Page 1
THESIS
CINNAMON TEAL BREEDING ECOLOGY IN THE SAN LUIS VALLEY OF COLORADO
Submitted by
Casey M. Setash
Department of Fish, Wildlife, and Conservation Biology
In partial fulfillment of the requirements
For the Degree of Master of Science
Colorado State University
Fort Collins, Colorado
Summer 2018
Master’s Committee:
Advisor: William L. Kendall
Paul F. Doherty, Jr.
Cameron L. Aldridge
David Olson
Page 2
Copyright by Casey M. Setash 2018
All Rights Reserved
Page 3
ii
ABSTRACT
CINNAMON TEAL BREEDING ECOLOGY IN THE SAN LUIS VALLEY OF COLORADO
The foundation of effective waterfowl management is an abundant and resilient
waterfowl population, which begins with an understanding of what drives population size and
growth. Population growth rate is the product of a number of vital rates, all of which remain
relatively unknown for the cinnamon teal (Spatula cyanoptera). I investigated the interactions
between biotic and abiotic factors influencing the basic demographic rates of cinnamon teal
during the breeding season in the San Luis Valley of Colorado. Specifically, I assessed the
relationship between the habitat around a selected nest site and cinnamon teal nesting success.
Additionally, I evaluated whether a relatively novel approach to surveying social groupings of
waterfowl can act as an effective index of breeding effort and success for cinnamon teal, the
intraspecific variation in nest attendance patterns during incubation and how it affects nest
survival, and the rates at which breeding females and ducklings survive the breeding season.
This research has the potential to enhance the understanding of the basic population ecology of
this overlooked species and provide information about vital rates that can be used in future
analyses and management of the population on a larger scale.
I found that cinnamon teal select nest sites with habitat characteristics that are also
associated with a higher probability of nest survival (Chapter 2, this thesis). Specifically, I
observed cinnamon teal selecting nest sites characterized by a lower proportion of forbs relative
to what was available, which were also associated with higher nest survival among the nests I
observed. I established that weekly transect surveys assessing the social groupings of cinnamon
Page 4
iii
teal throughout the breeding season have the potential to act as an index of reproductive success
if done on a larger scale (both temporally and geographically; Chapter 3, this thesis). I also found
differences in the nest attendance patterns during early incubation compared to late incubation,
which were also impacted by time of day and temperature (Chapter 4, this thesis). Finally, I
estimated breeding season duckling and hen survival rates that were comparable to other
waterfowl species and provided suggestions for future cinnamon teal researchers (Chapter 5, this
thesis).
Page 5
iv
ACKNOWLEDGMENTS
I would first and foremost like to thank my advisor, Dr. Bill Kendall, for providing me
with the opportunity to conduct this research. It was an honor to work with him, and his
compassion and unique perspective have pushed me to become a better ecologist, scientist, and
person. I would also like to thank my committee members, Dr. Paul Doherty, Dr. Cameron
Aldridge, and Dave Olson. All three have been extremely generous with their time and
commitment to this project, and their guidance was invaluable as I wove my way through this
portion of my career. I owe a special debt of gratitude to Dave Olson, without whose initiative
and passion for conservation this project would not exist and the field of waterfowl ecology
would be worse off.
I appreciate all of the time and thought that have gone into this project on the part of US
Fish and Wildlife Service employees, both within the Division of Migratory Birds and the
National Wildlife Refuge system. Special thanks go to Casey Stemler, Jim Dubovsky, Kammie
Kruse, and Dave Sharp for getting this project off the ground and supporting me throughout this
process. The staff of the San Luis Valley National Wildlife Refuge Complex could not have been
a more wonderful group of people to spend the summers with. Suzanne Beauchaine, Sharon
Vaughn, Scott Miller, Dean Lee, Pete Striffler, Dewane Mosher, and David Dean were all
invaluable in helping with the logistics of field work, providing me with housing and vehicles
during my field seasons, and allowing this research to take place under their watch. I would also
like to thank all of the folks living in the San Luis Valley who made me feel at home and who
have a special tie to the wildlife and the land in that region. It’s a special place and I feel very
lucky to have lived there for three summers. Thanks especially to Jenny Nehring and Cary Aloia
Page 6
v
for being my SLV role models and constantly highlighting the work being done by women in
waterfowl/wetlands research. Stephanie Ferrero and Brent Frankland with Colorado Parks &
Wildlife (CPW) also shared their knowledge of the area and provided assistance via telemetry
flights to locate some lost birds. Thanks to Dr. Jim Gammonley of CPW for not only providing
financial support for nest monitoring cameras, but also for paving the way for this research to
take place with his past work on cinnamon teal and in the San Luis Valley.
None of this work would have been possible without the technicians and volunteers that
helped out along the way. Meghan Keating, Brandon Nooner, Liz Smith, Katherine Scott, Kelsey
Persyn, Josh Houghtaling, Christina Meuhlbauer, Hailey Glasko, Michelle Moyer, all of my
video and photo reviewers, and all of the Student Conservation Association/Pathways interns
who helped out (especially Adam Braddock, Cloe Traylor, and Hilary Syvertson), thank you for
bearing with me throughout this learning process and for being the workhorses of the project.
You made field work and living in the bunkhouses so enjoyable, and I’m glad to call you all
friends.
Thank you to everyone in the Fish, Wildlife, and Conservation Biology department and
the USGS Cooperative Fish and Wildlife Research Unit who has supported, challenged, and
laughed with me over the course of my Master’s. Gabriele Engler provided constant logistical
support over the course of three remote field seasons and the day-to-day administrative
challenges of being a graduate student. Thank you to all of the other graduate students who have
shaped my time at Colorado State University. The other members of the Kendall lab, Brian
Gerber, Perry Williams, Kristen Pearson, and Maria Dzul, were extremely influential mentors,
role models, and friends. The Doherty Lab welcomed me into their group when I was without a
Page 7
vi
lab group to attend, as did the Bailey/Huyvaert “Superpopulation” Lab. All of these people
provided instrumental advice on both professional and personal levels.
Thanks to my mom, for showing me the delightful world of birds at a young age and for
always being willing to lend an ear, Michael, Amy, and Pete for showering me with humor and
joy throughout a sometimes-difficult degree, and my dad, who is the strongest, hardest working
man I know. A special thanks goes to Adam Behney for not only geeking out about ducks with
me on a regular basis, but for being a constant source of support and being generally wonderful.
Finally, thanks to my cat, Aloo, for falling asleep on my keyboard every time I tried to write this
thesis.
Page 8
vii
TABLE OF CONTENTS
ABSTRACT .................................................................................................................................... ii
ACKNOWLEDGMENTS ............................................................................................................. iv
LIST OF TABLES ......................................................................................................................... ix
LIST OF FIGURES ...................................................................................................................... xii
Chapter 1 - INTRODUCTION ....................................................................................................... 1
Literature Cited ............................................................................................................................... 7
Chapter 2 - NEST SITE SELECTION INFLUENCES CINNAMON TEAL NEST SURVIVAL
IN COLORADO ............................................................................................................................. 9
SUMMARY ................................................................................................................................ 9
INTRODUCTION ....................................................................................................................... 9
METHODS................................................................................................................................ 13
RESULTS.................................................................................................................................. 18
DISCUSSION ........................................................................................................................... 20
MANAGEMENT IMPLICATIONS ......................................................................................... 23
Literature Cited ............................................................................................................................. 37
Chapter 3 - SOCIAL INDICES OF CINNAMON TEAL REPRODUCTIVE SUCCESS IN
COLORADO ................................................................................................................................ 46
SUMMARY .............................................................................................................................. 46
INTRODUCTION ..................................................................................................................... 47
STUDY AREA .......................................................................................................................... 49
METHODS................................................................................................................................ 50
RESULTS.................................................................................................................................. 53
DISCUSSION ........................................................................................................................... 55
MANAGEMENT IMPLICATIONS ......................................................................................... 58
Literature Cited ............................................................................................................................. 67
Chapter 4 - NEST ATTENDANCE PATTERNS OF CINNAMON TEAL DURING
INCUBATION .............................................................................................................................. 70
SUMMARY .............................................................................................................................. 70
INTRODUCTION ..................................................................................................................... 70
METHODS................................................................................................................................ 74
Page 9
viii
RESULTS.................................................................................................................................. 77
DISCUSSION ........................................................................................................................... 80
Literature Cited ........................................................................................................................... 103
Chapter 5 - HEN AND DUCKLING SURVIVAL OF CINNAMON TEAL IN COLORADO 112
SUMMARY ............................................................................................................................ 112
INTRODUCTION ................................................................................................................... 112
METHODS.............................................................................................................................. 115
RESULTS................................................................................................................................ 118
DISCUSSION ......................................................................................................................... 120
Literature Cited ........................................................................................................................... 128
Chapter 6 - CONCLUSIONS...................................................................................................... 133
Literature Cited ........................................................................................................................... 136
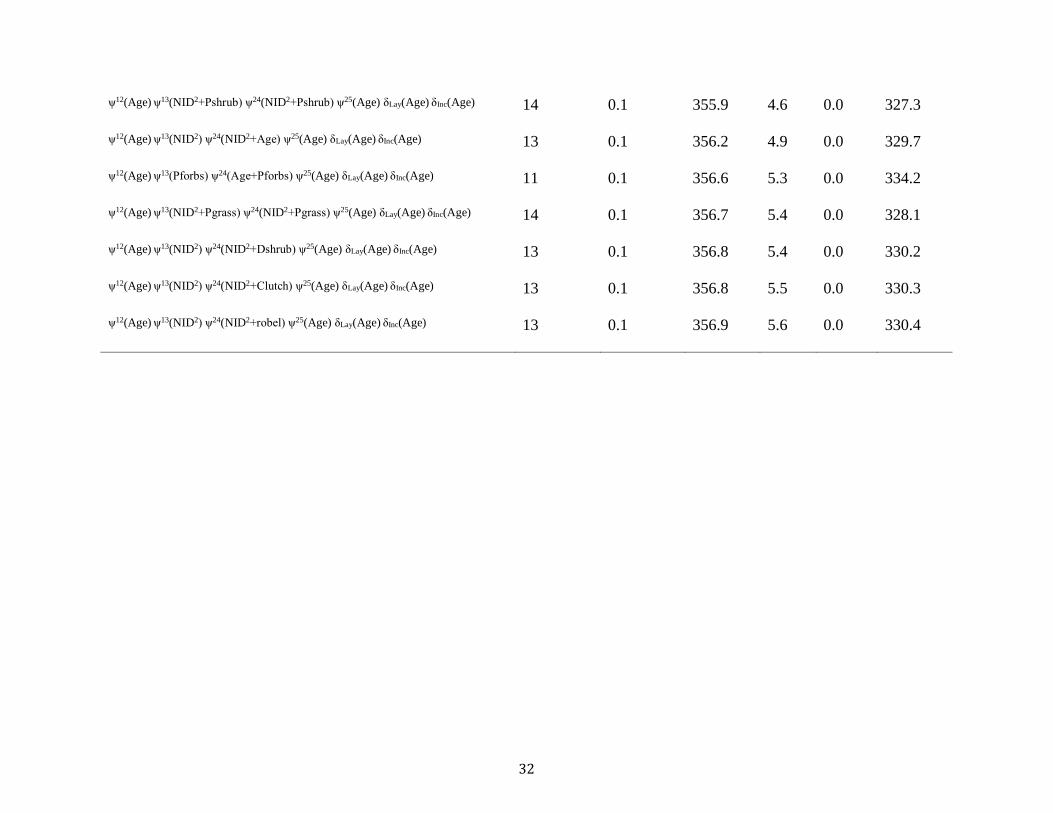
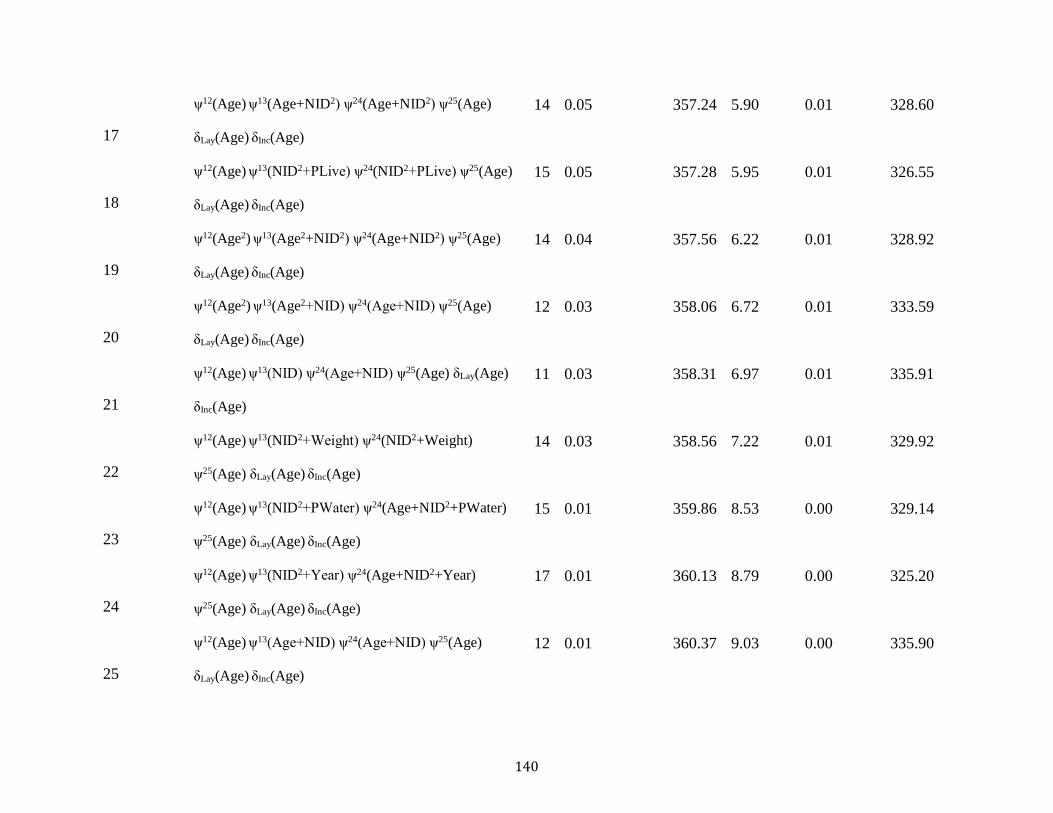
Appendix A: HIDDEN MARKOV MODEL STRUCTURES CONSIDERED TO DESCRIBE
THE VARIABILITY IN CINNAMON TEAL NEST SURVIVAL AND ASSOCIATED AICc
VALUES. .................................................................................................................................... 138
Page 10
ix
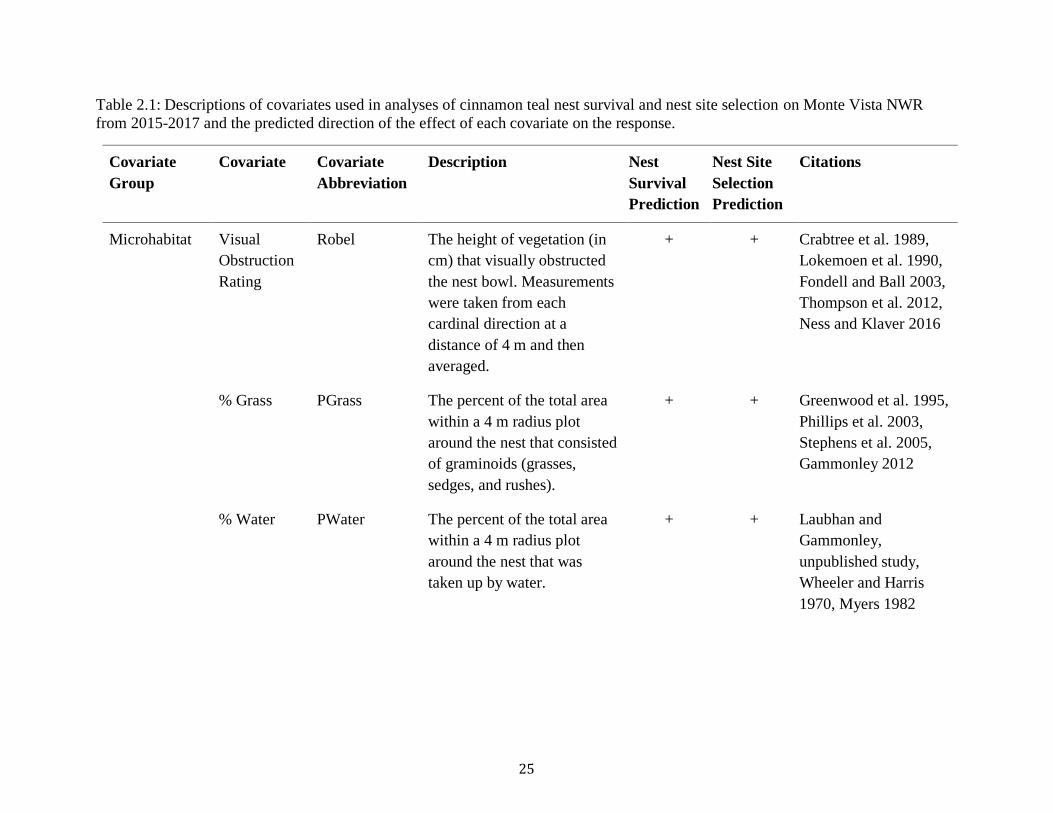
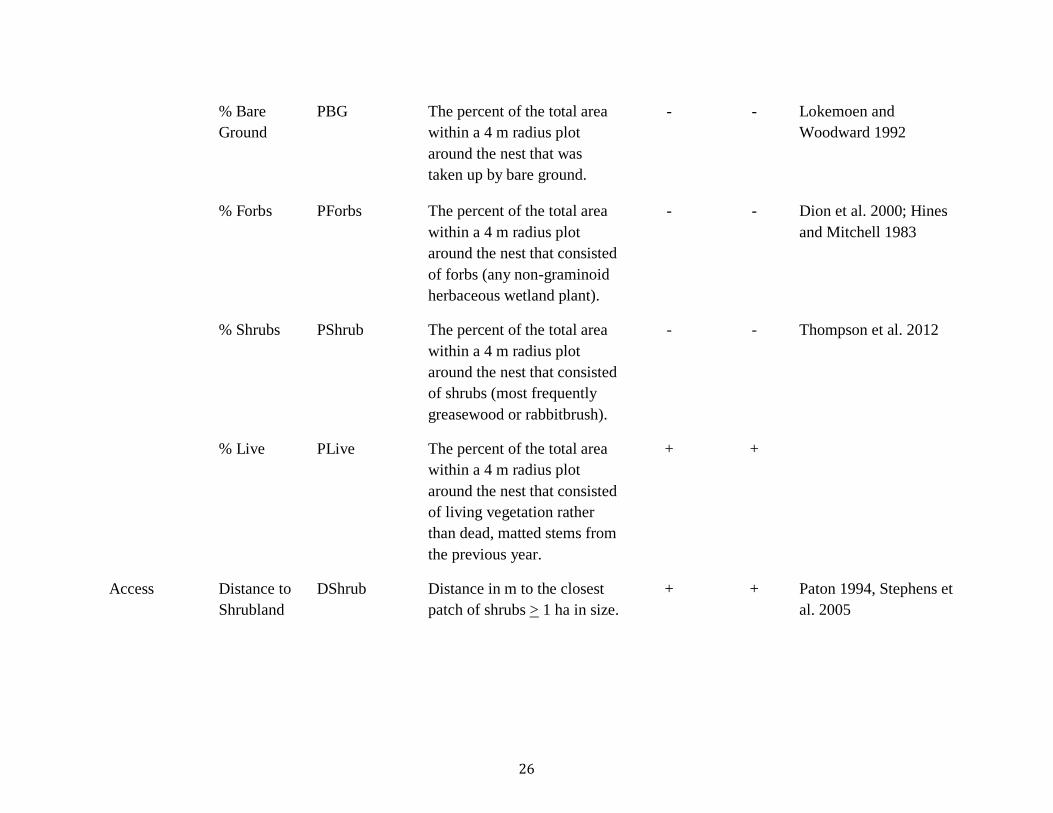
LIST OF TABLES Table 2.1: Descriptions of covariates used in analyses of cinnamon teal nest survival and nest site
selection on Monte Vista NWR from 2015-2017 and the predicted direction of the effect of each
covariate on the response. ............................................................................................................. 25
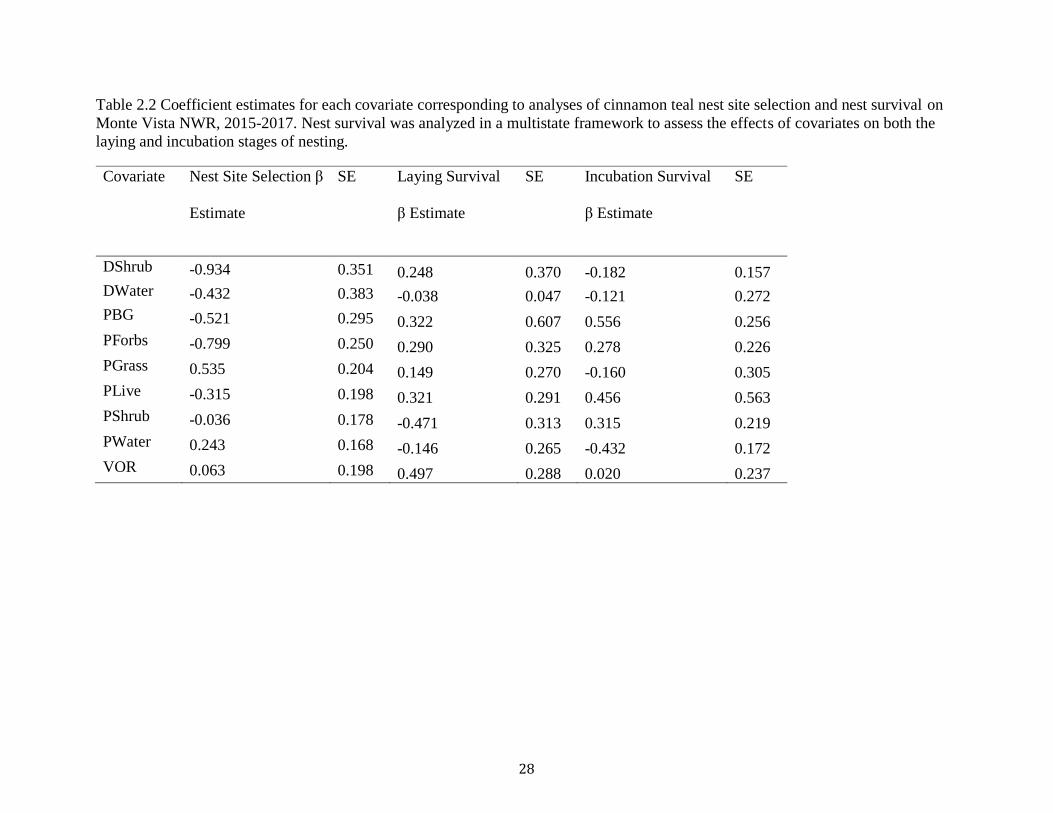
Table 2.2 Coefficient estimates for each covariate corresponding to analyses of cinnamon teal
nest site selection and nest survival. Nest survival was analyzed in a multistate framework to
assess the effects of covariates on both the laying and incubation stages of nesting. Cinnamon
teal nests included in the analysis were located on Monte Vista NWR from 2015-2017. ........... 28
Table 2.3: AICc table for nest site selection analysis using discrete choice models of cinnamon
teal nesting on Monte Vista NWR in 2017. .................................................................................. 29
Table 2.4: Summary of cinnamon teal nest fates for nests found of Monte Vista National Wildlife
Refuge from 2015-2017. ............................................................................................................... 30
Table 2.5: 90% confidence set (based on Akaike weights) indicating support for models
explaining cinnamon teal nest survival on Monte Vista NWR from 2015-2017. ........................ 31
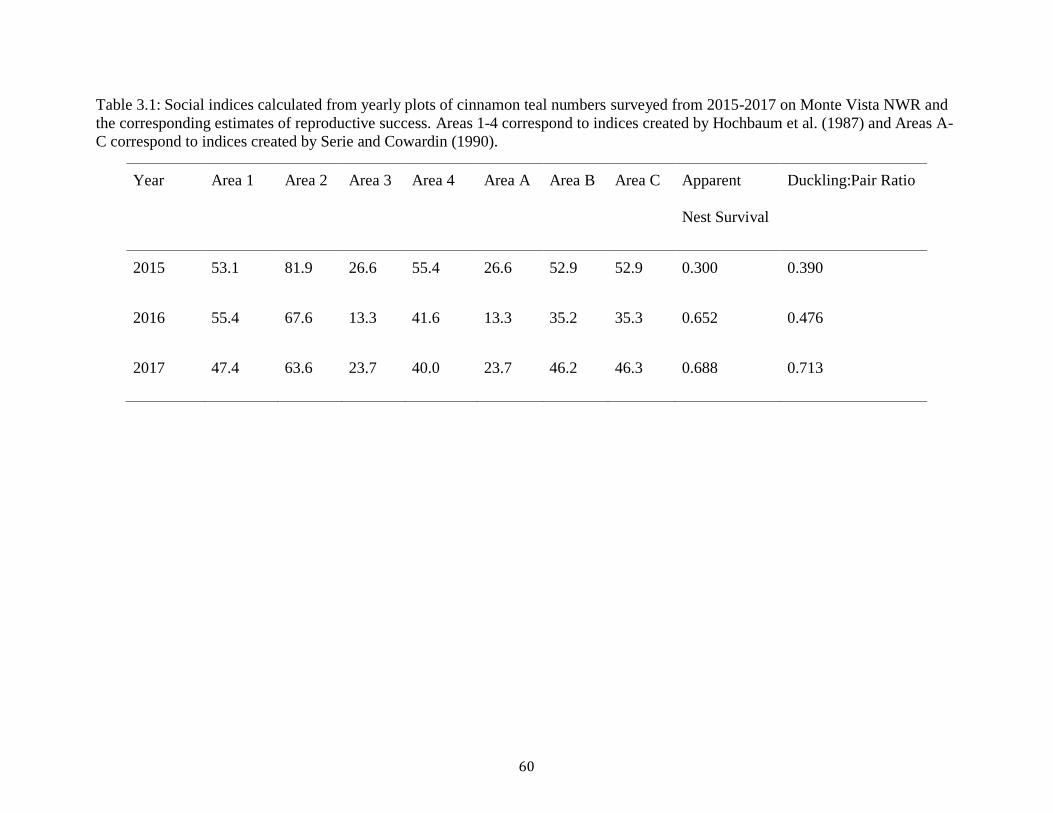
Table 3.1: Social indices calculated from yearly plots of cinnamon teal numbers surveyed from
2015-2017 on Monte Vista NWR and the corresponding estimates of reproductive success. Areas
1-4 correspond to indices created by Hochbaum et al. (1987) and Areas A-C correspond to
indices created by Serie and Cowardin (1990). ............................................................................ 60
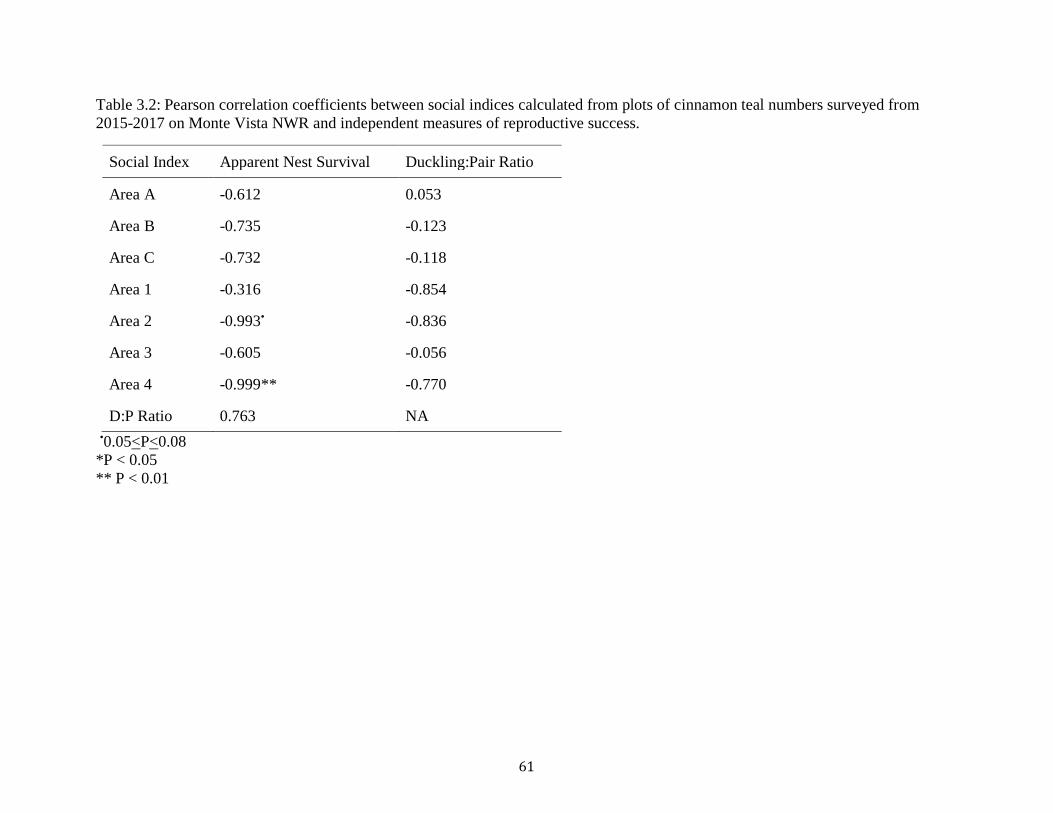
Table 3.2: Pearson correlations (r) between social indices calculated from plots of cinnamon teal
numbers surveyed from 2015-2017 on Monte Vista NWR and independent measures of
reproductive success. .................................................................................................................... 61
Page 11
x
Table 3.3: Observer-specific detection estimates and standard deviations for each social grouping
of cinnamon teal averaged across 17 social index surveys conducted on Monte Vista NWR in
2017............................................................................................................................................... 62
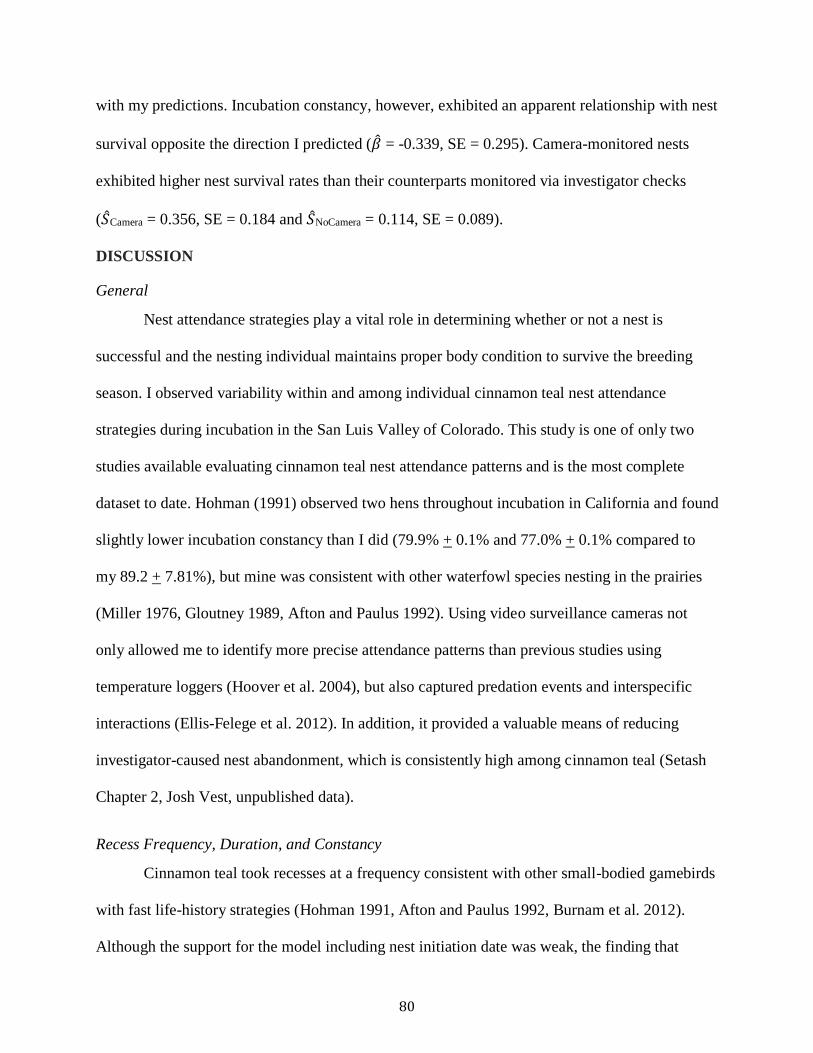
Table 4.1: Covariate definitions and predicted relationships with three response variables
associated with cinnamon teal nest attendance: recess frequency, duration, and incubation
constancy....................................................................................................................................... 86
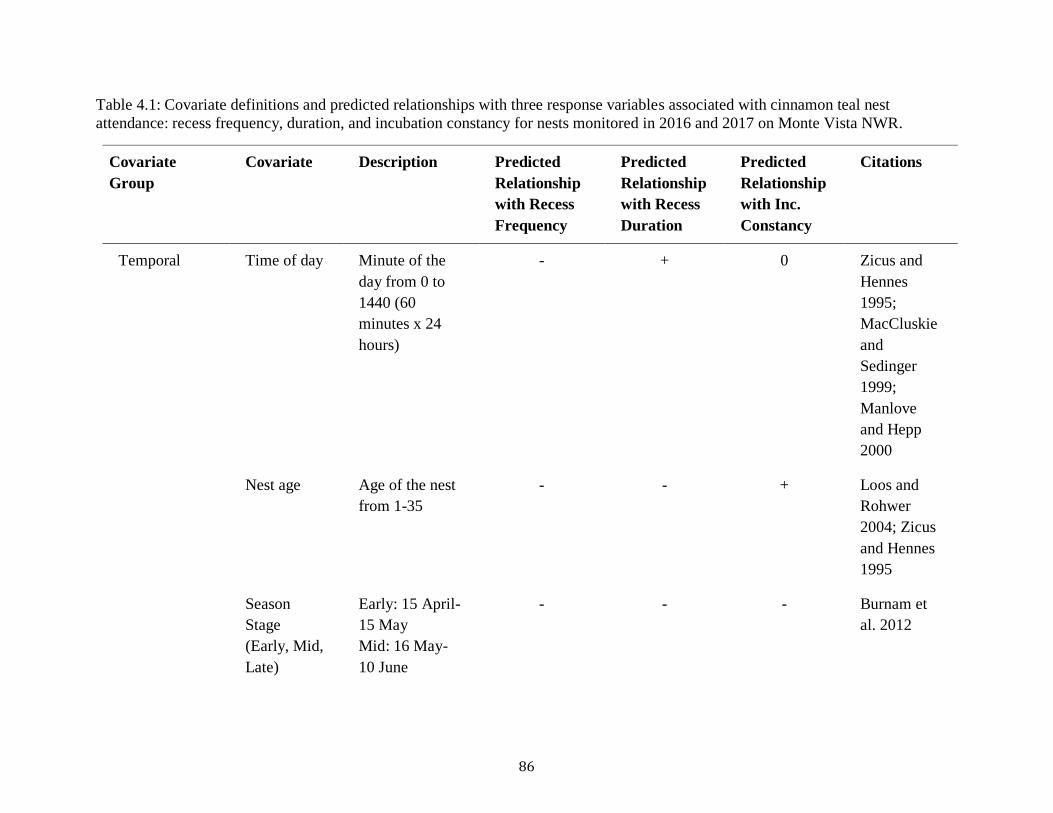
Table 4.2: Predictions of the effects of nest attendance parameters on cinnamon teal daily nest
survival rate during incubation. .................................................................................................... 90
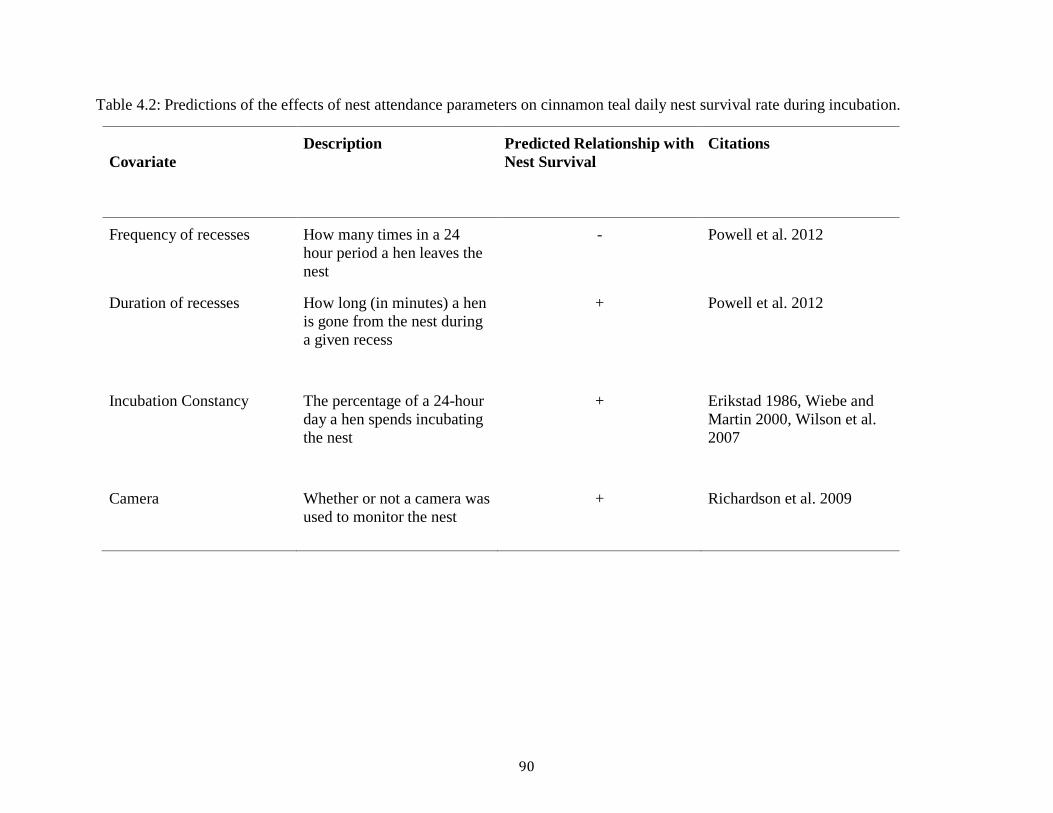
Table 4.3: Summary of cinnamon teal nest monitoring videos and photos from nests found in
2016 and 2017 on Monte Vista NWR........................................................................................... 91
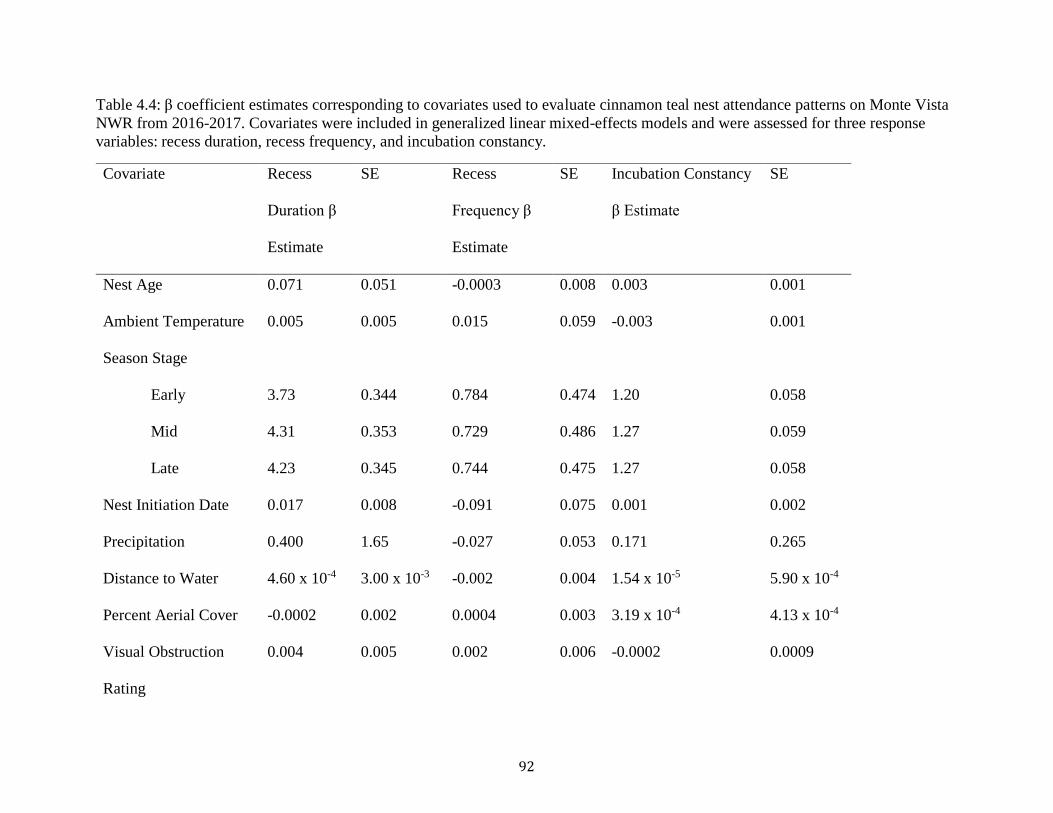
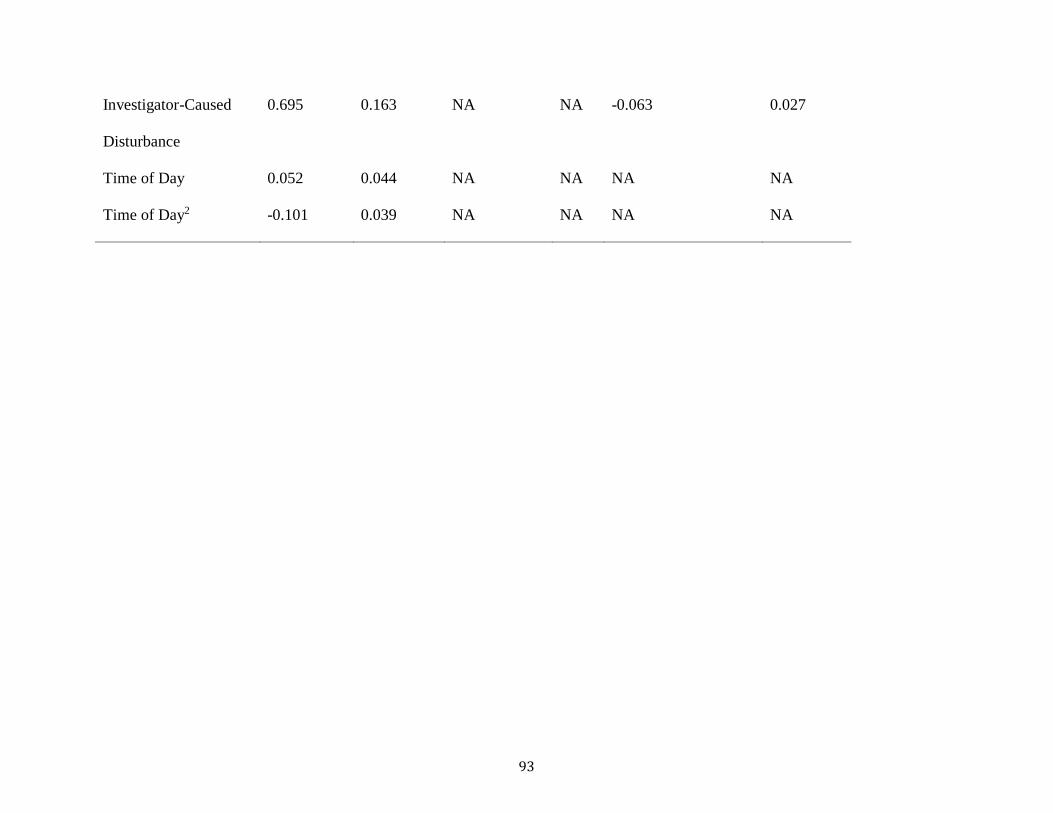
Table 4.4: β coefficient estimates corresponding to covariates used to evaluate cinnamon teal
nest attendance patterns on Monte Vista NWR from 2016-2017. Covariates were included in
generalized linear mixed-effects models and were assessed for three response variables: recess
duration, recess frequency, and incubation constancy. ................................................................. 92
Table 4.5: AICc table showing top models explaining frequency of recesses during cinnamon
teal incubation on Monte Vista NWR from 2016-2017................................................................ 94
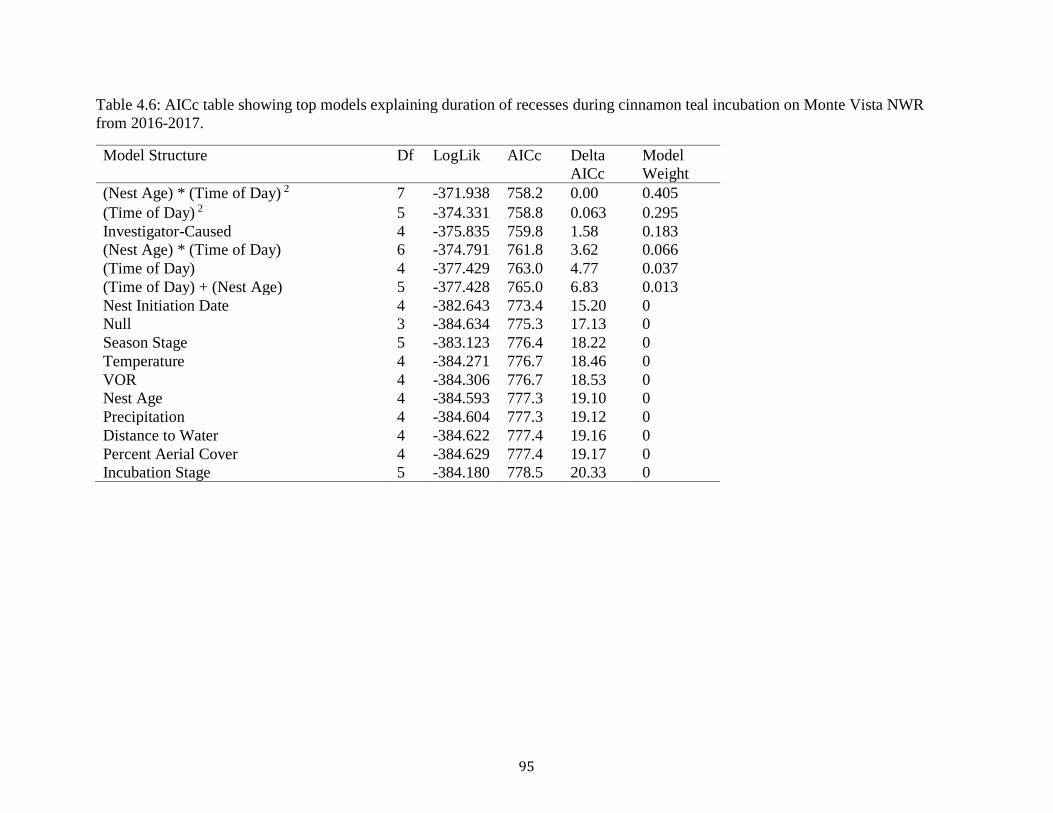
Table 4.6: AICc table showing top models explaining duration of recesses during cinnamon teal
incubation on Monte Vista NWR from 2016-2017. ..................................................................... 95
Table 4.7: AICc table showing top models explaining incubation constancy during cinnamon teal
incubation on Monte Vista NWR from 2016-2017. ..................................................................... 96
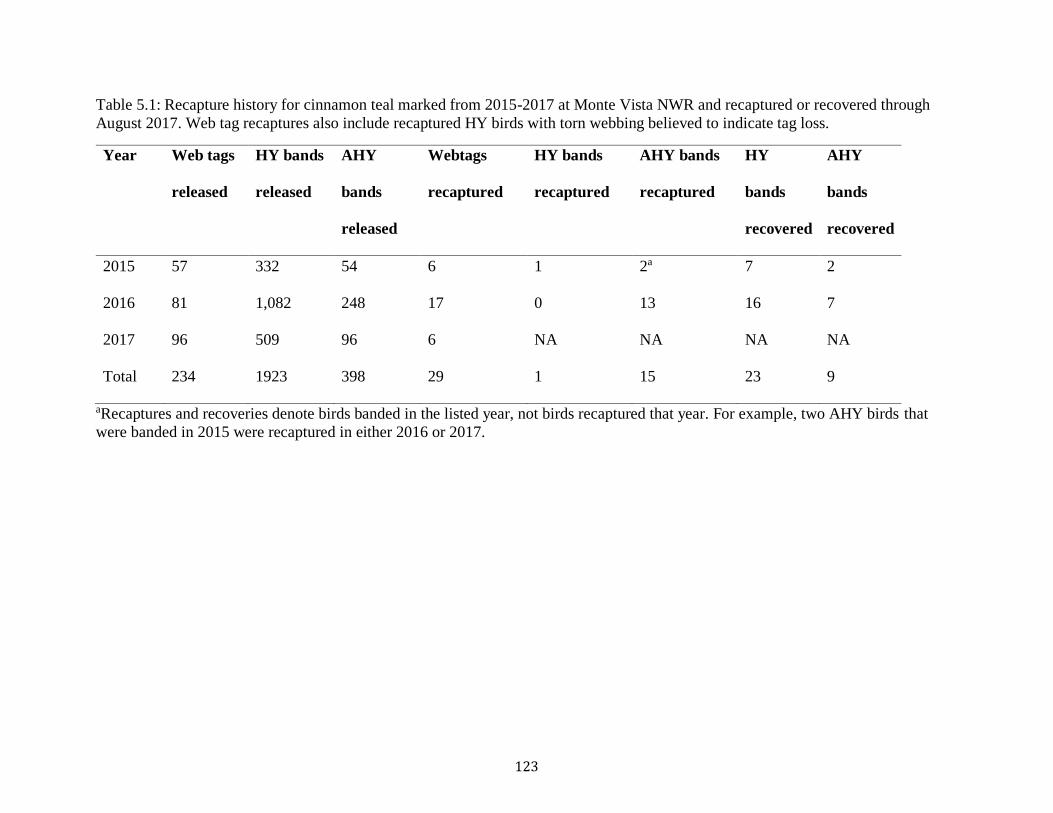
Table 5.1: Recapture history for cinnamon teal marked from 2015-2017. Web tag recaptures also
include recaptured HY birds with torn webbing believed to indicate tag loss. Recapture and
recovery information is not yet available for birds marked in 2017. aRecaptures and recoveries
Page 12
xi
denote birds banded in the listed year, not birds recaptured that year. For example, two AHY
birds that were banded in 2015 were recaptured in either 2016 or 2017. ................................... 123
Table 5.2: Candidate model set for estimating cinnamon teal duckling survival on Monte Vista
NWR using Burnham’s joint live recapture and dead recovery model. Age = parameter is
allowed to vary by age of the duck (hatch year or after hatch year), Seas = parameter is allowed
to vary between breeding season and non-breeding season, Year = parameter is allowed to vary
by year of the study (2015-2017). ............................................................................................... 124
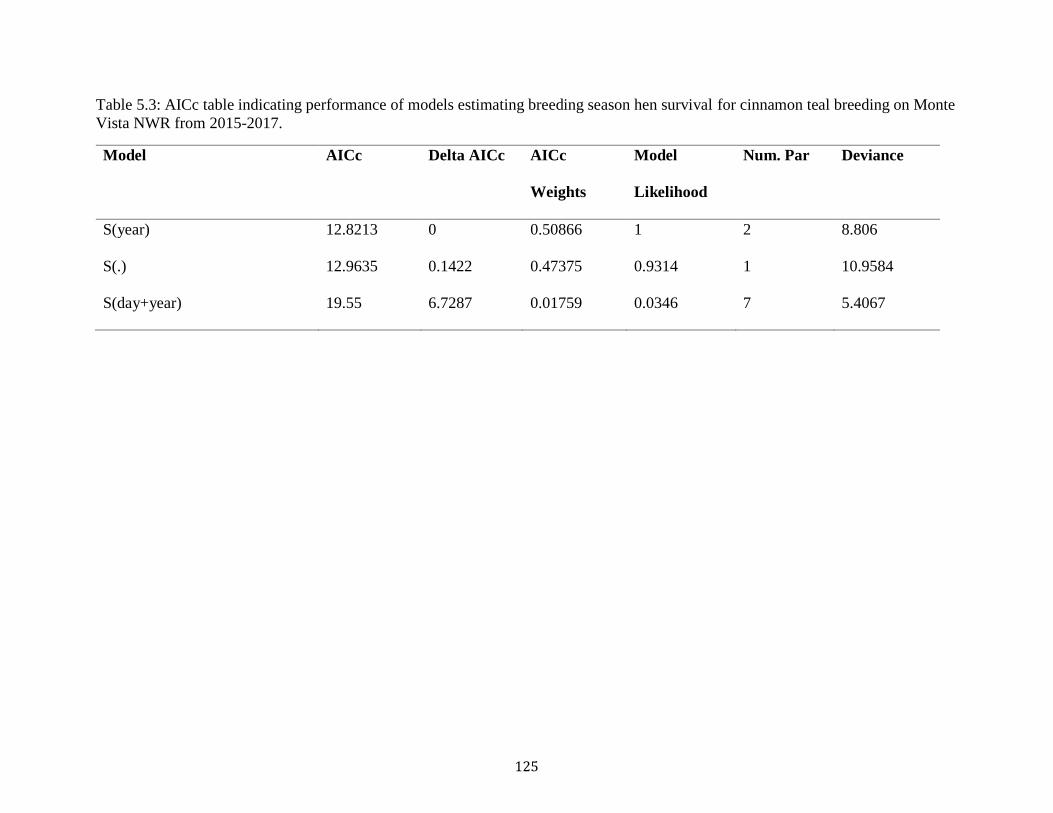
Table 5.3: AICc table indicating performance of models estimating breeding season hen survival
for cinnamon teal breeding on Monte Vista NWR from 2015-2017. ......................................... 125
Page 13
xii
LIST OF FIGURES
Figure 2.1: Diagram of nesting stages for cinnamon teal nest survival analysis in a multistate
framework. For nest failures, the stage at failure is allowed to be uncertain. .............................. 33
Figure 2.2: β parameter estimates corresponding to nest site selection (from univariate discrete
choice models) and nest survival (from hidden Markov model) during cinnamon teal laying and
incubation on Monte Vista NWR from 2015-2017. Nest site selection results are based on 57
cinnamon teal nests from 2017, while nest survival results are based on 85 nests pooled across
2015-2017. Points indicate apparent effect and error bars indicate 95% confidence intervals. ... 34
Figure 2.3: Relationship between nest initiation date and daily survival rate of cinnamon teal
nests on Monte Vista NWR from 2015-2017 during the laying stage of nesting. ........................ 35
Figure 2.4: Relationship between nest initiation date and daily survival rate of cinnamon teal
nests on Monte Vista NWR from 2015-2017 during the incubation stage of nesting. ................. 36
Figure 3.1: Examples of social indices calculated using curves of cinnamon teal pairs (dashed
lines), lone drakes (solid lines), and flocked drakes (dotted lines) counted during the breeding
seasons of 2015-2017 on Monte Vista NWR. Shaded areas correspond to Area A (left panel),
Area B (middle panel), and Area C (right panel) as calculated by Serie and Cowardin (1990)... 63
Figure 3.2: Examples of social indices calculated using curves of cinnamon teal pairs (dashed
lines) and lone drakes (solid lines) counted during the breeding seasons of 2015-2017 on Monte
Vista NWR. Shaded areas correspond to Area 1 (top left panel), Area 2 (top right panel), Area 3
(bottom left panel), and Area 4 (bottom right panel) as calculated by Hochbaum et al. (1987). . 64
Page 14
xiii
Figure 3.3: Social index plots using counts of cinnamon teal from 2015-2017. Left column
represents indices calculated using Hochbaum et al. (1987) methods and right column represents
indices calculated using Serie and Cowardin (1990) methods. .................................................... 65
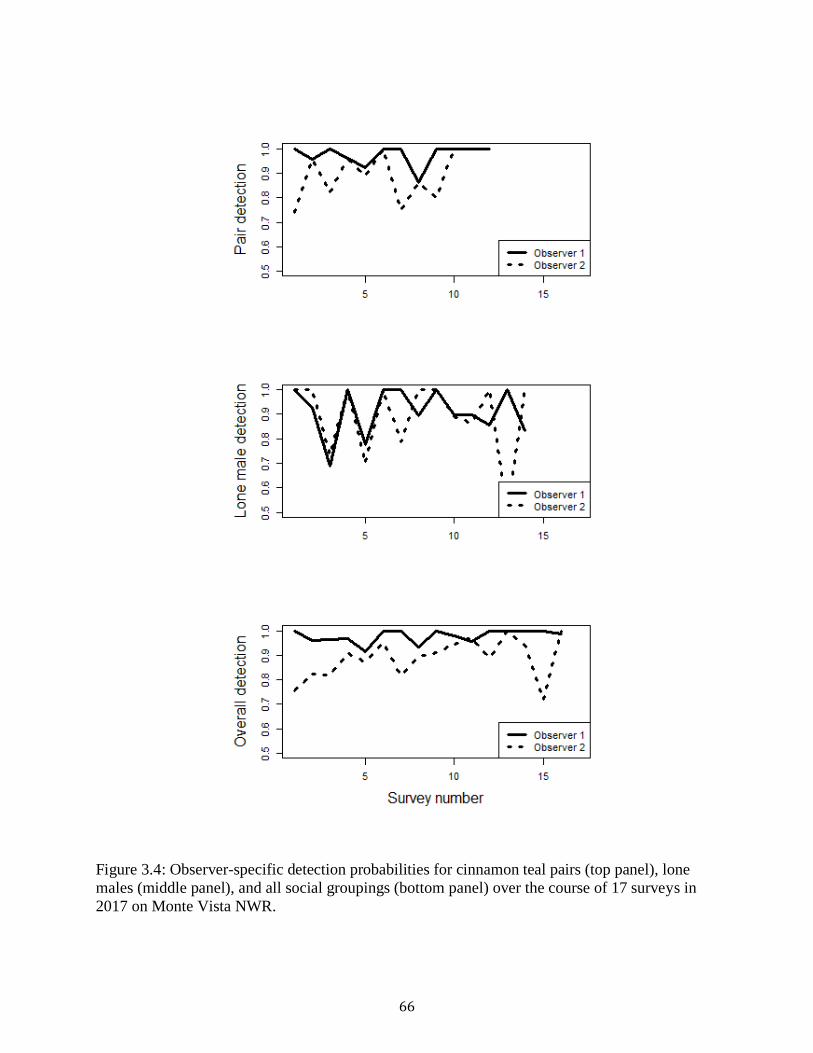
Figure 3.4: Observer-specific detection probabilities for cinnamon teal pairs (top panel), lone
males (middle panel), and all social groupings (bottom panel) over the course of 17 surveys in
2017 on Monte Vista NWR. ......................................................................................................... 66
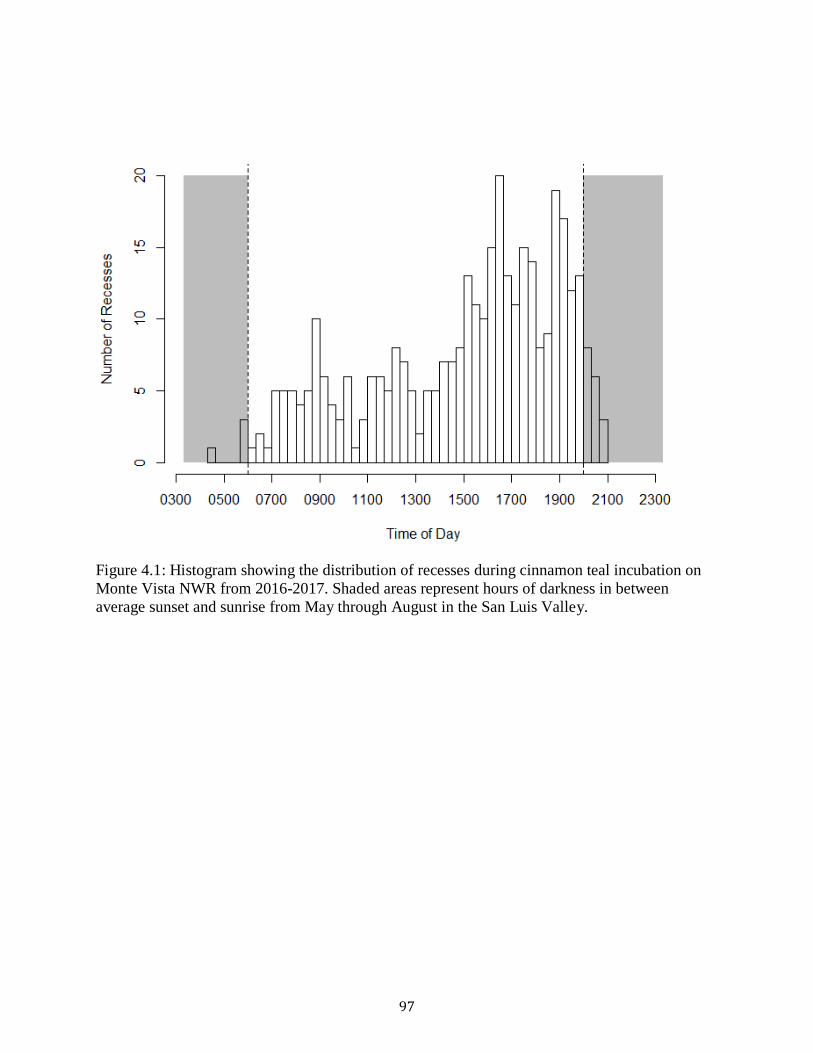
Figure 4.1: Histogram showing the distribution of recesses during cinnamon teal incubation on
Monte Vista NWR from 2016-2017. Shaded areas represent hours of darkness in between
average sunset and sunrise from May through August in the San Luis Valley. ........................... 97
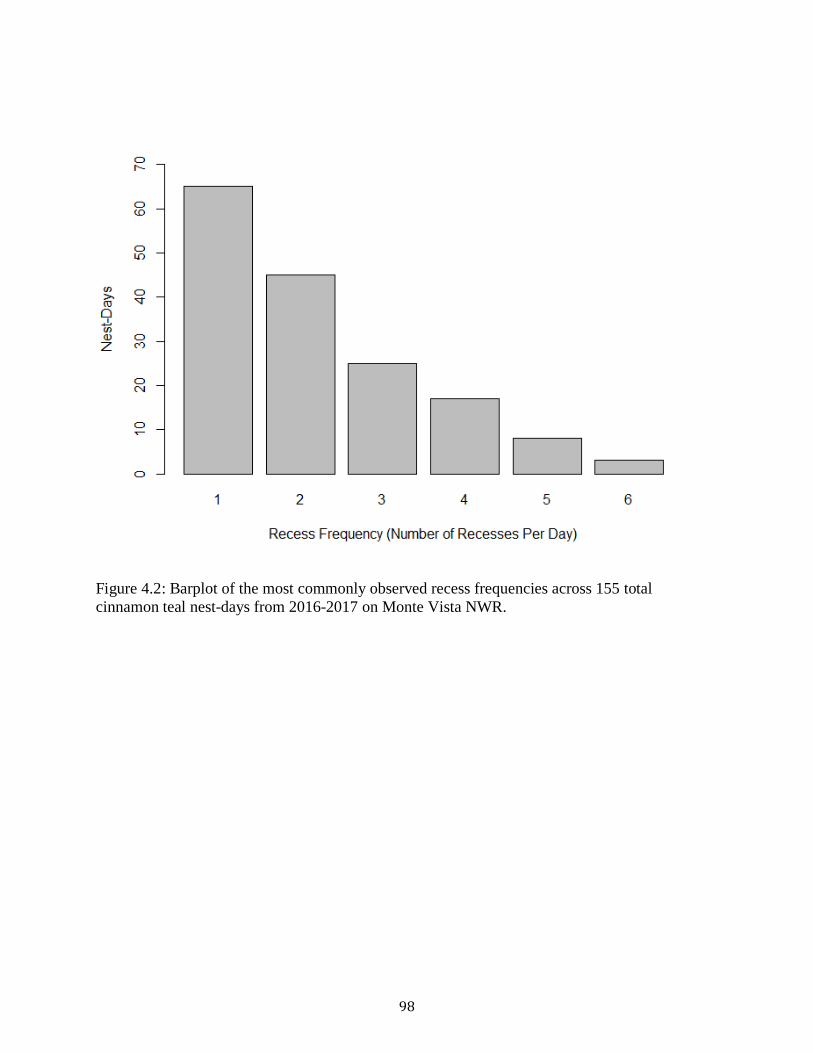
Figure 4.2: Barplot of the most commonly observed recess frequencies across 155 total
cinnamon teal nest-days from 2016-2017 on Monte Vista NWR. ................................................ 98
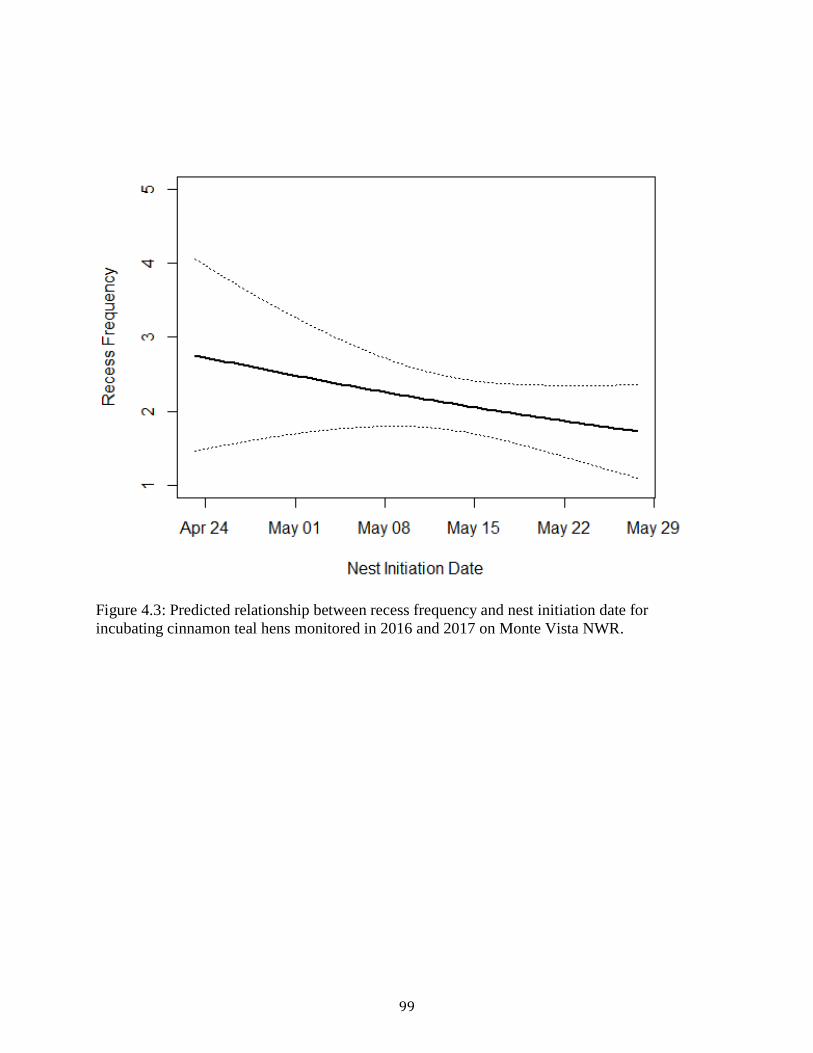
Figure 4.3: Predicted relationship between recess frequency and nest initiation date for
incubating cinnamon teal hens monitored in 2016 and 2017 on Monte Vista NWR. .................. 99
Figure 4.4: Relationship between recess duration and time of day for cinnamon teal hens with
nests early in incubation and late in incubation. All nests were monitored in 2016 and 2017 on
Monte Vista NWR. ..................................................................................................................... 100
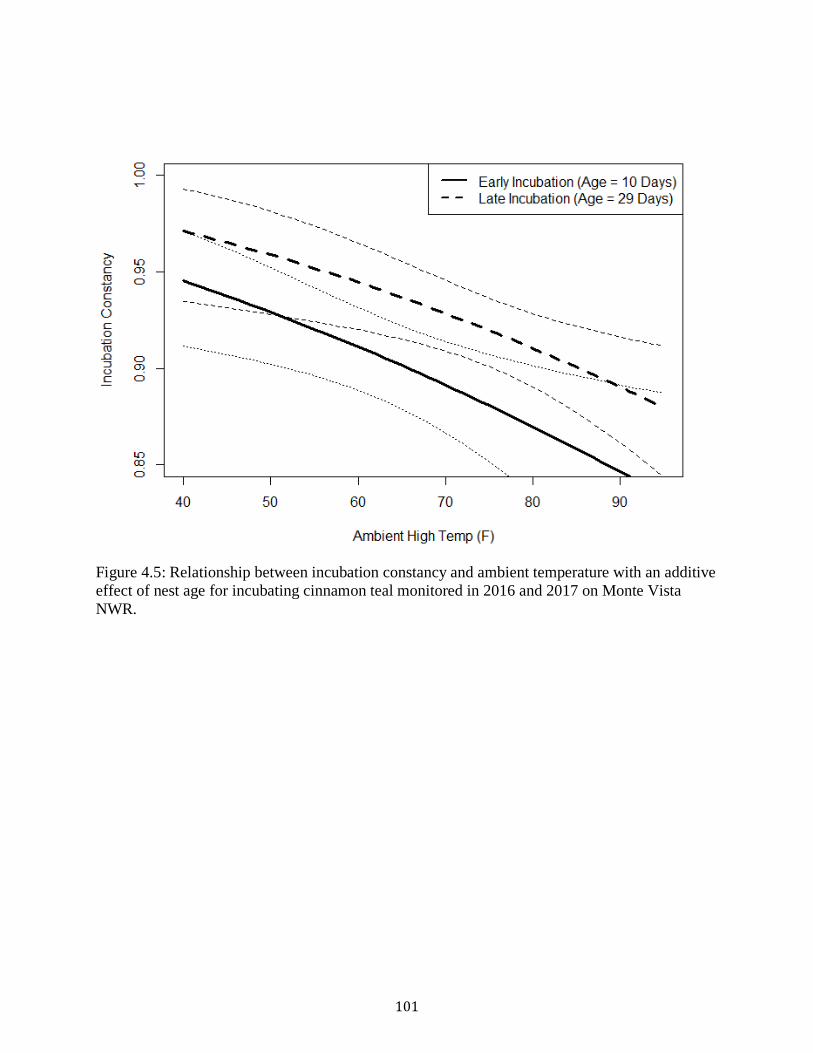
Figure 4.5: Relationship between incubation constancy and ambient temperature with an additive
effect of nest age for incubating cinnamon teal monitored in 2016 and 2017 on Monte Vista
NWR. .......................................................................................................................................... 101
Figure 4.6: Relationship between daily nest survival rate and three response variables
characterizing nest attendance of cinnamon teal hens monitored in 2016 and 2017 on Monte
Vista NWR. The solid line represents the predicted response and dashed lines represent 95%
confidence intervals. The figure on the left represents the negative relationship between daily
Page 15
xiv
survival rate during incubation and recess frequency (the number of times a hen leaves the nest
on a given day). The figure in the middle is the positive relationship between daily incubation
survival and recess duration (in minutes). The figure on the right is the negative relationship
between daily incubation survival and incubation constancy (the proportion of the day spent
incubating eggs) .......................................................................................................................... 102
Figure 5.1: The distributions of cinnamon teal web tagging effort from 2015-2017 on Monte
Vista NWR. Density measures the relative number of web tags placed on ducklings on a given
date. ............................................................................................................................................. 126
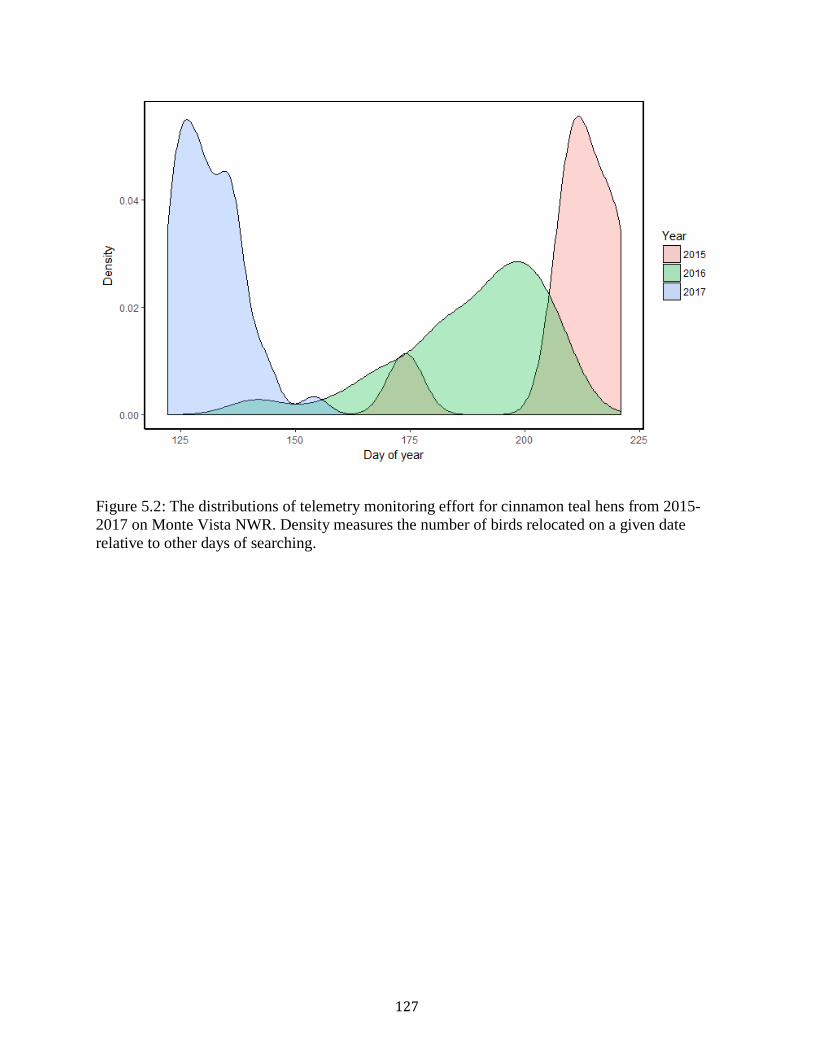
Figure 5.2: The distributions of telemetry monitoring effort for cinnamon teal hens from 2015-
2017 on Monte Vista NWR. Density measures the number of birds relocated on a given date
relative to other days of searching. ............................................................................................. 127
Page 16
1
Chapter 1 - INTRODUCTION
Cinnamon Teal Population Dynamics and Life History Traits
The cinnamon teal is a relatively understudied dabbling duck species breeding in high
densities in the intermountain west. It is the least abundant and least widely distributed of all
three teal species native to North America, with breeding population estimates ranging from
260,000-300,000 during the breeding season to 500,000-600,000 in the fall (Bellrose 1980,
Baldassarre 2014). Small banding samples and difficulty distinguishing between female
cinnamon teal and female blue-winged teal (Spatula discors) have made population analyses
difficult to carry out and have led to relatively few studies historically. Current management for
this species is based on estimates from the Waterfowl Breeding Population and Habitat Survey
(WBPHS) in the traditional survey area, which encompasses the northern US, central Canada,
and parts of Alaska, in addition to independent breeding waterfowl surveys, but data on
cinnamon teal are often combined with those of blue-winged teal due to the uncertainty of
identification (USFWS 2013). In addition, a large majority of cinnamon teal breed outside the
traditional survey area and researchers have conducted few breeding studies (Spencer 1953,
Vest, unpublished data). The 2012 North American Waterfowl Management Plan proposes an
acceptable threshold of cinnamon teal abundance of 300,000 birds continent-wide, but thresholds
within the traditional survey area are combined with blue-winged teal and are based upon
abundance estimates from the 1970s (Baldassarre 2014).
The North American subspecies of cinnamon teal (S. c. septentrionalium) breeds
throughout western North America, with four other subspecies breeding and wintering solely in
various regions of South America. They generally exhibit a fast life-history strategy relative to
other ducks; hens will typically breed as yearlings and will renest following the failure of an
Page 17
2
initial nesting attempt. They are elusive nesters, utilizing very thick perennial vegetation near or
over water in seasonal and semi-permanent wetlands and tunneling through the vegetation to get
to and from their nests (Gammonley 2012). Females with broods are extremely secretive,
typically foraging in areas of dense submergent vegetation with abundant emergent cover. Nest
initiation typically occurs by mid-May in Colorado and hatch is usually at its peak by late July
(Laubhan and Gammonley 2000). Hens choose the nest site while males guard foraging sites
nearby, and distance to water at the time of selection seems to be vital in the selection process
(Gammonley 2012). In Colorado, 83% of nests found in an unpublished study by Laubhan and
Gammonley and 87% of the active nests I located in this study were <10 meters from water.
Cinnamon teal are known to use highly alkaline wetlands, perhaps one of the few preferences of
theirs that differs from the closely related blue-winged teal (Gammonley 2012). Connelly and
Ball (1984) found that cinnamon teal preferred more emergent vegetation than blue-winged teal,
but that their remaining habitat and food preferences were nearly identical. In their study,
Connelly and Ball (1984) found cinnamon teal were subordinate to most other species, including
blue-winged teal, giving blue-winged teal a competitive advantage in areas where the two
species have begun to overlap in recent decades. Research remains limited regarding whether
cinnamon teal can remain robust to changes in land use and climate patterns across North
America, especially as the western United States becomes increasingly arid and blue-winged teal
continue to encroach upon their historic range. Without proper estimates of population size, vital
rates, and trends, proper management regimes cannot be enacted to ensure the longevity of this
species, such as identifying key areas of habitat to be protected.
Page 18
3
Historic Cinnamon Teal Studies
Few published studies thus far have focused specifically on identifying vital rates of
cinnamon teal, although an abundance of information regarding their natural history is available
(Gammonley 2012). Spencer (1953) conducted one of the early descriptive studies of cinnamon
teal ecology and life history, and since then, most of the research has focused on foraging
patterns and morphological differences between cinnamon teal subspecies and blue-winged teal
(Stark 1979, Connelly and Ball 1984, Gammonley 1995a, Gammonley 2012, Wilson et al. 2011).
Laubhan and Gammonley (2000) conducted a study on foraging habitat selection of waterbirds
in the San Luis Valley of Colorado, determining that selection patterns differed throughout the
breeding season for cinnamon teal. Hohman and Ankney (1994) conducted a study on pre-
nesting male cinnamon teal body condition in relation to pair status, finding limited evidence to
support the predictions that paired males are older and physically superior to unpaired males and
that superior males pair earlier.
Studies of breeding cinnamon teal have provided estimates of nest survival ranging from
32% for 1707 nests monitored across the western US (Bellrose 1980) to 62.2% at the Bear River
marshes in Utah (Williams and Marshall 1938). These estimates, however, likely contain
samples of blue-winged teal nests and are exclusively estimates of apparent nest survival, which
is typically biased high (Mayfield 1961, Dinsmore et al. 2002). Gilbert et al. (1996) conducted a
study of the effects of habitat management on duck species at Monte Vista National Wildlife
Refuge, but all three teal species were lumped together due to the uncertainty of identification.
This seminal work also provided initial evidence indicating the San Luis Valley in Colorado was
the best location for a breeding study. In it, Gilbert et al. (1996) estimated that Monte Vista
National Wildlife Refuge in the San Luis Valley had the highest breeding density of waterfowl
Page 19
4
on the continent. Although diminished water supply has altered the hydrological regimes in the
region, and thus the breeding density of waterfowl, it still plays a significant role in the
production of Colorado’s waterfowl, especially cinnamon teal (Szymczak 1986, USFWS 2015).
Project Impetus
Under a directive from the U.S. Fish and Wildlife Service in 2009, representatives from
all North American flyways came together to create an assessment of the population dynamics of
all three North American teal species (i.e., blue-winged, green-winged, and cinnamon teal). This
report provided survival and recovery estimates for all species, but concluded that very little
published information existed on cinnamon teal and that precision for the survival and recovery
estimates remained poor (USFWS 2013). To increase the precision of these estimates, The
Division of Migratory Birds in Region 6 of the U.S. Fish and Wildlife Service initiated a banding
project focused specifically on cinnamon teal across the Intermountain West. The primary
objective for this project was to band enough cinnamon teal to decrease the current coefficient of
variation for survival and recovery rates (CV = 48%) by 50% (CV = 24%; Olson, unpublished
report). In conjunction with this broad scale project, a breeding ecology project was funded in
Colorado to estimate cinnamon teal nest and duckling survival, characterize nest site selection,
and determine whether social index surveys have the potential to provide a time-efficient
measure of reproductive success. Cinnamon teal are thought to breed in high densities in
Colorado and the preliminary banding data showed the largest numbers of cinnamon teal being
captured there, rendering it the most appropriate location to initiate a breeding study. Updated
estimates of reproductive rates were meant to provide managers with the ability to improve
nesting habitat as well as efficiently monitor cinnamon teal productivity in their respective areas.
Page 20
5
Thesis Objectives and Format
The primary goal of this project was to estimate breeding vital rates of nesting cinnamon
teal that would help characterize demographic trends, population status, and responses to habitat
and water management. The secondary goals were to evaluate cinnamon teal behavior during the
breeding season, to better understand the evolutionary processes that have scaled up to
characterize their demography, and to determine whether these behavioral patterns can be used to
estimate reproductive success over a large scale. This thesis is divided into an introduction and
four main chapters, and all chapters are formatted as manuscripts.
The introduction provides a background for the completed project as well as an
introduction to the available literature on cinnamon teal biology. Chapters one through four
correspond to the objectives outlined above. Specifically, Chapter one is an evaluation of
cinnamon teal nest site selection and nest survival on Monte Vista National Wildlife Refuge,
with an emphasis on the nest site and individual hen characteristics that influence survival rates
to determine whether teal are selecting for those specific characteristics when choosing a nest
site. Chapter two is an evaluation of social indices and whether they are an appropriate metric of
reproductive effort for cinnamon teal. In it, I calculate indices of several measures of
reproductive success derived from surveys of waterfowl social groupings and evaluate whether
they are correlated with independently collected estimates of reproductive success (e.g., nest
survival and duckling:pair ratios). Chapter three evaluates nest attendance during incubation with
respect to the factors driving the duration and frequency with which hens leave their nests. I
investigate patterns of incubation attendance among cinnamon teal, evaluating whether certain
attendance strategies are associated with nest survival and whether environmental characteristics
Page 21
6
impact the attendance strategies they employed. Finally, chapter four details my estimates of hen
survival and duckling survival during the breeding season.
Page 22
7
Literature Cited
Baldassarre, G. 2014. Ducks, Geese, & Swans of North America. Johns Hopkins University
Press, Baltimore, Maryland. 1027 pp.
Bellrose, F.C. 1980. Ducks, Geese, & Swans of North America. Stackpole Books. Harrisburg,
PA.
Connelly, Jr., J. W. and I. J. Ball. 1984. Comparisons of aspects of breeding Blue-winged and
Cinnamon teal in eastern Washington. Wilson Bull. no. 96:626-633.
Dinsmore, S.J., G.C. White, F.L. Knopf. 2002. Advanced techniques for modeling avian nest
survival. Ecology, 83: 3476-3488.
Gammonley, J. H. 1995a. Spring feeding ecology of Cinnamon Teal in Arizona. Wilson Bull. no.
107:62-70.
Gammonley, J. H. 1995b. Nutrient reserve and organ dynamics of breeding Cinnamon Teal.
Condor no. 97:985-992
Gammonley, J. H. 2012. Cinnamon Teal (Anas cyanoptera), The Birds of North America Online
(A. Poole, Ed.). Ithaca: Cornell Lab of Ornithology.
Gilbert, D.W., D.R. Anderson, J.K. Ringelman, and M.R. Szymczak. 1996. Response of nesting
ducks to habitat and management on the Monte Vista National Wildlife Refuge,
Colorado. Wildlife Monographs 131:3-44.
Hohman, W. L. and C. D. Ankney. 1994. Body size and condition, age, plumage quality, and
foods of prenesting male Cinnamon Teal in relation to pair status. Can. J. Zool. no.
72:2172-2176.
Laubhan, M. K. and J. H. Gammonley. 2000. Density and foraging habitat selection of
waterbirds breeding in the San Luis Valley of Colorado. Journal of Wildlife Management
no. 64 (3):808-819.
Page 23
8
Mayfield, H. 1961. Nesting success calculated from exposure. The Wilson Bulletin, 73: 255-261.
Spencer, Jr., H. E. 1953. The Cinnamon Teal, Anas cyanoptera (Vieillot): its life history,
ecology, and management. Master's Thesis. Utah State University. Logan.
Stark, R. S. 1979. Morphological differences between Blue-winged and Cinnamon teal. Master's
Thesis, Colorado State Univ., Fort Collins.
Szymczak, M. R. 1986. Characteristics of duck populations in the intermountain parks of
Colorado. Colorado Division of Wildlife Technical Publication No. 35, Denver,
Colorado, USA.
U.S. Fish and Wildlife Service. 2013. Teal Assessment Team: An assessment of the harvest
potential of North American teal. Unpublished Report.
U.S. Fish and Wildlife Service. 2015. Comprehensive conservation plan and environmental
assessment, San Luis Valley National Wildlife Refuge Complex. Lakewood, CO: U.S.
Department of the Interior, Fish and Wildlife Service, Mountain-Prairie Region.
Williams, C. S. and W. H. Marshall. 1938. Duck nesting studies, Bear River Migratory Bird
Refuge, Utah, 1937. The Journal of Wildlife Management, 2:29-48.
Wilson, R. E., M. D. Eaton, S. A. Sonsthagen, J. L. Peters, K. P. Johnson, B. Simarra and K. G.
McCracken. 2011. Speciation, subspecies divergence, and paraphyly in the Cinnamon
Teal and Blue-winged Teal. Condor,113 (4):747-761.
Page 24
9
Chapter 2 - NEST SITE SELECTION INFLUENCES CINNAMON TEAL NEST
SURVIVAL IN COLORADO
SUMMARY
Nest survival of ducks is partially a function of the spatiotemporal characteristics of the
site at which a bird chooses to nest. Nest survival is also a fundamental component of population
growth in waterfowl, but remains almost entirely unstudied for cinnamon teal (Spatula
cyanoptera). I investigated cinnamon teal nest survival in an intensively managed wetland
complex in southern Colorado and assessed nest site selection to investigate whether certain nest
site characteristics were adaptive. I monitored 85 nests from 2015-2017 on Monte Vista National
Wildlife Refuge and did not detect a difference in nest survival across years (Probability of nest
survival from 2015-2017 = 0.194, SE = 0.076). Teal selected nest sites characterized by a lower
proportion of forbs (β̂PForbs = -0.799, SE = 0.250) than available sites. The relationships between
habitat characteristics and nest survival varied both in direction and by nest stage (i.e., laying or
incubation). Microhabitat characteristics exhibited only a weak effect on laying survival, but
incubation survival was influenced by the proportion of forbs at the nest site and to a lesser
extent the proportion of grasses (β̂Pforbs for Inc. = -0.432, SE = 0.172, β̂PGrass = 0.315, SE =
0.219). Nest site selection was predictive of future nest survival for some nest site characteristics
but not others, suggesting teal might be selecting nest locations to benefit reproductive success.
INTRODUCTION
Nest survival, the probability that a nesting attempt results in at least one egg hatching,
has been identified as one of the most influential components of recruitment, and ultimately the
rate of population change, for many duck species (Jehle et al. 2004, Rotella et al. 2003, Shaffer
2004). A large body of research exists focusing solely on ascertaining nest survival in a variety
of waterfowl species and determining explanatory factors that account for the spatial and
Page 25
10
temporal variation in success rates (Emery et al. 2005, Stephens et al. 2005, Pieron and Rohwer
2009, Grant and Shaffer 2012, Thompson et al. 2012, Ringelman et al. 2014). Cinnamon teal are
relatively absent from this body of literature due to their range being outside traditional survey
areas and the difficulty differentiating them from blue-winged teal. Nest survival and hen success
(i.e., the product of the probabilities that a hen will nest, renest should her initial attempt fail, and
that the nest is successful) are the most influential parameters in models of the reproductive
success of mallards (Johnson et al. 1992, Hoekman et al. 2002). In addition, Greenwood et al.
(1995) determined that nest success was the most influential vital rate determining mallard
production, and that the percentage of cropland in Prairie Canada influenced the nest success
rates of five duck species. Understanding patterns of variation in nest survival and the
mechanisms that give rise to these patterns is therefore highly useful to managers of duck
populations.
Nest success depends on a variety of factors including, but not limited to, the local
assemblage of predators (Pieron and Rohwer 2009, Amundson et al. 2012), perceptibility of the
nest to predators (Devries and Armstrong 2011, Doherty et al. 2014), nest age (Smith and Wilson
2010), distance and access to high quality foraging sites (Greenwood et al. 1995, Holopainen et
al. 2015), nesting density of concurrent species (Ringelman et al. 2014, Grant and Shaffer 2015),
nest initiation date (Greenwood et al. 1995, Drever and Clark 2007, Ringelman et al. 2018), and
annual variation in weather patterns (Skagen and Yackel Adams 2012, Webb et al. 2012). If
management techniques can be identified that address any or all of the factors resulting in higher
cinnamon teal nest survival, then these tactics can be implemented to increase cinnamon teal
productivity.
Page 26
11
The selection of a nest site has immense fitness implications for waterfowl. In the arid
west, where nesting habitat can be limited, ducks must find and secure a nest site that enables
them to avoid predators, access foraging areas, and provides the necessary conditions for
incubation. The relationship between breeding habitat selection and fitness is rarely studied for
birds (but see Gunnarsson et al. 2005, Arlt and Pärt 2007, Gibson et al. 2016, Pärt et al. 2017),
and not at all for waterfowl. The relationship between nest site characteristics and nest survival
implies that hens that have access to and choose higher quality nest sites should have a higher
probability of breeding successfully. The term “adaptive” has been used to characterize these
decisions in previous literature, pertaining to the benefits conferred on a bird’s reproductive
success based on where they choose to breed (Gibson et al. 2016). My primary objectives were
to determine the influence of nest site habitat characteristics, temporal characteristics, and
individual hen characteristics on daily survival rate (DSR) of cinnamon teal nests in an
intensively managed wetland complex, and to establish whether teal selected those
characteristics disproportionately to their availability in an adaptive manner.
I was interested in the ecological and behavioral processes driving cinnamon teal
reproductive success and the modifiable habitat characteristics associated with these processes.
As vegetation structure is frequently considered a predominant driver of nest site selection and
survival in birds, I centered my hypotheses around these structural traits. I predicted that, of the
covariates corresponding to the microhabitat around the nest, visual obstruction rating, a higher
proportion of graminoids surrounding the nest, and a higher proportion of water surrounding the
nest would be associated with higher nest survival and a higher probability of nest site selection
(Table 1). Dense nesting cover, typically consisting of live stems and matted dead graminoids in
the case of cinnamon teal, affords birds protection from visual identification by predators
Page 27
12
(Ringelman et al. 2017), while nearby water provides easily accessible foraging opportunities
close to the nest (Jungers et al. 2015). Conversely, I predicted higher proportions of bare ground,
forbs, and shrubs around the nest would be associated with lower nest survival and nest site
selection probability. These characteristics are associated with a less dense vegetation
community, precluding the opportunity for teal to create tunnels through the vegetation to their
nests (Grant et al. 2017). In addition, higher proportions of shrubs surrounding the nest could
provide perching opportunities for avian predators (Grant et al. 2017). I also evaluated covariates
relating to a hen’s access to foraging areas (e.g., distance to water) and predators’ access to the
nest (e.g., distance to shrubland), which I predicted would be negatively and positively related to
nest survival, respectively. I predicted these relationships would also hold for nest site selection,
given the need for hens to balance their energetic requirements and safety throughout nesting
(Gibson et al. 2016). In addition to habitat characteristics, I predicted that several traits
associated with an individual hen might influence nest survival. For example, increased clutch
size has been shown to have mixed effects on the probability that a nest will be successful
(Rohwer 1985, Dillon and Conway 2018). In addition, the date at which the hen initiates a nest
relative to other nests and the weight of the hen during nesting are commonly associated with
intraspecific variability in nest survival among waterfowl species (Ringelman et al. 2014, Dugger
et al. 2016). I therefore predicted these hen traits would be unrelated, negatively related, and
positively related to nest survival, respectively.
STUDY AREA
Monte Vista National Wildlife Refuge (NWR) is part of the San Luis Valley NWR
Complex, situated 6 miles south of the town of Monte Vista, Colorado. The 2015 San Luis
Valley Comprehensive Conservation Plan fully characterizes this 6,003-hectare study area,
Page 28
13
which sits at approximately 2,255 meters of elevation and receives less than 20 centimeters of
precipitation annually. Most of the water in this region comes from snowmelt, a shallow
unconfined aquifer, and a deep artesian aquifer (Huntley 1979). The primary vegetation
throughout the study area consists of bulrush (Schoenoplectus sp.), cattails (Typha latifolia),
Baltic rush (Juncus arcticus), and sedges (Carex sp.) in the semi-permanent and permanent
wetlands, as well as rabbitbrush (Ericameria nauseosa), greasewood (Sarcobatus vermiculatus),
saltgrass (Distichlis spicata), and alkali sacaton (Sporobolus airoides) in the upland areas.
Rotational cattle and sheep grazing is used as a management tool for invasive plant species, and
some center pivot irrigation produces barley and alfalfa (USFWS 2015). Historically, Monte
Vista NWR had the highest waterfowl nesting density on the continent (Gilbert et al. 1996), but
drawdown of the aquifers and prolonged drought have resulted in increasingly arid conditions.
Under their 2015 Comprehensive Conservation Plan, the San Luis Valley NWR Complex
included cinnamon teal as a focal species for their chosen plan alternative, linking their life
history and population dynamics directly to their habitat-based objectives (USFWS 2015).
METHODS
Data Collection
I searched for nests from 2015-2017 using a combination of systematic searches and
rope-dragging (Wiens 1969) on foot through all areas of the refuge containing appropriate teal
nesting habitat. These included flooded or potentially flooded meadows of Baltic rush, bulrush,
and grasses. I also specifically searched areas near cinnamon teal drakes on waiting sites
(Bellrose 1980). Additionally, I systematically searched 18 randomly selected 8.5-hectare plots
in 2017 every one to two weeks in addition to opportunistically searching other wetland habitats.
I selected these plots from the aforementioned appropriate habitat and did so to ensure a
Page 29
14
representative sample of teal nests. I trapped cinnamon teal hens using decoy traps from 20
April 2016 to 10 May 2016 and 4 April 2017 to 17 May 2017 and attached a prong-and-suture
VHF radio transmitter (Model A4350 or A4420 weighing 12g [3.6% of the bird’s body weight]
and 8g [2.4% of the bird’s body weight], respectively; Advanced Telemetry Systems, Isanti, MN,
USA) and a metal leg band (U.S. Geological Survey [USGS]), in order to search for nests via
telemetry. All trapping and handling of cinnamon teal followed protocols approved by the
Colorado State University Animal Care and Use Committee (Protocol #15-5756A). I attempted
to locate nests of radiomarked birds by homing in on their approximate location until I could
conclude that they had likely entered the incubation stage to reduce investigator-caused nest
abandonment. I also included in this analysis 19 teal nests found by refuge staff during their
independent nest monitoring project.
I recorded a GPS location and candled eggs to backdate nest initiation date and estimate a
hatch date for all nests found (Weller 1956). I checked nests every five to seven days, which
typically required flushing the hen each time. To reduce investigator disturbance, I monitored
some nests via trail camera (Covert MP8 Trail Camera, Mossy Oak Break-Up Country or Stealth
Cam G42 No-Glo Trail Game Camera STC-G42NG) or video surveillance cameras (Advance
Security Model SSC-24940-36) in 2016 and 2017, allowing me to visit the nest less frequently.
At each identified nest site, I visually characterized habitat information I predicted might
be predictive of selection and subsequent survival of the nest. These included visual obstruction
rating (Robel et al. 1970), nest substrate, the most prevalent live and dead plant genera, distance
of the nest to water, distance to shrubland, and the percent cover of grasses, forbs, shrubs, water,
and bare ground (see Table 1 for citations). I recorded this information within a four-meter radius
centered on the nest using the radius created by the Robel pole cord as a convenient method of
Page 30
15
characterizing the habitat in the immediate vicinity of the nest. In 2017, I measured the same
vegetation information at five randomly generated points within a 30-meter radius of the nest
(Messmer et al. 2015, Guerena et al. 2016). I recorded these measurements within a week of
finding a nest to evaluate a hen’s environment as close to the time that it selected its nest site as
possible (Gibson et al. 2016). Measuring vegetation at that scale allowed me to examine the
factors driving a hen’s selection of a nest site within its home range. Cinnamon teal hens have
been shown to maintain relatively small home ranges, remaining close to their nests during
incubation recesses, and centering home ranges on a high-quality body of water used for
foraging (Gates 1962, Derrickson 1978). Spencer (1953) rarely found the average cinnamon teal
home range around a nest to exceed 0.075 ha and Evans and Black (1956) reported that the blue-
winged teal mean activity radius was 29 ha. I was interested in whether habitat selected at the
nest site scale was chosen for its adaptive impacts on nest survival and therefore wanted to avoid
variability between home ranges incurred by sampling at a larger scale.
Statistical Analyses - Nest Site Selection
I developed a resource selection function (RSF) to evaluate nest site selection of
cinnamon teal. I used discrete choice models (clogit function from survival package in Program
R; Cooper and Millspaugh 1999, R Core Team 2013, Therneau 2015) to fit models with a binary
response variable (1 = used and 0 = available sites) using data sampled in a matched case-control
framework (Hosmer and Lemeshow 2000), and I standardized covariates to compare coefficient
estimates across scales and units. I built an a priori model set including various combinations of
10 covariates corresponding to biologically feasible hypotheses (Table 2.1, Table 2.2). Most
models included only a single covariate given my limited sample size, but I did include several
models incorporating more than one covariate if I thought the interaction between these
Page 31
16
covariates was biologically important to nest site selection. I compared each model to an
intercept-only null model to evaluate which habitat characteristics influenced nest site selection.
Statistical Analyses - Nest Survival
I used a hidden Markov framework (sensu Pradel 2005, Kendall et al. 2012, Johnson et
al. 2016) that extends Devineau et al. (2014) and Miller et al. (2017), to estimate stage-specific
survival rates for both the laying and the incubation periods, allowing for uncertainty in the stage
at which a nest failed. I included five states in these models (Figure 1): Laying (1), Incubation
(2), Failed During Laying (3), Failed During Incubation (4), and Hatched (5). This model
structure includes five parameter types: 𝑆𝑡𝑖, the probability of survival for individuals in state i
from time t to t+1, 𝜓𝑡𝑖𝑗
, the probability of transitioning from state i to state j between times t and
t+1 given that it survives, 𝑝𝑡𝑖, the probability of being detected at time t given that it is in state i
at time t, , 𝜋𝑡𝑖, the probability, given it is released in an unknown state at time t, that it is actually
in state i at time t, and 𝛿𝑡𝑖|𝑖
, the probability that, given it is encountered, the state is assigned
correctly given it is actually in state i. Given that nest survival is expressed through the
transitions 𝜓𝑡13 and 𝜓𝑡
24, which are the daily failure probabilities for each nesting stage (i.e.,
laying and incubation), I set 𝑆𝑡𝑖 ≡ 1 (Devineau et al. 2014). I also fixed 𝑝𝑡
𝑖 ≡ 1 since the
modeling only began after my initial location of the nest and its relocation was guaranteed once I
had already detected it. All 𝛿𝑡𝑖 were fixed to 1 for each living state (i.e., i = 1 and i = 3) since I
had the ability to candle eggs to determine the nest’s age and thus the state, in addition to the fact
that I was mainly interested in my ability to assign the correct state at which a nest failed (i.e., 𝛿𝑡𝑖
for i = 2 and i = 4). I considered the daily transition probability from incubation to hatch (𝜓𝑡25) a
nuisance parameter (Miller et al. 2017) and each occasion within the encounter history
Page 32
17
corresponded to an additional day of nest age, which typically average 10 days for laying and 23
days for incubation. I constrained all models to preclude biologically infeasible transitions and
constrained 𝜓𝑡12, the probability of transitioning from laying to incubation, to occur within a
biologically reasonable timeframe. Since there was some variability in how many eggs hens laid
and when they began incubation, 𝜓𝑡12 was allowed to vary over several days when the transition
was most likely to happen. I constrained 𝜓𝑡12 to 0 before those days and 1.00 afterwards to
preclude unrealistic scenarios and help with estimation. I excluded nests that I judged to have
failed due to investigator activity (n = 32), nests that I found after they had already hatched or
failed (n = 30), and nests inappropriate for other reasons (e.g., could not identify fate, etc.; n = 3)
from the nest survival analysis. I used the number of eggs on my most recent nest visit as a cue
for whether or not the nest failed due to investigator activity. For example, if a nest had 3 eggs
on a given visit, and several days later the nest still had 3 eggs and all eggs were cold, I assumed
that my interruption of the laying period caused that nest to fail.
I included covariates in the models in a two-step approach. I added temporal covariates
first to assess whether daily survival rate varied by nest age or by timing of nest initiation, as it
has been shown to do for many other bird species (Daan et al. 1990). I therefore included linear
and quadratic trends on nest age as well as nest initiation date. To the most parsimonious of those
models I added individual covariates from the Microhabitat, Access, and Intrinsic covariate
groups in biologically meaningful combinations (Table 1). I standardized habitat covariates in
order to compare them across scales and to compare them to the coefficients estimated from the
nest site selection analysis (see below). I implemented these models in Program MARK (White
and Burnham 1999), using the Hidden Markov model (see Pradel 2005, Kendall et al. 2012).
Page 33
18
RESULTS
I found a total of 152 nests from 2015-2017 (N = 40 in 2015, N = 52 in 2016, and N = 60
in 2017). After excluding unusable nests as defined in the methods section, 85 nests remained (N
= 30 in 2015, N = 23 in 2016, and N = 32 in 2017) with which to evaluate nest survival. I used
57 nests found in 2017 to evaluate nest site selection, excluding only those for which I failed to
obtain random vegetation points for logistical reasons. Of the 85 nests included in the nest
survival analysis, 31 were depredated, 6 were abandoned, and 4 failed due to other causes (e.g.,
flooding, inviable eggs, hen killed, etc.).
Nest Site Selection
Baltic rush was the primary substrate for cinnamon teal nests (98.2%), followed by other
graminoids (grasses and sedges; 1.75%). Most nests (70.2%) were in flooded meadows, followed
by upland areas (9.27%). Consistent with my predictions (Table 2.1), hens were more likely to
select sites with high proportions of grasses (β̂PGrass = 0.535, SE = 0.204; Table 2.2, Figure 2.2)
and low proportions of forbs (β̂PForbs = -0.799, SE = 0.250; Table 2.2, Figure 2.2) in the
immediate vicinity around the nest. Adding the proportion of grass to the model including the
proportion of forbs did not improve the fit, but the apparent effect for PGrass still exhibited the
predicted positive relationship with nest site selection (Table 2.2; Arnold 2010) and percent forbs
was therefore considered the most important variable. The model including distance to shrubland
was the third ranked model, predicting that hens would select sites closer to shrubland relative to
available sites (β̂DShrub = -0.934, SE = 0.351, ∆𝐴𝐼𝐶𝑐 = 5.91, Table 2.3). Percent water exhibited
a positive but weak relationship with nest site selection consistent with my predictions
(β̂PWater = 0.243, SE = 0.168, ∆𝐴𝐼𝐶𝑐 = 11.7). The model including percent bare ground
exhibited a negative relationship with nest site selection, consistent with my predictions (β̂PBG =
Page 34
19
-0.343, SE = 0.231), but received weak support (∆𝐴𝐼𝐶𝑐 = 6.76, 𝑤𝑖 = 0.007). Contrary to my
predictions, neither distance to water nor visual obstruction rating affected nest site selection at
the scale I measured (β̂DWater = -0.432, SE = 0.383; β̂VOR = 0.063, SE = 0.198; Tables 2.2 & 2.3,
Figure 2.2). Percent shrubs also failed to exhibit the negative relationship with nest site selection
I predicted (β̂PShrubs = -0.032, SE = 0.165).
Nest Survival
My top model indicated that nest survival was 0.194 (SE = 0.076) across the full 33-day
nesting period and did not vary by year (Tables 2.4 & 2.5, Appendix A). Daily survival rate
during the laying period (𝐷𝑆�̂�𝑙𝑎𝑦) was 0.887 (SE = 0.033; Overall survival for 10-day laying
period = 0.301, SE = 0.073) compared to 0.981 (SE = 0.006) for daily survival rate during
incubation (𝐷𝑆�̂�𝑖𝑛𝑐; Overall survival for 23-day incubation period = 0.643, SE = 0.027). A
quadratic effect of nest initiation date (NID2) was consistently included in the top models, and
the most parsimonious models in the first model-building step included a linear age trend on ψ12,
ψ25, δLay, and δInc. Percent forbs (PForbs) was the only microhabitat covariate consistently
included in the top models (β̂Pforbs for Inc. = -0.432, SE = 0.172; Tables 2.2 & 2.5). Distance to
water, distance to shrubland, and percent water all exhibited weakly negative relationships with
incubation survival, all of which were consistent with my predictions except percent water
(β̂DWater = -0.182, SE = 0.157, β̂DShrub = -0.121, SE = 0.272, β̂PWater = -0.160, SE = 0.305). The
relationship between percent of living vegetation and incubation survival was also consistent
with my predictions, exhibiting a positive relationship (β̂PLive = 0.556, SE = 0.256). However, the
positive direction of relationships between percent bare ground and incubation survival and
percent of shrubs and incubation survival opposed my predictions (β̂PBG = 0.278, SE = 0.226,
β̂PShrub = 0.456, SE = 0.563). The relationship between vegetation density and incubation survival
Page 35
20
approached zero, contrary to my predictions (β̂VOR = 0.020, SE = 0.237). Clutch size and hen
weight were also very weakly associated with incubation survival (β̂Clutch = -0.105, SE = 0.267,
β̂Weight = 0.003, SE = 0.012). The relationship between daily survival rate and NID varied
between the two nest stages (Figure 2.3 and Figure 2.4). Laying DSR exhibited a weakly positive
relationship with NID, whereas incubation DSR exhibited a negative relationship (β̂NID,Lay =
0.011, SE = 0.045, β̂NID, Inc = -0.145, SE = 0.065).
Relationships between Nest Site Selection and Nest Survival
Relationships between characteristics influencing nest site selection and nest survival
varied by both nest stage and covariate. All of the microhabitat and access covariates exhibited
weak, statistically insignificant relationships with nest survival during the laying period, with
visual obstruction rating showing the most substantial trend (β̂VOR for Lay = 0.497, SE = 0.288;
Appendix A). During incubation, however, PForbs was negatively associated with nest survival
(β̂PForbs for Inc. = -0.432, SE = 0.172), and was disproportionately selected less frequently than
other plant taxa at the nest site scale (β̂PForbs = -0.799, SE = 0.250; Figure 2.2). PGrass exhibited
a complementary relationship with PForbs, with higher proportions of grass exhibiting a positive
apparent effect on incubation survival (β̂PGrass = 0.315, SE = 0.219) and teal selecting higher
proportions of grass more frequently (β̂PGrass = 0.535, SE = 0.204; Figure 2.2).
DISCUSSION
Adaptive Nest Site Selection
I found variable relationships between nest site selection and nest survival during
different cinnamon teal nesting stages. Although my study provides some evidence that
cinnamon teal selected nest sites adaptively for some characteristics and not for others, I caution
Page 36
21
the reader that this study was observational (i.e., without manipulation to the system) and sample
size was limited, and it should therefore be interpreted accordingly. Birds selected sites with
lower proportions of forbs and higher proportions of grasses, which subsequently led to higher
incubation survival. Although I did not identify forbs or grasses down to species, a majority of
the forb species consisted of invasive plants, most commonly perennial pepperweed (Lepidium
latifolium). This species can drastically change the productivity and composition of herbaceous
wetland plant communities (Young et al. 1995, USFWS 2015) and spreads rapidly throughout
wetland areas. It is a tall plant that grows densely and may break up the structure of the
vegetation enough to prevent teal from tunneling to and from their nests (Gammonley 2012). If
invasive forb species are, in fact, a culprit of reduced cinnamon teal nest survival, it appears as if
they are attempting to mitigate this effect by selecting nest sites in areas less affected by invasive
species. Although the cinnamon teal has a relatively fast life history strategy, it is likely able to
adjust its selection criteria annually to reflect past experiences and local conditions, as seen in a
variety of other bird species (Forstmeier and Weiss 2004, Lawrence et al. 2016, Devries et al.
2018, Porzig et al. 2018). To truly test whether natural selection is driving the directionality of
cinnamon teal nest site selection, however, a long-term study of the temporal variability in nest
site selection would be necessary (Clark and Shutler 1999, Devries et al. 2018).
Nest Survival
This study represents the only attempt of which I am aware to estimate nest survival for
cinnamon teal using modern, unbiased methodology. Although inference can only be made at the
scale of the study area, nest survival estimates are comparable to those of other fast-lived
waterfowl species (Johnson 1979, Lokemoen et al. 1990). Using a hidden Markov approach to
estimate nest survival not only allowed me to incorporate uncertainty in the state at which a nest
Page 37
22
failed, but also to view patterns that would otherwise have been inestimable. Daily survival rate
of nests was lower during the laying stage than the incubation stage for cinnamon teal. Hens lay
one egg a day, and typically do not attend the nest regularly during the laying period
(Gammonley 2012). Their eggs are therefore more exposed and less protected from nest
predators. Consequently, nesting studies that fail to incorporate nests found during the laying
stage or include few nests in the analysis that were found during laying might be biasing nest
survival estimates high. Using the stage-based framework to analyze nest survival also allowed
me to elucidate differing relationships between nest initiation date and nest survival during the
two nesting stages. Waterfowl typically exhibit a negative relationship between nest survival and
initiation date, although evidence is frequently mixed (Drever and Clark 2007). I found a
negative relationship between nest survival and initiation date during only the incubation period
for cinnamon teal. Trade-offs in nest initiation date and the amount of available resources on the
landscape likely shape this relationship, since nesting earlier allows hens to occupy high-quality
nesting sites with easily accessible foraging areas during an energetically expensive time (Emery
et al. 2005). This might not be as important during the laying stage, when hens spend
considerably more time off the nest and therefore have the ability to spend more time foraging.
This relationship, therefore, might only present itself during the incubation stage of nesting.
Therefore, studies that do not partition nest survival into the different nesting stages might be
overlooking the nuanced ways in which nesting behavior can be both adaptive and maladaptive
(Blums et al. 2005, Ringelman et al. 2018). Studies that find mixed effects of nest initiation date
on nest survival might actually find the expected negative effect were they to examine only the
incubation period. I did, however, monitor nests less frequently during the laying stage than
Page 38
23
during incubation to prevent investigator-caused abandonment, and my power to detect an effect
during the laying stage was therefore lower.
Conclusions
This study offers novel insights into an enigmatic duck species whose breeding habits are
rarely studied. Estimating differences in its nest survival across the nesting stages and
preferences for nest site selection provides a first step in describing the productivity of this
species and managing for a stable, if not increasing, population. More research is necessary to
ascertain the underlying mechanisms producing differences among laying and incubation
survival, and nest attendance patterns might provide a starting point for such research. In
addition, sample size was limited and repeating this study at Monte Vista NWR as well as other
sites could greatly enhance the evidence for the processes exemplified here. Fitness
consequences of the choices made during reproduction can scale up to subsequently affect
overall population dynamics. Therefore, understanding the mechanisms guiding choices that
affect reproductive output have the potential to not only guide management actions, but to
broaden our understanding of the evolution of differing life history strategies and species
population dynamics.
MANAGEMENT IMPLICATIONS
Cinnamon teal management is not frequently at the forefront of discussion among
waterfowl managers given its relative population stability and the lack of information pertaining
to many of its vital rates (USFWS 2013). This study represents an advancement of the baseline
information necessary to determine whether large-scale management interventions are necessary
to maintain a stable cinnamon teal population throughout the Intermountain West. An estimated
nest survival rate that is similar to other species of teal across North America and breeding
Page 39
24
habitat selection trends consistent with management already carried out for a majority of
waterfowl species indicate few management actions are likely required beyond the status quo.
Although generalizations outside of my study area are limited and the observational nature of
this study limits causal inference, I did find evidence to suggest that cinnamon teal are adaptively
avoiding high densities of forbs when choosing a nest site. Some of these forbs may consist of
late-successional wetland plants like cattails, but many of the forbs influencing teal nest site
selection and survival are likely invasive species such as perennial pepperweed and Canada
thistle. Late-successional species can be minimized and food-producing emergent vegetation
maximized through the use of moist-soil management regimes and prescribed burns (Kantrud
1986; Ringelman 1990; Haukos and Smith 1993; de Szalay and Rush 1997). Monte Vista
National Wildlife Refuge already takes extensive measures to combat the spread of invasive
plant species using pesticides, burning, and hydrological management. My results represent
substantial support for continuing those practices as they indicate some of the forb species on the
refuge may be negatively influencing both habitat use and nest survival of one of their focal
species, the cinnamon teal. Current management of cinnamon teal does not differ drastically
from management of other waterfowl species in the Intermountain West, and other species might
also benefit from management regimes favoring breeding cinnamon teal.
Page 40
25
Table 2.1: Descriptions of covariates used in analyses of cinnamon teal nest survival and nest site selection on Monte Vista NWR
from 2015-2017 and the predicted direction of the effect of each covariate on the response.
Covariate
Group
Covariate Covariate
Abbreviation
Description Nest
Survival
Prediction
Nest Site
Selection
Prediction
Citations
Microhabitat Visual
Obstruction
Rating
Robel The height of vegetation (in
cm) that visually obstructed
the nest bowl. Measurements
were taken from each
cardinal direction at a
distance of 4 m and then
averaged.
+ + Crabtree et al. 1989,
Lokemoen et al. 1990,
Fondell and Ball 2003,
Thompson et al. 2012,
Ness and Klaver 2016
% Grass PGrass The percent of the total area
within a 4 m radius plot
around the nest that consisted
of graminoids (grasses,
sedges, and rushes).
+ + Greenwood et al. 1995,
Phillips et al. 2003,
Stephens et al. 2005,
Gammonley 2012
% Water PWater The percent of the total area
within a 4 m radius plot
around the nest that was
taken up by water.
+ + Laubhan and
Gammonley,
unpublished study,
Wheeler and Harris
1970, Myers 1982
Page 41
26
% Bare
Ground
PBG The percent of the total area
within a 4 m radius plot
around the nest that was
taken up by bare ground.
- - Lokemoen and
Woodward 1992
% Forbs PForbs The percent of the total area
within a 4 m radius plot
around the nest that consisted
of forbs (any non-graminoid
herbaceous wetland plant).
- - Dion et al. 2000; Hines
and Mitchell 1983
% Shrubs PShrub The percent of the total area
within a 4 m radius plot
around the nest that consisted
of shrubs (most frequently
greasewood or rabbitbrush).
- - Thompson et al. 2012
% Live PLive The percent of the total area
within a 4 m radius plot
around the nest that consisted
of living vegetation rather
than dead, matted stems from
the previous year.
+ +
Access Distance to
Shrubland
DShrub Distance in m to the closest
patch of shrubs > 1 ha in size.
+ + Paton 1994, Stephens et
al. 2005
Page 42
27
Distance to
Water
DWater Distance (m) to any water
body, including ponds or
flooded meadows.
- - Laubhan and
Gammonley,
unpublished study,
Wheeler and Harris
1970, Myers 1982,
Crabtree et al. 1989,
Jungers et al. 2015
Intrinsic/Other Clutch Size Clutch Number of cinnamon teal
eggs in the nest.
0 NA Rohwer 1985
Hen Weight Weight Weight (g) of the hen. + NA Reviewed by Johnson et
al. 1992, Pace and
Afton 1999
Nest
Initiation
Date
NID The number of days past my
arbitrary start date (10 May)
the nest was initiated. Can be
negative if the nest was
initiated before 10 May.
- NA Crabtree et al. 1989,
Daan et al. 1990, Drever
and Clark 2007,
Ringelman et al. 2014
Page 43
28
Table 2.2 Coefficient estimates for each covariate corresponding to analyses of cinnamon teal nest site selection and nest survival on
Monte Vista NWR, 2015-2017. Nest survival was analyzed in a multistate framework to assess the effects of covariates on both the
laying and incubation stages of nesting.
Covariate Nest Site Selection β
Estimate
SE Laying Survival
β Estimate
SE Incubation Survival
β Estimate
SE
DShrub -0.934 0.351 0.248 0.370 -0.182 0.157
DWater -0.432 0.383 -0.038 0.047 -0.121 0.272
PBG -0.521 0.295 0.322 0.607 0.556 0.256
PForbs -0.799 0.250 0.290 0.325 0.278 0.226
PGrass 0.535 0.204 0.149 0.270 -0.160 0.305
PLive -0.315 0.198 0.321 0.291 0.456 0.563
PShrub -0.036 0.178 -0.471 0.313 0.315 0.219
PWater 0.243 0.168 -0.146 0.265 -0.432 0.172
VOR 0.063 0.198 0.497 0.288 0.020 0.237
Page 44
29
Table 2.3: AICc table for nest site selection analysis using discrete choice models of cinnamon teal nesting on Monte Vista NWR in
2017. PForbs = % of the area within a four-meter radius plot around the nest consisting of forbs, PGrass = % of the area within a
four-meter radius plot around the nest consisting of grass, PBG = % of the area within a four-meter radius plot around the nest
consisting of bare ground, PWater = % of the area within a four-meter radius plot around the nest consisting of water, PLive = %
of the area within a four-meter radius plot around the nest in which the vegetation is living (i.e., the current year’s growth), PShrub =
% of the area within a four-meter radius plot around the nest consisting of shrubs, DShrub = distance (in m) from the nest to the
closest area of shrubs > one ha in size, DWater = distance (in m) from the nest to the closest water body or flooded meadow, and
Robel = the height of vegetation (in cm) that visually obstructed the nest bowl. Measurements were taken from each cardinal direction
at a distance of 4 m and then averaged.
Model Structure Df LogLik AICc Delta AICc Model Weight
β1*(PForbs) 1 -95.3 192.6 0.0 0.7
β1*(PForbs) + β2*(PGrass) 2 -95.3 194.6 2.0 0.2
β1*(DShrub) 1 -98.2 198.5 5.9 0.0
β1*(PGrass) 1 -98.3 198.6 6.1 0.0
β1*(DShrub) + β2*(DWater) 2 -98.0 200.1 7.6 0.0
β1*(PBG) 1 -99.9 201.7 9.2 0.0
β1*(PLive) 1 -101 203.8 11.2 0.0
β1*(PWater) 1 -101 204.2 11.7 0.0
β1*(DWater) 1 -101 204.9 12.3 0.0
β1*(VOR) 1 -102 206.2 13.6 0.0
β1*(PShrub) 1 -102 206.2 13.7 0.0
Page 45
30
Table 2.4: Summary of cinnamon teal nest fates for nests found on Monte Vista National Wildlife Refuge from 2015-2017.
Year Number of
Nests Found
Number of
Successful Nests
Number of
Depredated Nests
Number of
Abandoned Nests*
Number of Nests Failed
Due to Other Causes
Nest
Survival
2015 40 9 19 10 2 0.194
2016 52 17 13 20 2 0.194
2017 60 23 26 10 1 0.194
*Includes nests whose hens abandoned due to investigator activity as well as those that abandoned due to other causes.
Page 46
31
Table 2.5: 90% confidence set (based on Akaike weights) indicating support for models explaining cinnamon teal nest survival on
Monte Vista NWR from 2015-2017. ψ12 = The probability that a nest will transition from the laying stage to the incubation stage, δLay
= The probability of being able to detect that a nest failed during the laying state given that it did fail during the laying state, ψ13 =
The probability that a nest will fail during the laying stage, ψ24 = The probability that a nest will fail during the incubation stage, ψ25 =
The probability that a nest will transition from the incubation stage to the hatched stage, at which point modeling stops, δInc = The
probability of being able to detect that a nest failed during the incubation state given that it did fail during the incubation state, NID2
indicates a quadratic effect on nest initiation date, + indicates an additive effect, Age = Linear time trend, Pforbs = % of the area
within a four-meter radius plot around the nest consisting of forbs, Pgrass = % of the area within a four-meter radius plot around the
nest consisting of grass, Pshrub = % of the area within a four-meter radius plot around the nest consisting of shrubs, Robel = visual
obstruction rating as measured using a Robel pole (Robel et al. 1970), Dshrub = distance (in m) from nearest patch of shrubs > 1 ha
in size, and Clutch = the number of eggs laid by a hen once she enters incubation (i.e., the full clutch size).
Model Structure Number of
Parameters
Model
Likelihood
AICc Delta
AICc
Model
Weight
Deviance
ψ12(Age) ψ13(NID2) ψ24(NID2+Pforbs) ψ25(Age) δLay(Age) δInc(Age) 13 1.0 351.3 0.0 0.3 324.8
ψ12(Age) ψ13(NID2+Pforbs) ψ24(NID2+Pforbs) ψ25(Age) δLay(Age) δInc(Age) 14 0.6 352.5 1.2 0.1 323.9
ψ12(Age) ψ13(Age+NID2) ψ24(NID2+Pforbs) ψ25(Age) δLay(Age) δInc(Age) 14 0.5 352.5 1.2 0.1 323.9
ψ12(Age) ψ13(Age+NID2) ψ24(Age+ NID2+Pforbs) ψ25(Age) δLay(Age) δInc(Age) 15 0.4 353.4 2.1 0.1 322.7
ψ12(Age) ψ13(NID2) ψ24(NID2) ψ25(Age) δLay(Age) δInc(Age) 12 0.2 354.9 3.5 0.0 330.4
ψ12(Age) ψ13(NID2) ψ24(NID2+Pgrass) ψ25(Age) δLay(Age) δInc(Age) 13 0.2 355.0 3.6 0.0 328.4
ψ12(Age) ψ13(NID2+Clutch) ψ24(NID2+Clutch) ψ25(Age) δLay(Age) δInc(Age) 14 0.1 355.2 3.9 0.0 326.6
ψ12(Age) ψ13(NID2+robel) ψ24(NID2+robel) ψ25(Age) δLay(Age) δInc(Age) 14 0.1 355.8 4.4 0.0 327.1
Page 47
32
ψ12(Age) ψ13(NID2+Pshrub) ψ24(NID2+Pshrub) ψ25(Age) δLay(Age) δInc(Age) 14 0.1 355.9 4.6 0.0 327.3
ψ12(Age) ψ13(NID2) ψ24(NID2+Age) ψ25(Age) δLay(Age) δInc(Age) 13 0.1 356.2 4.9 0.0 329.7
ψ12(Age) ψ13(Pforbs) ψ24(Age+Pforbs) ψ25(Age) δLay(Age) δInc(Age) 11 0.1 356.6 5.3 0.0 334.2
ψ12(Age) ψ13(NID2+Pgrass) ψ24(NID2+Pgrass) ψ25(Age) δLay(Age) δInc(Age) 14 0.1 356.7 5.4 0.0 328.1
ψ12(Age) ψ13(NID2) ψ24(NID2+Dshrub) ψ25(Age) δLay(Age) δInc(Age) 13 0.1 356.8 5.4 0.0 330.2
ψ12(Age) ψ13(NID2) ψ24(NID2+Clutch) ψ25(Age) δLay(Age) δInc(Age) 13 0.1 356.8 5.5 0.0 330.3
ψ12(Age) ψ13(NID2) ψ24(NID2+robel) ψ25(Age) δLay(Age) δInc(Age) 13 0.1 356.9 5.6 0.0 330.4
Page 48
33
Figure 2.1: Diagram of nesting stages for cinnamon teal nest survival analysis in a multistate
framework. For nest failures, the stage at failure is allowed to be uncertain.
Page 49
34
Figure 2.2: 𝛽 parameter estimates corresponding to nest site selection (from univariate discrete
choice models) and nest survival (from hidden Markov model) during cinnamon teal laying and
incubation on Monte Vista NWR from 2015-2017. Nest site selection results are based on 57
cinnamon teal nests from 2017, while nest survival results are based on 85 nests pooled across
2015-2017. Points indicate apparent effect and error bars indicate 95% confidence intervals.
Page 50
35
Figure 2.3: Relationship between nest initiation date and daily survival rate of cinnamon teal
nests on Monte Vista NWR from 2015-2017 during the laying stage of nesting.
Page 51
36
Figure 2.4: Relationship between nest initiation date and daily survival rate of cinnamon teal
nests on Monte Vista NWR from 2015-2017 during the incubation stage of nesting.
Page 52
37
Literature Cited
Amundson, C.L., M.R. Pieron, T.W. Arnold, L.A. Beaudoin. 2012. The effects of predator
removal on mallard production and population change in Northeastern North Dakota. The
Journal of Wildlife Management, 77:143-152.
Arnold, T.W. 2010. Uninformative parameters and model selection using Akaike’s Information
Criterion. The Journal of Wildlife Management, 74:1175-1178.
Arlt, D., T. Pärt. 2007. Nonideal breeding habitat selection: A mismatch between preferences
and fitness. Ecology, 88:792-801.
Bellrose, F.C. 1980. Ducks Geese & Swans of North America. Stackpole Books. Harrisburg, PA.
Blums, P., J.D. Nichols, J.E. Hines, M.S. Lindberg, A. Mednis. 2005. Individual quality, survival
variation and patterns of phenotypic selection on body condition and timing of nesting in
birds. Oecologia, 143:365-376.
Clark, R.G., D. Shutler. 1999. Avian habitat selection: Pattern from process in nest-site use by
ducks? Ecology, 80:272-287.
Cooper, A.B., J.J. Millspaugh. 1999. The application of discrete choice models to wildlife
resource selection studies. Ecology, 80:566-575.
Cowardin, L.M., D.S. Gilmer, C.W. Shaiffer. 1985. Mallard recruitment in the agricultural
environment of North Dakota. Wildlife Monographs, 92:3-37.
Crabtree, R.L., L.S. Broome, M.L. Wolfe. 1989. Effects of habitat characteristics on gadwall nest
predation and nest-site selection. The Journal of Wildlife Management, 53:129-137.
Daan, S., C. Dijkstra, J.M. Tinbergen. 1990. Family planning in the kestrel (Falco tinnunculus):
The ultimate control of covariation of laying date and clutch size. Behaviour, 114:83-116.
Derrickson, S.R. 1978. The mobility of breeding pintails. The Auk, 95:104-114.
Page 53
38
De Szalay, F.A., V.H. Resh. 1997. Responses of wetland invertebrates and plants important in
waterfowl diets to burning and mowing of emergent vegetation. Wetlands, 17:149-156.
Devineau, O., W.L. Kendall, P.F. Doherty, T. Shenk, G.C. White, P. Lukacs, K.P. Burnham,.
2014. Increased Flexibility for Modeling Telemetry and Nest-Survival Data Using the
Multistate Framework. The Journal of Wildlife Management, 78:224-230.
Devries, J.H., L.M. Armstrong. 2011. Impact of management treatments on waterfowl use of
dense nesting cover in the Canadian parklands. The Journal of Wildlife Management,
75:1340-1349.
Devries, J.H., R.G. Clark, L.M. Armstrong. 2018. Dynamics of habitat selection in birds:
adaptive response to nest predation depends on multiple factors. Oecologia, 187:305-318.
Dillon, K.G., C.J. Conway. 2018. Nest predation risk explains variation in avian clutch size.
Behavioral Ecology, 29:301-311.
Dion, N., K.A. Hobson, S. Larivière. 2000. Interactive effects of vegetation and predators on the
success of natural and simulated nests of grassland songbirds. The Condor, 102: 629-634.
Doherty, K.E., D.E. Naugle, J.D. Tack, B.L. Walker, J.M. Graham, J.L. Beck. 2014. Linking
conservation actions to demography: grass height explains variation in greater sage-
grouse nest survival. Wildlife Biology, 20: 320-325.
Drever, M.C., R.G. Clark. 2007. Spring temperature, clutch initiation date and duck nest success:
a test of the mismatch hypothesis. Journal of Animal Ecology, 76:139-148.
Dugger, B.D., J.M. Coluccy, K.M. Dugger, T.T. Fox, D. Kraege, M.J. Petrie. 2016. Population
dynamics of mallards breeding in eastern Washington. Journal of Wildlife Management,
80:500-509.
Page 54
39
Emery, R.B., D.W. Howerter, L.M. Armstrong, M.G. Anderson, J.H. Devries, B.L. Joynt. 2005.
Seasonal Variation in waterfowl nesting success and its relation to cover management in
the Canadian prairies. Journal of Wildlife Management 69:1181-1193.
Fondell, T.F., I.J. Ball. 2003. Density and success of bird nests relative to grazing on western
Montana grasslands. Biological Conservation, 117: 203-213.
Forstmeier, W., I. Weiss. 2004. Adaptive plasticity in nest-site selection in response to changing
predation risk. Oikos, 104:487-499.
Gammonley, J. H. 2012. Cinnamon Teal (Anas cyanoptera), The Birds of North America Online
(A. Poole, Ed.). Ithaca: Cornell Lab of Ornithology.
Gates, J.M. 1962. Breeding biology of gadwall in northern Utah. The Wilson Bulletin, 74:43-67.
Gibson, D., E.J. Blomberg, M.T. Atamian, J.S. Sedinger. 2016. Nesting habitat selection
influences nest and early offspring survival in Greater Sage-Grouse. The Condor,
118:689-702.
Gilbert, D.W., D.R. Anderson, J.K. Ringelman, and M.R. Szymczak. 1996. Response of nesting
ducks to habitat and management on the Monte Vista National Wildlife Refuge,
Colorado. Wildlife Monographs 131:3-44.
Grant, T.A., T.L. Shaffer. 2012. Time-specific patterns of nest survival for ducks and passerines
breeding in North Dakota. The Auk, 129:219-328.
Grant, T.A., T.L. Shaffer. 2015. Do ducks and songbirds initiate more nests when the probability
of survival is greater? The Canadian Field-Naturalist, 129:323-330.
Grant, T.A., T.L. Shaffer, E.M. Madden, M.P. Nenneman. 2017. Contrasting nest survival
patterns for ducks and songbirds in northern mixed-grass prairie. Journal of Wildlife
Management, 81:641-651.
Page 55
40
Greenwood, R.J., A.B. Sargeant, D.H. Johnson, L.M. Cowardin, T.L. Shaffer. 1995. Factors
associated with duck nest success in the Prairie Pothole Region of Canada. Wildlife
Monographs, 128:3-57.
Guerena, K.B., P.M. Castelli, T.C. Nichols, C.K. Williams. 2016. Factors influencing nest
survival in resident Canada geese. The Journal of Wildlife Management, 80:1022-1030.
Gunnarsson, T.G., J.A. Gill, J. Newton, P.M. Potts, W.J. Sutherland. 2005. Seasonal matching of
habitat quality and fitness in a migratory bird. Proc. R. Soc. B, 272:2319-2323.
Haukos, D.A., L.M. Smith.1993. Moist-soil management of playa lakes for migrating and
wintering ducks. Wildlife Society Bulletin, 21:288-298.
Hines, J.E., G.J. Mitchell. 1983. Gadwall nest-site selection and nesting success. The Journal of
Wildlife Management, 47:1063-1071.
Hoekman, S.T., L.S. Mills, D.W. Howerter, J.H. Devries, and J.J. Ball. 2002. Sensitivity
analyses of the life cycle of mid-contient mallards. Journal of Wildlife Management
66:883-900.
Holopainen, S., C. Arzel, L. Dessborn, J. Elmberg, G. Gunnarsson, P. Nummi, H. Pöysa, K.
Sjöberg. 2015. Habitat use in ducks breeding in boreal freshwater wetlands: a review.
The European Journal of Wildlife Research 61:339-363.
Hosmer, D.W., S. Lemeshow. 2000. Applied Logistic Regression. New York: John-Wiley &
Sons, Inc.
Huntley, D. 1979. Ground-water recharge to the aquifers of northern San Luis Valley, Colorado:
Summary. Geological Society of America Bulletin, 90:707-709.
Jehle, G., A.A. Yackel Adams, J.A. Savidge, and S.K. Skagen. 2004. Nest survival estimation: a
review of alternatives to the Mayfield estimator. The Condor 106:472-484.
Page 56
41
Johnson, D.H. 1979. Estimating nest success: The Mayfield method and an alternative. The Auk,
96:651-661.
Johnson, D. H., J.D. Nichols, and M.D. Schwartz. 1992. Population dynamics of breeding
waterfowl. In Ecology and Management of Breeding Waterfowl eds. B. D. J. Batt, A.D.
Afton, M.G. Anderson, C.D. Ankney and D. H. Johnson pp. 446-485. University of
Minneapolis Press, Minneapolis, MN.
Johnson, D.S., J.L. Laake, S.R. Melin, R.L. DeLong. 2016. Multivariate state hidden Markov
models for mark-recapture data. Statistical Science, 31:233-244.
Jungers, J.M., T.W. Arnold, C. Lehman. 2015. Effects of grassland biomass harvest on nesting
pheasants and ducks. The American Midland Naturalist, 173:122-132.
Kantrud, H.A. 1986. Effects of vegetation manipulation on breeding waterfowl in prairie
wetlands: A literature review. Fish and Wildlife Technical Report 3.
Kendall, W.L., G.C. White, J.E. Hines, C.A. Langtimm, J. Yoshizaki. 2012. Estimating
parameters of hidden Markov models based on marked individuals: use of robust design
data. Ecology 93:913-920.
Lawrence, C., D. Paris, J.V. Briskie, M. Massaro. 2016. When the neighbourhood goes bad: can
endangered black robins adjust nest‐site selection in response to the risk of an invasive
predator? Animal Conservation, 20:321-330.
Lokemoen, J.T., H.F. Duebbert, D.E. Sharp. 1990. Homing and reproductive habits of mallards,
gadwalls, and blue-winged teal. Wildlife Monographs, 106:3-28.
Lokemoen, J.T., R.O. Woodward. 1992. Nesting waterfowl and water birds on natural islands in
the Dakotas and Montana. Wildlife Society Bulletin, 20:163-171.
Page 57
42
Messmer, D.J., S.A. Petrie, S.S. Badzinski, M.L. Gloutney, M.I. Schummer. 2015. Habitat
associations of breeding mallards and canada geese in southern Ontario, Canada. Wildlife
Society Bulletin, 39:543-552.
Miller, M.W., D.I. Leech, J.W. Pearce-Higgins, R.A. Robinson. 2017. Multi-state, multi-stage
modeling of nest-success suggests interaction between weather and land use. Ecology
98:175-186.
Myers, T.L. 1982. Ecology of nesting waterfowl on Anderson mesa, in north central Arizona.
Master's Thesis, Univ. of Arizona, Tucson.
Ness, B.N., R.W. Klaver. 2016. Canada goose nest survival at rural wetlands in north-central
Iowa. Wildlife Society Bulletin, 40:705-713.
Pace R.M., Afton A.D. 1999. Direct recovery rates of lesser scaup banded in Northwest
Minnesota: sources of heterogeneity. The Journal of Wildlife Management, 63:389–395.
Pärt, T., J. Knape, M. Low, M. Oberg, D. Arlt. 2017. Disentangling the effects of date,
individual, and terriftory quality on the seasonal decline in fitness. Ecology, 98:2102-
2110.
Paton, P.W.C. 1994. The effect of edge on avian nest success: How strong is the evidence?
Conservation Biology, 8:17-26.
Phillips, M.L., W.R. Clark, M.A. Sovada, D.J. Horn, R.R. Koford, R.J. Greenwood. 2003.
Predator selection of prairie landscape features and its relation to duck nest success. The
Journal of Wildlife Management, 67:104-114.
Pieron, M.R., F.C. Rohwer. 2009. Effects of large-scale predator reduction on nest success of
upland nesting ducks. The Journal of Wildlife Management, 74:124-132.
Page 58
43
Porzig, E.L, N.E. Seavy, J.M. Eadie, T. Gardali, D.L. Humple, G.R. Geupel. 2018. There goes
the neighborhood: White-crowned Sparrow nest site selection and reproductive success
as local density declines. The Condor, 120:234-244.
Pradel, R. 2005. Multievent: An extension of multistate capture-recapture models to uncertain
states. Biometrics, 61:442-447.
R Core Team. 2013. R: A language and environment for statistical computing. R Foundation for
Statistical Computing, Vienna, Austria. URL http://www.R-project.org/.
Ringelman, K.M., J.M. Eadie, J.T. Ackerman. 2014. Adaptive nest clustering and density-
dependent nest survival in dabbling ducks. Oikos, 123:239-247.
Ringelman, K.M., J.M. Eadie, J.T. Ackerman, A. Sih, D.L. Loughman, G.S. Yarris, S.L.
Oldenburger, M.R. McLandress. 2017. Spatiotemporal patterns of duck nest density and
predation risk: a multi-scale analysis of 18 years and more than 10000 nests. Oikos,
126:332-338.
Ringelman, K.M., J. Walker, J.K. Ringleman, S.E. Stephens. 2018. Temporal and multi-spatial
environmental drivers of duck nest survival. The Auk, 135:486-494.
Ringelman, J.K. 1990. “Chapter 13.4.4. Habitat Management for Molting Waterfowl."
Waterfowl Management Handbook.
Robel, R.J., J.N. Briggs, A.D. Dayton, and L.C. Hulbert. 1970. Relationships between visual
obstruction measurements and weight of grassland vegetation. Journal of Range
Management 23:295-297.
Rohwer, F.C. 1985. The adaptive significance of clutch size in prairie ducks. The Auk, 102:354-
361.
Page 59
44
Rotella, J.J., R.G. Clark, and A.D. Afton. 2003. Survival of female lesser scaup: effects of body
size, age and reproductive effort. Condor 105:336-347.
Shaffer, T.L. 2004. A unified approach to analyzing nesting success. The Auk 121:526-540.
Skagen, S.J., A.A. Yackel-Adams. 2012. Weather effects on avian breeding performance and
implications of climate change. Ecological Applications, 22:1131-1145.
Smith, P.A., S. Wilson. 2010. Intraseasonal patterns in shorebird nest survival are related to nest
age and defence behavior. Oecologia, 163:613-624.
Spencer, Jr., H.E. 1953. The Cinnamon Teal, Anas cyanoptera (Vieillot): its life history, ecology,
and management. Master's Thesis. Utah State University. Logan.
Stephens, S.E., J.J. Rotella, M.S. Lindberg, M.L. Taper, J.K. Ringelman. 2005. Duck nest
survival in the Missouri Coteau of North Dakota: Landscape effects at multiple spatial
scales. Ecological Applications 15:2137-2149.
Therneau, T. 2015. A Package for Survival Analysis in S. version 2.38, https://CRAN.R-
project.org/package=survival.
Thompson, S.J., T.W. Arnold, S. Vacek. 2012. Impact of encroaching woody vegetation on nest
success of upland waterfowl. The Journal of Wildlife Management, 76:1635-1642.
U.S. Fish and Wildlife Service. 2013. Teal Assessment Team: An assessment of the harvest
potential of North American teal. Unpublished Report.
U.S. Fish and Wildlife Service. 2015. Comprehensive conservation plan and environmental
assessment, San Luis Valley National Wildlife Refuge Complex. Lakewood, CO: U.S.
Department of the Interior, Fish and Wildlife Service, Mountain-Prairie Region.
Webb, S. L., C.V. Olson, M.R. Dzialak, S.M. Harju, J.B. Winstead, D. Lockman. 2012.
Landscape features and weather influence nest survival of a ground-nesting bird of
Page 60
45
conservation concern, the greater sage-grouse, in human-altered environments.
Ecological Processes, 1:4.
Weller, M.W. 1956. A simple field candler for waterfowl eggs. Journal of Wildlife Management
20:111–113.
Wiens, J.A. 1969. An Approach to the Study of Ecological Relationships among Grassland
Birds. Ornithological Monographs, 8:1-93.
Wheeler, R. J. and S. W. Harris. 1970. Duck nesting and production in the Humboldt Bay area of
California. Calif. Fish Game no. 56:180-187.
White, G.C. and K. P. Burnham. 1999. Program MARK: Survival estimation from populations
of marked animals. Bird Study 46 Supplement, 120-138.
Young, J.A., C.E. Turner, L.F. James. 1995. Perennial Pepperweed. Rangelands 17:121-123.
Page 61
46
Chapter 3 - SOCIAL INDICES OF CINNAMON TEAL REPRODUCTIVE SUCCESS IN
COLORADO
SUMMARY
The cinnamon teal (Spatula cyanoptera) is a difficult duck species to study using
traditional techniques due to its secretive habits and limited range during the breeding season. I
evaluated whether previously established social indices, which were developed to assess
reproductive success in waterfowl through consecutive roadside transect surveys of social
groupings (i.e., pairs, lone males, flocked males), were an appropriate indicator of success for
breeding cinnamon teal in Colorado. I conducted social index surveys from 2015 to 2017 on
Monte Vista National Wildlife Refuge while concurrently evaluating nest survival using
traditional nest monitoring methods. I also used dependent double observer methodology to
adjust for observer-specific detection rates for each social grouping observed on surveys in 2017.
Only one of the seven calculated indices (Area 4) was significantly correlated (r = -0.999, p-
value = 0.007) with nest survival, while none of the indices were correlated with duckling:pair
ratio, an additional measure of productivity calculated from the transect surveys. The estimate of
overall detection was high (�̂� = 0.998, SD = 0.004) but differed by observer (�̂�1 = 0.980, SD =
0.027 and �̂�2 = 0.895, SD = 0.085) across social groupings. Estimates of detection were similar
between observers for lone drakes (�̂�1 = 0.912, SD = 0.098, �̂�2 = 0.891, SD = 0.157, t = -0.123,
p-value = 0.667) and between social groupings (Pair detection: �̂�1 = 0.975, SD = 0.044 �̂�2 =
0.899, SD = 0.101), but varied significantly between observers for pairs (t = -2.40, p-value =
0.030). Social indices have the potential to act as a useful tool for difficult-to-study duck species
if they are carried out consistently over long timespans and across geographic areas.
Page 62
47
INTRODUCTION
While effective, typical nest monitoring methods used to determine vital rates of
waterfowl species are extremely time- and effort-intensive. Previous studies have shown that
roadside transect counts of social groupings of waterfowl conducted throughout the breeding
season can indicate breeding effort and timing information regarding when significant events are
occurring (i.e., peak hatch date, peak nest initiation date, peak incubation initiation date, etc.;
Dzubin 1969, Hochbaum et al. 1987, Serie and Cowardin 1990, Arnold et al. 2008). Dzubin
(1969) determined that the ratio of pairs to lone males in a breeding area decreases as more hens
begin nesting, at which point transect surveys start to reveal increasing numbers of lone drakes.
At some point, if hens are successful in their nesting attempts, males will start to flock up into
small groups of 2-5 individuals, whereas nest failures will result in increasing pair numbers as
hens prepare for renesting. When plotted against Julian date throughout the breeding season, the
curves created by the number of lone males, pairs, and flocked males can provide an index of the
number of breeding pairs in an area and their level of success (Dzubin 1969, Hochbaum et al.
1987, Serie and Cowardin 1990, Arnold et al. 2008). The areas beneath different sections of
these lone male and pair curves have been used as indices of nesting effort and success as shown
by correlations with independent nest monitoring studies in the same geographic regions
(Hochbaum et al. 1987, Serie and Cowardin 1990, Arnold et al. 2008). The use of social indices
has been relatively scarce since its inception, however, and even more so in regions outside the
Prairie Potholes. Some indices calculated from curves of pairs and lone drakes have been shown
to be useful for predicting brood production of commonly breeding duck species in Prairie
Canada, while others were more appropriate for predicting nest survival (Hochbaum et al. 1987).
Other social indices calculated using the pair, lone drake, and flocked drake curves of
canvasbacks (Aythya valisineria) in Manitoba were strongly correlated with hen success, which
Page 63
48
accounts for both nesting success and renesting success (Serie and Cowardin 1990). More
recently, the efficacy of these indices was tested on a long-term mallard (Anas platyrhynchos)
dataset, resulting in mixed findings regarding the reliability of social indices as reproductive
predictors (Arnold et al. 2008).
The seven original indices these authors calculated from the social grouping curves were
quite similar, but differed slightly in their execution. Serie and Cowardin (1990) used pair, lone
drake, and flocked drake curves to calculate indices A-C where Social Index A computed the
area between the pair and lone drake curves from peak pair numbers to the intersection of pair
and lone male curves (Figure 1). This area should be large in years of high early nesting success,
but it does not capture renesting effort later in the season. Social Index B calculated the area
from the peak in pair numbers to the peak in flocked males, indicating few actively nesting
females when the area is large as pairs would theoretically decline quickly and remain low in
years of high nesting effort. This index may also capture renesting effort better than index A.
Similar to Area B, Social Index C calculated the area from the initial peak in pair numbers to the
time when pairs reach zero, which should also be small if reproductive success is high.
Hochbaum et al. (1987) used only the pair and lone drake curves to calculate indices 1-4 where
Area 1 measured the entire area under the pair curve (equivalent to Area C), Area 2 was the
entire area under the lone drake curve, Area 3 was the area between the pair and lone drake
curves early in the season when pairs exceeded drakes (equivalent to Area A), and Area 4 was
the area between the lone drake and the pair curves later in the season when drakes exceeded
pairs (Figure 2).
Different indices may be more beneficial for different species and measures of
reproductive success based on the timing of a given species’ breeding season and its social
Page 64
49
behavior (Hochbaum et al. 1987, Serie and Cowardin 1990). Given the correlations between
social indices and the reproductive success of breeding waterfowl in Prairie Canada, my goal
was to apply these same indices to cinnamon teal (Spatula cyanoptera) breeding in Colorado and
begin to evaluate whether this is a viable option for indexing cinnamon teal vital rates. Vital rate
estimates for cinnamon teal are frequently combined with those for the closely related blue-
winged teal (Spatula discors) because the hens and drakes in basic plumage are nearly
impossible to differentiate. A visual survey conducted during the breeding season when teal are
in their easily identifiable breeding plumage, however, has the potential to provide accurate
species-specific estimates of reproductive success. The cinnamon teal is an early to mid-season
nester that forms pairs on the wintering grounds and begins nesting as soon as it finds suitable
habitat on its northward migration (Gammonley 2012). There is typically a steep drop-off of pair
numbers as females initiate nesting. Thus, I predicted that social indices A (analogous to Area 3)
and B would most effectively capture their reproductive success (as measured by nest survival)
while indices C and 4 might be more indicative of productivity (i.e., the number of ducklings
produced; Arnold et al. 2008).
STUDY AREA
Monte Vista National Wildlife Refuge (NWR) is part of the San Luis Valley NWR
Complex, situated 6 miles south of the town of Monte Vista, Colorado. The 2015 San Luis
Valley Comprehensive Conservation Plan fully characterizes this 6,003 hectare study area,
which sits at approximately 2,255 meters of elevation and receives less than 20 centimeters of
precipitation annually. Most of the water in this region comes from snowmelt, a shallow
unconfined aquifer, and a deep artesian aquifer (Huntley 1979). The primary vegetation
throughout the study area consists of bulrush (Schoenoplectus sp.), cattails (Typha latifolia),
Page 65
50
Baltic rush (Juncus arcticus), and sedges (Carex sp.) in the semi-permanent and permanent
wetlands, as well as rabbitbrush (Ericameria nauseosa), greasewood (Sarcobatus vermiculatus),
saltgrass (Distichlis spicata), and alkali sacaton (Sporobolus airoides) in the upland areas.
Rotational cattle and sheep grazing is used as a management tool for invasive plant species, and
some center pivot irrigation produces barley and alfalfa (USFWS 2015). Historically, Monte
Vista NWR had the highest waterfowl nesting density on the continent (Gilbert et al. 1996), but
drawdown of the aquifers and prolonged drought have resulted in increasingly arid conditions.
Under their 2015 Comprehensive Conservation Plan, the San Luis Valley NWR Complex
included cinnamon teal as a focal species for their chosen plan alternative, linking their life
history and population dynamics directly to their habitat-based objectives (USFWS 2015).
METHODS
I identified a 19.6 km route along drivable levee roads representative of all Monte Vista
NWR habitat types and interspersing areas I subsequently searched for cinnamon teal nests. I
conducted surveys at 7 day intervals from early April until early August during the 2015-2017
breeding seasons. I began surveys at sunrise and ended no later than 1030h. I conducted counts
of social groupings for cinnamon teal, blue-winged teal, mallards, and gadwall because they are
the four most commonly nesting species of waterfowl on the refuge (Scott Miller, USFWS-
SLVNWR, personal communication). I grouped birds into one of five categories: lone males,
pairs, flocked males, females with ducklings, and mixed-species flocks. Flocked males were
defined as any five or more males in close association, and aggregate single-species groups were
separated out into pairs and lone males (Serie and Cowardin 1990). I differentiated cinnamon
teal hens with ducklings from blue-winged teal with ducklings based on visual identification of
field marks, association with other individuals of the same species, and a general understanding
Page 66
51
of the relative prevalence of blue-winged teal to cinnamon (i.e., I observed fewer blue-winged
teal over the course of three field seasons). I conducted surveys from a vehicle with one or two
observers using binoculars and a rangefinder to document all social groups within 0.2 km of the
road. I stopped at each wetland location for no more than two minutes to ensure I had time to
count the species present, but was not counting birds that landed in the wetland during that time
(Hammond 1969, Arnold et al. 2008). I remained in the vehicle and did not make the assumption
that observers were detecting all individuals (Serie and Cowardin 1990, Arnold et al. 2008). In
2017, I followed dependent double-observer protocols to adjust for imperfect detection of
available ducks/groupings by one or both observers (Nichols et al. 2000). Under this method, a
primary observer counted all individual birds and reported them to a secondary observer. The
secondary observer recorded the birds reported by the primary observer in addition to any birds
missed by the primary observer. I split the survey route into two “sites,” and each observer took
turns being the primary observer within a survey route. This allowed me to calculate an observer-
specific detection probability for each survey throughout the season.
Index Calculation
I plotted normalized counts of pairs, lone males, and flocked males against survey date
each year to assess changes in these social groupings throughout the breeding season. I
normalized survey totals by dividing both the number of pairs and the number of lone males by
the total number of indicated breeding pairs (the sum of pairs and lone males) each week. I left
censored counts before 4 April to ensure that I calculated all indices from the same date. Indices
are based on either two or three of these curves, and I calculated each index according to the
methodology used by Serie and Cowardin (1990; Figure 1) and Hochbaum et al. (1987; Figure
2). Graph areas used to calculate indices were defined by Serie and Cowardin (1990): "Area A is
Page 67
52
the area between the pair and lone male curves starting from date of peak pairs to when these
curves intersect, Area B is the area under the pair curve from peak pairs to the point of peak
flocked males, and Area C is the area under the pair curve from peak pairs to the point when
percent pairs first becomes zero." Areas defined by Hochbaum et al. (1987) were “Area 1, the
area under the pair curve, Area 2, the area under the drake curve, Area 3, the area between the
pair and drake curves from the date of peak pairs to the date of the crossover of the curves, and
Area 4, the area between the pair and drake curves from the first crossover date, prior to and
following apparent renesting." I calculated areas using the auc() function from the MESS
package in Program R (Ekstrøm 2011). This function allows users to compute the area under a
curve using natural spline interpolation for two vectors.
Independent Measures of Reproductive Success
I calculated Pearson correlation coefficients (r) between each social index value and the
estimates of nest survival and duckling:pair ratio from 2015-2017. I estimated nest survival using
a multievent framework (see Pradel 2005, Kendall et al. 2012, Setash Chapter 2), which allowed
us to estimate laying survival and incubation survival separately and compare the estimates from
both nesting stages to the various social indices. Using the multievent framework to estimate nest
survival, I did not detect an effect of year on laying survival or incubation survival. I therefore
included annual estimates of apparent nest survival in my calculation of correlation coefficients
to see whether social indices might act as predictors of yearly nest survival. I calculated
duckling:pair ratio according to the methods provided in Arnold et al. (2008). This entailed
averaging the number of ducklings seen on all surveys where ducklings were detected and
averaging the number of indicated breeding pairs from the three surveys centered on the
Page 68
53
crossover point of the pair and lone drake curves. I then compared these averages to calculate the
ratio of ducklings to indicated breeding pairs.
Detection Probability
Arnold et al. (2008) encouraged researchers estimating social indices to use methods for
evaluating detection probability to reduce bias of duckling:pair ratios. I therefore tabulated
observations from surveys conducted in 2017 according to Nichols et al. (2000) to calculate
detection using a dependent double observer methodology. For each survey, 𝑥𝑖𝑗 was the number
of birds counted by observer i when observer j was the primary observer. 𝑃𝑖, the detection
probability for each observer i, was calculated using equation (3) in Nichols et al. (2000) and I
assumed it to be the same whether the observer was serving as primary or secondary observer
within a survey. I split observations into social groupings to estimate detection probability of
each grouping separately (e.g., pairs, lone males, flocked males, and groups of ducklings)
because pairs and groups of ducklings likely fail to meet the assumption that observations of
individuals are independent (Nichols et al. 2000). I then decided whether duckling:pair ratios
needed to be adjusted or whether counts were biased enough to change the shape of the curve,
thus changing a given index, based on these estimates of detection (Arnold et al. 2008).
RESULTS
I conducted an average of 19 surveys each year (range = 17-22). The pair curve decreased
and the lone drake curve increased throughout the beginning of the season, intersecting on 22
May 2015, 20 May 2016, and 12 May 2017 (Figure 3.3). These corresponded to the average
dates of nest initiation for my independently sampled cinnamon teal nests, which were 3 June in
2015, 22 May in 2016, and 13 May in 2017. I missed the date of peak pairs in both 2015 and
2017, but in 2016 pairs peaked on 26 April, nearly a month later than the other years. Indicated
Page 69
54
breeding pairs, however (the sum of pairs and lone drakes), peaked in late April each year,
ranging from 13 April to 26 April. The peak numbers of indicated breeding pairs ranged from
148 in 2017 to 224 in 2015.
Yearly apparent nest survival ranged from 0.300 to 0.688 and duckling:pair ratio varied
from 0.390 to 0.713 (Table 3.1). Correlation coefficients varied considerably, ranging from 0.053
for the correlation between Area A and duckling:pair ratio to -0.999 for the correlation between
Area 4 and apparent nest survival (Table 3.2). Area 4 was the only index significantly correlated
with reproductive success, but overall correlation coefficients were quite high (Table 3.2).
Duckling:pair ratio was also highly correlated with apparent nest survival although I primarily
used it as a measurement of reproductive success to which I compared the indices.
Detection probability varied by observer (Table 3.3, Figure 3.4, t = 4.11, p-value < 0.001)
throughout the 2017 surveys, but overall it was relatively high (�̂�1 = 0.980, SD = 0.027 and �̂�2 =
0.895, SD = 0.085; �̂� = 0.998, SE = 0.004; Table 3.3) across social groupings. Detection
probability varied significantly between observers for pairs (t = -2.40, p-value = 0.030) but not
lone drakes (t = -0.123, p-value = 0.667). Although I observed ducklings on four surveys during
2017, I only observed enough groups to estimate detection on two individual surveys. Duckling
detection did not vary significantly by observer (�̂�1 = 1.00, SD = 0, �̂�2 = 0.726, SD = 0.388, t = -
1.00, p-value = 0.500) and each observer missed few enough ducklings that the estimate of
overall duckling detection was 1.00 (�̂� = 1.00, SD = 0). Overall (i.e., across social grouping)
observer-specific detection estimates increased slightly over time and the lower of the two
detection rates converged on the higher estimate as the season progressed (Figure 3.4).
Abundance estimates incorporating detection rarely differed from the naïve counts of individuals
given my high detection probability, and those that did differ (most frequently estimates of pair
Page 70
55
numbers) never changed the original number of individuals by more than 1.95. I considered these
negligible differences and therefore assumed that my counts and estimates of duckling:pair ratios
were unbiased so I did not make further adjustments.
DISCUSSION
Social Indices as a Tool for Estimating Breeding Phenology
Weekly driving surveys were a far more efficient method of detecting important breeding
milestones on my study area than monitoring nests using traditional methods such as rope-
dragging and subsequent observations. I initially conducted these surveys during a pilot study to
determine the timing of reproductive events helpful in planning field season logistics (e.g., peak
nest initiation, approximate timing of renesting, etc.; Dzubin 1969) and continued them
throughout the study to assess their value in terms of monitoring reproductive success. As a
means of estimating breeding phenology, they were an invaluable tool. The date the pair curve
and the lone drake curve intersects has been shown to indicate peak nest initiation date on a
given study area (Dzubin 1969). The intersection of these curves from my study matched the
mean nest initiation dates of nests I monitored separately from 2015-2017, providing evidence
for their reliability as a method for monitoring timing.
The pair and lone drake intersection and the mean nest initiation date from monitored
nests occurred earliest in 2017 (12 May and 13 May, respectively). This coincided with the
lowest number of indicated breeding pairs (IBP) and the highest apparent nest survival and
duckling:pair ratio recorded throughout the study period. With fewer breeding birds and
therefore less intense competition, hens could potentially obtain high quality breeding sites early
in the season, which is often tied to higher reproductive success than nests initiated later in the
season (Daan et al. 1990). The reasons for variations in cinnamon teal abundance and subsequent
Page 71
56
IBP are unclear, but are likely tied to variation in precipitation and local hydrology across years
(Doherty et al. 2015). The San Luis Valley Refuge Complex provides some of the only semi-
permanent wetland habitat in the arid region, so variations in their flooding regimes and water
availability might directly affect cinnamon teal settling patterns (Finger et al. 2016, Bartzen et al.
2017). Social indices provide an effective and efficient way to estimate cinnamon teal phenology
throughout the breeding season and can therefore indicate when to study settling patterns
throughout the San Luis Valley and other regions.
Social Indices as a Tool for Monitoring Reproductive Success
The social indices I calculated showed promise as a tool for efficiently monitoring
cinnamon teal reproductive success within a limited timeframe. Social indices 2 and 4 were the
only areas exhibiting either significant or marginally significant correlations with nest survival,
and also displayed two of the strongest correlations with duckling:pair ratio (Table 2). Higher
values for indices 2 and 4 result from a higher ratio of lone drakes to pairs throughout the survey
period, indicating that breeding effort was consistently high throughout the season since females
were theoretically on nests and therefore unavailable for detection (Arnold et al. 2008). Area 4 is
thought to specifically reflect information about renesting, with smaller areas indicating high
renesting effort (Hochbaum et al. 1987, Arnold et al. 2008). This is consistent with my
observations as I located few known renests throughout the course of the study period. It is
possible, however, that nests found during the later months of the breeding season were renesting
attempts, but without individually identifiable markers on birds I could not verify sequential
nests. Managers might therefore monitor Areas 2 and 4 of the social index curves in lieu of
searching for cinnamon teal nests to evaluate general trends in cinnamon teal nest survival on a
large scale. Given the limited timeframe of this study, however, correlations between social
Page 72
57
indices and measures of reproductive success should be viewed with caution and interpreted
accordingly.
Detection Probability
Using a dependent double observer methodology (Nichols et al. 2000) to estimate
detection throughout my 2017 surveys took minimal effort and enabled us to determine whether
duckling:pair ratios were biased as well as whether the shape of the plotted social grouping
curves should be adjusted (Arnold et al. 2008). Adjusting counts for detection rate would change
the ratio of one social grouping to another, therefore modifying the area calculated under the
curve (i.e., the social index). Despite the fact that the estimates of detection in this study were
high enough to preclude these adjustments, I recommend continuing to use methods for
estimating detection in future social index studies. Although my sample sizes were large enough
to estimate precise detection probabilities according to social grouping (e.g., pair, lone drake,
ducklings), the large number of birds hindered my ability to use an independent double observer
approach, since mapping individuals would be difficult as flocks swam and flushed off the water
(Pagano and Arnold 2009). In addition, estimates of detection probability resulting from the
dependent double observer method are based only on birds that are available for detection. They
are therefore potentially biased high when both observers fail to record birds or when there are
few instances of the secondary observer recording birds missed by the primary observer. This
could be problematic if detection is low enough to warrant adjusting counts, thus changing the
shape of the plots and the social indices. However, if the assumption can be made that the
individuals being observed are representative of the individuals that are missed (and thus the
ratio between social groupings), and this is consistent across the entire season, calculating a
detection probability is unnecessary.
Page 73
58
Detection probabilities differed between observers and between social groupings of
cinnamon teal. However, estimates increased and converged between the experienced and novice
observers as surveys progressed (Figure 4), indicating that either both observers were becoming
more skilled as the season went on, or that environmental covariates were acting on both
observers simultaneously to reduce the number of individuals recorded by one observer but not
the other. Contrary to other studies estimating group-specific detection, my estimates of
detection probability were similar for lone drakes and for pairs of cinnamon teal (Pagano and
Arnold 2009). Larger groups of ducks, especially those including the frequently more colorful
males, are expected to be more conspicuous and therefore easier to detect (Marsh and Sinclair
1989, Laake et al. 2008). When I observed groups including both males and females, I split the
group up into pairs and “leftover” males, potentially accounting for the similar estimates for the
two groups. It would likely be beneficial to keep track of group size as well as social status in
future studies to see whether larger groups are easier to detect. My estimates of detection
probability may also be a function of an observer learning curve, as pairs are more abundant in
the beginning of the season when novice observers are still learning waterfowl identification
while lone drakes are more abundant as the season progresses. If this were the case, detection
probability would be biased low for pairs and high for lone drakes, potentially explaining the
similarity between the two estimates seen in this study.
MANAGEMENT IMPLICATIONS
As a method for monitoring reproductive success in a region, social indices are
particularly useful when they are conducted consistently for several years or concurrently in
different geographic areas since a sufficient sample size is necessary to calculate a correlation
(i.e., > 3 years or study sites; Arnold et al. 2008). If this relatively easy and minimally time-
Page 74
59
intensive method were to be utilized for cinnamon teal on a range-wide basis, it could provide
baseline estimates of production that are currently lacking for this species. Larger scale surveys
might also provide cost-effective estimates of regional population abundance in the absence of
more traditional surveys (e.g., BPOP, aerial surveys, etc.). Careful forethought should be given
to the selection of a transect route, however, given the bias in density estimates associated with
road transects (Austin et al. 2000). Surveying a larger transect width might mitigate this bias, but
consideration of the study species, wetland types being surveyed, and waterfowl behavioral
effects induced by moving vehicles should be considered before initiating a survey route. Social
index surveys are an appropriate tool for managers with limited budgets, questions or concerns
about waterfowl reproductive success on their management area, and/or ongoing waterfowl
monitoring projects that could be augmented with additional concurrent information.
Page 75
60
Table 3.1: Social indices calculated from yearly plots of cinnamon teal numbers surveyed from 2015-2017 on Monte Vista NWR and
the corresponding estimates of reproductive success. Areas 1-4 correspond to indices created by Hochbaum et al. (1987) and Areas A-
C correspond to indices created by Serie and Cowardin (1990).
Year Area 1 Area 2 Area 3 Area 4 Area A Area B Area C Apparent
Nest Survival
Duckling:Pair Ratio
2015 53.1 81.9 26.6 55.4 26.6 52.9 52.9 0.300 0.390
2016 55.4 67.6 13.3 41.6 13.3 35.2 35.3 0.652 0.476
2017 47.4 63.6 23.7 40.0 23.7 46.2 46.3 0.688 0.713
Page 76
61
Table 3.2: Pearson correlation coefficients between social indices calculated from plots of cinnamon teal numbers surveyed from
2015-2017 on Monte Vista NWR and independent measures of reproductive success.
Social Index Apparent Nest Survival Duckling:Pair Ratio
Area A -0.612 0.053
Area B -0.735 -0.123
Area C -0.732 -0.118
Area 1 -0.316 -0.854
Area 2 -0.993• -0.836
Area 3 -0.605 -0.056
Area 4 -0.999** -0.770
D:P Ratio 0.763 NA
•0.05<P<0.08
*P < 0.05
** P < 0.01
Page 77
62
Table 3.3: Observer-specific detection estimates and standard deviations for each social grouping of cinnamon teal averaged across 17
social index surveys conducted on Monte Vista NWR in 2017.
Observer Pair Detection (SD) Lone Male
Detection (SD)
Flocked Male
Detection
Duckling Detection
(SD)
Overall Detection
(SD)
�̂�1 0.975 (0.044) 0.912 (0.098) NAa 1 (0) 0.980 (0.027)
�̂�2 0.899 (0.101) 0.891 (0.157) NAa 0.726 (0.388) 0.895 (0.085)
�̂� 0.997 (0.005) 0.987 (0.027) NAa 1 (0) 0.998 (0.004)
aToo few groups of flocked males were observed to estimate flocked male detection.
Page 78
63
Figure 3.1: Examples of social indices calculated using curves of cinnamon teal pairs (dashed lines), lone drakes (solid lines), and
flocked drakes (dotted lines) counted during the breeding seasons of 2015-2017 on Monte Vista NWR. Shaded areas correspond to
Area A (left panel), Area B (middle panel), and Area C (right panel) as calculated by Serie and Cowardin (1990).
Page 79
64
Figure 3.2: Examples of social indices calculated using curves of cinnamon teal pairs (dashed
lines) and lone drakes (solid lines) counted during the breeding seasons of 2015-2017 on Monte
Vista NWR. Shaded areas correspond to Area 1 (top left panel), Area 2 (top right panel), Area 3
(bottom left panel), and Area 4 (bottom right panel) as calculated by Hochbaum et al. (1987).
Page 80
65
Figure 3.3: Social index plots using counts of cinnamon teal from 2015-2017. Left column
represents indices calculated using Hochbaum et al. (1987) methods and right column represents
indices calculated using Serie and Cowardin (1990) methods. Dotted line = pairs, solid line =
lone drakes, dashed line = flocked males. Each row corresponds to one year of the study period,
from 2015-2017.
Page 81
66
Figure 3.4: Observer-specific detection probabilities for cinnamon teal pairs (top panel), lone
males (middle panel), and all social groupings (bottom panel) over the course of 17 surveys in
2017 on Monte Vista NWR.
Page 82
67
Literature Cited
Arnold, T.W., A.M. Pagano, J.H. Devries, R.B. Emery, D.W. Howerter, B.L. Joynt. 2008.
Social indices of breeding productivity in parkland mallards. The Journal of Wildlife
Management, 72: 224-230.
Austin, J.E., H.T. Sklebar, G.R. Guntenspergen, T.K. Buhl. 2000. Effects of roadside transect
width on waterfowl and wetland estimates. Wetlands, 20:660-670.
Bartzen, B., K.W. Dufour, M.T. Bidwell, M.D. Watmough, R.G. Clark. 2017. Relationships
between abundances of breeding ducks and attributes of Canadian prairie wetlands.
Wildlife Society Bulletin, 41:416-423.
Daan, S., C. Dijkstra, J.M. Tinbergen. 1990. Family planning in the kestrel (Falco tinnunculus):
The ultimate control of covariation of laying date and clutch size. Behaviour, 114:83-116.
Doherty, K.E., J.S. Evans, J. Walker, J.H. Devries, D.W. Howerter. 2015. Building the
foundation for international conservation planning for breeding ducks across the U.S. and
Canadian border. PLoS ONE 10(2): e0116735.
Dzubin, A. 1969. Assessing breeding populations of ducks by ground counts. Pages 178–230 in
Saskatoon Wetlands Seminar. Canadian Wildlife Service Report Series No. 6, Ottawa,
Ontario, Canada.
Ekstrøm, C.T. (2011). The R Primer. Chapman & Hall. Boca Raton, FL.
Finger, T.A., A.D. Afton, M.L. Schummer, S.A. Petrie, S.S. Badzinski, M.A. Johnson, M.L.
Szymanski, K.J. Jacobs, G.H. Olsen, M.A. Mitchell. 2016. Environmental factors
influence lesser scaup migration chronology and population monitoring. The Journal of
Wildlife Management, 80:1437-1449.
Page 83
68
Gammonley, J. H. 2012. Cinnamon Teal (Anas cyanoptera), The Birds of North America Online
(A. Poole, Ed.). Ithaca: Cornell Lab of Ornithology.
Gilbert, D.W., D.R. Anderson, J.K. Ringelman, and M.R. Szymczak. 1996. Response of nesting
ducks to habitat and management on the Monte Vista National Wildlife Refuge,
Colorado. Wildlife Monographs 131:3-44.
Hammond, M. C. 1969. Notes on conducting waterfowl breeding population surveys. Pages
238–258 in Saskatoon Wetlands Seminar. Canadian Wildlife Service Report Series No. 6,
Ottawa, Ontario, Canada.
Hochbaum, G.S., F.D. Caswell, B.C. Turner, D.J. Nieman. 1987. Relationships among social
components of duck breeding populations, production and habitat conditions in prairie
Canada. Transactions North American Wildlife and Natural Resources Conference
52:310-319.
Huntley, D. 1979. Ground-water recharge to the aquifers of northern San Luis Valley, Colorado:
Summary. Geological Society of America Bulletin, 90:707-709.
Kendall, W.L., G.C. White, J.E. Hines, C.A. Langtimm, J. Yoshizaki. 2012. Estimating
parameters of hidden Markov models based on marked individuals: use of robust design
data. Ecology 93:913-920.
Laake, J., M.J. Dawson, J. Hone. 2008. Visibility bias in aerial survey: mark–recapture, line-
transect or both? Wildlife Research, 35:299-309.
Marsh, H., and Sinclair, D.F. 1989. Correcting for visibility bias in strip transect aerial surveys of
aquatic fauna. The Journal of Wildlife Management, 53:1017–1024.
Page 84
69
Nichols, J.D., J.E. Hines, J.R. Sauer, F.W. Fallon, J.E. Fallon, P.J. Heglund. 2000. A double-
observer approach for estimating detection probability and abundance from point counts.
The Auk, 117: 393-408.
Pagano, A.M., T.W. Arnold. 2009. Detection probabilities for ground-based breeding waterfowl
surveys. The Journal of Wildlife Management, 73: 392-398.
Pradel, R. 2005. Multievent: An extension of multistate capture-recapture models to uncertain
states. Biometrics, 61:442-447.
Serie, J. R., and L. M. Cowardin. 1990. Use of social indices to predict reproductive success in
canvasbacks. The Journal of Wildlife Management, 54: 66–72.
U.S. Fish and Wildlife Service. 2015. Comprehensive conservation plan and environmental
assessment, San Luis Valley National Wildlife Refuge Complex. Lakewood, CO: U.S.
Department of the Interior, Fish and Wildlife Service, Mountain-Prairie Region.
Page 85
70
Chapter 4 - NEST ATTENDANCE PATTERNS OF CINNAMON TEAL DURING
INCUBATION
SUMMARY
Patterns of nest attendance in birds influence whether or not an individual’s reproductive
attempt is successful and have the potential to impact the future success of its offspring. Parental
behaviors during incubation vary based on an individual’s body condition, energy requirements,
and environmental factors in its breeding habitat. I assessed nest attendance patterns in the
cinnamon teal (Spatula cyanoptera) breeding in the San Luis Valley of Colorado from 2016-
2017. I evaluated the effect of temporal and environmental covariates on the duration and
frequency of incubation recesses and the constancy with which a hen incubates. I then assessed
the effects of nest attendance patterns on nest survival during the incubation stage. I observed
weak support for a negative relationship between nest initiation date and recess frequency, and
recess duration varied by nest age and time of day, with hens on older nests taking longer
recesses in the afternoon and hens on nests earlier in incubation taking longer recesses in the
morning and evening. Incubation constancy decreased with higher ambient temperatures and
increased for hens with older nests. Nest survival was positively associated with lower recess
frequency and longer recess duration. My results suggest cinnamon teal might be modifying their
behavior during the breeding season to use variable climatic conditions to their advantage while
maintaining the highest probability of a successful reproductive attempt.
INTRODUCTION
The incubation stage of the nesting period is one of the most energetically taxing stages
of a bird’s annual cycle. Incubating birds face tradeoffs pertaining to the cost of reproduction that
form the foundation of life-history theory (Lack 1968, Stearns 1976, Drent and Daan 1980,
Partridge 1989). These costs are a result of the fact that birds, typically females, must remain on
Page 86
71
the nest for extended periods of time, often losing body mass, foraging opportunities, and
exposing themselves to higher risk of predation in the process. Waterfowl, for example, have
been shown to have lower survival during the breeding season than other parts of the year due to
their vulnerability while on the nest (Sargeant et al. 1984, Greenwood et al. 1995, Devries et al.
2003). Birds use varying strategies relating to the frequency and duration with which they leave
the nest during incubation to ensure that they meet their own energetic requirements while
minimizing the time eggs are exposed to predators and adverse conditions. Behavioral strategies
that have the lowest ratio of energetic costs to reproductive benefits allow the incubating bird to
invest more time in the nest and potentially attain higher reproductive output. These behavioral
patterns may therefore provide insight into the underlying mechanisms resulting in differential
survival rates among bird species with similar life-history strategies. As nest survival and female
survival have both been shown to disproportionately influence the population growth rate of
many bird species (Hoekman et al. 2002, McNew et al. 2012, Pollentier et al. 2014),
understanding nesting behavior has practical implications as well as the potential to provide
evidence for the evolutionary significance of specific behaviors and how they relate to a bird’s
fitness and life-history strategy.
Among uniparentally incubating birds, energetic demands are typically the limiting factor
of the duration for which a female will incubate a nest (Afton and Paulus 1992, Bryan and
Bryant 1999, Tulp et al. 2009, Reneerkens et al. 2011). Given finite resources, females face
tradeoffs between obtaining energetic resources and nest attendance that have implications for
their reproductive output, which may even carry over to future years (Sedinger and Alisauskas
2004). Females make these tradeoffs daily, constrained by their own physical condition, capacity
to store nutrients, and the environment in which they are nesting (Cresswell et al. 2004, Burnam
Page 87
72
et al. 2012). Many factors have the potential to influence their behavioral decisions, including
ambient temperature (Boulton et al. 2010, Mougeot et al. 2014), the microhabitat and
microclimate around the nest (Holloran 1999, Dobony 2000, Holloran and Anderson 2003),
timing of nesting within the breeding season (Burnam et al. 2012), age or experience of the bird,
and life history strategy of the species (Flint 2003).
Some large-bodied species with relatively slow life-history strategies (e.g., common
eiders and snow geese) store nearly all the necessary energy reserves to maintain their body
condition throughout nesting, requiring them to leave the nest very infrequently, if at all (Meixell
and Flint 2017). Species with faster life-history strategies, however (e.g., teal, mallards, and
gadwall), must take one or more recesses a day to forage during incubation. For example, the
average frequency of such recesses ranges from 0.33 breaks per day in common eiders (Swennen
et al. 1993) to 4.7 breaks per day in cinnamon teal breeding in California (Hohman 1991). This
variability implies that there is some optimum combination of recess parameters that results in
the highest probability of reproductive success for a given species and environment. Infrequent,
long recesses expose the nest to the elements for longer periods of time, but may reduce
behaviors that draw attention to the nest’s location (i.e., leaving and returning to the nest multiple
times). Conversely, frequent, short recesses may allow the hen to forage more efficiently, leading
to higher overall reproductive output and hen survival, but may lead to increased
conspicuousness of the nest.
The cinnamon teal (Spatula cyanoptera) is an ideal species with which to investigate
variation in incubation behaviors, given its fast life-history strategy relative to other large-bodied
bird species. It breeds throughout the Intermountain West of North America, where the
environment is variable during the breeding season and provides an opportunity to evaluate the
Page 88
73
effects of environmental factors on incubation behavior. As the sole incubating parent, the hen
faces increased costs of leaving the eggs relative to both parents trading places during incubation
(Cresswell et al. 2004). They are small-bodied dabbling ducks that feed primarily during daylight
hours, allowing for relatively easy monitoring via surveillance cameras and providing hens with
the potential to take advantage of fluctuations in ambient temperature when leaving their nests.
Variation in nest attendance strategies among individual cinnamon teal may help
decipher what drives nest survival in this enigmatic species. The objectives of this study were to
identify whether the cinnamon teal exhibits variable strategies of incubation attendance, quantify
the environmental factors influencing these strategies, and examine whether these differences
result in nest survival disparities. I predicted that, like other bird species with fast life-history
strategies (Burnam et al. 2012), cinnamon teal recesses would be bimodal, occurring most often
in the early morning and just before dusk. I expected to see hens using a continuum of nest
attendance strategies based on body condition and access to foraging areas ranging from very
infrequent, long recesses to frequent, short recesses during incubation. I predicted that because
longer, less frequent recesses reduce the attention of predators around the nest site, hens using
this strategy would have a higher probability of nest survival. I predicted that higher ambient
temperature would positively influence recess duration and frequency, thus negatively
influencing incubation constancy for this species as a means of safeguarding against a reduction
in embryo temperature. However, I hypothesized that these factors would likely interact with
environmental characteristics such as distance to water, since the hen’s accessibility to foraging
habitat may influence how long she must spend off the nest searching for food.
Page 89
74
METHODS
Study Area and Field Methods
I conducted this study on Monte Vista National Wildlife Refuge in the San Luis Valley of
Colorado. I located nests via systematic foot searches and rope dragging (Wiens 1969) during the
breeding seasons from 2016-2017. This 6,003 hectare study area sits at approximately 2,255
meters of elevation and receives less than 20 centimeters of precipitation annually (USFWS
2015). The primary vegetation throughout the study area consists of bulrush (Schoenoplectus
sp.), cattails (Typha latifolia), Baltic rush (Juncus arcticus), and sedges (Carex sp.) in the semi-
permanent and permanent wetlands, as well as rabbitbrush (Ericameria nauseosa), greasewood
(Sarcobatus vermiculatus), saltgrass (Distichlis spicata), and alkali sacaton (Sporobolus
airoides) in the upland areas (USFWS 2015). Historically, Monte Vista NWR had the highest
density of waterfowl nests on the continent (Gilbert et al. 1996), but drawdown of the aquifers
and prolonged drought have resulted in increasingly arid conditions. Under their 2015
Comprehensive Conservation Plan, the San Luis Valley NWR Complex included cinnamon teal
as a focal species for their chosen plan alternative, linking their life history and population
dynamics directly to their habitat-based objectives (USFWS 2015).
Camera System
Within 24 hours of finding a nest, I placed either a single trail camera (Covert MP8 Trail
Camera, Mossy Oak Break-Up Country or Stealth Cam G42 No-Glo Trail Game Camera STC-
G42NG) or a video surveillance camera (Advance Security Model SSC-24940-36)
approximately 10-30 cm from the nest. I selected nests based on nest age, placing cameras only
on nests that were within one day of the start of incubation to prevent investigator-caused
abandonment risked when placing cameras on nests still in the laying stage. If possible, I placed
cameras with an overhead view of the nest to obtain the best view through dense vegetation.
Page 90
75
Each camera was fitted with a 32GB SD card that I changed every four to seven days. Because
trail cameras held the batteries and SD card within the camera body, they required us to flush the
hen from the nest to change the batteries and SD card on a regular basis. The video camera came
equipped with a 100-foot power cable attached to a 12-volt battery and a DVR containing the SD
card, which allowed us to check the nest on a portable LCD screen connected to a video output
cable, change the battery, and change the SD card without causing any disturbance to the nest.
Photo and Video Viewing Procedures
I viewed photos with Windows Photo Viewer, recording the date and time when the hen
left and returned to the nest. I also recorded the time and date when any other species entered the
frame, the hen exhibited any nest defense behaviors, a predator depredated the nest, the first time
ducklings became visible (i.e., hatch), ducklings left the nest, and any human disturbed the nest
(e.g., flushing the hen to check the nest, change the camera battery, etc.). I viewed video
recordings (saved in 15-minute intervals) with Windows Media Player on 2x speed, recording
the same information listed above. I tabulated the duration of each recess, the number of recesses
each hen took every day, the age of the nest on each day of observation, and whether the recess
was caused by investigator disturbance. Occasionally I missed hens leaving or returning to the
nest, at which time I would search through previously viewed videos or photos to ensure I
recorded every possible recess. To ensure each observation of a hen leaving the nest was paired
with an observation of the hen returning, I estimated the total number of recesses per day using a
Lincoln-Petersen estimator (see Seber 1982). This allowed us to assess whether I needed to
adjust the frequency of recesses taken by a given hen each day.
Page 91
76
Explanatory Variables
I evaluated the effects of 11 covariates on nest attendance, which I grouped into temporal,
intrinsic, and environmental categories (Table 4.1). Because I expected nest attendance patterns
to vary as food availability and energy requirements fluctuated temporally, I included time of
day, the age of the nest, nest initiation date, the stage of the breeding season, and the stage of
incubation as covariates. I divided the stage of the breeding season into three sections
corresponding to average peak nest initiation date across the study period. Early season
corresponded to dates between 15 April and 15 May, mid-season to dates between 16 May and
10 June, and late season to dates between 11 June and 30 June. I also divided the incubation
period into stages corresponding to the number of days the hen had been incubating. Early
incubation ranged from age 7-15 days (assuming the hen had stopped laying and had entered
incubation), mid incubation ranged from age 16-23 days, and late incubation ranged from age
24-35 days. Clutch size was the only intrinsic covariate I assessed as increasing clutch size may
indicate higher reproductive investment and therefore influence recess frequency, duration, and
overall incubation length (Hepp et al. 2005, Burnam et al. 2012, Carter et al. 2014). The nest
sites selected by cinnamon teal likely incorporate features camouflaging them from predatory
detection, but I also evaluated whether environmental conditions at the nest influenced their
recess patterns during incubation. I incorporated distance to water, ambient temperature, percent
aerial cover, and visual obstruction rating as covariates to assess whether access to foraging areas
and perceived protection from predators had an effect on the frequency and duration with which
hens left the nest. Finally, I included a covariate indicating whether a hen’s recess was caused by
investigator disturbance to assess any variation in recess patterns attributable to human
interference.
Page 92
77
Statistical Analysis
I identified three response variables to encompass the various strategies available to
cinnamon teal hens: frequency of recess, duration of recess, and the total percentage of a 24-hour
day that a hen spent on the nest (i.e., incubation constancy). I used generalized linear mixed
effects models (lme4 in Program R; Bates et al. 2015) to examine nest attendance strategies
during incubation. These models account for a lack of independence between repeated
observations of the same hen throughout the incubation period, preventing pseudoreplication
(Hurlbert 1984) of recess bouts. I therefore included nest as a random effect in all models for
each of the three response variables. I examined variation in recess frequency using Poisson
regression due to the discrete count nature of the frequency data. I log-transformed recess
duration (Zuur et al. 2009), arcsine-transformed incubation constancy (Sokal and Rohlf 2012),
and standardized covariates to account for heteroscedasticity, meet normality assumptions, and
compare effect sizes across multiple scales, respectively. I included various combinations of the
covariates described above based on a priori biologically feasible hypotheses (Table 4.1), using
Akaike’s Information Criterion (Akaike 1973) with the adjustment for small sample size (AICc)
to select which model best explained the variation in each of the three response variables
(Burnham and Anderson 2002). I then conducted an analysis of cinnamon teal nest survival,
including average incubation recess duration, frequency, and constancy as covariates (Table 4.2).
I used a hidden Markov framework to isolate effects of covariates within nesting stages (i.e.,
laying and incubation; see Pradel 2005, Kendall et al. 2012, Setash Chapter 2).
RESULTS
I recorded a total of 292,035 photos and 2,541 hours of video on 47 nests for 2016 and
2017 (Table 4.3). Due to camera connection malfunctions and visibility issues (e.g., vegetation
Page 93
78
obstructed view), only 21 of those 47 nests had usable photos/footage, representing
approximately 2,952 hours of incubation and 155 nest-days. Hens initiated the observed nests
from 23 April to 28 May, encompassing a broad range of environmental conditions throughout
the spring thaw. Clutch sizes also varied among camera-monitored nests, ranging from eight
eggs to 13 eggs. Of the 341 total recesses observed, hens took 77% of those recesses during the
afternoon and 23% in the morning (Figure 4.1). A large proportion of the observed recesses
occurred during late incubation (n = 153 recesses, 44.9%), followed by mid incubation (n = 128
recesses, 37.5%) and early incubation (n = 60, 17.6%).
Recess Frequency
Hens took an average of 2.95 recesses per day (SD = 1.43; Range = 1-6; Figure 4.2).
None of my models outcompeted the null in explaining recess frequency (Table 4.5), but there
was substantial support for the second and third best models, which incorporated nest initiation
date and its quadratic effect, alone (∆𝐴𝐼𝐶𝑐 = 0.67 and 1.58, 𝑤𝑖 = 0.157 and 0.100, respectively;
Table 4.5). Under the model including nest initiation date, hens were predicted to take fewer
daily recesses the later they initiated nests (�̂� = -0.100, SE = 0.076; Table 4.4, Figure 4.3). I did
not detect an effect of habitat covariates on recess frequency (Table 4.5). The Lincoln-Petersen
estimator did not identify a substantial difference in recess frequency for nests at which
observations of recesses were missed. Therefore I did not adjust recess frequency for any hens.
Recess Duration
The average recess duration was 86.5 minutes (SD = 102.3; Range = 2-1352). Human
disturbance caused 19 of the 341 recesses observed, most of which were the initial nest visits to
conduct camera set up. The mean duration of investigator-caused recesses was significantly
longer than that of naturally occurring recesses (t = 8.47, p-value = <0.001), averaging 260.3
Page 94
79
minutes (Range = 5-1352) compared to 76.3 minutes (Range = 2-394), respectively. The top
model for recess duration included an interaction between nest age and time of day (Table 4.6),
with hens on younger nests (i.e., earlier in incubation) taking longer recesses in the early
morning and late evening than their older counterparts (Figure 4.4). Habitat covariates did not
appear to influence recess duration (Table 4.6).
Incubation Constancy
Hens spent an average of 89.2% of the day on the nest (SD = 7.81%). The most
parsimonious model explaining the percentage of time hens spent on the nest included an
additive effect of nest age and ambient temperature (Table 4.7). Hens spent a lower proportion of
the day on the nest in warmer ambient temperatures (�̂� = -0.003, SE = 0.001; Table 4.4, Figure
4.4.5), and hens with older nests that were closer to hatching spent more time on the nest overall
(�̂� = 0.003, SE = 0.001; Table 4.4, Figure 4.4.5).
Nest Survival
Ten of the 47 nests monitored with a camera were unsuccessful in hatching > 1 egg, but
only three of those nests resulted in usable footage. Hens with successful nests spent on average
86.6 minutes (SD = 102.3) off the nest during a given recess and took 2.95 recesses per day (SD
= 1.43), whereas the unsuccessful hens spent an average of 78.6 minutes off (SD = 52.4) and
took 2.86 recesses per day (SD = 1.83). Unsuccessful hens also had slightly higher incubation
constancy (95.4%, SD = 0.994%) compared to the successful hens (89.3%, SD = 7.84%). When I
included recess frequency, duration and incubation constancy as covariates of nest survival
during the incubation stage, they exhibited varying relationships with daily nest survival rate
(Figure 6). Higher rates of nest survival were weakly associated with hens that took infrequent
(�̂� = -0.109, SE = 0.757) and longer recesses (�̂� = 0.027, SE = 0.028) in the directions consistent
Page 95
80
with my predictions. Incubation constancy, however, exhibited an apparent relationship with nest
survival opposite the direction I predicted (�̂� = -0.339, SE = 0.295). Camera-monitored nests
exhibited higher nest survival rates than their counterparts monitored via investigator checks
(�̂�Camera = 0.356, SE = 0.184 and �̂�NoCamera = 0.114, SE = 0.089).
DISCUSSION
General
Nest attendance strategies play a vital role in determining whether or not a nest is
successful and the nesting individual maintains proper body condition to survive the breeding
season. I observed variability within and among individual cinnamon teal nest attendance
strategies during incubation in the San Luis Valley of Colorado. This study is one of only two
studies available evaluating cinnamon teal nest attendance patterns and is the most complete
dataset to date. Hohman (1991) observed two hens throughout incubation in California and found
slightly lower incubation constancy than I did (79.9% + 0.1% and 77.0% + 0.1% compared to
my 89.2 + 7.81%), but mine was consistent with other waterfowl species nesting in the prairies
(Miller 1976, Gloutney 1989, Afton and Paulus 1992). Using video surveillance cameras not
only allowed me to identify more precise attendance patterns than previous studies using
temperature loggers (Hoover et al. 2004), but also captured predation events and interspecific
interactions (Ellis-Felege et al. 2012). In addition, it provided a valuable means of reducing
investigator-caused nest abandonment, which is consistently high among cinnamon teal (Setash
Chapter 2, Josh Vest, unpublished data).
Recess Frequency, Duration, and Constancy
Cinnamon teal took recesses at a frequency consistent with other small-bodied gamebirds
with fast life-history strategies (Hohman 1991, Afton and Paulus 1992, Burnam et al. 2012).
Although the support for the model including nest initiation date was weak, the finding that
Page 96
81
incubating hens take fewer incubation recesses as nest initiation date increases is consistent with
the idea that foraging opportunities are seasonally variable (Krapu and Reinecke 1992). Previous
studies have shown the importance of energy reserves for birds initiating nests early in the
season and the speed at which incubating birds lose weight (Harvey et al. 1989, Hepp et al. 1990,
Manlove and Hepp 2000, Hepp et al. 2005). Given the limited capacity of cinnamon teal to store
nutrients, the earliest nest initiators, having just arrived on the breeding grounds in depleted body
condition, likely have to leave frequently to forage and improve their body condition, especially
during periods of low ambient temperature (Hepp et al. 2005). In addition, teal respond
opportunistically to daily and seasonal patterns of variation in food abundance or availability, so
their behavioral patterns are likely more dynamic than could be captured here.
Contrary to my predictions, microhabitat conditions in the area surrounding the nest did
not appear in the top models explaining variation in recess frequency, duration, or incubation
constancy for cinnamon teal. I included distance to water as an index of how long it would take
incubating birds to access foraging areas and thus the duration of their recess, but it may be that
water sources are so ephemeral, this does not accurately capture the variation in the distance a
nest is from water throughout the nesting period, and therefore does not act as an appropriate
index of recess duration. Neither temperature nor vegetation structure (e.g., visual obstruction
rating, percent aerial cover) exhibited a strong relationship with recess duration. Birds select
their nest sites based on the perceived safety of the microhabitat characteristics surrounding the
nest (Setash Chapter 2, Conway and Martin 2000b), which might preempt the need to adjust
incubation behavior based on the daily variation in perceived safety.
Although neither recess duration nor frequency were correlated with ambient
temperature, the combination of the two, measured as incubation constancy, was negatively
Page 97
82
correlated with temperature. This pattern is commonly exhibited across bird species; incubating
females of many species take advantage of high ambient temperatures to forage when the chance
of embryo hypothermia is lowest (Skutch 1962, Caldwell and Cornwell 1975, Afton 1980,
Ringelman and Longcore 1982, Afton and Paulus 1992, Mallory and Weatherhead 1993,
Eichholz and Sedinger 1999, McClintock et al. 2014). Incubation constancy also exhibited a
positive relationship with nest age, with hens on older nests (i.e., closer to hatch) displaying
higher incubation constancy than those in early, post-laying incubation. This is also a common
phenomenon among birds as they are forced to make tradeoffs between energy requirements and
embryo development early in incubation, and as their investment in the nest increases throughout
incubation (Drent 1970, Loos and Rohwer 2004, Hepp et al. 2005, Wang and Beissinger 2011,
Burnam et al. 2012). Birds that are in higher body condition and therefore have the ability to
incubate with increased constancy early in the incubation stage can reduce their incubation time
(Deeming and Ferguson 1991, Zicus et al. 1995, Hepp et al. 2005, Kim and Monaghan 2006),
increase hatchability (Skutch 1962, Arnold 1993), and increase duckling condition (Kim and
Monaghan 2006). Given the small body size of teal and their income breeding strategy, they
likely do not have the capacity to maintain high incubation constancy during early incubation
and therefore increase constancy as incubation progresses and they replenish their energy
reserves.
The duration of incubation recesses differed according to the age of the nest and the time
of day females took the recess. Hens on nests close to hatching took their longest recesses during
the afternoon, but hens early in the incubation process took longer recesses during the morning
and evening. In arid climates such as the San Luis Valley of Colorado, temperatures can vary by
more than 20 degrees Celsius throughout the day (Mix et al. 2011). Daily variation in
Page 98
83
temperature has been shown to influence nest attendance patterns in other bird species including
wild turkeys (Meleagridis gallopavo; Spohr 2001), black-necked cranes (Grus nigricollis; Zhang
et al. 2017), and Carolina chickadees (Poecile carolinensis; Walters et al. 2016). In addition,
eggs become increasingly susceptible to fluctuations in temperature as they approach hatch,
necessitating increased attentiveness or strategic timing of nest recesses to correspond with high
ambient temperatures (Romanoff and Romanoff 1949, Burnam et al. 2012). Hens with nests
early in incubation likely had more flexibility in when they took long recesses and therefore took
bimodal recesses to avoid diurnal predators (Coates and Delehanty 2008) and take advantage of
food availability, while hens with nests close to hatch needed to ensure they maintained a highly
regulated embryonic temperature and therefore timed their longest recesses to occur during the
warmest part of the day.
Nest Survival
With the caveat that sample size was limited and few nests monitored via camera failed, I
observed variation among individuals in nest attendance strategy that resulted in differential rates
of nest survival. The strategies ranged from short, frequent recesses to long, infrequent recesses,
the latter being associated with the highest nest survival. Given that the microhabitat surrounding
the nests monitored by cameras did not affect nest attendance patterns, hens may have been using
this nest attendance strategy to reduce the probability that they will attract the attention of nest
predators by leaving and returning to the nest as infrequently as possible. Longer, infrequent
recesses reduce trails through the vegetation and movement that might draw attention. The
intraspecific variation in attendance strategy and nest survival might also be correlated with hen
age, experience, and body condition, although I did not measure any of these qualities in this
study. Hens with few energetic reserves or in poor condition are already inherently less likely to
Page 99
84
succeed in producing offspring, and if their condition necessitates that they leave the nest more
frequently to forage, activity near the nest might lead to a further reduction in the probability of
nest survival.
Cameras provided a convenient method to monitor cinnamon teal nesting behavior, but
further research is necessary to evaluate the indirect effects of cameras on nest survival. Cameras
have been shown to impact nest survival to varying degrees in a variety of bird species (reviewed
by Richardson et al. 2009), but more specific investigations into the impacts on waterfowl nests
are warranted given the discrepancies in nest survival detected in this study.
Conclusions
Advances in video technology have improved the ability of researchers to accurately
monitor nest attendance activities in a minimally invasive way (Burnam et al. 2012, Coates and
Delehanty 2008). This has been an especially important development for gamebirds, whose
reproductive choices and behaviors are of particular interest to better understand the processes
that scale up to affect demographic parameters and have implications for the management of
harvested populations (Ellis-Felege and Carroll 2012). Little research has focused specifically on
cinnamon teal, however, and additional research is needed to expand the evidence for adaptive
patterns of nest attendance provided in this study. Increasing sample sizes of camera-monitored
nests should be a high priority in future studies as conservation actions are limited by the
insubstantial inferences resulting from small sample sizes (Ellis-Felege and Carroll 2012).
Additional work is also needed to improve implementation of cameras for birds utilizing dense
nesting cover. Fewer than half of my deployed cameras resulted in usable footage, mostly due to
views obstructed by vegetation. Research ascertaining an appropriate mix of camera size, stand
structure, and camera angle would mitigate sample size issues and minimize camera effects on
Page 100
85
the study species. I encourage future researchers to utilize an estimator for detection (i.e., a
Lincoln-Petersen estimator), especially for nests monitored in dense vegetation, to account for
the possibility of a recess being missed because neither departure nor return of the hen was
detected. This will ensure unbiased counts of recess frequency and provide reliable information
for future studies.
Page 101
86
Table 4.1: Covariate definitions and predicted relationships with three response variables associated with cinnamon teal nest
attendance: recess frequency, duration, and incubation constancy for nests monitored in 2016 and 2017 on Monte Vista NWR.
Covariate
Group
Covariate Description Predicted
Relationship
with Recess
Frequency
Predicted
Relationship
with Recess
Duration
Predicted
Relationship
with Inc.
Constancy
Citations
Temporal Time of day Minute of the
day from 0 to
1440 (60
minutes x 24
hours)
- + 0 Zicus and
Hennes
1995;
MacCluskie
and
Sedinger
1999;
Manlove
and Hepp
2000
Nest age Age of the nest
from 1-35
- - + Loos and
Rohwer
2004; Zicus
and Hennes
1995
Season
Stage
(Early, Mid,
Late)
Early: 15 April-
15 May
Mid: 16 May-
10 June
- - - Burnam et
al. 2012
Page 102
87
Late: 11 June-
30 June
Incubation
stage (Early,
Mid, Late)
Early: Age 7-15
Mid: Age 16-23
Late: Age 24-
35
- - + Burnam et
al. 2012
Nest
Initiation
Date
Date first egg
was laid
0 0 - Loos and
Rohwer
2004
Intrinsic/Hen
Related
Clutch size Largest number
of eggs being
incubated (even
if > 1 gets
depredated, I
still use the
most eggs the
nest had at any
point in time)
- + + Wiebe and
Martin
2000, Loos
and Rohwer
2004, Hepp
et al. 2015,
Nord and
Williams
2015
Environmental Distance to
water
Distance (m)
from the nest to
the closest
water deeper
than 3 cm
0 + 0 Miller 1976
Page 103
88
Ambient
high
temperature
Daily high
temperature
recorded by a
weather station
in Monte Vista,
CO.
+ + - MacCluskie
and
Sedinger
1999,
Conway and
Martin
2000a
% Aerial
Cover
Visual estimate
of the
percentage of
the nest
obstructed by
vegetation from
directly
overhead
+ + - Miller 1976
VOR The height of
vegetation (in
cm) that
visually
obstructed the
nest bowl.
Measurements
were taken
from each
cardinal
direction at a
distance of 4 m
+ + - Winder et
al. 2016
Page 104
89
and then
averaged.
Other Investigator-
Caused?
Was the recess
caused by
human
disturbance?
0 + - Meixell and
Flint 2017
Page 105
90
Table 4.2: Predictions of the effects of nest attendance parameters on cinnamon teal daily nest survival rate during incubation.
Covariate
Description Predicted Relationship with
Nest Survival
Citations
Frequency of recesses How many times in a 24
hour period a hen leaves the
nest
- Powell et al. 2012
Duration of recesses How long (in minutes) a hen
is gone from the nest during
a given recess
+ Powell et al. 2012
Incubation Constancy The percentage of a 24-hour
day a hen spends incubating
the nest
+ Erikstad 1986, Wiebe and
Martin 2000, Wilson et al.
2007
Camera Whether or not a camera was
used to monitor the nest
+ Richardson et al. 2009
Page 106
91
Table 4.3: Summary of cinnamon teal nest monitoring videos and photos from nests found in 2016 and 2017 on Monte Vista NWR.
Year Number of
Photos Recorded
Hours of Video
Recorded
Number of
Nests with
Usable
Photos/Video
Average Recess
Duration in
minutes (SD)
Average Recess
Frequency (SD)
Average
Incubation
Constancy (SD)
2016 208,779 0 9 92.3 (117.8) 2.79 (1.41) 0.902 (0.075)
2017 83,256 2,541 12 75.8 (59.0) 3.23 (1.47) 0.883 (0.082)
Total 292,035 2,541 21 86.5 (102.3) 2.95 (1.43) 0.892 (0.078)
Page 107
92
Table 4.4: β coefficient estimates corresponding to covariates used to evaluate cinnamon teal nest attendance patterns on Monte Vista
NWR from 2016-2017. Covariates were included in generalized linear mixed-effects models and were assessed for three response
variables: recess duration, recess frequency, and incubation constancy.
Covariate Recess
Duration β
Estimate
SE Recess
Frequency β
Estimate
SE Incubation Constancy
β Estimate
SE
Nest Age 0.071 0.051 -0.0003 0.008 0.003 0.001
Ambient Temperature 0.005 0.005 0.015 0.059 -0.003 0.001
Season Stage
Early
Mid
Late
3.73
4.31
4.23
0.344
0.353
0.345
0.784
0.729
0.744
0.474
0.486
0.475
1.20
1.27
1.27
0.058
0.059
0.058
Nest Initiation Date 0.017 0.008 -0.091 0.075 0.001 0.002
Precipitation 0.400 1.65 -0.027 0.053 0.171 0.265
Distance to Water 4.60 x 10⁻⁴ 3.00 x 10⁻³ -0.002 0.004 1.54 x 10⁻⁵ 5.90 x 10⁻⁴
Percent Aerial Cover -0.0002 0.002 0.0004 0.003 3.19 x 10⁻⁴ 4.13 x 10⁻⁴
Visual Obstruction
Rating
0.004 0.005 0.002 0.006 -0.0002 0.0009
Page 108
93
Investigator-Caused
Disturbance
0.695 0.163 NA NA -0.063 0.027
Time of Day 0.052 0.044 NA NA NA NA
Time of Day2 -0.101 0.039 NA NA NA NA
Page 109
94
Table 4.5: AICc table showing top models explaining frequency of recesses during cinnamon teal incubation on Monte Vista NWR
from 2016-2017.
Model Structure Df LogLik AICc Delta AICc Model
Weight
Null 2 -254.868 513.8 0 0.220
Nest Initiation Date 3 -254.166 514.5 0.67 0.157
(Nest Initiation Date)2 4 -253.567 515.4 1.58 0.100
Precipitation 3 -254.715 515.6 1.77 0.091
Distance to Water 3 -254.791 515.7 1.92 0.084
VOR 3 -254.814 515.8 1.97 0.082
Temperature 3 -254.837 515.8 2.01 0.080
Percent Aerial Cover 3 -254.855 515.9 2.05 0.079
Nest Age 3 -254.868 515.9 2.07 0.078
Season Stage 4 -254.856 518.0 4.15 0.028
Page 110
95
Table 4.6: AICc table showing top models explaining duration of recesses during cinnamon teal incubation on Monte Vista NWR
from 2016-2017.
Model Structure Df LogLik AICc Delta
AICc
Model
Weight
(Nest Age) * (Time of Day) 2 7 -371.938 758.2 0.00 0.405
(Time of Day) 2 5 -374.331 758.8 0.063 0.295
Investigator-Caused 4 -375.835 759.8 1.58 0.183
(Nest Age) * (Time of Day) 6 -374.791 761.8 3.62 0.066
(Time of Day) 4 -377.429 763.0 4.77 0.037
(Time of Day) + (Nest Age) 5 -377.428 765.0 6.83 0.013
Nest Initiation Date 4 -382.643 773.4 15.20 0
Null 3 -384.634 775.3 17.13 0
Season Stage 5 -383.123 776.4 18.22 0
Temperature 4 -384.271 776.7 18.46 0
VOR 4 -384.306 776.7 18.53 0
Nest Age 4 -384.593 777.3 19.10 0
Precipitation 4 -384.604 777.3 19.12 0
Distance to Water 4 -384.622 777.4 19.16 0
Percent Aerial Cover 4 -384.629 777.4 19.17 0
Incubation Stage 5 -384.180 778.5 20.33 0
Page 111
96
Table 4.7: AICc table showing top models explaining incubation constancy during cinnamon teal incubation on Monte Vista NWR
from 2016-2017.
Model Structure Df LogLik AICc Delta AICc Model Weight
(Nest Age) + (Temp) 5 267.291 -524.4 0 0.596
(Nest Age) * (Temp) 6 267.436 -522.6 1.78 0.245
Temp 4 263.519 -518.9 5.48 0.038
Null 3 262.232 -518.4 6.01 0.029
Nest Age 4 263.055 -518.0 6.41 0.024
Precipitation 4 262.438 -516.8 7.65 0.013
Nest Initiation Date 4 262.425 -516.7 7.67 0.013
VOR 4 262.258 -516.4 8.01 0.011
Percent Aerial Cover 4 262.235 -516.4 8.05 0.011
Distance to Water 4 262.232 -516.4 8.06 0.011
Season Stage 5 263.035 -515.9 8.51 0.008
Clutch Size 4 185.883 -363.6 160.8 0.000
Page 112
97
Figure 4.1: Histogram showing the distribution of recesses during cinnamon teal incubation on
Monte Vista NWR from 2016-2017. Shaded areas represent hours of darkness in between
average sunset and sunrise from May through August in the San Luis Valley.
Page 113
98
Figure 4.2: Barplot of the most commonly observed recess frequencies across 155 total
cinnamon teal nest-days from 2016-2017 on Monte Vista NWR.
Page 114
99
Figure 4.3: Predicted relationship between recess frequency and nest initiation date for
incubating cinnamon teal hens monitored in 2016 and 2017 on Monte Vista NWR.
Page 115
100
Figure 4.4: Relationship between recess duration and time of day for cinnamon teal hens with
nests early in incubation and late in incubation. All nests were monitored in 2016 and 2017 on
Monte Vista NWR.
Page 116
101
Figure 4.5: Relationship between incubation constancy and ambient temperature with an additive
effect of nest age for incubating cinnamon teal monitored in 2016 and 2017 on Monte Vista
NWR.
Page 117
102
Figure 4.6: Relationship between daily nest survival rate and three response variables characterizing nest attendance of cinnamon teal
hens monitored in 2016 and 2017 on Monte Vista NWR. The solid line represents the predicted response and dashed lines represent
95% confidence intervals. The figure on the left represents the negative relationship between daily survival rate during incubation and
recess frequency (the number of times a hen leaves the nest on a given day). The figure in the middle is the positive relationship
between daily incubation survival and recess duration (in minutes). The figure on the right is the negative relationship between daily
incubation survival and incubation constancy (the proportion of the day spent incubating eggs)
Page 118
103
Literature Cited
Afton, A. D. 1980. Factors affecting incubation rhythms of Northern Shovelers. Condor 82:132-
137.
Afton, A.D., S.L. Paulus. 1992. Incubation and brood care in waterfowl. Pp. 62-108 in Ecology
and management of breeding waterfowl (B.D.J. Batt, et al., eds.). University of
Minnesota Press, Minneapolis.
Akaike, H. 1973. Information theory and an extension of the maximum likelihood principle. Pp.
267–281 in B. N. Petrov and F. Csaki (editors), Proceedings of the Second International
Symposium on Information Theory. Akademiai Kiado, Budapest, Hungary.
Arnold, T.W. 1993. Factors affecting egg viability and incubation time in prairie dabbling ducks.
Canadian Journal of Zoology, 71:1146-1152.
Bates, D., Maechler, M., Bolker, B., Walker, S. 2015. Fitting Linear Mixed-Effects Models
Using lme4. Journal of Statistical Software, 67:1-48.
Boulton, R.L., Y. Richard, D.P. Armstrong. 2010. The effect of male incubation feeding, food
and temperature on the incubation behavior of New Zealand Robins. Ethology, 116:490-
497.
Bryan, S.M., D.M. Bryant. 1999. Heating nest-boxes reveals an energetic constraint on
incubation behavior in great tits, Parus major. Proceedings of the Royal Society B-
Biological Sciences, 266:157-162.
Burnam, J.S., G. Turner, S.N. Ellis-Felege, W.E. Palmer, D.C. Sisson, J.P. Carroll. 2012.
Patterns of incubation behavior in Northern Bobwhites. Pp. 77–88 in C. A. Ribic, F. R.
Thompson III, and P. J. Pietz (editors). Video surveillance of nesting birds. Studies in
Avian Biology (no. 43), University of California Press, Berkeley, CA.
Page 119
104
Burnham, K.P., D.R. Anderson. 2002. Model selection and inference: an information-theoretic
approach. Springer-Verlag, New York, NY.
Caldwell, J.P., G.W. Cornwell. 1975. Incubation behavior and temperatures of the Mallard duck.
Auk 92:706-731.
Carter, A.W., W.A. Hopkins, I.T. Moore, S.E. DuRant. 2014. Influence of incubation recess
patterns on incubation period and hatchling traits in wood ducks Aix sponsa. Journal of
Avian Biology, 45:273-279.
Coates, P.S., D.J. Delehanty. 2008. Effects of environmental factors on incubation patterns of
Greater Sage-Grouse. Condor 110:627–638.
Conway, C.J., T.E. Martin. 2000a. Effects of ambient temperature on avian incubation behavior.
Behavioral Ecology 11:178–188.
Conway, C.J., T.E. Martin. 2000b. Evolution of passerine incubation behavior: Influence of
food, temperature, and nest predation. Evolution 54:670–685.
Cresswell, W., S. Holt, J.M. Reid, D.P. Whitfield, R.J. Mellanby, D. Norton, S. Waldron. 2004.
The energetic costs of egg heating constrain incubation attendance but do not determine
daily energy expenditure in the pectoral sandpiper. Behavioral Ecology, 15:498-507.
Deeming, D.C., M.W.J. Ferguson. 1991. Physiological effects of incubation temperature on
embryonic development in reptiles and birds. – In: Deeming, D. C. and Ferguson, M. W.
J. (eds), Egg incubation: its effects on embryonic development in birds and reptiles.
Cambridge University Press, pp, New York, pp. 147–171.
Devries, J.H., J.J. Citta, M.S. Lindberg, D.W. Howerter, M.G. Anderson. 2003. Breeding-Season
Survival of Mallard Females in the Prairie Pothole Region of Canada. The Journal of
Wildlife Management, 67:551-563.
Page 120
105
Dobony, C.A. 2000. Factors influencing Ruffed Grouse productivity and chick survival in West
Virginia. M.S. Thesis, West Virginia University, Morgantown, WV.
Drent, R.H. 1970. Functional aspects of incubation in the herring gull. Behaviour, 17:1–132
Drent, R.H., S. Daan. 1980. The prudent parent: Energetic adjustments in avian breeding. Ardea,
68:225-252.
Eichholz, M.W., and J.S. Sedinger. 1999. Regulation of incubation behavior in Black Brant.
Canadian Journal of Zoology 77:249-257.
Ellis-Felege, S.N., A. Miller, J.S. Burnam, S.D. Wellendorf, D.C. Sisson, W.E. Palmer, J.P.
Carroll. 2012. Partial depredations on Northern Bobwhite nests. Pp. 161–172 in C. A.
Ribic, F. R. Thompson III, and P. J. Pietz (editors). Video surveillance of nesting birds.
Studies in Avian Biology (no. 43), University of California Press, Berkeley, CA.
Ellis-Felege, S.N., J.P. Carroll. 2012. Gamebirds and nest cameras: present and future. Pp. 35-44
in C.A. Ribic, F. R. Thompson III, and P. J. Pietz (editors). Video surveillance of nesting
birds. Studies in Avian Biology (no. 43), University of California Press, Berkeley, CA.
Erikstad, K.E. 1986. Relationship between weather, body condition and incubation rhythm in
Willow Grouse. Fauna Norvegica Series C, Cinclus 9:7–12.
Flint, P.L. 2003. Incubation behavior of Greater Scaup (Aythya marila) on the Yukon-
Kuskokwim Delta, Alaska. Wildfowl, 54:71-79.
Gilbert, D.W., D.R. Anderson, J.K. Ringelman, and M.R. Szymczak. 1996. Response of nesting
ducks to habitat and management on the Monte Vista National Wildlife Refuge,
Colorado. Wildlife Monographs 131:3-44.
Gloutney, M.L. 1989. Behavior of mallards and blue-winged teal during the incubation period in
prairie Saskatchewan. M.S. Thesis. University of Saskatchewan, Saskatoon.
Page 121
106
Greenwood, R.J., A.B. Sargeant, D.H. Johnson, L.M. Cowardin, T.L. Shaffer. 1995. Factors
associated with duck nest success in the Prairie Pothole Region
of Canada. Wildlife Monographs 128.
Harvey, W.F., IV, G.R. Hepp, R.A. Kennamer. 1989. Age determination of female Wood Ducks
during the breeding season. Wildlife Society Bulletin 17: 254–258.
Hepp, G.R., R.A. Kennamer, W.F. Harvey IV. 1990. Incubation as a reproductive cost in female
Wood Ducks. Auk 107:756–764.
Hepp, G.R., T.H. Folk, C.A. Manlove. 2005. Nest temperature, incubation period, and
investment decisions of incubating wood ducks Aix sponsa. Journal of Avian Biology,
36:523-530.
Hepp, G.R., S.E. DuRant, W.A. Hopkins. 2015. Influence of incubation temperature on offspring
phenotype and fitness in birds. In Nests, Eggs and Incubation: New Ideas about Avian
Incubation (D. C. Deeming and S. J. Reynolds, Editors).
Hoekman, S.T., L.S. Mills, D.W. Howerter, J.H. Devries, J.J. Ball. 2002. Sensitivity analyses of
the life cycle of mid-continent mallards. Journal of Wildlife Management 66:883-900.
Hohman, W.L. 1991. Incubation rhythm components for three Cinnamon Teal nesting in
California. Prairie Naturalist, 23:229-233.
Holloran, M.J. 1999. Sage grouse (Centrocercus urophasianus) seasonal habitat use near Casper,
Wyoming. M.S. Thesis, University of Wyoming, Laramie, WY.
Holloran, M.J., S.H. Anderson. 2003. Direct identification of northern sage-grouse
(Centrocercus urophasianus) nest predators using remote sensing cameras. Canadian
Field-Naturalist, 117:308-310.
Page 122
107
Hoover, A.K., F.C. Rohwer, K.D. Richkus. 2004. Evaluation of nest temperatures to assess
female nest attendance and use of video cameras to monitor incubating waterfowl.
Wildlife Society Bulletin, 32:581-587.
Hurlbert, S.H. 1984. Pseudoreplication and the design of ecological field experiments.
Ecological Monographs 54:187–211.
Kendall, W.L., G.C. White, J.E. Hines, C.A. Langtimm, J. Yoshizaki. 2012. Estimating
parameters of hidden Markov models based on marked individuals: use of robust design
data. Ecology 93:913-920.
Kim, S., P. Monaghan. 2006. Effects of early incubation constancy on embryonic development:
An experimental study in the herring gull Larus argentatus. Journal of Thermal Biology,
31:416-421.
Krapu, G.L, K.J. Reinecke. 1992. Foraging Ecology and Nutrition. Pp. 62-108 in Ecology and
management of breeding waterfowl (B.D.J. Batt, et al., eds.). University of Minnesota
Press, Minneapolis.
Lack, D. 1968. Ecological adaptations for breeding in Birds. Methuen, London.
Loos, E.R., F.C. Rohwer. 2004. Laying-stage nest attendance and onset of incubation in prairie
nesting ducks. The Auk 121: 587-599.
MacCluskie, M.C., J.S. Sedinger. 1999. Incubation behavior of northern shovelers in the
subarctic: A contrast to the prairies. The Condor, 101:417-421.
Mallory, M.L., P.J. Weatherhead. 1993. Incubation rhythms and mass loss of Common
Goldeneyes. Condor 95:849-859.
Manlove, C.A., G.R. Hepp. 2000. Patterns of nest attendance in female wood ducks. The Condor
102:286–291
Page 123
108
McClintock, M.E., G.R. Hepp, R.A. Kennamer. 2014. Plasticity of incubation behaviors helps
Wood Ducks (Aix sponsa) maintain an optimal thermal environment for developing
embryos. The Auk, 131:672-680.
McNew, L.B., A.J. Gregory, S.M. Wisely, B.K. Sandercock. 2012. Demography of greater
prairie-chickens: Regional variation in vital rates, sensitivity values, and population
dynamics. The Journal of Wildlife Management, 76:987-1000.
Meixell, B.W., P.L. Flint. 2017. Effects of industrial and investigator disturbance on Arctic-
nesting geese. The Journal of Wildlife Management, 81:1372-1385.
Miller, K.J. 1976. Activity patterns, vocalizations, and site selection in nesting blue-winged teal.
Wildfowl, 27:33-43.
Mix, K., V.L. Lopes, W. Rast. 2011. Annual and growing season temperature changes in the San
Luis Valley, Colorado. Water Air and Soil Pollution, 220:189-203.
Mougeot, F., A. Benitez-Lopez, F. Casas, J.T. Garcia, J. Vinuela. 2014. A temperature-based
monitoring of nest attendance patterns and disturbance effects during incubation by
ground-nesting sandgrouse. Journal of Arid Environments, 102:89-97.
Nord, A., J.B. Williams. 2015. The energetic costs of incubation. In Nests, Eggs and Incubation:
New Ideas about Avian Incubation (D. C. Deeming and S. J. Reynolds, Editors). Oxford
University Press, New York, NY, USA. pp. 152–170.
Partridge, L. 1989 Lifetime reproductive success and life-history evolution. Lifetime
Reproduction in Birds (ed. I.Newton), pp. 421 440. Academic Press, London.
Pollentier, C.D., S.D. Hull, R.S. Lutz. 2014. Eastern wild turkey demography: Sensitivity of vital
rates between landscapes. The Journal of Wildlife Management, 78:1372-1382.
Page 124
109
Powell, L.A., M.D. Giovanni, S.R. Groepper, M. Reineke, W.H. Schacht. 2012. Attendance
Patterns and Survival of Western Meadowlark Nests. Papers in Natural Resources. Paper
360.
Pradel, R. 2005. Multievent: An extension of multistate capture-recapture models to uncertain
states. Biometrics, 61: 442-447.
Reneerkens, J., K. Grond, H. Schekkerman, I. Tulp, T. Piersma. 2011. Do uniparental
sanderlings Calidris alba increase egg heat input to compensate for low nest
attentiveness? PloS ONE, 6:e16834.
Richardson, T.W., T.Gardali, S.H.Jenkins. 2009. Review and meta-analysis of camera effects on
avian nest success. The Journal of Wildlife Management, 73: 287-293.
Ringelman, J.K., J.R. Longcore. 1982. Nest and brood attentiveness in female Black Ducks.
Condor 84:110-116.
Romanoff, A.L., and A.J. Romanoff. 1949. The avian egg. Wiley Publishing, New York, NY.
Sargeant, A.B., S.H. Allen, R.T. Eberhardt. 1984. Red fox predation on breeding ducks in the
midcontinent North America. Wildlife Monographs, 89.
Seber, G. A. F. 1982. The estimation of animal abundance and related parameters. Macmillan
Publishing, New York, New York, USA
Sedinger, J.S., R.T. Alisauskas. 2014. Cross-seasonal effects and the dynamics of waterfowl
populations. Wildfowl, 4:277-304.
Skutch, A. 1962. The constancy of incubation. The Wilson Bulletin, 74:115-152.
Sokal, R.R., R.J. Rohlf. 2012. Biometry: the principles and practice of statistics in biological
research. W.H. Freeman and Company. New York, New York, USA.
Page 125
110
Spohr, S.M. 2001. Variables influencing nest success of Eastern Wild Turkeys in Connecticut:
nesting habitat, home range-scale fragmentation, and nest attentiveness. M.S. thesis,
University of Maine, Orono, ME.
Stearns, S.C. 1976 Life history tactics: a review of the ideas. Quarterly Review of Biology, 51:3-
47.
Swennen, C., J.C.H. Ursem, P. Duiven. 1993. Determinate laying and egg attendance in common
eiders. Ornis Scandinavica, 24:48-52.
Tulp, I., H. Schekkerman, L.W. Bruinzeel, J. Jukema, G.H. Visser, T., Piersma. 2009. Energetic
demands during incubation and chick rearing in a uniparental and a biparental shorebird
breeding in the high arctic. The Auk, 126:155-164.
U.S. Fish and Wildlife Service. 2015. Comprehensive conservation plan and environmental
assessment, San Luis Valley National Wildlife Refuge Complex. Lakewood, CO: U.S.
Department of the Interior, Fish and Wildlife Service, Mountain-Prairie Region.
Walters, L.A., J.A. Webber, B.A. Jones, C.L. Volker. 2016 Taking a break: The relationship
between ambient temperature and nest attendance patterns of incubating Carolina
chickadees (Poecile carolinensis). The Wilson Journal of Ornithology, 128:719-726.
Wang, J.M., S.R. Beissinger. 2011. Partial incubation in birds: Its occurrence, function, and
quantification. The Auk, 128:454-466.
Wiebe, K.L., K. Martin. 2000. The use of incubation behavior to adjust avian reproductive costs
after egg laying. Behavioral Ecology and Sociobiology, 48: 463-470.
Wiens, J.A. 1969. An Approach to the Study of Ecological Relationships among Grassland
Birds. Ornithological Monographs, 8:1-93.
Page 126
111
Wilson, S., K. Martin, S.J. Hannon. 2007. Nest survival patterns in willow ptarmigan: Influence
of time, nesting stage, and female characteristics. The Condor, 109: 377-388.
Winder, V.L., M.R. Herse, L.M. Hunt, A.J. Gregory, L.B. McNew, B.K. Sandercock. 2016.
Patterns of nest attendance by female Greater Prairie-Chickens (Tympanuchus cupido) in
northcentral Kansas. Journal of Ornithology, 157:733-745.
Zhang, L., B. An, M. Shu, C. Zhao, X. Yang, Y. Suo, Y. Se, X. Dabu. 2017. Incubation
strategies of the black-necked crane (Grus nigricollis) in relation to ambient temperature
and time of day. Avian Research, 8:19.
Zicus, M.C., S.K. Hennes, M.R. Riggs. 1995. Common goldeneye nest attendance patterns. The
Condor, 97: 461-472.
Zuur, A., E.N. Leno, N. Walker, A.A. Saveliev, G.M. Smith. 2009. Mixed effects models and
extensions in Ecology with R. Springer, New York, New York, USA.
Page 127
112
Chapter 5 - HEN AND DUCKLING SURVIVAL OF CINNAMON TEAL IN
COLORADO
SUMMARY
Breeding season vital rates constitute an important component of annual waterfowl
demography and aid in the analysis and management of waterfowl populations. Breeding season
survival rates for hens and ducklings are unavailable for the cinnamon teal (Spatula cyanoptera)
and an assessment of these rates is necessary to properly inform management. I web tagged 290
cinnamon teal ducklings and radiomarked 43 hens from 2015-2017 on Monte Vista NWR in the
San Luis Valley of Colorado. I estimated duckling survival from hatch until the start of
preseason banding (approximately 60 days on average) and hen survival throughout the 93-day
study period corresponding to the time hens arrived on the breeding grounds until the start of
preseason banding. Duckling survival was 0.802 (SE = 0.752) in 2015, 0.210 (SE = 0.045) in
2016, and was inestimable in 2017 (survival averaged across years = 0.506, SE = 0.107). Only
one telemetered hen died over the course of the study period and my estimate of daily breeding
season hen survival was 0.9963 (SE = 0.004) in 2016 when the hen died. These results are the
only available estimates of cinnamon teal hen and duckling survival available, and represent
substantial evidence for the need to improve banding protocols for all waterfowl species.
INTRODUCTION
The breeding season poses unique risks and decisions for female waterfowl in North
America. Hens face tradeoffs between their own survival and the survival of their offspring,
which result in variability in where individuals nest (Miller et al. 2007) and how invested they
are in their nest/offspring (Blums et al. 2002, Liker and Székely 2005). Breeding hens are
frequently more vulnerable to sources of mortality during this time than any other part of the
annual cycle (Sargeant and Raveling 1992). They often face stochastic environmental conditions,
Page 128
113
especially species that breed in the arctic or at higher elevations (Johnson et al. 1992), have
diverse sets of predators (Johnson et al. 1989, Amundson and Arnold 2011), and must contend
with the limitations of their own experience, condition, and genetic adaptations during this time
of increased energetic demand. Offspring of breeding waterfowl also depend on a wide array of
biotic and abiotic factors to survive until fledging. Ducklings are subject to heavy predation,
extreme weather events, and large overland movements in areas where water sources are
ephemeral and inconsistent (Talent et al. 1983, Ringelman 1992, Mehl and Alisauskas 2006,
Amundson and Arnold 2011). The conditions ducklings face in early life have the potential to
not only determine whether or not they are recruited into the breeding population (Pöysä et al.
2017), but also to affect their future breeding performance and predilection to return to their natal
breeding grounds (Gauthier 1990).
Hen and duckling survival have been studied thoroughly for many waterfowl species
historically. Many studies focus on ascertaining how these vital rates are influenced by local
landscape covariates and estimating these parameters reliably at varying scales (Davis et al.
2017, Garrick et al. 2017, Boyer et al. 2018). Both hen survival and duckling survival have been
shown to contribute substantially not only to reproductive success parameters (e.g., recruitment),
but also to overall population growth rate (Hoekman et al. 2002, Coluccy et al. 2008). Cinnamon
teal (Spatula cyanoptera) have been largely excluded from the population ecology literature,
however, due to the lack of banding samples and the difficulty in differentiating them from their
close relatives, the blue-winged teal (Spatula discors; USFWS 2013). Therefore, to date,
estimates of hen and duckling survival are lacking, as is information regarding how these
parameters have changed over time. Hens are particularly secretive and difficult to observe
during the breeding season, making estimates of breeding season hen survival and duckling
Page 129
114
survival even scarcer. The traditional methods of estimating duckling survival require frequent
relocations of entire broods, which is rarely possible with cinnamon teal since they utilize dense
emergent vegetation during the brood-rearing stage (Gammonley 2012).
Cinnamon teal breed in high densities on Monte Vista National Wildlife Refuge, which
holds critical wetland habitat in the arid San Luis Valley of Colorado for breeding waterfowl and
other waterbirds (USFWS 2015). A large portion of the cinnamon teal banded across the
Intermountain West from 2012-2017 were captured in this region (57.0% of known cinnamon
teal; D. Olson, unpublished report), and at one point it was estimated that specific areas on
Monte Vista NWR were home to the highest breeding density of waterfowl in the country
(Gilbert et al. 1996). It is therefore an ideal location to evaluate breeding season survival for both
ducklings and hens to provide baseline data to inform future research as climate conditions
change in the arid west. My objectives during this study were to estimate cinnamon teal hen
survival and duckling survival during the breeding season in a system characterized by relatively
high breeding density. Due to limited sample size, my goal was mainly to provide baseline
estimates rather than to describe the ecological mechanisms underlying the variation in these
estimates.
STUDY AREA
I conducted this study on Monte Vista National Wildlife Refuge in the San Luis Valley of
Colorado. This 6,003 hectare study area sits at approximately 2,255 meters of elevation and
receives less than 20 centimeters of precipitation annually (USFWS 2015). The primary
vegetation throughout the study area consists of bulrush (Schoenoplectus sp.), cattails (Typha
latifolia), Baltic rush (Juncus arcticus), and sedges (Carex sp.) in the semi-permanent and
permanent wetlands, as well as rabbitbrush (Ericameria nauseosa), greasewood (Sarcobatus
Page 130
115
vermiculatus), saltgrass (Distichlis spicata), and alkali sacaton (Sporobolus airoides) in the
upland areas (USFWS 2015). Under their 2015 Comprehensive Conservation Plan, the San Luis
Valley NWR Complex included cinnamon teal as a focal species for their chosen plan
alternative, linking their life history and population dynamics directly to their habitat-based
objectives (USFWS 2015).
METHODS
Nest Searching and Marking Birds
In 2015-2017, I searched for nests using a combination of systematic searches and rope-
dragging (Wiens 1969) on foot through all areas of the refuge containing appropriate teal nesting
habitat. These included flooded or potentially flooded meadows of Baltic rush, bulrush, and
grasses. I also specifically searched areas near cinnamon teal drakes on waiting sites (Bellrose
1980). In 2017, I systematically searched 18 randomly selected 8.5-hectare plots every one to
two weeks in addition to opportunistically searching other wetland habitats. I selected these plots
from the aforementioned appropriate habitat and did so to ensure a representative sample of teal
nests. I trapped cinnamon teal hens before breeding commenced using decoy traps (Sharp and
Lokemoen 1987), baited swim-in traps (Hunt and Dahlka 1953), and on the nest using bownets
during late incubation (i.e., after day 19 of incubation; Salyer 1962). I attached a prong-and-
suture VHF radio transmitter (Model A4350 or A4420 weighing 12g and 8g respectively;
Advanced Telemetry Systems, Isanti, MN, USA) or individually identifiable nasal discs
(Lokemoen and Sharp 1985) and a metal leg band (U.S. Geological Survey (USGS)), to search
for nests via telemetry and to follow hens with broods. All trapping and handling of cinnamon
teal followed protocols approved by the Colorado State University Animal Care and Use
Committee (Protocol #15-5756A). I located nests of radiomarked birds by homing in on their
Page 131
116
approximate location until I could conclude that they had likely entered the incubation stage to
reduce investigator-caused nest abandonment. I relocated telemetered hens on an irregular basis
and for varying amounts of time each year after ducklings had hatched, recording the number of
ducklings seen (if any) and the status of the hen (i.e., dead or alive).
On the day of estimated hatch, I returned to the nest to attach a web tag to the foot of
each hatching duckling (Model 1005-1, National Band and Tag, Newport, Kentucky, USA;
Alliston 1975). I then returned to the nest a final time to determine how many ducklings had
hatched and which web tag numbers were associated with ducklings that did not hatch. From
August until two weeks prior to the start of the waterfowl hunting season, refuge staff conducted
banding operations, capturing ducks using baited swim-in traps and fitting all duck species with
a US Geological Survey aluminum leg band. Cinnamon teal were visually examined for web tags
or torn webbing indicating a web tag had been lost, and all recaptures from previous banding
seasons were recorded. Within-season recaptures were not recorded.
Duckling Survival
I calculated seasonal survival for hatch year birds during the breeding season (ranging
from mid-April to mid-August) and the non-breeding season. This survival probability is not
estimable without supplementary recapture and recovery data in addition to the web tag
recaptures, so I included all recapture and recovery data from cinnamon teal banded at Monte
Vista NWR for 2015-2017. I therefore had data from recaptured and recovered birds that had
been web tagged only, web tagged and banded, and banded only. I used Burnham’s joint model
for live recapture and dead recovery (Burnham 1993) in Program MARK (White and Burnham
1999) to estimate summer survival of ducklings while accounting for subsequent detection and
annual survival. This method allowed for increased precision in survival estimates compared to
Page 132
117
those that would result from an analysis of band recovery or live recapture data alone. This
model estimates four parameter types: 𝑆𝑡, survival at time t; 𝑝𝑡, the probability that an individual
is detected at time t, given it is alive and in the study area at time t; 𝑟𝑡, the probability, given an
individual dies in the interval (t, t + 1) that it is reported; and 𝐹𝑡, the probability that an
individual using the study area at time t is faithful to the study area at time t + 1, given it
survives to t + 1. I included six time periods in these models, one for each breeding season and
non-breeding season across the three year study period. I fixed breeding season recapture
probabilities (𝑝𝐵𝑆) to zero because the only opportunity to recapture birds occurred during
banding, which marked the end of the breeding season. I also fixed breeding season recovery
rates (𝑟𝐵𝑆) to zero because birds were not susceptible to hunting during the breeding season and
were therefore not recovered if they died. I fixed breeding season fidelity (𝐹𝐵𝑆) to one because it
was confounded with survival and I did not have the recovery data needed to estimate it
separately. Given my limited sample of web tagged ducklings, the uncertainty of a bird’s sex
upon hatching, and the small proportion of recaptured individuals, I pooled estimates of duckling
survival and adult survival, respectively, across sex. I created an a priori list of candidate models
to evaluate whether survival was constant or varied across years and seasons (Table 1).
Recapture and recovery data were not yet available for the 2017-2018 hunting season or the 2018
banding season at the time of this analysis (i.e., future information), so all parameters that I
allowed to vary by year were inestimable for 2017. I used the top model to calculate an average
breeding season duckling survival for the study period.
Page 133
118
Hen Survival
I estimated breeding season hen survival using a nest survival model (Dinsmore et al.
2002) since my telemetry data could be considered “ragged” (Rotella et al. 2004). I implemented
this modeling approach in Program MARK (White and Burnham 1999) and compared these
estimates to those derived from the joint live recapture and dead recovery analysis (see previous
section; Burnham 1993) for breeding season survival of after hatch year birds. This model
estimates a daily survival rate (𝐷𝑆𝑅𝑡) that can be rescaled to estimate survival for the entire time
period birds were monitored. I monitored birds over varying time periods each year, and
calculated overall breeding season hen survival by rescaling daily survival rate to the entire
monitoring period (𝑆𝑀𝑜𝑛𝑖𝑡𝑜𝑟𝑖𝑛𝑔 𝑃𝑒𝑟𝑖𝑜𝑑). I calculated the variance for survival on the breeding
season scale using the delta method (Powell 2007).
RESULTS
Duckling Survival
I web tagged 290 cinnamon teal ducklings from 2015-2017. Seasonal variability in
nesting phenology introduced variability in the timing of web tagging, but my web tagging effort
was constant across years (Setash Chapter 2; Figure 1). A total of 234 ducklings hatched after
being web tagged and were available for recapture during banding operations (n = 57 in 2015, n
= 81 in 2016, and n = 96 in 2017; Table 1). I recaptured five web tagged birds in 2015, 18 in
2016, and two in 2017. In addition, I caught four hatch year individuals with torn webbing in
2017 that were thought to have lost a web tag. Refuge staff banded 332 hatch year and 54 after
hatch year cinnamon teal in 2015, 1,082 hatch year and 248 after hatch year in 2016, and 509
hatch year and 96 after hatch year in 2017 (Table 1). Summer survival estimates of ducklings
was 0.802 (SE = 0.752), and 0.210 (SE = 0.045) for 2015 and 2016, respectively (since 2017 was
Page 134
119
inestimable; Table 2). When averaged across years, breeding season duckling survival was 0.506
(SE = 0.107). The estimate of breeding season duckling survival from the model that pooled
survival across years was 0.432 (SE = 0.355), but it performed considerably worse than the
model in which survival varied by year (ΔAICc = 26.0074).
Hen Survival
I radio tagged nine cinnamon teal hens in 2015, 16 in 2016 and 18 in 2017. I censored
five individuals in 2015, three in 2016 and five in 2017 either because the transmitters fell off or
because I could not relocate their transmitter signals and I could not be certain whether this was
due to mortality, transmitter failure, or emigration from the study area. In 2015, I monitored
telemetered birds for a period of 27-45 days (varied by individual), all of which were captured on
their nests towards the end of incubation (Figure 2). In 2016, I monitored birds over a 93-day
period from the day they were marked during decoy trapping through the brood rearing period,
and in 2017 I monitored them over a 61-day period from decoy trapping until peak nest initiation
had ended (Figure 2). I also marked 22 hatch year birds with nasal discs in 2015 and 133 in 2016
during operational banding procedures, and I resighted seven in subsequent years. One of the 16
telemetered birds in 2016 was killed by an avian predator, and I recorded no deaths of
telemetered cinnamon teal in 2015 or 2017. The best-approximating model indicated breeding
season survival varied by year (Table 3). Daily survival rate estimates from the nest survival
model (1.00, SE = 0.00 in 2015, 0.9963, SE = 0.004 in 2016 and 1.00, SE = 0.00 in 2017) were
comparable to those estimated by the Burnham model (1.00, SE = 0.00 for each estimable year)
given only one individual died during the study period. When rescaled to encompass the entire
93-day study period, the estimate of breeding season survival using the daily survival rate from
2016 was 0.708 (SE=0.289)
Page 135
120
DISCUSSION
Hen survival and duckling survival are two of the most influential parameters to
recruitment and population growth rate in waterfowl (Hoekman et al. 2002, Coluccy et al. 2008,
Amundson et al. 2012). Despite limited sample sizes and restricted geographic scope, the
estimates of breeding season survival presented here are the only available estimates for
cinnamon teal of which I am aware. These estimates have the potential to inform future analyses
of cinnamon teal demographics (e.g., sensitivity analyses, population viability analyses), but I
advise the reader that estimates should be used with caution given the variability in survival
estimates across years and the limited timeframe of monitoring. Among waterfowl, hen survival
is typically lowest during the breeding season relative to the remainder of the year (Hammond
and Johnson 1984, Sargeant and Raveling 1992, Arnold et al. 2016). My estimate of breeding
season hen survival (93-day survival in 2016 = 0.708, SE=0.289) was consistent with this
phenomenon and with breeding season survival estimates of comparable species (90-day survival
= 0.76, SE=0.004 for mallards in the Prairie Potholes; Devries et al. 2003, 133-day survival =
0.764, SE = 0.090 for mottled ducks in Texas; Rigby and Haukos 2012). Because ducklings
hatched and were web tagged throughout the breeding season, the estimates of duckling survival
provided here represent an average cinnamon teal survival rate from hatch until the start of
banding, regardless of when that hatch occurred. Because my nest searching effort and the timing
of web tagging was relatively constant across years and was distributed evenly with regards to
the peak hatch date within years (Figure 1), these estimates should be reliable without accounting
for the time-to-banding variability. In addition, they were comparable to estimates of duckling
survival until fledging for other waterfowl species (0.56 for mallards in Minnesota; Ball et al
1975, 0.65 for mallards in North Dakota; Talent et al. 1983).
Page 136
121
Suggestions for Future Research
I recommend careful forethought and creativity when planning future studies focused
specifically on ascertaining breeding cinnamon teal vital rates. This study emphasized the
inherent difficulties in monitoring cinnamon teal breeding populations, and I encourage the use
of advancing technology to monitor these birds in the future. Drones are becoming an
increasingly common method for monitoring waterbird survival, reproductive success, and
movement (McEvoy et al. 2016), and have the potential to access wetlands that are difficult to
traverse and use heat sensitive equipment to conduct duckling counts that would otherwise be
challenging. In addition, search efforts for telemetered birds would be greatly improved by the
use of aerial survey techniques, as the densely vegetated habitat used by cinnamon teal during
the breeding season is especially susceptible to signal bounce and interference, and an overhead
perspective would likely increase detection considerably. Given the low recovery rate for banded
cinnamon teal, managers could greatly increase the value of the data they collect through small
changes in banding protocols. Recording individual recapture information within season in
addition to across seasons (Lindberg et al. 2001) would provide the information necessary to
calculate survival and detection estimates without having future recapture and recovery data
information. I therefore encourage recording daily recapture information for all studies and
banding protocols in the future. In addition, methods that could augment the reporting rate of
auxiliary markers on ducks might aid in advancing our knowledge of more enigmatic species like
the cinnamon teal. For example, several individuals marked with nasal discs (n = 2) or web tags
(n = 1) were reported through social media outlets tailored to birders and waterfowl hunters
throughout the course of this study, and it is likely that they would not have been reported to the
Bird Banding Laboratory otherwise. Nasal disc resightings were relatively infrequent, but have
Page 137
122
the potential to provide migration information, especially if more systematic searches are
conducted.
With limited data, my analysis was somewhat restricted, precluding my ability to estimate
sex-specific survival rates. The use of web tagged ducklings to estimate duckling survival is a
promising avenue for future studies, especially in locations that are conducive to drive trapping
or have easily accessible areas of brood habitat (Stetter 2014). Locations of traps used to
recapture web tagged ducklings and banded birds should be carefully considered, however, to
ensure the banding effort is universal enough to encompass all ducks breeding in the study area.
Obtaining higher recovery rates than I observed here would allow for the use of hidden Markov
models (sensu Nichols et al. 2004, Pradel 2005, Kendall et al. 2012, Johnson et al. 2015) to
estimate sex-specific duckling survival rates originating from ducklings that cannot be assigned
to a sex upon hatching/web tagging. I encourage future researchers to consider this technique as
a possible avenue for estimating duckling survival rates. Building on the information presented
here to evaluate variation in seasonal survival rates over greater temporal and spatial scales and
assessing the impacts of environmental covariates on cinnamon teal survival rates is the next step
in ascertaining a more comprehensive understanding of this enigmatic species.
Page 138
123
Table 5.1: Recapture history for cinnamon teal marked from 2015-2017 at Monte Vista NWR and recaptured or recovered through
August 2017. Web tag recaptures also include recaptured HY birds with torn webbing believed to indicate tag loss.
Year Web tags
released
HY bands
released
AHY
bands
released
Webtags
recaptured
HY bands
recaptured
AHY bands
recaptured
HY
bands
recovered
AHY
bands
recovered
2015 57 332 54 6 1 2a 7 2
2016 81 1,082 248 17 0 13 16 7
2017 96 509 96 6 NA NA NA NA
Total 234 1923 398 29 1 15 23 9
aRecaptures and recoveries denote birds banded in the listed year, not birds recaptured that year. For example, two AHY birds that
were banded in 2015 were recaptured in either 2016 or 2017.
Page 139
124
Table 5.2: Candidate model set for estimating cinnamon teal duckling survival on Monte Vista NWR, 2015-2017, using Burnham’s
(1993) joint live recapture and dead recovery model. Age = parameter is allowed to vary by age of the duck (hatch year or after hatch
year), Seas = parameter is allowed to vary between breeding season and non-breeding season, Year = parameter is allowed to vary by
year of the study (2015-2017).
Model AICc
Delta
AICc
AICc
Weights
Model
Likelihood
Num.
Par Deviance
S(Age*Seas*Year) p(Age*Seas*Year) r(Age*Seas*Year) F(Age*Seas) 653.9022 0 0.40747 1 13 627.759
S(Age*Seas*Year) p(Age*Seas*Year) r(Age*Seas) F(Age*Seas) 653.9444 0.0422 0.39896 0.9791 13 627.8012
S(Age*Seas*Year) p(Age*Seas) r(Age*Seas*Year) F(Age*Seas) 656.0436 2.1414 0.13967 0.3428 12 631.9209
S(Age*Seas*Year) p(Age*Seas*Year) r(Age*Seas*Year) F(Age*Seas*Year) 657.9479 4.0457 0.0539 0.1323 15 627.759
S(Age*Seas) p(Age*Seas*Year) r(Age*Seas) F(Age*Seas) 679.9096 26.0074 0 0 11 657.8058
S(Age*Seas) p(Age*Seas) r(Age*Seas) F(Age*Seas) 684.6023 30.7001 0 0 8 668.5458
Page 140
125
Table 5.3: AICc table indicating performance of models estimating breeding season hen survival for cinnamon teal breeding on Monte
Vista NWR from 2015-2017.
Model AICc Delta AICc AICc
Weights
Model
Likelihood
Num. Par Deviance
S(year) 12.8213 0 0.50866 1 2 8.806
S(.) 12.9635 0.1422 0.47375 0.9314 1 10.9584
S(day+year) 19.55 6.7287 0.01759 0.0346 7 5.4067
Page 141
126
Figure 5.1: The distributions of cinnamon teal web tagging effort from 2015-2017 on Monte
Vista NWR. Density measures the relative number of web tags placed on ducklings on a given
date.
Page 142
127
Figure 5.2: The distributions of telemetry monitoring effort for cinnamon teal hens from 2015-
2017 on Monte Vista NWR. Density measures the number of birds relocated on a given date
relative to other days of searching.
Page 143
128
Literature Cited
Alliston, W. G. 1975. Web-tagging ducklings in pipped eggs. Journal of Wildlife Management
39: 625–628.
Amundson, C. L., T. W. Arnold. 2011. The role of predator removal, density-dependence, and
environmental factors on Mallard duckling survival in North Dakota. Journal of Wildlife
Management, 75:1330–1339.
Amundson, C.L., M.R. Pieron, T.W. Arnold, L.A. Beaudoin. 2012. The effects of predator
removal on mallard production and population change in northeastern North Dakota.
Journal of Wildlife Management, 77:143-152.
Arnold, T.W., A.D. Afton, M.J. Anteau, D.N. Koons, C.A. Nicolai. 2016. Temporal variation in
survival and recovery rates of lesser scaup. The Journal of Wildlife Management, 80:850-
861.
Ball, I.J., D.S. Gilmer, L.M. Cowardin, J.H. Riechmann. 1975. Survival of wood duck and
mallard broods in north-central Minnesota. Journal of Wildlife Management, 39:776-780.
Bellrose, F.C. 1980. Ducks Geese & Swans of North America. Stackpole Books. Harrisburg, PA.
Blums, P., R.G. Clark, A. Mednis. 2002. Patterns of reproductive effort and success in birds:
path analyses of long-term data from European ducks. Journal of Animal Ecology, 71:
280-295.
Boyer, R.A., J.M. Coluccy, R.A. Montgomery, K.M. Redilla, S.R. Winterstein. 2018. The effect
of habitat on the breeding season survival of mallards in the Great Lakes Region.
Canadian Journal of Zoology, doi.org/10.1139/cjz-2017-0224.
Burnham, K.P. 1993. A theory for combined analysis of ring recovery and recapture data. In
Marked Individuals in Bird Population Studies (Edited by J.-D. Lebreton and P. North),
199-213. Birkhauser Verlag, Basel.
Page 144
129
Coluccy, J.M., T. Yerkes, R. Simpson, J. W. Simpson, L. Armstrong, J. Davis. 2008. Population
dynamics of breeding Mallards in the Great Lakes States. Journal of Wildlife
Management 72:1181–1187.
Davis, J.B., F.J. Vilella, J.D. Lancaster, M. López-Flores, R.M. Kaminski, J.A. Cruz-Burgos.
2017. White-cheeked pintail duckling and brood survival across wetland types at
Humacao Nature Reserve, Puerto Rico. The Condor, 119: 308-320.
Devries, J.H., J.J. Citta, M.S. Lindberg, D.W. Howerter, M.G. Anderson. 2003. Breeding-season
survival of mallard females in the Prairie Pothole Region of Canada. Journal of Wildlife
Management, 67:551-563.
Dinsmore, S.J., G.C. White, F.L Knopf. 2002. Advanced techniques for modeling avian nest
survival. Ecology, 83:3476-3488.
Gammonley, J.H. 2012. Cinnamon Teal (Anas cyanoptera), The Birds of North America Online
(A. Poole, Ed.). Ithaca: Cornell Lab of Ornithology.
Garrick, E.J., C.L. Amundson, P.J. Seddon. 2017. Duckling survival of mallards in Southland,
New Zealand. The Journal of Wildlife Management, 81: 858-867.
Gauthier, G. 1990. Philopatry, nest-site fidelity, and reproductive performance in buffleheads.
The Auk, 107:126:132.
Gilbert, D.W., D.R. Anderson, J.K. Ringelman, and M.R. Szymczak. 1996. Response of nesting
ducks to habitat and management on the Monte Vista National Wildlife Refuge,
Colorado. Wildlife Monographs 131:3-44.
Hammond, M.C., D.H. Johnson. 1984. Effects of weather on breeding ducks in North Dakota.
U.S. Fish and Wildlife Technical Report.
Page 145
130
Hoekman, S.T., L.S. Mills, D.W. Howerter, J.H. Devries, J.J. Ball. 2002. Sensitivity analyses of
the life cycle of mid-contient mallards. Journal of Wildlife Management 66:883-900.
Hunt, G.S., K.J. Dahlka. 1953. Live trapping of diving ducks. Journal of Wildlife Management,
17:92-97.
Johnson, D. H., A. B. Sargeant, and R. J. Greenwood. 1989. Importance of individual species of
predators on nesting success in the Canadian Prairie Pothole Region. Canadian Journal of
Zoology 67:291–297.
Johnson, D.H., J.D. Nichols, M.D. Schwartz. 1992. Population dynamics of breeding waterfowl.
In Ecology and Management of Breeding Waterfowl (B. D. J. Batt, A. D. Afton, M. G.
Anderson, C. D. Ankney, D. H. Johnson, J. A. Kadlec, and G. L. Krapu, Editors).
University of Minnesota Press, Minneapolis,MN, USA.
Johnson, D.S., J.L. Laake, S.R. Melin, R.L. DeLong. 2016. Multivariate state hidden Markov
models for mark-recapture data. Statistical Science, 31:233-244.
Kendall, W.L., G.C. White, J.E. Hines, C.A. Langtimm, J. Yoshizaki. 2012. Estimating
parameters of hidden Markov models based on marked individuals: use of robust design
data. Ecology 93:913-920.
Liker, A., T. Székely. 2005. Mortality costs of sexual selection and parental care in natural
populations of birds. Evolution, 59:890-897.
Lindberg, M.S., W.L. Kendall, J.E. Hines, M.G. Anderson. 2001. Combining band recovery data
and Pollock's robust design to model temporary and permanent emigration. Biometrics,
57:273-281.
Lokemoen, J.T., D.E. Sharp. 1985. Assessement of nasal marker materials and designs used on
dabbling ducks. Wildlife Society Bulletin, 13:53-56.
Page 146
131
McEvoy, J.F., G.P. Hall, P.G. McDonald. 2016. Evaluation of unmanned aerial vehicle shape,
flight path and camera type for waterfowl surveys: disturbance effects and species
recognition. PeerJ 4:e1831.
Mehl, K.R., R.T. Alisauskas. 2007. King Eider (Somateria spectabilis) brood ecology: Correlates
of duckling survival. The Auk, 124: 606-618.
Miller, D.A., J.B. Grand, T.F. Fondell, R.M. Anthony. 2007. Optimizing nest survival and
female survival: consequences of nest site selection for canada geese. The Condor,
109:769-780.
Nichols, J.D., W.L. Kendall, J.A. Spendelow, and J.E. Hines. 2004. Estimation of sex-specific
survival from capture-recapture data when sex is not always known. Ecology 85:3192-
3201.
Powell, L.A. 2007. Approximating variance of demographic parameters using the delta method:
A reference for avian biologists. The Condor, 109:949-954.
Pöysä, H., R.G. Clark, A. Paasivaara, P. Runko. 2017. Do environmental conditions experienced
in early life affect recruitment age and performance at first breeding in common
goldeneye females? Journal of Avian Biology, 48:1365-1371.
Pradel, R. 2005. Multievent: An extension of multistate capture-recapture models to uncertain
states. Biometrics, 61: 442-447.
Rigby, E.A., D.A. Haukos. 2012. Breeding season survival and breeding incidence of female
mottled ducks on the upper Texas Gulf Coast. Waterbirds, 35:260-269.
Ringelman J.K. 1992. Identifying the factors that limit duck production. United States Fish and
Wildlife Leaflet 13.2:1–8.
Page 147
132
Rotella, J.J., S.J. Dinsmore, T.L. Shaffer. 2004. Modeling nest-survival data: a comparison of
recent developed methods that can be implemented in MARK and SAS. Animal
Biodiversity and Conservation 27:187-205.
Salyer, J.W. 1962. A bownet for ducks. Journal of Wildlife Management, 26:219.
Sargeant, A.B., D.G. Raveling. 1992. Mortality during the breeding season. Pp. 396-422 in
Ecology and management of breeding waterfowl (B.D.J. Batt, et al., eds.). University of
Minnesota Press, Minneapolis.
Sharp, D.E., J.T. Lokemoen. 1987. A decoy trap for breeding-season mallards in North Dakota.
Journal of Wildlife Management, 51:711-715.
Stetter, A.P. 2014. Nest-site selection, duckling survival, and blood parasite prevalence of lesser
scaup nesting at Red Rock Lakes National Wildlife Refuge. Master’s Thesis, Kansas
State University. Manhattan, Kansas.
U.S. Fish and Wildlife Service. 2013. Teal Assessment Team: An assessment of the harvest
potential of North American teal. Unpublished Report.
U.S. Fish and Wildlife Service. 2015. Comprehensive conservation plan and environmental
assessment, San Luis Valley National Wildlife Refuge Complex. Lakewood, CO: U.S.
Department of the Interior, Fish and Wildlife Service, Mountain-Prairie Region.
Talent, L.G., R.L. Jarvis, G.L. Krapu. 1983. Survival of mallard broods in south-Central North
Dakota. The Condor 85:74–78.
White, G.C. and K. P. Burnham. 1999. Program MARK: Survival estimation from populations
of marked animals. Bird Study 46 Supplement, 120-138.
Wiens, J.A. 1969. An Approach to the Study of Ecological Relationships among Grassland
Birds. Ornithological Monographs, 8: 1-93.
Page 148
133
Chapter 6 - CONCLUSIONS
Waterfowl are unique among wildlife in the ways they are managed and the population
level questions that remain unanswered for many species. The cinnamon teal is one of those
species and remains the least studied and least abundant duck species in North America. My
objective in this study was to partially bridge the information gap between cinnamon teal and
other closely related species, beginning with an understanding of breeding demographics.
Although observational in nature, this study provided insight into mechanisms driving nest site
selection and nest survival, a potential method for surveying reproductive success, evidence for
nest attendance patterns similar to other species of waterfowl during the incubation stage of
nesting, and hen and duckling survival rates during the breeding season. While there is work to
be done to improve methods used to study cinnamon teal, I provided suggestions throughout this
thesis that will offer future researchers potential considerations regarding study design, analysis,
and field logistics. In an increasingly arid west and changing climatic conditions worldwide, this
research has the potential to not only enhance the understanding of the basic population ecology
of this species, but also to provide baseline estimates of vital rates to which future researchers
can refer as species and habitats continue to adapt and change.
Cinnamon teal nest throughout the Intermountain West in semi-permanent and seasonal
wetlands (Gammonley 2012). My research emphasizes the importance of wetland graminoid
communities to cinnamon teal habitat use and reproductive success throughout this region, as
well as the importance of considering the effect of invasive plant species on this success.
Although my estimate of overall nest survival (0.194, SE = 0.076) is comparable to other fast-
lived waterfowl species (Johnson 1979, Lokemoen et al. 1990, Skone et al. 2016), it is important
to continue monitoring this vital rate across scales and regions to obtain a better understanding of
Page 149
134
the cinnamon teal and to ensure its longevity. More research is also necessary to ascertain the
importance of varying hydrological regimes and ephemeral water sources to its reproductive
success. My research did not find a relationship between the distance of a nest to water and nest
survival, but the variation in this distance throughout the duration of a single bird’s nesting
period necessitates more research to truly capture that variation and determine its effect, if any.
In the future, reproductive monitoring might be possible on a larger scale using social
index surveys (Hochbaum et al. 1987, Serie and Cowardin 1990, Arnold et al. 2008, Setash
Chapter 3). In this thesis, I showed strong correlations between several social indices and other
metrics of reproductive success that, if verified over a longer time scale, show promise for
monitoring cinnamon teal and other waterfowl in a time-efficient manner. This method is also an
excellent tool for gaining an understanding of the reproductive phenology of a system, as my
research and others' show that using social indices allows researchers and managers to pinpoint
pivotal events throughout the breeding season (i.e., peak nest initiation, timing of renesting, etc.).
As budgets among the wildlife management community become more restricted, social index
surveys offer an alternative method for monitoring parameters of waterfowl populations
necessary to assess the population. Although not frequently monitored, patterns in nest
attendance offer a unique perspective on waterfowl behavior in relation to the more frequently
evaluated population parameters such as nest survival. In this thesis, I showed that cinnamon teal
nest attendance patterns vary by nest age, time of day, and ambient temperature, and that they are
making use of the variation in their daily thermal environment to ensure the success of their nests
(Setash Chapter 3). These results not only provide inference into the behavior of this secretive
species, but potentially offer explanations for variations in seasonal survival of breeding hens,
nests, and ducklings.
Page 150
135
Estimates of waterfowl survival during specific stages of the annual cycle are often
important components of their management, especially given their status as game birds
(Hoekman et al. 2002). Breeding season survival of hens and ducklings drives the following
year’s breeding population levels and can indicate variation in habitat quality or management
actions (Ringelman 1992, Stetter 2014). My estimates of cinnamon teal hen and duckling
survival during the breeding season contribute directly to management of the species as they are
the only estimates currently available that do not combine cinnamon and blue-winged teal
survival. They therefore act as a baseline on which future researchers can build and generate
future research questions regarding the mechanisms driving breeding season survival. Most
importantly, this research provides guidance to future cinnamon teal researchers regarding
banding protocols and web tagging efforts that can be implemented across species to provide the
most robust information available. Cinnamon teal research is often considered behind that of
other species (USFWS 2013), but the work presented here will provide a foundation upon which
others can construct the complete story of this species’ population dynamics and trajectory midst
a changing world.
Page 151
136
Literature Cited
Arnold, T.W., A.M. Pagano, J.H. Devries, R.B. Emery, D.W. Howerter, B.L. Joynt. 2008. Social
indices of breeding productivity in parkland mallards. The Journal of Wildlife
Management, 72: 224-230.
Gammonley, J. H. 2012. Cinnamon Teal (Anas cyanoptera), The Birds of North America Online
(A. Poole, Ed.). Ithaca: Cornell Lab of Ornithology.
Hochbaum, G.S., F.D. Caswell, B.C. Turner, D.J. Nieman. 1987. Relationships among social
components of duck breeding populations, production and habitat conditions in prairie
Canada. Transactions North American Wildlife and Natural Resources Conference
52:310-319.
Hoekman, S.T., L.S. Mills, D.W. Howerter, J.H. Devries, and J.J. Ball. 2002. Sensitivity
analyses of the life cycle of mid-contient mallards. Journal of Wildlife Management
66:883-900.
Johnson, D.H. 1979. Estimating nest success: The Mayfield method and an alternative. The Auk,
96:651-661.
Lokemoen, J.T., H.F. Duebbert, D.E. Sharp. 1990. Homing and reproductive habits of mallards,
gadwalls, and blue-winged teal. Wildlife Monographs, 106:3-28.
Ringelman J.K. 1992. Identifying the factors that limit duck production. United States Fish and
Wildlife Leaflet 13.2:1–8.
Serie, J. R., and L. M. Cowardin. 1990. Use of social indices to predict reproductive success in
canvasbacks. The Journal of Wildlife Management, 54: 66–72.
Skone, B.R., J.J. Rotella, J. Walker. 2016. Waterfowl production from winter wheat fields in
North and South Dakota. The Journal of Wildlife Management, 80:127-137.
Page 152
137
Stetter, A.P. 2014. Nest-site selection, duckling survival, and blood parasite prevalence of lesser
scaup nesting at Red Rock Lakes National Wildlife Refuge. Master’s Thesis, Kansas
State University. Manhattan, Kansas.
U.S. Fish and Wildlife Service. 2013. Teal Assessment Team: An assessment of the harvest
potential of North American teal. Unpublished Report.
Page 153
138
Appendix A - HIDDEN MARKOV MODEL STRUCTURES CONSIDERED TO DESCRIBE THE VARIABILITY IN
CINNAMON TEAL NEST SURVIVAL AND ASSOCIATED AICc VALUES.
Model
Number
Model Structure K Model
Likelihood
AICc Delta
AICc
Model
Weight
Deviance
1
ψ12(Age) ψ13(NID2) ψ24(NID2+Pforbs) ψ25(Age)
δLay(Age) δInc(Age)
13 1.00 351.34 0.00 0.25 324.79
2
ψ12(Age) ψ13(NID2+Pforbs) ψ24(NID2+Pforbs) ψ25(Age)
δLay(Age) δInc(Age)
14 0.55 352.52 1.19 0.14 323.89
3
ψ12(Age) ψ13(Age+NID2) ψ24(NID2+Pforbs) ψ25(Age)
δLay(Age) δInc(Age)
14 0.55 352.55 1.21 0.14 323.91
4
ψ12(Age) ψ13(Age+NID2) ψ24(Age+ NID2+Pforbs)
ψ25(Age) δLay(Age) δInc(Age)
15 0.36 353.40 2.06 0.09 322.67
5
ψ12(Age) ψ13(NID2) ψ24(NID2) ψ25(Age) δLay(Age)
δInc(Age)
12 0.17 354.88 3.54 0.04 330.40
6
ψ12(Age) ψ13(NID2) ψ24(NID2+Pgrass) ψ25(Age)
δLay(Age) δInc(Age)
13 0.16 354.95 3.62 0.04 328.40
7
ψ12(Age) ψ13(NID2+Clutch) ψ24(NID2+Clutch)
ψ25(Age) δLay(Age) δInc(Age)
14 0.15 355.20 3.86 0.04 326.56
Page 154
139
8
ψ12(Age) ψ13(NID2+robel) ψ24(NID2+robel) ψ25(Age)
δLay(Age) δInc(Age)
14 0.11 355.78 4.45 0.03 327.15
9
ψ12(Age) ψ13(NID2+Pshrub) ψ24(NID2+Pshrub)
ψ25(Age) δLay(Age) δInc(Age)
14 0.10 355.90 4.56 0.03 327.26
10
ψ12(Age) ψ13(NID2) ψ24(NID2+Age) ψ25(Age) δLay(Age)
δInc(Age)
13 0.09 356.25 4.91 0.02 329.70
11
ψ12(Age) ψ13(Pforbs) ψ24(Age+Pforbs) ψ25(Age)
δLay(Age) δInc(Age)
11 0.07 356.61 5.27 0.02 334.21
12
ψ12(Age) ψ13(NID2+Pgrass) ψ24(NID2+Pgrass) ψ25(Age)
δLay(Age) δInc(Age)
14 0.07 356.74 5.40 0.02 328.10
13
ψ12(Age) ψ13(NID2) ψ24(NID2+Dshrub) ψ25(Age)
δLay(Age) δInc(Age)
13 0.07 356.76 5.43 0.02 330.21
14
ψ12(Age) ψ13(NID2) ψ24(NID2+Clutch) ψ25(Age)
δLay(Age) δInc(Age)
13 0.07 356.81 5.47 0.02 330.25
15
ψ12(Age) ψ13(NID2) ψ24(NID2+robel) ψ25(Age)
δLay(Age) δInc(Age)
13 0.06 356.92 5.58 0.02 330.37
16
ψ12(Age) ψ13(NID) ψ24(NID) ψ25(Age) δLay(Age)
δInc(Age)
10 0.05 357.22 5.88 0.01 336.89
Page 155
140
17
ψ12(Age) ψ13(Age+NID2) ψ24(Age+NID2) ψ25(Age)
δLay(Age) δInc(Age)
14 0.05 357.24 5.90 0.01 328.60
18
ψ12(Age) ψ13(NID2+PLive) ψ24(NID2+PLive) ψ25(Age)
δLay(Age) δInc(Age)
15 0.05 357.28 5.95 0.01 326.55
19
ψ12(Age2) ψ13(Age2+NID2) ψ24(Age+NID2) ψ25(Age)
δLay(Age) δInc(Age)
14 0.04 357.56 6.22 0.01 328.92
20
ψ12(Age2) ψ13(Age2+NID) ψ24(Age+NID) ψ25(Age)
δLay(Age) δInc(Age)
12 0.03 358.06 6.72 0.01 333.59
21
ψ12(Age) ψ13(NID) ψ24(Age+NID) ψ25(Age) δLay(Age)
δInc(Age)
11 0.03 358.31 6.97 0.01 335.91
22
ψ12(Age) ψ13(NID2+Weight) ψ24(NID2+Weight)
ψ25(Age) δLay(Age) δInc(Age)
14 0.03 358.56 7.22 0.01 329.92
23
ψ12(Age) ψ13(NID2+PWater) ψ24(Age+NID2+PWater)
ψ25(Age) δLay(Age) δInc(Age)
15 0.01 359.86 8.53 0.00 329.14
24
ψ12(Age) ψ13(NID2+Year) ψ24(Age+NID2+Year)
ψ25(Age) δLay(Age) δInc(Age)
17 0.01 360.13 8.79 0.00 325.20
25
ψ12(Age) ψ13(Age+NID) ψ24(Age+NID) ψ25(Age)
δLay(Age) δInc(Age)
12 0.01 360.37 9.03 0.00 335.90
Page 156
141
26
ψ12(Age) ψ13(Age2) ψ24(Age) ψ25(Age) δLay(Age)
δInc(Age)
8 0.01 361.05 9.71 0.00 344.83
27
ψ12(Age) ψ13(NID2+DShrub) ψ24(Age+NID2+DShrub)
ψ25(Age) δLay(Age) δInc(Age)
15 0.01 361.40 10.06 0.00 330.67
28
ψ12(Age) ψ13(Year) ψ24(Year) ψ25(Age) δLay(Age)
δInc(Age)
13 0.00 362.04 10.71 0.00 335.49
29
ψ12(Age) ψ13(Age2) ψ24(Age2) ψ25(Age) δLay(Age)
δInc(Age)
10 0.00 362.06 10.73 0.00 341.73
30 ψ12(Age) ψ13(.) ψ24(Age) ψ25(Age) δLay(Age) δInc(Age) 9 0.00 362.23 10.89 0.00 343.95
31
ψ12(Age) ψ13(NID2+Year) ψ24(NID2+Pforbs+Year)
ψ25(Age) δLay(Age) δInc(Age)
19 0.00 362.67 11.33 0.00 323.51
32
ψ12(Age) ψ13(PGrass) ψ24(Age+PGrass) ψ25(Age)
δLay(Age) δInc(Age)
11 0.00 362.98 11.64 0.00 340.58
33 ψ12(Age) ψ13(.) ψ24(Age2) ψ25(Age) δLay(Age) δInc(Age) 9 0.00 363.10 11.76 0.00 344.83
34
ψ12(Age) ψ13(Robel) ψ24(Age+Robel) ψ25(Age)
δLay(Age) δInc(Age)
11 0.00 363.16 11.82 0.00 340.76
35
ψ12(Age) ψ13(Age) ψ24(Age) ψ25(Age) δLay(Age)
δInc(Age)
10 0.00 363.34 12.01 0.00 343.01
Page 157
142
36
ψ12(Age2) ψ13(Age2) ψ24(Age2) ψ25(Age2) δLay(Age2)
δInc(Age2)
10 0.00 363.81 12.47 0.00 343.48
37
ψ12(Age) ψ13(Year+NID2) ψ24(Year+NID2) ψ25(Age)
δLay(Age) δInc(Age)
18 0.00 364.00 12.66 0.00 326.96
38
ψ12(Age) ψ13(DWater) ψ24(Age+DWater) ψ25(Age)
δLay(Age) δInc(Age)
11 0.00 365.29 13.95 0.00 342.89
39
ψ12(Age) ψ13(NID2+PBG) ψ24(Age+NID2+PBG)
ψ25(Age) δLay(Age) δInc(Age)
17 0.00 367.38 16.04 0.00 332.45
40 ψ12(Age) ψ13(.) ψ24(.) ψ25(Age2) δLay(Age2) δInc(Age2) 10 0.00 367.48 16.14 0.00 347.14
41 ψ12(Age) ψ13(Age) ψ24(Age) ψ25(Age) δLay(.) δInc(.) 9 0.00 377.22 25.88 0.00 358.95
42 ψ12(.) ψ13(.) ψ24(.) ψ25(.) δLay(.) δInc(.) 5 0.00 482.88 131.54 0.00 472.79
43 ψ12(Age) ψ13(Year) ψ24(Age+Year) ψ25(Age) δLay(Age)
δInc(Age)
13 0.00 511.65 160.31 0.00 485.17