NAVAL POSTGRADUATE SCHOOL Monterey, California CM THESIS AN ANALYSIS OF FACTORS THAT INFLUENCE ENLISTMENT DECISIONS IN THE U.S. ARMY by Young Yeol Oh March 1998 Thesis Co-Advisors: Mark J. Eitelberg Gregory G. Hildebrandt Approved for public release; distribution is unlimited. DTIC QÜALITV TWH^OTTJ» 0
Transcript
NAVAL POSTGRADUATE SCHOOL Monterey, California
CM
THESIS
AN ANALYSIS OF FACTORS THAT INFLUENCE ENLISTMENT DECISIONS
IN THE U.S. ARMY
by
Young Yeol Oh
March 1998
Thesis Co-Advisors: Mark J. Eitelberg Gregory G. Hildebrandt
Approved for public release; distribution is unlimited.
DTIC QÜALITV TWH^OTTJ» 0
REPORT DOCUMENTATION PAGE Form Approved OMB No. 0704-0188
Public reporting burden for this collection of information is estimated to average 1 hour per response, including the time for reviewing instruction, searching existing data sources, gathering and maintaining the data needed, and completing and reviewing the collection of information. Send comments regarding this burden estimate or any other aspect of this collection of information, including suggestions for reducing this burden, to Washington Headquarters Services, Directorate for Information Operations and Reports, 1215 Jefferson Davis Highway, Suite 1204, Arlington, VA 22202-4302, and to the Office of Management and Budget, Paperwork Reduction Project (0704-0188) Washington DC 20503.
1. AGENCY USE ONLY (Leave blank) 2. REPORT DATE March 1998
REPORT TYPE AND DATES COVERED Master's Thesis
4. TITLE AND SUBTITLE :
AN ANALYSIS OF FACTORS THAT INFLUENCE ENLISTMENT DECISIONS IN THE U.S. ARMY
6. AUTHOR(S) Oh, Young Yeol
7. PERFORMING ORGANIZATION NAME(S) AND ADDRESS(ES) Naval Postgraduate School Monterey CA 93943-5000
9. SPONSORING/MONITORING AGENCY NAME(S) AND ADDRESS(ES)
FUNDING NUMBERS
PERFORMING ORGANIZATION REPORT NUMBER
10. SPONSORING/MONITORING AGENCY REPORT NUMBER
11. SUPPLEMENTARY NOTES The views expressed in this thesis are those of the author and do not reflect the official policy or position of the Department of Defense or the U.S. Government.
12a. DISTRIBUTION/AVAILABILITY STATEMENT Approved for public release; distribution is unlimited.
12b. DISTRIBUTION CODE
13 ABSTRACT (maximum 200 words)
The purpose of this thesis is to analyze factors that influence decisions to enlist in the U.S. Army. This thesis uses 1997 New Recruit Survey data from the Army Recruiting Command and examines new recruits who contracted between October 1, 1996 and September 30, 1997, but had not yet entered basic training. This study employs cross-tabulations and a Multi-Nomial Logit model, using PROC CATMOD, to analyze the data. The results show that recruits who differ in gender, ethnicity, past status, educational expectations, years of service, and contact initiation are influenced to enlist by different factors. Educational incentives, especially the Army's College Fund, and self-development, including "to do something I can be proud of," are given as the most important reasons to enlist. Recruiters and friends are the most influential sources of information about the Army, and TV advertisements are the most influential sources in the mass media. Key barriers to enlistment are the perceptions that service in the military is a serious obstacle to educational progress, followed by military life, and conflicting interests. Immediate family members, especially parents, are key influencers in the enlistment decision. The results suggest that the Army should strive to improve its image and service environment, as well as continue to sustain enlistment incentives and resources at an adequate level.
Table 13. Marginal Advertising Costs of Obtaining High-Quality Enlistments
within One Month, 1989 27
Table 14. Description of the New Recruit Survey, by Data Version 31
xm
Table 15. Description of the New Recruit Survey Versions,
by Gender and Racial/Ethnic Group 31
Table 16. Percentage Distribution of Enlistment Reasons
by New Revruit Survey Version, 1997 36
Table 17. Percentage Comparison of the Five Most Important Reasons to Enlist:
1997 NRS, 1996 YATS, and Elig's (1984) study 36
Table 18. Percentage Comparison of the Four Most Important Reasons to Enlist
by New Recruit Survey Version, Gender and Racial/Ethnic Group, 1997 37
Table 19. Percentage Distribution of Educational Expectations
by Gender/Ethnic Group, 1997 38
Table 20. Percentage Distribution of Opinion over GI Bill Abolition,
by New Recruit Survey Version, 1997 38
Table 21. Percentage Distribution of Recruits by Years of Service,
by Gender/Ethnic Group, 1997 38
Table 22. Percentage Distribution of Recruits by the Four Most Important Reasons
to Enlist and Years of Service, 1997 39
Table 23. Percentage of Advertising Recognition by Source,
Gender/Ethnic Group, 1997 40
Table 24. Percentage of Recruits Attributing Importance of Information Sources
by Gender and Racial/Ethnic Group, 1997 41
Table 25. Percentage Distribution of the Four Most Important Reasons to Enlist
among Recruits Who Indicated Major Importance of TV
Advertisements 41
Table 26. Percentage Distribution of Opinion about Seeing an Recruiter 42
xiv
Table 27. Percentage Distribution of Recruits by First Contact with Recruiter and
New Recruit Survey Version, 1997 42
Table 28. Percentage Distribution of Recruits According to Contact Initiative,
by the Four Most Important Reasons to Enlist 43
Table 29. Percentage Distribution of Recruits According to First Contact Situation,
by Gender, 1997 43
Table 30. Key Barriers to Enlist (Important or Very Important), in Percent,
by Gender and Racial/Ethnic Group, 1997 44
Table 31. Key Influences, in Percent, by Supportive and Least Supportive, 1997 45
Table 32. Category of Response Variables: Enlistment Reasons 46
Table 33. Description of Variables 47
Table 34. Analysis of Variance for the Main Effect Model: Men 48
Table 35. Parameter Estimates of Model: Men 50
Table 36. Predicted Probability of Each Category for Men 51
Table 37. Analysis of Variance for the Main Effect Model: Women 54
Table 38. Parameter Estimates of Model: Women 55
Table 39. Predicted Probability of Each Category for Women 56
Table 40. Grouping of Explanatory Variables by Information Sources 59
Table 41. Analysis of Variance for Response Variable by Information Sources 59
Table 42. Parameter Estimates of Enlistment Reasons by Information Sources 60
Table 43. Predicted Probability of Each Category by Information Sources 61
Table 44. Main Effect Variables for Each Infromation Source 62
Table 45. Parameter Estimates of the Importance of Each Information Sources 64
Table A.l. Predicted Probability of Each Category of Enlistment Reasons
for Men 72 xv
Table A. 2. Predicted Probability of Each Category of Enlistment Reasons
for Women 73
Table A. 3. Predicted Probability of the Importance of Media Information 74
Table A4. Predicted Probability of the Importance of Information
from the Army or Its Recruiter 74
Table A. 5. Predicted Probability of the Importance of Information
from Other Sources 75
Table B.l. Analysis of Variance for the Main Effect Model 77
Table B. 2. Parameter Estimates of Model 78
xvi
I. INTRODUCTION
Since the advent of the All-Volunteer Force (AVF), there have been continuous
debates and doubts about its efficiency, effectiveness, and equitability. Despite such
lingering concerns, a major conference, held at the U.S. Naval Academy to commemorate
two decades of the AVF, declared the all-volunteer system a complete success. The
Department of Defense (DoD) has been successful in meeting recruiting goals, increasing
retention, and improving the overall quality of the force. This success results from
vigorous recruiting efforts, additional recruiting resources provided by Congress,
increased military pay and compensation, and higher youth unemployment (Gilroy et al.,
1996, p. 68). The successes have been particularly remarkable for the Army.
We can learn the following lessons from the early years of the AVF: (1) various
changes in the economy and the youth labor force affect the military's ability to recruit and
retain high quality personnel; (2) pay and benefits, especially educational assistance, are
good recruiting and retention incentives; (3) adequate recruiting and advertising resources
are important; (4) it is essential to track youth attitudes and propensities toward the
military and then use this information in recruiting programs; (5) there are ways to better
select, assign and train new recruits; and so on. (Gilroy et al., 1996, p. 68)
The AVF is now in its third decade. The military is currently confronting various
challenges, such as force downsizing, a reduction in both budget and recruiting resources,
the decline in youth population and propensity to enlist, continued economic recovery, and
a change in people's perception of the military due to the collapse of the Soviet Union.
Therefore, it is more important now than ever before for both DoD and the services to
continue attracting high-quality, motivated youth into the military to maintain a high-
quality, combat-ready force.
The present situation of the U.S. armed forces may reflect the future of the Korean
Army, which is currently facing the same challenges. It also is possible that the North and
South Korea will become unified suddenly or over a period of years. If this occurs,
maintaining the military through the draft system will lose its justification. Thus, this is a
good time for the Korean Army to learn from the United States' experience with the AVF.
A. PURPOSE AND OBJECTIVES
The purpose of this thesis is to analyze factors that influence the decisions of
young people to enlist in the U.S. Army.
The objectives of this thesis are as follows:
1. To examine the factors that influence the decision to enlist.
2. To determine the relationship between the above factors and demographic
variables (e.g., gender, race).
3. To evaluate the effect of the Army's current enlistment incentives and
related resources of the Army on enlistment decisions.
4. To determine statistical differences between the effects of various factors
on the decision to enlist.
5. To develop a vision of the future Korean Army.
B. SCOPE AND LIMITATIONS
1. Scope
This thesis focuses on finding the factors that influence the decision to enlist in the
U.S. Army. This analysis examines new recruits who contracted between October 1, 1996
and September 30, 1997, but before they go to basic training. Specifically, the research
tries to determine the important reasons for enlisting, the effect of enlistment incentives
and resources, key barriers to and key influencers for enlisting.
2. Limitations
The main limitation of this thesis is potential bias from analyzing data. The data
used focus on new recruits who have already decided to join the Army, and exclude those
who do not want to enlist. Therefore, the responses to the survey questions are more
likely to be favorable to the Army. This may cause the key findings to be overestimated.
C. SUMMARY OF CHAPTERS
Chapter II contains general background information on the AVF and a discussion
of key issues related to this thesis. Chapter III offers a review of previous studies. Chapter
IV describes the data and methodology used in this study. Chapter V presents the data
analysis and empirical results of the model employed. Chapter VI provides conclusions
and recommendations based on the study.
H. BACKGROUND
A. ALL-VOLUNTEER FORCE
After intense national debate, the United States ended conscription in June 1973.
The Vietnam War clearly served to dramatize the draft issue and, indeed, acted as a
catalyst for the debate. However, the root cause was a growing concern about the inequity
of the Selective Service draft. (Scowcroft, 1982, p. 163)
The equity issue was twofold: the burden of conscription and the selective way
that this burden was applied. Individuals subjected to the draft were forced to bear a
burden that other members of society were able to avoid. The specific burdens were many,
including low pay, risk to life and limb, personal hardship, arduous working conditions,
and disruption in their personal and working lives, among others. The issue of inequity
arose because of the selective way that these burdens were applied. As the numbers of
young men reaching military age each year increased substantially during the 1960s, a
smaller and smaller proportion was required to serve. As a result, the vast majority of
military-age youth would never have to serve. For every young man forced to serve, three
or four would not. Thus, no matter how fair or equitable the selection process could be
made in an ex ante sense, such as a random lottery, there was no escaping the fact that a
selective service draft would be inequitable expost-i.e., to those unfortunate enough to be
drafted. (Scowcroft, 1982, p. 163)
With the decision to abolish military conscription, the United States took on a
monumental task: raising an armed force of three million by strictly volunteer means. A
key concern was whether the services could enlist enough young men and women without
incurring exorbitant additional costs and without compromising the quality and, therefore,
the effectiveness of the armed forces. (Binkin, 1984, p. vii)
The President's Commission on an All-Volunteer Armed Force (or Gates
Commission) had set out the blueprint for the AVF rooted in economic behavior. It
assumed that by making entry-level military compensation competitive with civilian wages,
sufficient numbers of high-quality personnel would be attracted to military service, that the
racial composition of the force would not be significantly altered, and that the people
brought into the military could be molded into an effective fighting force. In 1973, the
American economy was in trouble, youth unemployment was high, and entry-level military
pay was roughly competitive with civilian wages, thanks to increases granted during the
last years of conscription. In the absence of employment alternatives, the AVF appeared to
be an immediate success. (Segal, 1989, p. 38)
According to Thurman (Gilroy et al., 1986, p. 56), the eras of the AVF can be
denoted as follows:
• 1st AVF: • 2nd AVF:
• 3rd AVF:
• 4th AVF: 1983-1991
5th AVF:
1973-1976, Era ending with the demise of the GI bill. 1976-1979, Era ending with the failure of all the services to achieve
recruiting goals. 1979-1983, Era comprising the upswing in pay comparability, the
arrival of the Army College Fund. Era ending with when Desert Storm was won and force reduction began. Era characterizing by a reduction in forces, numerous regional threats, peace keeping missions, a lower recruiting missions, reduced recruiting resources, and a paucity of advertising.
1991- present,
Figure 1 shows the trend of high-quality recruits over the AVF periods. Table 1
shows the summary of each AVF period based on the previous studies.
Mean value
(%)
54>$ $$,1
5th AVF
AVF Period
Source: Derived from Gilroy et al., 1996.
Figure 1. Distribution of High-Quality Recruits in the Army over Time
6
A high-quality recruit is defined as one who has obtained a high school diploma
and attained a percentile score of 50 or above on the Armed Forces Qualification Test
(AFQT) (Gilroy et al., 1996, p. 72).
Table 1. Summary of the All-Volunteer Army Periods
Period Characteristic Evaluation
1st AVF
• Advent of AVF: high uncertainty • High entry level pay • Sufficient recruiting resources/ budget • GI Bill: major recruit incentive • Expanding youth population • High youth unemployment rate
• Success in meeting recruiting goal: both quantity and quality
• High quality recruit -Mean: 35.7 percent
2nd AVF
• Overconfidence in AVF • Lower relative military pay • Ending GI Bill-> VEAP • Reduction in recruiting resources • Growing national economy • Low youth unemployment rate
• 17,000 short of manpower objectives
• Accession quality dropped -Mean: 20.0 percent
3rd AVF
• Recovery from the failure in 2nd AVF • Recovery of relative pay level • Basic benefit of VEAP increase, ACF • Increase in resources: advertising • Youth population decline • High unemployment rate
• Recovery of high quality, an increase through the period -Mean: 32.4 percent
• An increase in the Army awareness from advertising: "Be All You Can Be"
4th AVF
• Cold war tension decline, ending with Desert Storm
• High entry level civilian wage • Recruiting resources increase • Youth population drop • Low youth unemployment rate
• Substantial increase in high- quality recruits (48.3 percent in FY 83 to 71.3 in FY 91)
5th AVF
• Numerous regional threats • Force downsizing-» budget cut • A reduction in recruiting resources • Youth propensity to enlist decline • Strong recovery of national economy
• Stable recruit quality (over 60 percent)
• New challenge in recruiting
Source: Derived from Gilroy et al., 1996, and Eitelberg and Mehay, 1994.
Figure 1 and Table 1 show that the percentage of high-quality recruits in the Army
has increased over the AVF periods from 35.7 percent in the 1st AVF to 65.1 percent in
the 5th AVF. Table 1 and Figure 1 also indicate that the success of the AVF depends on
how to adopt an effective policy and provide sufficient resources to cope with a frequently
changing recruiting environment.
B. ENLISTMENT SCREENING
1. Enlistment Standards
The following are the basic eligibility criteria for enlistment into the armed forces
(Kirby and Thie, 1996, pp. 65-66):
• Age: between 17 and 35 years.
• Citizenship: U.S. citizen or permanent resident.
• Education: possession of a high school diploma desired but not mandatory;
non-graduates may be accepted provided their AFQT score is 31 or higher.
• Aptitude: persons scoring in Category V are illegible to enlist by law (10
U.S.C 520 AND DoD Directive 1145.1). The number of Category TV
enlistees cannot exceed 20 percent of the total number of enlistees.
• Physical fitness: free of contagious and infectious diseases; free of medical
conditions or physical defects that would require excessive time lost from duty
or might likely result in separation for medical unfitness; medically capable of
satisfactorily completing training; adaptable to the military environment;
medically capable of performing duties without aggravation of existing medical
conditions or physical defects.
• Dependency status: cannot enlist married individuals with more than two
dependents under 18, or unmarried individuals with custody of dependents
under 18, without a waiver.
• Moral character: disqualification on this basis encompasses individuals under
judicial restraint, with significant criminal records, or displaying antisocial or
other problematic behavior.
8
2. Aptitude Screen
The primary components of the aptitude screen are the Armed Services Vocational
Aptitude Battery (ASVAB) and the AFQT.
a. The Armed Services Vocational Aptitude Battery (ASVAB)
All of the Services use the ASVAB for screening enlistees and for
occupational assignment. By combining selection and classification, the Services are able
to improve the matching of applicants with available job positions and to allow job
guarantees for those qualified. (Kirby and Thie, 1996, p. 63)
The current ASVAB consists of 10 subtasts as follows (Laurence et al.,
1991, p.9):
Word Knowledge (WK) Coding Speed (CS)
Paragraph Comprehension (PC) General Science (GS)
Arithmetic Reasoning (AR) Auto And Shop Information (AS)
Elig et al., (1984) examined a study conducted by ARI to determine what
influenced the reasons to enlist. Table 11 exhibits the results, which show that the most-
often-mentioned reasons to enlist were "the chance to better myself," "to get trained in a
skill," and "money for a college education." "Getting money for college" increased from 7
percent in 1979 to 16 percent in 1983, but "to improve myself and "to get skill training"
decreased. (Gray, 1987, pp. 43-44)
Table 11. Percentage of the Most Important Reasons to Enlist: 1979,1982, and 1983
Which one of the these reasons is your most important reason for enlisting?
1979 DoD Survey of
April contracts
Survey of accessions Spring Summer
1982 1983 1982 1983
Chance to better myself 39 30 25 N/A N/A To get trained in a skill 26 22 19 35 30 Money for a college education 7 15 16 20 17 To serve my country 10 9 9 10 12 1 was unemployed 4 10 9 10 10 To prove that 1 can make it 4 6 7 9 10 To be away from home on my own 5 4 5 5 7 Earn more money 1 2 7 4 6 Travel 4 N/A N/A 4 4 To get away from personal problems Family problems
1
0.5
1
1
2
1
2
1
2
2
Source: Gray, 1987.
22
Gray (1987) examined the relationship between recruit quality and military
enlistment influences, using survey data of 1985 Army recruits from ARI. The analysis
indicated that upper test-score recruits were more strongly influenced by educational
benefits than by skill training and unemployment.
B. ENLISTMENT INCENTIVES
Bachman and Blair (1975) stressed that the typical high school student planning
for college tends to view military service as an unwise interruption of his or her
educational development. The "college in exchange for service" formula is a means of
attracting able individuals who can learn quickly, serve quickly, and then leave quickly to
make room for other fresh recruits.
Hunter and Nelson (1982) noted that recruitment declined during late 1970s due to
a reduction in economic incentives. Over this 1975-1979 period, pay for the military
recruit fell relative to any civilian pay index measured, and a valuable educational benefit
(GI Bill) was replaced by another far less valuable one (The Post Vietnam Era Veterans'
Educational Assistance Program). Reduced financial incentives resulted in a 21-percent
decline in recruits and a 25-percent of reduction in enlistment rates for male high school
graduates between 1975 and 1979. (Scowcroft, 1982, p. 101)
According to Binkin (1984), military pay declined by an estimated 10 percent
relative to civilian pay between FY 1975 and 1979. The relative decline in military pay
would have caused a 10-percent decline in the enlistment rates of high quality male
recruits. Also, the conversion of the GI Bill to VEAP accounted for a decline of between 5
and 10 percent in high school graduate recruits (Binkin, 1984, pp. 10-12). This resulting is
little bit lower than Hunter and Nelson's, but the loss of GI bill clearly yielded a major loss
of benefits and resulted in a decline in enlistments.
Goldberg and Greenston (1986) found that pay has a very strong effect on
enlistments. However, the effect varies considerably among the occupational codes. A
one-percent increase in relative military pay would cause the supply to increase by 0.50 to
3.61. As for enlistment bonuses, the magnitude of a bonus is much smaller than that of
23
relative pay. This may imply that it is expensive to use bonuses to channel recruits.
(Gilroy, 1986, p.79)
DoD and the Army undertook a two-year test, from July 1982 to June 1984, to
determine the enlistment effects of expanding the bonus program. The RAND Corporation
assisted DoD by designing the experiment and analyzing the data. The results show that
the extended bonus program had striking effects on the number of high-quality enlistees
attracted to priority skills and on the number of recruits signing up for longer terms.
(Polich et al., 1986)
Warner (1990) determined that, between 1981 and 1986, the average present value
of Army educational benefits increased by nearly 70 percent. According to an estimate of
the effects of Army educational benefits, such a benefit increase would induce high-quality
enlistments to rise by about 29 percent. Because actual enlistmentSnearly doubled over
this period, more than one-quarter of the increase in the Army's high-quality enlistments
apparently can be traced to increases in the Army's educational benefits.
Gilroy, Phillips and Blair (1990) examined the effects of the ACF on recruiting.
They found that the elasticity of the effect was 0.14, and a 10-percent increase in the ACF
would result in a 1.4-percent increase in enlistments.
Klerman and Karoly (1994) studied the magnitude of the potential for lowering the
military pay of new recruits. The standard estimates imply that the elasticity of high-quality
accessions with respect to first-term pay is about 1.5. This elasticity implies that a ten-
percent increase in pay yields a 15-percent increase in high-quality recruits. At levels that
low, it is possible that the elasticity is considerably higher; that is, a 15-percent cut in the
pay table would yield a larger-than-3 0-percent cut in enlistments or a dramatic fall in the
quality of enlistees. (Eitelberg and Mehay, 1994, p. 59)
Asch and Dertouzos (1994) analyzed the relative cost-effectiveness of enlistment
bonuses and educational benefits. They found that educational benefits significantly
expand enlistment supply and increase incentives for first-term completion. Relative to
bonus programs, educational benefits enhance the flow of prior-service individuals into the
military.
24
C. RECRUITING RESOURCES
1. Advertising
According to Mirelson (1984), advertising was not considered an influence on
enlistment (see Table 9). He cites a DoD Military Advertising Awareness Project
conducted from 1977 to 1980, which determined that recruits frequently remembered
parts of military advertisements, but that they had little influence on the decision to enlist.
(Gray, 1987, p. 46)
Mirelson (1984) found that 35 percent of the recruits who saw or heard an Army
advertisement before enlisting sought further information as a result of the advertisement.
Of the sample, 21 percent had decided to seek information about the military prior to
seeing or hearing an advertisement. (Gray, 1987, pp. 46-47)
Dertouzos et al., (1989) analyzed the effects of Army advertising on recruiting.
They used an econometric analysis of information describing advertising patterns for a
three-year period 1981 to 1984. The conclusion was that, in general, advertising
expenditures in a given month have a significant and immediate effect on the number of
high-quality enlistments in the Army. Moreover, advertising has a lagged effect, increasing
enlistment for as long as six months, although the effect often dampens over time. The
enlistment effect of advertising in a given month falls by about 42 percent each month after
the advertising appears.
Table 12 provides elasticity estimates for advertising expenditures. For national
advertising, all media appear to increase enlistment supply substantially. For example, a
100-percent increase in television advertising can be expected to increase high-quality
enlistments by 2.31 percent. The enlistment increases as a result of doubling the national
radio and magazine advertising budget would be 0.85 and 2.18 percent, respectively. For
local advertising, increases in expenditures on daily newspaper advertising are significantly
related to high-quality enlistments. However, neither high school newspapers nor local
radio purchases had any discernible effect on enlistments. (Dertouzos et al., 1989, pp. 26-
Kearl et al., (1990) mentioned in their research that one can expect the number of
recruiters to have a large and significant effect on the number of enlistments, since
recruiters have direct and continual contact with prospective applicants and with recruits
in the Delayed Entry Program (DEP). Their authors found that a 10-percent increase in
the number of recruiters would increase enlistments by 5,258.
Orvis et al., (1996) examined the conversion of recruiting supply in their research.
They found some decline in rates of both contact with youth and discussion with
influencers from a recent YATS and Recruiter Survey. The evidence suggesting a decline
in recruiter contacts with high school students is provided by recent trends in the high
school ASVAB. Between school year 1987-1988 and school year 1993-1994, the total
number of students testing declined from about 1.1 million per year to about 850,000 per
year. These declines could have resulted from reductions in the number of recruiters and
stations, which may have reduced the feasible number of visits to high schools.
Hosek et al., (1986) cited early studies indicating that adding one percent to the
size of a service's recruiting force would increase high-quality male enlistments by perhaps
a half of a percent. More recent estimates place the effect in the 0.7- to 0.8- percent range.
27
Based on these estimates, a 10-percent decline in high-quality male enlistments could be
offset by a 13-percent increase in the number of recruiters. (Bowman et al., 1986, p. 200)
D. KEY INFLUENCERS
Stephen (1977)analyzed the results of a two-year field study of the Army National
Guard in Wisconsin that includes personal interviews with 812 guardsmen. In 68 percent
of the cases where the Guard first made contact, a friend within the Guard or Reserves,
rather than a recruiter or commander, made contact. Guard and Reserve friends are also
mentioned by 54 percent of those who decided to wait a while before joining. The next
most frequently mentioned source of influence among those who decided to wait was the
immediate family, at 14 percent.
Thomas (1984) examined the effect of parents with military experience on
enlistment. For all active-duty personnel, 58.3 percent had parents who had some service
experience, and 12.5 percent had parents with more than ten years of military employment.
According to the study by Orvis et al. (1996), the percentage of youths reporting
discussions with their father, mother, and friends is 21.3, 19.4, and 17.7 percent,
respectively, in FY 95. They mentioned that it is possible that youths who talk to
influencers get more negative advice about joining the military than they used to. This
could reduce enlistment rates. (Orvis et al., 1996, pp. 24-25)
E. SUMMARY
Generally, the following conclusions can be drown from previous research:
Money for college and skill training have been the two most important
reasons to enlist, according to recruits. The first reason, money for college,
has increased over time.
Among monetary benefits, educational benefits have generally had the most
significant effect on enlistment.
Advertising and the role and number of recruiters have exercised a strong
effect on enlistment.
28
1.
4. Immediate family members, such as father and mother, and recruits'
friends are key influencers in the decision to enlist or not to enlist.
The most important conclusion we can draw from these studies is that, in a
continuously changing environment, the military needs to discover a timely and adequate
mix of factors that influence the decision to enlist.
29
30
IV. DATA AND METHODOLOGY
A. DATA
This thesis uses the 1997 Army New Recruit Survey (NRS) data files obtained
from Army Recruiting Command to analyze factors that influence the decisions of
persons to enlist in the U.S. Army.
Army Recruiting Command conducts the NRS annually to measure attitudes
toward and the perceived value of Army programs before applicants develop a strong
opinion about Army life. This survey captures information close to the decision point.
Army Recruiting Command mailed the survey to a stratified sample of new recruits. New
recruits received the NRS one month after a contract date of between October 1, 1996
and September 30, 1997, but before they went to basic training.
For the purpose of this thesis, the NRS data are modified into three versions. The
versions are explained in Table 14. Version 2 and Version 3 are employed to examine
any differences among variables in those versions.
Table 14. Description of the New Recruit Survey, by Data Version
Version Version 1
Description All new recruits
Version 2 Version 3
New recruits who enlisted without incentives (recruits w/o) New recruits including those who enlisted with incentives (recruits w/)
Table 15 shows the sample size and demographic factors of each version that was
developed for this study.
Table 15. Description of the New Recruit Survey Versions, by Gender and Racial/Ethnic Group, 1997
Version Sample Size
Gender Racial/Ethnic Group Male Female White Asian Black Native Hispanic
Version 1 8,312 6,315 1,997 6,165 128 1,490 48 481 Version 2 5,932 4,430 1,502 4,217 96 1,201 41 377 Version 3 2,380 1,885 495 1,948 32 289 7 104
31
B. METHODOLOGY
This thesis uses cross-tabulations and Multi-Nomial Logit models to analyze the
data. These methods are described below.
1. Cross-Tabulations
Cross-tabulations provide percentage calculations for various dimensional tables.
This analysis focuses on key factors that influence the decision to enlist, which fall into
several categories: the most important reasons to enlist; the effect of advertisements and
recruiters; key influencers; key barriers to enlistment; and the impact of a change in
enlistment incentives. Tables are summarized and explained by gender and race, using
three versions of the data. However, since a particular cross tabulation table dose not
control for the effect of variables not included in the table, the results derived from cross-
tabulations may be misleading. Therefore, a Multi-Nomial Logit model is employed to
cover the limitations of cross-tabulation analysis.
2. Multi-Nomial Logit Model
A Multi-Nomial Logit modeling is somewhat different from the Logistic
Regression model, which requires binary dependent variables. The concept of Multi-
Nomial Logit is that logits can be formed from contrasts of non-redundant category pairs
whenever the dependent variable is three or more categories, and each logit is then
modeled in a separate equation.
This thesis examines the factors that influence the decision to enlist by using
maximum likelihood estimation of parameters with the analysis of generalized logits. The
estimates were calculated using the PROC CATMOD procedure.
PROC CATMOD is a procedure for categorical data modeling. The procedure
analyzes data that can be represented by a contingency table. It fits linear models to
functions of response frequencies and can be used for linear modeling, log-linear
modeling, logistic regression, and repeated measurement analysis. (SAS institute, 1990,
p. 407) An important feature of PROC CATMOD is that one does not have to create
indicator variables to handle qualitative explanatory variables (Stokes et al., 1995, p.205).
Since analyzing the factors that influence the decision to enlist is the purpose of
the thesis, this study examines three main effects:
32
• Enlistment reasons as a function of certain measurable variables, such as
gender, race, years of service, status before joining the Army, educational
expectations, and contact initiation.
• Enlistment reasons as a function of three categories of information sources
to identify the relationship between enlistment reasons and information
sources.
• Each information source as a function of certain measurable variables,
such as gender, race, years of service, status before joining the Army,
educational expectations, and contact initiation.
The following are general procedures for running Multi-Nomial Logit with PROC
CATMOD:
• Aggregate data for the most effective number of categories as a response
variable.
• Screen independent variables using an analysis of variance.
• Run Multi-Nomial Logit with PROC CATMOD by using main effect
variables.
• Interpret results with parameter estimates for each log of the odd ratio
among response variables.
• Select sub-groups to examine the predicted probability of the model.
The Multi-Nomial Logit analysis in Chapter V includes more details about such
issues as how to group response variables, describe independent variables, and interpret
results.
33
34
V. ANALYSIS OF DATA
A. PRELIMINARY ANALYSIS
The preliminary analysis consists of descriptive statistics of the data. It examines
variable frequencies and the relationships and statistical differences among key variables
in each version through using cross-tabulations. Key findings include enlistment reasons,
the effect of enlistment incentives, the perception of information sources, the effect of the
recruiter, including contact initiation, barriers to enlistment, and key influencers.
1. Enlistment Reasons
Table 16 shows a comparison of the most important reasons for enlisting. In all,
20.2 percent of new recruits mentioned "money for college" as the most important reason
to enlist, followed by "something I can be proud of" (20 percent), "trained in a skill"
(12.7 percent), and "serve my country" (9.6 percent). It is surprising that "something I
can be proud of has almost the same percentage as "money for college." The research
shows that recruits enlisting without incentives are looking for "something I can be proud
of," while those enlisting with incentives are more interested in "money for college." The
desire to serve one's country (9.6 percent) is still a motivator for young men, but reasons
related to pay (3.9 percent) and unemployment (0.9 percent) do not appear to be
important factors in deciding to enlist, and there is not a large difference among NRS
versions.
Table 17 shows a comparison of the most important reasons between the three
studies: this thesis; 1996 YATS; and Elig's (1984) study. "Money for college" is the most
important motivation to enlist for both this study and in the 1996 YATS. A considerable
percentage of actual enlistees are influenced by "something I can be proud of," which is
not asked in the 1996 YATS. The percentage of "trained in a skill" and "more money" in
the 1997 NRS data is much lower than in the 1996 YATS. Also, comparing the results
with Elig's study, the percentage of "money for college" in this study is higher than in
Elig's, while the percentage of "trained in a skill" is lower. These results imply that the
current enhanced educational incentives leads youths to focus more on education benefits
when deciding whether or not to enlist. There is little difference in the importance of
"serve my country" between the three studies. 35
Table 16. Percentage Distribution of Enlistment Reasons by New Recruit Survey Version, 1997
Most important reasons Total Recruit Recruit for enlisting w/o incentives w/ incentives
Travel 2.7 2.8 2.5 Prove I can make it 6.4 6.5 6.2 Something I can be proud of 20.0 20.4 19.0 Money for college 20.2 19.4 22.3 Mgmt and leadership experience 5.7 5.9 5.3 More money 3.9 4.0 3.7 Trained in a skill 12.7 12.7 12.8 Family tradition 1.7 1.6 1.9 Away from home 2.5 2.3 2.8 Serve my country 9.6 9.4 10.1 Unemployed 0.9 1.1 0.4 High-tech environment 2.1 2.1 2.1 Other 11.5 11.7 11.0
Total | 100.01 100.01 100.01 1 1 Each value is rounded.
Source: Derived from 1997 New Recruit Survey (NRS).
Table 17. Percentage Comparison of the Five most important Reasons to enlist: 1997 NRS, 1996 YATS, and Elig's Study
Most important reason 1997 NRS 1996 YATS Elig's study1
for enlisting Money for college 20.2 32.0 17.0 Trained in a skill 12.7 24.0 26.5 Something I can be proud of 20.0 N/A N/A More money (pay) 3.9 11.0 4.75 Serve my country 9.6 12.0 10.0
1 Mean percentile value derived from ARI survey results in Table 11.
Table 18 shows that "money for college" is a stronger incentive for women than it
is for men, as well as a stronger incentive for black and Hispanic men than it is for white
men. White men and women are more likely to mention "trained in a skill" and "serve
my country" than are blacks and Hispanics. Blacks are less likely than others to be
motivated by "serve my country." For "something I can be proud of," there is no
36
difference with regard to either gender or racial/ethnic group, with the exception of
Hispanic women (about 8 percent higher).
Table 18. Percentage Comparison of the Four Most Important Reasons to Enlist by New Recruit Survey Version, Gender and Racial/Ethnic Group, 1997
Most important reason I Wale Female for enlisting
White Black Hispanic Total White Black Hispanic Total
Money for Total 17.1 21.7 24.3 18.1 26.1 28.4 30.1 26.6 college Recruit w/o 15.9 21.0 23.2 17.2 25.8 25.3 31.5 25.7
Recruit w 19.3 24.3 28.4 20.4 26.8 43.9 25.0 29.4
Trained in a Total 14.5 12.3 6.5 13.7 10.7 7.6 8.9 9.8 skill Recruit w/o 14.8 12.0 5.3 13.7 10.7 8.2 9.0 10.0
Recruit w 13.8 13.8 10.8 13.6 10.7 4.9 8.3 9.4
Something 1 Total 19.5 20.7 21.4 19.8 20.6 18.3 28.3 20.7 can be proud of Recruit w/o 19.8 21.3 22.4 20.3 20.5 18.6 28.1 20.7
Recruit w 18.7 18.2 17.6 18.6 20.9 17.1 29.2 20.7
Serve my Total 12.3 4.7 9.6 11.0 6.3 3.3 1.8 5.2 country Recruit w/o 12.3 4.2 9.1 10.8 7.1 3.2 0.0 5.5
Recruit w 12.4 6.6 8.1 11.6 4.2 3.7 8.3 4.3
Source: Derived from 1997 New Recruit Survey (NRS).
2. Enlistment Incentives
The ranking of the most important reasons for enlisting shows that the educational
incentive has a large impact on enlistment. Table 19 exhibits the educational expectations
of new recruits. Most new recruits want to get a higher education, a bachelor's degree
(37.6 percent) or a master's degree or higher (40.4 percent). Furthermore, women, blacks
and Hispanics have higher expectations than do men and whites, respectively.
Considering this kind of trend, educational incentives could be an effective method of
attracting more college-bound recruits.
37
Table 19. Percentage Distribution of Educational Expectations by Gender and Racial/Ethnic Group, 1997
Educational expectation
Total Gender Racial/Ethnic Group Male Female White Black Hispanic
Master's or Ph.D. 40.4 36.1 53.8 37.7 47.5 52.1
Bachelor's degree 37.6 39.1 33.2 39.0 32.9 32.7
Associate's degree 9.4 10.0 7.4 9.9 8.7 5.8
Vocational degree 6.6 8.1 2.2 7.4 5.0 3.9
High school diploma 5.9 6.7 3.5 6.0 6.0 5.5
Total 100.01 100.01 100.0 100.0 100.01 100.0 Each value of total is rounded.
Source: Derived from 1997 New Recruit Survey (NRS).
Over 80 percent of new recruits think that abolishing the GI Bill would make
recruiting hard (see Table 20). This result supports the conclusion reported in Chapter III
that the loss of the GI Bill in the late 1970s had a large negative impact on enlistment.
This also proves that most recruits are sensitive to a change in educational benefits. As
most previous studies have reported, sufficient resources (in this case, the GI Bill) are of
key importance in guaranteeing the success of the AVF.
Table 20. Percentage Distribution of Opinion over GI Bill Abolition, by New Recruit Version, 1997
GI bill—doing away with would make recruiting hard
Total Recruit w/o incentives
Recruit w/ incentives
Strongly agree Agree Neither or disagree
63.9 18.6 17.5
63.9 18.1 18.0
63.8 20.4 15.8
total 100.0 100.0 100.0 Source: Derived from 1997 New Recruit Survey (NRS).
38
Table 21 demonstrates the relationship between years of service and demographic
factors. Just under half (48.1 percent) of recruits take four-year service, followed by
three-year service (32.6 percent). Women (58.30 percent) are especially likely to opt for
four years. Blacks (52.9 percent) are also more likely to take four-year service than
recruits in other racial/ethnic groups.
Table 21. Percentage Distribution of Recruits by Years of Service, Gender, Racial/Ethnic Group, 1997
Years of service 2yrs 3yrs 4yrs 5yrs 6yrs Total
Total 3.4 32.6 48.1 8.1 7.8 100.0 Sex Male
Female 3.6 2.8
37.3 18.0
44.7 58.3
7.0 11.8
7.3 9.1
100.01
100.0 Race White
Black Hispanic
3.6 2.8 4.0
31.7 33.8 35.8
47.2 52.8 47.0
9.3 4.7 5.0
8.2 5.9 8.3
100.0 100.0 100.01
' Each value is rounded. Source: Derived from 1997 New Recruit Survey (NRS).
As shown in Table 22, "money for college" is the main reason to enlist for recruits
who take the two-year service option, but this option includes just 3.4 percent of all
recruits (from Table 21). The percentage of "trained in a skill" gets larger as years of
service increase from 7.1 percent for two-year service enlistments to 22.2 percent for
five-year service enlistments. The percentage of "something I can be proud of is almost
equally distributed over the years of service categories. Table 22 implies that work-bound
recruits are more likely to select a long commitment than are college-bound recruits.
Table 22. Percentage Distribution of Recruits by the Four Most Important Reasons to Enlist and Years of Service, 1997
Most important reason to enlist 2yrs 3yrs 4yrs 5yrs 6yrs Something I can be proud of 16.3 22.3 19.1 18.5 20.6 Money for college 46.0 16.2 22.3 14.6 14.0 Trained in a skill 7.1 11.1 12.0 22.2 17.8 Serve my country 5.4 11.4 8.4 9.8 9.7
Source: Derived from 1997 New Recruit Survey (NRS). 39
3. Enlistment Resources
This section consists of two parts: the effects of advertising and the recruiter. It
considers the effect of Army advertising on enlistment, the role of recruiter in helping
applicants to decide, and the initiation of the first contact between applicants and
recruiters. The section also evaluates the effect of each information source that the Army
Recruiting Command uses to help applicants make an enlistment decision.
a. The Effect of Advertising
Table 23 shows that over 80 percent of new recruits remember the Army's
advertisements from television, followed by school, the recruiting station, magazines, and
mail. Meanwhile, newspapers and the Internet are not memorable media for new recruits.
Table 23. Percentage of Advertising Recognition by Source, Gender, and Racial/Ethnic group, 1997
Advertising Source
Total Gender Racial/Ethnic group Male Female White Black Hispanic
Source: Derived from 1997 New Recruit Survey (NRS).
Table 24 shows the importance of information from each source. The
information from a recruiter (69.7 percent) is the most influential in helping recruits make
an enlistment decision. Just under half (45.5 percent) of new recruits rely on information
from friends who have enlisted, with women and non-whites more likely to depend on
friends' information. The importance of advertising on TV is also considerable, but radio
advertising is not. This reflects the different characteristics of these two media. In
contrast to the recognition level shown in Table 23, the importance of information from
magazines, mail and school is much lower than the percentage of their recognition levels.
40
This study has the same result as Dertouzos's (1989) with regard to local
radio advertising: hardly any discernible effect on enlistment. And, unlike the impact of
the Internet on our society in general, the impact of Internet on recruiting is less than
what one might expect.
Table 24. Percentage of Recruits Attributing Importance to Information Sources, by Gender and Racial/Ethnic Group, 1997
How important was info, from?
Total Sex Race Male Female White Black Hispanic
Friend who enlisted 45.5 48.5 52.6 48.3 51.7 57.5 Ad on TV 32.2 32.7 30.5 29.6 38.9 40.1 Ad on radio 14.9 14.5 16.0 13.3 20.2 18.4 Ad in magazine 20.0 20.2 19.7 17.8 24.5 32.7 Mail info. 29.2 28.8 30.5 27.1 35.6 34.3 Info. At school 28.3 29.5 35.3 29.5 35.0 37.4 Info from recruiter 69.7 68.8 72.2 69.4 69.8 70.7 Info from internet 12.5 12.2 13.4 12.0 12.5 17.4
Note: Values above are the sum of percentage: "important" and "very important." Source: Derived from 1997 New Recruit Survey (NRS).
Table 25 shows the relationship between TV advertisements and the four
most important reasons to enlist. Among those who think that information from TV is
"important" or "very important", 26 percent mentioned "something I can be proud of and
13.8 percent mentioned "serve my country" as a motivating factor to enlist. One may
assume that these results come from the effect of "Be All You Can Be," the motto used in
Army advertisements. The image of the Army in TV advertising apparently stimulates
young people to enlist for these two reasons.
Table 25. Percentage Distribution of the Four Most Important Reasons to Enlist among Recruits Who Indicated Major Importance of TV Advertisements
How important was info. From TV?
TV Advertisement
Money for college
15.9
Something I can be proud of
26.0
Trained in a skill
10.5
Serve my country
13.8 Source: Derived from 1997 New Recruit Survey (NRS).
41
b. Recruiters
Table 26 shows recruit opinions regarding recruiter contact. Most new
recruits (over 70 percent) believe that it is a good idea to contact a recruiter in making an
enlistment decision. Meanwhile, 23.5 percent of recruits tend to rely on their friends
when deciding whether or not to enlist. This result is correlated to key influencer and
supports the assumption that friends of recruits are one of the most important influencers.
Table 26. Percentage Distribution of Opinion about Seeing an Recruiter
If a friend asked your advise about seeing an Army recruiter
Good idea Bad idea Up to him or her
Total
Percentage 76.0 0.6 23.4 100.0 Source: Derived from 1997 New Recruit Survey (NRS).
As seen in Table 27, 51.4 percent of new recruits take the initiative to
contact a recruiter. Recruits enlisting without incentives (53.1 percent) are about 6
percent more likely to initiate the contact than are those with incentives (47.2 percent).
Recruiters are more likely to initiate contact with incentive-bound recruits. Friends of
recruits still have a considerable effect on first contact.
Table 27. Percentage Distribution of Recruits by First Contact with Recruiter and New Recruit Survey Version, 1997
How did you have first contact with an Army recruiter?
Total Recruits w/o incentives
Recruits W/ incentives
I contacted army recruiter first.
Recruiter contacted me.
I was friend with whom a recruiter was meeting.
51.4
38.3
10.3
53.1
36.9
10.0
47.2
41.9
10.9
Total 100.0 100.0 100.0 Source: Derived from 1997 New Recruit Survey (NRS).
As seen in Table 28, recruits who make the first contact tend to consider
"something I can be proud of " as a motivator, while those who recruiters contact are 42
more likely to mention "money for college." This implies that the recruiters focus on
meeting the high-quality recruit goal, because those who want the Army College Fund
must score 50 or better on the AFQT and be a high school diploma graduate.
Table 28. Percentage Distribution of Recruits According to Contact Initiative, by the Four Most Important Reasons to Enlist, 1997
Enlistment Reason I contacted Recruiter Recruiter contacted me
Money for college 15.5 26.2 Something I can be proud of 21.6 17.5 Trained in a skill 11.6 14.5 Serve my country 11.2 7.9
Source: Derived from 1997 New Recruit Survey (NRS).
Just under half (47 percent) of contacts are made by phone, and about 53 percent
of contacts are made face-to-face. Women are 3 percent more likely than men to make
contact by phone. Men are more likely to make face-to-face contact (see Table 29). The
percentage of contact at school is considerable for both men and women.
Table 29. Percentage Distribution of Recruits According to First-Contact Situation, by Gender, 1997
Under what circumstances did you talk with a recruiter?
Total Gender Male Female
By phone (I called the recruiter) By phone (recruiter called me) Talked at school Talked at Rctg. Stn. (I initiated the visit) Talked at an army cinema van display
Talked during a chance encounter in public Other
19.6 27.3 16.5 27.4
0.2
3.9 5.1
19.0 27.1 16.3 28.5
0.2
4.0 5.0
21.7 27.8 17.2 23.7
0.3
4.0 5.5
Total 100 100.01 100.01
Each value is rounded. Source: Derived from 1997 New Recruit Survey (NRS).
43
4. Key Barriers to Enlist
Table 30 shows the percentage of key barriers for enlisting that new recruits
mentioned as "important" or "very important". About 76 percent of new recruits think of
military service as a serious obstacle to their educational progress. The military lifestyle,
other interests, and commitment are also considered significant barriers. New recruits
think danger in performing duty and fear of basic training are less important barriers to
enlistment. Women's responses regarding danger and fear of basic training are 7 percent
to 26 percent higher than that of men, and, for them, danger and fear of basic training are
considerable barriers to enlistment. With regard to each barrier, the percentage of blacks
and Hispanics are much higher than that of whites. The fact that women, blacks and
Hispanics are more worried about educational interruption supports the assertion that
they have higher educational expectations. The same trends are seen in the results of the
1996 YATS.
Table 30. Key Barriers to Enlist (Important or Very Important), in Percent, By Gender and Racial/Ethnic Group, 1997
Key barriers to enlist Total Gender Racial/Ethnic Group Male Female White Black Hispanic
Lifestyle 63.1 60.6 70.7 60.7 70.7 67.9
Other interests 63.2 61.7 68.1 59.2 75.6 72.9
Commitment 56.5 54.2 63.9 54.7 62.0 62.3
Danger 35.2 32.6 43.7 30.0 54.2 44.1
Obligations 44.7 43.4 59.2 41.2 58.2 49.3
Education 75.7 73.5 82.6 72.9 84.6 84.9
Fear of basic training 35.5 28.8 56.4 33.5 43.2 35.4
Family attitude 39.1 36.9 46.0 37.1 44.2 45.2
Source: Derived from 1997 New Recruit Survey (NRS).
44
5. Key Influencers
Table 31 shows the percentages of key influencers on enlistment. As previous
studies determined, one's immediate family exercises a great influence on the decision to
enlist, with a total of 57.2 percent. Father, mother, and friends, in order, strongly support
the decision to enlist. Blacks and women are more likely than others to depend on their
mother. Meanwhile, friends (42.1 percent) are the least supportive of enlistment.
Table 31. Key Influencers, in Percent, by Supportive and Least Supportive, 1997
Influencer Supportive Least Supportive Mother 22.2 (33.11, 27.92) 14.0 Father 22.5 8.0 Friend 18.3 42.1
Other immediate family 3 12.5 6.1
2 Women 3 Including sister, brother, husband, and wife.
Source: Derived from 1997 New Recruit Survey (NRS).
This result implies that, if a person's key influencers have a negative perception
of the Army and advise against enlistment, they might have a significant effect on
enlistment, as Orvis et al. (1996) observed.
Therefore, it is very important that the Army try to change the perception of
parents and friends from negative to positive. To accomplish this, the Army must
improve not only its image through aggressive advertising and recruiters' efforts, but also
its service environment with regard to leadership, quality of life, and healthy human
relationships.
B. MULTINOMIAL LOGIT ANALYSIS USING PROC CATMOD
1. Analysis of Enlistment Reasons
a. Grouping the Response Variables
To reduce the number of required parameter estimates, the most important
reasons given to enlist are categorized into four groups. Table 32 shows how the answers
have been grouped for this analysis based on cross-tabulation analysis (see Tablel6). The
45
four categories are "college fund," "job training/money," "other," and "self-
development." "Money for college" is categorized as "college fund" to examine the
significance of the current educational incentive called Army College Fund (ACF); it also
has somewhat different characteristics than "money" or "self-development."
Table 32. Category of Response Variables: Enlistment Reasons
0 1 2 3 College Job Money Other Self-development Fund training
Money Trained in a More money Travel Prove I can make it For college skill
Unemployed Family tradition Something I can be High-tech proud of environment Serve my
country
Other
Mgmt and Leadership Experience
Away from home
Since the four response variables are created and are in the order "0:
college fund," "1: job/ money," "2: other," and "3: self-development," generalized logits
are formed for the probability of "college fund" to "self-development," "job/ money" to
"self-development," and "other" to "self-development."
b. Explanatory Variables
(1) Gender
Gender is a dichotomous variable. Male is 0, and female is 1.
(2) Ethnicity
A dummy variable defined by three categories: White (0), Black
(1), and Hispanic (2). Native American, Alaskan, Asian, and Pacific Islander are removed
from the data due to their small proportion of all recruits in the sample.
(3) Educational Expectations
A dichotomous variable. These are the educational expectations of
recruits. If someone has educational expectations of college or above, then the variable
EXEDU equals 0. If less than college-level, EXEDU equals 1.
46
(4) Past Status
A dummy variable defined by three categories. It represents the
recruit's status before joining the Army. If someone was in the work force part- or full-
time, then PASTST equals 0. If in school part- or full-time, then PASTST equals 1.
Someone unemployed equals 2.
(5) Contact Initiation
A dummy variable defined by three categories. If recruits make the
first contact, then CONTACT equals 0. If the recruiter makes the first contact, then
CONTACT equals 1. If the recruit's friends help to meet recruiters, then CONTACT
equals 2.
(6) Years of Service
A dichotomous variable. If someone has two- to four-year
commitments, then YOS equals 0. If someone has five- to six-year commitments, then
YOS equals 1.
Table 33 shows the description of explanatory variables.
Table 33. Description of Variables
Demographic ETHNIC White:0, Black: 1, Hispanic:2
Others EXEDU Educational expectation
- >= college:0, < college: 1
PASTST Status before joining the Army - work full or part time: 0, - school füll or part time: 1, - unemployed: 2
Table 40 gives the description of explanatory variables. Each group is divided
into two sub-categories~0: important or very important; 1: less than important.
Table 40. Grouping of Explanatory Variables by Information Source
MEDIA IFARMY IFOTH Media Advertisement Army or Recruiters Other TV
Radio
Magazine
Recruiter
Mail (solicited)
Mail (unsolicited)
Friends who enlisted
School
Internet
Table 41 shows the analysis of variance for four categories of enlistment reasons
by information sources. The goodness of fit is adequate for this model (Chi-square =
11.95 with 12 df and/? = 0.4494). The effects of information from media advertising and
Army recruiters are highly significant, p < 0.001. Information from other sources is
significant at a = 0.05 level.
Table 41. Analysis of Variance for Response Variable by Information Sources
Source of variation Degrees of Freedom
Chi-square Probability
INTERCEPT
MEDIA IFARMY IFOTH
LIKELIHOOD RATIO
3
3 3 3
12
285.85
39.67 78.44 9.07
11.95
0.0000
0.0000 0.0000 0.0284
0.4494 Source: Derived from 1997 M ew Recruit Surv ey (NRS).
59
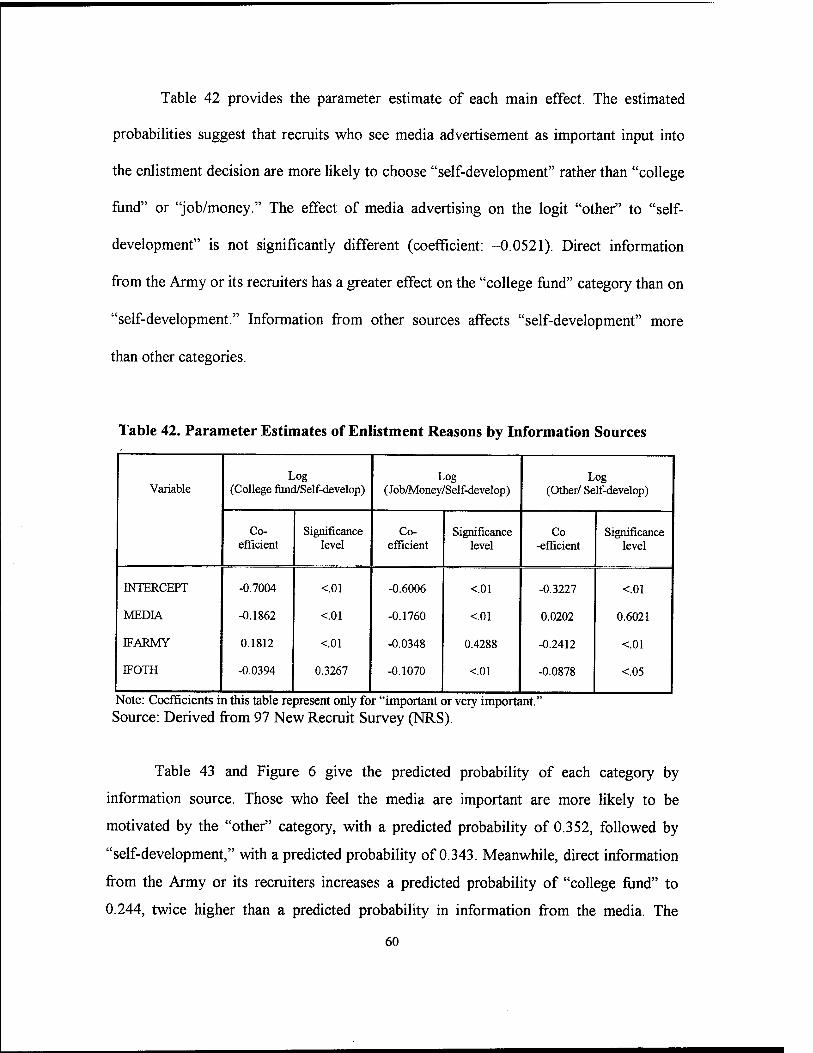
Table 42 provides the parameter estimate of each main effect. The estimated
probabilities suggest that recruits who see media advertisement as important input into
the enlistment decision are more likely to choose "self-development" rather than "college
fund" or "job/money." The effect of media advertising on the logit "other" to "self-
development" is not significantly different (coefficient: -0.0521). Direct information
from the Army or its recruiters has a greater effect on the "college fund" category than on
"self-development." Information from other sources affects "self-development" more
than other categories.
Table 42. Parameter Estimates of Enlistment Reasons by Information Sources
Variable Log
(College fund/Self-develop) Log
(Job/Money/Self-develop) Log
(Other/ Self-develop)
Co- efficient
Significance level
Co- efficient
Significance level
Co -efficient
Significance level
INTERCEPT
MEDIA
IFARMY
EFOTH
-0.7004
-0.1862
0.1812
-0.0394
<01
<01
<01
0.3267
-0.6006
-0.1760
-0.0348
-0.1070
<01
<01
0.4288
<01
-0.3227
0.0202
-0.2412
-0.0878
<.01
0.6021
<01
<.05
Note: Coefficients in this table represent only for "important or very important." Source: Derived from 97 New Recruit Survey (NRS).
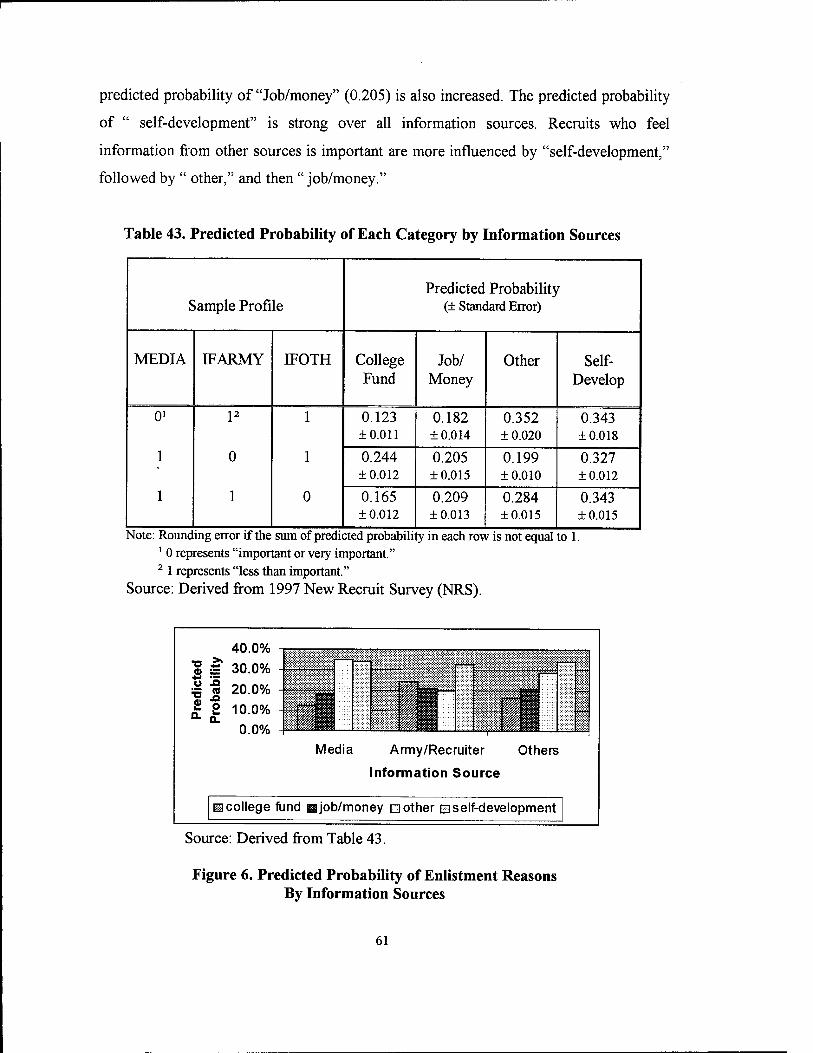
Table 43 and Figure 6 give the predicted probability of each category by
information source. Those who feel the media are important are more likely to be
motivated by the "other" category, with a predicted probability of 0.352, followed by
"self-development," with a predicted probability of 0.343. Meanwhile, direct information
from the Army or its recruiters increases a predicted probability of "college fund" to
0.244, twice higher than a predicted probability in information from the media. The
60
predicted probability of "Job/money" (0.205) is also increased. The predicted probability
of " self-development" is strong over all information sources. Recruits who feel
information from other sources is important are more influenced by "self-development,"
followed by " other," and then " job/money."
Table 43. Predicted Probability of Each Category by Information Sources
Sample Profile Predicted Probability
(± Standard Error)
MEDIA IF ARMY IFOTH College Fund
Job/ Money
Other Self- Develop
01
1
1
P
0
1
1
1
0
0.123 ±0.011
0.182 ±0.014
0.352 ± 0.020
0.343 ±0.018
0.244 ±0.012
0.205 ±0.015
0.199 ±0.010
0.327 ±0.012
0.165 ±0.012
0.209 ±0.013
0.284 ±0.015
0.343 ±0.015
Note: Rounding error if the sum of predicted probability in each row is not equal to 1. 1 0 represents "important or very important." 2 1 represents "less than important."
Source: Derived from 1997 New Recruit Survey (NRS).
40.0% | £ 30.0%
| « 20.0% £ S 10.0%
0.0% Media Army/Recruiter Others
Information Source
^college fund mjob/money Qother mself-development
Source: Derived from Table 43.
Figure 6. Predicted Probability of Enlistment Reasons By Information Sources
61
3. Analysis of Information Sources
The purpose of this analysis is to examine the relationship between the
importance of each information source and certain single variables. The method and
description of independent variables are the same as in Section 1.
a. Response Variables
The response variable is a dichotomous one with response categories
"important" or "very important" and "less than important," as mentioned in Section 2.
Therefore, the estimated model of each group for information sources is a function of
gender, racial/ethnic group, past status, and contact initiation:
Log (Important or very important/Less than important)
= /(GENDER, ETHNIC, PASTST, CONTACT)
However, the main effect model of each information source is somewhat
different from the estimated model because non-significant variables are removed from
the model as a result of an analysis of variance.
b. Multi-Nomial Logit Analysis
Table 44 shows the main effect variables for each information source,
which are derived from the analysis of variance for the importance of information from
the various sources. The main effect model of media information is the function of
gender and racial/ethnic group. The main effect model of information from the Army or
its recruiters is the function of gender, past status, and contact initiation. The main effect
of information from other sources is the function of gender, racial/ethnic group, past
status, and contact initiation, which includes all independent variables.
Table 44. Main Effect Variables for Each Information Source
Media Army or its recruiters
Other sources
GENDER ETHNIC
GENDER (p= 0.06)1
PASTST CONTACT
GENDER ETHNIC (p= 0.07)2
PASTST CONATCT
Note:' and2 are kept in the model because they are marginally influential. 62
Table 45 shows the parameter estimates of the main effect model of three
categories of information sources. With regard to media information, the results show
that male recruits are more likely than female recruits to say that information from the
media influenced their decision to enlist. Among racial/ethnic groups, whites are least
likely to report that media is important, while Hispanics and blacks depend more on
media information to make enlistment decisions.
The results indicate that men are less likely than women to rate
information from the Army or its recruiters as important or very important. Recruits who
are in the work force are less likely to mention the importance of direct information,
while those who are in school full- or part-time depend more on direct information.
Recruits who are contacted by recruiters are more influenced by information from the
Army or its recruiters. According to the analysis of enlistment reasons, recruits who are
in school and who are contacted by recruiters are more likely to be motivated by
enlistment incentives, especially the college fund. Thus, for incentive-bound recruits,
direct information from the Army or its recruiters is very important in the enlistment
decision.
Men are less likely than women to mention information from other
sources as important in their enlistment decision. Among racial/ethnic groups, Hispanics
are most likely to be influenced by information from other sources. Persons in school
depend more on information from other sources than do those in the work force. Recruits
who contact recruiters with friends' help are more likely to consider other information
sources as important. Recruits who either make the first contact or are contacted by a
recruiter are less likely to feel that information from other sources is important or very
important.
63
Table 45. Parameter Estimates of the Importance of Each Information Source
VARIABLE Media Army or its recruiter Other sources
Log (important or very important/less than important)
Co- efficient
Significance level
Co- efficient
Significance level
Co- efficient
Significance level
INTERCEPT
GENDER Male
Female
ETHNIC White
Black
Hispanic
PASTST Work
school
CONTACT Recruits
Recruiters
Friends
-0.4111
0.0836
-0.0836
-0.3110
0.1301
0.1809
<01
<05
<.05
<.01
<.05
<.05
1.4091
-0.0788
0.0788
<.01
0.0610
0.0610
0.8839
-0.1187
0.1187
-0.1224
-0.0755
0.1979
-0.1027
0.1027
-0.2969
-0.3164
0.6133
<01
<01
<01
<05
0.2666
<05
<01
<01
<01
<01
<.01
N/A*
N/A* -0.3109
0.3109
-0.7867
0.7997
-0.0130
<.01
<01
<.01
<01
<.01
N/A*
* Variable not included because of low significance.
Source: Derived from 97 New Recruit Survey (NRS).
Figure 7 shows that the predicted probability of the importance of media
information for white men is 0.346 for important, while black and Hispanic males have
the predicted probability of 0.451 and 0.463, respectively. The predicted probability for
white females is 0.308, while black and Hispanic women have the predicted probability
of 0.401 and 0.422, respectively. Figure 7 supports the results of the parameter estimates
for the importance of information from the media.
64
= 80.0%
2 60.0%
2 40.0%
■g 20.0%
« 0.0% o k. 0.
white male
black Hispanic white male male female
black Hispanic female female
Gender & Race/Ethnicity
^>= important ^< important
Source: Derived from 1997 New Recruit Survey (NRS).
Figure 7. Predicted Probability of the Importance of Media Information
Figure 8 shows the predicted probability of the importance of information
from the Army or its recruiters. For example, the predicted probability for men from the
work force who make the first contact is 0.558 for important, while, for women in school
who are contacted by recruiters, it is 0.925. Regardless of gender, recruits who are in
school and who are contacted by a recruiter are more likely to be influenced by direct
information from the Army or its recruiters.
Figure 9 shows the predicted probability of the importance of information from
other sources. For example, the predicted probability for Hispanic women in school who
make the first contact with a friend's help is 0.872, while, for white men with the same
other conditions, it is 0.796. As Figure 9 shows, recruits whose friends help them contact
a recruiter are more likely to think of other sources as important information, regardless
of gender and racial/ethnic group. Women feel more than do men that information from
other sources is important to the enlistment decision.
65
■a &
H 1 00% 80% 60% 40% 20%
0%
recruit work
recruiter recruit school
recruiter
Past Status/Contact Initiation
13male ■ female
Source: Derived from 1997 New Recruit Survey (NRS).
Figure 8. Predicted Probability of the Importance of Information from the Army or Its Recruiters: Important or Very Important
■O +;
'— CO
O. Q.
100.0% 80.0% 60.0% 40.0% 20.0%
0.0% white male
black male
Hispanic male
white female
black female
Hispanic female
Gender & Race/Ethnicity
M recruit ■ recruiter □ friend
Note: Controlling sample profile with school for past status. Source: Derived from 1997 New Recruit Survey (NRS)
Figure 9. Predicted Probability of the Importance of Information from Other Sources: Important or Very Important
66
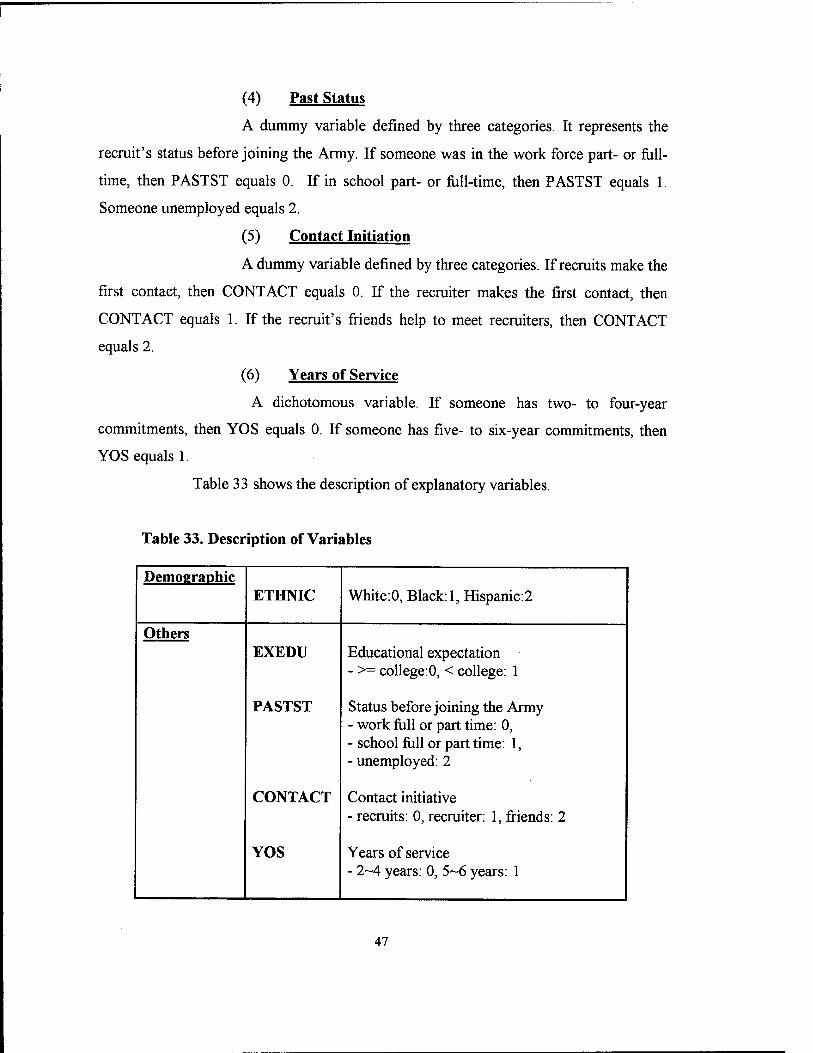
VL CONCLUSIONS AND RECOMMENDATIONS
A. CONCLUSIONS
The primary goal of this thesis is to analyze factors that influence people's
decisions to enlist in the U.S. Army. By using cross-tabulations and Multi-Nomial Logit
analysis, the research tried to determine the important reasons for enlisting, the effect of
enlistment incentives and resources, and key barriers to and key influences on enlistment.
The major findings of the data analysis are described in Chapter V. Conclusions drawn
from the findings are presented below.
"Money for college" and "something I can be proud of are the primary reasons
for enlisting. Skill training and patriotism are also among the reasons for enlisting, but
"more money" and "unemployment" apparently have little effect on enlistment
motivation. The characteristics that influence the decision to enlist are gender,
racial/ethnic group, educational expectations, status before joining the Army, contact
initiation, and years of service. These different characteristics have different influences
on recruits' enlistment decisions. Women and non-whites are more influenced than men
and whites by "money for college." Regardless of gender and racial/ethnic group, recruits
who have a college-or-above level of educational expectations, who are students before
enlisting, who are contacted by a recruiter, and who have a shorter commitment, are more
likely to be motivated by "money for college," and those who make the first contact, who
are in the work force, with the same other conditions, are more likely to be influenced by
"self-development" or "other" category including patriotism.
With regard to enlistment incentives, most new recruits want get a higher
education (college level or above), and women have higher expectations than do men.
Thus, educational incentives, such as the Army College Fund, can be a strong motivation
for youths to enlist. More than 80 percent of new recruits think that the abolition of the
GI Bill would make recruiting difficult. This suggests that most recruits are sensitive to a
change in enlistment incentives, especially educational benefits. For recruits who have a
two-year commitment, "money for college" is the main reason to enlist. The percentage
recruits identifying skill training as an enlistment reason gets larger as years of service
67
increase. Thus, work-bound recruits are more likely than college-bound recruits to select
a long commitment.
Recruiters and friends who have enlisted are the most important sources of
information about the Army. Among the mass media, TV advertisement is the most
influential source of information. Men tend to recall the Army's advertising better than
do women. Whites are less likely than non-whites to report that the media are important.
TV advertising stimulates recruits to choose "self-development," including "something I
can be proud of," or the " other" category, including "serve my country," as a motivating
factor to enlist, while incentive-bound recruits tend to seek more information from
recruiters.
Most recruits make the first contact. Recruiters are more likely to contact
incentive-bound recruits who want the Army College Fund or enlistment bonuses
because they are more likely to be designated as high-quality soldiers, and recruiters have
to meet the high-quality recruit goal.
Most new recruits think of the military as a serious obstacle to educational
progress. The military lifestyle, other interests, and a long commitment are also serious
barriers to enlistment. Women are more concerned than men about the military lifestyle
and future educational progress.
Immediate family members, especially parents, have a great influence on the
decision to enlist. Blacks and women are more likely than others to depend on their
mother.
B. RECOMMENDATIONS
The results of this analysis suggest that the Army needs an effective recruiting
policy, sufficient resources, and a timely, adequate mix of factors that influence the
decision to enlist in a continuously changing environment.
Educational benefits, especially the college fund, are a key factor in influencing
youths to enlist. Youths are more likely to serve because of benefits they will receive, as
the cost of college increases and the general perception of military service becomes more
negative. Also, it is critical to address the perception among young people that service in
the Army is a great obstacle to their educational progress. 68
It is impossible to maintain youth awareness about benefits and opportunities
from the Army if the Army has neither a sufficient number of recruiters nor an effective
advertising program. Although youths are not highly motivated by "more money,"
military pay or bonuses can be a negative incentive for enlistment if they are decreased
below the level recruits expect. Therefore, monetary incentives, including the college
fund, should be kept at a level high enough to allow the Army to meet its recruiting goal.
Furthermore, the results of this thesis show that an equivalent number of youths consider
service in the Army a means for personal self-development. Work-bound recruits still
think of the Army as a place to learn various skills for their future. Patriotism also has a
marginal effect on enlistment. Thus, considering the cost of enlistment incentives, it is
important to find ways to attract youths who may want to enlist for those reasons.
Effective Advertising and recruiters' efforts can be helpful, because this study shows that
new recruits who are most affected by media advertisements enlist for "self-
development" or patriotism.
Another key finding of this thesis is that the way new recruits' parents and
friends view the Army is an important factor in deciding whether or not to enlist. Most
key influencers have post-Vietnam or non-military experience, so they might have
misconceptions about military life and question the necessity of military service in the
current world situation. The Army might be concerned that those influencers impart a
negative attitude to potential recruits, so the focus of Army advertising and recruiter
efforts should be on changing the attitudes of those influencers.
The incentives and resources mentioned above can have a considerable effect on
enlistment decisions in the short run. For the long term, the Army has to make a major
effort to improve not only its image, but also its service environment with respect to
sound leadership, quality of life, training, healthy human relationships, equal opportunity
for women and minorities, and so on. Therefore, soldiers and veterans who have a
positive impression of the Army can have a great effect on the enlistment decisions of
their friends, sons, or daughters.
Looking at the current situation in Korea, the Korean Army confronts many of the
same issues that the U.S. Army faces, even though it still uses a draft system to fill its
ranks. Some of these issues are: a low propensity to enlist; the perception that the military 69
hinders educational and vocational progress; the issue of inequity; a higher educational
requirement to survive in a very competitive society; an increase in numbers of post-
Korean War generations; and so on. Therefore, the results of this thesis suggest that, if
Korea adopts an all-volunteer system, the Korean Army should follow the example set by
the U.S. Army. To succeed, however, any new system would clearly have to fit Korea's
unique culture and environment.
70
APPENDIX A: PREDICTED PROBABILITIES OF EACH
MULTI- NOMIAL LOGIT MODEL
This appendix contains tables showing predicted probabilities for each Multi-
Nomial Logit models discussed in Chapter V. Explanations of variables in population
profile of each table are the same as the content of Table 33.
71
Table A.l. Predicted Probability of Each Category of Enlistment Reasons for Men.
Population Profile Predicted Probability
ETHNIC YOS EXEDU CONTACT PASTST College Job/ Other Self- Fund Money Development