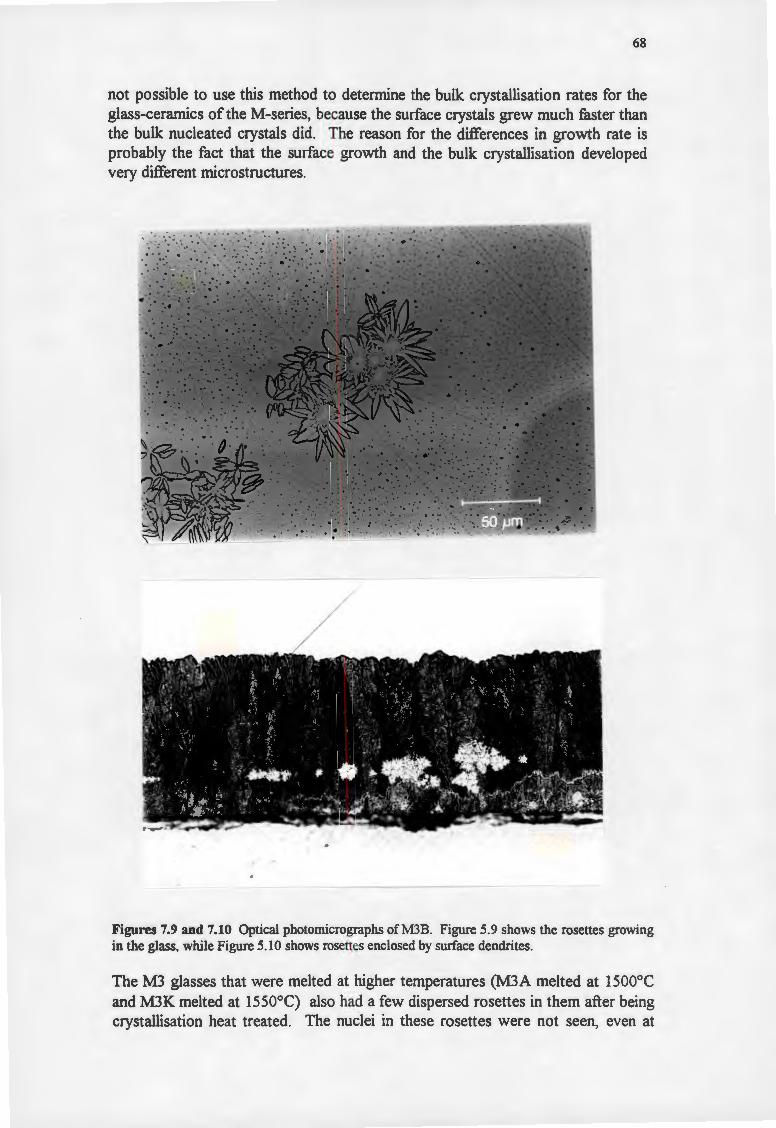
University of Cape Town CRYSTALLISATION OF PFA GLASSES by S. Emms A thesis submitted for the degree of Master of Science in Applied Science to the Faculty of Engineering at the University of Cape Town. Department of Civil Engineering University of Cape Town February 1994 _,..,......,,... • \ ...,. ..&-j,. .... . - .•-t,\ _.. J The Univen<!y r f Cr"" l'>' . ., L ;:'\ been nh:r'l t tile rir;ht tu "'"7'1'''" :: '.:.·; •: '-:, in v.hole . 1
Transcript
Univers
ity of
Cap
e Tow
n
CRYSTALLISATION OF PFA GLASSES
by
S. Emms
A thesis submitted for the degree of Master of Science in Applied Science to the Faculty of Engineering at the University of Cape Town.
J The Univen<!y r f Cr"" l'>' . ., L ;:'\ been nh:r'l
t tile rir;ht tu "'"7'1'''" :: '.:.·; •: '-:, in v.hole .1
L::::~~::.:,,:~~ j'~~·~,;:J .~~-~t~:,:~~:J
Univers
ity of
Cap
e Tow
n
The copyright of this thesis vests in the author. No quotation from it or information derived from it is to be published without full acknowledgement of the source. The thesis is to be used for private study or non-commercial research purposes only.
Published by the University of Cape Town (UCT) in terms of the non-exclusive license granted to UCT by the author.
Univers
ity of
Cap
e Tow
n
ACKNOWLEDGEMENTS
I would like to thank a number of people for their assistance during the writing of this thesis:
• Professor R. 0. Heckroodt, my supervisor, for his help guidance and patience.
• Mrs Vera Frith, for suggestions and proof-reading.
• The Department of Geology and the staff, for the use X-ray diffraction and ion chromatography facilities.
ii
• The Materials Engineering Department and the staff, for the use of the SEM and optical microscopes.
• John Williams, Dennis Botha and the staff of the Civil Engineering Department, for help in the laboratory.
• Bernard Greaves, for photographic work.
• Pretoria Portland Cement, for chemical analyses.
• Ash Resources and the Foundation for Research and Development of the CSIR are gratefully acknowledged for their financial assistance.
Univers
ity of
Cap
e Tow
n
iii
CRYSTALLISATION OF PFA GLASSES
by
S. Emms
Glasses with various compositions, falling in the CaO-AI20rSi02 and MgO-CaOAI20rSi02 systems were made, using pulverised fuel ash and silica, hydrated lime, kaolin and magnesium carbonate. Titania or ferric oxide and chromia were used as nucleants. Various crystallisation heat treatments were carried out and the nucleation and crystallisation behaviour was studied.
A minimum MgO:CaO was found to be necessary for bulk nucleation to occur. The activation energy for viscous flow decreased with increased MgO:CaO ratios. This was accompanied by an increase in the surface crystal growth rates and a decrease in the activation energy for surface crystal growth. Titania also lowered the activation energies for viscous flow and surface crystal growth and caused an increase in the surface crystal growth rates.
The melting temperature affected the nucleation behaviour of the glasses, with melting temperatures above I 400°C suppressing bulk nucleation. The melting time was not found to affect the nucleation behaviour. High Fe3+fFe2+ ratios caused the formation of spinet bulk nuclei.
Changes in the melting time affected the Fe3+fFe2+ ratios, affecting both the surface growth rates and the bulk crystallisation rates. The surface crystal growth rates decreased as the Fe3+fFe2+ ratios increased, because Fe2+ ions lower viscosity. Bulk crystallisation occurred more rapidly in the glasses with high Fe3+fFe2+ ratios, because F e3+ ions favour the formation of spinet nuclei.
The glasses in the CaO-AI20rSi02 system developed dendrites, growing from the surface of the glass. The minerals that crystallised out were melilite and anorthite, with perovskite present in the glasses containing titania. Diopside crystallised out of the glasses in the MgO-CaO-AI20rSi02 system. The morphology was either dendritic surface growth, bulk nucleated rosettes or a combination, depending on the composition and the melting history of the glass.
Univers
ity of
Cap
e Tow
n
iv
CONTENTS
TITLE PAGE
ACKNOWLEDGEMENTS u
ABSTRACT m
CONTENTS IV
1. INTRODUCTION 1
2. LITERATURE REVIEW 2
2.1. NUCLEATION 2
2.1.1. Homogeneous Nucleation 2
2.1.2. Heterogeneous Nucleation 3
i. Surf ace nucleation 3
ii. Bulk Heterogeneous Nucleation 4
2.1.3 Factors Affecting Nucleation 5
i. Glass Structure and Nucleation 5
ii. Nucleants 6
iii. Melting Atmosphere and the Oxidation State of the Glass 7
iv. Melting Time and Fe3+ !Fe2+ ratios 8
2.2 CRYSTALLISATION AND NUCLEATION RELATIONSHIP 11
2.2.1 Rate of Nucleus Formation 11
2.2.2 Interaction between nucleation and crystallisation rates 11
2.3 CRYSTALLISATION 12
2.3.1 Types of Crystallisation 12
i. Epitaxial growth 12
ii. Surface Growth 13
a. Morphology 13
Univers
ity of
Cap
e Tow
n
b. Thermal Expansion Coefficients
c. Surface Flaws
d. Thickness of the Surface Layers
iii. Bulk Crystallisation
a. Spherulites and Dendrites
b. Rosettes
c. Single crystals
d. Recrystallisation
2.3.2 Factors Affecting Growth Rates
i. Composition and Viscosity
ii. Immiscibility
iii. Structure of the Crystallising Mineral
3. METHODOLOGY
3.1 RAW MATERIALS USED
3.2 COMPOSITION OF GLASSES
3.3 MELTING
3.4 POURING AND SHAPING
3.5. HEAT TREATMENT PROCEDURE
3.5.1 Heat Treatment Procedures from Literature
3.5.2 The Heat Treatment Schedules Used
3.6 MEASURING CRYSTALLISATION RATES
3.6.1 Surface Crystallisation
3.6.2 Bulk Growth Rates
3. 7 DILATOMETRY
3.7.1 Specimen Preparation
3. 7.2 Procedure
13
15
15
15
15
17
17
17
18
18
19
19
20
20
21
22
23
24
24
24
25
25
26
26
26
26
v
Univers
ity of
Cap
e Tow
n
vi
3.8 METHODS OF DETERMINING THE FE3+/FE2+ RA TIO 27
3.8.1 Methods Discussed in Literature 27
3.8.2 Method Used in this Study 27
i. Specimen Preparation 27
ii. Procedure 28
iii. Advantages ,of this Method 29
iv. Disadvantages of the Method 30
3.9 X-RAY DIFFRACTION 30
3.9.1 Determination ofMelilite Composition by XRD 31
i. Methods Used in the Literature 31
ii. Gehlenite -Akermanite Composition Determination 31
3.10 MICROSCOPY 33
3.10.1 Specimen Preparation 33
3.10.2 SEM Microscopy 33
4. THE EFFECTS OF COMPOSITION 34
4.1 EFFECT OF COMPOSITION ON NUCLEATION 34
4.2 DILATOMETRY 3 5
4.3 EFFECT OF COMPOSITION ON SURFACE GROWTH RATE 36
4.3.1 T- and D-Series 36
4.3.2 M-Series 38
4.4 CORRELATION BETWEEN Q AND E 39
4.5 DISCUSSION 40
5. EFFECTS OF THE MEL TING PROCEDURE 42
5.1 EFFECT OF THE MELTING PROCEDURE ON BULK NUCLEATION 42
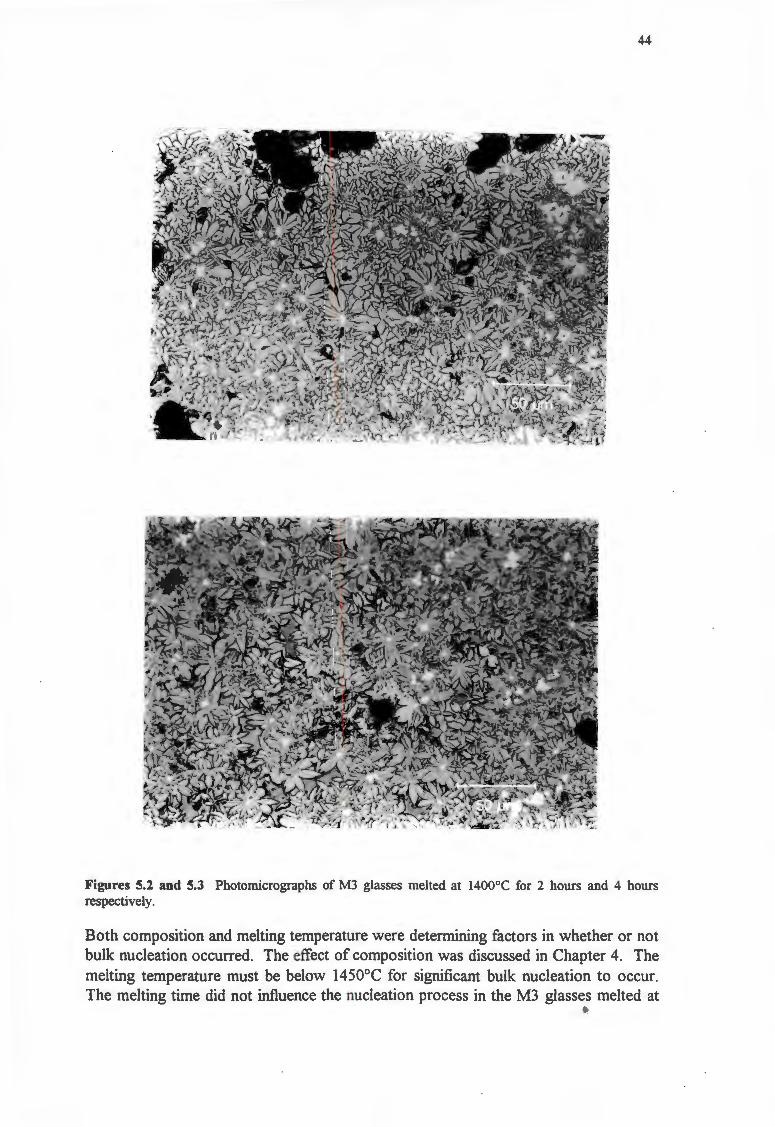
5.2 THE MELTING PROCEDURE AND THE CRYSTAL GROWTH RATE 45
5.2.1 The Effect of Melting Temperature on Surface Crystallisation Rates 45
Univers
ity of
Cap
e Tow
n
5.2.2 The EfTect of Melting Time on Crystallisation Rate
i. Surface Growth Rates
ii. Bulk Crystallisation
5.3 DISCUSSION
6. FE3+JFE2+RATIO
6.1 FE3+/FE2+ RATIOS AND MELTING PARAMETERS
6.1.1 Melting Temperature
6.1.2 Melting Time
6.2 THE FE3+/FE2+ RATIO AND NUCLEATION
6.3 THE FE3+/FE2+ RATIO AND GROWTH RATE
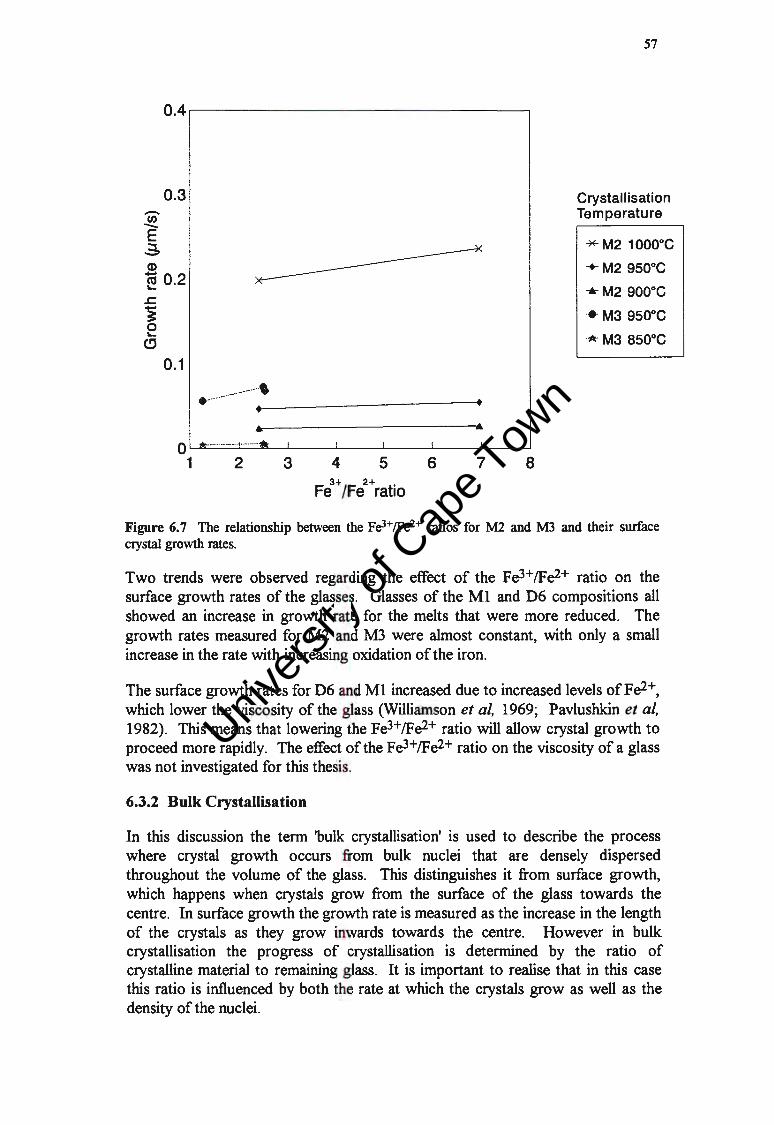
6.3.1 Surface Growth Rates
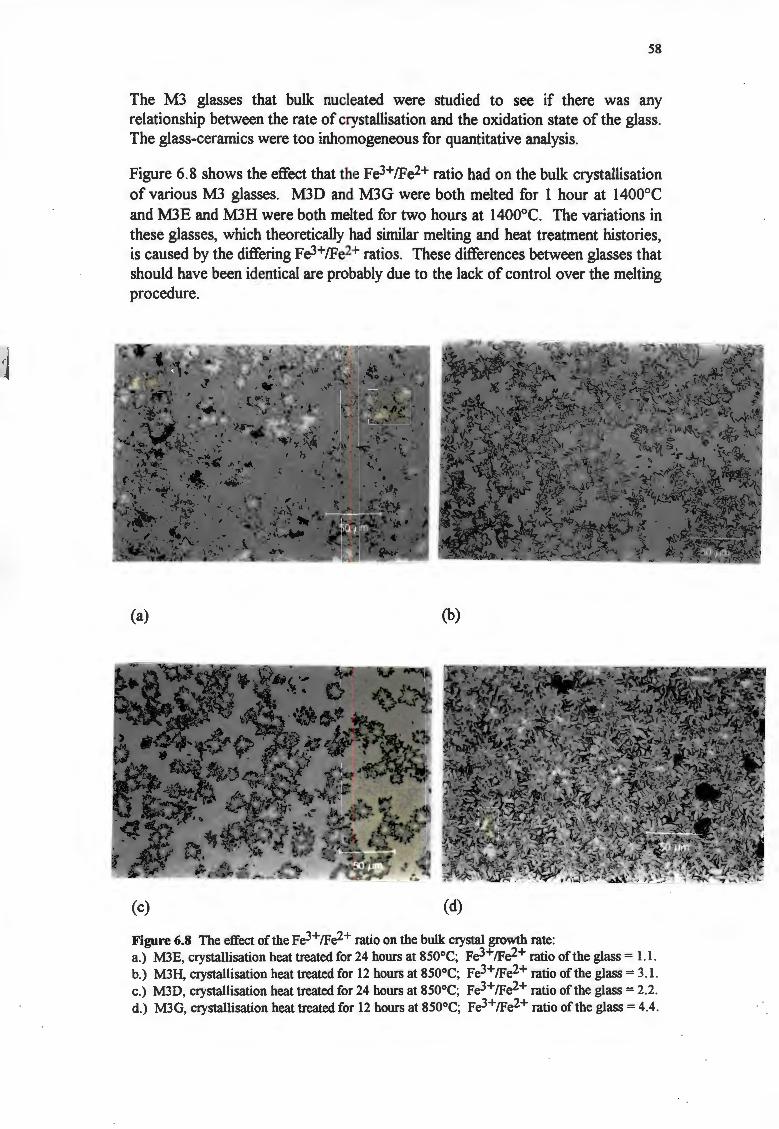
6.3.2 Bulk Crystallisation
6.4 DISCUSSION
7. MINERAL PHASES AND MORPHOLOGY
7.1 T- AND D-SERIES
7.1.1 Mineral Phases
7.1.2 Microstructure
7.1.3 Composition of Phases
7.2 M-SERIES
7.2.1 Mineral Phases
7.2.2 Microstructure
7.2.3 Composition of Phases
7.3 DISCUSSION
8. CONCLUSIONS
9. REFERENCE LIST
vii
46
46
48
49
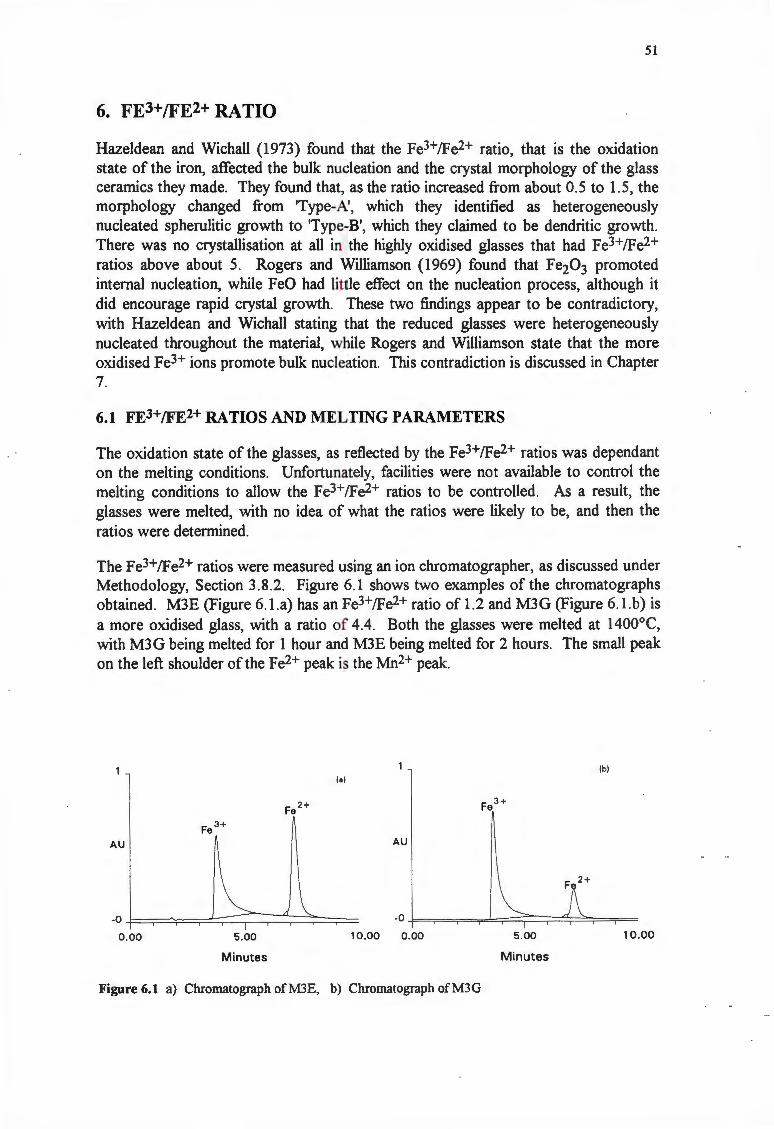
51
51
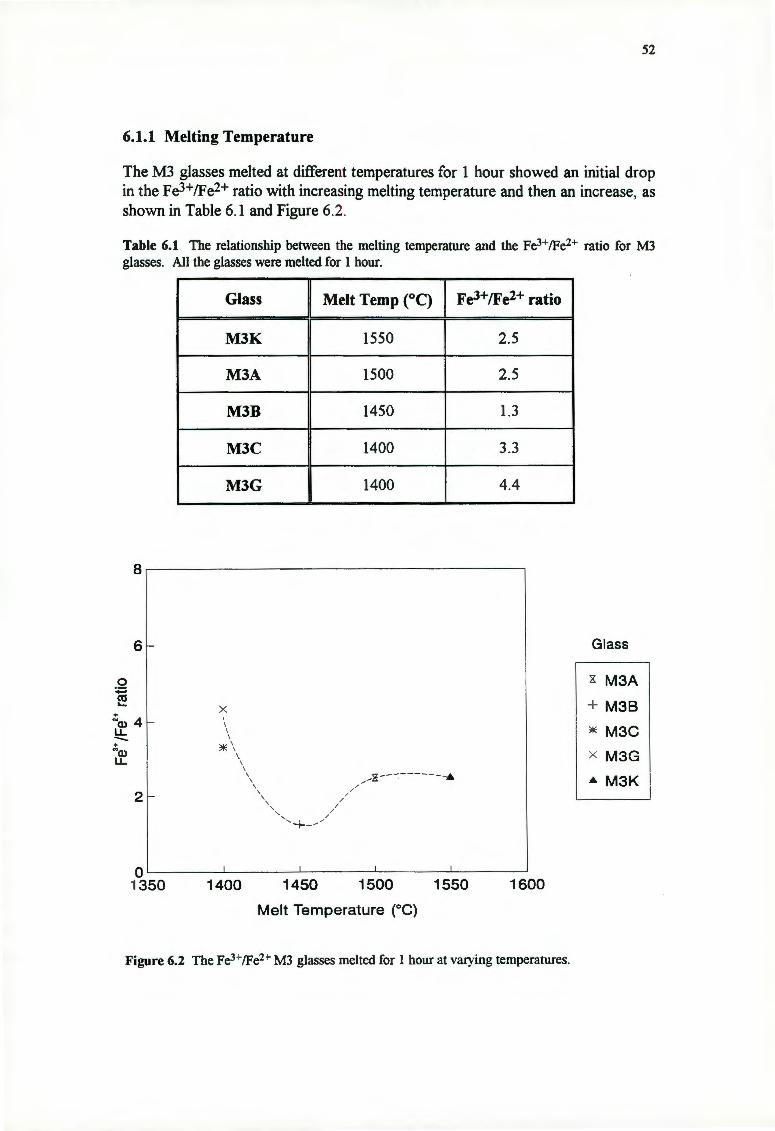
52
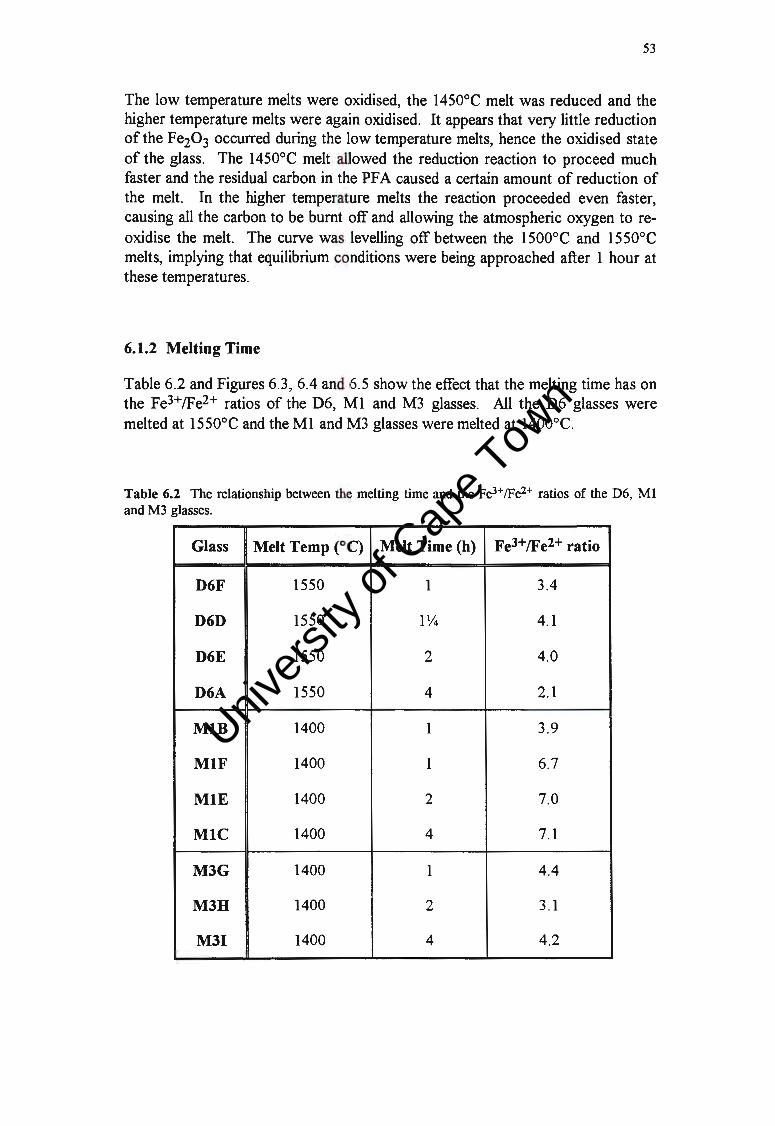
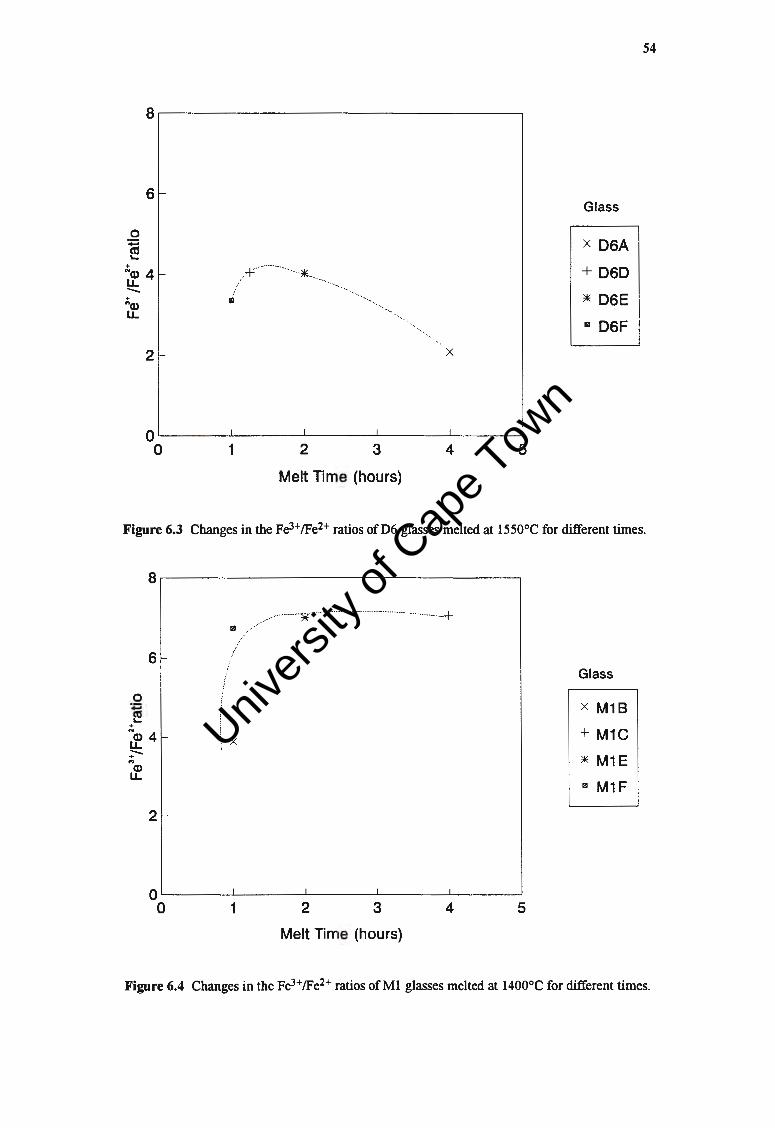
53
55
56
56
57
60
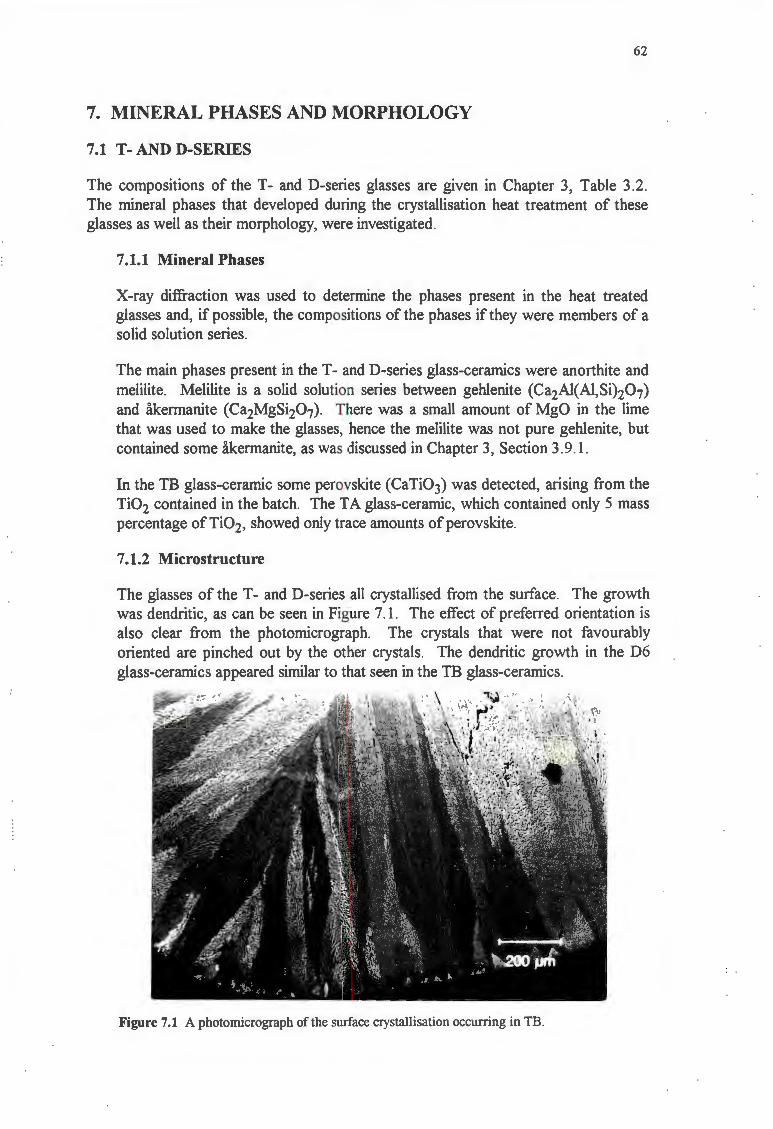
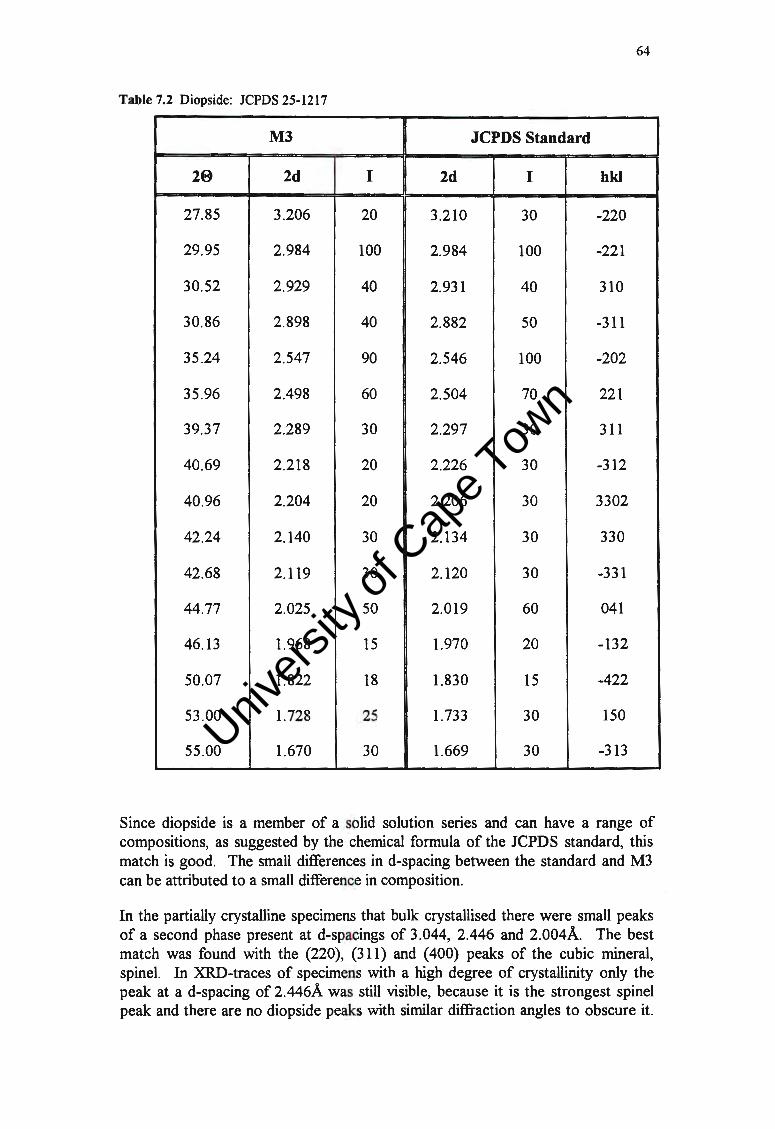
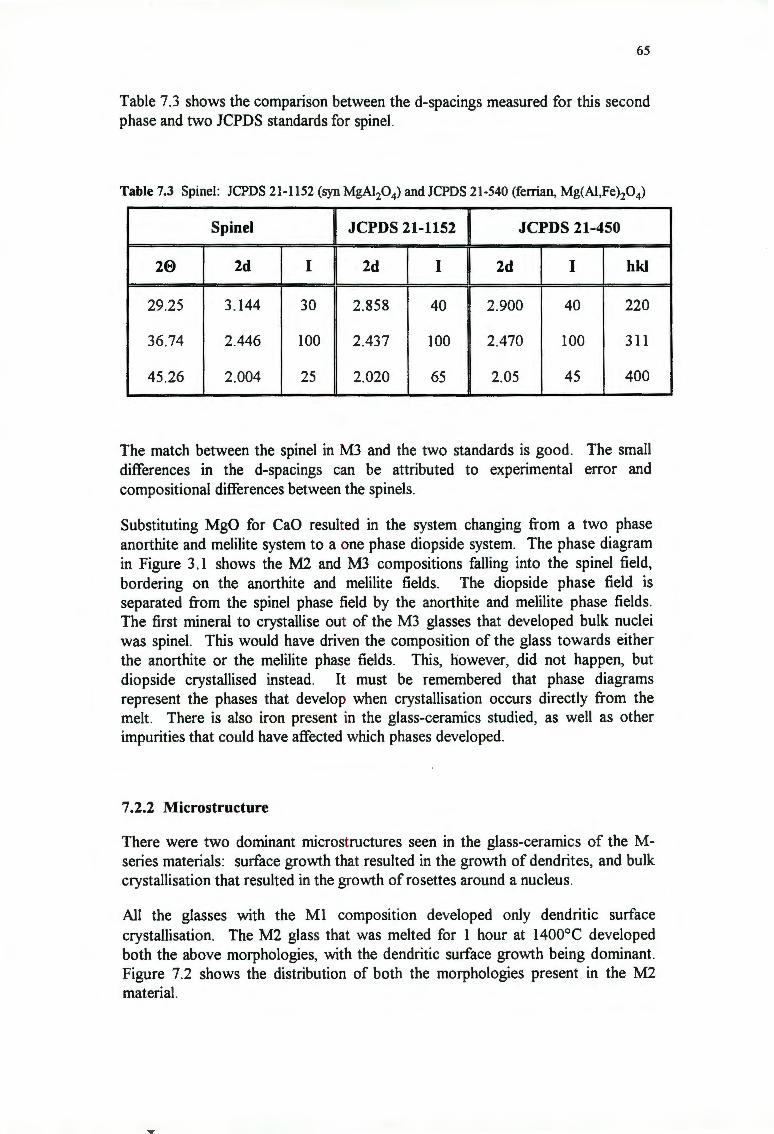
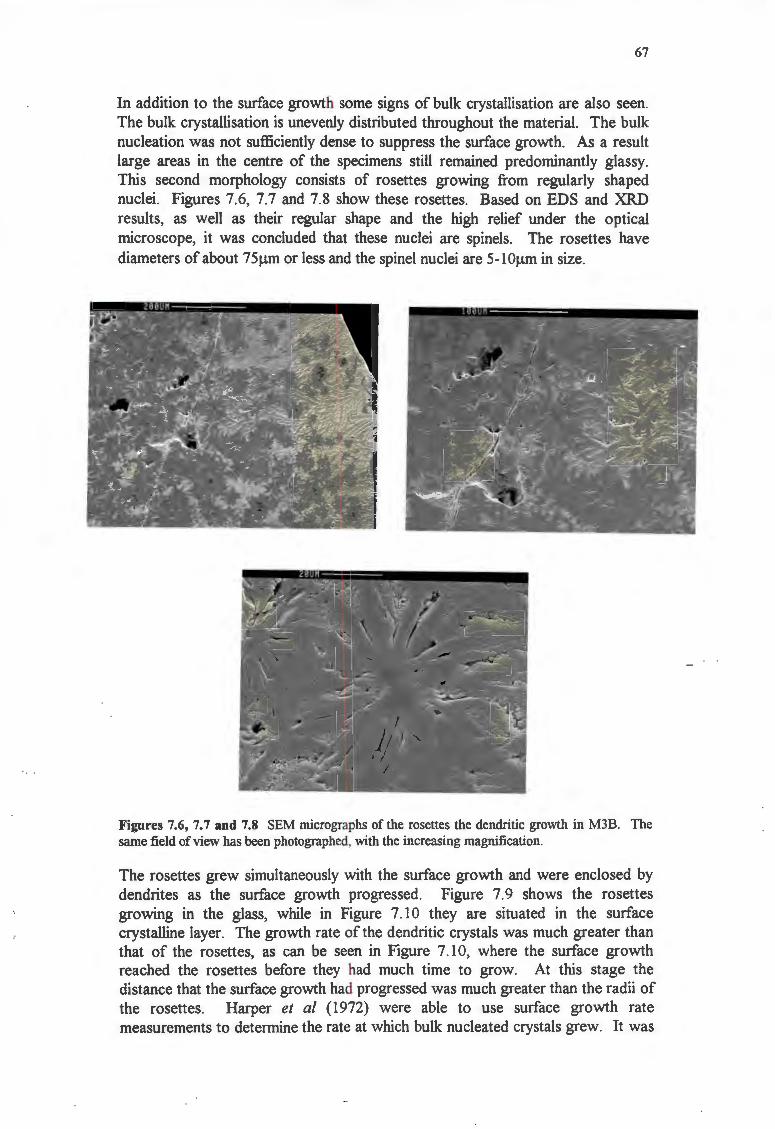
62
62
62
.62
63
63
63
65
71
72
75
79
Univers
ity of
Cap
e Tow
n
viii
APPENDIX 82
MINERALS OF INTEREST 82
1 Diopside 82
Structure 82
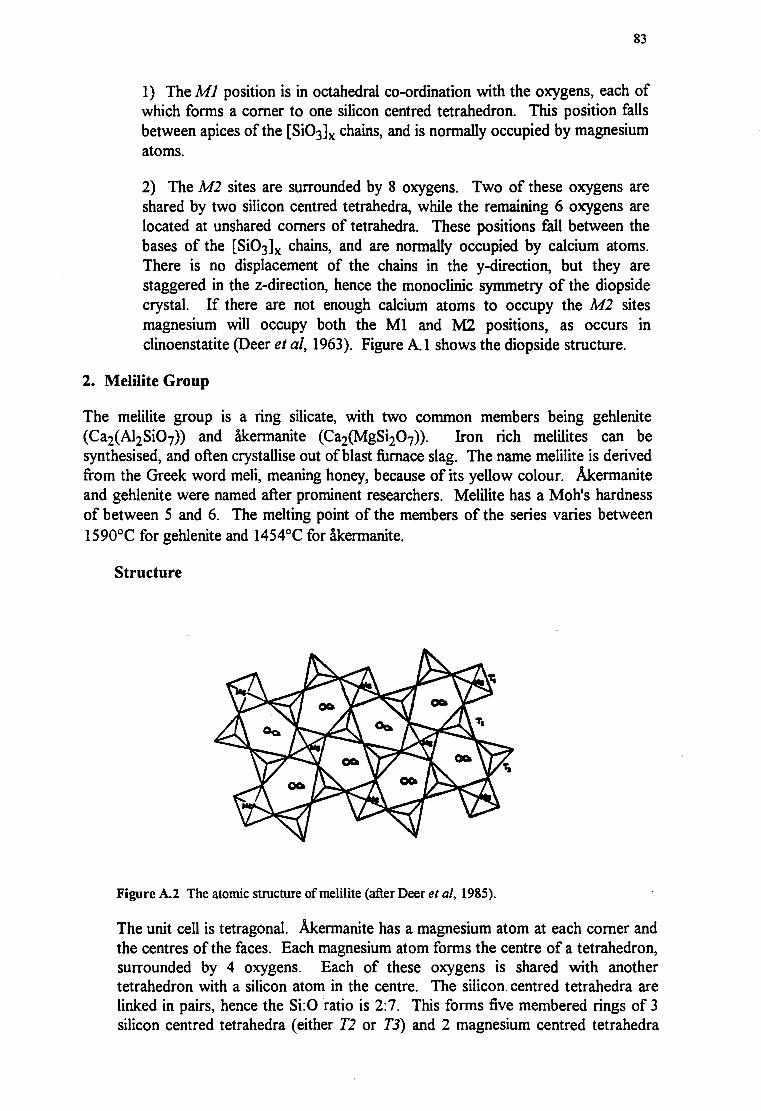
2. Melilite Group 83
Structure 83
3 Anorthite 84
Structure 84
4. Spin el 84
Structure 84
REFERENCES 85
Univers
ity of
Cap
e Tow
n
1
1. INTRODUCTION
Kirby (1987) used PFA with added lime to successfully make glass that could be drawn into fibres. This led to an investigation into the manufacture of glass-ceramics from the PF A. The reason that the PF A was considered as a raw material for glass manufacture is that it has been rapidly cooled from the molten state and thus has a large amount of glassy material in it. This glassy material lowers the energy requirements for melting.
There are three steps in the manufacture of a glass-ceramic. Firstly, the batch is melted and poured, then the glass undergoes an annealing and nucleation heat treatment, which is followed by a crystallisation heat treatment. Bulk nucleation is essential if surface growth is to be suppressed, therefore the effects that changes in the composition and the melting parameters had on the nucleation process were investigated. The effects of the composition and the melting parameters on the surface and bulk crystal growth rates were also studied. To do this, glass specimens were exposed to crystallisation heat treatments at different times and temperatures.
This work picks up from where Kirby (1991) left off. Initial work indicated that the system is very sensitive to composition and changes in the manufacturing process. As a result, the focus of the investigation centred around determining the effects of the composition of the glass and the glass making parameters on the crystallisation behaviour of the glass when heat treated.
Other aspects that were looked into include the effects that different nucleants and different nucleating heat treatment times and temperatures had on the nucleation behaviour of the glasses. The effect of composition on viscosity was looked at. A detailed investigation into these parameters was not carried out.
Univers
ity of
Cap
e Tow
n
2
2. LITERATURE REVIEW
2.1. NUCLEATION
In glass making nucleation and growth of crystals is usually avoided, since it causes unpredictable changes in the viscosity, which can affect the glass making machinery. Crystals may also introduce local stress concentrations due to the effect of differential contraction between the glass and the crystalline phases, creating defects in the glass. In glass-ceramic production, however, nucleation is required and the glass system may need to be manipulated to achieve the desired nucleation and crystal growth.
2.1.1. Homogeneous Nucleation
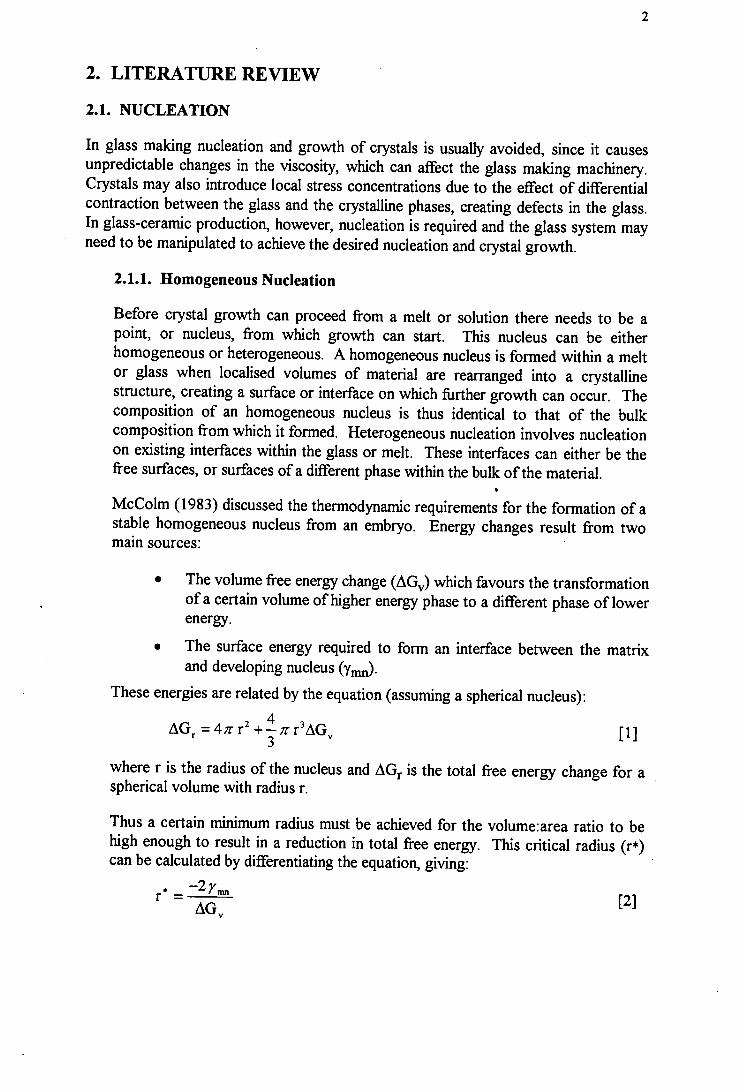
Before crystal growth can proceed from a melt or solution there needs to be a point, or nucleus, from which growth can start. This nucleus can be either homogeneous or heterogeneous. A homogeneous nucleus is formed within a melt or glass when localised volumes of material are rearranged into a crystalline structure, creating a surface or interface on which further growth can occur. The composition of an homogeneous nucleus is thus identical to that of the bulk composition from which it formed. Heterogeneous nucleation involves nucleation on existing interfaces within the glass or melt. These interfaces can either be the free surfaces, or surfaces of a different phase within the bulk of the material.
McColm (1983) discussed the thermodynamic requirements for the formation of a stable homogeneous nucleus from an embryo. Energy changes result from two mam sources:
• The volume free energy change (L'.\Gv) which favours the transformation of a certain volume of higher energy phase to a different phase of lower energy.
• The surface energy required to form an interface between the matrix and developing nucleus (y~.
These energies are related by the equation (assuming a spherical nucleus):
4 L'.\Gr =47rr2 +-Jrr3L'.\Gv
3 [1]
where r is the radius of the nucleus and L'.\Gr is the total free energy change for a spherical volume with radius r.
Thus a certain minimum radius must be achieved for the volume:area ratio to be high enough to result in a reduction in total free energy. This critical radius (r*) can be calculated by differentiating the equation, giving:
• -2rmn r =---'-L'.\Gv
[2]
Univers
ity of
Cap
e Tow
n
The critical free energy change for r* is therefore:
.1G • = 16Jr (y mn )3 r 3(.1GJ2
2.1.2. Heterogeneous Nucleation
3
[3]
Homogeneous nucleation, as described above, requires a large degree of undercooling and is thus very rare in silicate melts, because of their high viscosity at low temperatures. Heterogeneous nucleation' is nucleation that occurs preferentially at special sites (Hillig, 1964). This means that crystal growth will occur on an existing interface, which is more common than homogeneous nucleation. As a result, it is not necessary to assume a spherical nucleus because a 'shape factor' is introduced which modifies equation [3] to give:
where E> is the 'wetting angle', or the angle of contact between the nucleus and the surface.
Common heterogeneous nucleation sites include free surfaces and the surfaces of impurities or precipitates within the bulk of the material thus heterogeneous nucleation can be either surface nucleation or heterogeneous bulk nucleation.
i. Suiface nucleation
Uncontrolled devitrification of conventional glasses normally starts at the surface between the glass and the container wall or the atmosphere and grows inwards. Nucleation proceeds faster from the surface than by homogeneous nucleation in the bulk. This may be due to differences in composition between the surface and the interior and flaws or other heterogeneities on the surface of the glass, for example dust from the atmosphere (Partridge, 1987). This type of nucleation can be encouraged by creating inhomogeneities in the surface layer, such as by fine grinding, ion implantation and ion exchange (McMillan, 1982; Partridge, 1987).
Ion implantation is done using electric fields to draw ions from a stream of gaseous material and accelerating them so that they impinge on the glass surface. The ions loose energy on impact, preventing them from penetrating the substrate, so that only the surface layer is affected (Partridge, 1987).
Nucleation by ion exchange may be achieved in sodic glasses by immersing the glass in a bath of molten lithium salt. Lithium ions replace sodium ions in the surface layer. On heat treatment a high strength lithium-rich crystalline phase will form on the surface (Partridge, 1987).
Surface crystallisation can also be nucleated by the irradiation of glasses containing Au, Ag, Cu or Pt ions. High energy radiation only penetrates the surface layer, reducing the metal ions. Heat treatment causes the reduced
Univers
ity of
Cap
e Tow
n
4
ions to grow into nuclei, from which crystal growth occurs. These are known as photosensitive glasses (Partridge, 1987).
The effect of the atmosphere surrounding the samples during the nucleation heat treatment is important. An oxygen rich atmosphere enhances the formation of high strength surface layers, while a dry reducing atmosphere retards the development of nuclei, with fewer growth sites resulting in dispersed crystals. This led to the theory that surface nucleation may involve the recombination of oxygen with oxygen deficient sites at the surface of the glass. In Na20-Si02 glasses it was also found that the presence of water in the atmosphere increased nucleation and crystallisation rates. The reason for this is thought to be that the water molecules break thus decreasing the viscosity of the glass and enhancing diffusion (Partridge, 1987).
ii. Bulk Heterogeneous Nucleation
In this discussion the term nucleant or nucleating agent will refer to a substance, usually an oxide, that is added to the glass batch in order to promote the formation of nuclei, which provides the surface on which crystallisation can occur. The nucleus forms as a result of the action of the nucleant and has a different composition from the nucleant. The aim of bulk heterogeneous nucleation in the crystallisation of glass-ceramics is to achieve a uniform, fine grain distribution. This is done by creating closely spaced nuclei, which lower the activation energy for the start of crystal growth (McMillan, 1982). For silicate glass systems typical nucleants are oxides, such as Ti02 and Cr20 3 and non oxides such as CaF2.
The 'wetability' of the nucleus is important, as was shown by equation 4. The smaller the wetting angle, 0 (see equation 4), the greater the wetability and hence the greater the ability of the nucleus to nucleate growth. This angle is determined by the nature of the chemical bond and the degree of lattice misfit, or disregistry, between the nucleus and the matrix (Davies et al, 1970). A low misfit between planes with low Miller indices in the matrix and nucleus promotes growth on the nucleus.
The separation of the glass into two phases on cooling is a second process that has been observed. This is known as glass-in-glass separation. Emulsions are typical of this type of separation, with the phase having the higher surface tension forming droplets within the other phase (Veasey, 1973; Vogel and Gerth, 1964).
Glass-in-glass separation is an important mechanism for achieving bulk heterogeneous nucleation (Maier, 1988). Maier observed that some glasses of the MgO-AI20 3-Si02 (MAS) system showed separation of the glass into two distinct compositions prior to the formation of heterogeneous nuclei. The exact mechanism by which nuclei form after glass-in-glass separation and Veasey (1973) nucleation will be either:
Univers
ity of
Cap
e Tow
n
5
• homogeneous, with nuclei forming within one of the phases, or
• heterogeneous, with growth being nucleated by the surface between the two phases.
Small compositional variations, e.g., the addition of a small amount of AI203, reduces phase separation in silica glasses. Nucleating agents are believed to enhance phase separation.
2.1.3 Factors Affecting Nucleation
The melting history, including time, temperature and atmosphere can all affect the ability of a glass to nucleate and grow crystals. During melting there is a reorganisation and degradation of the silicate structures of the minerals that make up the batch. The melting conditions will therefore affect the extent to which the silicate structures are degraded and reorganised. The structure of the glass needs to be rearranged during nucleation and crystallisation, thus the initial structure of the glass affects these two processes. Other factors that are important are the type of crucible, furnace lining, volume of the melt and the type of nucleant used. It is important to note that all these factors work together, so although they will be discussed separately, they should be viewed as components of a larger system of parameters.
i. Glass Structure and Nucleation
The classical theories on glass structure give possible mechanisms by which homogeneous nuclei may form. The main theory is the Zachariasen-Warren network theory, (Vogel, 1971). According to the network theory, glass is relatively homogeneous, with a random structure, with the metal to oxygen bonds varying in length and angle. This randomness gives the glass a high entropy and hence internal energy. If this energy is too high devitrification occurs on cooling to a more stable, ordered crystalline structure. The theory also makes use of the concepts of network forming oxides, e.g. Si02, which try to form a closed network and network modifying oxides, e.g. Na20, which break up the network.
Lebedev and Porai-Koshits (quoted by Vogel, 1971) proposed the alternative crystallite theory that postulates that glass has a relatively highly ordered structure, consisting of micro crystallites of a size less than 1 Onm, surrounded by areas of disorder. The increase in viscosity on cooling is given as the reason for the arrest in the further growth of the crystallites (Vogel, 1971). This gives the glass a cellular structure (Vogel and Gerth, 1964). The crystallite model has however not been able to explain why these crystallites do not grow on reheating, causing the glass to devitrify in an uncontrolled manner (Goodman, 1986).
Goodman (1975, 1983, 1986, 1987) proposed an alternative to the crystallite theory, namely the strained mixed cluster model. The polymorphism generally displayed by most glass formers is the basis of this theory. It postulates that glass consists of strained clusters of at least two polymorphs
Univers
ity of
Cap
e Tow
n
6
of a major constituent of the glass. The crystallites form as the glass is quenched through the various stability fields of the different polymorphs and their relative amounts are determined by their relative free energies. The crystallites persist metastabily, since there is not sufficient time for them to transform to the lower temperature forms during the cooling. The clusters are non-epitaxial in relation to each other and hence interfacial strain exists between adjacent crystallites of different polymorphs.
The network and crystallite models can be regarded as boundary cases, with most glasses being a compromise between the two (Vogel, 1966). Glasses that tend towards the crystallite structure will be heterogeneous on a microscale, consisting of small areas that are precrystalline. This facilitates the formation of a uniform distribution of nuclei. On the other hand, glass with a homogeneous structure, after the network theory, is not easily nucleated. The statistical distribution of the ions means that only a few sites will deviate sufficiently from randomness to allow stable nuclei to develop. This will yield coarse grained crystals. In the crystallite model collision between adjacent crystallites of the same polymorph, which are favourably oriented, would result in the growth of embryonic nuclei. These nuclei would eventually reach a stable size. The decreasing surface to volume ratio would make further growth on the nuclei and ultimately crystallisation thermodynamically favourable. If the strained mixed cluster model is applied, there will not be a decrease in free energy with the growth of the clusters. The strain at the nonepitaxial interfaces between the crystallites of the different polymorphs will maintain a high degree of disorder. This entropy will keep the free energy high and the nuclei will not reach a stable state that supports growth.
ii. Nucleants
Chrome ore, titania and calcium fluoride are the most effective nucleants in the MCAS (MgO-CaO-Al20rSi02) system studied by Davies et al (1970). (However, CaF2 should be avoided, as it emits fumes, which would be problematic in large scale production.)
A mixture of nucleants is more effective than a single oxide. Davies et al (1970) proposed the theory that transition element ions do not work alone but that one ionic species buffers the other one by being preferentially oxidised. This allows the ions of the other element to remain at the critical ionisation level that promotes devitrification.
For most common nucleants used on their own oxidation occurs during the glass melting process. This is a problem, since it hinders the ability of the nucleating agents to form nuclei. Using an oxide that is in a more reduced · state does help. If Fe30 4 is substituted for Fe20 3 the holding time of the glass at the melting temperature may be almost doubled, since the former is in a more reduced state then the latter. Using an iron oxide-carbon combination also prevents oxidation, because the carbon has a reducing effect.
Reducing conditions during melting seem to result in nucleation with most types of nucleants. Under oxidising conditions the holding times must be very
Univers
ity of
Cap
e Tow
n
7
short for effective nucleation to occur, but lack of assimilation (complete melting and absorption of the batch into the melt) is a problem at these short holding times.
Kislitsyn et al (1980) found that increasing the amount of Cr20 3 in the slag glasses eliminated slumping during heat treatment. Along with iron oxides, the Cr20 3 forms spinets which constitute the nuclei on which pyroxenes grow.
Kirsch et al ( 1988) worked on the MgO-CaO-AI20rSi02 system, used in the manufacture of abrasion resistant glass ceramics from slags and dust. They found that certain nucleants or nucleant combinations resulted in different mineral assemblages. Spinet and enstatite crystallised together if either Cr203 or Cr203 + FeO were used. Just spinet crystallised if either Cr203 or Fe203 was used. Cordierite + cristobalite formed if Cr20 3 and Fe20 3 were used as nucleants. They found that the ratio as well as the amounts of the Cr3+, Fe3+ and Fe2+ ions where important parameters.
iii. Melting Atmosphere and the Oxidation State of the Glass
Na20-Ca0-Si02 glasses experimented with by Kumar and Rindone (1979) show the effect of the melting atmosphere of the glass. The glasses were melted for different times at 1320°C, either under vacuum conditions or under an atmosphere of dry oxygen. They found that the nucleation and growth rates and the diffusion coefficients increased with increased melting time under vacuum conditions. This suggests that the diffusing species had greater mobility in the glasses melted for longer times in a vacuum. Melting under an atmosphere of dry oxygen had the opposite effect, causing a decrease in both the growth rate and the diffusion coefficient with increased melting time. These trends were reversible if the atmosphere was changed during melting.
Chemical analyses of the glasses melted for varying times under different atmospheres gave no significant difference in the chemical compositions, thus it was not a compositional effect.
The explanation they proposed makes use of the theory that silicate glasses can either be enriched in oxygen or oxygen deficient. In these nonstoichiometric glasses some of the oxygen ions may be present in the form o-, instead of 02-. This would give a glass that is enriched in oxygen, while still being coulombically neutral. An oxygen depleted glass would have electron pairs substituting for some of the bridging oxygen ions, thus maintaining charge neutrality. The latter configuration gives rise to the oxygen deficiencies which form point defects with trapped electrons. Point defects are known to enhance the diffusion process and hence also the growth rate. They also provide nucleation sites, thus increasing the nucleation rate. The longer the glass is melted in a vacuum, the more the growth rate and diffusion coefficient increase. Melting under an oxygen atmosphere leads to a decrease in this defect concentration and hence lowers the nucleation rate, the diffusion coefficient and the crystal growth rate (Kumar and Rindone, 1979).
Univers
ity of
Cap
e Tow
n
8 I
This finding contradicts the theory of Partridge {1987) that the presence of oxygen in the atmosphere during the nucleation heat treatment step enhances the formation of surface nuclei, by the process of oxygen recombining with oxygen poor sites on the surface of the glass. (See Section 2.L2, i. Surface Nucleation.)
iv. Melting Time and Fe3+ !Fe2+ ratios
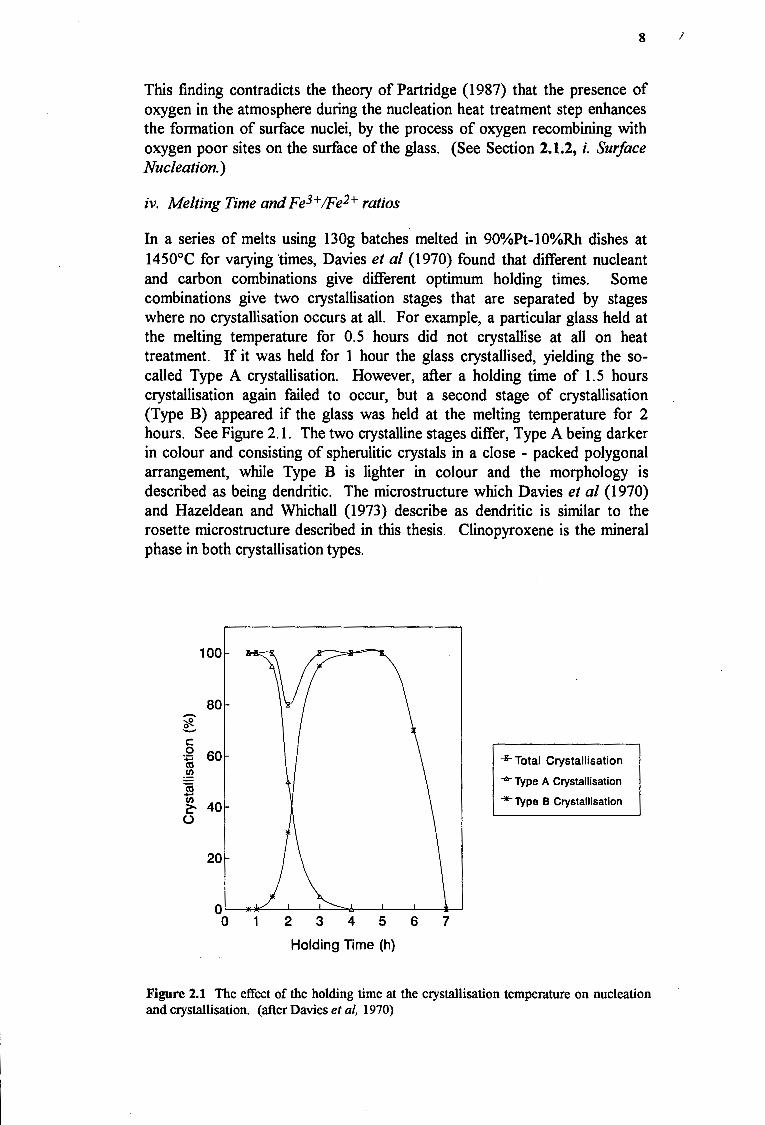
In a series of melts using 130g batches melted in 90%Pt-10%Rh dishes at 1450°C for varying times, Davies et al {1970) found that different nucleant and carbon combinations give different optimum holding times. Some combinations give two crystallisation stages that are separated by stages where no crystallisation occurs at all. For example, a particular glass held at the melting temperature for 0.5 hours did not crystallise at all on heat treatment. If it was held for 1 hour the glass crystallised, yielding the socalled Type A crystallisation. However, after a holding time of 1.5 hours crystallisation again failed to occur, but a second stage of crystallisation (Type B) appeared if the glass was held at the melting temperature for 2 hours. See Figure 2.1. The two crystalline stages differ, Type A being darker in colour and consisting of spherulitic crystals in a close - packed polygonal arrangement, while Type B is lighter in colour and the morphology is described as being dendritic. The microstructure which Davies et al (1970) and Hazeldean and Whichall {1973) describe as dendritic is similar to the rosette microstructure described in this thesis. Clinopyroxene is the mineral phase in both crystallisation types.
100
80 -* -c: 0 60 :;::::; +Total Crystallisation cu .!!!
-..:.- Type A Crystallisation ~ (/)
40 "*- Type B Crystallisation ~
(..')
20
0'--4'-ll!<'---'-~'---';:,,,.,i,..~-'---'~---~
0 2 3 4 5 6 7
Holding Time (h}
Figure 2.1 The effect of the holding time at the crystallisation temperature on nucleation and crystallisation. (after Davies et al, 1970)
Univers
ity of
Cap
e Tow
n
9
Hazeldean and Wichall (1973) in a continuation of the work by Davies et al found that Type A crystallisation is nucleated by glass-in-glass separation. The nucleation mode of Type B is uncertain, with Davies et al proposing that growth proceeds inwards from the surface and Hazeldean and Wichall postulating that nucleation could be homogeneous. The intermediate glassy stage marks the diminishing of Type A crystallisation and the start of Type B crystallisation. An even longer holding time results in a total lack of crystallisation on heat treatment. Generally there is a progression of: glass => early crystallisation (Type A) => glass => late crystallisation (Type B) => glass. Times vary with the nucleants used, but under the particular experimental conditions used, it appears that if a glass is held for longer than 5 hours at the melting temperature the final glass stage will have been reached, and the glass will no longer crystallise when heat treated.
These effects are not as noticeable when a large batch is melted, such as on a pilot plant scale. The larger volume to surface ratio of the bigger melt results in less oxidation of the glass at the glass-atmosphere interface. Type A crystallisation persists after extended melting times of up to 72 hours, if the batch contains carbon (Hazeldean and Wichall, 1973).
Hazeldean and Wichall (1973) found that 44% of the Fe20 3 that was added to the glass batches they investigated, was reduced to Fe2+ during the first half an hour of melting, until the oxidation state reached a value close to the equilibrium for the melting temperature. The actual oxidation state was slightly more reduced than that predicted, which they ascribed to inherent reducing properties of the slag. After about 0.5 hours the reaction reversed and the melt became progressively more oxidised as the melting time was increased, approaching the equilibrium oxidation state for the melting temperature. They found a ratio of Fe3+:Fe2+ of 3: 1 after about 24 hours at the melting temperature. Four factors were identified as being of importance with respect to nucleation, namely the total weight percentage of iron and of sulphur and their respective oxidation states.
Davies et al (1970) suggest that the problem of the oxidation of the nucleants during melting can be solved by using plumbago lined crucibles, or by having a controlled atmosphere with a low oxygen partial pressure. Under these conditions chrome ore or titania nucleants can be used in small proportions (2 to 3 mass % ), irrespective of the holding time. Another way of reducing the oxidation effect is using an oxide that is in a reduced state. If Fe30 4 is substituted for Fe20 3 the holding time may be almost doubled, since the former is in a more reduced state then the latter. Melting larger volumes of · glass also reduces the oxidation effect, because the larger the volume of the melt, the larger the ratio of volume to surface in contact with the atmosphere, hence the smaller the relative area in contact with the atmosphere.
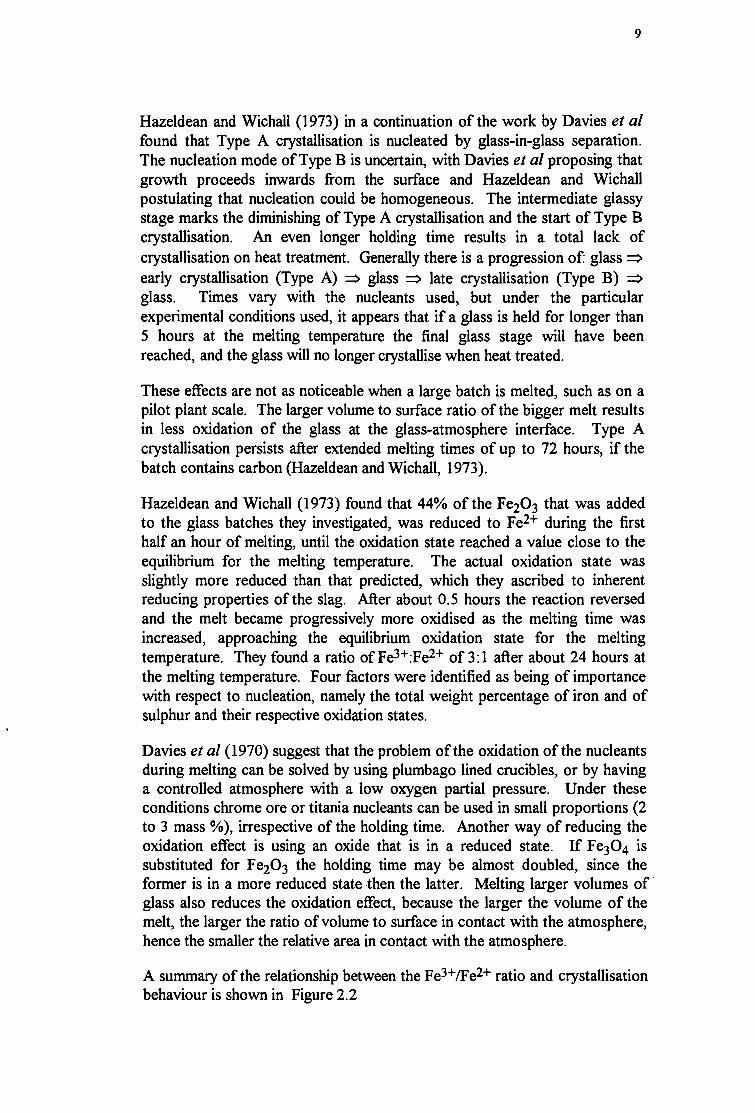
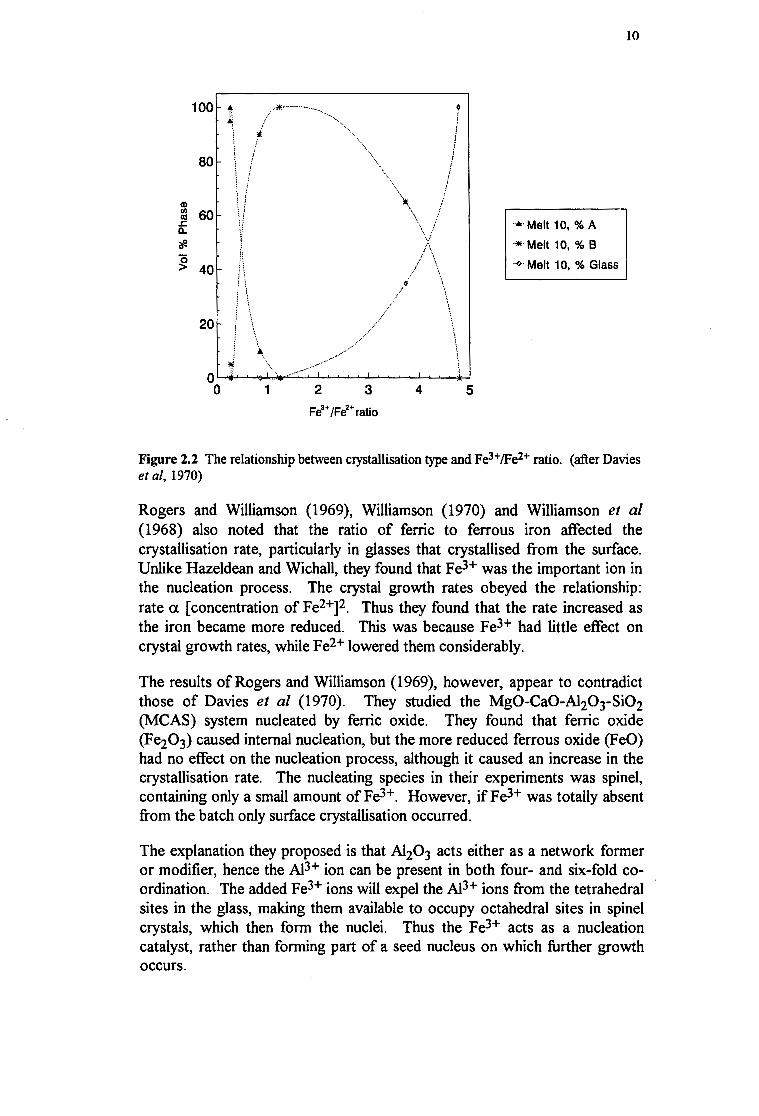
A summary of the relationship between the Fe3+fFe2+ ratio and crystallisation behaviour is shown in Figure 2.2
Univers
ity of
Cap
e Tow
n
<D
100,_"'
;;\
80
gj 60 .r:::. a.. If.
g 40
20
~ 0 -0
\I
! i i
\
*•···-·-···--·--.• ·· ....
· .... · ...
..... ··· ......
/
; ........................ ·····~·· I
1 2 3
Fe3+ /Fe2+ ratio
......
\\ ! ·. / \.,/
/
/\ I \
\
\
i
!
r i !
\
I
4
\ \ \ \
5
·•·Melt 10, % A
·*·Melt 10, % B
·-<>· Melt 10, % Glass
IO
Figure 2.2 The relationship between crystallisation type and Fe3+/Fe2+ ratio. (after Davies et al, 1970)
Rogers and Williamson (1969), Williamson (1970) and Williamson et al (1968) also noted that the ratio of ferric to ferrous iron affected the crystallisation rate, particularly in glasses that crystallised from the surface. Unlike Hazeldean and Wichall, they found that Fe3+ was the important ion in the nucleation process. The crystal growth rates obeyed the relationship: rate a. [concentration of F e2+]2. Thus they found that the rate increased as the iron became more reduced. This was because Fe3+ had little effect on crystal growth rates, while Fe2+ lowered them considerably.
The results of Rogers and Williamson (1969), however, appear to contradict those of Davies et al (1970). They studied the Mg0-CaO-A120rSi02 (MCAS) system nucleated by ferric oxide. They found that ferric oxide (Fe20 3) caused internal nucleation, but the more reduced ferrous oxide (FeO) had no effect on the nucleation process, although it caused an increase in the crystallisation rate. The nucleating species in their experiments was spinel, containing only a small amount ofFe3+. However, ifFe3+ was totally absent from the batch only surface crystallisation occurred.
The explanation they proposed is that A120 3 acts either as a network former or modifier, hence the AI3+ ion can be present in both four- and six-fold coordination. The added Fe3+ ions will expel the AI3+ ions from the tetrahedral sites in the glass, making them available to occupy octahedral sites in spinel crystals, which then form the nuclei. Thus the Fe3+ acts as a nucleation catalyst, rather than forming part of a seed nucleus on which further growth occurs.
Univers
ity of
Cap
e Tow
n
11
2.2 CRYSTALLISATION AND NUCLEATION RELATIONSHIP
Crystallisation of a glass during heat treatment proceeds in an unpredictable manner if control is not exercised over the nucleating process. In the production of glassceramics the relationship between nucleation and crystallisation needs to be understood so that heat treatment schedules can be calculated that will give the optimum properties to the final product.
2.2.1 Rate of Nucleus Formation
Hing and McMillan, {1973), pointed out that there is a temperature at which the homogeneous nucleation rate is maximised. The rate of nucleation, as discussed by Rogers and Williamson {1969), is proportional to two exponential terms, one being a thermodynamic barrier and the other a kinetic barrier.
I = [nkTJ[exp(-Ky3
)][AGA] h AGv 2 kT kT
[5]
According to equation 5, the thermodynamic barrier (Ky3/AGv2kT) depends on y, the nucleus/matrix interfacial energy; K, a factor depending on the nucleus shape and AGv, the free energy difference per volume of nucleus and matrix. The kinetic barrier (AG A/kT) depends on AG A• the activation energy required for movement across the matrix/nucleus interface. Other variables are: n, the molecular density of the nucleating species; T, the absolute temperature; k, the Boltzmann constant and h, Planck's constant.
This leads to the characteristic bell-shaped Tammann curve for nucleation rates, (Hing and McMillan, 1973). This is shown in Figure 1.3. Starting at a temperature just above the nucleation temperature, a drop in temperature increases the degree of undercooling and the behaviour is governed by the thermodynamic term in equation [5]. The free energy of the nucleus decreases and the matrix structure becomes unstable relative to the nucleus structure, resulting in an increase in the nucleation rate. The rate continues increasing with decreasing temperature, until the optimum nucleation temperature is reached, where the rate is a maximum. If a further drop in temperature occurs the kinetic term will become increasingly important. Now, a drop in the temperature makes it increasingly difficult for atoms or ions to achieve the activation energy required to cross the matrix/nucleus barrier and the nucleation rate drops off
2.2.2 Interaction between nucleation and crystallisation rates
The crystallisation rate is governed by a similar equation, but the optimum temperatures for nucleation and for crystallisation differ. The rates for nucleation and crystallisation do not necessarily drop off rapidly as the temperature deviates from the optimum. There is often a considerable temperature range within which both nucleation and crystallisation will proceed rapidly. If the optima of the two curves are very close and there is a large temperature range for each process, then the curves will overlap.
Univers
ity of
Cap
e Tow
n
12
(a) (b)
Nucleation Nucleation Growth
Q) Cl> - -as cu a: a:
T1 T2 T3 T1 T2 T3 T4
Temperature Temperature
Figure 2.3 Tamman curves for nucleation and crystal growth, after McColm (1983).
For a fine grained micro structure to develop a high nucleus density must be achieved. The crystals that grow on these nuclei will therefore impinge on each other before they have grown too large, preventing their further growth and the coarsening of the microstructure. For this to be achieved, a Tamman curve distribution as seen in Figure 2.3 (b) is necessary, where the curves are widely separated. Nucleation is carried out at a temperature just below T2. When sufficient nuclei have been formed, the temperature is raised to the optimum crystallisation temperature (above T3) and rapid growth occurs on the nuclei. On the other hand, a large overlap, as seen in Figure 2.3 (a), results in unrestricted growth on the nuclei as they form, resulting in a coarse grained microstructure.
2.3 CRYSTALLISATION
2.3.1 Types of Crystallisation
i. Epitaxial growth
The concept of epitaxial growth is applicable to the growth of a mineral on a nucleus that consists of a different mineral phase with a different structure, in other words, heterogeneous nucleation. The classic explanation of the relationship between the two phases in epitaxial growth is given by McMillan {1969). It is described as the growth of one phase on another, where the two phases have a close and fixed relative orientation with respect to the spacing of their low index planes.
Epitaxial growth is not easily observed in glass-ceramics because of the small scale at which it occurs. The first stage in the manufacture of a glass-ceramic is a low temperature nucleation heat treatment, which gives very fine crystallites, or nuclei, which are closely spaced and may even be in contact with one another. As a result, subsequent epitaxial growth that occurs on
Univers
ity of
Cap
e Tow
n
13
these nuclei during the crystallisation heat treatment step ts not easily observed, even under a transmitting electron microscope.
To solve this problem, Headley and Loehman (1984) used a high temperature nucleation method that resulted in coarsening of the nuclei, so that they were observable under the transmission electron microscope. These nuclei, or crystallites, were coarse enough for the nucleated growth of other phases to be seen occurring on them. The observations made did not support the popular view on the relationship between the two phases, but instead suggested that the silica tetrahedra of the two phases had a common alignment.
Hazeldean and Wichall (1973) proposed a totally different mechanism, based on their work on slag glass-ceramics. They proposed that epitaxial growth originated by a process of polycrystalline growth on the smooth droplet surface in phase separated systems, causing the surface to become angular as crystal facets developed. This would then provide the necessary crystal faces on which epitaxial growth of a crystalline phase could occur.
ii. Surface Growth
a. Morphology
Where growth occurs form the interface between the glass and the atmosphere or crucible wall, the crystal morphology may be fibrous with a strong preferential orientation normal to the specimen surface (Carpenter et al, 1986). These fibres may be acicular crystals (thin, needle-like crystals) which grow inwards from the surface, as observed by Partridge (1987), or dendritic, if the crystals branch as they grow away from the surface.
Dendritic growth reflects the crystallisation temperature. Scherer and Uhlmann {1976) observed that the finer the dendrites and the closer their spacing, the lower the temperature at which crystallisation occurred. In the soda - silica glasses they studied they also observed that hemispheres may be nucleated at the surface and grow inwards if the crystallisation temperature is low (720°C). (The investigators carried out most of the crystallisation heat treatments at temperatures above 750°C.)
b. Thermal Expansion Coefficients
Layers of surface crystals are usually coarse grained and mechanically weak. Due to differences in thermal expansion coefficients between the crystalline layer and the glassy interior, the crystalline layer often flakes off during cooling (Topping, 1976). However, if surface crystallisation is carefully controlled it can be used to improve the mechanical strength. This process takes advantage of the differences in thermal expansion of the crystalline surface and the glassy interior by putting the surface layer into compression. This is the same principle by which glass is chemically
Univers
ity of
Cap
e Tow
n
14
or thermally toughened and serves to inhibit crack growth (McMillan, 1982).
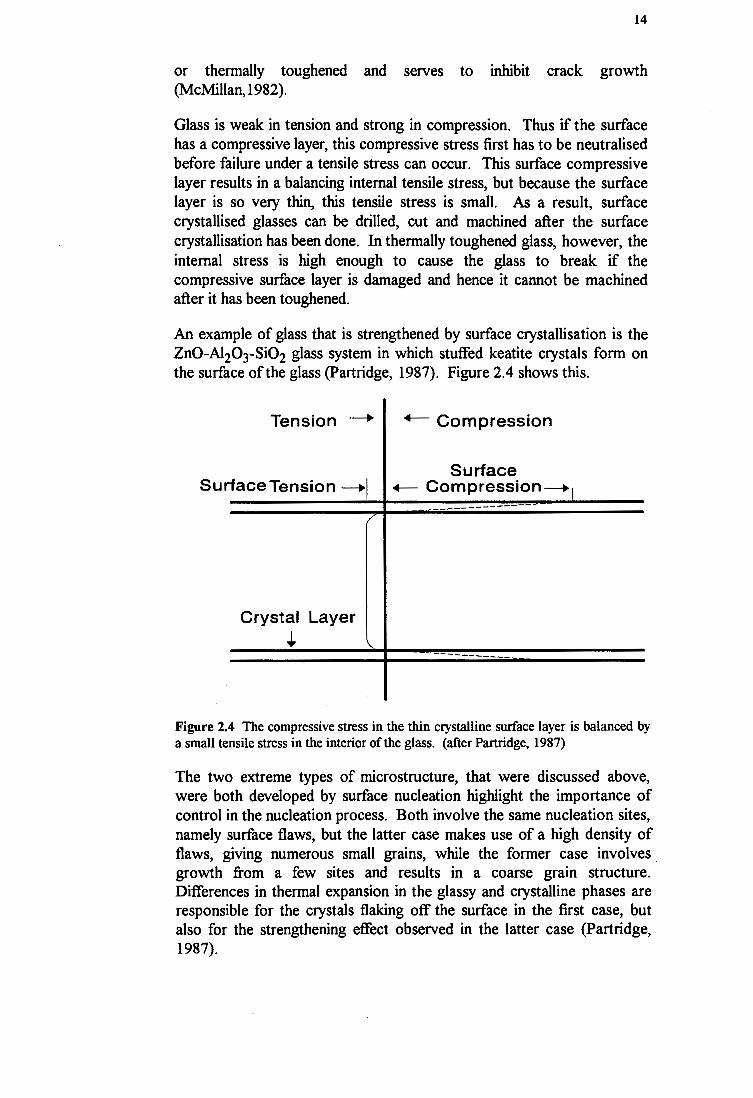
Glass is weak in tension and strong in compression. Thus if the surface has a compressive layer, this compressive stress first has to be neutralised before failure under a tensile stress can occur. This surface compressive layer results in a balancing internal tensile stress, but because the surface layer is so very thin, this tensile stress is small. As a result, surface crystallised glasses can be drilled, cut and machined after the surface crystallisation has been done. In thermally toughened glass, however, the internal stress is high enough to cause the glass to break if the compressive surface layer is damaged and hence it cannot be machined after it has been toughened.
An example of glass that is strengthened by surface crystallisation is the ZnO-A120 3-Si02 glass system in which stuffed keatite crystals form on the surface of the glass (Partridge, 1987). Figure 2.4 shows this.
Figure 2.4 The compressive stress in the thin crystalline surface layer is balanced by a small tensile stress in the interior of the glass. (after Partridge, 1987)
The two extreme types of microstructure, that were discussed above, were both developed by surface nucleation highlight the importance of control in the nucleation process. Both involve the same nucleation sites, namely surface flaws, but the latter case makes use of a high density of flaws, giving numerous small grains, while the former case involves growth from a few sites and results in a coarse grain structure. Differences in thermal expansion in the glassy and crystalline phases are responsible for the crystals flaking off the surface in the first case, but also for the strengthening effect observed in the latter case (Partridge, 1987).
Univers
ity of
Cap
e Tow
n
15
c. Surface Flaws
The surface crystallised layer also results in the modification of surface flaws, limiting their severity. An example is the strengthening of Li20-Si02 glasses by the formation of a lithium disilicate surface layer. Glasses in the CaO-AI20 3 system may also be strengthened by encapsulation of surface flaws. The fine grained surface microstructure blunts the surface flaws, limiting their potential to nucleate cracks (Partridge, 1987).
d. Thickness of the Surface Layers
The thickness of the crystalline layer is important. If it is too thin, it will not satisfactorily resist surface abrasion, while if it is too thick differences in thermal expansion between the interior and the surface will cause disintegration of the glass during cooling. Depending on the glass composition, the optimum thickness for improved mechanical strength and scratch resistance is between 50-IOOµm (Partridge, 1987). If surface growth is allowed to progress too far and the crystallising fronts meet at the centre of the material, a mechanically weak plane results due to the effect of the growth orientation (Partridge, 1987).
iii. Bulk Crystallisation
a. Spherulites and Dendrites
Spherulites and dendrites are two crystal morphologies that grow under similar circumstances, but have very different appearances. They are both made up of crystalline fibres that are separated by areas of glass. These fibres are often fine and twisted. Both spherulites and dendrites form when the composition of the first phase to crystallise is very different from the bulk composition (Barry, 1979; Lewis et al, 1979). Spherulitic and dendritic growth are competitive and the two morphologies will never occur alongside one another.
A spherulite consists of a number of crystalline fibres that grow from a single point outwards, until the growth eventually becomes radial. It occurs at high undercoolings, where nucleation and crystallisation are rapid, but diffusion is slow and becomes the rate controlling process. Since the composition of the fibres and the glass differ, the fibres will grow away from the areas that are depleted in the elements preferred by the crystallising phase. Growth will therefore not occur on the flat surfaces of fibres, perpendicular to their length, because the necessary elements are depleted and the diffusion rate is very slow. Instead, growth will occur at the ends of the fibres, or from protuberances that may develop along their length. The crystallographic orientation and direction of growth of the branches are determined by the interference of the diffusion fields of adjacent branches rather than by twinning laws or crystallography. They usually form at low angles to the main fibre. The lower the crystallisation heat treatment temperature, the finer the spacing
Univers
ity of
Cap
e Tow
n
16
between the fibres and branches, since diffusion does not readily occur over long distances at low temperatures (Barry, 1979).
One type of spherulitic growth that has been observed results in an 'opensheaf morphology'. According to Carpenter et al (1986), if the impingement of adjacent developing spherulites causes a halt in spherulite growth these incomplete spherulites will form what they termed and open-sheaf morphology. They observed a second, similar morphology, for which they proposed the term 'open-leaf. This morphology develops if the elements required to crystallise the relevant phase become depleted and further growth is therefore halted.
Dendritic growth occurs at higher temperatures, or smaller degrees of undercooling, than spherulitic growth. The fibres are usually straight and branched and they are often faceted. Branching occurs at crystallographically favourable angles to the main fibre and sub-branches may grow parallel to the original fibre.
According to Barry (1979) the anisotropic growth is due to:
• a matrix that is less depleted in components at the tips of the fibres than near the flat surfaces,
• anisotropic growth characteristics of the mineral and • selective adsorption of impurities on certain crystal faces.
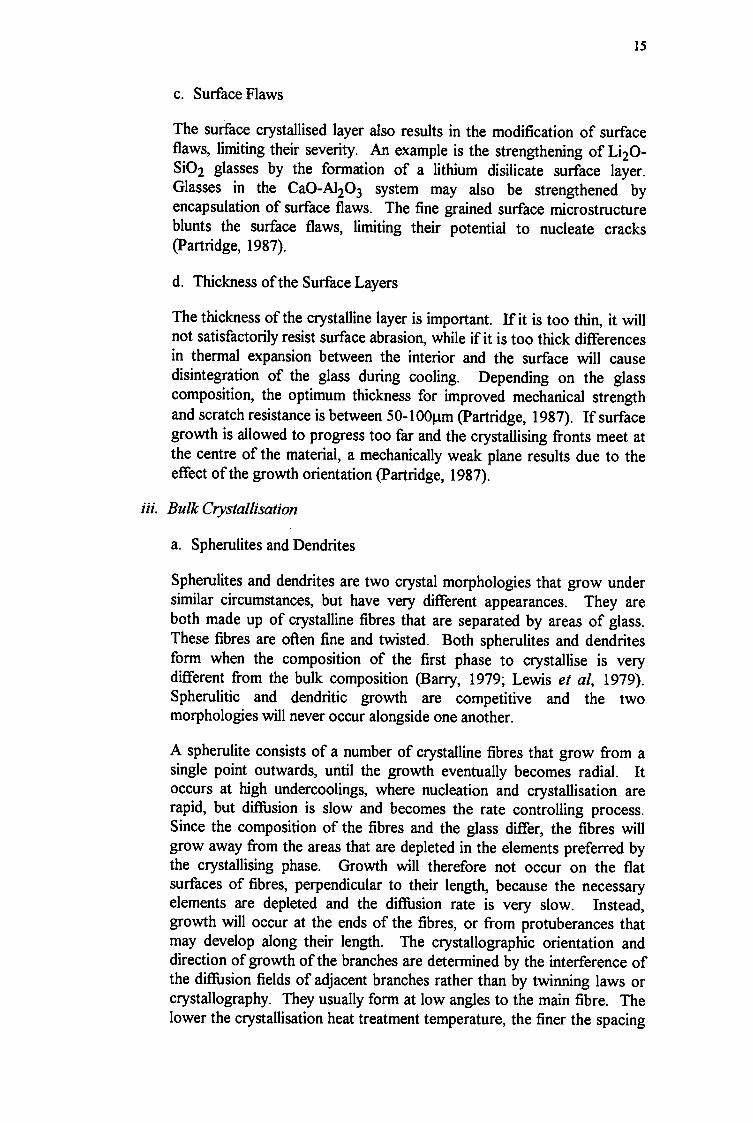
Dendritic growth in glass-ceramics may occur as thin plates that grow preferentially along a certain crystallographic direction, resulting in faceted crystals (Lewis et al, 1979). The arms of the dendrites consist of secondary twins growing off the facets of the primary plates. These twins are coherent and hence have a low activation energy. Lateral growth of the plates is suppressed because of the anisotropic growth rate of the phase concerned and the preferential growth of the secondary twins.
Figure 2.5 An example of a dendrite. (after Lewis et al, 1979)
Univers
ity of
Cap
e Tow
n
17
b. Rosettes
Rosette growth is nucleated by phase separation. It is the growth of large numbers of conical single crystals away from a nucleus. The effect of this is a series of crystals radiating from a point, each crystal consisting of a number of parallel planes. As the crystals grow further from the centre they thicken to give a conical shape. This occurs by the addition of successive layers of crystal planes that are nucleated at 're-entrant' points at the crystal-matrix interface (Lewis et al, 1979).
Figure 2.6 The growth of a rosette. The conical shape is achieved by the addition of parallel plates.
c. Single crystals
Lewis et al (1979) found that lithium-silicate glasses containing phosphorous tend to devitrify by the growth of individual single crystals with elliptical cross sections. They grow without branching until they are impinged upon by adjacent crystals. This type of growth is more isotropic than the other morphologies.
d. Recrystallisation
Recrystallisation occurs when the existing crystalline phase is metastable and a different phase crystallises at its expense. Both Rogers and Williamson (1969) and IIlavac (1983) noted that this occurs in glasses of · the MCAS system. After a short heat treatment at an intermediate temperature diopside crystallises, but when these glass-ceramics are heat treated for long times at elevated temperatures recrystallisation occurs and melilite grows at the expense of diopside.
Univers
ity of
Cap
e Tow
n
18
2.3.2 Factors Affecting Growth Rates
The rate of growth is zero at the liquidus temperature, increases with decreasing temperature until it reaches a maximum and then decreases again to zero. Above the liquidus temperature the growth rate is negative, as shown by Figure 2. 7 (Partridge, 1987).
Liquid us -~==~-+--= .. =·····=····-:::.:···:::::·····=····-····-····-· Temperature
6 0 -Q) .... ::::J ca .... Q) a. E ~
Rate of crystal growth (mm/h)
Figure 2. 7 The relationship between the crystal growth rate and temperature.
The growth rate is dependant on two factors, the rate at which the irregular glass structure can be rearranged into the periodic crystal lattice and the rate at which the energy released during crystallisation can be transported away from the crystal front. These are both diffusion controlled process and therefore changes in viscosity will affect the growth rate. If the crystal growth rate is 1 µmis of less, then the heat flow considerations are not important, because the heat can be removed without it affecting the crystal growth process. In systems where the crystal growth rate is very high, for example up to lOµm/s, the temperature gradients at the glass-crystal interface are very steep and the difficulty of removing the heat from the growth front may affect the growth rate (Partridge, 1987).
Swift (1947), quoted by Partridge (1987), stated that the surface crystallisation rate is constant until the crystallisation fronts from the opposite sides meet. Thus the growth rate is linear under isothermal conditions.
i. Composition and Viscosity
The types of transition metal ions and their state of oxidation appear to exert a considerable effect on the crystal growth rate of a glass. The Fe3+ ion has little effect, but the F e2+ ion causes an increase in the growth rate, proportional to the square of the concentration (Williamson, 1970; Rogers and Williamson, 1969). In glasses that crystallise from the surface it was
Univers
ity of
Cap
e Tow
n
19
found that the advancing crystal front is depleted in iron, while the glass at the glass-crystal interface is enriched in iron, lowering the viscosity and allowing for the increased crystal growth rates. Williamson et al (1968) found that even a few mass percentage offe3+ lowers the viscosity only slightly over the crystallisation heat treatment temperature range that they used. Equivalent amounts of Fe2+ cause a large drop in viscosity, probably because the large Fe2+ ion acts as a network modifier, causing the breaking of Si-0-Si bonds in the glass. Chromium ions have the opposite effect on the crystal growth rate. Cr3+ and cr6+ result in a large reduction in growth rate, while Cr2+ has a less marked effect. They also found that Cr20 3 caused an increase in viscosity in silicate glasses.
Williamson et al (1968) found that MgO lowers the viscosity of glass and also has an accelerating effect on the crystallisation rate.
Kumar and Rindone (1979), in their study of Nai-Ca0-Si02 glasses, discovered that the melting atmosphere affects the oxygen concentration of a glass. The lower the oxygen concentration, the higher the defect concentration and hence the higher the diffusion coefficient and the crystal growth rate. This is similar to the effect that the melting atmosphere has on nucleation, discussed in section 2.1.3 .iii.
ii. Jmmiscibility
Immiscibility affects the viscosity, causing it to increase as phase separation occurs. This does not necessarily imply that the crystallisation rate, which is usually diffusion controlled, would decrease. The diffusion rate and hence the growth rate, is not related to the bulk viscosity, but rather to the respective properties of the different compositions that separate out. Scherer and Uhlmann (1976) investigated this relationship with respect to surface nucleated glasses from the Na20-Si02 system. They found that the growth rate is not affected in any way by the immiscibility observed. The phase separation introduces 'channels of high mobility', where the composition is brought very close to that of the crystallising phase. Thus the increase in diffusion coefficient of the bulk material is balanced by a reduction in the diffusion distance.
iii. Structure of the Crystallising Mineral
Crystallisation may be anisotropic if the crystallising phase is an anisotropic mineral with a layered or chain structure (Lewis et al, 1979). This is termed the faceting tendency and it gives a microstructure consisting of elongated crystals.
Isotropic minerals will be more likely to yield an equiaxed microstructure. The morphologies that result from the growth of nonfaceting interfaces are also likely to be more simple than the complex morphologies of faceting minerals. Thus the growth rate will be greater in one direction for anisotropic minerals and equal in all directions in an isotropic mineral.
Univers
ity of
Cap
e Tow
n
21
Each batch was weighed out and put into a jar and shaken, sieved and shaken again, to ensure homogeneity of the batch.
3.2 COMPOSITION OF GLASSES
The T- and D-series glasses were made using the basic D6 composition. The M-series glasses had the basic D6 composition, but some of the CaO was replaced by an equal mass percentage of MgO. The nucleants in the D- and M-series glasses were Fe20 3 and Cr203 and in the T-series Ti02. The full batch composition of each glass is given in Table 3.2. Figure 3.1 shows the compositions of glasses D6 and D4 (Kirby, 1991) using the CaO-A120 3-Si02 (CAS) phase diagram and the approximate compositions of M2 and M3 using the 10 % Mg0-CaO-A120 3-Si02 (MCAS) diagram.
Table 3.2 The batch composition of the glasses made (in g)
D6 DA DB TA TB Ml M2
PFA 26.44 26.44 26.44 26.44 26.44 26.44 26.44
Kaolin 23.49 23.49 23.49 23.49 23.49 23.49 23.49
Si02 2.53 2.53 2.53 2.53 2.53 2.53 2.53
Ca(OH)i 30.71 30.71 30.71 30.71 30.71 25.79 20.84
MgC03 5.97 11.93
Fe20 3 1.33 0.66 2.66 1.33 1.33
Cr20 3 1.33 0.66 2.66 1.33 1.33
Ti02 3.52 6.99
Table 3.3 Major oxides in glasses made (in mass percentage).
Glass Si02 Al20 3 Cao MgO MgO:CaO c
PFA 54.2 31.8 4.6 1.2
D&T 40.5 25.7 33.8 0 0
Ml 40.1 25.5 29.9 4.5 0.15
M2 40.6 25.8 24.8 8.8 0.35
M2C 40.6 25.8 24.8 8.8 0.35 5
M3 41.1 26.1 19.7 13.1 0.66
M3
26.44
23.49
2.53
15.98
17.89
1.33
1.33
Univers
ity of
Cap
e Tow
n
(a)
Cao
(b)
Si02 90% MgO 10%
~ ~
1 · Ca2Si04 2 Gehlenite 3 Anorthite 4 Pseudowollastonite 5 Tridymite s Cristobalite 1 Mullite s Corundum 9 . CaAl1201e 1 o CaA140 7 11 CaAl2Q4
1 2 Ca12Al14033 13 Ca3Al206 14 lime 15 Ca3Si05 1 s Rankinite 11 Two Liquids
Figure 3.1 (a) The CAS phase diagram with the compositions of glasses D6 and D4 marked. (b) The 10% MCAS phase diagram showing M2 and M3. Note that M2 should be slightly below the plane of the diagram and M3 slightly above it. Ml would plot approximately mid-way between the two diagrams. (after Levin et al, 1964)
3.3 MELTING
Klementaski and Kerrison ( 1966) made slag glass-ceramics on a pilot plant scale. They found that the opacity of the slagceram glass melt hindered the transfer of heat from the surface to the interior of the melt.
However, in the small scale melts made in the laboratory for this thesis, the opacity of the glass melt did not cause any problems. The glass was melted in sintered alumina crucibles in an electric furnace. The time for the furnace to reach melting temperature
Univers
ity of
Cap
e Tow
n
23
varied considerably, depending on the state of the elements and the melting temperature, since the heating rate dropped as the temperature increased. With the furnace operating well, it took 6 to 8 hours for the melting temperature to be reached. The higher the melting temperature, the longer the time it took to reach it.
The D- and T-series glasses did not melt well at temperatures that were lower than about I530°C. A TB glass was melted for 4 hours at I450°C, but all the batch material had not been assimilated (i.e. melted and homogenised) and there was scum on the surface of the melt. The glass was quite viscous and did not pour easily. Coarse crystals formed on top of the glass on cooling. Melting for 4 hours at I550°C gave a good glass. The T- and D-series glasses were all melted at either I 530°C or I550°C. The addition of magnesia allowed the M-glasses to be melted at lower temperatures, the lowest temperature used being I 400°C.
The melting times and temperatures varied. Table 3 .4 shows the different melting regimes used.
Table 3.4 Melting procedures for the glasses investigated.
In some cases it was necessary to top up the crucible during the heating stage. This was specially important when melting batches that contained great quantities of MgC03, since the C02 emitted caused the melt to bubble very vigorously, boiling over the edge of the crucible. The problem was alleviated by half filling the crucible and topping it up at a later stage. The atmosphere during melting was air.
3.4 POURING AND SHAPING
Klemantaski and Kerrison (I966) found that the surfaces of opaque, dark glasses cool very quickly by radiation once the crucible is removed from the furnace. In transparent glasses the surface of the glass is heated by radiation from the interior, but the opacity ·
Univers
ity of
Cap
e Tow
n
24
of the dark glass hinders this heat transfer. The viscosity of the slagceram glasses also changes sharply with a decrease in temperature, and hence the forming process must be rapid and preferably carried out at a high temperature.
This was found to be the case with the PF A glasses made, they poured well immediately after they were removed from the furnace, but the pourability decreased rapidly with time. No complex forming processes were carried out on the glasses. They were poured into graphite coated steel moulds and immediately placed into a heat treatment furnace, held at 750°C.
3.5. HEAT TREATMENT PROCEDURE
3.5.1 Heat Treatment Procedures from Literature
The heat treatment procedure outlined by McMillan (1969) involves two stages: the nucleation stage, followed at a higher temperature by the crystal growth stage. There are three important parameters in this two stage process: the heating rate from the temperature at which nucleation occurs to the crystallisation temperature and the time and the temperature of each stage.
The heat treatment times and temperatures are related to the Tamman nucleation and crystallisation curves for the glass. Tamman curves are discussed in the literature review, Section 2.2. The specific times and temperatures used depend on the glass being heat treated and the nature of the glass-ceramic that is desired. Klementaski and Kerrison (1966) used crystallisation heat treatment temperatures between 900°C and 1100°C and nucleation heat treatment temperatures between 650°C and 750°C (i.e. near the anneal temperature) for the slagceram glasses in the MCAS system that they studied.
If the rate at which the glass is heated to the crystallisation temperature is slow enough, a separate nucleation stage is not necessary according to Kirby (1991). A heating rate of < 2°C I minute was found to be sufficient to allow nucleation to occur during heating, provided that there is enough nucleating agent in the batch.
McMillan {1969) is also in favour of a slow heating rate. Rapid heating can cause cracking and deformation of the glass, because it does not allow enough time to form a crystal skeleton that will support the glass matrix. On the other hand, Richards et al (1976) advocate a high heating rate to prevent deformation of the glass. Their reasoning is as follows: Heat treatment occurs between the softening and crystallisation temperatures, therefore the glass must be rapidly heated through this temperature range so that there is not enough time for slumping to occur before crystallisation starts.
3.5.2 The Heat Treatment Schedules Used
The heat treatment used was determined by trial and error and by referring to the work of Kirby (1991). After casting the glass was immediately placed into the heat treatment furnace held at 750°C for times varying between 4 and 16 hours. This initial heat treatment served as both an annealing period (to remove stress
Univers
ity of
Cap
e Tow
n
25
from the glass) and a nucleation period. Heat treatments for 16 hours, or at the higher temperature of 780°C, were also carried out.
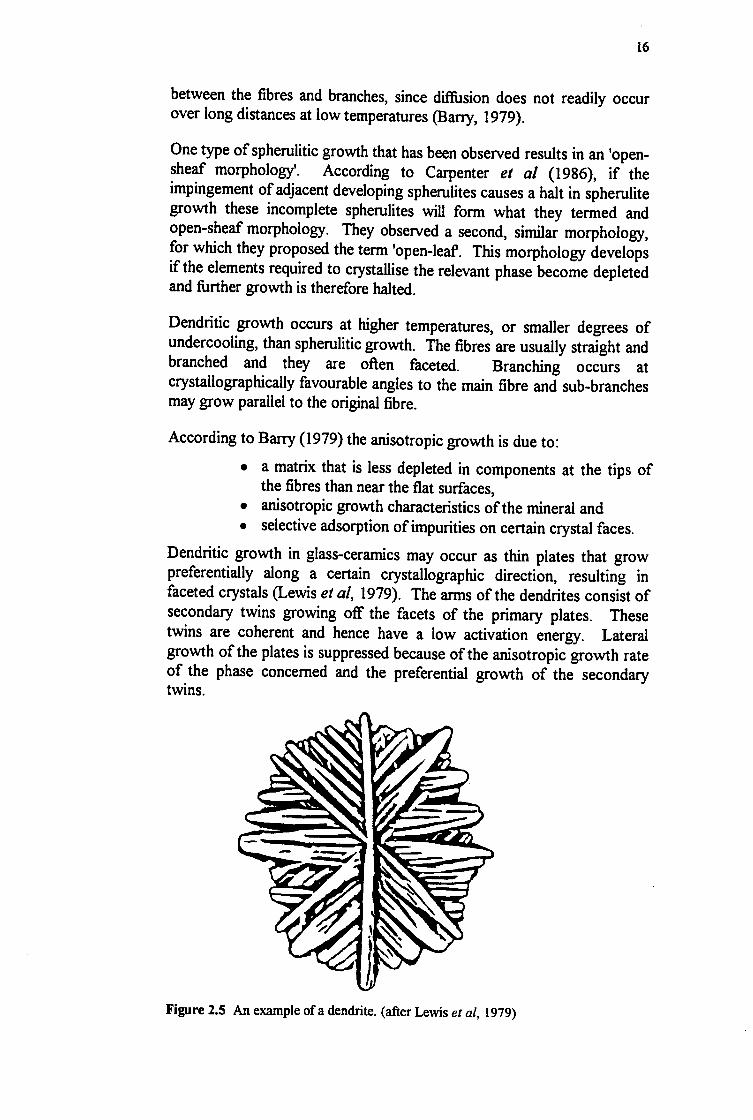
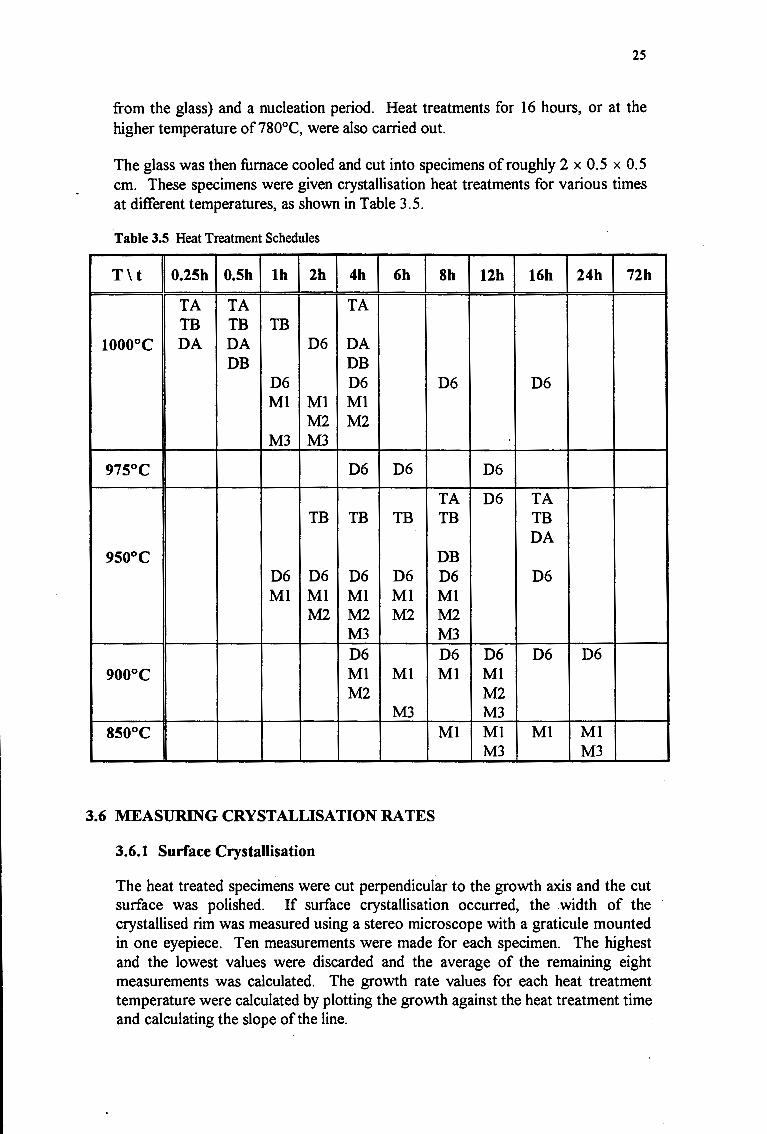
The glass was then furnace cooled and cut into specimens of roughly 2 x 0.5 x 0.5 cm. These specimens were given crystallisation heat treatments for various times at different temperatures, as shown in Table 3.5.
Table 3.5 Heat Treatment Schedules
T\ t 0.25h 0.5h lh 2h 4h 6h Sh 12h 16h 24h 72h
TA TA TA TB TB TB
1000°c DA DA D6 DA DB DB
D6 D6 D6 D6 Ml Ml Ml
M2 M2 M3 M3
975°C D6 D6 D6
TA D6 TA TB TB TB TB TB
DA 950°C DB
D6 D6 D6 D6 D6 D6 Ml Ml Ml Ml Ml
M2 M2 M2 M2 M3 M3 D6 D6 D6 D6 D6
900°C Ml Ml Ml Ml M2 M2
M3 M3 850°C Ml Ml Ml Ml
M3 M3
3.6 MEASURING CRYSTALLISATION RATES
3.6.1 Surface Crystallisation
The heat treated specimens were cut perpendicular to the growth axis and the cut surface was polished. If surface crystallisation occurred, the width of the crystallised rim was measured using a stereo microscope with a graticule mounted in one eyepiece. Ten measurements were made for each specimen. The highest and the lowest values were discarded and the average of the remaining eight measurements was calculated. The growth rate values for each heat treatment temperature were calculated by plotting the growth against the heat treatment time and calculating the slope of the line.
Univers
ity of
Cap
e Tow
n
26
The plots of the growth distance versus time graph passed through the origin, proving that the incubation period, if there was one, was very short and crystallisation started as soon as the temperature was sufficiently high.
To determine the dependence of growth rate on temperature the Arrhenius equation was used:
Rate = A exp (-Q/RT)
where: A is a constant for the system concerned T is the temperature at which the reaction occurs (in K) Q is the activation energy for the reaction to occur (in J/mol) R is the gas constant (8.314 J/mol K)
For each glass an Arrhenius plot ofln rate versus I/Temperature was drawn. The slope of each graph was calculated, giving a value for E/R. This was multiplied by R to give the energy in J/mol.
3.6.2 Bulk Growth Rates
Due to the irregularity in the shapes and sizes of the bulk crystals it was not possible measure the growth rates. Instead, visual comparisons were made to compare the extent to which crystallisation had progressed in the different specimens.
The surface growth rates proved to be more rapid thanthe growth of the internal rosettes that grew from bulk nuclei. This meant that it was not possible to follow the procedure used by Harper et al (1972). They measured the surface growth rate and used that as the growth rate of the radii of the internal crystals, since in the glasses they studied these rates were identical.
3.7 DILATOMETRY
3.7.1 Specimen Preparation
Special dilatometry specimens were cast, using a graphite mould. The specimens were trimmed to size (50mm x 5mm x 5mm) using a diamond saw.
3.7.2 Procedure
The thermal expansion of the glass was determined with a Leitz optical dilatometer, with the trace being recorded on photographic paper.
Each specimen was heated at a constant rate of 10°C/min in the dilatometer furnace. The temperature scale was marked on the photographic paper by turning the light beam off briefly every 100°C. The values of Tg, the glass transition temperature and Td, the softening point of the glass, were measured directly from the traces. The standard deviation on the readings was± 1°C.
Dilatometry information gives an indication of the viscosity of a material. The dilatometer used has viscosity values of J013.5 and 1011.5 associated with Tg (the
Univers
ity of
Cap
e Tow
n
27
glass transition temperature) and Td (the softening point) respectively. Thus low Tg and Td temperatures mean a low viscosity for the glass. Using the relationship: Viscosity= A exp(Q/RT), the activation energy for viscous flow (Q) for each glass can be calculated from these two temperature values.
3.8 METHODS OF DETERMINING THE FEl+fFE2+ RATIO
3.8.1 Methods Discussed in Literature
Williamson et al (1968) used the following procedure to determine the Fe3+fFe2+ ratios in glass. They dissolved the glass in a HF and HCl mixture and reduced all the iron to Fe2+ with stannous chloride. The solution was titrated with K2Cr207, which oxidised the iron and gave the total iron content as Fe3+. To determine the Fe2+ concentration the glass was dissolved in the presence of a known amount of oxidant and under an inert atmosphere, to control oxidation of the iron during the measuring procedure. The solution was then back titrated with a ferrous ammonium sulphate solution to determine the Fe2+ content. The Fe3+ concentration was then calculated by difference.
Hazeldean and Wichall (1973) determined the total iron content in the glasses they studied colorimetrically with thioglycollic acid. The ferrous iron was determined by reacting the glass with an HCl-HF-ICl mixture under an inert atmosphere and then estimating the ferrous iron as iodine.
3.8.2 Method Used in this Study
A third method is the determination of the Fe3+fFe2+ ratio by ion chromatography, as described by Le Roex and Watkins (to be published). A Dionex* 4000i ion chromotographer fitted with a Dionex* CS-5 separator column and a CG-5 guard column was used.
i. Specimen Preparation
The samples were ground under acetone in an automatic mortar and pestle for about half an hour. A modification of the Pratt method (Pratt, 1894) as quoted by Le Roex and Watkins (to be published), for dissolving silicate rocks and minerals without causing oxidation was used. In this procedure, fifty mg of powdered glass are put into a platinum crucible and dampened with distilled water. A mixture of0.5ml 18M H2S04 + 0.5ml 28M HF+ lml distilled, deoxygenated water was added to the powdered glass. The crucible was covered with a platinum lid and gently heated over a Bunsen burner for . one minute. The heating step was critical because the iron could easily be oxidised during the dissolution process. The glass solution was then diluted up to 100 times, using distilled, deoxygenated water. The degree of dilution depended on the concentration of iron in the specimen. In the case of the glass samples studied, the dilution was approximately 0.06mg/ml.
Univers
ity of
Cap
e Tow
n
28
ii. Procedure
Referring to Figure 3 .2, the process can be described as follows:
The dissolved sample was injected at the top of the separator column. The eluant, which contained a complexing agent, was pumped into the separator column and complexed with the metal ions. A 6: 'M solution of pyridine-2,6-dicarboxylic acid was used as an eluant chelator. The ions were eluted as divalent and monovalent species and then reacted with a colour complexing agent. The metal ion complexes moved through the column at different rates, depending on their affinity for the column resin. This caused the different ion·s to be separated into discrete bands which were delivered, one at a time, into the detection system. In the membrane mixing device the ionic complexes combined with a colouring agent which was pumped through from the post column reagent reservoir. As each band of coloured ionic complexes moved through the UV detector cell, its visible wavelength absorbance was measured photometrically. A pre-selected wavelength, in this case 520 nm, was used. The higher the concentration of a particular metallic ion, the higher the absorbance of the coloured complex it formed. The results appeared in the form of a chromatogram, giving separate peaks for the two ions. The Fe3+fFe2+ ratio was determined by integrating the areas under the peaks and determining the ratio.
Delivery Mode
Separation Mode
Detection Mode
Data Mode {
9 oc:J:::i
l
Eluant Reservoir
Pump
Sample Injector
Separator Column
Post Column Reagent Reservoir
Membrane ()__ n Mixing Device Y 01----d
UV-Vis Detector Cell
Figure 3.2 A schematic diagram of the operation of the ion chromatographer. (From the operating manual.)
An example of a chromatogram is shown in Figure 3.3. The Fe3+ concentration values do not return to the background value immediately, but the peak tails off at the end. The explanation given for this is that oxidation
Univers
ity of
Cap
e Tow
n
29
occurs during the 10 minute run through the chromatographer (Le Roex and Watkins, to be published).
Calibration of the machine is done using international rock standards for which ratios have been determined to a high degree of accuracy and precision, using a number of analytical methods. The Fe3+ complex is 1.4 times as sensitive to detection as the Fe2+ complex and this was corrected for, using correction factors calculated from the results obtained for the international rock standards. The standard used in this investigation was a nepheline syenite, known as STM-1. It has a Fe2+fFe3+ ratio of 1 :3.
Fe 2 +
Fe 3 +
AU
-0-t--.~-.--,-~,.-----.-~.---.-~.---.-~
0.00 5.00 Minutes
Figure 3.3 An example ofa trace of the Fe3+ and Fe2+ peaks that was generated by the ion chromotographer. The sample was a nepheline syenite, known as STM-1. The areas under the peaks were integrated and used to establish the Fe2+/Fe3+ ratio.
Material from each specimen was dissolved and run at least four times. The most oxidised ratios were discarded due to the possibility of oxidation occurring and the average of the three smaller values was calculated. If a value was particularly small and efforts to reproduce it failed, it was also discarded, due to the possibility of incomplete dissolution of the specimen, favouring the dissolution of the ferrous ions over the ferric ions.
iii. Advantages of this Method
Advantages of this method are the relatively low cost as well as the short time required to run each sample - about ten minutes, including the dissolution process. It also directly gives the ratio between the ferric and ferrous ions, without the need to determine the total iron content.
A high degree of reproducibility (standard deviation = ± 0.02 for the Fe20 3/Fe0 ratio) for various rock standards, was obtained by Le Roex and· Watkins (to be published). The reproducibility obtained in this present study was not as good. Some of the readings were discarded, for the reasons outlined in Section iv below. For the rest of the readings the standard deviation=± 0.1 for the Fe3+fFe2+ ratio.
Univers
ity of
Cap
e Tow
n
30
iv. Disadvantages of the Method
The effect of the fineness of the powdered glass was not investigated, however it was noted that if small pieces of glass (± O.Smm in diameter) were dissolved, the result was considerably more oxidised than if the glass was in a powdered form before being dissolved. It is possible that the fineness of the glass may have had an influence in the readings obtained.
The possibility of oxidising the glass during the powdering process was also not considered in detail. The glass was crushed in an alumina mortar and pestle and then ground down in an agate mortar and pestle. The grinding was carried out under acetone, to prevent oxidation, however the exact effect of the powdering process on the oxidation state of the glass is not known. Differences in the grinding time or the fineness of the powder may also affect the ion ratio values obtained for samples of the same specimen which were ground separately. This possibility was not investigated.
There was also the possibility of experimental error during the dissolution process. Oxidation of the sample can very easily occur during the dissolution process. Another probable problem was the effect of incomplete dissolution. In some cases different dissolution of the same specimen gave a number of similar readings and one very much reduced reading. This reduced reading seemed to coincide with a dissolution that had been incomplete. Hence the possibility exists that the Fe2+ ions were more readily dissolved than the fe3+ ions. In the case of the nepheline syenite standard used, if there was a residue it was dark green in colour, probably mainly consisting of magnetite, which would account for the artificially lower result obtained. The dissolution process could have been affected by a number of parameters. The crucible containing the acid and glass rested on a tripod stand and a bunsen burner was held in the hand and moved back and forth, fanning the bottom of the crucible with the flame. The intensity of the flame, the distance it was held from the crucible and the movement of the flame could all affect the dissolution process. With practice the variations could be minimised, but not totally eliminated, specially from one day to another. These factors probably contributed to the spread in results sometimes encountered.
3.9 X-RAY DIFFRACTION
X-ray diflTaction was used to determine the phases present in the heat treated glasses and if possible, the compositions of the phases that were members of a solid solution series. Due to the surface crystallisation, quantitative analysis to obtain crystal growth rates was irrelevant, as the volume ratio of the glassy interior to crystalline surface layer is dependent on the size of the specimen.
The heat treated specimens were ground to a powder using a Seib mill.
Univers
ity of
Cap
e Tow
n 1.80
~ 1.70 ::l u ... 1.60 .2 0 ~ N
<J 1.50
1.40 100
31
3.9.1 Determination ofMelilite Composition by XRD
90
i. Methods Used in the Literature
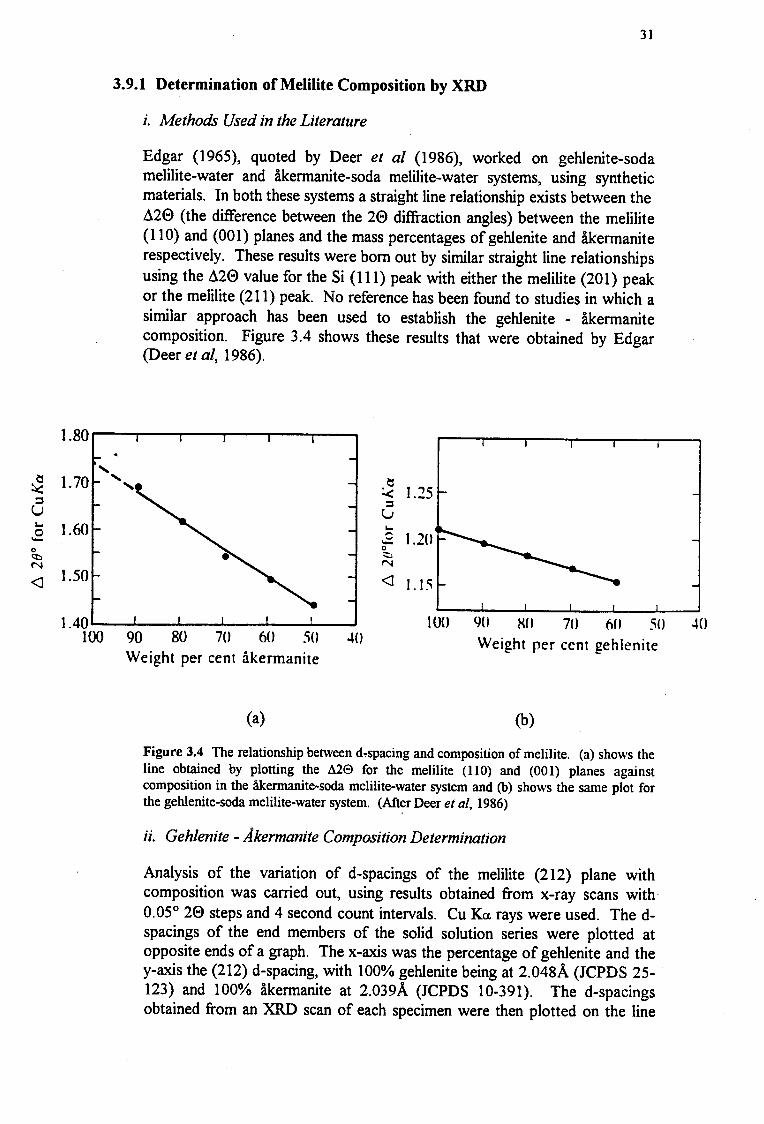
Edgar (1965), quoted by Deer et al (1986), worked on gehlenite-soda melilite-water and akermanite-soda melilite-water systems, using synthetic materials. In both these systems a straight line relationship exists between the d20 (the difference between the 20 diffraction angles) between the melilite (110) and (001) planes and the mass percentages of gehlenite and akermanite respectively. These results were born out by similar straight line relationships using the d20 value for the Si (111) peak with either the melilite (201) peak or the melilite (211) peak. No reference has been found to studies in which a similar approach has been used to establish the gehlenite - akermanite composition. Figure 3 .4 shows these results that were obtained by Edgar (Deer et al, 1986).
80 70 60 so 40
c: < 1.::?5 ::l u ... c.2 1.2() 0 ~ N
<J 1.15
100 90 80 70 60 so 40
Weight per cent akermanite Weight per cent gehlenite
(a) (b)
Figure 3.4 The relationship between d~spacing and composition of melilite. (a) shows the line obtained by plotting the A2e for the melilite (110) and (001) planes against composition in the akermanite-soda melilite-water system and (b) shows the same plot for the gehlenite-soda melilite-water system. (After Deer et al, 1986)
ii. Gehlenite -Akermanite Composition Determination
Analysis of the variation of d-spacings of the melilite (212) plane with composition was carried out, using results obtained from x-ray scans with· 0.05° 20 steps and 4 second count intervals. Cu Kcx. rays were used. The dspacings of the end members of the solid solution series were plotted at opposite ends of a graph. The x-axis was the percentage of gehlenite and the y-axis the (212) d-spacing, with 100% gehlenite being at 2.048A (JCPDS 25-123) and 100% akermanite at 2.039A (JCPDS 10-391). The d-spacings obtained from an XRD scan of each specimen were then plotted on the line
Univers
ity of
Cap
e Tow
n
-~
32
joining the two end members, and the corresponding composition could then be read off the d-value of the x-axis. Figure 3.5 shows this plot.
Figure 3.5 The plot used to detennine the composition of melilite using the d-spacings of the (212) planes, using the method described by Deer et al (1986).
DA, TA and DB had compositions of greater than 70% gehlenite. This is consistent with the low MgO content of the parent glass. TA and D6 had minimum gehlenite compositions of about 50%. The reason for the lower D6 values is not certain, but the low TB values may be attributed to the presence of perovskite which, in taking up some of the calcia, enriched the melilite in magnesia.
There was an error of about 10% on the individual d-value determinations, coupled with a very wide spread of values from specimens of the same composition. To apply this method successfully, the x-ray diffraction must be carried out with extreme accuracy, as there is only 0.009A difference between the d-spacings for the pure end members. A number of peaks actually had dvalues greater than 2. 048A, which plotted as compositions in excess of 100% gehlenite. This implies that there was a peak shift due to other impurities in the melilite.
An attempt to improve the resolution by doing a scan using a smaller step size (0.01° 20) and longer count interval (10 seconds) was made. This approach was unsuccessful, giving zigzag XRD traces, with no obvious peaks, and low reproducibility. Successive scans of the same material also gave totally different traces. Given the inaccuracies of the method it was difficult to
Univers
ity of
Cap
e Tow
n
33
obtain precise results. The resolution that could be achieved was not sufficient to make this a viable means of determining the melilite composition.
3.10 MICROSCOPY
3.10.1 Specimen Preparation
The heat treated specimens were mounted in resin and polished. The polished specimens were etched for 15 seconds using Keller's reagent, which consists of 95 ml distilled water, 2.5 ml HN03, 1.5 ml 36 % HCI and lml 40 % HF.
For optical microscopy the specimens were coated with a very thin layer of Au/Pd to prevent reflection of light from the interior of the specimen.
3.10.2 SEM Microscopy
The SEM and EDS investigations were carried out at 20 kV due to the nonconductivity of the specimens. Semi-quantitative EDS readings were taken over I 00 second intervals, at tilt angle of 20° and a distance of 25mm. If a large field was available, then the entire field was scanned. This was not possible when analysing small crystals. For these analyses the larger crystals were chosen and spot analyses carried out on them. An example of this was the analysis of the spinet nuclei. The largest spinet crystals were approximately 1 Oµm in size. The probe size is approximately 250 - 350 nm, but the volume analysed usually has a larger diameter than the probe size. The depth of the activated area may also have exceeded the depth of the nucleus being analysed. For these reasons it could be assumed that the EDS analyses were reasonably accurate, but the possibility that the material surrounding the object of interest affected the analysis could not be excluded.
Univers
ity of
Cap
e Tow
n
34
4. THE EFFECTS OF COMPOSITION
Three series of glasses were made, namely the T-, D- and M- series. The D6 glass was developed by Kirby ( 1991) as a follow up to the work on the D4 glass. The motivation for making the T- series was the fact that Kirby reported a more rapid crystal growth rate and better resistance to particle erosion for titania nucleated glasses than for the Fe20 3 and Cr20 3 nucleated D4 glass. The M- series was made because the glasses from the D- and T- series failed to bulk nucleate under the conditions used in this study. Most industrial glass ceramics used are in the MgO-CaO-AI20 3-Si02 (MCAS) system, rather than the CaO-AI203-Si02 (CAS) system (Davies et al, 1970). The M-series of glasses was therefore made with compositions falling in the MCAS system.
The effect of composition on crystal growth rates was studied in all the glasses, but mainly in those which showed surface growth, which is very easy to measure. Only visual observations were made regarding the crystal growth rates of the glasses that bulk nucleated and the results are reported in Sections 5.2.2 ii and 6.3.2.
4.1 EFFECT OF COMPOSITION ON NUCLEATION
Along with variations in the melting temperatures, discussed in Section 5.1, compositional variation of the glass was one of the factors that determined whether or not bulk crystal growth occurred. Table 4.1 shows the glasses of the M-series that crystallised from the surface and those which bulk nucleated.
Table 4.1: The relationship between composition and nucleation behaviour of the M-series glasses . . The melting temperature was 1400°C.
Melt Time Glass MgO:CaO Crystallisation Type
1 hour MlB/F Surface
2 hours MlE 0.15 Surface
4 hours MIC Surface
1 hour M2A 0.35 Surface (+Bulk)
1 hour M3C/D/G Bulk
2 hours M3E/H 0.66 Bulk
4 hours M3F/I Bulk
Univers
ity of
Cap
e Tow
n
35
Note: M denotes the series (i.e. to distinguish it from T- or D-series), the number is the composition, (eg. Ml, M2 and M3 have different amounts of CaO and MgO), the second letter distinguishes different melts, which may occur under different conditions, e.g. M3A, M3B and M3C, or different melts under the same conditions, e.g. M3C, M3D and M3G.
With the specific experimental conditions used, only the glass with the M3 composition showed bulk nucleation. The M2 glass developed only a few dispersed nuclei, while all the Ml-glasses yielded only surface crystallisation. From these results it can be concluded that there is a minimum amount of MgO that must replace CaO before any bulk nucleation will occur under the conditions used in this study. The greater the substitution ofMgO for CaO, the more efficiently the bulk nucleation occurs.
4.2 DILATOMETRY
Dilatometry runs were carried out to determine the viscosity relationships between the glasses studied and hence explain the effects that the compositional changes had on the crystal growth rates.
The values for Tg, Td and the activation energy for viscous flow (Q) were obtained from the dilatometry curves of the different glasses. The data for the glasses are shown in Table 4.2. The D6 glass made from pure components has a lower glass transition, a lower softening point temperature and a higher activation energy for viscous flow than the D6 glass made with PF A. This is probably due to mmor impurities in the PF A glass, but this aspect has not been investigated further.
Table 4.2 The Tg and Td temperatures of the glasses investigated.
Glass MgO/CaO Tg {°C) Td (°C) Q (MJ/mol)
D6 0 782 838 0.801
D6(Pure Components) 0 772 825 0.829
Ml 0.15 733 789 0.730.
M3 0.66 730 794 0.640
TB 756 813 0.751.
' In Figure 4.1 the data of D6 and two of the M-series glasses are plotted to show the effect that changing the MgO/CaO ratio has on the viscous flow. Both Tg and Td drop off rapidly with the first replacement of CaO with MgO. Further substitution is accompanied by a levelling off of the curves. The activation energy for viscous flow
Univers
ity of
Cap
e Tow
n
36
also shows a sharp drop for the first substitution, followed by a more gradual drop for further substitutions.
850*
-8 LO + c. x - Q)
~800 ->-C>
Q) ....
.... Q) • Tg (°C) :::::i c: - w Ctl
+ Td (°C) .... c: Q) 0 c. 7 ·.;:::: E Ctl * a (J/mol) Q) > F 750 +;;
0 * <(
* II • 0
700 6 0 0.1 0.2 0.3 0.4 0.5 0.6 0.7
Mass% MgO/CaO
Figure 4.1 The effects of the glass composition on Tg, Td and Q.
4.3 EFFECT OF COMPOSITION ON SURFACE GROWTH RATE
4.3.1 T- and D-Series
The surface growth rates of the T- and D-series were measured and the effects of changes in composition on the surface growth rates were investigated. The ease of measuring surface growth rates made these glasses ideal for determining the effects of composition on crystal growth rates.
From Figure 4.2 it can be seen that the growth rate of glass TB was much greater than that of glass TA.
Univers
ity of
Cap
e Tow
n
37
3 Heat Treatment Temperatures
e .§. • TA 1000°c .i::
to TA 950°C 'i e2 * TB 1000°c ~
(ij 111 TB 950°C -Cf)
~ (.) x TB 900°C
1
2 4 6 8 10 12 14 16 18
Heat Treatment Time (hours)
Figure 4.2 The surface growth rates of the glasses from the T-series.
TB was totally crystalline after 2 hours at l000°C and 4 hours at 950°C. When polished it was evident that the nucleation was from the surface, giving elongated crystals growing inwards (see Figure 7.1 in Section 7.1.2). This was more obviously seen in the specimens that were heat treated for shorter times and thus were not fully crystalline and had glassy centres.
Table 4.3 gives the growth rates calculated for the TA, TB, DA and D6 glasses at the corresponding crystallisation heat treatment temperatures, as well as the activation energies for crystal growth. The titania glasses (TA and TB) showed much higher crystallisation rates than the D glasses that contained Cr20 3 and Fe20 3. The effect of titania can also be seen by comparing TA and TB. TB crystallised more rapidly than TA, which had less titania.
The effect of adding more Cr20 3 and Fe203 can be seen by comparing glasses D6 and DA. The extra Cr203 and Fe203 in D6 led to higher surface growth rates. There were not enough specimens of DB to obtain sufficient information to compare it to the other glasses.
Univers
ity of
Cap
e Tow
n
38
Table 4.3 Growth rates and activation energies for T- and D-series glasses.
Glass Growth Rates (µm/sec) E (MJ/mol)
900°C 950°C 1000°C
TA 0.047 0.168 0.166
TB 0.018 0.190 0.790 0.344
DA 0.032 0.133 0.338
D6A,C 0.042 0.174 0.615
DB (0.021)
4.3.2 M-Series
Arrhenius plots for these glasses are shown in Figure 4.3. Data for melts of the same composition tend to plot together, with similar slopes, while there is a noticeable difference in the slopes for glasses of different compositions. The slope of the Arrhenius curve gives the activation energy for crystal growth.
Q) -as .... .r:. ~ 0 .... .9 ..!:
-3
-4
-5
7.8 8 8.2 8.4 8.6 8.8
1/T exp-4 /K
9
Figure 4.3 A comparison of the Arrhenius plots for all the glasses.
Glass (Melting Conditions)
..._ 06A (1550°C,4h)
+ D6F (1550°C, 1 h)
* 06E (1550°C,2h)
-* M2A (1530°C,2h)
+ M2B (1400°C, 1 h)
-/Jr M3A (1500°C, 1 h)
~ M3B (1450°C, 1 h)
~ M3K (1550°C, 1 h)
··•· M1 C (1400°C,4h)
·-A· M1 E (1400°C,2h)
·llll· M1 F (1400°C, 1h)
The crystal growth rates and the activation energies, obtained from the Arrhenius plots, are plotted against the mass percentage of MgO in Figure 4.4. In order to
Univers
ity of
Cap
e Tow
n
39
minimise the effects of different melting conditions, only values that were obtained from glasses that were melted between 1530°C and 1550°C for between 1 and 2 hours, were used.
0.5r-------------~
0.4
CD ·----£ 0.2 , .. ............... ,
'.... --· ............. -.. __________ _ 0.1
0 0.2 0.4 0.6
Mass ratio MgO:CaO
10
8
6
ii) + a. )(
~ > ei CD c: w c: 0
4 "iii > n c(
2 w
-soo·c +sso·c * 1000°c
-• E
Figure 4.4 The crystal growth rates and the activation energies for crystal growth plotted against the mass percentage MgO.
The replacement of CaO by MgO caused an initial increase in the surface crystallisation rate. Further substitutions were accompanied by a levelling off of the growth rate. The growth rate increased again slightly with the change from the M2 to the M3 composition. The values for the activation energy for crystal growth (E) dropped and then increased with the changes in composition.
4.4 CORRELATION BETWEEN Q AND E
Table 4.4 The correlation between changes in the activation energy for viscous flow (Q) and the activation energy for crystal growth (E) with changes in the MgO/CaO ratio.
Glass MgO/CaO Ratio Q (MJ/mol) E (MJ/mol)
D6 0 0.801 0.459
Ml 0.15 0.730 0.401
M2 0.35 0.264
M3 0.66 0.640 0.318
The effect of the composition on the activation energies for viscous flow (Q) and crystal growth (E) is shown in Table 4.4. With an increasing MgO/CaO ratio Q showed a rapid decrease, followed by a smaller decrease. A similar trend was observed in the E values, but E increased again with the last substitution of MgO for CaO. These two activation energies are closely related, since viscosity reflects the ease
Univers
ity of
Cap
e Tow
n
40
of the diffusion of elements and ions to the crystal growth front. The two activation energies will thus show similar trends with change in composition.
Since the focus was on the glasses of the D- and M-series, not much information was gathered on the effect of titania. It was observed, however, that an increase in the amount oftitania was accompanied by a drop in the activation energy for viscous flow, an overall drop in the activation energy for crystal growth and an overall increase in the surface growth rates.
4.5 DISCUSSION
The glasses of the T- and D-series, which contained no MgO, showed no bulk nucleation under the conditions used in this study. The first signs of bulk nucleation occurred at an MgO/CaO ratio of 0.35. The bulk nucleation was only significant at an MgO/CaO ratio of 0.66. From this it was concluded that there was a minimum MgO/CaO ratio, below which no bulk nucleation would occur. As the MgO/CaO ratios increased from 0.35 to 0.66 the density of bulk nuclei increased. There were no references found to previous studies that deal with the effect of the MgO/CaO ratio on bulk nucleation. The composition of the nuclei, which is discussed in Chapter 7, is a magnesium spinel. This is probably why the MgO/CaO ratio was the determining factor in whether or not bulk nucleation occurred. In the glasses with low MgO/CaO ratios there was not sufficient magnesium for the nuclei to form and hence no bulk nucleation occurred. However, as will be discussed in Chapter 5, under certain melting conditions bulk nucleation was suppressed, regardless of the glass composition. The Fe3+fFe2+ ratios of the glasses, which were affected by the melting parameters, also had a role in the nucleation process. This aspect will be discussed in Chapter 6.
The composition also had an effect on the surface growth rates observed. There were no Tg and Td measurements of TA, but the values for TB (see Table 4.2) show that the replacement of the Fe20 3 and Cr20 3 in the base glass by titania lowered Tg and Td considerably. If D6 and TB are compared it can be seen that both the activation energy for viscous flow and the activation energy for crystal growth decrease with the replacement of Cr20 3 and Fe20 3 by Ti02. This decrease was accompanied by an increase in the surface growth rate measured. This corresponds to the findings of Dipichikov and Borisov (1975). They stated that 4 - 10% Ti02 decreases the crystallisation temperature for various glass-ceramics by about 50°C in the temperature range 930°C - 1000°C. A decrease in the crystallisation temperature implies that there was also a decrease in the activation energy for viscous flow. The reason for this is that a decrease in viscosity would result in easier diffusion of the elements needed for crystal growth and hence crystal growth would proceed more rapidly and at lower temperatures. It should be pointed out that the behaviour of TB is complicated by the presence of an extra mineral phase, compared to D6 and TA. The mineral phases that crystallise out are looked at in Chapter 7.
Replacing CaO with MgO also affected the activation energies for viscous flow (Q) and crystal growth (E). As a result, the surface growth rates were also affected. As the MgO/CaO ratio increased, Q initially decreased rapidly and then more slowly. E also decreased initially and levelled of, but then it increased slightly. These changes were accompanied by an initial increase in the crystal growth rate, which then levelled
Univers
ity of
Cap
e Tow
n
41
off slightly and then increased slightly again. Therefore, the replacement of CaO by MgO caused a lowering of the activation energies for viscous flow and crystal growth and thus an increase in the crystal growth rates. A similar observation, that the addition of MgO to the CaO-AI20rSi02 system lowers the crystallisation temperature, was made by Negro (1987). This relationship was considerably complicated by the effects of the melting parameters (discussed in Chapter 5) and the Fe3+fFe2+ ratios (discussed in Chapter 7). Another complicating factor was the fact that the change in composition was accompanied by a change in the minerals that crystallised out of the glass, because a phase field was crossed. This is looked at in Chapter 7.
Univers
ity of
Cap
e Tow
n
42
5. EFFECTS OF THE MELTING PROCEDURE
Davies et al (1970) found that melting time had an influence on the type of crystallisation that occurred when they heat treated glasses in the MgO-CaO-AI20r Si02 system, as can be seen in Figure 2.1 in Chapter 2. They did not investigate the effects of melting temperature on nucleation and crystallisation, or the effects that the melting parameters had on crystal growth rates of the glass-ceramics. The effects of both melting time and temperature on the nucleation and crystallisation behaviour were investigated in this study.
The mass of the batches melted were such that, when the volatile components (such as C02 and H20) had been released there would be lOOg of glass left. Sintered alumina crucibles were used throughout and the melting was carried out in an electric furnace in air. It must be noted that changes in these conditions, for example the batch size, may yield results that differ from those reported in this thesis.
All the glasses were given a nucleation heat treatment of 16 hours at 750°C. The crystallisation heat treatment times and temperatures varied. Table 3 .5 in Chapter 3 gives the complete range of crystallisation heat treatment schedules used.
5.1 EFFECT OF THE MELTING PROCEDURE ON BULK NUCLEATION
The effect of the melting time and temperature on the bulk nucleation and subsequent crystallisation of the M glasses is shown in Table 5 .1.
Table 5.1 The relationship between melting time and temperature and crystallisation behaviour.
Time (h) Glass Temperature (°C)
CJ 1400 1450 1500 1530 1550
1 Surface
2 Ml Surface Surface
4 Surface
1 M2 Surface (+Bulle)
2 Surface
1 Bulk Surface Surface Surface (+Bulle)
2 M3 Bulk
4 Bulk
Glass batches with Ml and M2 compositions were melted at 1530°C and at 1400°C for various times, as shown in Table 5 .1. The difference in melting temperature had no effect on the type of crystallisation that occurred in Ml, since all the glasses developed
Univers
ity of
Cap
e Tow
n
43
only surface growth. The M2 glass that was melted for 1 hour at 1400°C had some dispersed bulk nuclei, while the glass melted at 1530°C for 2 hours had no nuclei at all. The inability of the Ml and M2 glasses to effectively bulk nucleate was a compositional effect (as was discussed in section 3 .1.1) and not due to the melting or heat treatment parameters.
The melting time and temperature of the M3 glasses had a noticeable effect on their behaviour on subsequent heat treatment. The melting temperature had a determining effect on whether or not bulk nucleation occurred. To investigate these effects, five glasses of the M3 composition were made, each with different melting parameters.
For dense bulk nucleation to occur, with the specific conditions used in this study, the melting temperature had to be below 1450°C. If the melting temperature was 1450°C or higher surface growth occurred, with a few isolated bulk nuclei. This suppression of bulk nucleation was therefore a result of the high melting temperature and not the nucleation heat treatment. A separate study was done in which the nucleation heat treatment time was varied between 4 and 17 hours, but this did not affect the absence of bulk nucleation.
All the M3-glasses melted at 1400°C gave bulk crystallisation on heat treatment, regardless of the duration of the melting process, however the melting time did affect the homogeneity of the specimens. Under the optical microscope the heat treated glass-ceramics appeared inhomogeneous and streaky. Streaks and clusters of nuclei were visible, alternating with areas where there were very few nuclei. The longer the melting time the more homogeneous the glass. The M3 glasses that were melted for 1 hour at 1400°C were very inhomogeneous. Complete homogeneity was not achieved, even after melting for four hours. This problem may be solved by stirring of the glass during melting, but facilities to achieve consistent stirring conditions were not available. Figures 5.1, 5.2 and 5.3 show the effect of melting time on homogeneity.
Figure 5.1 Photomicrograph ofM3 glasses melted at 1400°C for 1 hour.
Univers
ity of
Cap
e Tow
n
44
Figures 5.2 and 5.3 Photomicrographs of M3 glasses melted at 1400°C for 2 hours and 4 hours respectively.
Both composition and melting temperature were determining factors in whether or not bulk nucleation occurred. The effect of composition was discussed in Chapter 4. The melting temperature must be below 1450°C for significant bulk nucleation to occur. The melting time did not influence the nucleation process in the M3 glasses melted at
Univers
ity of
Cap
e Tow
n
45
l 400°C, other than to affect the homogeneity of the glass and the distribution of the nuclei.
5.2 THE MELTING PROCEDURE AND THE CRYSTAL GROWTH RATE
5.2.1 The Effect of Melting Temperature on Surface Crystallisation Rates
The effect of the melting temperature on the surface growth rate was investigated for the M3 glasses that crystallised from the surface, namely M3B, M3A and M3K (melted for 1 hour at 1450°C, 1500°C and 1550°C respectively) . Crystallisation heat treatments were carried out at various times and temperatures, as shown in Table 3.5 in Chapter 3. Table 5.2 shows the surface growth rate values that were measured. The surface growth rates are plotted against the melting temperature in Figure 5.4.
Table 5.2 Surface growth rates and activation energies for crystal growth for M3 glasses melted for 1 hour at various temperatures.
Ci)
E ..:; G)
Glass Melt Temp Growth Rate (µm/s)
(oC) 850°C 950°C
M3B 1450 0.004 0.056
M3A 1500 0.006 0.073
M3K 1550 0.004 0.070
0.08 ....----- ---- -----------, 0.5
0.06
.... ··
*· ···· ···· ··· ······· ··-?!(···
... -··
0.4 '5' E ~ ::!!
0 .3 E;; Qi
~ 0.04 c w c 0 .r::.
"i 0
0 0.02
----0.2 ~
.:::: ti < II
0.1 w
0 0 1350 1400 1450 1500 1550 1600
Melt Temperature (°C)
Figure 5.4 M3 glasses melted for 1 hour at various temperatures.
E (MJ/mol)
0.292
0.281
0.355
Crystallisation Temperature
- 850°
-+- 950°
Univers
ity of
Cap
e Tow
n
46
Table 5.3 gives the surface growth rates and crystal growth activation energies for two Ml glasses that were melted for 2 hour at different temperatures. Figure 5.5 shows the effect of melting temperature on the crystal growth rate for the M 1 glasses melted for 2 hours at 1400°C and 1530°C.
Table 5.3 Surface growth rates and activation energy for crystal growth for Ml glasses melted for 2 hours at different temperatures.
Glass Melt Temp Growth Rate (µm/sec) E
I ( C) I 850°C 950°C 1000°c (MJ/mol)
Ml A 1530 0.049 0.233 0.401
MlE 1400 0.002 0.041 0.158 0.327
0.25 ~-----------------, 0.5
0.2 ...... ·········· * 0.4 ::::::-0
........ E --... ···· ······· ...., Crystallisation VJ e -- Temperature E 0.3 > ,:;0.15 Cl
Q) Qi - 950°C
iii c w
a: c + 1000°c L: 0
~ 0.1 0.2 ·~ *· E 2 .~ (.!) ti
< II
0.05 0.1 w
0 0 1350 1400 1450 1500 1550 1600
Melt Temperature (°C)
Figure 5.5 Ml glasses - Melt temperature versus rate. The rate appears to increase slightly with increased melting time.
From this information it can be seen that the melting temperature exerted relatively little influence on the surface growth rates that were measured. There was an overall increase in the surface growth rate measured for the glasses that were melted at higher temperatures. The activation energies for crystal growth
Univers
ity of
Cap
e Tow
n
Glass
D6F
D6D
D6E
D6A
D6C
MlB
MlF
MlE
MlC
47
also showed relatively small increases with changes in the melting temperatures of the glasses. This can be seen in the Arrhenius plots in Figure 4.3 that have parallel lines for M3A, M3B and M3K. The effect of the melting temperature on the surface growth rates and the activation energy for crystal growth is greater for the Ml glass-ceramics than for the M3 glass-ceramics.
5.2.2 The Effect of Melting Time on Crystallisation Rate
i. Surf ace Growth Rates
Glasses of the Ml and D6 composition were melted for different times at 1400°C and 1550°C respectively. Table 5.4 shows the growth rates measured for Ml and D6 glasses that were melted for different times at the same temperature. Figures 5.6 and 5.7 are plots showing how the surface growth rates changed with melting time for D6 and Ml respectively.
Table 5.4 The surface growth rates and activation energies for crystal growth for D6, melted for various times at 1550°C and Ml , melted for various times at 1400°C.
Figure 5.7 Ml glasses melted at 1400°C for various times.
Crystallisation Temperature
• 1ooo·c + s1s·c * sso·c • E
Crystallisation Temperature
0 1000°c
+ 950°C
* 900°C
• 850°C
x E
48
Univers
ity of
Cap
e Tow
n
49
Figure 5. 7 shows that for the M 1 glasses the surface growth rate decreases with initial increases in the melting time, but for extended melting times there is an increase in the rates with time. The activation energy for crystal growth shows the opposite trend. Figure 5.6 shows a similar trend for the D6 glasses. If the curves for the Ml glass-ceramics and the D6 glass-ceramics are compared, their shapes appear to have some similarities. The curves for the Ml glass-ceramics are similar to the left part of the curves for the D6 glass-ceramics. The graph in Figure 5. 7 appears to have been shifted to the left relative to Figure 5.6. This may be explained by the fact that the D6 glasses were melted at a higher temperature than the Ml glasses, causing an acceleration of the effect of the melting time for the D6 material.
ii. Bulk Crystallisation
Qualitative observations of the progress of crystallisation were made from the XRD traces of the partially bulk crystallised glasses and relating the development of the mineral peaks to the bulk crystal growth rate.
In an XRD trace glass can be seen as a broad 'glass hump' between 20° and 36° 20 against the otherwise low intensity baseline of background noise. As crystallisation proceeded each successive XRD trace for the glass-ceramics showed diminished glass humps while the intensities of the mineral peaks increase, reflecting the higher degrees of crystallinity. From the start of crystallisation the diffraction peaks were sharp and well defined, although small. This indicated that the first crystals to form were well developed and relatively large.
The XRD traces of some of the M3 glasses, that were melted for different times at l 400°C and then heat treated, gave an indication of how far crystallisation had progressed after a given time. The XRD traces of the glass-ceramics that had been heat treated at 950°C showed little difference in growth rate from the glass-ceramics that had been melted for different times. For crystallisation heat treatments carried out at 900°C, M3E (melted for 2 hours) and M3F (melted for 4 hours) reached complete crystallinity after a shorter heat treatment time than did M3C and M3D (both melted for 1 hour) . The crystallisation heat treatments carried out at 850°C showed this trend more clearly. The crystal growth rate was greater as the melting time for each glass increased. M3F was completely crystalline after a 12 hour heat treatment, while it took more than 24 hours for M3E to reach complete crystallinity and M3C and M3D were not yet fully crystalline after a 72 hour heat treatment.
Comparisons of optical micrographs of all the M3 glasses that were melted at l 400°C only supported these observations to a limited extent. Again, the growth of the crystals appeared to occur at similar rates for all the melts if they were heat treated at 950°C, but the glasses that were melted for 4 hours showed faster growth than the glasses that were melted for 1 hour if the glasses were heat treated at 850°C. This however was only a general observation. There were considerable variations seen in the crystal sizes in
Univers
ity of
Cap
e Tow
n
50
glasses that were both melted and crystallised for the same lengths of time. This variability will be discussed later in Chapter 6, with reference to the effect of the fe3+fFe2+ ratios.
5.3 DISCUSSION
The melting temperature affected the bulk nucleation behaviour of the M-series glasses. In glasses of the M3 composition, which have a high MgO/CaO ratio, melting temperatures of 1450°C or higher suppressed bulk nucleation. This happens because the melting temperature affects the Fe3+fFe2+ ratio of the glass. This ratio has a determining effect on whether or not bulk nucleation occurs. This will be discussed in Chapter 6.
The melting time exerts little effect on the bulk nucleation process. Longer melting times allow a longer time for the glass to homogenise and hence for the bulk nuclei to be more evenly distributed.
The melting temperature exerted a relatively small influence on the surface growth rates of the Ml and M3 glasses. In both cases, the surface growth rate increased slightly with increased melting temperature. The melting temperature affected the Fe3+fFe2+ ratio, which in tum affected the surface growth rates. This will be discussed in Chapter 6.
The melting time had a pronounced effect on the surface growth rates. D6 initially showed a small decrease in the surface growth rate, followed by a large increase in the growth rate with increased melting time. For the Ml glasses there was an initial drop in the growth rate, which reached a minimum for the glass that had been melted for 2 hours. A further increase in the melting time was accompanied by an increase in the surface growth rate. The Ml glasses were melted at a lower temperature than the D6 glasses and hence the curve for the Ml glasses is shifted to the left of that for the D6 glasses. The reason for this shift is that the oxidation and reduction reactions, which occur in the glass during melting, proceed faster at the higher temperatures. The effect of the melting time on the oxidation state of the iron in the glass and the effect on the surface growth rates will be discussed in Chapter 6.
In the M3 glasses that bulk nucleated the bulk growth appeared to progress faster in the glasses that had been melted for longer times, but there were some exceptions, which seemed to be linked to the Fe3+fFe2+ ratios of the glasses.
Univers
ity of
Cap
e Tow
n
51
6. FE3+fFE2+ RATIO
Hazeldean and Wichall (1973) found that the Fe3+fFe2+ ratio, that is the oxidation state of the iron, affected the bulk nucleation and the crystal morphology of the glass ceramics they made. They found that, as the ratio increased from about 0.5 to 1.5, the morphology changed from 'Type-A', which they identified as heterogeneously nucleated spherulitic growth to 'Type-B', which they claimed to be dendritic growth. There was no crystallisation at all in the highly oxidised glasses that had Fe3+fFe2+ ratios above about 5. Rogers and Williamson (1969) found that Fe20 3 promoted internal nucleation, while FeO had little effect on the nucleation process, although it did encourage rapid crystal growth. These two findings appear to be contradictory, with Hazeldean and Wichall stating that the reduced glasses were heterogeneously nucleated throughout the material, while Rogers and Williamson state that the more oxidised fe3+ ions promote bulk nucleation. This contradiction is discussed in Chapter 7.
6.1 FE3+fFE2+ RATIOS AND MELTING PARAMETERS
The oxidation state of the glasses, as reflected by the Fe3+fFe2+ ratios was dependant on the melting conditions. Unfortunately, facilities were not available to control the melting conditions to allow the Fe3+fFe2+ ratios to be controlled. As a result, the glasses were melted, with no idea of what the ratios were likely to be, and then the ratios were determined.
The fe3+fFe2+ ratios were measured using an ion chromatographer, as discussed under Methodology, Section 3.8.2. Figure 6.1 shows two examples of the chromatographs obtained. M3E (Figure 6.1.a) has an f e3+fFe2+ ratio of 1.2 and M3G (Figure 6.1.b) is a more oxidised glass, with a ratio of 4.4. Both the glasses were melted at 1400°C, with M3 G being melted for 1 hour and M3E being melted for 2 hours. The small peak on the left shoulder of the Fe2+ peak is the Mn2+ peak.
Figure 6.1 a) Chromatograph ofM3E, b) Chromatograph ofM3G
5.00
Minutes
10.00
Univers
ity of
Cap
e Tow
n
52
6.1.1 Melting Temperature
The M3 glasses melted at different temperatures for 1 hour showed an initial drop in the F e3+ IF e2+ ratio with increasing melting temperature and then an increase, as shown in Table 6.1 and Figure 6.2.
Table 6.1 The relationship between the melting temperature and the Fe3+/Fe2+ ratio for M3 glasses. All the glasses were melted for 1 hour.
Figure 6.2 The Fe3+JFe2+ M3 glasses melted for 1 hour at varying temperatures.
Glass
x M3A
+ M38
* M3C
x M3G
• M3K
Univers
ity of
Cap
e Tow
n
53
The low temperature melts were oxidised, the 1450°C melt was reduced and the higher temperature melts were again oxidised. It appears that very little reduction of the Fe203 occurred during the low temperature melts, hence the oxidised state of the glass. The 1450°C melt allowed the reduction reaction to proceed much faster and the residual carbon in the PF A caused a certain amount of reduction of the melt. In the higher temperature melts the reaction proceeded even faster, causing all the carbon to be burnt off and allowing the atmospheric oxygen to reoxidise the melt. The curve was levelling off between the 1500°C and 1550°C melts, implying that equilibrium conditions were being approached after 1 hour at these temperatures.
6.1.2 Melting Time
Table 6.2 and Figures 6.3, 6.4 and 6.5 show the effect that the melting time has on the Fe3+fFe2+ ratios of the D6, Ml and M3 glasses. All the D6 glasses were melted at 1550°C and the Ml and M3 glasses were melted at 1400°C.
Table 6.2 The relationship between the melting time and the Fe3+/Fe2+ ratios of the D6, Ml and M3 glasses.
Glass Melt Temp (°C) Melt Time (h) Fe3+fFe2+ ratio
D6F 1550 1 3.4
D6D 1550 11/.i 4.1
D6E 1550 2 4.0
D6A 1550 4 2.1
MlB 1400 1 3.9
MlF 1400 1 6.7
MlE 1400 2 7.0
MIC 1400 4 7.1
M3G 1400 1 4.4
M3H 1400 2 3.1
M31 1400 4 4.2
Univers
ity of
Cap
e Tow
n
6-
0
~ .tCD 4 -LL -• .,CD LL
2-
··· .. ..
··· ..... ······· .....
······ ... ···· ....
·· .. x
0'--~~~~l~~~~~l ~~~~l~~~---'I~~~~
0 1 2 3 4 5
Melt Time (hours)
Glass
x 06A
+ 060
* 06E 111 06F
54
Figure 6.3 Changes in the Fe3+/Fe2+ ratios ofD6 glasses melted at 1550°C for different times .
Figure 6.4 Changes in the Fe3+/Fe2+ ratios of Ml glasses melted at 1400°C for different times.
Univers
ity of
Cap
e Tow
n
55
6
Glass 0 ~
"' ..t. M3G .... + "'Cl) 4 lL x M3H -+
"' Cl) • M31 lL
2
o~~~~~~~~~~~~~~~~
0 1 2 3 4 5
Melt Time (hours)
Figure 6.5 Changes in the Fe3+/Fe2+ ratios ofM3 glasses melted at 1400°C for different times.
The Fe3+fFe2+ ratio for D6 (see Figure 6.3) initially increased slightly with increased melting time, reaching a maximum after two hours. A further increase in the melting time caused the Fe3+fFe2+ ratio to decrease rapidly. The plot of the Fe3+fFe2+ ratios for the Ml glasses (see Figure 6.4) shows an increase, until a maximum is reached at 2 hours. For a further increase in the melting time the Fe3+fFe2+ ratio remains almost the same. The Ml glasses were melted at a much lower temperature than the D6 glasses, resulting in the Ml graph being shifted to the left relative to the D6 graph. The graph for the M3 glasses showed the opposite trend, with the iron being reduced at first and then oxidised. The variations in the oxidation state of the iron in the M3 glasses were smaller than the variations that occurred in the other glasses.
6.2 THE FE3+fFE2+ RA TIO AND NUCLEATION
There appears to be some correlation between the oxidation state of the iron in the glass and whether or not bulk nucleation will take place. If the M3 glasses were in an oxidised state (Fe3+fFe2+ ratios of 4-7) bulk nucleation always occurred. However, in the reduced M3 glasses (Fe3+fFe2+ ratios of 1-4) either dense bulk nucleation occurred or surface growth with a few dispersed clusters of bulk nuclei occurred. The only difference between the reduced glasses that bulk crystallised and those that did not were their melting temperatures. The glasses that had been melted at 1400°C always developed bulk nuclei, regardless of their Fe3+fFe2+ ratio. The glasses that were
Univers
ity of
Cap
e Tow
n
56
melted at 1450°C or higher were all reduced and all of them developed surface growth with limited bulk nucleation. The reason for this discrepancy was not determined.
The bulk nucleation behaviour of the two M2 glasses made were also affected by the Fe3+fFe2+ ratios. Glass M2B (melted for 1 hour at 1400°C) had an Fe3+fFe2+ ratio of 7.0 and there was some minor bulk nucleation, while glass M2A (melted for 2 hours at 1530°C) with an Fe3+fFe2+ ratio of2.4 showed no tendency to bulk nucleate.
When the Ml glasses are considered, however, this observation no longer holds. All the Ml glasses were highly oxidised, with values ranging from about 4 to 7.5, yet none of them developed bulk nuclei. This is due to the effect that composition has on the nucleation behaviour of the glasses and was discussed in Chapter 4.
6.3 THE FE3+fFE2+ RA TIO AND GROWTH RA TE
6.3.1 Surface Growth Rates
Figures 6.6 and 6.7, show the effect that the Fe3+fFe2+ ratios of the various glasses had on the surface growth rates measured.
Figure 6.6 The relationship between the Fe3+/Fe2+ ratios for Ml and D6 and their surface crystal growth rates.
Univers
ity of
Cap
e Tow
n
0.3 -en -E .3. Cl>
~ 0.2 ~
'i 0 '-(!)
0.1
-··--····-·· •...
3 4 5 6 3+ 2+ •
Fe /Fe ratio
7 8
57
Crystallisation Temperature
* M2 1000°c
+M2 950°C
-.-M2 900°C
·• M3 950°C
*· M3 850°C
Figure 6.7 The relationship between the Fe3+/Fe2+ ratios for M2 and M3 and their surface crystal growth rates.
Two trends were observed regarding the effect of the Fe3+fFe2+ ratio on the surface growth rates of the glasses. Glasses of the Ml and D6 compositions all showed an increase in growth rate for the melts that were more reduced. The growth rates measured for M2 and M3 were almost constant, with only a small increase in the rate with increasing oxidation of the iron.
The surface growth rates for D6 and Ml increased due to increased levels ofFe2+, which lower the viscosity of the glass (Williamson et al, 1969; Pavlushkin et al, 1982). This means that lowering the Fe3+fFe2+ ratio will allow crystal growth to proceed more rapidly. The effect of the Fe3+fFe2+ ratio on the viscosity of a glass was not investigated for this thesis.
6.3.2 Bulk Crystallisation
In this discussion the term 'bulk crystallisation' is used to describe the process where crystal growth occurs from bulk nuclei that are densely dispersed throughout the volume of the glass. This distinguishes it from surface growth, which happens when crystals grow from the surface of the glass towards the · centre. In surface growth the growth rate is measured as the increase in the length of the crystals as they grow inwards towards the centre. However in bulk crystallisation the progress of crystallisation is determined by the ratio of crystalline material to remaining glass. It is important to realise that in this case this ratio is influenced by both the rate at which the crystals grow as well as the density of the nuclei.
Univers
ity of
Cap
e Tow
n
58
The M3 glasses that bulk nucleated were studied to see if there was any relationship between the rate of crystallisation and the oxidation state of the glass. The glass-ceramics were too inhomogeneous for quantitative analysis.
Figure 6.8 shows the effect that the Fe3+fFe2+ ratio had on the bulk crystallisation of various M3 glasses. M3D and M3G were both melted for 1 hour at 1400°C and M3E and M3H were both melted for two hours at 1400°C. The variations in these glasses, which theoretically had similar melting and heat treatment histories, is caused by the differing Fe3+fFe2+ ratios. These differences between glasses that should have been identical are probably due to the lack of control over the melting procedure.
(a) (b)
(c) (d)
Figure 6.8 The effect of the Fe3+/Fe2+ ratio on the bulk crystal growth rate: a.) M3E, crystallisation heat treated for 24 hours at 850°C; Fe3+/Fe2+ ratio of the glass= 1.1. b.) M3H, crystallisation heat treated for 12 hours at 850°C; Fe3+ /Fe2+ ratio of the glass = 3 .1. c.) M3D, crystallisation heat treated for 24 hours at 850°C; Fe3+/Fe2+ ratio of the glass= 2.2. d.) M3G, crystallisation heat treated for 12 hours at 850°C; Fe3+/Fe2+ ratio of the glass= 4.4.
Univers
ity of
Cap
e Tow
n
59
(e) (t)
(g) (h)
Figure 6.8 cont. e.) M3D, crystallisation heat treated for Yi an hour at 950°C; Fe3+/Fe2+ ratio of the glass= 2.2. f.) M3G, crystallisation heat treated for '!.. hours at 950°C; Fe3+/Fe2+ ratio of the glass= 4.4. g.) M3E, crystallisation heat treated for 4 hours at 900°C; Fe3+/Fe2+ ratio of the glass= 1.1. h.) M3H, crystallisation heat treated for Yi an hour at 900°C; Fe3+/Fe2+ ratio of the glass= 3.1.
There is a trend for bulk crystallisation to proceed more rapidly in the more oxidised glasses studied in this thesis. This observation appears to contradict the findings of Williamson et al (1969), namely that Fe2+ lowers viscosity, allowing crystal growth to proceed more rapidly. This may be counterbalanced by the findings of Rogers and Williamson (1969), namely that Fe3+ is necessary for the formation of spinel nuclei. Hence, the more oxidised glass would have a denser distribution of nuclei and the growth would appear to proceed faster, but in reality growth would only be occurring from more growth points. Unfortunately the lack
Univers
ity of
Cap
e Tow
n
60
of homogeneity in the glasses prevented a study of the density distribution of the spinet nuclei. (See Chapter 7, Section 7.2)
6.4 DISCUSSION
Variations in the melting time of the M3 glasses that were melted at a low temperature caused very small variations in the Fe3+fFe2+ ratios of the glasses. Melting for 1 hour at l 400°C was probably not long enough for the melts to reach oxidation-reduction equilibrium, since Davies et al (1970) found that up to 24 hours were required before equilibrium was reached in glasses with similar compositions melted at low temperatures. As the melting temperature increased the glass would be reduced by residual carbon in the PF A. At higher temperatures the carbon would rapidly bum off and the atmospheric oxygen would re-oxidise the melt.
From the plots of the effect of the melting time on the Fe3+fFe2+ ratio of the D6 and Ml glasses, it appeared that the melts were increasingly oxidised with increasing melting time. The D6 glass was reduced with further increases in the melting time. It is possible that the Ml graph represents only the left hand part of the D6 curve, since the reduction and oxidation reactions would proceed faster at higher temperatures. The graph for the M3 glasses showed the opposite trend, with the iron being reduced at first and then oxidised, while the variations in the oxidation state of the iron in the M3 glasses were smaller than the variations that occurred in the other glasses. The behaviour of the D6 and Ml glasses is contradictory to the expected behaviour, namely that there would be early reduction of the iron by residual carbon from the PF A, followed by oxidation by atmospheric carbon, as happened in the M3 glasses.
The effect of variations in the Fe3+fFe2+ ratio on the nucleation behaviour of the glasses was not always clear. M3 glasses that were oxidised always developed bulk nuclei . If the M3 glasses were reduced, those that had been melted at 1400 C developed bulk nuclei, but those that had been melted at higher temperatures developed surface growth with only a few dispersed bulk nuclei present. The M2 glass that was oxidised developed a few bulk nuclei, while the glass that was reduced only developed surface growth. All of the Ml glasse:; were oxidised, but none of them developed bulk nuclei . However, the lack of bulk nucleation in Ml is a compositional effect.
The D6 and Ml glass-ceramics showed an increase in their surface growth rates for the more reduced glasses. This was due to the effect of the increased number of Fe2+ ions, which lower the viscosity of the glass and therefore allow diffusion to occur more readily and hence the crystal growth rates increase. The M2 and M3 glass-ceramics showed the opposite trend, to a lesser extent. This is contradictory to the expected behaviour and the reason for it could not be established.
The decrease in surface growth rate with increasing oxidation of the glass is supported by the findings of Williamson et al ( 1969) and Pavlushkin et al ( 1982 ), who found that Fe2+ lowers the viscosity of the glass, therefore, lowering the Fe3+fFe2+ ratio will allow crystal growth to proceed more rapidly. The effect of the Fe3+fFe2+ ratio on the viscosity of a glass was not investigated for this thesis. The reason for the slight increases in the surface growth rates with increasing oxidation for the M2 and M3 materials could not be established.
Univers
ity of
Cap
e Tow
n
61
It must be noted that the differences in the surface growth rates between the glasses of different compositions are a compositional effect and not due to differences in the oxidation state of the iron. An increase in the MgO/CaO ratio caused the activation energy for viscous flow to drop and the surface growth rates to correspondingly increase. Variations in the F e3+ IF e2+ ratio can only account for variations in the surface growth rates between glasses of the same composition.
Bulk crystallisation occurred faster in the glasses that were more oxidised. The oxidised glasses had increased levels of Fe3+ ions, which promote nucleation. A denser distribution of nuclei would provide more growth points from which crystallisation could proceed and therefore crystallisation would proceed much faster.
Univers
ity of
Cap
e Tow
n
62
7. MINERAL PHASES AND MORPHOLOGY
7.1 T- AND D-SERIES
The compositions of the T- and D-series glasses are given in Chapter 3, Table 3.2. The mineral phases that developed during the crystallisation heat treatment of these glasses as well as their morphology, were investigated.
7.1.1 Mineral Phases
X-ray diffraction was used to determine the phases present in the heat treated glasses and, if possible, the compositions of the phases if they were members of a solid solution series.
The main phases present in the T- and D-series glass-ceramics were anorthite and melilite. Melilite is a solid solution series between gehlenite (Ca2Al(Al,Si)i07)
and akermanite (Ca2MgSi20 7). There was a small amount of MgO in the lime that was used to make the glasses, hence the melilite was not pure gehlenite, but contained some akermanite, as was discussed in Chapter 3, Section 3.9.1.
In the TB glass-ceramic some perovskite (CaTi03) was detected, arising from the Ti02 contained in the batch. The TA glass-ceramic, which contained only 5 mass percentage ofTi02, showed only trace amounts of perovskite.
7.1.2 Microstructure
Figure 7.1 A photomicrograph of the surface crystallisation occurring in TB.
Univers
ity of
Cap
e Tow
n
63
7.1.3 Composition of Phases
An attempt was made to determine the exact compos1t1on of the melilite, as described in Section 3.9, but the technique was not sensitive enough and the only conclusion that could be drawn was that the melilite consists of more than 50 % gehlenite. Given the composition of the T- and D-series materials, one would expect more gehlenite than akermanite, which is in agreement with these results.
Energy dispersive spectrography (EDS) analyses were done to determine if there was any partitioning of elements between the glass and the crystalline surface layers. Partitioning is the preferential inclusion of a particular element in the crystalline phase, depleting the glass of that element, or the rejection of an element from the crystallising phase, causing the glass to be enriched in that element. The composition was quite uniform across the glass-crystal interface, thus the presence of more than one mineral phase (i.e. anorthite and melilite in the D-series and TA material and anorthite, melilite and perovskite in TB material) enabled the utilisation of all the elements at the growth front. This was found to be the case in both the T-series and the D-series glass-ceramics. X-ray analyses suggested the presence of MgO because of the presence of akermanite in the melilite, but no Mg was picked up in the EDS analyses.
Table 7.1 shows the EDS results for the TB glass-ceramic. The readings were taken at: the centre of the crystalline surface layer; the edge of the crystal growth front; the glass just ahead of the growth front and in the centre of the glass. There is very little variation in the concentration of atoms across the crystal front.
Table 7.1 The percentage concentration of elements at various points on the TB glass-ceramic.
Fe Ti Ca Si Al Mg
Crystal 2 16 37 26 19 0
Growth Front 2 17 36 26 19 0
Glass Edge 2 14 38 28 18 0
Glass 2 14 38 27 19 0
7.2 M-SERIES
7.2.1 Mineral Phases
XRD analyses of the M-series glass-ceramics showed that the major mineral phase present in the glasses that crystallised from the surface and those that bulk crystallised was aluminian diopside (JCPDS 25-1217), with the chemical formula: Ca(Mg,Fe,Al)(Si,Al)i06). Table 7.2 shows the comparison between the dspacings of the major peaks obtained for M3 glass-ceramics and those of the JCPDS standard.
Univers
ity of
Cap
e Tow
n
64
Table 7.2 Diopside: JCPDS 25-1217
MJ JCPDS Standard
20 2d I 2d I hid
27.85 3.206 20 3.210 30 -220
29.95 2.984 100 2.984 100 -221
30.52 2.929 40 2.931 40 310
30.86 2.898 40 2.882 50 -311
35.24 2.547 90 2.546 100 -202
35.96 2.498 60 2.504 70 221
39.37 2.289 30 2.297 30 311
40.69 2.218 20 2.226 30 -312
40.96 2.204 20 2.206 30 3302
42.24 2.140 30 2.134 30 330
42.68 2.119 30 2.120 30 -331
44.77 2.025 50 2.019 60 041
46.13 1.968 15 1.970 20 -132
50.07 1.822 18 1.830 15 -422
53 .00 1.728 25 1.733 30 150
55.00 1.670 30 1.669 30 -313
Since diopside is a member of a solid solution series and can have a range of compositions, as suggested by the chemical formula of the JCPDS standard, this match is good. The small differences in d-spacing between the standard and M3 can be attributed to a small difference in composition.
In the partially crystalline specimens that bulk crystallised there were small peaks of a second phase present at d-spacings of 3.044, 2.446 and 2.004A. The best match was found with the (220), (311) and ( 400) peaks of the cubic mineral, spinel. In XRD-traces of specimens with a high degree of crystallinity only the peak at a d-spacing of 2.446A was still visible, because it is the strongest spinel peak and there are no diopside peaks with similar diffraction angles to obscure it.
Univers
ity of
Cap
e Tow
n
65
Table 7.3 shows the comparison between the d-spacings measured for this second phase and two JCPDS standards for spinel.
The match between the spinel in M3 and the two standards is good. The small differences in the d-spacings can be attributed to experimental error and compositional differences between the spinels.
Substituting MgO for CaO resulted in the system changing from a two phase anorthite and melilite system to a one phase diopside system. The phase diagram in Figure 3 .1 shows the M2 and M3 compositions falling into the spinel field, bordering on the anorthite and melilite fields. The diopside phase field is separated from the spinel phase field by the anorthite and melilite phase fields . The first mineral to crystallise out of the M3 glasses that developed bulk nuclei was spinel. This would have driven the composition of the glass towards either the anorthite or the melilite phase fields. This, however, did not happen, but diopside crystallised instead. It must be remembered that phase diagrams represent the phases that develop when crystallisation occurs directly from the melt. There is also iron present in the glass-ceramics studied, as well as other impurities that could have affected which phases developed.
7 .2.2 Microstructure
There were two dominant microstructures seen in the glass-ceramics of the Mseries materials: surface growth that resulted in the growth of dendrites, and bulk crystallisation that resulted in the growth of rosettes around a nucleus.
All the glasses with the Ml composition developed only dendritic surface crystallisation. The M2 glass that was melted for 1 hour at 1400°C developed both the above morphologies, with the dendritic surface growth being dominant. Figure 7.2 shows the distribution of both the morphologies present in the M2 material.
Univers
ity of
Cap
e Tow
n
66
Figure 7.2 An electron micrograph of a fracture surface of glass M2B heat treated at 900°C for 12 hours. Both surface growth and internal crystallisation are visible.
The M3B glass (melted at 1450°C for 1 hour) developed mainly surface crystallisation that consists of feather-like dendrites that grow from the external surface and pores in the glass and sometimes from the boundaries of other crystals, towards the centre of the glass. The dendrites are about 200µm long and taper down from a breadth of about IOOµm. Figures 7.3, 7.4 and 7.5 show the dendritic growth at different magnifications.
Figures 7.J, 7.4 and 7.5 SEM micrographs of the dendritic surface crystallisation in M3B. The same field of view is seen, with increasing magnification.
Univers
ity of
Cap
e Tow
n
67
In addition to the surface growth some signs of bulk crystallisation are also seen. The bulk crystallisation is unevenly distributed throughout the material. The bulk nucleation was not sufficiently dense to suppress the surface growth. As a result large areas in the centre of the specimens still remained predominantly glassy. This second morphology consists of rosettes growing from regularly shaped nuclei. Figures 7.6, 7.7 and 7.8 show these rosettes. Based on EDS and XRD results, as well as their regular shape and the high relief under the optical microscope, it was concluded that these nuclei are spinets. The rosettes have diameters of about 75µm or less and the spinel nuclei are 5-lOµm in size.
Figures 7.6, 7. 7 and 7.8 SEM micrographs of the rosettes the dendritic growth in M3B. The same field of view has been photographed, with the increasing magnification.
The rosettes grew simultaneously with the surface growth and were enclosed by dendrites as the surface growth progressed. Figure 7.9 shows the rosettes growing in the glass, while in Figure 7 .10 they are situated in the surface crystalline layer. The growth rate of the dendritic crystals was much greater than that of the rosettes, as can be seen in Figure 7 .10, where the surface growth reached the rosettes before they had much time to grow. At this stage the distance that the surface growth had progressed was much greater than the radii of the rosettes. Harper et al (1972) were able to use surface growth rate measurements to determine the rate at which bulk nucleated crystals grew. It was
Univers
ity of
Cap
e Tow
n
68
not possible to use this method to determine the bulk crystallisation rates for the glass-ceramics of the M-series, because the surface crystals grew much faster than the bulk nucleated crystals did. The reason for the differences in growth rate is probably the fact that the surface growth and the bulk crystallisation developed very different microstructures.
Figures 7.9 and 7.10 Optical photomicrographs ofM3B. Figure 5.9 shows the rosettes growing in the glass, while Figure 5.10 shows rosettes enclosed by surface dendrites.
The M3 glasses that were melted at higher temperatures (M3A melted at 1500°C and M3K melted at 1550°C) also had a few dispersed rosettes in them after being crystallisation heat treated. The nuclei in these rosettes were not seen, even at
Univers
ity of
Cap
e Tow
n
69
magnifications of lOOOx (Figure 7.12) in the SEM. It was therefore assumed that they were very small and it would be very unlikely to cut through one when sectioning a specimen. Figures 7 .11 and 7 .12 show the crystals in the M3 A glassceramic. Figure 7.13 shows crystals in the M3K glass-ceramic.
Figures 7.11, 7.12 and 7.13 The first two SEM micrographs are of polished sections through the M3A glass-ceramic. The rough edges of the crystals are noticeable in Figure 7 .12, which is a magnification of a section of Figure 7.11. Figure 7.13 is a SEM micrograph of an etched fracture surface of the M3K glass-ceramic. It shows two crystals in three dimensions.
The M3 glasses that bulk crystallised developed rosettes as the dominant morphology. The micrographs in Figures 7.14 and 7.15 show the very early crystallisation stage of these materials. Figure 7 .14 is an etched fracture surface of an M3J specimen, which was melted at 1400°C for 1 hour and nucleation heat treated at 750°C for 4 hours. Figure 7.15 shows a polished and etched section of M3D, which had a similar melting history to M3J, but the nucleation heat treatment was carried out for 16 hours and not 4 hours. This specimen was also crystallisation heat treated for half an hour at 850°C.
EDS analyses of these crystals, as well as their regular shapes, suggest that they are spine} crystals. In specimens in which crystallisation had progressed much further the nuclei of the rosettes were analysed and found to consist of spinel. For
Univers
ity of
Cap
e Tow
n
70
this reason the crystals shown in Figures7.14 and 7.15 were considered to be the bulk nuclei. The nuclei are 5µm or less in size in the M3J material in Figure 7.14. In Figure 7. 15 the nuclei are larger, up to 15 µm, because the extended nucleation heat treatment time would have allowed more time for the nuclei to grow.
Figures 7.14 and 7.15 Figure 7.14 shows an etched fracture surface of the M3J material. This specimen has only had a 4 hour nucleation heat treatment at 750°C and no crystallisation heat treatment. Figure 7.15 shows the M3D material after a crystallisation heat treatment of half and hour at 850°C.
Figures 7.16 and 7.17 show two stages of crystallisation in the M3D glasscerarrucs. In Figure 7 .16 there is still a large amount of glass present, while the specimen in Figure 7.17 shows only residual glass between the arms of the rosettes.
Figures 7.16 and 7.17 The progress of bulk crystal growth in M3D after 4 hours at 900°C and 950°C respectively.
Univers
ity of
Cap
e Tow
n
71
There was a small amount of dendritic surface growth present around the edges of the specimens, but it was largely suppressed by the densely distributed rosettes and never grew more than about Imm inwards from the surface.
7 .2.3 Composition of Phases
EDS analyses were carried out on glass-ceramics of the M-series. The glassceramics that developed surface crystallisation had no partitioning of elements, so the composition of the crystalline phase can be assumed to be the same as that of the glass from which it crystallised. The calculation of the molecular formula of the diopside in the Ml glass-ceramics gave the formula: Ca(F eo.2 Tio.1 MgO ·0.1 Cao.sAio.s)(SiOo.1Alo3h06.
The calculation of the molecular formula of the diopside in the M2 glass-ceramics gave the formula: Ca(Feo.1 Tio.1M&.2Cao.1Alo.s)(Sio.sAio.2)i06. There is very little difference between the Ml and M2 diopside compositions, besides the presence of more Mg and less Ca in M2, because of the difference in the glass compositions.
The situation for the M3 glasses was not as simple. The M3 glasses that developed surface growth had no partitioning of elements and the diopside had the same composition as the glass, but the M3 glasses that bulk nucleated had considerable partitioning of the elements.
The composition of the diopside in the glass-ceramics with surface growth was calculated as: Cao.sM&.2(M&_5Fe0.2Ti0.1AI0.2)(Si0.8AI0.2)i06. Just as the M2 glass-ceramics had more Mg and less Ca than the Ml glass-ceramic, so too the M3 glass ceramics had more Mg and less Ca than the M2 glass-ceramics. There were not enough calcium atoms to occupy all the M2 sites and therefore magnesium atoms occurred in both Ml and M2 sites. This is tending towards the clinoenstatite composition. (Note: Ml and M2 refer to positions within the diopside lattice and not to the material compositions. A brief discussion of the structure of diopside can be found in the Appendix.)
EDS analyses of the spinet nuclei in the M3 glass-ceramics that developed bulk crystallisation gave the composition: (M&.6Fe0.4)AI20 4. According to Deer et al (1985), spinets, with a Mg:Fe2+ ratio of 3:1 or more are very common in nature. They are known as pleonaste or ceylonite. EDS analyses of the first diopside crystals to form on the spinet nuclei gave the molecular formula: Ca(Feo.3 Tio.1Mgo.2Cao.3AI0.1)(Si0.7AI0.3h06- This formula has greater amounts of calcium and less magnesium and aluminium than the original glass composition.
The results from the EDS analyses are shown in Figure 7.18. A number of analyses were done and the averages were used to plot the graph.
Univers
ity of
Cap
e Tow
n
72
Glass
d
60
Elements
50 -+-Fe
-+-Ti
~ 40 --ca (.)
--Si .E .9 --er <( 30
-+-Al
---Mg 20
10
011========-~~'--~.._~~~-l Nucleus First Growth Glass Glass
a b c d
Figure 7.18 EDS results from the M3 glasses. The x-axis shows the distance from the centre of the nucleus - as can be seen in the schematic diagram of a rosette above the graph. The y-axis is the atomic percentage of the elements.
There is a partitioning effect on the Al, Mg and Fe, which decrease with distance from the nucleus. These three elements were taken up by the spinel nuclei, causing the glass to be depleted. Ca and Si are also partitioned, being rejected by the spinel nucleus, resulting in the glass being enriched in these two elements.
7.3 DISCUSSION
There are two crystal morphologies encountered in the glass-ceramics produced in this study. The first morphology is the dendritic surface growth that occurs in glasses of all three series. The second morphology consists of rosettes that grow from the bulk nuclei that occur in some of the M3 glasses. In the glasses where spinels nucleated rosette growth, the dendritic surface growth was almost completely suppressed.
Univers
ity of
Cap
e Tow
n
73
The minerals that grew were dependant on the compositions of the glasses. Both the T- and the D-series materials developed anorthite and melilite. The TB glass, which had more titania than the TA glass, also had perovskite in addition to these two minerals. The replacement of about 5 mass percentage of CaO with a similar amount of MgO caused the Ml glasses to crystallise out diopside, rather than the anorthite and melilite that crystallised out of D6 glasses. This indicates that a phase boundary was crossed when this replacement was made.
The M3 glasses that bulk nucleated have a second mineral phase, namely spine!, which forms the nuclei on which the rosettes grow. The M3 glass-ceramics that had predominantly surface growth only had a few spine! crystals in them.
Partitioning of elements occurred only in the glasses that bulk nucleated. The partitioning effect was mainly due the growth of the spine! nuclei, which used Fe, Al and Mg, rejecting the other elements. As a result, the glass was enriched in Si and Ca. The composition of the crystallising diopside was very similar to that of the residual glass. This is because diopside is able to accommodate a variety of elements in its structure.
Surface growth proceeded if there were no densely distributed bulk nuclei. This was because the rosettes that grew from the spinet nuclei suppressed the surface growth. The spinet nuclei only grew in the glasses that had high MgO contents. The Fe3+fFe2+ ratios also determined whether the spinet nuclei would be present. If the Fe3+fFe2+ ratio was high there were enough Fe3+ ions for the spinet to grow, but if the Fe3+fFe2+ ratio was low very few spinet crystals grew, because, according to Rogers and Williamson (1969), Fe3+ is needed for spinet crystals to form.
This is of relevance to the apparent contradiction that was pointed out in Chapter 6. Hazeldean and Wichall (1973) found that the Fe3+fFe2+ ratio affected the bulk nucleation and the crystal morphology of the glass ceramics they made. They found that, as the ratio increased, the morphology changed from 'Type-A', which they described as heterogeneously nucleated spherulitic growth to 'Type-B', which they termed dendritic growth. The graph in Figure 2.2 in Chapter 2 shows this effect. Rogers and Williamson (1969) found that Fe20 3 promoted internal nucleation, while FeO had little effect on the nucleation process, although it did encourage rapid crystal growth. These two findings appear to be contradictory, with Hazeldean and Wichall stating that the reduced glasses were heterogeneously nucleated throughout the material, while Rogers and Williamson (1969) state that the more oxidised Fe3+ ions promote bulk nucleation.
The findings of this thesis, indicate that low Fe3+fFe2+ ratios result in dendritic surface growth and that high Fe3+fFe2+ ratios result in bulk nucleated spherulitic growth. This agrees with the findings of Rogers and Williamson (1969), but differs with the conclusions made by Davies et al (1970) and Hazeldean and Whichall (1973).
If the micrograph of the 'Type-A' slag glass-ceramics (Hazel dean and Whichall, 1973) is compared with that of the dendritic surface growth observed in some of the glassceramics studied in this thesis, a remarkable similarity is seen. The 'Type-A' heterogeneously nucleated spherulites are dendrites growing from heterogenities in the glass. Similarly, the microstructure shown in the micrograph of the 'Type-B' slag
Univers
ity of
Cap
e Tow
n
74
glass-ceramic is identical to the rosettes observed in the bulk nucleated glass-ceramics studied in this thesis. Therefore the 'Type-B' microstructure which was described as being dendritic (Hazeldean and Whichall, 1973) consists of bulk nucleated rosettes. The nuclei are not visible in the optical photomicrographs used by Hazeldean and Whichall. This is probably due to the fact that they used much lower nucleation heat treatment temperatures and shorter times, resulting in very small bulk nuclei that were not visible at the magnifications which they used to study the microstructure.
If this interpretation is applied to the findings of Davies et al (1970) and Hazeldean and Whichall (1973) then there is no longer a contradiction with the findings of Rogers and Williamson (1969) and there is also agreement with the findings of this thesis, namely that a low Fe3+JFe2+ ratio results in dendritic growth and bulk nucleation is suppressed .
. ( ,,,.,
Univers
ity of
Cap
e Tow
n
75
8. CONCLUSIONS
In the glasses that were studied, there were a number of parameters that affected their crystallisation behaviour on heat ·treatment. The most important parameters investigated were composition, melting time and melting temperature and the F e3+ IF e2+ ratios of the glasses.
Changes in the composition of the glasses had a considerable effect on the crystallisation of the glasses on heat treatment. Two main compositional variations were investigated, namely the effect of replacing the nucleating agents Cr20 3 and Fe20 3 with Ti02 and also replacing varying amounts of CaO with equivalent amounts ofMgO. .
Titania increased the crystal growth rate of the glasses made in the CaO-AI20 3-Si02 system, by lowering the viscosity of the glass, allowing faster diffusion and hence faster growth rates.
Substituting MgO for CaO caused the system to change from the two phase melilite and anorthite system to a single phase diopside system. This substitution was accompanied by a number of effects. There was a drop in activation energy for surface crystal growth and an increase in the rate of surface growth. For further substitutions of MgO for CaO within the diopside phase field, the activation energy for surface crystal growth and the surface crystal growth rate tended to level off. A large drop in the Tg and Td temperatures was also found to occur when the melilite and anorthite disappeared. This was accompanied by a decrease in the activation energy for viscous flow. Further substitution of MgO for CaO caused small changes in the activation energy for viscous flow.
These changes in activation energy for viscous flow were not, however, accompanied by an immediate change in the bulk nucleation behaviour. A considerable substitution of CaO by MgO was required before bulk nucleation would occur in the glasses. Even then the nucleation behaviour was very sensitive to the melting temperature used. Melting at a temperature not higher than 1400°C produced a glass that developed effective bulk nucleation for the M3 composition and a few dispersed bulk nuclei in the M2 glass. Melting at 1530°C suppressed the bulk nucleation completely in the M2 glass. In the M3 glasses melted at 1450°C or higher, bulk nucleation was sparse or even absent.
The reason that the melting parameters influenced the nucleation behaviour can be attributed to their effect on the oxidation state of the iron. In the glass compositions where bulk nucleation was observed, it was the more oxidised glasses that always showed bulk nucleation and the suppression of dendritic surface growth. The glasses . in which the iron was reduced either had bulk nucleation with suppressed surface growth, or alternatively surface crystallisation with possibly a few bulk nuclei present. This was only the case in the glasses with high MgO and low CaO content~. The other glasses showed no bulk nucleation, regardless of the oxidation state of the iron.
,~ .,-
Univers
ity of
Cap
e Tow
n
77
(a) (b) (c)
>- ~ -·c: + .s «i NQ) «i - u.
~ -(/) +- (/)
>- (')Q) >-,_ ,_ (..) u. (..)
"if. *' Melt Time Melt Time F~iFe2+
Figure 8.3 The relationship between the Fe3+ fFe2+ ratio, volume percentage crystallinity and the melting time for the M3 material.
Visual observations found that the bulk crystallisation rates were faster in glasses with high Fe3+JFe2+ ratios. This was probably due to increases in the distribution density of the nuclei caused by the increased number of Fe3+ ions, which are necessary for the formation of spinet nuclei, according to Rogers and Williamson (1969).
Figures 8.4 and 8.5 show the relationship between the melting time, the Fe3+fFe2+ ratios and the surface crystal growth rates for glass-ceramics of the Ml- and M3-sen es.
(a) (b) (c)
Q) Q) - -ca + ca a:
~ NQ) a:
.r:::. u.
~ .r:::. - +-~ 3: (')Cl>
0 - u. 0 ,_ ---- --- ... C!J --------- C!J
-------
Melt Temp Melt Temp
Figure 8.4 The relationship between the Fe3+fFe2+ ratio, surface growth rate and the melting temperature for the M3 material. The solid line in (a) and (c) represents the surface growth rate and the broken line represents the activation energy for crystal growth.
Q) -ca a: .r:::. ~ 0 ....
C!J
(a)
Melt Temp
+ NQ)
u. +(')Cl> u.
(b)
Melt. Temp
Q)
a; a: .r:::. ~ 0 ....
C!J
(c)
-~-
Figure 8.5 The relationship between the Fe3+fFe2+ ratio, surface growth rate and the melting temperature for the Ml material. The solid line in (a) and (c) represents the surface growth rate and the broken line represents the activation energy for crystal growth.
The melting temperature was found to exert a small effect on the growth of rates of the glass-ceramics that developed surface crystallisation. The Ml materials behaved as
Univers
ity of
Cap
e Tow
n
78
expected, with the surface growth rate decreasing with increasing Fe3+fFe2+ ratios. The M3 glasses, however showed the opposite trend, but on a much smaller scale. The reason for this was not investigated. The influence of the melting temperature on the bulk growth rates could not be investigated, since effective bulk nucleation occurred in only the M3 glasses that were melted at 1400°C.
Two major crystal morphologies were identified in the materials studied. The crystal morphology in the glass-ceramics that displayed surface growth was dendritic. The glasses in which bulk nucleation occurred crystallised via the growth of diopside rosettes on spinet nuclei. There was no partitioning of the elements in the specimens that had surface growth, but considerable partitioning occurred in the glasses that had bulk nucleation, due the formation of the spin el nuclei.
A contradiction appeared to exist between the findings of Davies et al (1970) and Hazeldean and Whichall(1973) and those of Rogers and Williamson (1969). Davies et al and Hazeldean and Whichall found that glasses in which the iron was reduced developed what they termed 'Type-A' heterogeneously nucleated spherulites and oxidised glasses developed a 'Type-B' morphology. This 'Type-B' morphology they interpreted as being dendritic growth. This implies that Fe2+ ions promote heterogeneous nucleation, while the presence of Fe3+ ions results in dendritic crystallisation. Rogers and Williamson found that Fe3+ ions were required for the formation of spinet nuclei in the Mg0-CaO-AI20 3-Si02 system. The findings of this thesis are in agreement with the findings of Rogers and Williamson. Further investigation of the contradiction proved it to be a difference in interpretation and terminology used and not a difference in the nucleation and crystallisation behaviour of the glass-ceramics. Photomicrographs of what Hazeldean and Whichall called heterogeneously nucleated spherulites were similar in appearance to the surface dendrites observed in glasses studied in this thesis. The microstructure which Hazeldean and Whichall described as dendritic is similar in appearance to the bulk nucleated rosettes seen in some of the M3 glass-ceramics studied in this thesis. Therefore, oxidised glasses do result in bulk nucleation, while dendritic growth develops in reduced glasses.
In conclusion, the system studied is very sens1t1ve to even small changes in composition and melting conditions. There are a number of interrelated factors that govern the behaviour of these glasses and the relationships between them are complex.
Univers
ity of
Cap
e Tow
n
79
REFERENCE LIST
BARRY,T.I. (1979): The Mineralogy of glass-ceramics. Brit. Ceram .. Soc. Proc., 29, ppl-22
CARPENTER,P.R., CAMPBELL,M., RAWLINGS,R.D., ROGERS,P.S. (1986): Spherulitic growth of apatite in a glass-ceramic system. Journal of Materials Science Letters, 5, pp 1309-1312
DA VIES,M.W., KERRISON,B., GROSS,W.F., ROBSON,M.J. and WICHALL,D.F. (1970): Slagceram: A glass ceramic from blast-furnace slag. Journal of Iron and Steel, pp 348- 370
DEER, W.A., HOWIE,R.A. and ZUSSMAN,J. (1986): Rock Forming Minerals, Vol. lB, Disilicates and Ring Silicates, 2nd ed. Longman Grp, London
DIPICIDKOV,F., BORISOV,I., (1975): Effect of some additives on the crystallisation of glass - ceramics. Stroit. Mater. Silik. Prom-st, 16, [6] pp 24 -28.
GOODMAN,C.H.L., (1975): Strained mixed cluster model for glass structure. Nature, 257, 370
GOODMAN,C.H.L., (1983): Mixed cluster, viscous melts and glass formation. The Structure ofNon-Crystalline Materials, ppl97-200.
GOODMAN,C.H.L., (1986): The structure of silica glass and its surface. Physics and Chemistry of Glasses Vol. 27, Nol, pp27-31
GOODMAN,C.H.L., (1987): A new way of looking at glass. Glass Technology, Vol. 28, No.1
HARPER,H and McMILLAN,P.W. (1972): The formation of glass-ceramic microstructures. Physics and Chemistry of Glasses, Vol.13, N0.4
HAZELDEAN,G.S.F. and WICHAL,D.F. (1973): Effect of chemical composition on nucleation and crystallisation of slag-based glass-ceramics. Journal of The Iron and Steel Institute, Aug., pp574-580
HEADLEY, T.J. and LOEHMAN,R.E. (1984): Crystallisation of a Glass-Ceramic by Epitaxial Growth. Journal of the American Society, Vol67, NO. 9, pp620-625
HILLIG,W.B. (1964): A Theoretical and Experimental Investigation of Nucleation Leading to Uniform Crystallisation of Glass. Symposium on Crystallisation in Glasses and Melts, American Ceramic Society, Inc.,
HING,P. and McMILLAN,P.W. (1973): A transmission electron microscope study of glass-ceramics. Journal of Materials Science, 8,pp340-348
HLAVAC,J (1983): The Technology of Glass and Ceramics, An Introduction. Glass and Science Technology, 4, Chap3
KIRBY,M.J (198?): Mineral wool from PFA. BSc(Hons) Thesis, UCT
Univers
ity of
Cap
e Tow
n
.. • ... • --• -
80
KIRBY,M.J. (1991): Glass ceramics from a South African pulverised fuel ash. M.Sc. Thesis, UCT
KIRSCH,M., BERGER,G., BANACH,U., HUBERT,T. (1988): Vitroceramics - A Non-Conventional Kind of Ceramics. Interceram. 3,pp34-38
KISLITSYN,B.F., SAS,R.I., GOLIUS,T.E., POLISCHUC,N.A., (1980): Production of glass ceramic articles from open hearth furnace slag., Steklo Keram
KLEMENTASKI,S. and KERRISON,B. (1966): Slagceram, A New Constructional Material. Chemistry and Industry, pp 1745-53
KUMAR,B. and RINDONE,G.E. (1979): Phase separation characteristics of a soda-lime-silica glass as influenced by melting atmosphere. Physics and Chemistry of Glasses, Vol.20, No. 6
LE ROEX,A.P. and WATKINS,R.T. (Not yet published): A rapid ion chromotographic method/or the determination of the Fe3+/Fe2+ ratio in silicate rocks and minerals. (Submitted to Chemical Geology, 12/03/93)
LEVIN,E.M., ROBBINS,C.R. and McMURDIE,H.F. (1964): "Phase Diagrams for Ceramicists", American Ceramics Society.
LEWIS,M.H., METCALF-JOHANSEN,J. and BELL,P.S. (1979): Crystallisation Mechanisms in Glass-Ceramics. Journal of The American Ceramic Society. Vol.62, No5-6, pp278-288
MAIER, V. and MuLLER,G. (1988): Nucleation and Crystallisation in Mg-Alsilicate-glass-ceramics. c.fi./Ber, 65, 617, 208-212.
McCOLM,I.J. (1983): Ceramic Science for Materials Technologists, Leonard Hill, London, pp 204-234
McMILLAN,P.W. (1969): Non-Metallic Solids Vol. 1 Glass-ceramics. Academic Press London
McMILLAN,P.W. (1982): The Crystallisation of Glass. Journal of Non-Crystalline Solids, 52, pp 67-76
NEGRO,A. and BACIIlORRINI,A. (1978): Use of blast-furnace slags in the preparation of glass-ceramics. Ceram. Inf (Faenza), 13[19] pp523-532
PARTRIDGE,G. (1987): A review of surface crystallisation in vitreous systems. Glass Technology, Vol. 28, No.I pp9-18
PAVLUSHKIN,N.M., SARKISOV,P.D. and ORLOVA,L.A. (1982): Catalysed Glass-crystallisation processes and synthesis of slag sitalls. Zhurnal V ses. Khim . Vol. 27, No. 5, pp 30-38 .
RICHARDS,S.R., HART,A.T., LANIGAN,P.G. and FRAZER,F.W. (1976): Crystallisation of glass-ceramics from glasses based on blast furnace slag . Journal of the Australian Ceramic Society. 12, 1, pp7-12
Univers
ity of
Cap
e Tow
n
81
ROGERS,P.S. and WILLIAMSON,J. (1969): The Nucleation of Crystalline Phases in Silicate Glasses Containing Iron Oxides. Glass Technology Vol. 10 No. 5
SCHERER,G.W. and UHLMANN,D.R. (1976): Effects of phase separation on crystallisation behaviour. Journal ofNon-crystalline Solids Vol. 21, pp199-213
TOPPING,J.A. (1976): The Fabrication of glass-ceramic materials based on blast furnace slag - A Review. Journal of the Canadian Ceramic Society, Vol. 45, pp 63-67
VOGEL,W. (1966): Inter-relationships between microheterogeniety, nucleation and crystallisation in glasses. Glass Technology, Vol.7, No.I, ppl5-21.
VOGEL,W. (1971): Structure and Crystallisation of Glasses. Pergamon Press Ltd., Braunschweig, Germany.
VOGEL,W. and GERTH,K. (1964): Catalysed Crystallisation in Glass. Symposium on Crystallisation in Glasses and Melts, American Ceramic Society, Inc., ppl 1-22
WILLIAMSON,J. (1970): The kinetics of crystal growth in an aluminosilicate glass containing small amounts of transition-metal ions. Mineralogical Magazine, Vol. 37, No. 291, pp759-770
WILLIAMSON,J., TIPPLE,A.J. and ROGERS,P.S. (1968): Influence of iron oxides on kinetics of crystal growth in Ca0-Mg0-Al203-Si02 glasses. Journal of The Iron and Steel Institute, September 1968, pp898-903
WILLIS,J.P. (1987): Variations in the composition of South African Fly Ash. Pro. International Symposium on Ash - a Valuable Resource. CSIR, Pretoria.
VEASEY,T.J. (1973): Recent developments in the production of glass-ceramics. Miner. Sci. Engng, Vol. 5, No. 2, pp 92-107.
Univers
ity of
Cap
e Tow
n
82
APPENDIX
MINERALS OF INTEREST
1 Diopside
Diopside (Ca(Mg,Fe)(Si20 6)is a member of the pyroxene group of chain silicates. The name diopside is derived from two Greek words which mean double appearance, because its vertical prism zone can be oriented in two ways. The unit cell is monoclinic. The hardness on the Moh scale is between 5 and 6.5 (Hurlbut et al, 1977).
Natural pyroxenes exist as a complete solid solution series between diopside, (magnesium rich) and hedenbergite, (iron rich). Aluminium is usually present, replacing silicon, but in naturally occurring rocks it does not usually exceed 10 %. Diopside is commonly found in thermally metamorphosed calcium-rich sediments. This is consistent with its occurrence in heat treated glass ceramics.
The diopside solid solution series and particularly aluminian diopside have a melting range between 1400°C and 1000°C. This means that the diopside is stable within the heat treatment temperature range used for crystallisation of the PF A glasses, which is below 1000°C (Deer et al, 1985).
Structure
Diopside consists of [Si03]x chains linked laterally by calcium and magnesium atoms. Each chain is formed by Si04 tetrahedra sharing two comers with two other tetrahedra, hence the overall ratio of Si:O is 1:3. There are two positions for the other metal atoms, the Ml and theM2 positions.
o~ • Silirm oc--. Q .W.waiw&
Figure A.1 The atomic structure of diopside (after Deer et al, 1963).
Univers
ity of
Cap
e Tow
n
83
I) The M 1 position is in octahedral co-ordination with the oxygens, each of which forms a comer to one silicon centred tetrahedron. This position falls between apices of the [Si03]x chains, and is normally occupied by magnesium atoms.
2) The M2 sites are surrounded by 8 oxygens. Two of these oxygens are shared by two silicon centred tetrahedra, while the remaining 6 oxygens are located at unshared comers of tetrahedra. These positions fall between the bases of the [Si03]x chains, and are normally occupied by calcium atoms. There is no displacement of the chains in the y-direction, but they are staggered in the z-direction, hence the monoclinic symmetry of the diopside crystal. If there are not enough calcium atoms to occupy the M2 sites magnesium will occupy both the Ml and M2 positions, as occurs m clinoenstatite (Deer et al, 1963). Figure A. I shows the diopside structure.
2. Melilite Group
The melilite group is a ring silicate, with two common members being gehlenite (Ca2(AI2Si07)) and akermanite (Ca2(MgSi20 7)). Iron rich melilites can be synthesised, and often crystallise out of blast furnace slag. The name melilite is derived from the Greek word meli, meaning honey, because of its yellow colour. Akermanite and gehlenite were named after prominent researchers. Melilite has a Moh's hardness of between 5 and 6. The melting point of the members of the series varies between 1590°C for gehlenite and 1454°C for akermanite.
Structure
Figure A.2 The atomic structure of melilite (after Deer et al, 1985).
The unit cell is tetragonal. Akermanite has a magnesium atom at each comer and the centres of the faces. Each magnesium atom forms the centre of a tetrahedron, surrounded by 4 oxygens. Each. of these oxygens is shared with another tetrahedron with a silicon atom in the centre. The silicon. centred tetrahedra are linked in pairs, hence the Si:O ratio is 2:7. This forms five membered rings of 3 silicon centred tetrahedra (either T2 or T3) and 2 magnesium centred tetrahedra
Univers
ity of
Cap
e Tow
n
84
(called Tl). These rings are linked to form corrugated sheets. The sheets are held together by Ca-0 bonds. In synthetic akermanite the distribution of silicon in T2 sites and magnesium in Tl tetrahedra is completely ordered, as shown in Figure A.2.
Pure gehlenite has aluminium replacing some of the silicon and all of the magnesium. The ordering is found to be: silicon occupies the Tl tetrahedra, while the T2 tetrahedra are occupied by equal numbers of aluminium and silicon atoms, (Deer et al, Vol. lB, 1986).
3 Anorthite
Anorthite is an end member of the common plagioclase feldspar series, the other end member being the sodic albite. The chemical formula of anorthite is CaA12Si20 8.
Anorthite has a hardness of 6-6.5 on the Moh scale. The melting point of pure anorthite is 1550°C.
Structure
The unit cell is triclinic, and hence the name anorthite, which is derived from the Greek word for oblique. It is a framework silicate, consisting of linked [Si,Al]-0 tetrahedra, giving the ratio 4[Si,A1]:80. There are large interstices in the framework, which are occupied by calcium ions. High and low temperatures forms exist. The low temperature anorthite structure consists of an ordered alternation of silicon and aluminium atoms (Deer et al, 1963).
4. Spinel
Spinel is an isometric mineral, usually crystallising as an octahedron. It may have dodecahedral truncations. (If four of the corners surrounding one plane of an octahedron are truncated the resulting shape will be a 12-sided dodecahedron, hence the term 'dodecahedral truncation'.) Crystals may also be twinned along the {111} direction. Twinning is usually simple, but multiple twins may occur. These two factors result in some unusual, but regular shapes if the crystal is sectioned during polishing for viewing under a microscope. Spinel has a hardness of between 7.5-8 on the Moh scale. The chemical formula for pure spinel is MgA120 4, which is the most common of the spinets, followed by hercynite (Fe2+ AI20 4). There is a continues replacement between these two end members. Of particular interest is the commonly occurring pleonaste or ceylonite with a Mg:Fe2+ ratio of 3: 1. Pure spinet is very refractory, with a melting point of 2135°C +-20°C. Spinet crystals may be identified under the optical microscope by their octahedral form and high relief (i.e. the spine! usually appears to be elevated above the rest of the minerals in the cross section viewed).
Structure
Spine! has a cubic structure, with 32 oxygen ions and 24 cations in a unit cell. The oxygen ions are in a close packed face centred cubic arrangement, but the smallest repeat unit, or unit cell, needs to be larger than the four oxygen fee lattice, because two types of cation need to be accommodated. Of the 24 cations 8 are in
Univers
ity of
Cap
e Tow
n
85
four-fold co-ordination and 16 are in six-fold co-ordination. In a normal spinel the tetrahedral sites are known as A sites and accommodate divalent cations, while the octahedral, or B sites accommodate trivalent cations. Inverse spinels also exist, with a different cation arrangement, but they are not of interest to this study (Kingery et al, 1976). If the unit cell is viewed perpendicular to the triad axis, shown in Figure A.3, the layers of oxygen ions alternate with layers of cations. The cation layers themselves alternate, with every second layer containing only B sites and the other layers containing both A and B sites in the ratio A "13 = 2: 1.
0 Oxygen @ Four-fold coordination positions (A)
• Six-fold coordination positions (8)
- - - - Triad axis
Figure A.3. The atomic structure of spinet. (after Deer et al, 1985.)
REFERENCES
DEER, W.A., HOWIE,R.A. and ZUSSMAN,J. (1985): An Introduction to Rock Forming Minerals. Longman Grp Ltd, Hong Kong.
DEER, W.A., HOWIE,R.A. and ZUSSMAN,J. (1986): Rock Forming Minerals, Vol. I B, Disilicates and Ring Silicates. 2nd ed. Longman Grp, Britain
DEER, W.A., HOWIE,R.A. and ZUSSMAN,J. (1963): Rock Forming Minerals, Vol. 2, Chain Silicates. Longman, Green and Co. Ltd, Great Britain
DEER, W.A., HOWIE,R.A. and ZUSSMAN,J. (1963): Rock Forming Minerals, Vol. 4, Framework Silicates. Longman, Green and Co. Ltd, Great Britain
HURLBUT,C.S. and KLEIN,C. (1977): Manual of Mineralogy (after Dana). 19th ed. John Wiley and Sons, Inc., USA
KINGERY,W.D., BOWEN,H.K. and UHLMANN,D.R. (1976): Introduction to Ceramics. Second Edition. John Wiley and Sons, Inc. New York p64