Page 1
Validation of the Application of Backscattered Ultrasound and
Photoacoustic Signals for Assessment of Bone Collagen Contents Using
Hydroxyprline Assay
by
Shendu Ma
998736293
A thesis submitted in conformity with the requirements for the degree of
BACHELOR OF APPLIED SCIENCE AND ENGINEERING
Department of Mechanical and Industrial Engineering
University of Toronto
Supervisor: Professor A. Mandelis
April 23, 2012
Page 2
2
i
ABSTRACT
In the previous research on the application of backscattered ultrasound (US) and
photoacoustic (PA) signals for the assessment of bone collagen and mineral contents,
Center for Advanced Diffusion-Wave Technologies (CADIFT) has identified that both PA
and US are sensitive to mineral content changes. In addition, PA is also sensitive to changes
in the collagen content of the bone, but US is not significantly sensitive to these changes.
This thesis project focuses on using hydroxyproline (HP) collagen assay to validate the
sensitivity of US and PA on collagen content assessment in bone samples. Results from
the HP collagen assay qualitatively support the conclusion from previous research.
Effectiveness and efficiency of HP collagen assay on measuring total collagen content level
for the samples used in previous research settings is confirmed with positive match between
the predicted and measured collagen content levels. Ongoing process and further direction
involve building quantitative correlation between specific collagen content level and US
and PA signal.
Page 3
3
ii
ACKNOWLEDGEMENTS
I would like to express my sincere appreciation to Professor Andreas Mandelis for
his continuous support and encouragement since my summer research at CADIFT in 2014.
In September 2015, Professor Andreas Mandelis kindly gave me the opportunity to
participate in this thesis project as part of his ongoing project that could potentially lead to
publication. Throughout the entire process of this thesis project, Professor Andreas
Mandelis has generously provided me with abundant research resources, precious personal
time and inspiring academic support.
I would like to thank Dr. Bahman Lashkari for his supervision and instruction on
this thesis project. As my closest colleague and most helpful teacher in the lab, Dr. Bahman
Lashkari has always been patient and helpful throughout this project.
Lastly, I would like to thank Professor Craig Simmons, Professor Edmund Young
and Professor Michael Sefton from the Department of Mechanical and Industrial
Engineering at University of Toronto for providing me useful information and authorizing
me to use their lab facilities to finish this project.
Page 4
4
TABLE OF CONTENTS
LIST OF FIGURES ............................................................................................................ 5
LIST OF TABLES .............................................................................................................. 6
1.0 INTRODUCTION ........................................................................................................ 7
2.0 BACKGROUND ........................................................................................................ 11
2.1 COLLAGEN CONTENT IN BONES ............................................................................... 11
2.2 DECOLLAGENIZATION OF BONE TISSUE ................................................................... 12
2.3 UA AND PS ASSESSMENT ........................................................................................ 13
3.0 LITERATURE REVIEW ........................................................................................... 16
3.1 ELISA COLLAGEN ASSAY ....................................................................................... 17
3.2 SIRIUS RED COLLAGEN ASSAY ................................................................................ 17
3.3 HYDROXYPROLINE COLLAGEN ASSAY ..................................................................... 18
4.0 EXPREMENTAL PROCEDURE .............................................................................. 20
4.1 LIST OF MATERIAL ................................................................................................... 20
4.2 SAMPLE PREPARATION – HYDROLYSIS .................................................................... 21
4.3 ASSAY PROCEDURE .................................................................................................. 22
5.0 RESULTS ................................................................................................................... 23
5.1 ASSUMPTIONS AND CONDITIONS: ............................................................................. 23
5.2 RAW RESULTS OF COLORED PLATE ......................................................................... 24
5.3 CALCULATIONS AND DATA HANDLING .................................................................... 27
6.0 DISCUSSION ............................................................................................................. 31
6.1 REPRODUCIBILITY AND REPEATABILITY .................................................................. 31
6.2 AGREEMENT TO DECOLLAGENIZATION GROUP SAMPLES ........................................ 31
6.3 DEFICIT FOR DEMINERALIZATION GROUP SAMPLES ................................................ 34
6.4 OTHER SOURCES OF ERROR ..................................................................................... 34
7.0 ONGOING PROCESS AND FUTURE DIRECTION ............................................... 38
8.0 CONCLUSION ........................................................................................................... 39
REFERENCES ................................................................................................................. 41
FIGURES AND TABLES ................................................................................................ 52
11.0 APPENDICES .......................................................................................................... 53
11.1 APPENDIX A: COMPARISONS BETWEEN COLLAGEN ASSAY METHOD AND KIT OFF-
THE-SHELF ..................................................................................................................... 53
11.2 APPENDIX B: HYDROXYPROLINE COLLAGEN ASSAY PROTOCOL FROM CHONDREX
INC. ................................................................................................................................ 57
Page 5
5
LIST OF FIGURES
Figure 1: Color Comparison between First Batch of Samples (on the right) and Second
Batch of Samples (on the left). ......................................................................................... 24
Figure 2: Raw Results before Adding Dyeing Agents...................................................... 25
Figure 3: Hydroxyproline Assay Results for Tested Samples. ......................................... 26
Figure 4: Sample Taken from Different Sites on the Same Bone Tissue. ........................ 33
Figure 5: Cap Deformation due to Over-heating during Incubation................................. 36
Figure 6: Cap Screw Thread Corrosion due To Volatilized HCl during Incubation. ....... 36
Page 6
6
LIST OF TABLES
Table 1: Materials used in Hydroxyproline Collagen Assay ............................................ 20
Table 2: Content in the Wells on the Plate. ...................................................................... 27
Table 3: Semi-quantitative Results for Tested Samples (units all in μg/ ml). .................. 28
Table 4: Translated Results in Weight Percentage. .......................................................... 29
Page 7
7
1.0 INTRODUCTION
In the previous research on the application of backscattered ultrasound (US) and
photoacoustic (PA) signals for the assessment of bone collagen and mineral contents
conducted by the Center for Advanced Diffusion-Wave Technologies (CADIFT), the
backscattered US and back-propagating PA signals from trabecular bones, and their
variations with reduction in bone minerals and collagen content were examined (1). The
results showed that both PA and US are sensitive to reduction of the mineral content of
bone. Moreover, PA is also sensitive to changes in the collagen content of bone, but US is
not significantly sensitive to these changes (1).
In the previous research, the samples were washed and kept in saline solution for
up to 2 days to dissolve the blood inside the pores. The samples were treated either with
ethylenediaminetetraacetic acid (EDTA) or with hypochlorite solution (NaOCl). The first
group was demineralized with 50% solution of EDTA in distilled water (pH=7.7) for
decalcification simulating the osteoporosis disease. This solution produces a very slow and
gentle demineralization (2, 3). The extent of the demineralization depends on solution
concentration and exposure duration as well as on the exposed area and bone compactness.
The second group was treated with sodium hypochlorite solution to decollagenize the
sample (4, 5). The exposure duration for samples treated with EDTA was 5 hours except
for sample 1 which was demineralized for 10 hours; and the samples treated with
hypochlorite solution which was demineralized for 3 hours except for sample 2 which was
decollagenized for 6 hours.
The major issue with the demineralization and decollagenization method is that it
does not provide the exact weight percentage of the mineral or collagen content remained
Page 8
8
in the samples after treatments. In order to obtain these numbers and quantitatively
correlate the percentage of mineral or collagen loss with US and PA results, additional
measurement is needed. The other minor issue with this demineralization and
decollagenization method is that the desired degree of demineralization or
decollagenization is obtained by changing solution concentration, exposure duration as
well as exposed areas and bone compactness. The operation is cumbersome and the
accuracy is hard to maintain. Since the objective of the previous research is to propose the
integrated application of US and PA assessment and to examine the relative sensitivity of
it, the desired resolution on the demineralization and decollagenization control level is
relatively low. However, as the research moves forward, a motivation to quantitatively
correlate the results of US and PA assessment to variations in collagen and mineral content
in the samples is encouraged. A more accurate quantitatively controlled demineralization
and decollagenization is also needed for improvement on the resolution of US and PA
assessment.
Due to the complexity of the composition of bone content (6, 7), solving the latter
issue would require more time and resources beyond the scope of this thesis. Moreover,
the current controlling methods of demineralization and decollagenization have advantages
of easy to use, efficient and reliable. It is of a lower priority in terms of validating the results
from previous research compared to the second issue. Although bone mineral density
(BMD) is definitely a major factor in the strength of bones, new studies suggest the chance
of bone fracture even without BMD deficit (6-8). Bone minerals are responsible for
compression strength of the bone and a vital factor for bone integrity. On the other hand,
the organic phase of bones which is mainly collagen type I provides the bone with tensile
Page 9
9
strength and ductility due to its viscoelastic properties. The reduction of collagen content
with aging (9-11) could be an important factor increasing fracture risk without decrease in
bone minerals. The changes of collagen cross-links during osteoporosis have been the
subject of several studies (12-14). There are still many unclear issues and more research is
needed on the variation of the organic phase of bones with aging and as a result of diseases
such as osteoporosis and diabetes. Therefore, any method or modality that can assess either
the collagen content, or collagen cross-linking, or both, may assist in better understanding
of bone diseases, their diagnosis and even the selection of therapeutic strategies. Some
studies have proposed the assessment of collagen cross-linking by analyzing the urine or
serum (11, 12).
To conclude, because of the reasons stated above, it is not included in this thesis to
optimize the control of demineralization and decollagenization and to validate the bone
mineral content result of the US and PA assessment. The focus of this thesis is to find an
effective and efficient method to measure the bone collagen content level in both treated
and untreated samples. The requirement of the solution is open to destructive method. The
solution could be mechanical, biochemical, chemical etc. The solution should also be able
to support the results from the previous research on US and PA assessment on bone density
detection. The results of measured collagen content level using the final solution proposed
in this thesis should match the results from previous research. Furthermore, after
comparison and analysis over the candidate solutions, a detailed list of material,
experimental procedure, results calculation and analysis of the final solution should be
documented. Then, a verification run of the final solution on the samples used in the
previous research is performed. The results from the verification run is analyzed. In the
Page 10
10
discussion section, deficit between results from the final solution and the previous research
is compared and source of error is analyzed. The thesis is concluded with future direction
and improvement.
Page 11
11
2.0 BACKGROUND
In order to explore the possible solutions that can measure the bone collagen content level,
the role of collagen content in bones, characteristic of collagen content, and reactions with
collagen content need to be reviewed. Secondly, since samples from both before and after
demineralization and decollagenization treatment are tested, the treatment itself and its
effect on the collagen content needs to be evaluated. Lastly, as the validation is required to
match the result from the US and PA methods, they need to be briefly investigated.
2.1 Collagen Content in Bones
Bone is a highly complicated tissue that is capable of adapt itself to mechanical
environment. According to its density, bone can be divided into cortical bones and
trabecular bones. Bone matrix is the smallest unit of bone tissue which consists of the
mineral phase and the collagen fibers. The mineral phase contributes to the stiffness of the
bones while the collagen fibers contributes to the toughness of the bones (7). The
anisotropic structure of bones and the material properties of bone tissues endows the
function of resisting mechanical loads. Bone strength is related to five factors: geometry of
bones, microarchitecture of trabecular bones, the turnover, the mineral and the collagen.
Bone appears to be the only tissue that contains a significant pool of immature crosslinks
(15). Several studies conclude that bone strength is strongly related to tissue mass and
stiffness, which is determined by the mineral phase (16-18), whereas the collagen matrix
contributes mainly to bone toughness (19-24).
Most of the non-cartilaginous tissues including the bone tissues contain both Type
I and Type III collagen (25-27). The individually banded collagen fibers in bone tissues
are also likely to contain Type V collagen (28). Tendon and bone have been considered
Page 12
12
exceptions to the foregoing generalizations, and the banded fibers of bone are believed to
be composed almost exclusively of Type I collagen. According to evidences from different
biochemical studies such as the studies of bone collagen chemical composition (29),
characterization of the biosynthetic products of bone-derived cell cultures (30), and indirect
immunofluorescent localization (31); it is concluded that bone is an exception to the
foregoing generalization of Type I collagen. Type V collagen has been extracted directly
from bone (32). It was validated and concluded by Douglas R. K.et al. that Type III
containing collagen fibers are detected at all ages examined, from 30 fetal weeks to 80
years. Type VI collagen is present in fetal bone in discrete fibrils separate from Type III
collagen, and becomes restricted to the margins of bone cells and the bone surface by 7
years (33). Therefore, in order to obtain the total collagen content level within cattle bone
samples, the collagen assay must be able to detect collagen Type I to Type VI so that it
will cover all possible types of collagen existed in bone tissues.
2.2 Decollagenization of Bone Tissue
In the previous research, three cattle femurs (Angus, Canadian) were purchased
from a local butcher. Ten trabecular bone samples were cut from the femurs. Samples were
cut with a saw to produce flat measurement areas without any cortical over-layer. The
samples were washed and kept in saline solution for up to 2 days to dissolve the blood
inside the pores. The samples were treated either with ethylenediaminetetraacetic acid
(EDTA) or with hypochlorite solution (NaOCl). The first group was demineralized with
50 % solution of EDTA in distilled water (pH=7.7) for decalcification simulating the
osteoporosis disease. This solution produces a very slow and gentle demineralization (34,
35). The extent of the demineralization depends on solution concentration and exposure
Page 13
13
duration as well as on the exposed area and bone compactness. The second group was
treated with sodium hypochlorite solution to decollagenize the sample (35-37). For ease of
reference to the samples, those demineralized with EDTA are identified with odd numbers
and the ones which were decollagenized with hypochlorite solution are classified with even
numbers. The exposure duration for samples treated with EDTA was 5 hours. Exceptions
were: Sample 1 which was demineralized for 10 hours; and the samples treated with
hypochlorite solution which were demineralized for 3 hours except for sample 2 which was
decollegenized for 6 hours (sample numbering is consistent from previous research to this
thesis project).
The decalcification treatment should not have any interaction with the
decollagenization treatment since only non-organic composition is removed in the
decalcification treatment. This decollagenization method removes collagen content in
samples regardless of the types of collagen. However, when EDTA binds with metallic
ions, it can also act like antioxidant. Therefore, for samples that are only treated with
EDTA, they could possibly reflect antioxidant properties. This effect could potentially lead
to an elevation of collagen content in EDTA treated samples compared to untreated
samples as the organic composition of such samples may have higher resistance to organic
oxidation over time (34-37).
2.3 UA and PS Assessment
The use of ultrasound for diagnosis of osteoporosis started in the 1980s and
essentially depends on the measurement of the speed of sound (SOS) and on normalized
broadband ultrasonic attenuation (nBUA) (38-42). New approaches such as fast and slow
wave detection and backscattered ultrasound were also introduced recently (42-45) and
Page 14
14
clinical instruments based on these parameters were proposed (43, 46). Although they did
not reduce the dominance of SOS and nBUA measurements in quantitative ultrasound
(QUS), these alternative approaches introduce parameters that may reveal more
information about the state of health of trabecular bones. The large number of mechanical
parameters affecting the ultrasonic response, as well as the substantial variation of human
bone tissue and complexity of its structure, are the major challenges of QUS in offering a
reliable diagnostic method for osteoporosis. Nevertheless, the backscatter method has the
advantage of facilitating measurements at crucial sites like hip or spine where the risk of
fracture is high. Several parameters have been introduced and applied to quantify bone
backscattered ultrasound. Some typical parameters are the frequency dependent
backscatter coefficient (BSC or η(f)) (47-54), the apparent integrated backscatter (AIB)
(55-58), and the broadband ultrasound backscatter (BUB) (59-62).
In the previous study, Lashkari et al. measured both the US backscattering and also
the photoacoustic (PA) back-propagating signal. The dependence of the PA signal on
optical properties of the tissue provides more specific information about bone composition
and structure. In their previous studies (63-66), it was shown that laser light can penetrate
at least as deep as 1.5 mm in cortical bone and 3 mm in cancellous bone and can generate
a detectable PA signal from those depths. It was shown that the PA back-propagating signal
is sensitive to controlled changes of bone minerals. The PA signals also indicate the
sensitivity to variation in bone composition. PA signal could also be detected as “coherent
structure backscattering” in a way very similar to ultrasound in frequencies above 1 MHz.
PA was also used to generate guided ultrasound waves in long bones for bone assessment
(66, 67).
Page 15
15
To conclude, the signal measured as AIB by US and PA in dB reflects the level of
mineral or collagen content in bone samples, the negative sign of the results refers to a
demineralization or decollagenization treatment. The larger the magnitude, the more
sensitive the assessment is on the specific sample.
Page 16
16
3.0 LITERATURE REVIEW
Appropriate methods that fits the objective of quantify collagen content in bone
samples are reviewed in this section. The most effective biochemical application is to use
the chemicals that selectively bind to specific bonds in unique amino acids existing in
specific type of collagen. Antibodies that bind to specific pathogens on the amino acid or
the collagen fiber can also satisfy such application through similar mechanism. Based on
this theoretical background, the following collagen assay could be our candidate solution:
ELISA for specific types of collagen (68, 69)
ELISA for specific pro-domains of collagen (68, 69)
Western blotting using specific collagen antibodies (69, 71)
Sirius Red based assays for soluble collagen (71-73)
Tissue hydrolysis followed by analysis of Hydroxyproline residues (either by a
colorimetric kit or by HPLC) (74-76)
Based on the feature of these methods and the requirements for our application,
since the photoacoustic and ultrasonic signal detects collagen content regardless of its type,
an assay with no discrimination on collagen type should be chosen. Thus, both Sirius red
and hydroxyproline methods are suitable candidate for our experiment. However, since our
sample would be solid and non-cultured after been tested by photoacoustic and ultrasonic
detection, hydroxyproline method would only require tissue hydrolysis while Sirius red
would require another sample solubilisation beforehand. Theoretical background will be
shortly introduced in the next two sections. Additionally, the best fitted candidate assay
Page 17
17
methods are evaluated from the time consumption for each array. The final selection should
have the smaller time consumption to achieve best efficiency. The detailed comparison
including manufacturer comparison and economic comparison can be found in Appendix
A.
3.1 ELISA Collagen Assay
Various species and types of collagen can be used as an antigen in ELISA for
studying antibody specificity and cross-reactivity (68, 69). Since collagen is a rigid
fibrillary protein with unique physical and chemical properties and differs from other
globular proteins, special attention for handling this protein is required. For example,
immunoglobulins in human and animal sera bind to polymeric and fibrillary collagen non-
specifically, and create significantly high false-positive reaction in ELISA (68).
Similarly, a secondary antibody in ELISA also binds to fibrillary collagen non-
specifically and creates high background values. Furthermore, these forms of collagen
affect the assay sensitivity significantly due to the formation of excess collagen layer on
the surfaces of ELISA plate (69). In general, ELISA collagen assay is more appropriate for
collagen assay on specific type of collagen and it would require a summation of several
assays on different collagen types in order to obtain the total collagen content in a sample.
Therefore, it is not the best candidate for our objective although it is most commonly used
in biochemical researches.
3.2 Sirius Red Collagen Assay
Sirius Red specifically binds to the [Gly-X-Y]n helical structure of fibrillary collagens such
as Type I to V collagen, and is used for detecting all types and species of collagen, whereas
Fast Green binds to non-collagenous proteins (75, 76). Because this assay does not require
Page 18
18
collagen solubilisation, it is widely used for the measurement of total collagen content in
various tissues (77-81). Since Sirius Red and Fast Green have absorptions at 540 nm and
605 nm respectively, the OD values of the extracted dyes can be used for the calculation
of collagen and non-collagenous protein content in each section. For general histological
studies in which tissue sections are 10-20 μm thick, the assay sensitivity for collagen and
non-collagenous proteins is greater than 3 μg/section and 50 μg/section, respectively.
Although Red Sirius is selectively targeted for Type I to V collagen, it was discussed in
the previous section that this range should cover the collagen types contained in bone
tissues. On the other hand, the sensitivity and reliability of Sirius Red collagen assay is
improved if the sample is soluble. In order to adapt this assay to our sample condition,
additional pre-process on the samples are required.
3.3 Hydroxyproline Collagen Assay
Due to its highly restricted distribution in collagen, the hydroxyproline content accurately
reflects the amount of collagen in the sample. Therefore, quantitating hydroxyproline has
been utilized for evaluating tissue fibrosis or collagen deposition (82-84). However, classic
hydroxyproline assays are not useful since it requires cumbersome procedures and special
tools (84). Hydroxyproline collagen assay works for quantitation of total collagen of any
type and species in tissue specimens and tissue homogenates (83). More importantly, this
collagen assay is suitable for both soluble and both colored and colorless samples. The
sample preparation is also simpler than Sirius Red collagen assay as it involves only a
hydrolysis process. Thus, hydroxyproline collagen assay is selected as the most appropriate
collagen assay for our objective. Its efficiency and effectiveness is validated through
Page 19
19
verification experiment on the same samples used in the previous research by Lashkari B.
et al.
Page 20
20
4.0 EXPREMENTAL PROCEDURE
As hydroxyproline collagen assay is selected, a detailed list of material and procedure is
documented in this section. The hydroxyproline assay kit (Catalog #6017) from Chondrex
Inc. is used. Procedures in this section are altered or adapted from the hydroxyproline assay
protocol provided by Chondrex Inc. to fit the conditions of our lab such as availability of
equipment, replacement of material with similar function etc. The original protocol can be
found in Appendix B.
4.1 List of Material
The following table summarizes information of all the material used in the hydroxyproline
assay, the provider of the material and storage instruction are also included for future
reference and budget concern.
Table 1: Materials used in Hydroxyproline Collagen Assay
Item Quantity Amount Storage Provider
Hydroxyproline Standard 1 vial 4 mg/ml x 0.5
ml -20°C Chondrex
10X Chloramine T
Concentrate 1 vial 1 ml -20°C Chondrex
2X DMAB
(dimethylaminobenzaldehyde)
Concentrate
1 vial 5 ml -20°C Chondrex
Solution A - Chloramine T
Dilution Buffer 1 bottle 10 ml -20°C Chondrex
Solution B - DMAB Dilution
Buffer 1 vial 5 ml -20°C Chondrex
Page 21
21
96-well Plate 1 plate
96-well (8-
well strips ×
12)
-20°C Chondrex
Concentrated HCl (12.1N) 1 bottle 500 ml 25°C BioShop
Glass screw-thread vial (2 ml)
with Teflon cap 1 package
100
vials/package 25°C VWR
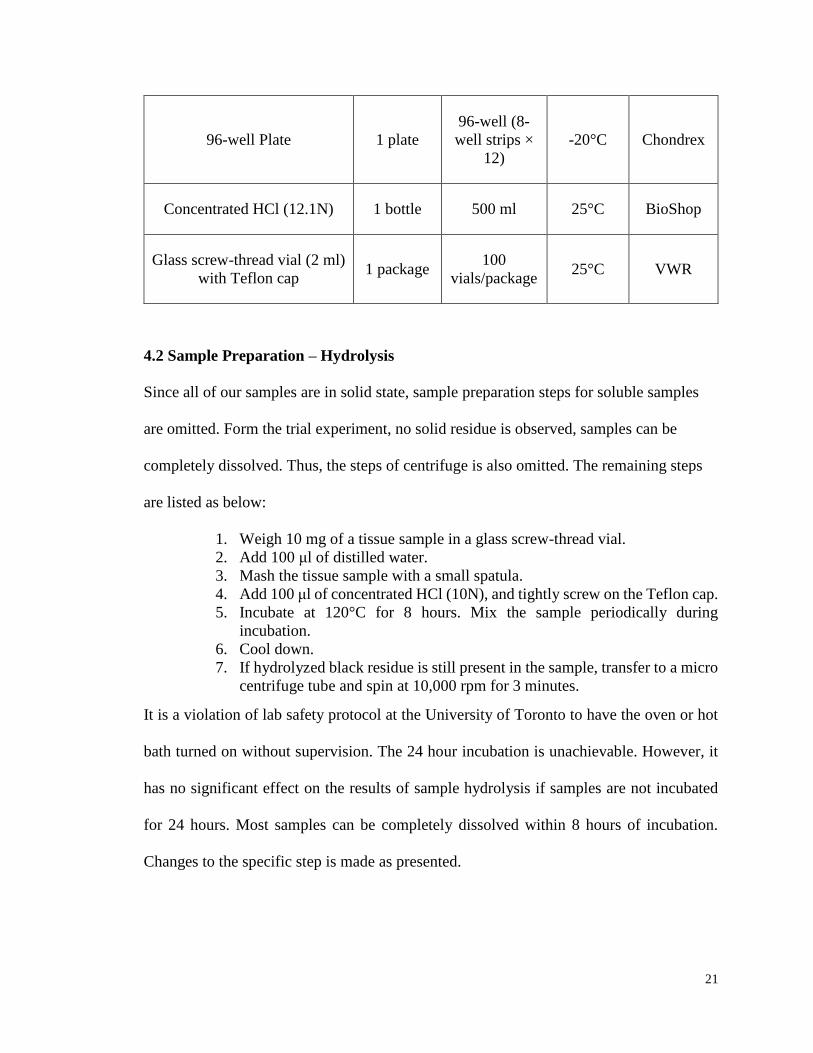
4.2 Sample Preparation – Hydrolysis
Since all of our samples are in solid state, sample preparation steps for soluble samples
are omitted. Form the trial experiment, no solid residue is observed, samples can be
completely dissolved. Thus, the steps of centrifuge is also omitted. The remaining steps
are listed as below:
1. Weigh 10 mg of a tissue sample in a glass screw-thread vial.
2. Add 100 μl of distilled water.
3. Mash the tissue sample with a small spatula.
4. Add 100 μl of concentrated HCl (10N), and tightly screw on the Teflon cap.
5. Incubate at 120°C for 8 hours. Mix the sample periodically during
incubation.
6. Cool down.
7. If hydrolyzed black residue is still present in the sample, transfer to a micro
centrifuge tube and spin at 10,000 rpm for 3 minutes.
It is a violation of lab safety protocol at the University of Toronto to have the oven or hot
bath turned on without supervision. The 24 hour incubation is unachievable. However, it
has no significant effect on the results of sample hydrolysis if samples are not incubated
for 24 hours. Most samples can be completely dissolved within 8 hours of incubation.
Changes to the specific step is made as presented.
Page 22
22
4.3 Assay Procedure
From the trial experiment, it is observed that most of the samples after sample hydrolysis
are colored but without any solid residue. Therefore, steps for handling colorless samples
are omitted in this section.
1. Prepare Standard Dilutions: Take 100 μl of Hydroxyproline (HP) Standard
and add to 900 μl of distilled water to make 400 μg/ ml of the diluted HP
standard; then serially dilute it with distilled water. For example, mix 500 μl of
the standard (400 μg/ml) with an equal volume of distilled water to make a 200
μg/ml solution, and then repeat it five more times to make 100, 50, 25, 12.5,
and 6.3 μg/ ml standards.
2. Prepare Sample Dilutions: The hydrolyzed samples can be used undiluted. If
necessary, the samples can be diluted with 5N HCl. If your sample has color (is
not clear), Sample Blank wells should be prepared due to the higher background
color. See steps 4 and 5 for this process.
3. Prepare Chloramine T solution: Mix 10 μl of 10X Chloramine T solution and
90 μl of Solution A for each well. For example, 10 samples, 7 point standard,
one blank (all in duplicate) will require 3.6 ml of the 1X Chloramine T solution.
Mix 360 μl of 10X Chloramine T solution with 3.24 ml of Solution A. Add
Standards and Samples: Choose 4-1 or 4-2 depending on your samples.
4. Add Reference Wells: Add 10 μl of standards, distilled water (blank, B) into
the first two columns on the plate, and samples into the remaining empty wells
in duplicate.
5. Add 1X Chloramine T Solution: Add 100 μl of the 1X Chloramine T solution
into the purple and orange wells, and add 100 μl of Solution A into the green
wells. Incubate at room temperature for 20 minutes.
6. Prepare DMAB solution: Mix 50 μl of 2X DMAB solution and 50 μl of
Solution B for each well. For example, 10 samples, 7 point standard, one blank
(all in duplicate) will require 3.6 ml of the 1X DMAB solution. Mix 1.8 ml of
2X DMAB solution with 1.8 ml of Solution B.
7. Add 1X DMAB solution: Add 100 μl of 1X DMAB solution into all wells and
incubate at 60°C for 30 minutes.
8. Read Plate: Read the OD values at 530-560 nm. If the OD values of samples
are greater than the OD values of the highest standard, re-assay the samples at
a higher dilution.
Page 23
23
5.0 RESULTS
5.1 Assumptions and Conditions:
Due to the unavailability of the colorimeter or a plate reader, the semi-quantitative results
are obtained at this stage while quantitative results are under its way by using facilities
from other labs. This means that there is no fully quantitative calculation based on the
optical density (OD) values as proposed by the assay protocol. By conducting the assay
procedure to sample 1, sample 2, sample 4, sample 6 and sample 3 on both treated and
untreated samples, raw results are shown is Figure 1. For this batch of samples, since the
24 hours of incubation under 120 °C was not maintained, instead, in order to completely
dissolve solid samples, it took 5 days of incubation under room temperature. The prepared
samples are colorless. However, when the incubation condition is strictly maintained for 8
hrs, sample solutions tuned in to brown color. It may be due to the reaction between the
organic composition and HCl solution. The comparison between two batches of samples
after hydrolysis is illustrated in Figure 1, although second batch of samples are prepared
for further fully-quantitative analysis involving colorimeter measurement of OD level in
the supplementary document of this thesis. Therefore, for the results being analyzed in this
report, procedure for colorless samples were followed.
Page 24
24
Figure 1: Color Comparison between First Batch of Samples (on the right) and Second Batch of Samples
(on the left).
5.2 Raw Results of Colored Plate
Although the fully-quantitative results is under an ongoing process and will be
submitted in the form of supplementary document, the semi-quantitative results are still of
significant value in terms of validate the effectiveness and efficient of hydroxyproline
collagen assay. Figure 2 shows the raw results without dyeing agents added. A slight
difference in color density/optical density is noticeable in the raw results. For example,
solution in A3 and A4 is significantly higher in optical density compared to solution in B3
and B4. C3, C4 and D3, D4 differentiate with each other in the similar fashion. All samples
are duplicated to evaluate the repeatability and reproducibility of the result. This means
Page 25
25
that color for column 1 should be the same as column 2, and so are column 3 and column
4, column 5 and column 6.
Figure 2: Raw Results before Adding Dyeing Agents.
The Chloramine T Solution and the DMAB solution function as dyeing agents in
the collagen assay. They do not add any other effect to the binding of hydroxyproline and
collagen amino acid. After dyeing operations and incubation, the results of the colored
plate is shown in Figure 3 on the next page.
1 2 3 4 5 6
A
B
C
D
E
F
G
H
Page 26
26
Figure 3: Hydroxyproline Assay Results for Tested Samples.
In Figure 3, column 1 and column 2 are references indicating total hydroxyproline
concentration in the solutions in the wells from low to high. From row A to H, as the color
of the solution becomes deeper, reference hydroxyproline concentration becomes higher.
Notice that for this specific result, well E1 is significantly different from this trend. This
could be a result from false addition of solutions or pollution of solution in this specific
well. However, since all the references are added in duplicate, column 2 along is sufficient
to serve as a complete reference array. Column 3 to column 6 contain all the samples being
tested. The allocation of samples is summarized in Table 2.
1 2 3 4 5 6
A
B
C
D
E
F
G
H
Page 27
27
Table 2: Content in the Wells on the Plate.
1 2 3 4 5 6
A Ref. 6.25
μg/ ml
Ref. 6.25
μg/ ml
Sample 2
Treated
Sample 2
Treated
Sample11
Treated
Sample11
Treated
B Ref. 12.5
μg/ ml
Ref. 12.5
μg/ ml
Sample 2
Untreated
Sample 2
Untreated
Sample11
Untreated
Sample11
Untreated
C Ref. 25
μg/ ml
Ref. 25
μg/ ml
Sample 4
Treated
Sample 4
Treated
D Ref. 50
μg/ ml
Ref. 50
μg/ ml
Sample 4
Untreated
Sample 4
Untreated
E Ref. 100
μg/ ml
Ref. 100
μg/ ml
Sample 6
Treated
Sample 6
Treated
F Ref. 200
μg/ ml
Ref. 200
μg/ ml
Sample 6
Untreated
Sample 6
Untreated
G Ref. 400
μg/ ml
Ref. 400
μg/ ml
Sample 1
Treated
Sample 1
Treated
H Ref. 800
μg/ ml
Ref. 800
μg/ ml
Sample 1
Untreated
Sample 1
Untreated
5.3 Calculations and Data Handling
By comparing the color density of the samples with the references, semi-
quantitative results of hydroxyproline concentration can be easily obtained by pair-wise
comparison. For example, B3 and B4 have deeper color than A1 and A2, therefore, the
concentration of B3 and B4 is between 12.5 μg/ml to 25 μg/ml. Notice that the lowest
hydroxyproline concentration is 6.25 μg/ml instead of 0 μg/ml in the protocol. The
consequence resulted from the alteration is that if the color in the samples is lighter than
the level of 6.25 μg/ml, it does not need the 0 μg/ml to set the lower limit to conclude that
it is within the 0 to 6.25 μg/ml range. The examples are A3, A4, C3, C4, E3 and E4. Their
colors are all lighter than A1 and A2, therefore, their hydroxyproline concentration should
be within the range of 0 to 6.25 μg/ml. The semi-quantitative results of all wells are
tabulated in Table 3.
Page 28
28
Table 3: Semi-quantitative Results for Tested Samples (units all in μg/ ml).
1 2 3 4 5 6
A Ref. 6.25
μg/ ml
Ref. 6.25
μg/ ml
0-6.25
μg/ ml
0-6.25
μg/ ml
6.25-12.5
μg/ ml
6.25-12.5
μg/ ml
B Ref. 12.5
μg/ ml
Ref. 12.5
μg/ ml
6.25-12.5
μg/ ml
6.25-12.5
μg/ ml
0-6.25
μg/ ml
0-6.25
μg/ ml
C Ref. 25
μg/ ml
Ref. 25
μg/ ml
0-6.25
μg/ ml
0-6.25
μg/ ml
D Ref. 50
μg/ ml
Ref. 50
μg/ ml
6.25-12.5
μg/ ml
6.25-12.5
μg/ ml
E Ref. 100
μg/ ml
Ref. 100
μg/ ml
0-6.25
μg/ ml
0-6.25
μg/ ml
F Ref. 200
μg/ ml
Ref. 200
μg/ ml
6.25-12.5
μg/ ml
6.25-12.5
μg/ ml
G Ref. 400
μg/ ml
Ref. 400
μg/ ml
6.25-12.5
μg/ ml
6.25-12.5
μg/ ml
H Ref. 800
μg/ ml
Ref. 800
μg/ ml
0-6.25
μg/ ml
0-6.25
μg/ ml
These results are in the unit of μg/ ml which requires a translating calculation to the
weight percentage of the sample. The following formulas are the necessary translating
calculations:
𝐻𝑦𝑑𝑟𝑜𝑥𝑦𝑝𝑟𝑜𝑙𝑖𝑛𝑒 (𝜇𝑔 𝑚𝑙⁄ ) × (𝐷𝑖𝑠𝑡𝑖𝑙𝑙𝑒𝑑 𝑊𝑎𝑡𝑒𝑟 𝑉𝑜𝑙𝑢𝑚𝑒 𝑚𝑙 + 𝐻𝐶𝑙 𝑉𝑜𝑙𝑢𝑚𝑒 𝑚𝑙)
𝑆𝑎𝑚𝑝𝑙𝑒 𝑊𝑒𝑖𝑔ℎ𝑡 (𝑚𝑔)= 𝐻𝑦𝑑𝑟𝑜𝑥𝑦𝑝𝑟𝑜𝑙𝑖𝑛𝑒 𝑙𝑒𝑣𝑒𝑙 (𝜇𝑔 𝑚𝑙⁄ ) 𝑖𝑛 𝑡ℎ𝑒 𝑠𝑎𝑚𝑝𝑙𝑒
𝐻𝑦𝑑𝑟𝑜𝑥𝑦𝑝𝑟𝑜𝑙𝑖𝑛𝑒 𝑙𝑒𝑣𝑒𝑙 (𝜇𝑔 𝑚𝑙⁄ ) 𝑖𝑛 𝑡ℎ𝑒 𝑠𝑎𝑚𝑝𝑙𝑒 ×100
13.5= 𝑐𝑜𝑙𝑙𝑎𝑔𝑒𝑛 𝑙𝑒𝑣𝑒𝑙 (𝜇𝑔 𝑚𝑔⁄ )
The total solution volume added to each well are 200 μl in each well. And according to the
procedure, 10 μg of solid bone samples are added. Therefore, for a 6.25 μg/ml
hydroxyproline concentration, it is translated into:
Page 29
29
𝐶𝑜𝑙𝑙𝑎𝑔𝑒𝑛 𝑙𝑒𝑣𝑒𝑙 =6.25(μg ml⁄ ) × 0.2(ml)
10 (mg)×
100
13.5= 9.2593 𝜇𝑔 𝑚𝑔⁄ = 0.926%
Therefore, raw data in Table 3 can be translated into final weight percentage range for each
sample as tabulated in Table 4.
Table 4: Translated Results in Weight Percentage.
1 2 3 4 5 6
A 0.926% 0.926% 0.926%-
1.852%
0.926%-
1.852%
1.852%-
3.704%
1.852%-
3.704%
B 1.852% 1.852% 1.852%-
3.704%
1.852%-
3.704%
0.926%-
1.852%
0.926%-
1.852%
C 3.704% 3.704% 0.926%-
1.852%
0.926%-
1.852%
D 7.407% 7.407% 1.852%-
3.704%
1.852%-
3.704%
E 14.815% 14.815% 0.926%-
1.852%
0.926%-
1.852%
F 29.630% 29.630% 1.852%-
3.704%
1.852%-
3.704%
G 59.260% 59.260% 1.852%-
3.704%
1.852%-
3.704%
H 118.519% 118.519% 0.926%-
1.852%
0.926%-
1.852%
For sample 2, sample 4, and sample 6, since these samples are decollagenized, the
treated samples should have nearly zero collagen content. The results of A3, A4, C3, C4,
E3, and E4 match the theoretical reasoning. In contrast, untreated samples should contain
a certain level of collagen content, which is supported by results for B3, B4, D3, D4, F3
and F4.
However sample 1 and sample 3 which are EDTA treated indicate completely
different results compared to sample 2, 4 and 6. EDTA treated samples have higher
Page 30
30
collagen content than untreated samples. The level of collagen content is similar for all the
samples regardless of treatment type and treatment existence.
Page 31
31
6.0 DISCUSSION
6.1 Reproducibility and Repeatability
According to the comparison between duplicated samples, the results are consistent for all
the samples. However, for the experiment run analyzed specifically in this report, the
references are not perfectly reproducible (solution in well E1 was not properly dyed).
Although this deficit between references did not affect any of the results, the similar error
could occur to the samples. The following factors may lead to this deficit and should be
paid with extra attention for the samples in later experiments:
1. During preparation of the standard dilutions, carefully label solutions for each
concentration as they are all colorless and of the same volume after the preparation.
2. When adding the dyeing agents, make sure the pipette tip does not make any contact
with the solution in the wells as they will affect the color of the solution and
therefore affect the final result.
3. Strictly follow the 60°C incubation temperature and 30 minute incubation time after
adding DMAB solution as DMAB is very sensitive to temperature over 80°C (83).
6.2 Agreement to Decollagenization Group Samples
For the results of sample 2, 4 and 6, which are the group of samples underwent
decollagenization with NaOCl, untreated samples have higher collagen content level
(1.852%-3.704%) compared to treated samples (0%-1.852%). The comparison between
treated and untreated samples matches the prediction. Theoretically, NaOCl should take
away all organic composition of the bone tissue, results from treat samples has almost zero
collagen content which shows a positive match. Although the difference between treated
and untreated samples is identifiable, the range of collagen content level in the untreated
Page 32
32
samples is nearly at the lower boundary of the prediction. The collagen content level could
be higher compared to the collagen level in cattle bone tissues in vivo, which is 5%-15%
(79). Several reasons could explain the low level of collagen content in our samples:
1. Location where the sample is taken from the bone pieces. As illustrated in Figure
4, the 10 mg sample dissolved into HCl solution is taken from different location on
the bone pieces in order to avoid bias, however, it is impossible to have bias free
samples as collagen content level varies with location on the bones.
As indicated in Figure 4, red square represents the part that is treated
(surface looks more trabecular compared to untreated part on the left), orange
circles are the sites where solid samples are taken. Notice that the color of bone
tissues differentiate with the depth from the bone outer surface to inner marrow
region on the untreated site (circled in blue square), collagen content level is
different for these regions. Although treatment has made the appearance difference
unable to identify, we try to take samples from as various sites on the same bone
piece as possible in order to avoid such bias.
Page 33
33
Figure 4: Sample Taken from Different Sites on the Same Bone Tissue.
2. Insufficient incubation temperature leads to incomplete hydrolysis of collagen
content, since this batch of samples is prepared with modified incubation conditions
(5 days under room temperature vs. 24 hrs under 120 °C).
3. Collagen loss during frequent frosting and defrosting when taking the samples off.
In general, for samples treated with NaOCl decollagenization process only, the
hydroxyproline process is validated for the assay of collagen content despite the instability
due to improper operations. Quantitative reliability and statistic relationship can be further
Page 34
34
established if the optical density values becomes handy with availability of equipment like
colorimeter.
6.3 Deficit for Demineralization Group Samples
For samples treated with EDTA demineralization process (sample 1 and sample 3),
untreated samples and treated samples are supposed to have similar collagen content level
as only mineral content is removed from the treatment. The results have indicated a deficit
that treated samples have higher collagen content level than untreated samples.
Recall that it was mentioned in the background section, using EDTA as
demineralization agent could bring antioxidant effect to samples which slows down organic
composition loss (including collagen loss) due to oxidation over time. This effect can
explain why EDTA treated samples have higher collagen content than untreated samples.
However, the values of the differences are questionable.
Overall, qualitatively, it is validated that hydroxyproline collagen assay is able to
distinguish treated and untreated collagen level within the demineralization group of
samples. The explanation is reasonable and the result is consistent with our prediction.
6.4 Other Sources of Error
Except for the factors discussed above, there are several other sources of error for the
hydroxyproline collagen assay. They may not result in significant deficit but they are still
worth analyzing in order to achieve higher accuracy of the hydroxyproline collagen assay.
Causes of the error and actions to avoid such error are discussed.
Page 35
35
1. DMAB solution and Chloramine T solution are not stable and cannot be stored and
reused for multiple assays. Moreover, to ensure the effectiveness of them, it is better
to use them within 2 hrs after their preparation (74).
2. HCl at 10 N concentration volatilize rapidly under room temperature and pressure.
As in our research, we dilute reagent level HCl (highest concentration, 12.1N, 37%)
into 10N HCl, the dilution process is also highly volatilizing, the actual HCl used
might be at lower concentration than the designed 10N. The best action is to buy
the 10N HCl off-the-shelf or to use the diluted HCl right after preparation.
3. During the incubation of the samples, Teflon cap could potentially deform and lead
to a leakage of HCl vapor under such high temperature. It will ultimately lead to
incomplete hydrolysis process. To avoid this, make sure all the vial cap is securely
tightened before incubation starts and do not use plastic cap instead of Teflon cap
since it is easier to deform and potentially melt with the reaction between the cap
and HCl. Figure 5 and Figure 6 shows the failure of a vial cap during one trial
experiment.
Page 36
36
Figure 5: Cap Deformation due to Over-heating during Incubation.
Figure 6: Cap Screw Thread Corrosion due To Volatilized HCl during Incubation.
Page 37
37
4. Make sure to use a new pipette tip after each use with different solution. Since the
collagen content level in our samples is supposed to be lower than 20%, and only
10 μl of each prepared sample solution is used, slight pollution from pipette tip
contact with other samples could cause a significant deficit in the result.
Page 38
38
7.0 ONGOING PROCESS AND FUTURE DIRECTION
At the current stage, we have contacted Prof. Craig Simmons from the MIE
department who referred us to Prof. Michael Sefton’s Sefton Lab in the CBBR facility that
is capable of providing optical density measurement for our research. Communication with
Prof. Michael Sefton is initiated and preparation for the optical density measurement is
finished. By the time this thesis report is being marked, a fully-quantitative results on the
second batch of samples (with more samples and more comprehensive sample preparation
including properly monitored 8 hr, 120°C incubation) should be available. It will be handed
in to Prof. Andreas Mandelis in the form of a thesis supplementary document in addition
to this report.
Furthermore, over the summer of 2015, I will be continuing related data analysis
and quantitative correlation between collagen content level and US and PA signals to
complete validation of the previous research in order to get the output of this thesis to the
publication stage.
A transition report is also expected in the summer in order to document the standard
procedure for such collagen assay for any later uses.
Page 39
39
8.0 CONCLUSION
This thesis project aimed to find an effective method to measure the collagen
content level in cattle bone tissues. Samples are subjected to decollagenization and
demineralization process using NaOCl and EDTA as treatment agents respectively. The
assay plan chosen must be able to provide accurate measurement of the weight percentage
of the collagen content in specific bone samples. The assay plan should be easy to conduct,
efficient and reliable.
Several candidate collagen assay methods are evaluated and justified. The
dominating factor in this project is that only a total collagen content level is needed instead
of collagen content level for specific collagen types. Based on this assumption, Sirius Red
collagen assay and hydroxyproline collagen assay were the best candidates. Among these
two assay plans, Sirius Red collagen assay requires a more cumbersome process including
cell culture, collagen isolation and collagen concentration. In contrast, hydroxyproline
collagen assay is suitable for both solid and liquid samples. Hydroxyproline collagen assay
is chosen as the experimental plan with modified procedures.
Two batches of samples are prepared. The first batch of samples are assessed to
provide semi-quantitative verification run to evaluate the effectiveness and efficiency of
hydroxyproline collagen assay for our requirement. The second batch of samples are
prepared for a fully-quantitative results using facility that supports optical density
measurement.
The results from the first batch of samples confirms the ability of hydroxyproline
assay to quantify collagen content level within a range of weight percentage using the
reference arrays. Results showed that for the decollagenized group, untreated samples have
Page 40
40
collagen content at 1.852%-3.704% while treated samples have collagen content within
0%-1.852%. For the demineralized group, untreated samples have collagen level at 0%-
1.852% compared to the range of 1.852%-3.704% for the treated samples. The result
matches the prediction that decollagenization process should remove most of the collagen
content and the EDTA demineralization agent can delay the oxidation of collagen content
and result in a slightly higher collagen level in treaded samples within its group.
The values of the weight percentage obtained from the first batch of samples are
lower than expectation. This is mainly because the first batch of samples used a alternative
sample preparation approach of incubating for 5 days under room temperature instead of
24 hrs under 120 °C, which leads to incomplete hydrolysis. Despite of the deficit from this
error, the hydroxyproline collagen assay is validated as a suitable method to satisfy the
objective.
Page 41
41
REFERENCES
1. Lashkari B, Yang L, Mandelis A. The application of backscattered ultrasound and
photoacoustic signals for assessment of bone collagen and mineral contents. Quant
Imaging Med Surg 2015;5(1):46-56. doi: 10.3978/j.issn.2223-4292.2014.11.11
2. Callis G, Sterchi D. Decalcification of Bone Literature Review and Practical Study
of Various Decalcifying Agents Methods and Their Effect on Bone Histology. J
Histotechnol 1998;21:49-58.
3. Ehrlich H, Koutsoukos PG, Demadis KD, Pokrovsky OS. Principles of
demineralization: modern strategies for the isolation of organic frameworks. Part
II. Decalcification. Micron 2009;40:169-93.
4. Hoffmeister BK, Whitten SA, Kaste SC, Rho JY. Effect of collagen and mineral
content on the high-frequency ultrasonic properties of human cancellous bone.
Osteoporos Int 2002;13:26-32.
5. Langton CM. Osteoporosis: case of skeletal biocorrosion. Corrosion Engineering,
Science and Technology 2007;42:339-343.
6. Ritchie RO, Buehler MJ, Hansma P. Plasticity and Toughness in Bone. Physics
Today 2009;62:41-7.
7. Viguet-Carrin S, Garnero P, Delmas PD. The role of collagen in bone strength.
Osteoporos Int 2006;17:319-36.
8. Launey ME, Buehler MJ, Ritchie RO. On the Mechanistic Origins of Toughness in
Bone. J Mater 2010;40:25-53.
Page 42
42
9. Bailey AJ, Sims TJ, Ebbesen EN, Mansell JP, Thomsen JS, Mosekilde L. Age-
related changes in the biochemical properties of human cancellous bone collagen:
relationship to bone strength. Calcif Tissue Int 1999;65:203-10.
10. Wang X, Shen X, Li X, Agrawal CM. Age-related changes in the collagen network
and toughness of bone. Bone 2002;31:1-7.
11. Leeming DJ, Henriksen K, Byrjalsen I, Qvist P, Madsen SH, Garnero P, Karsdal
MA. Is bone quality associated with collagen age? Osteoporos Int 2009;20:1461-
70.
12. Saito M, Marumo K. Collagen cross-links as a determinant of bone quality: a
possible explanation for bone fragility in aging, osteoporosis, and diabetes mellitus.
Osteoporos Int 2010;21:195-214.
13. Wang X, Bank RA, TeKoppele JM, Agrawal CM. The role of collagen in
determining bone mechanical properties. J Orthop Res 2001;19:1021-6.
14. Knott L, Whitehead CC, Fleming RH, Bailey AJ. Biochemical changes in the
collagenous matrix of osteoporotic avian bone. Biochem J 1995;310:1045-51.
15. Eyre DR, Dickson IR, Van Ness K (1988) Collagen crosslinking in human bone
and articular cartilage. Age-related changes in the content of mature
hydroxypyridinium residues. Biochem J 252:495–500
16. Currey JD (1979) Change in impact energy absorption of bone with age. J Biomech
12:459–469
17. Currey JD (1988) The effect of porosity and mineral content on the Young’s
modulus of elasticity of compact bone. J Biochem 21:131–139
Page 43
43
18. Currey JD, Brear K, Zioupos P (1996) The effects of aging and changes in mineral
content in degrading the toughness of human femora. J Biomech 29:257–260
19. Bailey AJ, Wotton SF, Sims TJ, Thompson PW (1992) Post translational
modifications in the collagen of human osteoporotic femoral
head.BiochemBiophysResCommun 185:801–805
20. Boskey AL, Wright TM, Blank RD (1999) Collagen and bone strength. J Bone
Miner Res 14:330–335
21. Wang X, Bank RA, TeKoppele JM, Agrawal CM (2001) The role of collagen in
determining bone mechanical properties. J Orthop Res 19:1021–1026
22. Zioupos P, Currey JD, Hamer AJ (1999) The role of collagen in the declining
mechanical properties of aging human cortical bone. J Biomed Mater Res 45:108-
116334
23. Thompson JB, Kindt JH, Drake B, Hansma HG, Morse DE, Hansma PK (2001)
Bone indentation recovery time correlates with bond reforming time. Nature
414:773–776
24. Zioupos P (2001) human bone: factors affecting its biomechanical properties and
the role of collagen. J Biomater Appl 15:187–229
25. Henkel W, Gianville RW: Covalent crosslinking between molecules of type I and
type III collagen. EurJ Biochem 122:205, 1982
26. Keene DR, Sakai LY, Bachinger HP, Burgeson RE: Type III collagen can be
present on banded collagen fibrils regardless of fibril diameter. J Cell Biol
105:2393, 1987
Page 44
44
27. Keene DR. Sakai LY, Burgeson RE, Bachinger HP: Direct visualization of lgM
antibodies bound to tissue antigens utilizing a monoclonal anti-type III 1gM as a
model system. J Histochem Cytochem 35:311, 1987
28. Birk DE, Fitch JM, Bariarz )P, Linsenmayer iT: Collagen type I and V are present
in the same fibril in the avian corneal stroma. J Cell Biol 106:999, 1988
29. Miller EJ: Biochemical studies on the structure of chick bone collagen. Fed Proc
28:1839, 1969
30. Robey PG. TermineJD: Human bone cells in vitro. Calcif Tissue Int 37:453, 1985
31. Reddi AH, Gay R, Gay 5, Miller EJ: Transition in collagen types dunning matrix-
induced cartilage, bone and bone marrow formation. Proc NatI Acad Sci USA
74:5589, 1977
32. Brock DL, MadniJ, Eikenberry EF, Brodsky B: Characterization of type V collagen
from chick bone. J Biol Chem 260:555, 1985
33. Keene, D. R., L. Y. Sakai, and R. E. Burgeson. Human Bone Contains Type III
Collagen, Type VI Collagen, and Fibrillin: Type III Collagen Is Present on Specific
Fibers That May Mediate Attachment of Tendons, Ligaments, and Periosteum to
Calcified Bone Cortex. Jour of Histochem & Cytochem (1991): 59-69.
34. Callis G., and Sterchi D., Decalcification of Bone Literature Review and Practical
Study of Various Decalcifying Agents Methods and Their Effect on Bone
Histology. The Journal of Histotechnology. 1998; 21(1): p. 49-58.
35. Ehrlich H., Koutsoukos P.G., Demadis K.D., Pokrovsky O.S., Principles of
demineralization Modern strategies for the isolation of organic frameworks, Part II
Decalcification. Micron. 2009; 40: p. 169-193.
Page 45
45
36. Hoffmeister B.K., Whitten S.A., Kaste S.C., and Rho J.Y., Effect of collagen
content and Mineral Content on the High-frequency Ultrasonic Properties of
Human Cancellous Bone. Osteoporos Int. 2002; 13: p. 26-32.
37. Langton C.M. Osteoporosis: case of skeletal biocorrosion. Corrosion Engineering,
Science and Technology. 2007; 42(4): p. 339-343.
38. Langton C.M., Palmer S.B., and Porter R.W., The measurement of broadband
ultrasonic attenuation in cancellous bone, Eng. Med., 1984; 13(2), p. 89-91.
12. Njeh C.F., Boivin C.M., and Langton C.M., The Role of Ultrasound in the
Assessment of Osteoporosis: A Review. Osteoporosis Int. 1997; 7: p. 7-22.
39. Langton C.M., and Njeh C.F., The Measurement of Broadband Ultrasonic
Attenuation in Cancellous Bone—A Review of the Science and Technology. IEEE
Trans. Ultrason. Ferroelect. Freq. Contr. 2008; 55(7): p. 1546-1554.
40. Laugier P. Instrumentation for In Vivo Ultrasonic Characterization of Bone
Strength. IEEE Trans. Ultrason. Ferroelect. Freq. Contr. 2008; 55(6): p. 1179-1196.
41. Laugier P., and Haïat G., Bone Quantitative Ultrasound Dordrecht, NDL: Springer;
2011.
42. Mano I., Horii K., Takai S., Suzaki T., Nagaoka H., and Otani T., Development of
Novel Ultrasonic Bone Densitometry Using Acoustic Parameters of Cancellous
Bone for Fast and Slow Waves, Jpn. J. Appl. Phys.2006 ; 45(5B): p. 4700-
4702.( doi:10.1143/JJAP.45.4700)
43. Wear K.A., Ultrasonic scattering from cancellous bone: a review. IEEE Trans.
Ultrason. Ferroelectr. Freq. Control. 2008; 55(7): p. 1432-1441.
Page 46
46
44. Litniewski J., Cieslik L., Lewandowski M., Tymkiewicz R., Zienkiewicz B., and
Nowicki A., Ultrasonic scanner for in vivo measurement of cancellous bone
properties from backscattered data. IEEE Trans Ultrason Ferroelectr Freq Control.
2012; 59(7): p. 1470-7. (doi: 10.1109/TUFFC.2012.2347).
45. Wear K.A., Frequency dependence of ultrasonic backscatter from human trabecular
bone: theory and experiment, J. Acoust. Soc. Am., 1999; 106, p.3659-3664.
20. Nicholson P.H.F., Strelitzki R., Cleveland R.O., and Bouxsein M.L., Scattering
of ultrasound in canclellous bone: predictions from a theoretical model, J. Biomech,
2000; 33, p. 503-506. (doi: 10.1016/S0021-9290(99)00208-0)
46. Jenson F., Padilla F., and Laugier P. Prediction of frequency-dependent ultrasonic
backscatter in cancellous bone using statistical weak scattering model. Ultrasound
in Med. & Biol. 2003; 29(3): p. 455-464.
47. Chaffai S., Roberjot V., Peyrin F., Berger G., and Laugier P., Frequency
dependence of ultrasonic backscattering in cancellous bone: Autocorrelation model
and experimental results. J. Acoust. Soc. Am. 2000; 108(5): p. 2403-2411.
48. Wear K.W., and Garra B.S., Assessment of bone density using ultrasounic
backscatter. Ultrasound in Med. & Biol. 1998; 24(5): p. 689-695.
49. Wear K. The Relationship between ultrasounic backscatter and bone mineral
density in human calcaneus. IEEE Trans. Ultrason. Ferroelect. Freq. Contr. 2000;
47: p. 777-780.
50. Ta D., Wang W., Huang K., Wang Y., and Le L.H., Analysis of frequency
dependence of ultrasonic backscatter coefficient in cancellous bone. J. Acoust. Soc.
Am. 2008; 124(6): p. 4083-4090.
Page 47
47
51. Lee K.IL., and Choi M.J., Frequency-dependent attenuation and backscatter
coefficients in bovine trabecular bone from 0.2 to 1.2 MHz. J. Acoust. Soc. Am.
2012; 131(1): p. EL67-73.
52. Karjalainen J.P., Toyras J., Riekkinen O., Hakulinen M., and Jurvelin J.S.,
Ultrasound Backscatter Imaging Provides Frequency-Dependent Information on
Structure, Composition and Mechanical Properties of Human Trabecular Bone.
Ultrasound Med Biol. 2009; 35(8): p. 1376-1384.
53. Riekkinen O., Hakulinen M.A., Toyras J., and Jurvelin J.S., Spatial variation of
acoustic properties is related with mechanical properties of trabecular bone. Phys.
Med. Biol.. 2007; 52: p. 6961–6968.
54. Hoffmeister B.K., Jones III C.I., Caldwell G.J., and Kaste S.C., Ultrasonic
characterization of cancellous bone using apparent integrated backscatter. Phys.
Med. Biol. 2006; 35(8): p. 2715-2727.
55. Hoffmeister B.K., Johnson D.P., Janeski J.A., Keedy D.A., Steinert B.W., Viano
A.M., and Kaste S.C., Ultrasonic characterization of human cancellous bone in
vitro using three different apparent backscatter parameters in the frequency range
0.6-15 MHz. IEEE Trans. Ultrason. Ferroelectr. Freq. Control. 2008; 55(7): p.
1442-1452.
56. Hoffmeister B.K. Frequency dependence of apparent ultrasonic backscatter from
human cancellous bone. Phys. Med. Biol. 2011; 56: p. 667-683.
57. Hakulinen M.A., Day J.S., Toyras J., Weinans H., and Jurvelin J.S., Ultrasonic
characterization of human trabecular bone microstructure. Phys. Med. Biol. 2006;
51(6): p. 1633-1648.
Page 48
48
58. Riekkinen O., Hakulinen M.A., Lammi M.J., Jurvelin J.S., Kallioniemi A., and
Toyras J., Acoustic Properties of Trabecular Bone Relationships to Tissue
Composition. Ultrasond Med. Biol. 2007; 33(9): p. 1438-1444.
59. Hakulinen M.A., Toyras J., Saarakkala S., Hirvonen J., Kroger H., and Jurvelin
J.S., Ability of ultrasound backscattering to predict mechanical properties of bovine
trabecular bone. Ultrasound Med Biol. 2004; 30(7): p. 919-927.
60. Roux C., Roberjot V., Porcher R., Kolta S., Dougados M., and Laugier P.,
Ultrasonic Backscatter and Transmission Parameters at the Os Calcis in
Postmenopausal Osteoporosis. J. Bone Miner. Res. 2001; 16(7): p. 1353-1362.
61. Lashkari B., and Mandelis A., Combined photoacoustic and ultrasonic diagnosis of
early bone loss and density variations. SPIE Proc. 8207, Photonic Therapeutics and
Diagnostics VIII, 82076K; 2012; San Francisco.
62. Lashkari B., and Mandelis A., Photoacoustic and ultrasonic signatures of early bone
density variations. In Photonic West (Bios), SPIE Proc. 8565; 2013; San Francisco.
63. Lashkari B., and Mandelis A., Coregistered photoacoustic and ultrasonic signatures
of early bone density variations. J. Biomed. Opt. 2014; 19(3): p. 036015 ( doi:
10.1117/1.JBO.19.3.036015).
64. Yang L., Lashkari B., Mandelis A., and Tan J.W.Y., Bone composition:
Photoacoustics versus Ultrasound. Int. J. Thermophys. 2014; To be published.
65. Steinberg I, Eyal A., and Gannot I., Multispectral photoacoustic method for the
early detection and diagnosis of osteoporosis. SPIE Proc. 8565, Photonic
Therapeutics and Diagnostics IX. 2013; 85656G.
Page 49
49
66. Zhao Z., Moilanen P., Karppinen P., Määttä M., Karppinen T., Hæggström E.,
Timonen J., Myllylä R., Photo-acoustic excitation and detection of guided
ultrasonic waves in bone samples covered by a soft coating layer. SPIE Proc. 8553,
Optics in Health Care and Biomedical Optics. 2012; 85531E.
67. Nowicki A., Litniewski J., Secomski W., Lewin P.A., and Trots I., Estimation of
ultrasonic attenuation in a bone using coded excitation. Ultrasonics. 2003; 41: p.
615–621.
68. Collagen: The Anatomy of a Protein, [1980], J. Woodhead-Galloway, 60 pages.
Publisher: Edward Arnold, London.
69. Collagen in the Physiology and Pathology of Connective Tissue, [1978], S. Gay &
E.J. Miller, 110 pages. Publisher: Gustav Fischer Verlas, Stuttgart.
70. Collagen. Structure and Mechanics, [2008], Editor: P. Fratzl. Publisher: Springer,
New York.
71. Collagen. Primer in Structure, Processing and Assembly (Topics in Current
Chemistry, Volume 247), [2005], Editors: J. Brinckmann, H. Notbohm & P.K.
Muller. Publisher: Springer, Berlin.
72. Structure and Function of Collagen Types, [1987], Editors: R. Mayne & R.E.
Burgeson. Publisher: Academic Press, Orlando.
73. Structural and Contractile Proteins, Part A Extracellular Matrix, (Methods in
Enzymology, Volume 82), [1982], Editors: L.W. Cunningham & D.W.
Frederiksen. Publisher: Academic Press, New York.
74. Sircol Collagen Assay. Collagen Assay Manuals and Protocols. Biocolor Inc., 1
Mar. 2014. Web. 22 Apr. 2015.
Page 50
50
75. Marotta, M., & Martino, G. [1985]. Sensitive spectrophotometric method for the
quantitative estimation of collagen. Analytical biochemistry, 150(1), 86-90.
76. AL Leon and M. Rojikind. A simple micro method for collagen and total protein
determination in formalin-fixed paraffin-embedded sections. J Histochem
Cytochem 33:737-743 (1985).
77. W Jimenez, A Pares, J Caballeria et al. Measurement of fi brosis in needle liver
biopsies: Evaluation of a colorimetric method. Hepatology 5:815-818 (1985).
78. BY Yue, J Sugar and K Schrode. Collagen staining in corneal tissues. Current
Eye Res 5:559-564 (1986).
79. P Bedossa, G Lemaigre, J Bacci and E Martin. Quantitative estimation of the
collagen content in normal and pathologic pancreas tissue. Digestion 44:7-13
(1989).
80. J James, KS Bosch, DC Aronson and JM Houtkooper. Sirius Red
histophotometry and spectrophotometry of sections in the assessment of the
collagen content of liver tissue and its application in growing rat liver. Liver
10:1-5 (1990).
81. J Armendariz-Borunda and M Rojkind. A simple quantitative method for
collagen typing in tissue samples: its application to human liver with
schistosomiasis. Coll Relat Res 4:45-47 (1984).
82. Blumenkrantz N, Asboe-Hansen G. A quick and specifi c assay for
hydroxyproline. Anal Biochem. Sep;55(1):288-91 (1973).
83. G. Kesava Reddy, Chukuka S. Enwemeka. A simplifi ed method for the analysis
of hydroxyproline in biological tissues. Clin Biochem. Jun;29(3):225-9 (1996).
Page 51
51
84. CJ Rogers, JR Kimmel, ME Hutchin. A hydroxyproline method of analysis for a
modifi ed gelatin in plasma and urine. J Biol Chem. Feb;206(2):553-9 (1954).
Page 52
52
FIGURES AND TABLES
Page 53
53
11.0 APPENDICES
11.1 Appendix A: Comparisons between Collagen Assay Method and Kit Off-the-
Shelf
Collagen Assay Methods and Kits Comparison 1. Collagen Assay Methods:
Currently for the analysis of collagen, various types of assays exist [1]:
- ELISA for specific types of collagen
- ELISA for specific pro-domains of collagen
- Western blotting using specific collagen antibodies
- Sirius Red based assays for soluble collagen
- Tissue hydrolysis followed by analysis of Hydroxyproline residues (either by a
colorimetric kit or by HPLC)
Based on the feature of these methods and the requirements for our application, since the
photoacoustic and ultrasonic signal detects collagen content regardless of its type, an assay
with no discrimination on collagen type should be chosen. Thus, both Sirius red and
hydroxyproline methods are suitable candidate for our experiment. However, since our
sample would be solid and non-cultured after been tested by photoacoustic and ultrasonic
detection, hydroxyproline method would only require tissue hydrolysis while Sirius red
would require another sample solubilisation beforehand. Theoretical background will be
shortly introduced in the next two sections.
1.1 Sirius Red Soluble Collagen Assay [1]
This assay recognizes soluble or (acid/pepsin) solubilized collagen. The assay is
colorimetric, has a 96-well plate format and is based on precipitation of collagen with
Sirius-Red, an anionic dye with sulphuric acid groups. This dye can bind the side-chain
groups of basic amino acid residues. The dye is released from the precipitated complex at
high pH followed by colorimetric detection. The assay is optimized such that other proteins
(such as albumin) do not interfere. Gelatin (unfolded collagen) is not recognized by this
assay.
Application: The assay is used for the measurement of (soluble) collagen in e.g. cell culture
media, and (acid or acid/pepsin) solubilized collagens e.g. from cell culture extracts. The
assay is less suitable for the determination of collagen in tissues, since in tissues most of
the collagen is cross-linked and therefore often only a low percentage of the collagen is
solubilized upon extraction.
1.1 Hydroxyproline Total Collagen Assay [1]
This assay recognizes all types of collagen (mature, immature, procollagen, degraded
collagen, cross-linked collagen, collagen from various sources). The assay is colorimetric,
has a 96-well plate format, and is based on the quantification of hydroxyproline, an amino
acid exclusively occurring in collagen. Hydroxyproline is released from collagen upon acid
hydrolysis of the collagen containing sample. Hydrolysis is carried out at 95 C, and the
product can directly be used for hydroxyproline analysis, without washing or drying steps.
This analysis is based on Chloramine T/DMBA.
Application: The assay is used for the measurement of total collagen. This includes all
procollagen, unfolded collagen, mature collagen as well as collagen degradation products
Page 54
54
of all collagen types present in the sample. Since the first step is complete hydrolysis of
the sample, difficulty in extraction of collagen plays no role. The assay is applicable for all
types of samples, including tissue.
[1] http://www.quickzyme.com/wp-content/uploads/2012/07/Application-note-How-to-
choose-your-collagen-assay.pdf
2. Collagen Assay Kits:
There are three major companies specialized in collagen detection products. They are
QuickZyme form Netherland, Chondrex Inc. and Sigma-Aldrich from the States. They all
provide products and service on hydroxyproline total collagen assay that is applicable to
solid non-cultured samples. A detailed comparison between these products are shown in
the following table:
Company, Product
QuickZyme,
Total Collagen
Assay Kit
Chondrex Inc.,
Hydroxyproline
Assay Kit
Sigma-Aldrich,
Hydroxyproline
Assay Kit
No. of Tests Per Kit 100 40 100
Price Per Kit € 292
(CAD $ 542.60) USD $ 357.50 CAD $ 429.50
Approximate Price
Per Test
€ 292
(CAD $ 5.43) USD $ 8.94 CAD $ 4.30
Components Not in
Kit
1. 12M and 6M HCl
for sample
hydrolysis
2. 4 M HCl for
sample dilution
3. Single and/or
multichannel
pipettes
4. Eppendorf
centrifuge
5. Incubator (or
thermos-block or
oven) for heating
at 95oC
6. Incubator (or
oven) for heating
at 60oC
7. Microplate reader
capable of
measuring at a
wavelength
between 540 and
580 nm, 570 nm
preferred.
8. Microplate shaker
1. Concentrated HCl
(10N)
2. A glass screw-
thread vial (1-2
ml) with a Teflon
cap (example:
National
Scientific B7999-
1)
1. 96 well flat-
bottom plate – It
is recommended
to use clear plates
for colorimetric
assays.
Spectrophotometr
ic multiwell plate
reader
2. Concentrated
(37% or ~12 M)
HCl, Catalog
Number 320331
or equivalent)
3. Activated
charcoal (Catalog
Number 242276
or 97876, or
equivalent).
4. 120 °C heating
block.
5. Pipette
compatible with
concentrated HCl.
6. Centrifugal
Evaporator or 60
°C oven.
Page 55
55
7. Pressure-tight vial
with PTFE-lined
cap, or 2 mL
polypropylene
vial.
Purchasing Website goo.gl/2WJuLC goo.gl/MDnWV4 goo.gl/0QB1kw
Tech. Spec. Website goo.gl/HVYrd6 goo.gl/h6sMU0 goo.gl/0QB1kw
Manual Doc. goo.gl/sCAqan goo.gl/h6sMU0 goo.gl/bZ9jma
QuickZyme and Sigma-Aldrich’s kits are relatively cheaper in terms of cost per test.
Sigma-Aldrich’s kit does not include the significant 96 flat plate component which are
included for the other kits.
Chondrex’s kit requires the least components outside the kit. QuickZyme and Sigma-
Aldrich have Canadian distributors while Chondrex does not have a Canadian distributor.
More shipping time is expected for Chondrex product.
Product Component Price Per Unit Quantity Per
Unit
Purchasing
Website
QuickZyme
12M HCl USD $7.50 100 mL goo.gl/z4EIHx
6M HCl USD $8.20 500 mL goo.gl/v2HgEv
4M HCl CAD $47.90 1 L goo.gl/3XoZVl
Single Pipette USD $199.00 1 Qty goo.gl/mg8GJf
Total CAD $270.00 Grand Total CAD $812.60
Chondrex
10N HCl USD $67.91 100 mL goo.gl/XIfr4y
Glass Screw
Thread Vial
(National
Scientific B7999-
1)
Approx. USD
$40.00 100 Qty goo.gl/BVCBjZ
Total CAD $120.00 Grand Total CAD $477.50
Sigma-Aldrich 96 flat bottom
plate CAD $176.00 1 Qty goo.gl/fYT5HI
Page 56
56
12M HCl CAD $75.20 500 mL goo.gl/ocqkkl
Activated charcoal CAD $32.00 250 g goo.gl/EE2tNI
2 mL
polypropylene vial CAD $102.00 100 Qty goo.gl/yoWygb
Total CAD $ 385.20 Grand Total CAD $ 814.70
Page 57
57
11.2 Appendix B: Hydroxyproline Collagen Assay Protocol from Chondrex Inc.