NAVAL POSTGRADUATE SCHOOL Monterey, California THESIS THE POTENTIAL IMPACT OF HYPERSPECTRAL IMAGERY ON AMPHIBIOUS WARFARE PLANNING by Keith W. Maly December 1999 Thesis Advisor: William K. Krebs Co-advisor: Richard C. Olsen Approved for public release; distribution is unlimited.
Transcript
NAVAL POSTGRADUATE SCHOOL
Monterey, California
THESIS THE POTENTIAL IMPACT OF HYPERSPECTRAL
IMAGERY ON AMPHIBIOUS WARFARE PLANNING
by
Keith W. Maly
December 1999
Thesis Advisor: William K. Krebs Co-advisor: Richard C. Olsen
Approved for public release; distribution is unlimited.
REPORT DOCUMENTATION PAGE Form Approved OMB No. 0704-0188
Public reporting burden for this collection of information is estimated to average 1 hour per response, including the time for reviewing instruction, searching existing data sources, gathering and maintaining the data needed, and completing and reviewing the collection of information. Send comments regarding this burden estimate or any other aspect of this collection of information, including suggestions for reducing this burden, to Washington headquarters Services, Directorate for Information Operations and Reports, 1215 Jefferson Davis Highway, Suite 1204, Arlington, VA 22202-4302, and to the Office of Management and Budget, Paperwork Reduction Project (0704-0188) Washington DC 20503.
1. AGENCY USE ONLY (Leave blank)
2. REPORT DATE
June 1996 3. REPORT TYPE AND DATES COVERED
Master’s Thesis
4. TITLE AND SUBTITLE
5. FUNDING NUMBERS
6. AUTHOR(S) Maly, Keith W.
7. PERFORMING ORGANIZATION NAME(S) AND ADDRESS(ES) Naval Postgraduate School Monterey, CA 93943-5000
8. PERFORMING ORGANIZATION REPORT NUMBER
9. SPONSORING / MONITORING AGENCY NAME(S) AND ADDRESS(ES) 10. SPONSORING / MONITORING AGENCY REPORT NUMBER
11. SUPPLEMENTARY NOTES
The views expressed in this thesis are those of the author and do not reflect the official policy or position of the Department of Defense or the U.S. Government. 12a. DISTRIBUTION / AVAILABILITY STATEMENT Approved for public release; distribution is unlimited.
12b. DISTRIBUTION CODE
13. ABSTRACT (maximum 200 words) In order to determine the impact that hyperspectral imagery (HSI) might have on the preparation of an amphibious mission, military image analysts exploiting primarily panchromatic and radar image were observed at two Joint Intelligence Centers. A prior task analysis on the amphibious planning process provided the tasks that the analysts would accomplish. Through quantitative analysis, it was determined that image interpretation probably fits the top-down visual information processing paradigm, as compared to the bottom-up, because of the extensive amount of knowledge used in interpretation that is not found in the stimulus. It was also determined that unfamiliar tasks and/or image formats prevent the analyst from employing knowledge and therefore, he or she must rely on the stimulus more heavily. Until the analyst obtains specialized knowledge regarding the hyperspectral exploitation, analysts will probably rely heavily on stimulus-based processing, which can negate any benefits that spectral imagery might offer. However, providing this knowledge to the analyst allows him or her to exploit the spectral characteristics of an image in order to accomplish tasks. This results in the production of better intelligence for a planner to prepare a mission plan from.
17. SECURITY CLASSIFICATION OF REPORT Unclassified
18. SECURITY CLASSIFICATION OF THIS PAGE
Unclassified
19. SECURITY CLASSIFI- CATION OF ABSTRACT Unclassified
20. LIMITATION OF ABSTRACT
UL
NSN 7540-01-280-5500 Standard Form 298 (Rev. 2-89) Prescribed by ANSI Std. 239-18
ii
Approved for public release; distribution is unlimited
THE POTENTIAL IMPACT OF HYPERSPECTRAL IMAGERY ON AMPHIBIOUS WARFARE PLANNING
Keith W. Maly Lieutenant, United States Navy
B.S., Rochester Institute of Technology, 1994
Submitted in partial fulfillment of the requirements for the degree of
MASTER OF SCIENCE IN SCIENTIFIC AND TECHNICAL INTELLIGENCE
from the
NAVAL POSTGRADUATE SCHOOL December 1999
Richard C. Olsen, Co-advisor
William K. Krebs, Thesis Advisor
Keith W. Maly
Approved by:
Author:
Dan Boger, Chairman Department of Joint C4I
iii
iv
v
ABSTRACT
In order to determine the impact that hyperspectral imagery (HSI) might have on
the preparation of an amphibious mission, military image analysts exploiting primarily
panchromatic and radar image were observed at two Joint Intelligence Centers. A prior
task analysis on the amphibious planning process provided the tasks that the analysts
would accomplish. Through quantitative analysis, it was determined that image
interpretation probably fits the top-down visual information processing paradigm, as
compared to the bottom-up, because of the extensive amount of knowledge used in
interpretation that is not found in the stimulus. It was also determined that unfamiliar
tasks and/or image formats prevent the analyst from employing knowledge and therefore,
he or she must rely on the stimulus more heavily. Until the analyst obtains specialized
knowledge regarding the hyperspectral exploitation, analysts will probably rely heavily
on stimulus-based processing, which can negate any benefits that spectral imagery might
offer. However, providing this knowledge to the analyst allows him or her to exploit the
spectral characteristics of an image in order to accomplish tasks. This results in the
production of better intelligence for a planner to prepare a mission plan from.
vi
vii
TABLE OF CONTENTS
I. INTRODUCTION ...................................................................................................1 II. AMPHIBIOUS WAFARE.......................................................................................5 A. PLANNING APPROACH...........................................................................6 1. Intelligence Estimate........................................................................7 2. Intelligence Preparation of the Battlefield .......................................7
3. Imagery Interpretation in Support of Amphibious Operations ........8 B. BASIC DECISIONS....................................................................................9 III. VISUAL COGNITION..........................................................................................11 A. BOTTOM-UP PROCESSING...................................................................12 1. Template Theory............................................................................13 2. Feature Theory ...............................................................................13 3. Computational Theory ...................................................................14 B. TOP-DOWN PROCESSING.....................................................................15 1. Context Effects...............................................................................15 2. Knowledge Effects.........................................................................16 3. Stages Model..................................................................................17 C. COGNITIVE MAPS..................................................................................18 1. Storage ...........................................................................................18 2. Errors..............................................................................................19 IV. PLANNING AIDS.................................................................................................21 A. MAPS ........................................................................................................22 1. Elevation ........................................................................................24 2. Color ..............................................................................................26 3. Strengths/Weaknesses....................................................................27 B. IMAGE FORMAT COMMONALITIES ..................................................28 1. Image Properties ............................................................................30 2. Metrics of Quality ..........................................................................31 a. GSD....................................................................................31 b. Radiometric........................................................................32 c. Spectral ..............................................................................32
viii
d. Interpretability....................................................................33 (1) NIIRS .....................................................................33 (2) MSIIRS ..................................................................34 C. TRADITIONAL IMAGERY.....................................................................35 1. Panchromatic Imagery ...................................................................35 2. Infrared Imagery ............................................................................38 a. Reflected IR .......................................................................38 b. Thermal IR .........................................................................39 3. Radar Imagery................................................................................42 4. Single Band Multispectral Imagery ...............................................45 5. Summary ........................................................................................47 D. SPECTRAL IMAGERY............................................................................47 1. Multispectral Imagery....................................................................48 a. True Color Composites ......................................................48 b. False Color Composites .....................................................51 c. Digital Image Processing ...................................................53 d. Summary ............................................................................56 2. Hyperspectral Imagery...................................................................57 a. Non-Literal Processing Techniques...................................58 (1) Spectral Angle Mapping (SAM)............................60 (2) Spectral Matched Filter (SMF) ..............................61 b. Interpretation Challenges ...................................................63 c. Incorporating HSI into Existing Capabilities.....................63 3. Sensor Fusion.................................................................................64 E. SUMMARY...............................................................................................66 V. THE STUDY ........................................................................................................67 A. TASK ANALYSIS ....................................................................................67 B. IMAGERY ANALYST STUDY...............................................................68 1. Participants.....................................................................................68 2. Apparatus .......................................................................................69 3. Procedure .......................................................................................69 C. ANALYSIS................................................................................................70 D. LIMITATIONS..........................................................................................71 1. Data Collected................................................................................71 2. Specificity ......................................................................................71 3. Lack of Control ..............................................................................72
ix
VI. RESULTS ........................................................................................................73 A. GENERAL TOPOGRAPGHIC DESCRIPTION......................................75 1. Coastal Configuration ....................................................................75 2. Beach Egress Points.......................................................................75 3. Obstacle Identification ...................................................................76 4. Cover and Concealment Determination.........................................77 5. Surface Characteristic Determination ............................................77 6. Determining Avenues of Approach ...............................................78 B. GENERAL HYDROGRAPHIC DESCRIPTION .....................................79 1. Tidal Condition Determination ......................................................79 2. Determining the Nature of the Surf ...............................................80 3. Wind Condition Determination......................................................80 4. Determining Water Currents..........................................................80 5. Underwater Obstacle Identification ...............................................81 C. TRANSPORTATION FACILITIES DETERMINATION .......................82 1. Road Network Characteristics .......................................................82 2. Inland Waterways Characteristics..................................................82 D. ENEMY MILITARY SITUATION DETERMINATION ........................83 1. Static Orders of Battle....................................................................83 2. Mobile Orders of Battle .................................................................84 VII. DISCUSSION ........................................................................................................87 A. INFERENCES FROM RESULTS.............................................................87 1. Explaining Image Interpretation Using Visual Information
Processing ......................................................................................88 a. Processing Sequence..........................................................88 (1) Establishing Perceptual Constancy .......................89 (2) Locating a Starting Point / Search Methods ..........90 (3) Locating Raw Pieces of Information .....................91 (4) Refining Raw Information .....................................92 (5) Higher-Order Processing .......................................92 b. Analytic Variations Based on Format................................93 (1) Radar ......................................................................93 (2) IR............................................................................94 (3) MSI ........................................................................94 c. Uncertainty.........................................................................95 2. Visual Information Processing Employed in Planning..................96 a. Why False-Color is Confusing...........................................97
x
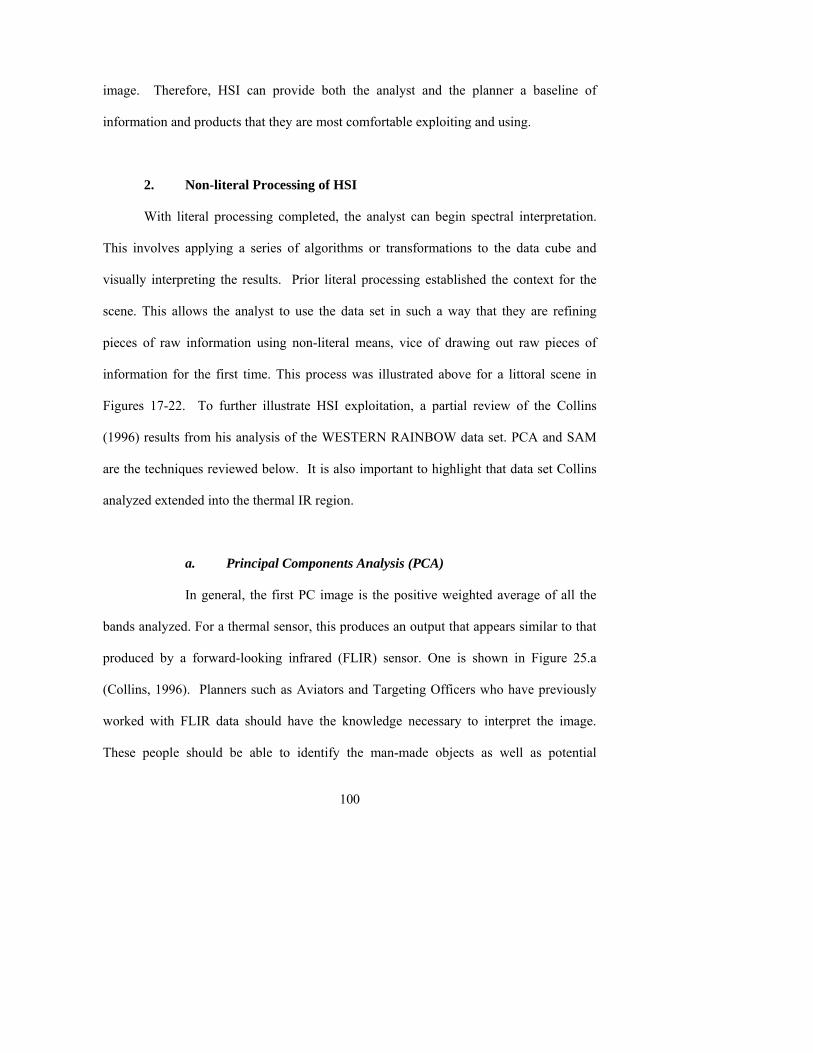
B. HSI EXPLOITATION...............................................................................99 1. Literal Interpretation of HSI ..........................................................99 2. Non-literal Interpretation of HSI .................................................100 a. Principal Components Analysis (PCA) ...........................100 b. Spectral Angle Mapping (SAM)......................................102 3. Presentation to the Planner...........................................................102 C. MATCHING HSI CERTAINTY WITH ANALYST UNCERTAINTY 103 1. Mine Detection.............................................................................104 2. Bathymetry...................................................................................104 3. Target Detection and Identification .............................................105 D. AMPHIBIOUS PLANNING ...................................................................106 VIII. CONCLUSION/RECOMMENDATIONS..........................................................109 APPENDIX A: COLOR FIGURES ......................................................................111 APPENDIX B: TASK ELEMENT LIST..............................................................121 LIST OF REFERENCES.................................................................................................123 INITIAL DISTRIBUTION LIST ....................................................................................129
xi
LIST OF FIGURES
Figure Page
1. Gun Camera Footage of a Tank .................................................................................12
2. 1:50,000 Topographical Map of Kontum, Vietnam..................................................23
In the past, spatial resolution was the most often quoted metric for
information quality, but it has been replaced by interpretability for determining the
analyst’s ability to correctly answer questions regarding a scene (Aerospace Corp, 1998).
Figure 8 displays four images in two different formats that have the same GSD. A
panchromatic imager produced the images in the upper row; a multispectral imager
produced the images in the lower row. Images from systems in the left column exhibit
good contrast and low noise, while images from the systems in the right column exhibit
high noise and low contrast. NIIRS and MSIIRS were developed to give analysts a
method to convey the interpretability of an image to others (IRARS, 1995).
(1) NIIRS. The National Imagery Interpretability Rating Scale
(NIIRS) is a standard adopted by multiple communities including, remote sensing and
intelligence. Initially developed in the 1970s, NIIRS is a numerical scale for rating image
quality based on independent textual criteria. The scale initially focused on military-
related criteria and was later expanded to include civil applications. The basis for the
rating criteria is image interpretation tasks that the analyst performs routinely. NIIRS
scale values range from 0 to 9. The higher the numerical value assigned to an image, the
more information contained in the image. The top left image in Figure 8 would be
between a NIIRS 5 and 6. The image is closer to NIIRS 6 because the aircraft on the
tarmac are easily identifiable (NIIRS 5) but car types such as sedans or station wagons
(NIIRS 6) cannot be determined. The top right image would be rated as NIIRS level 4
because the wing type differences between the small fighter aircraft on the tarmac are
identifiable and less information can be extracted from the rest of the image (IRARS,
1996).
Figure 8. Images with Identical GSD and Varying Image Quality (IRARS, 1995)
(2) MSIIRS. The Multispectral Imagery Interpretability
Rating Scale (MSIIRS) was modeled after NIIRS in 1993 to provide a common metric
34
35
system for manual exploitation of multispectral imagery in the wavelength range of 0.4 to
2.5 μm. Unlike NIIRS, MSIIRS is not a community-sanctioned standard. MSIIRS
values have a range of 0 to 7, based on a generic scale with additional criteria for a wide
variety of specialized interpretation tasks such as urban, military, or natural. The scale is
less concrete than NIIRS because the image analysts are free to exploit the image using
any band combination they choose. The lower left image in Figure 8 could be assigned a
MSIIRS level 5 because individual cars are identifiable in the parking lot located just
above the slightly wooded area (IRARS, 1995). While NIIRS and MSIIRS are similar
concepts, they have completely separate criteria that are not meant as a cross-reference
between images of different formats (IRARS, 1995; IRARS, 1996).
C. TRADITIONAL IMAGERY
The traditional imagery available to the imagery analyst and mission planner
comes from airborne and space platforms, in either soft or hard copy. If in hard copy, the
material may be a paper product, or a transparency that can be viewed on a light table.
The trend today is towards soft-copy, which can be exploited on a computer, and
manipulated using a variety of image processing tools. Traditional imagery formats are
panchromatic, infrared, radar and single band MSI.
1. Panchromatic Imagery
Panchromatic sensors record reflected solar energy as a single spectral band in the
visible region, approximately 0.4 to 0.7 μm, of the electromagnetic spectrum (Sabins,
36
1997). While understanding how objects reflect or absorb solar energy in this region is
important, the importance is reduced for interpreting panchromatic imagery because
much of the general knowledge the interpreter uses in this format is based on human
experience. The brightest areas in an image represent objects that reflect or scatter
incident energy best within a scene. Conversely, objects that absorb energy best within a
scene are the darkest areas of a picture. If a panchromatic scene contained the objects
whose spectra are described in Figure 6, the red sandpit would be the brightest object in
the gray scale display, followed by pinewoods and grasslands. The darkest object in the
scene would be the silty water (Short, 1999). The gray scale differences can then be
grouped together into different ways that allow the analyst to use other elements of
recognition to interpret the scene.
If the analyst has two images of the same area that differ only in perspective, he
may choose to interpret the image using stereoscopy. The technique takes advantage of
the human visual system to produce a three-dimensional image in the analyst’s brain by
using two two-dimensional images and a stereoscope (Sabins, 1997). Without
stereoscopy, the analyst can obtain only limited information about terrain relief. In this
case, marginal terrain relief can be obtained by analyzing how the sun strikes the earth in
the image or from object layover.
Object layover make the tops of taller objects within a scene appear to lean away
from the optical center of the image. The effect is created because the photons carrying
information about the top of an object arrive at the sensor from a different angle than the
photons carrying information about the bottom of the structure. Since the sensor can only
generate a two-dimensional image, the photons from the object are transposed onto the
image plane away from the optical center of the image. Figure 9 displays an aerial
photograph with layover and a pictorial description of the effect. Look angle, object
height, and relative displacement from the optical center of the image will all affect the
level of distortion created. A trained analyst uses layover as a tool to obtain relief data
using simple geometry (Sabins, 1997).
Figure 9. Example of Layover in Aerial Photography and Explanation (Sabins, 1997)
The strongest advantage of the panchromatic format is that the analyst can easily
describe the final assessment in terms the mission planner understands and trusts.
Panchromatic images also provide more quantitative and qualitative intelligence about an
area than a map does (FM 21-26, 1993). However, daylight and fair weather are essential
for successful imaging (Sabins, 1997). Obscurants such as water vapor or smoke render
panchromatic sensors useless because the sensor captures the reflected solar energy of the
37
38
obscurant, not the target of interest. In addition, raw images will not contain precise
location data when compared to a map (FM 21-26, 1993).
2. Infrared Imagery
The infrared portion of the electromagnetic spectrum can be divided into two
major sections. Reflected infrared includes the near infrared (0.7 to 1.2 μm) and short
wave infrared (1.2 to 3.0 μm) regions of the electromagnetic spectrum. Thermal or Long
Wave Infrared is located from 3 to 15 μm the electromagnetic spectrum. The wavelength
band from 5-8 μm is an atmospheric absorption band of electromagnetic energy (Sabins,
1997).
a. Reflected IR
Solar energy dominates the reflected IR region. An object’s appearance in
gray scale is based on its reflectance values in this region, which is the same phenomenon
as panchromatic. However, the amount of spectral reflectance for different objects can
vary from the visible region. One such example is vegetation. The solar reflectance for
certain vegetation types dramatically increases at approximately 0.8 μm. Using this “IR
ledge” is one method of finding camouflaged objects. True vegetation in this region is
very bright, while cut vegetation and camouflage material appear dark (MUG, 1995). If a
scene containing the objects of Figure 6 were imaged in the reflected IR, grasslands
would be the brightest objects in the scene, followed by pinewoods and the red sandpit,
with silty water still being the darkest object (Short, 1999). The scene will not appear the
39
same as a similar image in the visible region. This effect can be confusing to untrained
personnel and may lead to a poorer mission plan.
b. Thermal IR
Observations at longer wavelengths are controlled by the thermal emission
from the targets, and the scene dynamics differ from those described above for the
reflective IR domain. Figure 10 is a graph of Plank black body radiation formula for two
objects (Gettys, 1989). The dashed line depicts ideal blackbody solar energy at the
Earth’s surface. The solid line depicts an object with an approximate temperature of
300°K. Energy from solar emissions dominates the graph up to approximately 3-5 μm,
after which object emission dominates. Hence, FLIR and other observations in the
MWIR and LWIR are largely independent of solar illumination. Another advantage
thermal IR sensors provide over panchromatic is that airborne particles such as smoke
and dust have a reduced effect as an obscurant because the particles themselves are
smaller than the energy wavelengths of interest (Sabins, 1997; Aerospace Corp., 1998).
Image characteristics will often appear similar to panchromatic imagery
because both formats record information as gray-scale variations. The brightest tones on
thermal IR images represent the objects with the most radiant energy, while darker tones
correspond to objects with the least radiant energy. This explanation is still incomplete,
because two objects such as wood and metal that have the same absolute temperature
would nominally radiate the same amount of energy, and therefore they would be
indistinguishable to the analyst. Fortunately, just as the reflective character of targets
varies from material to material, so does the “emissivity,” or the relative ability of an
object to emit radiation, in comparison to an ideal “black body.” These variations are
relatively subtle (a few percent, typically) but sufficient to enhance the utility of IR
sensors in distinguishing targets that are otherwise not distinguishable. The object’s
other thermal characteristics such as inertia, conductivity, and capacity determines an
object’s ability to absorb and retain heat. In turn, these attributes as well as atmospheric
effects impact how an object appears relative to its environment in a given image (Short,
1999).
1 . 0 0 E - 0 1
1 . 0 0 E + 0 0
1 . 0 0 E + 0 1
1 . 0 0 E + 0 2
1 . 0 0 E + 0 3
0 . 1 1 . 1 2 . 1 3 . 1 4 . 1 5 . 1 6 . 1 7 . 1 8 . 1 9 . 1 1 0 . 1 1 1 . 1 1 2 . 1 1 3 . 1 1 4 . 1W a v e l e n g t h ( u m )
(W/s
q m
ster
um
)
1 . 0 0 E + 0 4
Rad
ianc
e
S o l a r E a r t h
Figure 10. Planck’s Blackbody Radiation Curves for the Sun and the Earth Measured at the Earth’s Surface (After Gettys, 1989)
40
Several phenomena on thermal IR images can be confusing to the
untrained user. Figure 11 displays diurnal temperature variations for various objects that
could comprise a scene. In the early morning hours and in late evening, the brightest
objects in the scene are vegetation, followed by standing water, rocks/soil, damp terrain,
and metallic materials. However, between local sunrise and local sunset rocks and soil
become the most radiant objects in the scene so they would appear the brightest (Sabins,
1997). In addition, wind patterns that cool selected objects can produce streaks on the
image that could be interpreted as significant tonal variations. Therefore, without a basic
understanding of these effects, image misinterpretation is possible.
Figure 11. Diurnal Temperature Variations for Selected Objects (Sabins, 1997)
System resolution is another challenge the analyst faces when interpreting
thermal IR images. Formula [1] shows that the GSD is proportional to the collected
wavelength λ. Since thermal IR wavelengths are an order of magnitude longer than
visible wavelengths, the GSD between comparably sized objects must increase by the
same amount in order for those objects to appear distinct, for a given optical system.
41
42
Therefore, an analyst who relies heavily on GSD can be hampered in his or her efforts to
interpret thermal IR imagery. This effect is illustrated using LANDSAT TM imagery in
Figure 13. Bands 1 and 2 are both images in the visible portion of the spectrum while
Band 6 images the thermal IR. The band 6 image is clearly less sharp than Bands 1 and 2
(Short, 1999).
The strengths of using thermal infrared images include the fact that the
medium captures information outside the range of the human eye. Sensors do not require
solar illumination for imaging and weather has a reduced impact on this format when
compared to panchromatic. The major disadvantage associated with this format is the
confusion an untrained user might encounter.
3. Radar Imagery
Radar imaging systems create an image by transmitting electromagnetic energy
from selected wavelengths from 0.1 to 100 cm, then capturing the reflected
electromagnetic energy. The long wavelengths would nominally lead to very poor
resolution given the applicability of equation [1]. Increased spatial resolution is attained
by using a very large antenna, which can be produced a virtual method such as synthetic
aperture radar (Sabins, 1997).
Radar sensors provide their own illumination. Therefore, they are not dependent
on solar reflection or thermal emission for successful imaging. In addition, atmospheric
effects such as absorption in this portion of the electromagnetic spectrum are
substantially reduced.
43
Pixel brightness in a radar image indicates spots where the transmitted energy was
returned to the sensor. Objects with steep slopes towards the antenna produce strong
returns, thus bright pixels. Corner reflectors such as buildings produce the strongest
returns. Objects with steep slopes facing away from the antenna produce very low
returns or dark pixels, because no energy reaches the area. Objects that scatter energy in
all directions such as vegetation produce intermediate returns. Smooth surfaces such as
pavement or water reflect energy away from the antenna thus producing very small
returns (Sabins, 1997). Figure 12 is a radar image of the Pentagon that shows these
effects. The exterior shape of the Pentagon is very strong, while the roads at the bottom
of the image are very dark. The vegetation in the courtyard at the center of the Pentagon
produces the intermediate tones described.
Smoothness is relative to the imaging system wavelength. An object such as
pavement appears rough in the visible region because the pavement scatters, rather than
reflects, most of the incident energy. However, the radar’s wavelengths are thousands of
times greater than those in the visible region, so the pavement reflects most of the energy
away. A surface is considered smooth if it meets the criterion shown in Formula [2]
(Sabins, 1997).
h < λ (8 sin γ)-1, where: [2]
h = vertical relief
λ = wavelength
γ = depression angle (angular measure of how far down the sensor
is pointed from the horizontal)
Phenomena such as object layover, relative motion, and topographic inversion also
present challenges to interpreting radar images. Radar images also experience object
layover, but it is reversed from the perspective found in panchromatic. When an object
with large vertical relief is imaged, the reflected energy from the top of the object arrives at
the sensor earlier than energy from the bottom of the object; therefore, the object appears to
lean toward the sensor. When the object sensed is in motion, distortion or smearing can be
produced because there are multiple returns in different places for the same object (Sabins,
1997). Topographic inversion is produced when the brain unsuccessfully guesses the
relative location of an illumination source when attempting to determine terrain relief. An
unsuccessful guess causes ridges to look like valleys and vice versa (Sabins, 1997).
Figure 12. Radar Image of the Pentagon (FAS, 1997)
44
45
The major advantage of radar images is that they are completely independent of
both lighting conditions and weather. The major disadvantage associated with radar is the
same as Thermal IR; the image format requires increased training to properly interpret.
4. Single Band Multispectral Imagery (MSI)
Multispectral imagery is on the boundary of current operational tools and the
specialized analysis domain of the expert, such as the mapmakers at NIMA. Still,
imagery analysts can utilize multi-spectral imagery, such as that obtained from the
LANDSAT satellites. Its distinction from traditional military systems is that
multispectral sensors collect the energy intensity simultaneously from two or more
contiguous regions of the electromagnetic spectrum, recording the intensity values
separately (MUG, 1995). MSI sensors probe several transmission windows in the .4 to
13 μm region of the electromagnetic spectrum. The collected energy is some
combination of solar energy and thermal radiation that varies as a function of wavelength
(Aerospace Corporation, 1998). For example, the LANDSAT Thematic Mapping (TM)
Satellite has seven spectral bands (values in μm): 1(0.45-0.52), 2(0.52-0.6), 3(0.63-0.69),
4(0.76-0.9), 5(1.55-1.75), 6(10.4-12.5), and 7(2.08-2.35) (Sabins, 1997). Interpreting one
band of LANSAT imagery independently of the other bands allows the image to be
displayed as a gray scale image.
Band 1 Band 2 Band 3
Band 4 Band 5 Band 6
Band 7
Figure 13. LANDSAT TM Imagery of Morro Bay, CA (Short, 1999)
The environmental characteristics the sensor responds to are a function of the
band interpreted, which means the same scene will appear slightly different in each band.
Figure 13 displays this effect for Morro Bay, California. For example, LANDSAT TM
46
47
bands 1 and 2 are both in the visible region, but band 1 is more sensitive to natural blue
light, while band 2 is more sensitive to natural green light. Neither band is sensitive to
red or infrared light. Since the analyst understands this, he or she might use this
technique to locate or describe objects that have high contrast in one of these bands.
LANDSAT bands 4, 5, and 7 responds to the reflected IR energy and band 6 respond to
thermal IR differences in a scene.
5. Summary
To summarize, when an image that represents a portion of the Earth surface
contains information that comes from a single spectral region, it may be interpreted
literally in gray scale. Each sensor encodes the information into gray scale differently.
Therefore, the analyst must understand the method the sensor uses to capture and record
the energy as well as certain physical effects to prevent misinterpretation.
D. SPECTRAL IMAGERY
In certain cases, a single gray scale image does not give the analyst enough
information about the area of interest to meet all the planner’s requirements. While a
multispectral sensor may physically capture the photons only once, it creates as many
images as there are bands. By performing additional processing on the scene, it is
possible to combine the effects of multiple bands into a single image that generate
additional visual cues for the analyst to interpret. If the additional processing is not
performed, it is likely that the resulting scene will provide no additional information
48
about the scene than any other original images independently. Each of these formats
(MSI, HSI, and sensor fusion) gives the interpreter the ability to analyze the image using
literal and non-literal means.
1. Multispectral Images (MSI)
Multispectral image interpretation allows the user to combine the several spectral
bands to create image products that differ significantly from the single band gray scale
images described previously. Coupling the information in the bands with object spectral
reflectance characteristics can result in higher information extraction when compared to a
panchromatic image (Sabins, 1997). The methods for interpreting MSI include true and
false color composites, classification, and principal components analysis.
a. True Color Composites
Joint Intelligence Centers have the capability to produce products such as
true color composites. While the production method falls into the realm of spectral
analysis because the analyst combines information from several spectral bands to produce
the image, the end product is an image that can be interpreted literally without additional
training. Color, shape, and size constancies are easy to establish, because the objects in
the scene appear as they do in human experience. This sort of product can be an
excellent planning tool for the military if the season in which the sensor captures the data
coincides with the season the operation in which occurs.
49
A natural extension of the single band multispectral image interpretation
described earlier is to integrate color as a method of conveying information. The most
common images produced using MSI data are three-band color composites, which assign
each a band different color gun (MUG, 1995). Each pixel usually has three digital
numbers assigned: red, green, and blue. After each color gun is fired, the colors mix in
an additive manner for each pixel on the analyst’s computer monitor.
A true color image matches the spectral data for red, green, and blue
information to the red, green, and blue color guns. Figure 14.a displays a LANDSAT
TM true color image of Morro Bay, CA (Short, 1999). Most objects in the image appear
as they would by direct human observation, such as from an airplane window. The water
around the coast is blue, the golf course on the east coast of the bay just south of the inlet
is green, and the urban area is characterized by the light gray grid of streets, as are the
two highways coming and out of the town (Short, 1999).
However, certain objects in Figure 14.a still do not appear the way they
would through direct observation. For example, the Pacific Ocean to the west of Morro
Bay is still too dark because water vapor in the atmosphere absorbs energy from this area
before it reaches the sensor (Short, 1999). The most unrealistic color in the scene is the
hill slope. It should be a golden brown, but is displayed with a purple tone. The reason
for this color distortion is grounded in physics. Each band of energy in the image reacts
differently to refraction, reflection, and absorption in the Earth’s atmosphere.
Subsequently, greater or lesser amounts of that energy arrive at the sensor than the value
required to “mix” the proper color. In Figure 14.a, more red light arrives at the sensor
Comment [KK1]: I’d be a bit more specific. You now have a bunch of subsections and it is unclear which one you are referring to.
than blue and even less green, which creates the color mixture displayed (Short, 1999).
Table 3 provides a textual listing of how other features are displayed in true color images.
a. True Color Bands 1, 2, 3 (BGR) b. NIR False Color Bands 2, 3, 4 (BGR)
c. False Color TM Bands 5, 7, 6 (BGR) d. False Color TM Bands 4, 7, 1 (BGR)
Figure 14. True and False Color Composite Images of Morro Bay, CA (Short, 1999)
50
51
b. False Color Composites
Whenever the analyst selects a color scheme that does not equate the red,
green, and blue (RGB) color guns to RGB information in the image, a false color image
is generated. Any color image that displays spectral information that the human eye
cannot perceive as a color is false color. Near IR (NIR) and SWIR are the most common
formats for MSI pictures. Table 3 describes the color gun assignments for NIR and
SWIR false color composites as well as a textual description of how objects are colored
in these images (MUG, 1995).
True Color Near IR Short Wave IR
Blue Gun displays visible blue visible green visible red
Green Gun Displays visible green visible red near IR
Red Gun displays visible red near IR short wave IR
Trees and Bushes olive green red shades of green depending on
band color gun combinations
Crops medium to
light green
pink to red shades of green depending on
band color gun combinations
Wetland Vegetation dark green to
black
dark red shades of green depending on
band color gun combinations
Water shades of blue
and green
shades of blue black
Urban Areas white to light
blue
blue to gray lavender
Bare Soil white to light
gray
blue to gray magenta, lavender or pale pink
Table 3. General Appearance of Features in Various Composite Images (MUG, 1995)
52
Figure 14.b displays a false color composite of Morro Bay, CA.
LANDSAT TM Band 2, which is natural green light, was assigned to the blue color gun.
Band 3, which is natural red light, was assigned to the green color gun. Finally Band 4,
which is reflected IR, was assigned to the red color gun. This corresponds to what one
would see with traditional “IR” film. The previous discussion of reflected IR described
how healthy vegetation appears very bright in the reflected IR. This correlates to the
bright red colored areas in the image. Based on the level of red tint in different sections
of the scene, the analyst can coarsely classify vegetation types (Short, 1999).
In addition, the nearshore areas of the Pacific Ocean in the scene are
lighter because the sediment in the water adds reflectance to the scene. In planning an
amphibious mission, the planner would want to avoid areas where he or she could see
blue very far away from shore because it could be an indication of shallow slope which
traditional displacement landing craft may run aground on. This shallow slope problem
was one of the concerns that planners during Operation Desert Storm faced in preparing
the amphibious assault of Kuwait (Gordon and Trainor, 1995).
Figures 14.c and 14.d are two other examples of false color images.
Figure 14.c is used to convey information about thermal differences based on band
selection. Just as in other relative temperature plots, shades of blue represent the coolest
areas of the image, while the red shades represent the warmest colors in the image (Short,
1999). Specific temperatures are not assigned to the color hues, so this information could
be misleading to a planner if the temperature difference were only 10°C. Figure 14.d
shows each of the major features of the image in a primary color. Vegetated areas are
53
displayed in bright blue; bright reds classify the surf, towns, and other hydrographic
characteristics; greens are uncultivated areas (Short, 1999).
Figures 14.c and 14.d illustrate a major drawback in false color image use
for military planning; they are disturbing to the untrained user because they violate the
concepts of color constancy. People expect water to be blue and grass to be green
regardless of illumination conditions. When objects such as these appear in a different
color without explanation, the viewer can become confused. If the image analyst cannot
explain what the color scheme means in a concise fashion that the planner can understand
and apply, then the planner will probably be thrown off by the fact that the colors are
wrong and be less likely to use that information in the planning process. The US
Department of Defense (DOD) appears to have minimized this problem in MSI by using
only certain false color composite image types. With the number of types minimized, the
analyst and the planner can use keys similar to Table 3 to interpret how different features
appear in different color groupings (MUG, 1995).
c. Digital Image Processing
There are several digital processing techniques available for the analyst’s
use in order to extract information from a scene. Principle Components Analysis and
Classification are just two of the digital image processing techniques that take advantage
of the fact that there are several DNs for each pixel, each representing different spectral
information.
54
If the individual images in Figure 13 are quickly reviewed, they all appear
very similar except band 6. Principal Component Analysis (PCA) is one processing
technique that uses all available spectral bands to create the same number of new images.
However, the first few principal component (PC) images contain most of the variability
between bands and most of the remaining images are noise. If materials within a scene
have significantly different spectra, this may aid in target discrimination. This effect can
be seen in the seven PC images of Morro Bay in Figure 15. PC 1 is generally a weighted
average of all the spectral bands that looks like a black and white photograph. PC 7 and
possibly PC 6 can be considered noisy. Additional PC images highlight different features
in the scene that the analyst can literally interpret, provided the analyst has the associated
knowledge to accompany the image (Richards, 1999).
The PC images may also be combined into a color composite. PC color
composites utilize more of the available color because each PC image highlights
uncorrelated differences, while the standard color composite does not (Richards, 1999).
Figure 15 displays a PC color composite by assigning the information from PC images 1,
2, and 3 to the blue, green, and red color guns, respectively.
An advantage of PCA is that only the first few images require
interpretation. Another advantage is that sensor noise that is inherent in all bands is
reduced. Therefore, the multi-band data set is effectively reduced to a single, lower-noise,
gray-scale image that is suitable for transport over low bandwidth communications
circuits (Short, 1999; Sabins, 1999). A disadvantage is that if the analyst or planner does
not understand how this processed image differs from the original, then the advantage of
PCA is lost.
PC 1 PC 2 PC 3
PC 4 PC 5 PC 6
PC 7 PC Color Composite-
images 1, 2, 3 (RGB)
Figure 15. PC Component Images of Morro Bay, CA (Short, 1999)
Classification groups pixels in a scene based on known spectral class
criteria. Selecting n bands from the available data sets creates an n-dimensional
55
56
classification space. Each band becomes an orthogonal axis to the others. The pixels in
the scene are mapped into the space based on their DNs for each band and can then be
grouped by comparing them to known material spectra. Assigning each class a color and
re-mapping the pixels geo-spatially creates a new color image (Short, 1999). Some
pixels will remain unclassified because they do not meet the criteria of any class
particularly well. In this case, they may be assigned to a class by way of statistical
analyses. If the classification is supervised, an analyst can control assignment; otherwise,
the computer can perform this automatically (Short, 1999; Sabins, 1997).
d. Summary
The major advantage of MSI is that the analyst can use the spectral
characteristics of objects to aid in their classification. By doing so, he or she provides
information about the area of interest that might not have been previously available in
any other format. Using color encoding allows the analyst to coarsely classify soil
vegetation types and water characteristics. Like infrared and radar formats, MSI provides
information outside the range of the human eye.
On the other hand, MSI is a complex medium requiring expert knowledge
in all of the electromagnetic regions described so far, as well as an understanding of how
to properly manipulate the data. Digital storage and processing requirements increase
with MSI, because each uncompressed scene contains one image per band. Provided the
data is collocated with planners and manipulation tools exist, this is not a problem.
However, the limited data rates that shipboard planners have access to make it difficult to
transfer a complete scene electronically.
2. Hyperspectral Images (HSI)
The distinguishing feature between MSI and HSI is the number of bands. While
MSI sensors utilize up to seven spectral bands, SI sensors generate hundreds of narrower
spectral bands in a spectral region (Aerospace Corp., 1998). Figure 7 pictorially displays
the spectral difference between MSI and HSI for a typical portion of the electromagnetic
spectrum (MUG, 1995).
The data returned by hyperspectral sensors are usually referred to as a
hyperspectral “data cube,” such as the one displayed in Figure 15. Two of the three cube
dimensions are spatial coordinates (e.g. x, y) and the third dimension is wavelength λ
(Aerospace Corp., 1998). Therefore, a single (x, y, λ) value describes the spectral
response for position (x, y) at wavelength λ. Fixing the spatial coordinates in a scene on
a single pixel, then plotting the extracted reflectance data as a function of wavelength
produces a pixel vector. This trace is similar to the spectral characteristic curves in
Figure 6 (Stefanou, 1997).
Figure 16. Sample Hyperspectral Data Cube (From Short, 1999)
57
58
The data cube may also be manipulated to produce monochromatic or color
composite images, which can be interpreted literally. In addition to the literal techniques,
there are also non-literal techniques that can be used to extract information from the data
cube.
a. Non-literal Processing Techniques
The higher spectral resolution provides the opportunity to detect subtle
spectral differences that are too narrow to be differentiated using MSI (MUG, 1995).
These differences in reflection curves are not resolvable using the literal analysis
techniques using panchromatic imagery (Short, 1999). Principal Components Analysis─
which was discussed in the multispectral section─ Spectral Angle Mapping, and Spectral
Matched Filter are three basic non-literal interpretation techniques used on hyperspectral
data cubes. Stefanou (1997) provides a more in-depth description of additional HSI
processing techniques.
SAM and SMF were performed on hyperspectral data of a cove at Eglin
AFB, FL. Figure 17 is a true-color composite of the cove, which is provided to orient the
reader to the region. The target spectra selected from the data cube were (color coding in
parenthesis): vegetation (green), shadows areas in vegetation (red), deep water (blue),
shallow water (yellow), sand (brown), and asphalt (maroon). The spectral library of
Figure 18, which was used to analyze the rest of the dataset, were developed by selecting
pixels that were comprised of that target material from Figure 17. Figure 19 shows the
pixels selected to produced the library overlaid onto the second principal component
image (PC 2) for the data set.
Figure 17. True Color Composite of Eglin AFB (Thanks to Chris Simi, Night Vision Lab)
Figure 18. Mean Spectra for Regions of Interest
59
Figure 19. Regions of Interest for Classification Overlaid on PC 2
(1) Spectral Angle Mapping (SAM). SAM is a deterministic
matching algorithm that compares pixel spectra to selected target spectra by comparing
the angle between pixels when both are mapped into N-dimensional space (Richards,
1999). When the angle value is within a user-defined range (expressed in degrees or
radians), the pixel is identified with the material that has those characteristic spectra. A
composite image can then be created where the different elements in a scene are color
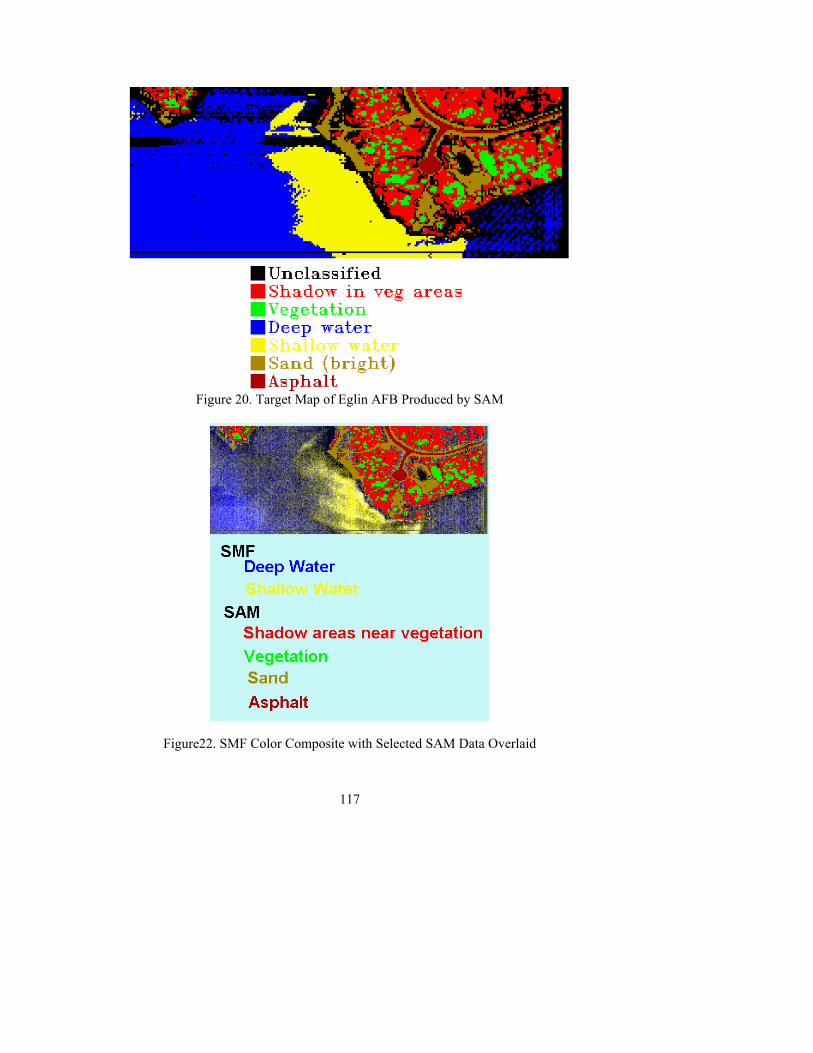
coded, providing a material or target map. Figure 20 is an target map produced by
performing SAM on the data set. The selected angle value was 0.1 radians. Increasing
the angle value could have reduced the number of unclassified pixels. However,
increasing the angle value also increases the chance of mislabeling a pixel.
60
Figure 20. Target Map of Eglin AFB Produced by SAM
(2) Spectral Matched Filter (SMF). SMF is a technique that
is representative of a class of statistical methods. It is derived from signal processing
theory (Richards, 1999). SMF produces an output that is proportional to an estimated
contribution of a target material to a given pixel (Collins, 1996). It is important to note
that both SMF and SAM require a comprehensive spectral library for the analyst to
conduct a comparison of the portions of the scene (Richards, 1999). Figure 21 illustrates
the image produced from SMF. Brighter pixels indicate a better likelihood that that pixel
is comprised of the target spectra. These individual SMF images can also be combined
into color composites. Figure 22 is a SMF color composite produced by assigning the
deep water image to the color blue, and assigning the shallow water to the colors red and
61
green. In addition, the SAM data for vegetation, sand, shadow areas around vegetation,
and asphalt were over overlaid onto the image.
Figure 21. SMF- Vegetation Class Probability
Figure 22. SMF Color Composite with Selected SAM Data Overlaid
62
63
b. Interpretation Challenges
A new set of problems arises when the analyst literally interprets a three-
band HSI composite or the products of one of the exploitation techniques described
above. The usage of false color images as with MSI is exacerbated because there are no
“standard” composite images in HSI (MUG, 1995). In addition, when the analyst selects
three portions of the spectrum for analysis, he or she in effect omits all but those three
portions in the interpretation, thus negating the benefits of higher spectral resolution.
Analysis of spectral imagery is a discipline that is still under development,
and there are a number of problems with the use of such data. Deterministic techniques
require a complete spectral library of background and target materials. Statistical
methods can distinguish materials, but may not identify them. Techniques such as SMF
can extract targets from a background but produce images that give probabilities of
occurrence that can be difficult to interpret (Stefanou, 1997; Short, 1999).
c. Incorporating HSI into Existing Capabilities
While HSI technologies have found applications in the commercial sector
(Neuenschwander, 1998), such as in the environmental monitoring function, they are still
not an operational capability within the US Department of Defense. However, HSI is
considered an advanced technology concept, covered under the Common Spectral
MASINT Exploitation Concept (COMSEC). The COMSEC’s purpose, as stated in the
Joint Warfighting Science and Technology Plan (1999) is quoted below:
64
“…to demonstrate COSMEC, end to end, to an operational user, showing the tactical
utility of MASINT spectral analysis to the warfighter. This ACTD will establish
COSMEC’s ability to support the Joint Vision 2010 mission areas of Information
Superiority and Combat Identification, as well as supporting specific operational
requirements. It will provide processing and exploitation capability to analysts in
preparation for government and commercial multi/hyperspectral collection platforms.
COSMEC supports both tactical and strategic intelligence using state-of-the-art MASINT
processing and exploitation algorithms. These algorithms will enhance the U.S. spectral
data exploitation capability. COSMEC has the ability to support a variety of operational
requirements, including detection and ID of camouflage and vehicles, search and rescue,
terrain characterization and mapping, beach route preparation, submarine detection, and
detection of chemical/biological weapons. COSMEC will provide operational units with
the capability to exploit data from existing and planned spectral sensors like the Land
Remote Sensing Satellite (LANDSAT), Satellite Pour d’Observation de la Terra (SPOT),
Senior Year Reconnaissance System Preplanned Product Improvement (SYERS P3I),
Hyperspectral Digital Imagery Collection Experiment (HYDICE), Spectrally Enhanced
Broad-band Array Spectrographic System (SEBASS), Moving Target Indicator (MTI),
and Littoral Airborne Sensor Hyperspectral (LASH). The modular design of COSMEC
will simplify the process of updating the program with new algorithms or sensors, such as
Warfighter and Naval Earth Map Observer (NEMO). This demonstration of COSMEC to
an operational unit will establish the ability of multi/hyperspectral analysis to support
search and rescue or camouflage detection in a combat-oriented mission. COSMEC’s
user-friendly interface and extensible architecture make it a versatile and useful tool for
the warfighter.”
3. Sensor Fusion
The final method of analysis involves merging data from two or more of the
formats previously described to produce a separate image for the area of interest. When
formats are combined properly, the analyst is able to extract more information about the
area of interest than by using any of the formats separately. A typical format
combination is MSI and panchromatic. LANDSAT color composites have poor GSD (30
65
m) but are good for classifying vegetation. Similarly, a good panchromatic image from
SPOT or IRS has better spatial resolution but only for a single wavelength region. By
digitally combining the panchromatic image with the color composite, the analyst can
describe the region with panchromatic with its better GSD, as well as classify soil types
using MSI, using a single image (Sabins, 1997).
Another example combines MSI and DTED to determine what pieces of land are
feasible for a particular type of military operation. For example, an airborne drop zone
must be flat, clear land. The analyst determines suitable locations by combining digital
terrain elevation data (DTED) and MSI. By using MSI, the analyst finds areas devoid of
vegetation, then uses DTED to determine the terrain gradient. Areas that meet both
criteria are identified as suitable drop zones, which can then be included in the planning
process (Gorski, 1999).
While sensor fusion shows promise, these are special products produced on
demand and not used by military planners on a regular basis because of the lengthy
process necessary to create a single image. Multiple formats for a single area must be
located before they can be combined. After the individual images are acquired they must
be co-registered. Common geographic points must be selected to properly align the
images (Short, 1999). Co-registration in itself can be difficult because of the way objects
layover in different formats (i.e., objects in radar lie towards the focal point, but objects
in panchromatic lie away from the focal point) (Sabins, 1997). Completing this process
in a timely fashion poses difficulties to afloat planners with limited bandwidth and
computing power. In addition, these products will probably be displayed in false color.
66
As with MSI, the utility of the final product is based on how well the planner understands
the basis for the analyst’s assessment.
E. SUMMARY
This section reviewed the major planning aid formats used to prepare military
operations. Each format has its absolute strengths and weaknesses, as well as advantages
and disadvantages relative to other available formats. In most cases involving imagery,
the planner’s confidence in the analyst’s assessment is largely based on his or her ability
to understand how the analyst reached a decision.
67
V. THE STUDY
To determine the impact that HSI can have on amphibious warfare planning, the
impact that existing formats have must be ascertained. The impact that existing formats
have is evaluated by a study of image analysts. In order provide the analyst quantifiable
jobs that they can perform on an image that support amphibious mission planning, a task
analysis was performed on the amphibious planning process.
A. TASK ANALYSIS
A task analysis reduces a complex evolution into a set of less complex events that
may be analyzed independently. The elements identified in the task analysis represent
the information requirements necessary to plan the mission. This thesis uses the task
listing method that Zemke (1984) describes to complete the task analysis.
Task listing captures the duties involved in performing a task by breaking a large
task, such as planning an amphibious mission, into the primary subtasks involved with
accomplishing the main task. Subtasks comprise the steps necessary to complete the
main task regardless of the effort required for completion. In turn, the primary subtasks
are decomposed into their subtasks in the same manner as the main task was. This
process of subdivision is then recursively performed on each subtask until the desired
level of granularity is obtained, which for this thesis was whether the subtask was
answerable from Imagery Intelligence (IMINT). Subtasks that were not answerable by
IMINT were omitted from further development following identification. This list of
subtasks or task elements is provided in Appendix B.
68
B. IMAGERY ANALYST STUDY
The image analyst study was conducted to identify the cognitive processes
involved with image interpretation in support of amphibious operations. Analysts were
tasked with completing one of the task elements in Appendix B while being observed. In
addition, this thesis looked to identify situations where the analyst was uncertain with his
or her interpretation.
1. Participants
The imagery analyst study was conducted at two of the Unified Combatant
Commanders Intelligence Centers, Atlantic Intelligence Command (AIC) in Norfolk, VA
and Southern Command Joint Intelligence Center (SOUTHCOMJIC) in Miami, FL, as
well as the Naval and Marine Corps Intelligence Training Center (NMITC) in Dam Neck,
VA. The six subjects at AIC were assigned to the Expeditionary Warfare Products
Division (DI3). The fourteen subjects studied at USSOUTHCOM were assigned to the
JIC Imagery Division. The three subjects studied at NMITC were Imagery Analyst ‘C’
School instructors. The sixteen male subjects and eight female subjects were military
image analysts from all of the services in the US DOD or DOD Civilians. The average
exploitation experience was 7.4 years (range 1-20 years, S.D. 6 years). The average
length of formal training for the 24 analysts was 11 months (range 3-48 months, S.D.
11.6 months). Data regarding age were not collected. Table 4 shows the rank and service
of the different analysts observed in the study.
69
Rank USA USN USAF USMC DOD CIV
E-4 1 2 1 0 -
E-5 3 1 0 2 -
E-6 2 5 1 1 -
E-7 0 0 1 0 -
CIV - - - - 3
TOTAL 6 8 3 3 3
Table 4. Image Analyst Study Demographics
2. Apparatus
Subject interviews were conducted in their work settings while performing their
normal analytical duties. Analysts exploited high resolution panchromatic, radar, and IR
littoral scenes derived from National Sensors. MSI from LANDSAT was also exploited.
The author had no control over the image area, format, or quality presented to the analyst.
At the JICs, the analysts performed their analysis on recently acquired digital images
displayed on computer screens. At NMITC, the analysts performed their interpretation
on hardcopy black and white photographs or acetate negatives using a light table. These
images were specifically selected for training new analysts.
3. Procedure
During the interview each subject was asked how he or she would complete one
of the subtasks provided in Appendix B. Subjects were free to use any available image
formats and resource materials such as recognition guides. No time restrictions were
imposed on the subjects. Interviews lasted approximately 40 minutes.
70
Information regarding the decisions were collected using verbal protocols
(Carswell, 1999), in which the subject verbally described the steps taken to reach a
cognitive decision based on what he or she perceived in an image. Verbal protocols were
used because many of the intermediate steps in image interpretation are second nature to
the subjects. This technique allows the interviewer to collect data by having the subject
“talk through” a specific task. Finally, the author asked each subject how confident he or
she was with his or her result. If they expressed uncertainty, subjects were asked to
describe how their certainty level was reduced.
C. ANALYSIS
The data collected at this point was a list of task elements from the task analysis
and human factors data describing how trained analysts interpret the most common forms
of imagery. Qualitative analysis was performed on the data because the small sample
size and the lack of control the observer had over the situation prevent analysis by
statistical means. A written description of how an analyst accomplished a particular
subtask was created. Each subtask description contains information about visual clues,
identifiers, techniques, formats used, and level of certainty.
It is hypothesized these data will expose areas where the analyst is less certain
with the answers provided to particular task elements. It is also hypothesized that data
from HSI can improve the analysts’ certainty in these area and possibly provide valuable
information that was previously unavailable. The improved environmental knowledge Comment [WKK2]: you need to specify the task. The reader has no idea how improvement will be measured. Again, this is unclear and choppy sentences and thoughts.
71
base will increase the mission planner’s situational awareness in the littoral, allowing the
creation of a better mission plan.
D. LIMITATIONS
While this study does have merit because it was conducted on image analysts
performing tasks pertinent to amphibious warfare, there were weaknesses associated with
its design. Specifically, the data collected, specificity, and the lack of control are all noted
as limitations.
1. Data Collected
One type of data that should have been specifically collected during this study
pertained to the analyst’s relative certainty levels for different image types used to
complete a particular subtask. While it is suspected that the user would still be most
certain with results derived from high NIIRS panchromatic, this sort of data might have
provided additional insight as to what in formats other than panchromatic makes the
analyst uncertain.
2. Specificity
This study was focused on analysts supporting amphibious warfare. The results
from this study were then extended to planners preparing amphibious missions. The
benefits of exploring this single area in so much depth limits extension of the results to a
larger unstudied population.
72
3. Observer Control
The author’s lack of control over the situation was a limitation: there was a great
deal of variability associated with image quality. A more controlled study could have
been created by using having the analysts all interpret the same littoral images, which
would have reduced some of the variability in the study based on image type and quality.
Analysts could have accessed these hypothetical images via and INTELINK web page at
the Naval Postgraduate School. Once they accessed these electronic images, they
analysts could perform their literal interpretation.
73
VI. RESULTS
The first hypothesis ─ that there would be certain task elements for which the
analyst would be less certain with their results ─ was validated. These task elements
and condition of the civil/military telecommunications network; and avenue of approach
determination for ground or fixed wing air forces.
Table 5 shows what formats analysts used to complete a given task during the
period of observation. More precise numbers cannot be given in the table because the
specific number of images that an analyst used during the interview was not noted.
74
Task Panchromatic Radar Maps MSI IR
Coastal Configuration X X
Beach Egress Points X
Obstacle Identification X X
Cover and Concealment
Determination X X
Surface Characteristic
Determination X X
Determining Avenues of
Approach X X X
Tidal Condition
Determination X
Determining the Nature of
the Surf X
Wind Condition
Determination X
Determining Water Currents X
Underwater Obstacle
Identification X X
Road Network
Characteristics X
Inland Waterways
Characteristics X
Static Order of Battle X X X
Mobile Orders of Battle X X X
TOTAL 14 3 3 2 3
Table 5. Counts of Image Formats Used by Analysts
75
A. GENERAL TOPOGRAPHIC DESCRIPTION
1. Coastal Configuration
To characterize the coastal configuration, the subject first located the large water
mass by its darker color in either the panchromatic or radar image format. He or she then
moved toward the land by identifying the breakers, which appear as long thin white lines
on the dark background. After identifying the coastline, the subject selected portions of
the beach for further study in order to determine if they met the criteria of a possible
landing site. The factors impacting the selection at this point include the expected size of
the landing force, the type of landing craft used in the operation, and the beach size and
shape. The first two factors were facts that are available to the subject. Possible landing
areas are classified initially by their shape─ straight, concave, or convex ─then by
measuring their physical size, and finally determining the geographic coordinates for the
beach center. The subjects did not identify any uncertainty regarding this task.
2. Beach Egress Points
With possible beaches initially identified, the subject used the panchromatic
images to determine if that area has adequate points for the landing force to exit the
landing area from enroute to the objective. Adequate egress point descriptions included
information regarding location, exit type, beach relief, and soil composition. The subject
detected potential exits from differences in tone, which are either lighter or darker than
the background. Depending on the degree of randomness that an exit exhibited, the
subject classified the exit type as either manmade or natural. Natural exits exhibited
76
better blending into the background while the manmade exits displayed geometric,
repetitive patterns. The subject was less willing to describe relief data from a single
image. Therefore, he or she also analyzed topographic maps to make these
determinations. The narrowest point of each exit was measured to provide the planner a
measure of how easily an exit could be sealed by the defender. The three beach-soil
classifications an analyst was confident in making were sand, pebbles, and rocks, which
is a determination based on image texture and pattern. The subject exhibited uncertainty
in making a more refined classification.
3. Obstacle Identification
The subject located manmade obstacles that were not buried by their shape and
repetitive placement on the ground in either the radar or panchromatic image. Obstacles
whose construction material was metal were detected on radar, even if the obstacle was
not detected in panchromatic. Buried objects such as mines could possibly be detected
because of ground discoloration, but the subject stated he or she would be uncertain
regarding detection if the time between object burial and imaging was too long. The
subject located natural obstacles such as rocks, inland streams, etc. by understanding how
they can influence ground force movement. Inland streams are a darker color than the
background and have a natural shape. The subject did not describe how other natural
obstacles were detected, nor did he or she express uncertainty categorizing these features.
77
4. Cover and Concealment Determination
In order to determine cover and concealment effects, the subject used a
topographic map of the area. However, maps are of varying quality and the older the data
on the map, the more the subject relied on other formats such as MSI. Non-gray scale,
color composite maps were created for the area of interest. For areas with great seasonal
variation in foliage, the subject ensured that the source image was from the same season
as the operation execution. The subject selected the bands to best describe the level that
the terrain provides protection from enemy fire (cover) and concealment from enemy
forces. There was no standard color scheme used. However, the subject emphasized that
he or she must make the color representation simple enough to be able to explain it to the
commander. The subject did not express uncertainty in making this determination.
5. Surface Characteristic Determination
Both panchromatic and MSI were used to characterize the soil composition. The
subject needed to make cognitive decisions about soil composition, drainage, and relief.
For the panchromatic format, the subject could only classify beach soil as either
sand, pebbles, or rocks based on their texture and pattern. The subject did not comment
on soil characterization other than near the beach. The subject made soil drainage
characterizations based on color, because areas such as streams and water-saturated land
appear darker in the scene. A computerized version of stereoscopy produced a qualitative
description of vertical relief using two panchromatic images. The subject exhibited
uncertainty in making specific soil characterizations using panchromatic.
78
The subject used MSI color composites to characterize soil composition. Beyond
band selection, the subject did not quantify how this was performed. The subject did not
quantify how precise a characterization he or she could make from the presented image
for either the beach material or the soil composition of the area immediately behind the
beach. The subject used digital terrain elevation data (DTED) and the elevation data on
hardcopy charts to characterize surface slope. The subject did not express uncertainty
performing this task using MSI in conjunction with the elevation data.
6. Determining Avenues of Approach
Subjects in the study performed two tasks that are relevant to determining the
avenues of approach for rotary wing forces, locating power lines and determining suitable
helicopter landing zone locations (HLZ). Using a topographical map, the subject located
power lines by their symbol and also located the nearest prominent feature. Then the
feature was located in an IR image and the subject performed a localized search for the
first tower. The tower was located by either looking for the tower directly or by locating
the shadow it projected. The subject re-centered the image at periodic intervals where he
or she thought the next support tower would be located. The subject was not certain they
could locate all the power lines in a scene.
In determining potential HLZ’s, the subject scanned the panchromatic scene’s
wide-open grassy areas such as a golf course or athletic field because they generally have
a flat slope and fewer power lines surround them. The subject then determined the size
and shape of the potential landing spots. He or she did this by examining the boundary
79
between the soil comprising the landing spot and surrounding features such as trees or
fence line. The subject used an independent format such as a topographical map or
DTED to determine the terrain slope of the landing area. The subject also recommended
an approach path based on prominent navigation features such as buildings. After
determining the size and shape of the actual landing area, the subject searched the landing
area and the approach path for flight hazards such as power lines or lamp poles using the
method described in the previous paragraph. Then the analyst looked for access points
on the ground such as a road network. Finally, the subject performed an area search for
air defense equipment, military units, and medical units.
Dense urban areas and threat condition added uncertainty to locating adequate
HLZ. In addition, the subject expressed uncertainty in locating all flight hazards such as
power lines and poles.
B. GENERAL HYDROGRAPHIC DESCRIPTION
1. Tidal Condition Determination
The subject estimated the tidal conditions by comparing panchromatic images at
high and low tides. A measurement of the distance from the water’s edge at low tide to
the point high water line was made. The high water line was identified by the shading
difference between the darker water-saturated sand and lighter dry sand. A potential
landing site could be discounted if that measured difference was too great, because the
lack of cover and concealment place the landing force at a higher risk. The subject also
80
compared the two images looking for differences such as obstacles that might be covered
at high tide. The subject did not express uncertainty regarding this task.
2. Determining the Nature of the Surf
The subject determined the nature of the surf by making two measurements on the
panchromatic image. He or she first measured the distance from the water’s edge to the
point where the surf first breaks, then measured the angle that the waves strike the beach.
These measurements provide an indication to planners of how dangerous the surf is to
landing craft and personnel. The subject did not express uncertainty regarding this task.
3. Wind Condition Determination
The subject estimated the wind condition by analyzing wave action using
panchromatic images. The subject estimated wind direction to be orthogonal to long,
thin, white lines that characterized the waves. Larger waves also indicate stronger winds.
The subject analyzed the waves more carefully to determine whether the wind was
blowing on or off shore. If the leading edge of the wave is clean (i.e., no water spray) the
wind direction was blowing to sea. Otherwise, the wind was blowing onto land. The
subject did not express uncertainty regarding this task.
4. Determining Water Currents
The subject estimated water current by analyzing sediment deposit on the beach
using panchromatic imagery. The sediment was identified in the image by the variation
81
in texture between it and the other beach materials at the water’s edge. If the sediment
deposit appears evenly distributed across the beachfront, the current runs directly into the
beach. If the sediment collection was uneven, then the current runs orthogonal to the area
with more sediment.
In addition, the subject used the position of manmade objects such as breakwater
and jetty if available to judge the water current direction. The water current will hit the
breakwater first and deflect into the jetty in order to keep the sediment outside a channel.
The subject did not express uncertainty regarding this task.
5. Underwater Obstacle Identification
The subject stated that offshore obstacles could show up in panchromatic imagery
if they are at a depth shallow enough to affect surface wave action. Using a low tide
image, the subject scanned the wave pattern for line breaks away from shore. More
random breaking patterns can indicate point obstacles such as rocks, while uniform
breaking patterns indicate possible sandbars. The subject expressed uncertainty in
locating deeper underwater obstacles because those obstacles that did not break the water
surface or affect the wave action would not appear in the image. The subject stated he or
she would also review hydrographic charts. In order to locate known underwater rock
formations.
82
C. TRANSPORTATION FACILITIES DETERMINATION
1. Road Network Characteristics
The subject assessed the military utility of road networks by their type, width, and
construction material. The subject first identified roads by their long narrow shape. The
gray scale shade of the road in the panchromatic image is an indicator of the construction
material: dirt roads blend into the background, concrete appears light gray, and asphalt
appears very dark. The number of entrances and exits to the roadway per unit distance
were enumerated. In addition, the subject examined the terrain relief surrounding the
road for potential choke points such as tunnels and bridges. The subject did not express
uncertainty regarding this task.
2. Inland Waterways Characteristics
The subject used gray scale shade and shape differences to identify inland
waterways. The subject stated that streams and riverbeds were darker than the
surrounding background in the panchromatic image. In addition, the subject stated that
the topographical maps did not completely describe inland waterways. The subject
attempted to classify the waterway as manmade or natural based on how random or
repetitive the waterway appeared in the scene. The subject also measured width at
various points. The subject did not express uncertainty regarding this task.
83
D. ENEMY MILITARY SITUATION DETERMINATION
The techniques used by subjects on panchromatic, radar, and IR images for
determining force strength and disposition varied between static and dynamic orders of
battle. Static orders of battle include electronic, missile, air, naval (in-port), industrial,
and ground forces in garrison. Dynamic or mobile orders of battle included any
dispersed force such as deployed ground forces or forward air bases. The subjects
stressed that knowledge about the sensor and the enemy as well as analyst experience
aided the exploitation process. They also stated that shadows could help or hinder
exploitation. Shadows were beneficial for seeing features too small to be captured by the
sensor, but over-elongated shadows could distort information, possibly leading to
misidentification. When discriminating between classes of objects, subjects would use
key recognition features or length-to-width ratios as an aid.
1. Static Order of Battle
In previously identified sites, the place’s function was already known. In this
instance, the subject was primarily interested in updating the body of knowledge about
the site. The subject used existing knowledge about a site, either other images or reports
based on prior interpretation, to aid in completing the task. Radar, IR, and panchromatic
image formats all were exploited. As the subject scanned the site, he or she enumerated
and classified different pieces of equipment.
The subject interpreted the scene using a variety of techniques to aid in object
recognition. Equipment’s general shape might provide clues as to the way it would
84
appear in a scene or the marks it might leave on the ground when it is removed. In
addition, systems requiring extensive maintenance could have more support vehicles that
could be detected on IR or radar. The subject also scanned images for known patterns
based on the way certain systems were spatially arranged. More specifically, the subject
looked for regular patterns on a random background. Ground shadows were also used to
aid in identifying key recognition features. Finally, relative size between unidentified
objects was used to help classify objects. The subject also added that high NIIRS
panchromatic imagery was better than a map, especially in the urban areas. This was
because the map could not adequately capture the complexity of the scene. The subject
analyzed overgrowth to determine the frequency of usage for an unoccupied site. The
subject did not express uncertainty regarding this task.
2. Mobile Orders of Battle
The subject stated that mobile orders of battle such as dispersed troops were more
difficult to locate than their static equivalents. He or she attributed this to the relatively
limited baseline knowledge that could aid in the search, sometimes only geographic
coordinates. For this worst case scenario, the subject electronically plotted the
coordinates on the image and began a wide area search. The subject scanned areas closer
to lines of communication such as roads, trails, and rivers before searching other areas.
The subject searched these areas for known geometric patterns that could indicate the
function of a site. Terrain configuration significantly impacted the subjects’ ability to
85
identify units or equipment. For example areas with dense vegetation or significant
terrain relief were particularly difficult to locate targets of interest.
In cases such as a ground unit departing garrison, the subject first searched known
training areas for the missing units. Confirming their presence in these areas could be an
indication of routine operations. The subject also stated that some units modified their
operations in the field, so he or she looked for these differences to locate units. If the
subject successfully located one piece of equipment, he or she would search the area for
other equipment associated with that unit. The subject also estimated unit size by
enumerating objects that could be located, then taking the difference from what a unit
doctrinally deploys. The subject expressed uncertainty regarding this task.
86
THIS PAGE LEFT INTENTIONALLY BLANK
87
VII. DISCUSSION
This thesis approaches the task of determining the potential impact of HSI in
amphibious planning using the following process. The first section provides an
explanation of how analysts and planners interpret planning aid formats using visual
information processing theory. In addition, it offers a possible explanation for why the
false color format is disturbing to planners and analysts. Having established this, a
method for HSI exploitation and interpretation are developed. Then the work of Delgrand
(1993), Fay (1995), Collins (1996), Bergman (1996), and Stuffle (1996) are briefly
presented as examples of where HSI can provide valuable information in areas where the
analyst is uncertain. Finally, after establishing how the interpreter acquires better
information, particularly in areas of uncertainty, the effects of planning an amphibious
mission with an improved knowledge base are evaluated.
A. INFERENCES FROM RESULTS
The objective of this section is to explain how image analysts cognitively process
the different image formats using visual information processing. This is accomplished by
developing a processing model that is based on the literature review and the results of the
study. The model is then extended to include planners. From the model, a possible
explanation for why false color formats are so disturbing to planners and analysts is
provided.
88
1. Explaining Image Interpretation Using Visual Information Processing
The model that is developed in this section takes the form of a sequence of events
that the analyst attempts to complete in order to fulfill a subtask. Distinct variations in
other formats such as radar and MSI are accounted for after establishing the initial model,
because the initial model is developed exclusively for the panchromatic format. Finally,
methods that the analyst employed for reducing any certainty are reviewed.
a. Processing sequence
To complete a subtask, image interpretation seemed to follow a sequence,
which is shown in Figure 23. The basic sequence for the panchromatic format starts with
attempting to establish perceptual constancy. Then the analyst must find a starting point
in the image and establish a search method, Next, he or she locates, then refines raw
pieces of information. It is probable that the to accomplish a subtask, the analyst must
complete these intermediate steps several times before accomplishing the subtask.
Finally, the analyst combines pieces of information in higher-order processes in order to
fulfill the subtask. The confidence the analyst has in the end product has an associated
certainty level.
Stimulus-based and knowledge-based processing are used by the analyst
in varying capacities while completing this sequence. When the analyst is confident about
the format being exploited and the task to be completed, it appears that the analyst
employs knowledge not found in the stimulus. Therefore, top-down processing has a
heavier emphasis. However, if the analyst was uncertain with the format or the task being
accomplished, he or she could not employ knowledge as effectively. In this case,
stimulus-based processing had greater emphasis.
STARTSUBTASK
LOCATERAWINFO
REFINERAWINFO
HIGHER-ORDER
PROCESSES
STOPSUBTASK
STARTINGPOINT / SEARCH METHOD
ESTABLISH PERCEPTUALCONSTANCY
Figure 23. Flow Chart for Completing Interpretation
(1) Establishing Perceptual Constancy. Given that
perceptual constancy can be considered a form of general knowledge, it is also the
analysts’ first attempt at top-down processing. If the analyst can establish perceptual
constancy, which means that he or she has successfully stabilized the appearance of the
image in the domains of shape, size and color, then it is possible that the analyst can
employ other forms of general knowledge. This reduces the emphasis on stimulus-based
processing. However, if the analyst is unable the effectively establish perceptual
constancy, then he or she must probably rely on more heavily on stimulus-based
processing.
89
90
There are several factors that affect how quickly and confidently
an analyst can establish perceptual constancy for a remotely sensed image. To start, how
well the analyst understands the image format itself is an important part of establishing
perceptual constancy in all three domains (shape, size, and color), because the image
properties (scale, brightness, tone, contrast, and resolution) vary for each format.
Developing perceptual constancy is probably easiest in the panchromatic format because
the analyst is continually establishing perceptual constancy with energy from this
wavelength band as part of everyday experience. While the perspective varies from that
which the analyst comes into contact with outside of work, experience aids the analyst
because the he or she grows more comfortable viewing images with an overhead
perspective and a variety of look angles. This experience aids in establishing size and
shape constancy. In addition, the good spatial resolution found in panchromatic imagery
allows shapes to be portrayed accurately, which appears to make establishing shape
constancy easier. The need to establish color constancy was bypassed in most cases
because the panchromatic images are displayed in gray scale. Consequently, perceptual
constancy might have been easier to establish on these images because there is one less
domain (color) to be stabilized prior to commencing the next step.
(2) Locating a Starting Point / Search Methods. Next, the
analyst determines where in the scene to start searching for raw pieces of information. In
cases where the initial site location was already known, the subject plotted the geographic
coordinates electronically onto the image. When the site was not known, the subject
91
needed additional information to provide that focus. In most cases, a general geographic
reference from other report types such as those from informants or electronic signals
provided a geographical starting point.
With the initial point established, the analyst relies on learned
techniques such as following lines of communication (roads, waterways, power lines,
etc.) to locate pieces of information. Using techniques such as these are an indication
that the analyst is employing knowledge not found in the stimulus to aid in processing.
This results in the analyst reducing the search space without having to search the entire
image. However, the analysts if a technique such as this cannot be employed, the analyst
must emphasize stimulus-based techniques. During the study, analysts expressed
uncertainty in performing wide area searches that have little cuing data.
(3) Locating Raw Pieces of Information. Identification of
raw pieces of information is the first event in which the analyst draws something out of
an image that an observer can also experience. The knowledge that the analyst uses at
this point probably better fits the form of stimulus-based processing method such as
feature theory.
The analyst probably locates the raw pieces of information by
using the elements of recognition: shape, size, tone, texture, pattern shadow, site, and
association (Campbell, 1996). To help the analyst draw the information out of the image,
there would be qualifiers on the elements of recognition. For example, in the subtask
“determine coastal configuration,” the analyst must identify pieces of raw information
92
about the shape of a length of coastline. In this case, the analyst will use three different
qualifiers to locate that particular length of coastline. He or she first finds the breakers by
using specific instances of shape (long, thin lines) and color (white on a dark
background). The specific instance of association (breakers are near the coast) are then
used to determine the shape of the coast.
(4) Refining Raw Information. This step is significant in this
process for two reasons. First, the refinement of raw information requires knowledge not
found in the image for successful completion. As a result, it is better characterized in the
top-down paradigm. In addition, it is also probably the first place where feedback to
earlier steps can occur. For example, an analyst cannot start to search along a line of
communication until that line of communication is properly identified.
To refine raw pieces of information, the analyst performs tasks that
Campbell (1996) describes: classification, enumeration, mensuration, and delineation.
Continuing the “coastal configuration” example, in order to generate a set of coastline
areas suitable for landing, the analyst would measure portions of the “raw” coastline to
determine which areas meet the minimum size criteria for landing a particular sized force.
(5) Higher-Order Processing. The analyst accomplishes the
subtasks in this scenario by combining the refined pieces of information with specialized
knowledge. In the “coastline configuration” example, the set of potential sites is perhaps
rated by evaluating their shape (straight, concave, or convex) with respect to how the
93
enemy can concentrate firepower against the landing force and the known enemy troop
locations. In this instance, the specialized knowledge would be an understanding of how
different coastline shapes and troop disposition impact the placement of anti-landing
defenses.
b. Interpretation Variations Based on Format
With the basic sequence established for the panchromatic format,
variations in the sequence can be examined for the radar, IR, and MSI formats. This
must be done because the basic image properties (scale, brightness, tone, contrast, and
resolution) vary for each format.
(1) Radar. The major difference in the visual information
processing sequence between radar and panchromatic appears to be in the refining raw
pieces of information step. After the analyst selected a piece of raw information to
interpret, he or she talked about how the sensor collected energy, explaining the geometry
necessary to get an adequate return or how that geometry affected the analyst’s ability to
identify key features. For example, one analyst was trying to classify a warship in a
crowded port, but the ships’ rocking motion smeared the return from the target of interest.
The subject identified the ship by first employing knowledge about that country’s naval
order of battle allowed the analyst to reduce the number of possibilities to three or four
ships. Then he or she identified specific features on the ship such as approximate length
and number and position of masts and gun turrets on the ship. These pieces of
94
information were then cross-referenced to a recognition guide to properly identify that
warship. This example highlights the possibility that the analyst’s difficulty in locating
and refining raw pieces of information may be an indication that the analyst has to use
specialized knowledge about the format sooner in the interpretation process. However, in
other cases the analyst was not able to refine the information to the level of granularity
that they could get from a good resolution panchromatic image (e.g., it was a transport
aircraft, but he or she could not tell whether the aircraft was a C-130).
(2) IR. There did not appear to be any significant variations in
interpretation for analysts exploiting IR images. However, the author only observed three
IR scenes, which all appeared very similar to panchromatic images.
(3) MSI. One area where the author specifically tried to
collect data was in the exploitation of MSI false color images. The primary question is
whether the form of such a composite made interpretation difficult. In the two
applications observed it was unclear whether the analyst established color constancy for
the MSI format. The subject specifically stated that he or she was not trying to equate
color to a particular object (e.g., blue water or green vegetation). Rather, the analyst was
trying to identify potential regions (e.g., this purple shaded are is a void of vegetation).
In other words, the raw pieces of information the subject collected were areas of a certain
color. Information refinement in this case was accomplished by integrating overlaying
DTED onto the false color composite and eliminating areas based on slope. The author is
95
reluctant to make further inferences about the visual information processing methods
employed to interpret MSI given the extremely small sample size.
c. Uncertainty
When the subtask is complete, the analyst is has a particular confidence
level with the result of their interpretation. Some of the factors that affect this confidence
level are the basic image properties such as resolution and contrast. When the analyst is
less confident in a given subtask or with a image format, he or she is unable to apply the
specialized knowledge of image interpretation. In this case, it is more probable that he or
she will place a heavier emphasis on the stimulus.
However, the end user still needs the results of the analysts. As a result,
subjects had mechanisms available, such as NIIRS Rating, supervisory check, sensor
revisit, and older images, to increase the level of confidence they had in their judgments.
The analyst informs the end user of their confidence in most first phase exploitation
reports by reporting the images NIIRS rating. The author is viewing the NIIRS rating as
a level of confidence because the analysts should be able to draw more information from
higher NIIRS images. In addition, another trained military analyst always reviewed the
subjects work for errors. This involved the second analyst reviewing the image and the
report produced from the image. Frequent sensor revisit and reports from other
intelligence sources improved the subject’s confidence in making judgment calls,
particularly during radar exploitation. Finally, the subject used other sources such as
older panchromatic images to improve confidence.
96
2. Visual Information Processing Employed in Planning
The visual information processing model is also applicable to planners, although
it requires a slight modification in scope. While the analyst focuses on lower level
products (i.e., answering subtasks), the planner is more focused on combining the results
of subtasks such as coastal shape, enemy defense location, and obstacles to develop a
situational awareness about the battlespace that is the foundation for the mission plan.
After developing their situational awareness, they can employ the knowledge in the areas
of tactics and weapons employment to develop the actual mission plan.
Planners probably have the skills to complete the basic visual processing
sequence for the panchromatic and map formats. Panchromatic and map formats are
singled out as “interpretable” to all planners, because the planner can easily understand
the assessments from panchromatic with minimal explanation. In addition, the planner
has received the necessary training to interpret maps as part of their military education.
Some planners such as Aviators and Targeting Officers may have additional
experience with the IR format, because they use IR sensors such as night vision goggles
(NVG) or forward looking infrared (FLIR) while conducting the mission. However,
based on the author’s experience, the Aviators’ mission is still planned from
panchromatic images and maps. So while the Aviator is flying the mission, he or she is
comparing NVG / FLIR data to information previously acquired by the panchromatic and
map formats.
However, other planners may have had even less experience with formats other
than panchromatic and, as a result, be less likely to believe an analyst’s assessment.
97
Wollenbecker (1999) commented that gray scale IR negatives were given a commander
at one point in his career instead of the actual IR image, because the format looked more
like a “photograph.” The persons’ ability to process the image format, which is not
panchromatic, is negatively impacted because he or she is expecting a photograph.
a. Why False-Color is Confusing
To illustrate why false-color are confusing, the first phase terrain
categorization map of the KERNEL BLITZ 1997 data set in Figure 24 is used (SITAC,
1997). It confuses the analyst or planner because colors and textures used to represent
objects might be associated in long-term memory with other objects. In the original
image, there is a legend that describes the terrain categorization. However, the legend
alone is insufficient because it does not reduce the internal confusion created by the color
schemes in the image.
One example of this confusion is the region with the appearance of molten
lava that represents ocean. If the author were trying to locate targets of interest such as
waterborne obstacles, he would obviously look in the water region. However, when the
author looks at the ocean in this scene, he perceives molten lava.
The internal confusion between whether he is looking at molten lava or
ocean starts continues throughout the processing sequence. Initial attempts at top-down
processing probably fail because the image violates color constancy (e.g., the water looks
like molten lava and the land looks like water). While the author is able to locate the
coastline, developing an effective search pattern for the water is difficult because there
are many textures in this portion of the scene. Consequently, the author has difficulty
locating raw (or refining) pieces of information because the scene does not permit him to
employ his knowledge about how to identify waterborne obstacles (i.e., looking for
breaks in smooth water or in wave patterns). Therefore, the author would report to the
planner that he could not locate any obstacles in the water and that he is very uncertain of
his result.
Figure 24. Terrain Categorization of KERNEL BLITZ 1997 Data (SITAC, 1997)
Therefore, based on the work of this thesis, a person’s (analyst or planner)
lack of training in false-color formats such as MSI and HSI prevent the effective
establishment of color constancy. Without color constancy in these formats, people
cannot completely establish perceptual constancy. In addition, they also have a more
difficult time employing knowledge that they would otherwise use in image exploitation.
98
99
Consequently, they cannot complete the rest of the visual processing sequence efficiently,
because perceptual constancy is the first step in the sequence. If the planner perceives
that stimulus-based processing takes too long, he or she might find a more trusted format,
even if the information is less accurate.
B. HSI EXPLOITATION
With a possible reason for why false color products such as HSI are confusing to
planners established, it is possible to create a way to present these products to planners
that minimizes problems with color constancy and subsequently to develop a
methodology for exploiting HSI. This can be accomplished by the following: literal
interpretation, non-literal interpretation, and presentation to the planner.
1. Literal Interpretation of HSI
Panchromatic images are the preferred image format by planners and analysts.
They can be created from the HSI data cube by generating true color composites from the
HSI data cube, then converting the resulting image to black and white. Figure 15
illustrates another method of producing a panchromatic-like image, which is the first
principal component image of Morro Bay. Then the analyst exploits (or planner uses)
these images using the same visual information processing sequence already employed
on other panchromatic images. The raw or refined pieces of information derived from
the data cube will build the context necessary to perform spectral interpretation on the
100
image. Therefore, HSI can provide both the analyst and the planner a baseline of
information and products that they are most comfortable exploiting and using.
2. Non-literal Processing of HSI
With literal processing completed, the analyst can begin spectral interpretation.
This involves applying a series of algorithms or transformations to the data cube and
visually interpreting the results. Prior literal processing established the context for the
scene. This allows the analyst to use the data set in such a way that they are refining
pieces of raw information using non-literal means, vice of drawing out raw pieces of
information for the first time. This process was illustrated above for a littoral scene in
Figures 17-22. To further illustrate HSI exploitation, a partial review of the Collins
(1996) results from his analysis of the WESTERN RAINBOW data set. PCA and SAM
are the techniques reviewed below. It is also important to highlight that data set Collins
analyzed extended into the thermal IR region.
a. Principal Components Analysis (PCA)
In general, the first PC image is the positive weighted average of all the
bands analyzed. For a thermal sensor, this produces an output that appears similar to that
produced by a forward-looking infrared (FLIR) sensor. One is shown in Figure 25.a
(Collins, 1996). Planners such as Aviators and Targeting Officers who have previously
worked with FLIR data should have the knowledge necessary to interpret the image.
These people should be able to identify the man-made objects as well as potential
101
concealment areas in Figure 25.a even if the spatial resolution prohibits further
refinement.
b. Spectral Angle Mapping (SAM)
A typical classification approach, illustrated in Figure 20, is the SAM
technique. Application of this process to the thermal data produced the image shown in
Figure 25.b. The information level of information in Figure 25.b is different from the
simulated FLIR image in Figure 25.a. For example, spatial resolution and contrast in
Figure 25.a are insufficient to classify the “X” shaped array in the lower half of the image
as anything other than vehicles. However, the SAM classification tells the analyst or
planner that the ‘X’ shaped array is a group of T-80 tanks.
One problem with the target map is that if too narrow of an angle value is
chosen or too few spectra are used for comparison, much of the scene can remain
unclassified. This results in much of the context in the original image being lost as a by-
product of the analysis, ultimately making the SAM image more difficult to visually
process. Luckily, context can be regained in this image by overlaying the target map
onto a panchromatic image, as show in Figure 25.c. The image was produced in
Microsoft Image Composer 1.5 after scanning Collins’ base images into .GIF format.
Overlaying is a standard feature in hyperspectral manipulation software such as
Hypercube (Pazak, 1999). More importantly, the image in Figure 25.c provides better
information than either Figures 25.a or 25.b do independently. In Figure 25.c the five
blue boxes in a star pattern are an array of T-80 tanks, which are also not camouflaged or
102
concealed in the terrain, making them easier to identify. Based on the author’s
experience, it is speculated that planners might feel the same way.
3. Presentation to the Planner
An HSI-derived intelligence package that is delivered to the planner should
include panchromatic images, post-algorithm images, and written descriptions.
Panchromatic images allow the planner develop the baseline for the area. Post-algorithm
images are used to supplement the information already derived from the panchromatic
image. As the planner is unfamiliar with the color schemes used in hyperspectral
formats, one-paragraph narratives of what the colors describe should be accompany each
of the post algorithm images. The narratives allow the planner to effectively combine the
general knowledge of the area that the panchromatic image provides with the specialized
knowledge from false color HSI products in the planning process without extensive
training in HSI.
C. MATCHING HSI CERTAINTY WITH ANALYST UNCERTAINTY
If analysts and planners have established methods to perform subtasks and they
are confident in the results, then they are unlikely to accept or develop a different
procedure using a different format to get the same result. However, they might be more
willing to accept methods to gain intelligence in areas where they are currently uncertain.
Mine detection, bathymetry, and target detection are three areas where spectral analysis
shows promise.
103
a. Simulated FLIR b. SAM results c. SAM overlaid onto
Simulated FLIR
Figure 25. Hyperspectral Results from WESTERN RAINBOW (from Collins, 1996)
1. Mine Detection
Delgrand (1993) successfully detected land mines buried up to 15 cm deep in a
variety of environments using thermal IR data collected in the 5.0 and 10.0 μm region of
the EM spectrum. Selected results are shown in Figure 26. The circles in each image
mark the land mine locations in image c. The additional processing shown in images b
and c highlight the differences in soil temperature to the point where the analyst is
confident in declaring the circled spots in image c landmines. The same technique could
be done with spectral thermal imagery such as SEBASS. There are some suggestions that
visible imagery can detect recently disturbed earth as well (Bergman, 1996; Collins,
1996).
a. unprocessed scene b. warm soil c. tagged mines
Figure 26. Buried Land Mine Detection Using Dual Band IR (From Delgrand, 1993)
2. Bathymetry
Stuffle (1996) produced bathymetric images out to the 10-meter curve of Secret
Harbor, Lake Tahoe, using HYDICE data. Stuffle accomplished this by first producing
the “mask” of the water’s edge and the bottom materials in the harbor using PCA and
104
105
band selection shown in Figure 27.a. Blue indicates sand, yellow indicates bright rock,
red indicates dark rock, and black indicates land above water. Then using these known
spectra, as well as approximated atmospheric effect and water characteristics, he
generated the bottom contour map shown in Figure 27.b using the Bierwirth (1993)
Algorithm. These images can provide the planner a significant amount of intelligence
when compared to that on a chart of the same area shown in Figure 27.c. The planner
now knows what the bottom is made of, the depth of the water in the pertinent areas, and
the gradient of the seabed. This intelligence is used to determine where the most
desirable points to land are, as well as what areas can damage landing craft. An analyst
could not provide any of the intelligence to this level of detail by inspecting any existing
format.
3. Target Detection and Identification
Bergman (1996) and Fay (1995) have analyzed HSI data sets in order to
determine how effectively military targets could be detected and classified. Bergman
(1996) showed it was possible to detect and discriminate between real and decoy vehicles
in a natural grass environment, based on the analysis of HSI data from Operation
FOREST RADIANCE I. Fay (1995) showed the feasibility in detecting tactical targets in
the desert environment based on his analysis of HSI data from Operation DESERT
RADIANCE I. The significance in their work is that they show that a properly trained
analyst has another method besides ground resolution to detect and classify targets.
a. Bottom Surface Materials Mask b. Bottom Contour Map
c. Chart of the Same Area
Figure 27. Bathymetry of Secret Harbor, Lake Tahoe (From Stuffle, 1996; NOAA, 1987)
This section started by discussing how image analysts should approach HSI
exploitation in order to effectively process the data cube. Then some of the information
that can be derived from a HSI data cube was presented. This progression now permits
the exploration of how HSI can impact amphibious planning.
D. AMPHIBIOUS PLANNING
In warfare, the attacker chooses the point of attack to which the defender must
react. Better mission plans take advantage of attackers’ capabilities while placing the
106
107
defender at the greater disadvantage. Assuming that better quality information at the
proper place and time produce a better mission plan, the question the rest of this chapter
addresses is, “How does HSI influence the planning process such that the attackers’
strengths are optimized while placing the defender at the greatest disadvantage?”
In the largest quantitative sense, this better information allows the attacker to
chose the best landing site or point of attack. Better characterization of the battlespace
can mean that the attacker is less likely to attack into the heart of the enemy’s defense,
unless the objective and time constraints demand it. By moving the point of attack away
from the defender’s strength, the attacker forces the defender to generate combat power at
the point of attack in the same manner as the attacker. However, the defenders force
must move over land, using a slower rate of advance than the attacker (Gatchel, 1996).
Better characterization of the battlespace has other benefits. First, the planner can
accurately estimate what force size is needed to accomplish the mission. In addition, if
the analyst is able to detect defenses in a possible landing area that did not previously
exist, the planning staff can deal with those contingencies before the execution phase of
the operation. For example, if land or seaborne mines are detected near the operation
using HSI, the planning staff can plan to sweep, detonate, or maneuver around the
minefield. All these options place the defender at a greater disadvantage, because they
must now compensate for the failure of these defenses during combat.
Another option the attacker has regards the precision of his attack. If the analyst
can more accurately characterize the area of operations by discriminating between decoy
and real sites, the attacker’s force can be more efficiently employed because decoy sites
108
are ignored. Similarly, should the analyst be able to discriminate between targets such T-
72 and T-80 tanks as Collins (1996) did, this allows the attacker to apply the proper
amount of force to achieve a desired effect without wasting valuable munitions. Once
again, the defender is placed at a disadvantage, because the attacker has not over-
committed his strength to any particular target.
109
VIII. CONCLUSION / RECOMMENDATIONS
In conclusion, this thesis argues that specialized knowledge in remote sensing and
intelligence allows the analyst to establish perceptual constancy and develop the context
required to apply knowledge not found in the stimuli to visual information processing.
Furthermore, if the analyst is provided specialized knowledge about hyperspectral, he or
she can produce additional intelligence that would otherwise that be unattainable, which
results in the planner having better knowledge about the operating area from which to
produce a mission plan from.
Images derived from hyperspectral sensors are imagery intelligence. This format
should be integrated as an operational capability as soon as possible. Hyperspectral
sensors could be deployed with tactical forces in a manner similar to the F-14 Tactical
Aviation Reconnaissance Pod System (TARPS). However, until image analysts are
properly trained and can explain the results of their work to a mission planner, HSI will
not gain widespread acceptance because of the complicated nature of the displayed
results. In addition, further work in the areas of intelligence architecture and systems
must be addressed to maximize the benefits of spectral imagery exploitation. HSI is
another format that the analyst should have at his disposal to ensure the battlespace is
properly described, so that the planner can create the mission that best meets the
prescribed objectives.
110
THIS PAGE LEFT INTENTIONALLY BLANK
APPENDIX A: COLOR FIGURES
Figure 2. 1:50,000 Topographical Map of Kontum, Vietnam (NIMA, 1995)
111
Figure 8. Images with Identical GSD and Varying Image Quality (IRARS, 1995)
112
a. True Color Bands 1, 2, 3 (BGR) b. NIR False Color TM Bands 2, 3, 4 (BGR)
c. False Color TM Bands 5, 7, 6 (BGR) d. False Color TM Bands 4, 7, 1 (BGR) Figure 14. True and False Color Composite Images of Morro Bay, CA (Short, 1999)
113
PC 1 PC 2 PC 3
PC 4 PC 5 PC 6
PC 7 PC Color Composite-
images 1, 2, 3 (RGB) Figure 15. PC Component Images of Morro Bay, CA (Short, 1999)
114
Figure 16. Sample Hyperspectral Data Cube (From Short, 1999)
Figure 17. True Color Composite of Eglin AFB (Thanks to Chris Simi, Night Vision Lab)
115
Figure 18. Mean Spectra for Regions of Interest
Figure 19. Regions of Interest for Classification Overlaid on PC 2
116
Figure 20. Target Map of Eglin AFB Produced by SAM
Figure22. SMF Color Composite with Selected SAM Data Overlaid
117
Figure 24. Terrain Categorization of KERNEL BLITZ 1997 Data (SITAC, 1997)
118
119
a. Simulated FLIR b. SAM results c. SAM overlaid onto
Simulated FLIR Figure 25. Hyperspectral Results from WESTERN RAINBOW (from Collins, 1996)
a. unprocessed scene b. warm soil c. tagged mines Figure 26. Buried Land Mine Detection Using Dual Band IR (From Delgrand, 1993)
a. Bottom Surface Materials Mask b. Bottom Contour Map
c. Chart of the Same Area Figure 27. Bathymetry of Secret Harbor, Lake Tahoe (From Stuffle, 1996; NOAA, 1987)
120
121
APPENDIX B: TASK ELEMENT LIST
A. Determine the general topographic description for the area in question
1. Determine coastal configuration
2. Determine egress routes of coastal areas
3. Identify key terrain in the area
4. Obstacle identification
5. Determine the extent that the terrain provides cover and concealment
6. Determine surface characteristics: slope, materials, and drainage
7. Determine mobility corridors
8. Determine avenues of approach: ground and air forces
9. Determine how this terrain description affects supporting arms
B. Determine the general hydrographic characteristics for the area in question
1. Average Sea-State Determination
2. Determine the underwater gradient for the landing site from the waters
edge to the 3-fathom curve
3. Determine the nature of the surf IVO the beach
4. Determine the tidal conditions
5. Determine wind conditions
6. Determine water currents: type, direction and speed
7. Determine existence and location of underwater obstacles
C. Determine the general climatic characteristics for the area in question
D. Determine the nature and extent of transportation facilities in the area
1. Determine characteristics of road network
2. Determine characteristics of the existing rail network:
3. Determine characteristics of inland waterways
4. Determine the availability and condition of existing civil / military
telecommunications network
E. Determine enemy military situation
1. Static Orders of Battle
2. Mobile Orders of Battle
122
THIS PAGE LEFT INTENTIONALLY BLANK
123
LIST OF REFERENCES
Aerospace Corporation, Hyperspectral Imaging from Space: Principles, Status and
Utility Forecast, (Report Publication Number PWW-1400R-176-98), El Segundo, CA:
Author, 1998.
Bierwirth, P., Lee, T., Burne, R. “Shallow Sea Floor Reflectance and Water Depth
Derived by Unmixing Multispectral Imagery.” Photogrammetric Engineering and
Remote Sensing. Vol. 59, # 3, pp. 331-338, March 1993.
Bergman, S.M., The Utility of Hyperspectral Data to Detect and Discriminate Actual and
Target Decoy Vehicles, Master’s Thesis, Naval Postgraduate School, Monterey, CA,
December, 1996.
Campbell, J.B., Introduction to Remote Sensing (2nd ed.), New York: Guilford Press,
1996.
Chase, Handbook of Perception and Human Performance, Chapter 28: Visual
Information Processing, New York: John Wiley and Sons, 1986.
1. Defense Technical Information Center ....................................................................2 8725 John J. Kingman Rd. STE 0944 Ft. Belvoir, Virginia 22060-6218 2. Dudley Knox Library...............................................................................................2 Naval Postgraduate School 411 Dyer Road Monterey, California 93943-5101 3. Director, Training and Education ............................................................................1 MCCDC, Code C46 1019 Elliot Road Quantico, Virginia 22134-5107 4. Director, Marine Corps Research Center ................................................................1 MCCDC, Code C40RC 2040 Broadway Street Quantico, Virginia 22134-5107 5. Marine Corps Tactical Technical Systems Support Activity...................................1 Technical Advisory Branch Attn: Major J.C. Cummiskey Box 555171 Camp Pendleton, California 92055-5080 6. Professor William K. Krebs (Code OR/Kw) ...........................................................1 Naval Postgraduate School Monterey, California 93940 7. Professor Richard C. Olsen (Code PH/Os) ..............................................................1 Naval Postgraduate School Monterey, California 93940 8. OIC ONI Detachment .............................................................................................1 US Naval War College 686 Cushing Road Newport, Rhode Island 02840
130
9. Naval and Marine Corps Intelligence Training Center............................................1 Attn: LT Slentz 2088 Regulus Avenue Virginia Beach, Virginia 23461-2099 10. Mr. Mike Jelinek......................................................................................................1 Navy TENCAP Naval Space Command/ N311 5280 Fourth Street Dalgren, Virginia 22448-5300 11. LT Keith W. Maly, USN..........................................................................................1 c/o Mr. Donald Wesgate 160 Schnackel Drive Rochester, New York 14622