EFFECT OWNERSHIP STRUCTURE ON INTELLECTUAL CAPITAL DISCLOSURE IN ISLAMIC BANKING: EVIDENCE IN ASIA Thesis Submitted as a partial fulfilment for the economics bachelor degree in accounting department, economics faculty, Sebelas Maret UniversityPrepared by: Tri Damayanti F 0305021 ECONOMICS FACULTY SEBELAS MARET UNIVERSITY SURAKARTA 2009
Transcript
EFFECT OWNERSHIP STRUCTURE ON INTELLECTUAL CAPITAL DISCLOSURE
IN ISLAMIC BANKING: EVIDENCE IN ASIA
Thesis
Submitted as a partial fulfilment for the economics bachelor degree in accounting department,
economics faculty, Sebelas Maret University
Prepared by:
Tri Damayanti
F 0305021
ECONOMICS FACULTY
SEBELAS MARET UNIVERSITY
SURAKARTA
2009
ENDORSEMENT
Has been approved and accepted by both the thesis examiners as a partial fulfilment for the
economics bachelor degree in accounting department, Faculty of Economics, Sebelas Maret University.
Surakarta, August … ,2009
Boards of Examiners
1. Dra. Y Anni Aryani, M Prof Acc., PhD., Ak
NIP. 19650918199203 2 002
(……………………..)
Chairperson
2. Dra. Falikhatun, M.Si, Ak.
NIP. 19691117199403 2 002
(……………………...)
Supevisor
3. Dra. Evi Gantyowati, M.Si, Ak
NIP. 19651001199412 2 001
(……………………...)
Member
SUPERVISORY APPROVAL
Previously approved to be examined by the boards of examiner the thesis with the title:
EFFECT OWNERSHIP STRUCTURE ON INTELLECTUAL CAPITAL DISCLOSURE
IN ISLAMIC BANKING:
EVIDENCE IN ASIA
Surakarta, June 2009
Approved and accepted by supervisor,
Dra. Falikhatun, M.Si, Ak.NIP. 196911171994032002
MOTTO
Which then, of the favours of your Lord,
will you deny?
(Ar Rahman: 25)
Give thanks to Alloh
Give thanks to Alloh,
for the moon and the stars
prays in all day full,
what is and what was
take hold of your iman
don’t giving to shaitan
you who believe please give thanks to Alloh.
Allahu Ghafur Allahu Rahim Allahu yuhibul al Mohsinin,
huwa Khalikhun huwa Razikhun wahuha ala kulli shaiin khadir
Allah is Ghafur Alloh is Rahim Alloh is the one who loves the Muhsinin,
He is a creater, He is a sistainer and he is the one who has power over all.
Table IV.6 Amount of Two Format Intellectual Capital Disclosure ............... 46
Table IV.7 Intellectual Capital by category by Two Formats .......................... 47
Table IV.8 Normality Test (KolmogorovSmirnov Results) ........................... 49
Table IV.9 MulticollenearityTest Result ......................................................... 51
Table IV.10 Multicollenearity Test by Variables .............................................. 52
Table IV.11 Result of Autocorrelation Test ...................................................... 53
Table IV.12 Run Test Result ............................................................................. 54
Table IV.13 Result of Multiple Regression by ICDI as Dependent Variable.... 58
Table IV.14 Result of Multiple Regression by
ICWC as Dependent Variable ..................................................... 60
Table IV.15 Comparison Sign both Prediction and Actual .............................. 62
CHAPTER I
INTRODUCTION
A. Background
Service industry is an industry which can obtain income by doing service activities as its industry’s
output. Service activities in the service industry represent its ‘knowledge’ (Widyaningrum, 2004). In
other words, the ‘knowledge’ makes the major incomes in service industries. Therefore, ‘knowledge’ is
critical asset for the service industry that must be reported to both shareholders and its stakeholders.
However, the ‘knowledge’ which is an important component of the industries can not be found in the
reporting of company assets in the financial reports in the traditional accounting.
On the other hands, ‘knowledge’ in the industry is an important asset. However, inability to report
all financial assets owned by companies in the concept and practice happened in traditional accounting.
There were failures of companies in reporting knowledge as company’s assets. It caused that knowledge
was part of intangible assets which was not of traditional accounting’s focus.
Since in the 1990's, attention to the intangible assets management practice has increased
dramatically (Harrison and Sullivan, 2000). Petty and Guthrie (2000) and Sullivan and Sullivan (2000)
mentioned that one of approaches that can be used in the assessment and measurement of intangible
assets is intellectual capital. The main focus of intangible assets was the intellectual capital
management, information technology, sociology, and accounting [(Petty and Guthrie, 2000) and
(Sullivan and Sullivan, 2000)].
Knowledge, innovation, and skills which were owned by companies were the components of the
intellectual capital (Li, et al, 2008). Petty and Guthrie (2000), Wallman (1996) and Stewart (1997)
concluded that knowledge and intellectual capital could caused greater significance and become an
essential commodity on the value of business size compared to the company’s financial size.
Cerbioni and Parbonetti (2007) stated that intellectual capital disclosure was part of the voluntary
disclosure. Intellectual capital was available valuable information for investors. It could help them to
reduce uncertainty about future prospects and to facilitate the assessment of company’s accuracy
(Bukh, 2003). Intellectual capital disclosure also may indicate better financial performance (Saleh, et.
al., 2008).
The Influence intellectual capital in creating and sustaining competitive advantage and
shareholder value increased significantly (Tayles, et. al, 2007). Financial reports failed describing the
extent of value creation on intangible assets (Lev and Zarowin, 1999). It was also showed that
asymmetry information increased both companies and the user (Barth, Kasznik, and Mc Nichols,
2001), and created inefficiency in the resources allocation in capital market (Li, et. al, 2008).
The world economics developments were shown by increasing of companies in which worked by
using technology. Technology used by the company as quality improvement indicated a company’s
value added (Saleh, et. al, 2008). Some researchers had found that there was a large gap both market
value and book value disclosed by the companies. It was caused of company failed on reporting hidden
value in annual report (Brenan and Cornell, 2000, and Mouritsen et. al, 2004). Hidden value
represented as intellectual capital.
Saleh et. al (2008) stated that intellectual capital became an important source on companies in
achieved economic success. In addition, intellectual capital was important role in company's value
creation. It was caused that intellectual capital also one of the competitive benefits in the market. It was
also showed the better of financial performance. Intellectual capital was consists of human capital,
capital structure (internal structure), and relational capital (external structure). Human capital
represented as innovation, flexibility, tolerance, motivation, satisfaction, learning capacity, loyalty, and
training and formal education was owned by employees (CIMA, 2001). Internal Structure of the
organization could be defined as knowledge of organization, such as intellectual properties, contracts,
database, information, systems, culture, procedures, manuals, systems and routines administrative, and
best practices (CIMA, 2001).
One of the industries which used knowledge in getting business income is the financial institution.
Bozolan et. al (2003) stated that financial institutions require a different reporting with other business
sectors. Therefore, Brenan (2001) stated that financial institutions have lower proportion of intangible
assets and have less motivation to report on the voluntary intellectual capital in annual reports. One of
the financial institutions is bank.
Firer and Willliam (2003) stated that the bank was one of the most intensive intellectual capital’s
industries. In addition, the overall bank has employee homogenity than the other economic sectors
(Kubo and Saka, 2002). Banks are the institutions that play on funds flow in economics role as the
intermediation function. The bank problems arise may cause by problems on customers, investors, or
other parties to do bank services. The following sentence is an example of intellectual capital disclosure
in Islamic bank.
“To make systematic improvements in all areas of operational performance through the development and implementation of quality systems and processes which offer value for the customer” (Qatar Islamic Bank Annual Report, 2006, page 21).
These sentences above show that Qatar Islamic Bank as Islamic financial institution had disclosed
information about (1) systems (internal or structural intellectual capital represented by phrase “To make
systematic improvements in all areas of operational performance through the development and
implementation of quality systems and processes” and (2) customer (relational or external capital
represented by phrase “value for the customer”.
The emergence of Islamic banks was showed by establishment Ghamr Mit Bank in 1976. In this
modern era, Islamic banking had become global phenomenon, including in minority Moslem society
countries. Based on Mc Kinsey’s research (2005) reported by Agustianto (2009), stated that total assets
of global Islamic banking market reached 0.75 billion U.S. dollars in 2006. In 2010, it was estimated
would reach one billion U.S. dollars. Growth rate of 100 Islamic bank in the world reached 27 percent
annually. It was higher than growth rate of 100 largest conventional banks, which only reached 19
percent per year (Agustianto, 2009).
Latest research done by the Asian Banker Group (2008) mentioned that there were 100 Islamic
banks in the world. Asian Banker Group (2008) stated that Asia was profitable market area for Islamic
banking. Based on the results of Merrill Lynch and Cap Gemini’s research (2008) which stated that the
total wealth in the AsiaPacific region grew 8.5 percents after the Middle East countries created a big
advantage in Islamic bank (Beng, 2008).
Jensen and Meckling (1976) argued that the greater disclosure will reduce investor uncertainty
gain and reducing cost of capital the company. Gibbins et.al (1990) mentioned that the voluntary
disclosure process provides increased response of the disclosure both internal and external.
Accountability in Islam was reflected in the commitment to provide services needed by the Muslims
and the community through the disclosure (Haniffa and Hudaib, 2004). Unlike conventional banks,
which only focused on profit, Islamic banks were expected on perform the necessary disclosures to help
users create reports in a decision in the knowledge based economy. According to Siddiqi (1995) which
stated that Islamic financial institution include Islamic bank must comply with the percepts of Shari’ah
Islami’ah in their all activities including reporting. Moreover, disclosure reflects implementation the
role of Islam in economic regeneration and social justice. Haniffa and Hudaib (2004) also argued that
Islamic financial institutions need to disclose information. It was caused by importance to support
religious decision by providing accountability to Alloh SWT and society (Hablum minnalloh and
Hamblum minnnas concept).
Harahap and Gunawan (2006) studied the voluntary disclosure practice in Islamic bank in
Indonesia, Malaysia, and Australia. Results of their research showed that in general, Islamic bank in
these countries were dominated by voluntary disclosures include intellectual capital disclosure. Li, et. al
(2008) studied the relationship of corporate governance on intellectual capital disclosure in the different
types of companies in the United Kingdom. Their samples were non financial and financial institution’s
annual reports. By using the content analysis method, Li, et. al (2008) were chosen intellectual capital
as major topic in their research. Differences of this research to Li, et. al (2008) research was both the
corporate governance’s proxy and research samples taken. The title of this research is "Effect
Ownership Structure on Intellectual Capital Disclosure in Islamic Bank: Evidence in Asia". This
research examined the influence of ownership structure on intellectual capital disclosure in Islamic
banking in Asia.
B. Problem Formulation
Based on the background developed before, problem formulation can be formulated as: Is there
effect ownership structure on intellectual capital disclosure in Islamic bank in Asia?
C. Research Objectives
Objective will achieve in this research is to find the effect of ownership structure on the
intellectual capital disclosure Islamic bank in Asia.
D. Benefit of Research
The benefits that can be drawn from this research are as follows:
D.1 Academicians
For academicians, this research useful as:
a. reference and contribution on intellectual capital disclosure research in Islamic banking,
b. the future research to develop this research topics, from the findings, limitations, and
recommendations
D.2 Islamic Banking Industry
For Islamic banking industry, this research useful for providing knowledge about the practice of intellectual capital
disclosure. It also can be used by Islamic banking management in consideration about intellectual capital disclosure
practice and policy.
D.3 Regulator and Government
For regulators that includes the central bank, the minister for finance, securities exchange, and accountants in each
country’s sample, this research can be use to:
D. sets of policies or regulations and disclosure standards for intellectual capital disclosure practices to both
Islamic banks and others Islamic financial sectors.
E. Writing Systematic
The writing systematically as follows:
CHAPTER I : Introduction
This chapter includes the background, the
problem formulation, research objectives,
research benefits and writing systematicCHAPTER II : Theory Development
This chapter discusses the theoretical framework
and hypothesis development.CHAPTER III : Research Methodology
This chapter contains the research design,
sampling techniques; variables measurement;
research instruments; data source; data
collection methods; and data analysis methods.CHAPTER IV : Data Analysis and Discussion
This chapter discusses the data used, data
processing models and results of data analysis.CHAPTER V : Conclusion
This chapter contains conclusions, research
limitations, and suggestions were submitted for
further research.
CHAPTER II
THEORY DEVELOPMENT
L. Intellectual Capital Disclosure (ICD)
As CIMA (2001) mentioned that intellectual capital was possession of knowledge and experience,
professional knowledge and skill, good relationship, and technological capacities, which when applied
will give organization competitive advantage. Haniffa and Hudaib (2004) formulated that those
definition means:
m. Resources of intellectual in organization, such as technology, idea, innovations and skill.
n. Ability of intellectual capital to make competitive advantage. Edvisson and Sullivan (1996) also
argue that intellectual capital is knowledge that can be converted into value. Moreover, Andriesen
and Stam (2005) argue that intellectual capital reflects intangible resources. They were available
to an organization and gave relative advantage and produced future benefit.
Stewart (1991), Edvisson and Sullivan (1996), Edvisson and Malone (1997), Bontis (1998), Sveiby
(1997) and Li, et. al (2008) were classifying intellectual capital into three form as human capital (HIC),
structural capital (SIC), and relational capital (RIC).
Information on intellectual capital was important for stakeholders (Li et al, 2008). In the agency
context, Jensen and Meckling (1976) showed that greater disclosure could reduce uncertainty on
investors and reduced cost of capital the company. Therefore, managers should be willing to reveal the
information to the intellectual capital in order to increase the company’s value, providing investors with
the presumption both company's financial position and reduce the highest share volatility (Li, et al,
2008).
Barth, et. al (2001) found that the scope of the advertising analysis was greater for companies
which invest in research and development. While other empirical studies found there were the positive
impact on emergence on stock prices over a specific indicator of intellectual capital. They were in
research and development’s expenditure (Amir and Lev, 1996), the capitalization in software
development (Aboody and Lev, 1998), and customer satisfaction (Ittner and Larker, 1998).
Abeysekera (2006) stated that the development theoretical framework in intellectual capital in the
infancy period. Definition of intellectual capital made by expert was not the same, but the conclusion
can be drawn that intellectual capital is part of intangible assets. Mouritsen (1998) stated that
intellectual capital was the broad knowledge of the organization capacity. A broad knowledge of the
organization was beneficial for the organization changes in the business world. The simplest example
was requirement on innovated to produce their products which were declined in their prior position.
Further, there was a notable diversity intellectual capital was defined in. Guthrie and Petty (2000)
were alluded the fact that intellectual capital disclosure carried greater importance now than in the past
due to the dominant industry sectors shifting from manufacturing to high technology, financial and
insurance services. There was general opinion of many experts and organizations can be concluded
that the intellectual capital consists on the outline below. The general definition was developed by
Sveiby (1997) were consists of:
a. Human capital
Human Capital was the knowledge owned by employees such innovation, flexibility, tolerance,
motivation, satisfaction, learning capacity, loyalty, education and training as well as formal employees.
Dharma (2004) argued that human capital was capability accumulation, capacity and opportunities of
the members in the organization.
Human capital was the lifeblood in the intellectual capital, the source of innovation and
improvement, although it was a component which was difficult to measure (Steward, 1997). FitzEnz
(2000) in Ongkoharjo, et. al (2008) described human capital as a combination of three factors, such as:
1) the nature or character was brought to the work, for example intellectual, energy, positive attitude,
reliability, and commitment, 2) a person's ability to learn, the intellect, imagination, creativity and
talent, and 3) the motivation to share information and knowledge, the team spirit and goal orientation.
b. Structural capital
Structural capital was the company's assets such ownership system software, network distribution, and
supply chain companies. Petrash (1996) stated that structural capital included ability of the company in
reaching the market. Widyaningrum (2004) said that structural capital was availability of operational
property supporting the performance of employees.
c. Relational Capital or Customer Capital
Relational capital or customer capital was a good relationship woven by the company with external
parties (Petrash, 1996), and also knowledge about the market chain flow such as products, customers,
supplier, and establish good relations with the government (Bontis, 2000).
O. Ownership Structure
Jensen and Meckling (1976) stated that there was relationship of agency contract between one party
interest and another party. Agency cost increased if ownership structure became more diffuse (Fama
and Jensen, 1983). It caused the firms were subject of interest conflict more than concentrated
ownership structure companies. Firms with higher ownership diffusion had more incentives to disclose
information voluntary and reduce agency cost (Fama and Jensen, 1983).
P. Firm’s Size
Firm’s Size was potential variable in the disclosure topics. Singhvi and Desai (1971), Cooke (1992),
Wallace et al. (1994), Craig and Diga (1998) found the relationship between the firm's size and the level
of disclosure. In some research, found positive relationship between company size and the vastness.
Freedman and Jaggi (2005) found that the larger companies whose more activity, it will be more effect
on stakeholders. So, it is predicted that there is positive influence between firm’s size and intellectual
capital disclosure.
Q. Profitability
In the presence of disclosure cost, firms whose performance exceeds the threshold will disclose. While,
the below threshold firm will not (Verrecchia, 1983). Baginski et. al (2000) found that causal in
which attribution of voluntary disclosure was earning management. Moreover, Baginski et. al (2000)
argued that voluntary information disclosed more for external user while forecast news was bad. It can
be used to expand financial reporting models. On other words, can be stated that according to Baginski
(2000) there was more voluntary disclosure while firm’s both profitability and forecast news was not
better.
Shingvi and Desai (1997) found positive relationship between profitability and disclosure.
Companies which had higher profitability was better disclose than company with lower profitability
((Ullmann, 1985; Haniffa and Cooke, 2005). For this control variable, researcher predicted that
profitability has positive association on the intellectual capital disclosure.
R.Company Age
OwusuAnsah (1998), Akhtaruddin (2005) stated that the vastness of companies phase affected by
age includes the development and growth. Hossain (2008) researched sweep disclosures by bank and
concluded that there was negative relationship between company’s ages to the broad disclosure. So, it
is predicted there is negative association between company age and intellectual capital disclosure.
S. Leverage
Jensen and Meckling (1976), Smith and Warner (1979) in Karpik and Belkaoui (1989) stated that
there was agreement in the level of debt leverage intended limiting management's ability to create a
wealth transfer between shareholders and bond holders. Mangena and Pike (2005) stated that leverage
affect the levels of agency problem because of the disclosure in line to the increasing in level of debt.
Tan and Tower (1999) in Mangena and Pike (2005) reported that there was negative association
between leverage and levels of disclosure by using Finnish, Singapore and Australia companies.
According to these researches, it can be predicted that there is negative influence between leverage
and intellectual capital disclosure.
T. Auditor Type
Large and wellknown auditing firms may incite companies to disclose more information (Singhvi
and Desai, 1971, Firth, 1979). The assertion of large auditing firms promote high levels of disclosure
was supported by several arguments. Dumotier (1998), Raffournier (1998), Chalmers and Godfrey
(2004) argued that the firms in which used large auditing firm was preserved their reputation. It
caused large auditing firms have greater expertise (Mora and Rees,1998). Malone, et. al (1993) found
that the smaller auditing firm were often sensitive to the economics consequences of the loss client.
According to these researches, researcher can predict that intellectual capital disclosure negative
significant influenced firm audit.
U. Role of Duality
Decisionmaking power resulting from concentration role of duality could impair the board’s
oversight and governance roles, including disclosure policies. Separation of the two roles provides the
essential checks and balances on management behavior (Blackburn, 1994). Haniffa and Cooke (2002)
found that there was ineffective monitoring of managerial opportunistic while CEO entrancement.
According to these researches, it can be predicted that there is negative influence between role of
duality and intellectual capital disclosure.
V. Hypothesis Formulation
Eng and Mak (2003) argued that ownership structure therefore will influence the level of monitoring
and voluntary disclosure. Although, some evidence happened in Raffournier (1995) and Depoers
(2000) had rejected those hypothesis. It means that their research found there were firms with higher
ownership structure had no disclose more information voluntary. According to these researches, it can
develop the hypothesis :
1H : There is association between ownership diffusion in the firms and levels of intellectual
capital disclosure.
Bias may occur as a result of other factors. Although, it can avoided by using the control variables
as validity of measurement (Bryman and Bell, 2007). To avoid bias that occurred in these studies,
researcher uses control variables such as firm's size, company age, the company's leverage,
profitability, type of independent auditor, and role of duality.
According to the theory, both independent and control variables can be summarized predicted
relationship below.
Table II. 1
Predicted Sign of Relationship Each Independent and Control Variables
Variables Symbol Predicted SignOwnership Diffusion OD Negative
Firm’s size TA Positive
Profitability ROA Positive
Company age AGE Negative
Leverage LEV Negative
Auditor Type AUDITTYPE Negative
Role of Duality RDUAL Negative
The following formulation is regression model of this research according to the theory development.
ICD Index intellectual capital disclosure (ICDI), the natural
logarithm (Ln) of the number of words is an indicator of
intellectual capital (LnICWC)3 larger proportion of share ownership of the number of
shares outstanding; AGE Company age, established since the date (in years);ROA Return on assets (ROA) (Proxy of profitability)
Natural Logarithm total assets (Proxy of firm’s size); AUDITTYPE Dummy variable, 1 if big 4, 0 if otherwise.RDUAL Dummy variable, 1 if there is role of duality, 0 if there is no
role of dualityparameters;
error term;the iyears observation
W. Theoritical Framework
The following figure shows the theoretical frame work of this research. Dependent variable of this
research is intellectual capital disclosure. Independent variable is ownership structure. The control
variables are firm’s size (total assets), company age, profitability (ROA), leverage, auditor type, and
role of duality.
Independent variable: Ownership diffusion
Control variable:Firm’s sizeProfitabilityCompany AgeLeverageAuditor typeRole of duality
Dependent Variable:Intellectual Capital Disclosure
Figure II.1
Theory Framework
X. Research Comparison
Table II. 1 below shows the summary of previous researches in intellectual capital and voluntary
disclosure topics compared to this research.
Table II. 2
Research Comparison
Researcher Variables Method Analysis Samples
Li, et. al (2008) Dependent : Intellectual capital disclosureIndependent: Independent non executive directors, ownership structure, internal auditing mechanism, and role of dualityControl: Listing Age, ROA, Firm’s size (Sales)
Content Analysis 100 UK listed firms 20042005 in London Stock ExchangeFirms as samples include banking, telecommunication, business services, media and publishing, food production and beverage, pharmaceuticals and biotechnology, and IT firms.
Oliveira, et. al (2008)
Dependent : Voluntary disclosure of intangible reportingIndependent: Firm’s size, leverage, ownership diffusion, firms auditControl: ROA, industry type, listing status
Content Analysis 56 listed company in Portuguese stock market 2003
Saleh, et. al (2008)
Dependent : IC performanceIndependent: ownership structure (family ownership, government ownership, management ownership, and foreign ownership)There is no control variable.
VAIC All kinds of companies in MESDAQ
Li, et.al (2006)(working paper)
Exploratory study in European bank’s annual report
Content Analysis and descriptive Analysis
9 leading banks in Western European countries
Haniffa and Hudaib (2004)(working paper)
Exploratory study in Gulf Region’s Islamic bank’s annual report
Content Analysis and descriptive Analysis
5 Islamic banks in Gulf Region
CHAPTER III
RESEARCH METHODOLOGY
A. Research Design
This research included in hypothesis testing research. It caused that in this research are tested the
hypothesis which developed before (Hartono, 2005). This research aims to find the effect ownership
structure on intellectual capital disclosure in Islamic banks for the evidence in Asia.
B. Population, Sample, and Sampling Technique
Population is not known because there is no actual index taken from special institution that reported the
number of Islamic banks in Asia. In this research used purposive sampling techniques. Purposive
sampling technique is selecting sample techniques made by taking the sample based on certain criteria
developed in the research objectives (Hartono, 2005). The criteria of purposive sampling in this
research are:
a. full pledged Islamic Banking, which are located in Asia and listing in each country’s stock
exchange,
b. has a website that can be used to download the annual report,
c. Islamic banks which publishes English version annual report from 2003 to 2007 on their
respective websites,
d. Annual report that was taken from the website of each bank is also the only annual report can
provide complete information in accordance with the variables included in this research.
C. Variables Measurement
Variables examined in this research consists of dependent variables such intellectual capital disclosure.
Independent variable is ownership structure in which proxied by ownership diffusion. For control
variables are firm size, company age, leverage, profitability (ROA), auditor types, and role of duality.
1. Dependent Variable
Variation intellectual capital disclosure (ICDI) used as dependent variables expressed by the company.
This proxy is taken from the companies annual reports of each sample. Annual report is the only one of
many company public media for communications which can be used to transfer the information to
communities who invest in the company, to know the company’s capital (Frederiksen and Westphalen,
1998). In addition, Marston and Shives (1991) concluded that annual report was comprehensive
document that was provided by the company as company disclosure media to the public interest.
Parker (1982) argued that the annual report is a public media that cover the extent scope and
easily provided. The advantage of the annual report was there was addition component in reporting
financial report which can be communication media information about intellectual capital (Johanson et.
al, 1999, Abeysekera, 2006). Thus, the annual reports to be choice in measure company intellectual
capital.
The measurement of intellectual capital disclosure in this research adopted Li, et. al (2008). The
amount of intellectual capital components in Li, et. al (2008) was as 61 components. Thus, from 61
components revealed by the company and then divided by the number of 122 point (for 2 matrixes
format such as text and number). In this research, researcher excludes graph/picture as one of matrix
format by Li, et. al (2008) caused in accordance Ahmad (2004) that argues that graph/ picture would
involve a high level subjectivity. Ahmad (2004) also used text and number for measuring word count for
content analysis. As for how to calculate the components is the dummy variable method, using the
technique dichotomy score with the formula:
j
n
tij
j n
XICDI
j
∑== 1
nj = number of items that j th expressed by the company, consisting of 122 (ie 61 items in two formats),
Xij = 1 if the company reveals ith item, if 0 if the company does not reveal, so that 0 ≤ 1 ≤ ICDIj.
Dependent variables adapted to Li, et (2008) also measure the volume of intellectual capital
disclosure (ICWC). To measure the volume of ICD was calculated the number of words in the annual
report related to the 61 component intellectual capital disclosure (Li, et al, 2008). Number of words
selected as the method of calculating the volumes of intellectual capital disclosure. It caused that the
word was the smallest unit of quantitative measurement in the content analysis. It also expected to
maximize accuracy in the volume are (Zeghal and Ahmed, 1990).
This research using Islamic banks annual reports from different countries. Problems in the
language used by each country can be a constraint in the calculation of the word. Therefore, in this
research used the annual report in which using English version as international language standards.
Dependent variable in this research there are two kinds of proxy. They are intellectual capital
disclosure variation is signed as ICDI and intellectual capital disclosure volume is signed as ICWC.
Result of ICDI the calculation by with the dichotomy score method shows the variations of intellectual
capital. While ICWC by content analysis indicates the volume of intellectual capital disclosures are
made by company. The example of counting word in content analysis method can be seen the following
sentence.
“During this period, the IT Group was able to implement systems to support Retail Banking, Accounting, Assets, Trade Finance, IVR, Call Center, Debit Cards, Credit Cards, ATMs and SMS banking” (Annual Report of Boubyan Bank, 2006, pages 17)
From thus sentence, researcher can divided the sentence into some phrase such (1) the IT Group
was able to implement systems to support Retail Banking, Accounting, Assets, Trade Finance (2) Call
Center, and (3) Debit Card, Credit Cards, ATMS, and SMS Banking. First phrase show that Boubyan
Bank had been disclosed structural capital about technology used in its bank (see S10 at table of
research instrument). It is contain 16 words. Second phrase, shows that Boubyan bank had been disclose
about call center of which include in structural capital index number 12 about customer support
function (see S12 code at table of research instrument). It is contain 2 words. The last phrase, shows
that Boubyan bank had been disclose about both product and technology. Product represented by
disclosing about debit card and credit card. It is contain 4 words. Technology represented by disclosing
SMS banking facility and ATMs. It is contain 3 words.
2. Independent Variable
According to Oliveira et. al (2008), measurement of independent variable by calculating concentrated
ownership expressed by three major ownership in each annual reports.
3. Control Variable
Firm’s size selected because it was important for a potential disclosure research (Hossain, 2008). The
measurement of firm’s size of this research refers to the Haniffa and Cooke (2005), Freedman and Jaggi
(2005) using the natural logarithm of total asset size as a proxy. Firm’s size signed as TA.
Company age is signed as AGE. It is measured by counting the age of the company from the date
of company its establishment. Data on the date of the company establishment obtained from the
company history in the annual report. Then the data is performed by date cut off in December 31.
Profitability is signed as ROA. It is use return on assets (ROA) as profitability proxy. ROA
measured by counting net income divided by total assets.
Haniffa and Cooke (2005) and Freedman and Jaggi (2005) used the leverage as one of their
proxy in their research. Leverage is signed as LEV. It is measures by calculating the ratio of debt to total
equity. This ratio indicates how much of the total assets of the company were acquired or funded by
debt.
Firm audit is signed as AUDITYPE. It is measured by dummy variable. 1 if the firm audited by big 4 and 0 if
otherwise. The big 4 firm audit are Deloitte and Touche, KPMG, Price Water House, Coopers and Cap Gemini, and Ernest
and Young.
Role of duality is signed as RDUAL. It is measured by dummy variable, 1 if there is role of duality, 0 if there is no
role of duality in the firm.
D. Research Instruments
Content analysis technique in this research is done by read annual reports of each company. It is also
done by coding the annual report sample to get information in the framework of intellectual capital
indexes. Intellectual Capital indexes in the research Li, et. al (2008) selected as a reference indicator for
intellectual capital in accordance with the objectives of the research. It is also caused availability on
dependent variable data by content analysis methods. The component of intellectual capital is used in
this research is basically divided into three major parts, such as (Li, et.al, 2008).
a. human capital
b. Structural capital
c. Relational capital
In this research, the third indicator of intellectual capital disclosure is to be outlined 61 points are
included the indicator 22 points to human capital, 18 points for structural capital and 21 points for
relational capital (Li, et. al, 2008). Research instrument as 61 components list can be seen in detail in
the following table.
TableIII.1
Research Instruments
Code Items Names Description
Human CapitalH1Number of employees Employees count of a firm, employee breakdown by. e. g
market (business operation or geographical segments), department and job function, and information about its changes for such changes
H2Employee age Biological age of employee in the firm, include qualitative description of agerelated advantages/strength of a company’s employees and indicators such as average age of company’s employee, and age information
H3Employee diversity Diversity is defined as the division of classes among a certain population. The item refers to the mix of e. g ethnicity, gender, color, and sexual orientation. Relevant disclosure include employee diversity policy, the mix and breakdown of employee by race, religion, and culture
H4Employee equality Equal treatment of people irrespective of social and cultural differences. Related disclosure includes employee equality policy and initiative taken enforcement, senior management by gender, and percentage of disabled employees.
H5Employee Relationship The recognition of importance of employee, employee appreciation, dependence on key employee, employee satisfaction, loyalty, Health and safety and working environment. It is also includes initiatives to build and improve employee relationship e. g. trade union activities, promotion in share ownership and employee contractual relationship
H6Employee education Education of directors as well as other employees. Employees’ professional recognition is classified under employee workrelated competences.
H7Skills/knowhow Disclosures can be description of knowledge, knowhow, expertise or skills of directors and other employees. Matrices could also be shown indicating number of employees with such skills, etc.
H8 Employee workrelated competences
The knowledge and skills that can be useful to accomplish jobs. It refers to, Competence e.g. current positions held outside the company by directors, professional recognition/qualification, awards won (external), and employee publications.
H9 Employee workrelated knowledge
What is acquired during the job in terms of tacit, explicit and implicit knowledge. It mainly relates to knowledge that employees have related to their current job description, including employees’ previous working experience.
27
H10 Employee attitudes/.behavior
It reflects how employees are working. Relevant disclosures could be, e. g employee friendliness, welcoming, hard working, optimism, enthusiasm, andidentification of individuals with company’s goals.
H11 Employee commitments
It refers to employees being bound emotionally/intellectually to the organization. It covers, e.g. description of employee commitments, employee commitment matrix/index, and indicators such as attendance of meetings.
H12 Employee motivation Policies, initiatives and evidence of motivation of directors and other employees. It includes reward (internal) and incentives systems, e.g. employee explicit recognition, performance/ psychometric/ occupational assessment, and indicators of such as employee turnover1
stability, absence, and seniority.H13 Employee
productivity2It is typically measured as output per employee or output per laborhour, an output which could be measured in physical terms or in price terms. It shows the value added and efficiency of employees. Indicators include, e.g. employee value added, revenue or customers per employee.
H14 Employee training It includes, e.g. training policies, training programs, training time, attendance, investment in training, number of employees trained per period, and training results/effectiveness/efficiency.
H15 Vocational qualifications
It refers to education, managed and monitored by trade and professional organizations (Brooking, 1996), received by an employee for a particular vocation that proves the skill, knowledge and understanding he/she has to do a job well.
H
16
Employee development3
Employee career development. Disclosures include employee development policies and programs (e.g. succession planning), recruitment policies (e.g. internal promotion). Indicators include change of employee seniority, and rate of internal promotion.
H17 Employee flexibility Strategies used by employers to adapt the work of employees to their production/business cycles; and a method to enable workers to adjust working life and working hours to their own preferences. For example, temporary/fixedterm contracts, relaxed hiring and firing regulations, adjustable working hours or schedules (e.g. parttime, flexible working hours/shifts, working time accounts, leave, and overtime), outsourcing, job rotation,
1 Information about directors’ retirement is not included as employee turnover.2 Directors’ achievements based on incentive schemes are classified as employee motivation information rather than employee productivity. It is considered more appropriate to reflect on the motivational effectiveness of incentive schemes3 Not formal qualifications as degrees.
28
tele /homeworkers, outworkers.H18Entrepreneurial spirit It refers to, e.g. employee engagement (e.g. employee
suggestion systems/consultations, rate of employee suggestions acceptance), empowerment (responsibility taking), creativity (e.g. valuing creativity, tolerance of creative people), innovativeness, knowledge sharing, and employee proactive/reactive ability.
H19Employee capabilities Other employee abilities apart from the above discussed, e.g. communication ability, interpersonal ability, sensitivity (e.g. thoughtful), reflexibility, and management quality.
H20Employee teamwork Teamwork is the concept of people working together cooperatively. It covers information about culture of teamwork (expert teams and networks, teamwork capacity), programs that enhance relationships between employees within/ a cross departments.
H21 Employee involvement with community
Employee social competence can be reflected by their involvement with community It is defined as providing employees opportunities for contact with an often concealed but significant part of the firm’s stakeholders.
H22 Other employee features
It refers to the special display or attraction of, or gives special prominence to, employees of the firm, e.g. photographs of employees, other employee profileinformation (e.g. positions held).
Structural capital
S1Intellectual property It is a term that encompasses patents, copyrights, trademarks, trade secrets, licenses, commercial rights and other related fields. It covers the assets of a company which is protected by law.
S2Process It normally refers to a company’s management (sales tools, company cooperation forms, corporate specialization, operational or administrative processes). It includes utilization of organization resources, processes/ procedures / routines, and documentations which enables the company or employees to follow. Indicators are, e.g. efficiency, effectiveness, and productivity.
S3
Management philosophy ‘The way leaders in the firm think about the firm and its employees’ (Brooking, 1996: 62), i.e. the way a firm’s managed.
S4Corporate culture The set of key values, beliefs, attitudes and understanding shared by people and groups in an organization, which controls the way members of the organization interact with each other and with other
29
stakeholders. It covers information about, e.g. description of the firm’s corporate culture and value, stories and myths that build up about people, events and history conveying a message about what is valued within a firm.
S5Organization flexibility A company’s ability to face challenges and changes, such as specific processes firms use to alter their resource base.
S6Organization structure Reporting lines, hierarchies, and the way that work flows through the business, including management structure and business models.
S7Organization learning A characteristic of an adaptive organization. It covers what firms learn from experience and incorporate the learning as feedback into their planning process.
S8Research & development (R&D)
It refers to futureoriented, longerterm activities in business practice, which can achieve higher levels of knowledge and improvement in business practice, allowing the organization to exploit competitive advantages. It includes, e.g. R&D policies, programs, planning, progress, budgets, successful rate, rate of peerreviewed publications.
S
9
Innovation Defined as the successful implementation of creative ideas within a firm by introducing something new and useful (radical or incremental changes to products, processes or services).
S
1
0
Technology A collection of techniques, which is the current state of humanity’s knowledge of how to combine resources to produce desired products, to solve problems, fulfill needs, or satisfy wants. It includes machines, IT (e.g. computer hardware and software), IS (e.g. SAP, PeopleSoft, database), technical methods, and techniques.
S
1
1
Financial dealings Defined as the favorable relationships the firm has with investors, banks and other financiers, financial ratings, financial facilities available, and listings.
S
12
Customer support function
Functions for customer support, such as customer support centers (e.g. call centers) and other related activities and programs.
S
13
Knowledgebased infrastructure
It includes, e.g. documented materials (e.g. shared database) that a firm shares amongst employees, facilities or centers (knowledge centers, laboratories) for training & learning, and knowledge management and sharing programs/ policies /facilities.
S
1
Quality management & improvement
Practices in maintaining and improving quality standards of products and services. Information considered relevant includes, e.g. policies and
30
4 objectives, programs, control activities (e.g. TQM), description of quality performance, and existence of quality committee.
S15Accreditations (certificate)
A process in which certification of competency, authority, or credibility is presented. It has been broadly referred to as quality certificates. ‘Investor in people’ accreditation represents a firm’s commitment to its employees; hence classified under employee relationship.
S16Overall infrastructure/ capability
Infrastructure/capabilities of a firm that cannot be classified under the other 17 structural capital items. Where acquisitions are stated to add a firm’s capability of products and services provision, such information is included under this item.
S17Networking The systems available in a firm that allows interaction of people via a broad array of communication media and devices, e.g. voicemail, email, voice or video conferencing, the internet, groupware and corporate intranets, personal digital assistants, and newsletters.
S18 Distribution network Internal networks of distribution, such as distribution centers. It is what a company owns and forms a very essential part of the business supply chain.
Relational capital
R1Customers General customer information, e.g. type of customers, customer names, reputation of customers, customer base, knowledge of markets/customers, and customer purchasing histories.
R2Market presence It covers target markets of a firm, geographically or by market segmentation, percentage of sales represented by each market segment, and market share.
R3Customer relationships It includes policies and programs for building customer relationships (e.g. customer loyalty schemes, customer satisfaction survey and the initiatives taken for improvement, complaints management), current relationships with customers (e.g. customer satisfaction and loyalty, customer recommendation, recognition of dependence on key customers, customer perception (e.g. expressed by direct quotes), and various activities/ indicators that enhance customer relationships, such as ontime deliveries, convenience of returning goods, value for money).
R4Customer acquisition It refers to a company’s new customers/contracts (unless identified as favorite contracts). It also includes a company’s effort on acquiring new or more customers, such as investments/costs.
31
R5Customer retention It focuses on retaining the existing customers. Relevant information includes e.g. the number of repeated customers/contracts, renewed contracts, backlog orders, and customer repurchase.
R6 Customer training & education (CTE), such as presentation, road shows, exhibitions, etc.
R7Customer involvement It focuses on customer consultation on product or services development, which could also include customer and company connectivity.
R8 Company image/ reputation
It refers to the evaluation/perception of a firm by its stakeholders in terms of their effect, esteem, and knowledge, and what a company stand for.
R9Company awards It includes awards to a company which is not specifically to other aspects, such as innovation or employees.
R1
0
Public relation It is the managing of outside communication of an organization to create and maintain a positive image. Public relations involve, e.g. popularizing successes and downplaying failures.
R1
1
Diffusion & networking It includes taking part in social events, courses, conferences, lectures, or other presentations or seminars.
R1
2
Brands4 Information about, e.g. brand names, brand images, brand awareness, brand loyalty (e.g. word of mouth advocacy), brandbuilding strategies and activities, and brandrelated sales.
R1
3
Distribution channels Defined as appropriate mechanisms of getting products and services into the market (Brooking, 1996). It refers to various third party distribution channels, e.g. distributors, agents, dealers.
R1
4
Relationship with suppliers
It includes, e.g. knowledge of suppliers, relationships with them (such as reliance on key suppliers, bargaining power against suppliers, support of suppliers, and payment terms).
R1
5
Business collaboration Collaborations established with other business partners. It covers issues such as strategic alliances, joint venture and partnership for the purpose of working together to improve effectiveness and efficiency by combining each other’s advantages.
R1
6
Business agreements It includes such as licensing and franchising agreements. However, the transactions are not within a consolidated group of companies.
4 Brands have been classified under relational capital in various studies (e.g. Bozzolan et al., 2003; Brennan, 2001; Guthrie and Petty, 2000). Although authors such as Rodgers (2003) consider brands as a structural capital item, it is considered in this study that brands themselves are not able to create value for firms and it is the attachment of the market and customers, and the positive perception consumers have relating to the brand that lead to purchase decisions and add value to the firm.
32
R1
7
Favorite contract A contract obtained because of the unique market position held by the firm (Brooking, 1996). It includes description of the contract and the favorable relationships.
R1
8
Research collaboration Collaborations with scientific associations or institutions (e.g. schools and universities) for research or development purposes for the benefit of the company or the community.
R1
9
Marketing It includes, e.g. marketing initiatives, investments, strategies, capabilities, and effects (e.g. awareness raised or sales created).
R20 Relationship with stakeholders
A firm’s relationship with stakeholders, which cannot be covered by relationship with customers, suppliers and shareholders, e.g. community, government, and competitors.
R21 Market leadership A firm’s leadership in various markets or top positions. Market share supplementing market leadership statement is also included.
Source: Li, et. al (2008), pp. 155159
33
E. Data Source
The secondary data are used in this research. In this research, secondary data are the
annual reports issued by each banks. They are collected by purposive sampling
criteria. The annual reports collected based on purposive sampling criteria are from
2003 until the year 2007. Data were selected by download from their website. Data
are collected by pooled data.
F. Data Collection Method
1. Technical Data Collection for Dependent Variable
Technical data collection in this research is by using content analysis for
dependent variables. Content analysis is data collection method for research by
observing and analyzing the content or message of a text, the content and any
posts or document fragment. Then, they are classified into different categories or
groups depending on the criteria that have been defined by researchers (Milne
and Adler, 1999). Purnomosidhi (2006) stated that the goals content analysis is
identify the characteristics or specific information in document. The document
aims to produce the objectively and systematically description. Gray et. al (1995)
reported that the content analysis was used to conduct the annual report research
in general. Guthrie (2004) argued that the valuable of content analysis to
investigate intellectual capital disclosures in annual report
34
2. Technical Data Collection for Independent Variable
For independent variables, the data collected in the annual report of each
company’s sample which is required the ownership diffusion data.
3. Technical Data Collection for Control Variable
For control variables, the data collected in the annual report of each company’s
sample which is required complete information about company age, firm’s size,
profitability, leverage, firm’s audit, and role of duality.
G. Method Analysis
In this research, researcher uses SPSS program 16.00 version for data analysis. In a
test, the researchers tested a variable the stages as follows:
1. Classic Assumptions Test
a. Normality Test
Normality test aims to test normality of distribution in the regression model
on residual variables (Ghazali, 2005). Normality test stage was a test that must
be done. Removing classic assumption in statistics test, the multi regression
test will not be valid for the small sample (Ghazali, 2005).
b. Multicollinearity Test
Multicollinearity test aims to test free correlations between variables (Ghazali,
35
2005). A good regression model should not occur correlation between
independent variables. In case of mutual correlation, the variables are
orthogonal. The means of orthogonal was correlation of each independent
variable with other independent variable was 0 (Ghazali, 2005).
Mulicollinearity between independent variables can be seen on
the value of tolerance. It against the value of variances inflation factor (VIF)
(Ghazali, 2005). The second ways to know the multicollinearity is show the
size of each independent variable which described by the other independent
variables. Tolerance measures variability of independent variables selected
which are not explained by other independent variables. The lowest tolerances
values synonymous with the highest VIF values in this test (Ghazali, 2005).
c. Autocorrelation Test
Autocorrelation was the relationship between the errors which appear on the
time series. To detect the existence of autocorrelation can be done with the
DurbinWatson test (Ghazali, 2005).
d. Heteroscedasticity Test
Heteroscedasticity test done by using this heterokedasticity test method in
cross term to the R square value. X square table in accordance with the value
degree of freedom (df) are based on the number of its variables opposition not
including the constant (Ghazali, 2005).
36
2. Hypothesis Test
Hypothesis test consists of simultaneous regression test (F test statistics) and
partial regression test (test statistic T).
a. Simultaneous regression test (F Test Statistic)
Simultaneous test (F test) aims to test the influence simultaneously of
independent variables and the control variables on the dependent variable. The
aims of this test also to eliminate bias in testing. F test used ANOVA (Analysis
of Variances) which is used to know the main influence (main effect) and
interaction effect of the categorical independent variables against dependent
variable matrix. The influence of primary (main effect) was the direct
influence of independent variables against dependent variables. While shared
or joint effect was interaction effect on two or more independent variables on
the dependent variable Ghazali, 2005)
b. Partial Regression Test (T Test Statistic)
Ttest statistics basically showed the influence of one independent variable
individual variation explained in the dependent variable. T Test statistics can
be done by comparing the value of t statistics to the critical point according to
the table. When the value of t statistics of the calculation was higher than the
37
table, it means the null hypothesis was rejected or alternative hypothesis was
accepted (Ghazali, 2005).
38
CHAPTER IV
DATA ANALYSIS AND DISCUSSION
A. Introduction Analysis
This study is hypothesistesting research. This research examines the influence
ownership structure on intellectual capital disclosure in the Islamic bank in Asia.
In this chapter is described the data description, result of hypothesis testing and its
discussions. In this research, data are processed by using multiple regression
analysis on the SPSS program 16.00 version.
B. Data Analysis
The data description in this study includes the sample selection and descriptive
statistics analysis.
1.Sample Selection
There is no special institution which is record the number of Islamic banks in
Asia. Thus make researcher observes the number of Islamic banks in Asia by
tracing on each country’s stock exchange website. Researcher uses the list of
Asia’s countries based on the notes of Encyclopedia Asia. Based on this notes,
researcher is browsing the address of each country’s stock exchange website.
Then, researcher visits each securities exchange website and record the
number of Islamic bank listing on them. Number of Islamic banks in Asia
which are found by website tracing study can be seen in Appendix I. Table IV.
38
1 shows the the number of Islamic banks which are became sample of
research.
Table IV. 1
Number Islamic Banks in Asia
No. Description Number Islamic Bank Percentage
1 Populations Islamic Bank in Asia which were listed in the stock exchange each countries in Asia
31 100 %
2 Number of Islamic Bank listed which has bank’s website and provide the annual report can be downloaded
18 58.024%
Source: secondary data, processed.
The next step is to visit the Islamic banks website. Complete
list of Islamic banks website which are listed on the each country securities
exchange can be seen in Appendix 2. Then, researcher is downloaded the
annual report as an object in this research. However, not all Islamic banks
listed which were had bank’s website also publishes annual report. Only
some Islamic banks which can be sample based on purposive sampling
criteria. Table IV. 2 below shows the amount of the annual report can be
downloaded from their website and Islamic bank annual report which can
be in the analysis.
Table IV. 2
Annual Report Sample
No. Description Amount Annual Report Percentage
1 Annual Report downloaded and seen (from total number Islamic bank provide annual report in its website)
61 100 %
2 Annual Report which are not require purposive sampling criteria
27 44.2623%
39
3 Annual Report which are matched on purposive sampling criteria (final annual report sample)
34 53.125%
Source: Secondary data, processed.
Secondary data used in this research are 34 the Islamic bank’s
annual reports in Asia. There is limitation of the number of Islamic banks
that meet the purposive sampling criteria. Only 34 annual reports are taken
by using panel data (pooled data) in 10 Islamic banks of seven countries
(see Appendix 2)
Table IV.3
Final Sample
No Country Name of Islamic Bank Amount Percentage
1. Indonesia Bank Muamalat Indonesia
2 5.9%
2. Malaysia Bank Islam Malaysia Berhad
3 8.8%
3. KuwaitKuwait Finance House 5 14.7%
Boubyan Bank 3 8.8%
4. PakistanMeezan Bank 5 14.7%
Bank Islami 2 5.9%
5. Qatar Qatar Islamic Bank 2 5.9%
6. BahrainAl – Salam Bank 2 5.9%
Bahrain Islamic Bank 5 14.7%
7. Abu Dhabi Abu Dhabi Islamic Bank 5 14.7%
Total 34 100%
Source: secondary data, processed.
Researcher has been coding annual report of which required purposive
sampling criteria as the first step of collecting dependent variable data. The
following table is summary of the results presented coding intellectual capital
According to the Table IV.4 above, items of intellectual capital can
be seen are expressed major in other features employee (human capital),
technology and quality management & improvement (Structural capital).
As well as customer relationship and marketing (Relational capital) where
the percentage reaches 100%. It also can be state that all Islamic banks
including in the sample have disclosed intellectual capital item.
On disclosures related to the human capital, employee training is also
discloses 79 % of all annual sample. Example of disclosure about
employee training can be seen in the paragraph below.
43
“A total of 31 Muamalat Crew have participated in the single MOOP session held in 2003, while 19 bank officers have been promoted to the position of branch manager. Bank Muamalat has also adopted new employee remuneration and grading system that is aligned to current industry standards based on the competence of each Muamalat Crew. Other training programs in 2003 include standard service level training based on ISO 90012000 certification for frontliner employees, sharia accounting training for backoffice personnel, and a workshop for bank officers on the principles and practice of Islamic banking, delivered in cooperation with the Islamic Research & Training Institute of the Islamic Development Bank (IDB). More than Rp 1.9 billion were spent for various training programs in 2003. For the year 2004, Bank Muamalat plans to conduct two MOOP sessions as well as the “Seven Fluency” program with a focus on the 5th fluency (system and procedure)and the 4th fluency [Annual report Bank Muamalat Indonesia, 2003, page:45 ]
2. Descriptive statistics
Descriptive statistics in the research conducted to explore the value of
mean, and standard deviation of the variables of research. Descriptive
statistics in a research conducted to find the mean value and standard
deviation of each variable. The descriptive statistical results are as follows.
Table IV. 5
Descriptive statistics
44
Variable Mean Standards Deviation N
.3549 .07589 34LNICWC 8.3332 .62630 34
52.4089 20.05566 34
2.8913 3.40015 34
64.3660 31.20812 34
14.8235 10.19944 34
LNTA 14.6862 1.38234 34
AUDITYPE .82 .387 34
RDUAL .24 .431 34
Source: secondary data, processed
The table shows the result of descriptive statistics for knowing mean and
standard deviation values of 34 sample annual reports. Information of descriptive
statistics obtained on the results test are (a) mean of ownership diffusion is
52.4089 and standard deviation of 20.05566 (b) mean of LNTA is 14.6862 and
standard deviation of 1.38234, (c) mean the company's profitability (ROA) is
2.8913 of and standard deviation of 3.40015, (d) mean of the company age of is
14.8235 and standard deviation of 10.19944, (e) mean of the company's leverage
(LEV) is 64.3660 and standard deviation of 31.20812, (f) mean of the type of
independent auditors firm (AUDITTYPE) is 0.82 and standard deviation of 0.387,
and (g) mean of role of duality (RDUAL) 0.24 and standard deviation of 0.431
(completely, see Appendix 4)
Table IV.6
45
Amount of Two Format Intellectual Capital Disclosure
No Intellectual Capital
Amount(ICDI)
Percentage(ICDI)
Amount(ICWC)
Percentage(ICWC)
1 Human Capital 437 29.7 % 42558 24.5 %
2 Structural Capital 550 37.3% 86922 50.1 %
3 Relational Capital 486 32.9% 44059 25.4 %
Total 1473 100 % 173539 100 %
Source: secondary data, processed
The mean index (ICDI) is 0.3549 with slight variation in variety
human, structural, and relational capital disclosure, and the mean
aggregate word count (ICWC) is 5.104 words. ICDI ranges from 0.2 to
0.49. ICWC ranges from 1.502 words to 13.992 words.
The rankings of the mean human, structural, and relational capital
disclosure change according to the disclosure measure employed. Structural
capital ranks highest (37%) for the disclosure index score. Structural capital
ranks the highest in term of word count, while human capital and relational
capital are joints highest for focus, each forming 24.5 % and 25.4 % of total
annual report word count. In all cases, human capital is in third place,
although not far behind other two. The structuralrelational human ranking
for word count (50.1%, 25.4%, and 24.5.% of total intellectual capital
respectively) is not consistent with findings from prior intellectual capital
AUDITTYPE Weak NoneRDUAL Medium Medium
Source: secondary data, processed.
Significant levels: significant at 0.10 = weak, significant at 0.05= medium
H. Ownership Diffusion
This shows inconsistencies to Li, et.al (2008) and Oliveira, et. al (2008). Banhaj
and Plemborg (2008) mentioned about two possibilities of an impact of ownership
concentration in the company. First, a higher level of ownership concentration
might provide less voluntary disclosure since shareholder have an inside way of
getting information. In contrast, large shareholder may monitor management to
provide more voluntary disclosure in order to reduce a problem of asymmetry
information.
This research finding in line to GraciaMecca (2005) that found no
association ownership diffusion on intellectual capital because the usefulness of
intellectual capital disclosure via presentation of Spanish companies to financial
analysts is for their decisionmaker. Firms with closelyheld ownership are
63
expected to have less information asymmetry between management and dominant
shareholders who typically have access to the information they need and can
provide an active governance system that is difficult for smaller, more passive and
lessinformed investors (Cormier et al., 2005). This is particularly relevant to
intellectual capital disclosure because fund managers have access to such
information via private communication channels (Holland, 2006).
This research finding appropriate in contrast to Li et. al (2008) which found
association ownership structure on intellectual capital disclosure but no
association in role of duality. In this research found no association ownership
diffusion on intellectual capital but there was association in role of duality. The
reason was There is widespread acknowledgement that a dominant personality
commanding a firm may be detrimental to the interests of shareholders, and this
phenomenon has been found to be associated with poor disclosure (Forker, 1992)
and CEO entrenchment, resulting in ineffective monitoring of managerial
opportunistic behavior (Haniffa and Cooke, 2002). Concentration of decision
making power resulting from role duality could impair the board’s oversight and
governance roles, including disclosure policies. Separation of the two roles
provides the essential checks and balances on management behavior (Blackburn,
1994).
I. Firm’s Size
This result is not consistent with previous research. This is because in this study,
researchers did not differentiate between firms in which have both large and small
64
asset. Although, this finding consistent to Almilia and Retrinasari (2007) that
found firm’s size only positively significant to mandatory disclosure. In the case
voluntary disclosure, firm’s size is not significant. Intellectual capital disclosure
include on voluntary disclosure (Cerbioni and Parboneeti, 2007).
J. Company Age
The finding of company age in the case ICDI as dependent variable is not
consistent to Akhtaruddin (2005) and Hossain (2008). They found that the level of
disclosure was not influenced by the age of a bank or the number of years the
bank began business. However their findings were in line to this research findings
in the case of ICWC as dependent variable.
The findings in ICDI consistent to Kakani et. al (2001) found that newer and
smaller firms take to the market in spit of disadvantages like their lack of capital,
brand name, and reputation. So that, intellectual capitals disclosures influenced by
company age and positive significant.
K. . Profitability
In the case ICDI as dependent variable, findings is in line to Ullmann (1985) and
Haniffa and Cooke (2005). Level of profitability of the company indicated that the
ROA, a significant effect on the level of disclosure in company annual report.
ROA positive coefficients indicated in the table shows that there is a positive
relationship between the profitability of the intellectual capital disclosure. This
findings also in line to GraciaMecca (2005) that also found positive in
significantly ROA on intellectual capital disclosure.
65
Although, in the case ICWC as dependent variable there is negative
insignificant effect ROA to intellectual capital disclosure. This finding consistent
to Lim. et. al (2007), Li, et. al (2008), and Oliveira et, al (2008) that found
insignificantly ROA to level disclosure except to historical financial information.
L. Leverage
In the case ICDI as dependent variable, leverage has negative significant value.
This finding consistent with the research Tan and Tower (1999) in Mangena and
Pike (2005) indicate that the negative association of Finnish companies use, and
the company's Singapore and Australia respectively. Mangena and Pike (2005)
state that the level of leverage affect the agency problem because the disclosure in
line with the increased level of debt.
In the case ICWC as dependent variable, leverage coefficients indicate a
positive and insignificant value. This result is not consistent with some results of
research that uses leverage. But this findings consistent to Ahmad and Courtis
(1999) that found insignificant positive association between leverage and
disclosure levels.
M. Firms Audit (Audit Type)
The finding in the case ICDI as dependent variable was in line with research
conducted by Wallace et. al (1994), Hossain et. al (1995), Depoers (2000) says that
there is no empirical association support between the size of a strong company
66
with a broad audit of the information revealed. Thus, the relationship between the
firm’s types of independent auditors with intellectual capital disclosure is
significant as the negative test results in this research.
Although, the finding in the case ICWC as dependent is not consistent to
Singhvi and Desai (1971), and Firth (1979) that the auditor of a company that big
and famous can encourage companies to disclose more information. However, it
was consistent to Ahmed and Courtis (1999) found that there was no significant
association between audit firm and level of voluntary disclosure but they found
audit form and mandatory disclosure.
N. Role of Duality
The findings of this research confirm the findings of Ho and Wong (2001) which
found negative insignificant relationship in levels of voluntary disclosure caused
the dominant personality. Gul and Leung (2000) found that the CEO has
significant dominance of the low voluntary disclosure is the company. According
to Ho and Wong (2001) which found that person who holds two roles at the same
time will tend to save and not revealing information to outside parties. Fama and
Jensen (1983) argue that when a camp as a chairman and CEO, it will tend to be
impartial to the management of the stockholder. Despite of these prior researches,
it rationale that there is significant effect role of duality on intellectual capital
disclosure.
67
CHAPTER V
68
CONCLUSION
A. Conclusion
The conclusions of the research findings are:
1. In general, there is no significant relationship between ownership
structures (ownership diffusion) and intellectual capital disclosure in the
Islamic bank in Asia. In the other words, hypothesis in this research is
rejected.
2. For control variables, the results is different both ICDI as the dependent
variable and ICWC the dependent variable. For ICDI as a dependent
variable, in this research find that the control variables are significant
except firm’s size and ROA. For ICWC as dependent variables, control
variables are insignificant except on role of duality.
B. Limitation
The research limitations are:
1. There is no institution that records the number of Islamic banks in Asia.
2. This research use data sample collected by panel data methods and only
get 34 annual reports. It is caused the limitation of the number of Islamic
bank.
3. Bias may occur by counting all word in the phrase or sentence in content
analysis methods. It is caused that different grammar used in the sentence
can influence the number of word.
69
C. Recommendation
Researchers have any suggestions for the next research can
1. take research samples in larger sample areas. For example in Asia
Africa. This is recommended as research Zahn (2005) who examined Y2K
disclosure commercial banks in the AsiaPacific,
2. add the number of samples using the annual report of year 2008,
3. can compare both Islamic bank with large and small assets,
4. add the cultural value as a variable in the model by using
Hofstede's index. Zahn (2005) examine the factors that affect the issues of
Y2K disclosure on the banks in AsiaPacific region. It is expected that the
presence variables can improve the better in research model,
5. can examine the influence of the ownership structure of each
component of intellectual capital disclosure, such human capital, structural
capital, and relational capital,
6. use only key of word for word count analysis in order to avoid bias
which may occur in grammar problem.
70
BIBLIOGRAPHY
Abeysekera, I. 2006. The Project of Intellectual Capital Disclosure: Researching the Reasearch. Journal of Intellectual Capital, 7 (1): 6177
Abeysekera, I. and Guthrie, J. 2005. An Empirical Investigation of Annual Reporting Trends of Intellectual Capital in Sri Lanka. Critical Perspectives in Accounting, 16 (3): 151163
Aboody, D. and Lev, B.1998. The Value Relevance of Intangibles: The Case of Software Capitalization. Journal of Accounting Research, 36 (Supplement): 161–191
Ahmad, Nik Nezti Nik. 2004. Environemnetal Dislosure in Malaysian Annual Report: A Legitimacy Theory Perspective. IJCM Vol. 14, No.1 pp.4457
Ahmed, K and Courtis, J.K. 1999. Associations between Corporate Characteristics and Disclosure Levels in Annual Report: a MetaAnalysis. British Accounting Review. Vol.31.pp.3561
Akhtaruddin, M. 2005. Corporate Mandatory Disclosure Practice in Bangladesh. International Journal of Accounting, 48: 399422
Almilia, Luciana Spica and Retrinasari, Ikka. 2007. Analisis Pengaruh Karakteristik Perusahaan terhadap Kelengkapan Pengungkapan dalam Laporan Tahunan Pewrusahaan Manufaktir yang Terdaftar di BEJ. National Seminar’s proceeding. Economics Faculty, University of Trisakti, June 9
Andriensen, D.G and Stam, C.D. 2005. Intellectual Capital of The European Union. The 7th McMaster World Congres on The Management of Intellectual Capital and Innovation. Januari 1921, Hamilton, Ontaro, Canada
Agustianto. 2008. Evaluasi Bank syariah 2008. www. Niriah.com
Banhaj, J and Plemborg, T. 2006. Value Relevance of Voluntary Disclosure in the Annual Report. Accounting and Finance, Vol.48. pp.159180
Bank Mumalat Indonesia. 2003. Annual Report BMI 2003. www.bankmuamalat.co.id
Barth. M. E., Kasnik, R., and McNichols, M. 2001. Analyst Coverage and Intangible
Asset. Journal Of Accounting Research, 39 (1): 134
Belkaoui, Ahmed and Philip G. Karpik. 1989. Determinant of the Corporate Desicion to Disclose Social Information. Accounting, Auditing, and Accountability Journal, 2,1 pp 3651
Beng, Phar Kim. 2008. The Global March of Islamic banking. UEA: Emirates Business
Bonfour, A. 2003. The ICdVAL Approach. Journal of Intellectual Capital. Vol.4, No.1. pp.396412
Bontis, N. 2000. Assessing knowledge assets: A Review of The Models Used to Measure Intellectual Capital. Queen’s management Research Centre for KnowledgeBased Enterprises
________. 2002. Intellectual Capital Disclosure in Canadian Corporations. Journal of Human Resource Costing and Accounting, 7 (1/2): 920
Bontis, N., W.C.C. Keow., S. Richardson. 2000. Intellectual Capital and Business Performance in Malaysian Industries. Journal of intellectual Capital
Bozzolan, S., Favotto, F. and Ricceri, F. 2003. Italian Annual Intellectual Capital Disclosure: An Empirical Analysis. Journal of Intellectual Capital, 4 (4): 543558
Brennan, N. and Connel, B. 2000. Intellectual Capital: Current Issue and Policy Implications. Journal of Intellectual Capital, 1 (3), 206240
Brennan, N. 2001. Reporting Intellectual Capital in Annual Reports: Evidence from Ireland. Accounting, Auditing & Accountability Journal, 14 (4): 423436
Bryman, A, dan E, Bell. 2007. Business Research Methods. UK: Oxford University Press
Bukh, P. N. 2003. Commentary: The Relevance of Intellectual capital Disclosure: A Paradox?. Accounting, Auditing & Accountability Journal, 16 (1): 4956
Canibano, L., GarciaAyuso, M., and Sanchez, P. 2000. Accounting for Intangibles: A
Literature Review. Journal of Accounting Literature, 19: 102130
Cerbioni, F. and Parbonetti, A. 2007. Exploring the Effects of Corporate Governance on Intellectual Capital Disclosure: An Analysis of European Biotechnology Companies. European Accounting Review, 16 (4): 791826
Chalmers, K and Godfey, J. 2004. Reputation Costs: The Impetus for Voluntary Derivative Financial Instrument Reporting. Accounting, Organization and Society. Vol. 29. pp. 95125
Chaminade, C. and Roberts, H. 2003. What It Means Is What It Does: A Comparative Analysis of Implementing Intellectual Capital in Norway and Spain. European Accounting Review, 12 (4): 733751
CIMA.2001. Managing the Intellectual Capital within Today’s KnowlegdeBased Organization. Technical BrieftingSeptember
Conger, J.A, Finegold, dan E.E Lawler. 1998. Appraising Boradroom Performance. Harvard Business Review 76 (JanuaryFebruary), pp 136148
Cooke, T. E. 1989. Disclosure in the Corporate Annual Reports of Swedish Companies. Accounting and Business Research, 19 (74), 113124
__________. 1992. The Impact of Size, Stock Market Listing and Industry Type on Disclosure in the Annual Reports of Japanese Listed Corporations. Accounting and Business Research, 22 (87).pp 229237
Cormier, D, Magnan, M., and van Velthoven, B. 2005. ‘Environmental Disclosure Quality in Large German Companies: Economic Incentives, Public Pressures or Institutional Conditions?. European Accounting ReviewVol. 14 (1): 3–39
Craig, R. and Diga, J. 1998. Public Disclosure in ASEAN. Journal of International Financial Management and Accounting, 9 (3), 247273
Cuganesan, S.,N. Finch., and T. Carlin. 2007. Intellectual Capital Reporting: A Human Capital Focus. Academy of Accounting and Financial Studies Vol. 12 No. 1
Dharma, S., 2004. Formasi Modal Manusia dan Strategi Inovasi, Usahawan, No. 9, Tahun XXXIII, September: 2530
73
Depoers, F. 2000. A Cost Benefit Study of Voluntary Disclosure: Some Empirical Evidence from French Listed Companies. The European Accounting Review. Vol. 9 (2). Pp. 245263
Dumontier, D and Raffournier, B. 1998. Why Firms Comply Voluntary with IAS: An Empirical Analysis with Swiss Data. Journal of International Financial Management and Accounting. Vol. 29 (3). Pp. 13251359
Edvinson, Leif and Sullivan, P. 1996. Developing Model for Managing Intelectual Capital. European Management Journal, Vol.14, No.4. Pp 356364
Eng, L. L. and Mak Y. T. 2003. Corporate Governance and Voluntary Disclosure. Journal of Accounting and Public Policy. Vol.22. Pp.325345
Fama E.F. and Jensen M. 1983 Separation of ownership and control, Journal of Law and Economics, 26(2), pp. 301326
Firer, S. and Williams, S. Mitchell. 2003. Association Between the Ownership Structure of Singapore Publicy Traded Firms and Intellectual Capital Disclosures. www.ssrn.com
Frederiksen, J.V. and Westphalen, S.A. 1998. Human Resource Accounting: Interests an Conflicts. Thessaloniki, Greece, CEDEFOP European Centre for the Development of Vocational Training.
Freedman, M dan Jaggi, B. 1982. Pollution Disclosure, Poluution Performance. The International Journal of Management Science, pp 167176
Forker, J. J. 1992. Corporate Governance and Disclosure Quality’.Accounting and Business Research, 22 (86) 111–124
GarciaMeca, E. and Martinez, I. 2005. Assesing the Quality of Disclosure on Intangible in the Spanish Capital Market. European Business Review, 17 (4): 6394
Ghazali, Imam. 2005. Analisis Multivariate dengan Program SPSS. Semarang: BP UNDIP
Goh, P. C. and Lim K. P. 2004. Disclosing Intellectual Capital in Company Annual Report: Evidence from Malaysia. Journal of Intellectual Capital, 5 (3): 500510
Gul, F.A, and Leung, S. 2002. CEO Dominance and Voluntary Disclosure Strategies in Hong Kong Annual Report. Working Paper. City University of Hong Kong.
Guthrie, James and Petty, R. 2000. Intellectual Capital: Australian Annual Reporting Practices. Journal of Intelectual Capital, 1 (3): 241251
Guthrie, J., R. Petty., K. Yongvanich. 2004. Using Content Analysis as a Research Method to Inquire into Intellectual Capital Reporting. Journal of Intellectual Capital 5 (2): 282293.
Guthrie, J., R. Petty., F. Ricceri. 2006. The Voluntary Reporting of Intellectual Capital: Comparing Evidence from Hong Kong and Australia. Journal of Intellectual Capital Vol. 7 No. 2.Pp. 254271
Gray, S.J., Meek, G.K. and Roberts, C.B. 1995. International Capital Market Pressures and Voluntary Annual Report Disclosures by US and UK Multinational Companies”, Journal of International Financial Management and Accounting. Vol. 6 (1).
Habersam, M. and Piber, M. 2003. Exploring Intellectual Capital in Hospitals: Two Qualitative Case Studies in Italy and Austria. European Accounting Review, 12 (4): 753779
Haniffa, M. R. and Cooke, T. E. 2002. Culture, Corporate Governance, and Disclosure in Malaysian Corporations. Abacus, 38 (3): 317349.
___________________________. 2005. The Impact of Culture and Governance on Corporate Social Reporting. Journal of Accounting and Public Policy, 24: 391430.
Haniffa, M.R and Hudaib, M. 2004. Disclosure Practices of Islamic Financial Instituions: An Exploratory Studi. Working Paper
Harahap, S. S., and J. Gunawan. 2005. An Examination of Corporate SocialEnvironmental Disclosure in Annual Reports of Indonesian, Malaysia and Australian Islamic banking. Indonesian Management and Accounting Research Vol. 4 No. 1: 7399.
Harrison, S and P.H Sullivan. 2000. Proftting Form Intellectual Capital: Learning from Leading Companies. Journal of Intellectual Capital. Vol.1, No.3, pp.
75
3346
Hartono, Jogiyanto. 2005. Metode Penelitian Bisnis: Salah Kaprah and PengalamanPengalaman. Yogyakarta: BPFE.
Healy, P.M., and K.G. Palepu. 2001. Information Asymmetry, Corporate Disclosure, and The Capital Market: A Review of the Empirical Disclosure Literature. Journal of Accounting and Economics 31: 405440.
Ho, Simon S. M. and Kar Shan Wong. 2001. A Study of The Relationship between Corporate Governance Structures and The Extent of Voluntary Disclosure. Journal of International Accounting, Auditing. Pp791–826
Holland, J. 2006. A Model of Corporate Financial Communication, Institute of Chartered Accountants of Scotland (ICAS): Edinburgh.& Taxation, 10: 139156.
Hosain, M, Perera, M and, Rhaman, A. 1995. Voluntary Disclosure in The Annual Reports of New Zealand Companies. Journal of International Management and Accounting. Vol. 6 (1). Pp. 6987
Hossain, Muhammed. 2008. The Extent of Disclosure in Annual Report of Banking Companies: The Case of India. European Journal of Science and Research, 23 (4).Pp. 660681
Ittner, C. and Larcker, D. 1998. Are NonFinancial Measures Leading Indicators of Financial Performance? An Analyst Satisfaction Survey. Journal of Accounting Research, 36 (Supplement): 1–35
Jensen, M.C dan Meckling, W.H. 1976. Theory of the Firm: Managerial Behavior, Agency Cost, and Ownership Structure. Journal of Financial Economics, 3: 305360
Johanson, U., M. Martensson and M. Skoog. 1999. Measuring and managing intangibles:Twelve Swedish qualitative exploratory case studies. Working Paper. Stockholm University.
Kakani, R.K; Saha, R, and Reddy, V.N. 2001. Determinants of Financial Performance of Indian Corporate Sector in the PostLiberalization Era: An Exploartory Study. National Stock Echange Innitaitive, Reserach Paper No.5
Kahl, A, dan Belkoui, A. 1981. Bank Annual Report Disclosure Adequacy
76
Internationally. Accounting and Business Research, Summer, pp.189196
Keenan, J dan Aggestam, M. 2001. Corporate Governance and Intellectual Capital: Some Conceptualisation. Corporate Governance, 9.Pp 259275
Kubo, I and A. Saka. 2002. An Inquairy into the Motivations of Japanese Banking Workers in the Japanese Financial Industry. Journal of Knowledge Management, Vol.6 No.3, pp.262271
Lev, B. and Zarowin, P. 1999. The Boundaries of Financial Reporting and How to Extend Them. Journal of Accounting Research, 37 (2).Pp. 353386
Lev, B. 2001. Intangibles: Management, Measurement and Reporting. Washington: The Brookings Institution
Li. Jing, Richard Pike and Roszaini Haniffa. 2006. Intellectual Capital Disclosure in Corporate Annual Report: A European Comparison. Working Paper
_____________________________________. 2008. Intellectual Capital Disclosure and Corporate Governance Structure in UK Firms. Accounting and Business Research, 38 (2).Pp.137159
Malone et.al. 1993. An Empirical Investigation of The Extent of Corporate Financial Disclosure in The Oil and Gas Industry. Journal of Accounting, Auditing, and Finance. Vol.8 (3), pp. 249273
Mangena, Musa dan Pike, Richard. 2005. The Effect of Audit Committee Shareholding, Financial Expertise and Size on Interim Financial Disclosures. Accounting and Business Research. Vol. 35. No. 4. pp. 327349. 2005 327
Marr, B., D. Gray, and A. Nelly. 2003. Why do Firm Measure Their Intellectual Capital?. Journal of Intellectual Capital Vol. 14 No. 4.Pp. 441464
Marston, C. L. and & Shrives, P. J. 1991. The use of disclosure indices in accounting research: A review article. British Accounting Review, 23(3), pp. 195–210
Milne, M., and Adler, R. 1999. Exploring the Reliability of Social and Environmental Disclosures Content Analysis. Accounting, Auditing & Accountability Journal. Vol. 12 (2). Pp. 237–256
Mora, A and Rees, W. 1998. The Early Adoptionof Consolidated Accounting in Spain. The European Accounting Review. Vol. 7 (4). pp. 675696
77
Mouritsen, J. 1998. Driving Growth: Economics Value Added Versus Intellectual Capital. Management Accounting Research, 9 (4).Pp.461483
Mouritsen, J., Larsen, H. T., and Bukh, P. N. D. 2001. Intellectual Capital and the 'Capable Firm': Narrating, Visualising and Numbering for Managing for Managing Knowledge. Accounting, Organisation and Society, 26
Mouritsen, J., Bukh, P. N. and Marr, B. 2004. Intellectual Capital and New Public Management: Reintroducing Enterprise. Learning Organization, 11 (4/5). Pp. 380392
Oliveira, Lidia, Lucia Lima Rodrigues, and Russell Craig.2008. Applying Voluntary Disclosure Theories to Intangibles Reporting: Evidence from the Portugese Stock Market. www.ssrn.com
Ongkorahardjo, Martina Dwi Puji Astri; Antonius Susanto,and Dyna Rachmawati. 2008. Analisis Pengaruh Human Capital Terhadap Kinerja Perusahaan (Studi Empiris pada Kantor Akuntan Publik di Indonesia). Jurnal Akuntansi Keuangan. Vol. 10, No. 1, Mei: 1121
OwusuAnsah, S. 1998. The Impact of Corporate Attributes on The Extent of Mandatory Disclosure and Reporting by Listed Companies in Zimbabwe. International Journal of Accounting 33 (5), pp.605631
Parker, L.D. 1982. Corporate Annual Reporting:A Mass Communication Perspective. Accounting and Business Research, Autumn. Pp. 27986
Patelli, L and Prencipe, A. 2007. The Realtionship Between Voluntary Disclosure and Independent Directors in The Presence of A Dominant Shareholders. European Accounting Review, 16 (1) Pp: 533
Petrash, G. 1996. Dow’s journey to a Knowledge value management culture. European Managenemnt Research. Vol.14, No.4, pp.365373
Petry, P and J. Guthrie.2000. Intellectual Capital Literature Review: Measurement, Reporting, and Management. Journal of Intellectual Capital, Vo.1, No.2, pp.155175
Pike, S., A. Rylander., and G. Roos. 2001. Intellectual Capital Management and Disclosure. The Strategic Management of Intellectual Capital and Organizational Knowledge: A Selection of Readings, Oxford University
Raffournier, B.1995. The Determinants of Voluntary Financial Disclosure by Swiss Listed Companies. European Accounting Review, 4 (2) Pp: 261–280
Saleh, Norman Mohd, Rahman, Mara Ridhuan Abdul, dan Hasan. Mohamat Sabri. 2007. Ownership Structure and Intellectual Capital Performance in Malaysian Companies Listed in MESDAQ. www.ssrn.com
Siddiqi, A.H. 1980. The Translation of The Meaning of Shahih Muslim, Muhammad Ashraf, Lahore
Singhvi, S. S. dan Desai, H. B. 1971. An Empirical Analysis of The Quality of Corporate Financial Disclosure. The Accounting Review 46 (1) Pp 129138
Stewart, T. A. 1997. Intellectual CapitalThe New Wealth of Organization. London: Nicholas Brealey
Subbarao, A. V., dan Zeghal, D. 1997. Human Resources Information Disclosure in Annual Report: An International Comparison. Journal of Human Resources Costing and Accounting, 2 (2) Pp: 5373
Sujan, A. dan Abeysekera, I. 2007. Intellectual Capital Reporting Practices of the Top Australian Firm. Australian Accounting Review, 17 (2) Pp 7183
Sullivan, Jr. P.H and P.H Sullivan Sr. 2000. Valuing Intangible Companies, an Intellectual Capital Approach. Journal of Intellectual Capital, Vol.1, No. 4, pp. 328340
Sveiby, K. E. 1997. The New Organizational Wealth: Managing and Measuring Knowledgebased Asset. San Fransisco, CA: BerretKoehler Publishers
Swartz, NP dan Firer, S. 2005. Board Structure and Intellectual Capital Performance in South Africa. Meditari Accountancy Research, 13 (2) Pp 145166
Tayles, M., Pike R., dan Sofian S. 2007. Intellectual Capital, Management Accounting Practices and Corporate Performance: Perceptions of Managers. Accounting,
Tsang, W.K,. 1998. A longitudinal study ofcorporate social reporting in Singapore: the case of the banking, food and beverages and hotel industries. Accounting, Auditing and Accountability Journal 11(5),pp. 624635.
Tsui, J., F.A. Gul. 2000. Corporate Governance and Financial Transparencies in the Hong Kong special Administrative Region of the People’s Republic of China.www.ssrn.com
Ullman, A.E.1985. Data in Search of A Theory: A Critical Examination in Relationship Among Social Performance, Social Disclosure, and Economics Performance of US Firms. Academy Management Review 10 (3), pp.540557
Vandemaele, S. N., Vergauwen, P. G. M. C., and Smits A. J. 2005. Intellectual Capital Disclosure in the Netherlands, Sweden and the UK: A Longitudinal andComparative Study. Journal of Intellectual Capital, 6 (3) Pp. 417–426
Verrecchia R.E. 2001. Essays on disclosure. Journal of Accounting and Economics, 32(13). pp.97180
Vergauwen, P., Bollen, L, and Oirbans, E. (2007).‘Intellectual Capital Disclosure and Intangible Value Drivers: An Empirical Study’, Journal of Intellectual Capital, 45 (7) Pp.1163–1180
Wahidawati. 1997. Pengaruh Kepemilikan Manajerial dan Kepemilikan Institusional pada Kebijakan Hutang Perusahaan: Sebuah Perspective Teori Agency. SNA IV .Pp. 10841107
Wallace, R. S. Olusegun, Kamal Naser and Araceli Mora. 1994. The Relationship between the Comprehensiveness of Corporate Annual Reports and Firm Characteristics in Spain. Accounting and Business Research Vol. 25, No. 97. pp. 4153
Wallace, R.S.O dan Naser, K.1994. Firms Specific Determinants of Comprehensiveness of Mandatory Disclosure in The Corporate Annual Report of Listed Firms on The Stock Exchange in Hongkong. Journal of Accounting and Public policy 14, pp.311368
80
Wallman, S.M.H. 1996. The Future of Accounting and Financial Reporting Part2: The Colorized Approach. Accounting Horizon, 10 (2), pp.138148
William, S. M. 2001. Is Intellectual Capital Performance and Disclosure Related?. Journal of Intellectual Capital, 2 (3): 192203
Widyaningrum, Ambar. 2004. Modal Intelektual. Jurnal Akuntansi dan Keuangan Indonesia, Vol.1 pp.1625
Wong, M., dan C. Gardner. 2004. Intellectual Capital Disclosure: New Zealand Evidence. Journal of Literature Economics M41
Zahn, J.L.W Mitchell Van der. 2005. Factors Affecting Information Technology Problem Disclosure in AsiaPacific Commercial Banks. Financial Reporting, Regulation, and Governance Journal, pp.126
Zeghal, Daniel dan Ahmed, Sadrudin, A. 1990. Comparison of Social Responsibility Information Disclosure Media Used by Caanadian Firms. AAA Journal, pp 3853
Zhou, MM dan Panbuyen, P. 2004. The Association Between Board Composition and Different Types Disclosure. Unpublished Thesis
81
Appendix 1
Stock Exchange’s Website and Amount Islamic Bank Listed
No. Country Stock Exchange’s website Amount Islamic Banking Listed
South West Asia
1 Afghanistan www.kabulstockexchange.com 0
2 Bahrain www.bahrainstock.com 3
3 Cyprus www.cse.com 1
4 Palestina www.pse.com 0
5 Iran www.tse.or.id 4
6 Irak www.isxiq.net 1
7 Israel www.hebrew.tase.co.il 0
8 Jordan www.ase.com.jo 1
9 Kuwait www.kuawitse.com 2
10 Lebanon www.bse.com.lb 1
11 Oman www.ase.com.jo 1
12 Qatar www.dsm.co.qa 1
13 Saudi Arabia www.gulfbase.com 3
14 Syria www.syrialinks.com 1
82
15 Turkey www.ise.org 1
16 UAE www.adsm.co.ae 2
17 Yemen www.yemensites.com 1
South Asia
18 Bangladesh www.dsebd.org 1
19 Bhutan Unfinding website 0
20 India www.nseindia.com 1
21 Maladewa www. id.tixik.com 0
22 Nepal www.nepalstock.com 0
23 Pakistan www.kse.com.pk/www.lahorestock.com 2
24 Sri Lanka www.cse.lk 0
Midlle Asia
25 Kazakhstan www.kase.kz 0
26 Kirgizia www.questia.com 0
27 Uzbekistan www.uzse.uz 0
28 Tajikistan www.tajikgateway.org 0
29 Turkmenistan www.exchange.gov.tm 0
South East Asia
30 Kambodia ww.stockexchangecambodia.com 0
31 Laos no website 0
32 Vietnam www.vnstocks.com 0
33 Thailand www.set.or.th 1
34 Myanmar www.myanmar.gov.mm 0
35 Indonesia www.idx.go.id 1
36 Malaysia www.klse.co.my 1
37 Singapore www.ses.com.sg 1
38 Brunei Darussalam
Unfinding website 0
83
39 Philipine www.pise.org.ph 0
40 Timor Leste no website 0
East Asia
41 China www.sse.com.cn 0
42 Japan www.tse.or.jp/www.ose.or.jp 0
43 North Korea www.mapsofworld.com 0
44 South Korea www.kse.co.kr 0
45 Taiwan www.tse.com.tw 0
46 Hongkong www.hkex.com.hk 0
Amount 31
Appendix 2
Amount Purposive Sampling Islamic Bank Annual Report
84
85
No Islamic Bank Country Islamic Bank Website Annual Report Availability in
Website
Match on Purposivve Sampling
Yes No Yes No
1 Bank MuamalatIndonesia
Indonesia www.bankmuamalat.co.id √ √
2 Bank Islam Malaysia Berhad
Malaysia www.bankislam.co.my √ √
3 TheIslamic Bank of Asia
Singapore www.bankasia.co.sg √ √
4 Islamic Bank of Thailand
Thailand www.isbt.co.th √ √
5 Islamic Bank Bangladesh
Bangladesh www.islamibankbd.com √ √
6 Meezan Bank Pakistan www.meezanbank.com √ √
7Bank Islami Pakistan Limited
www.bankislami.com.pk √ √
8Al Salam Islamic Bank
Bahrain www.alsalambahrain.net √ √
9Bahrain Islamic Bank
www.bisbonline.com √ √
10Shameel Bank
www.shamilbank.net √ √
11 Bank TejaratIran www.tejaratbank.ir √ √
12
Bank Melli www.bmi.ir√
√
13 Bank Mellatwww.mellatbank.com √ √
14 Bank Refahwww.bankrefah.ir √ √
15 Ar Rajhi Islamic Bank Saudi Arabia www.alrajhibank.com.sa √ √


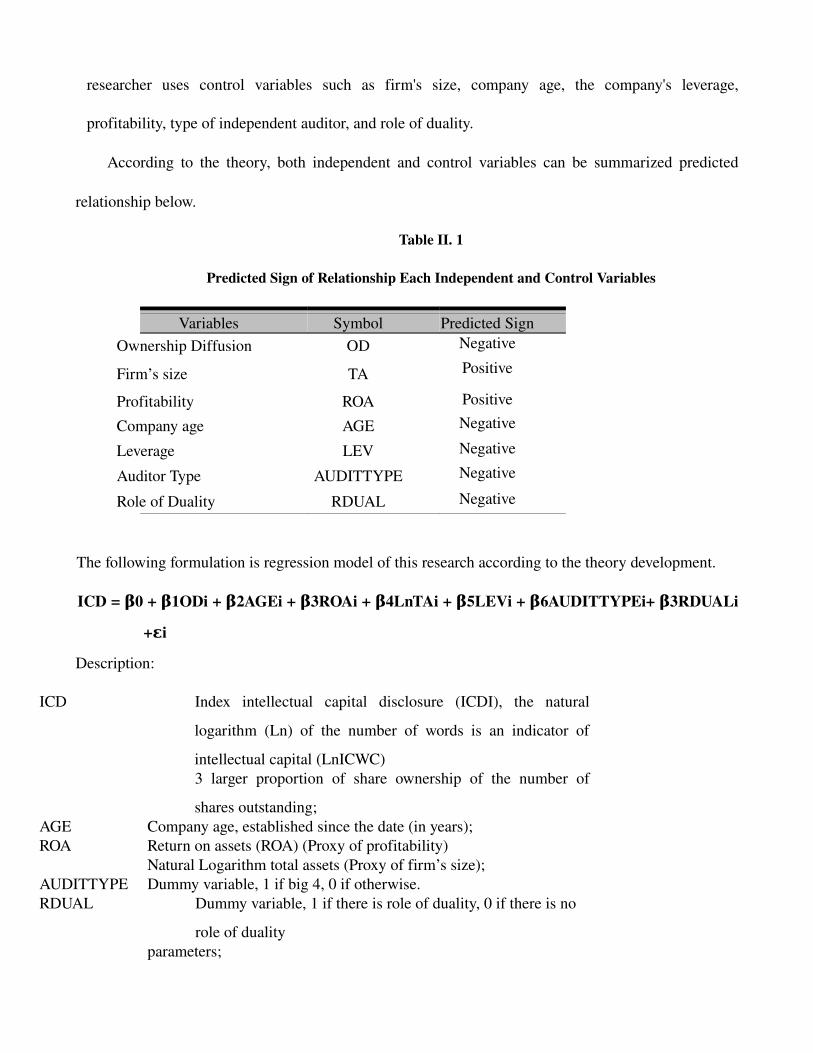


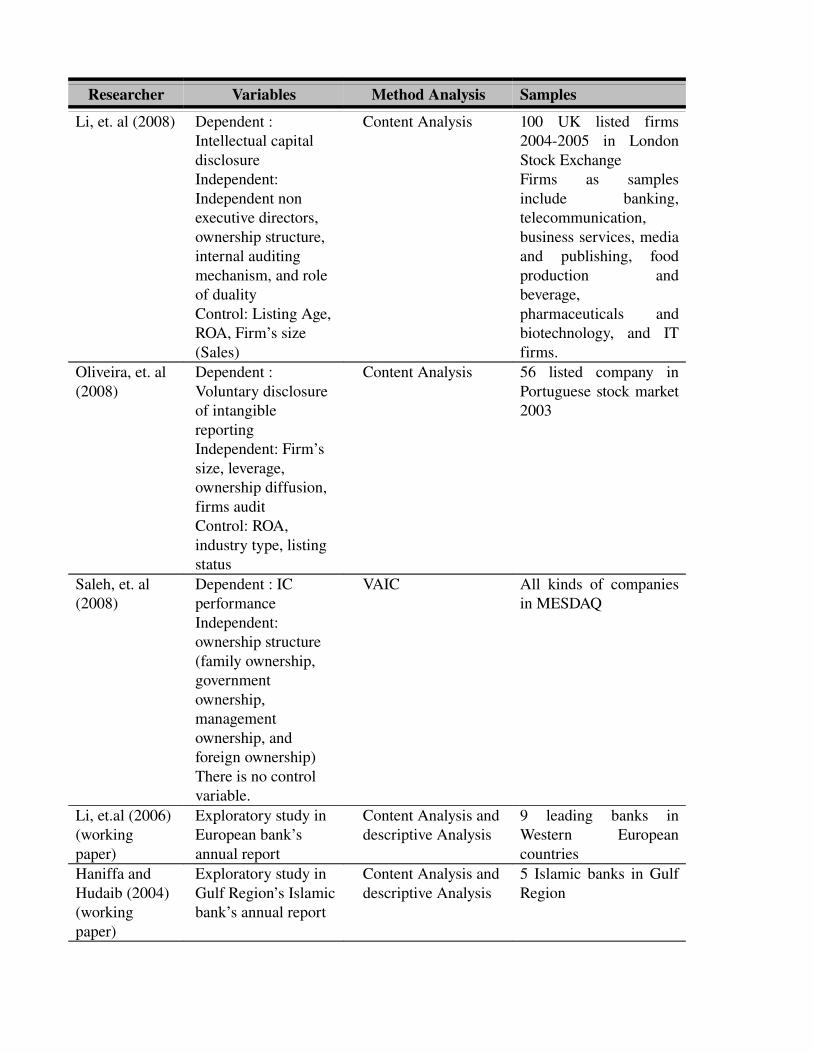

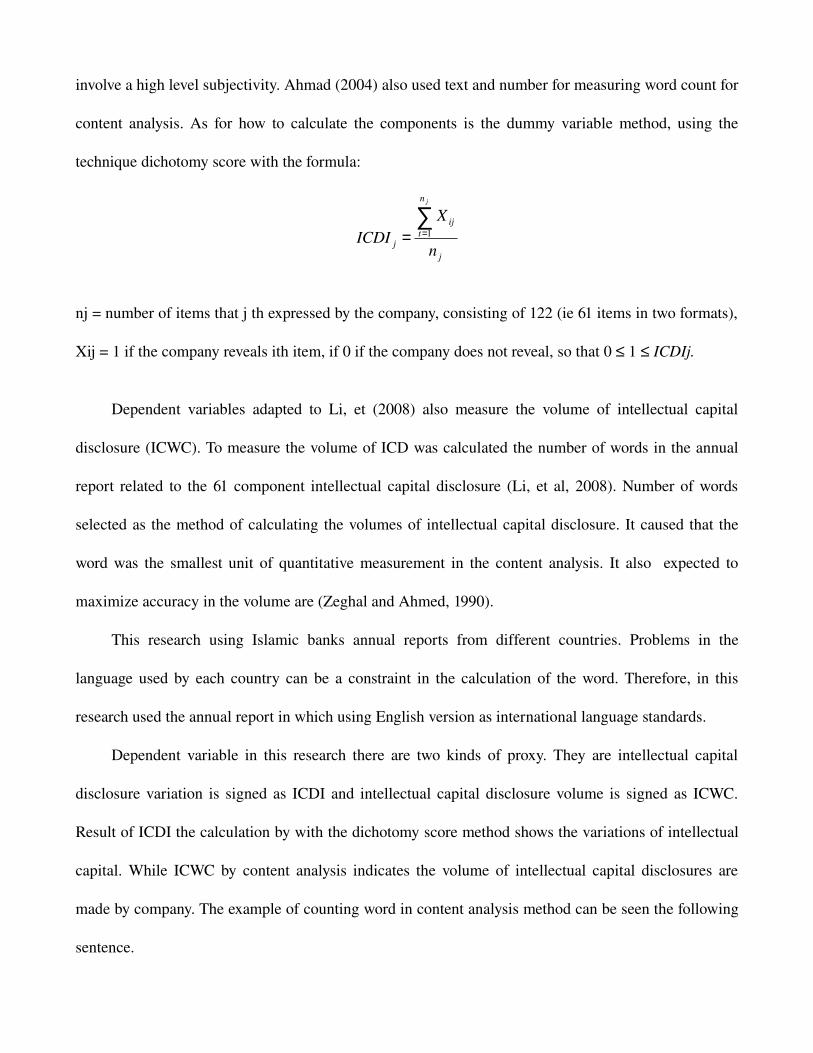
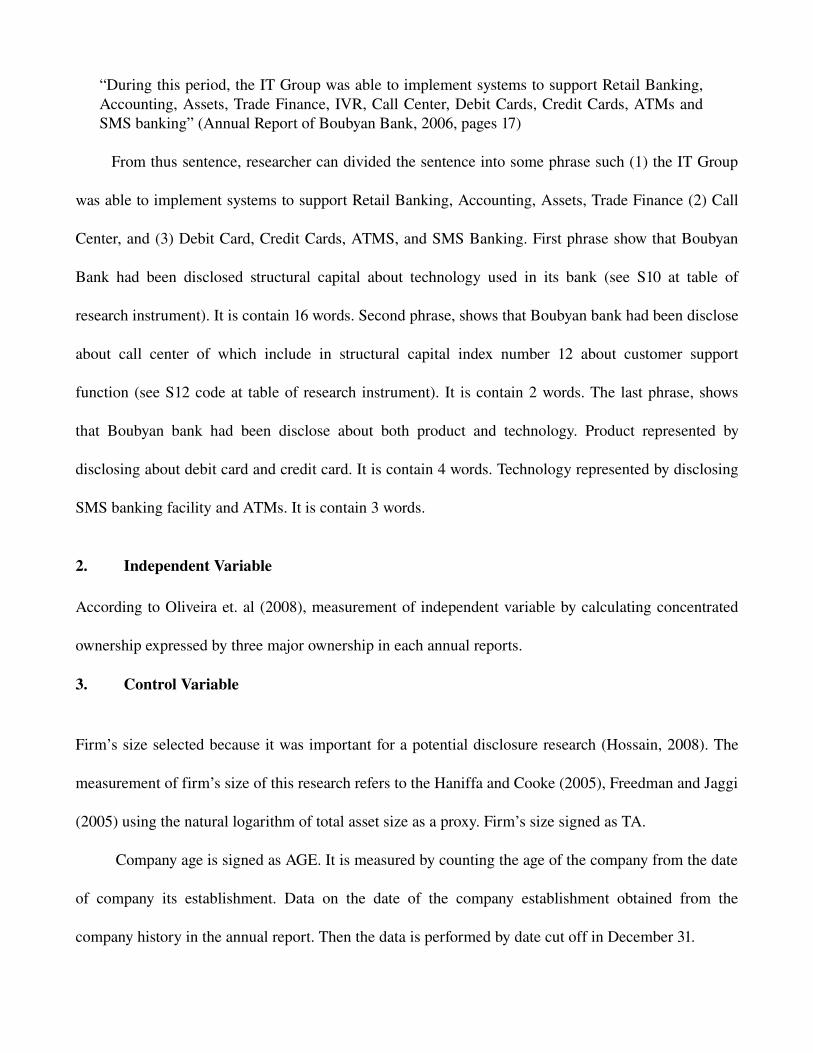


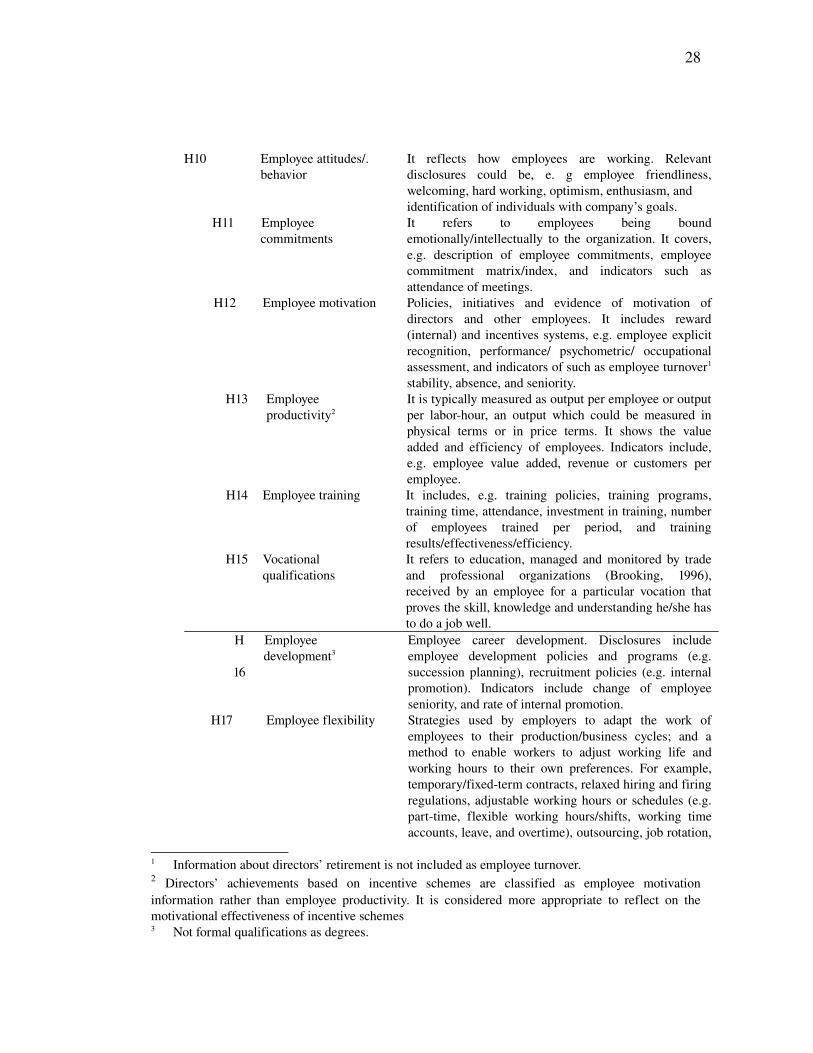


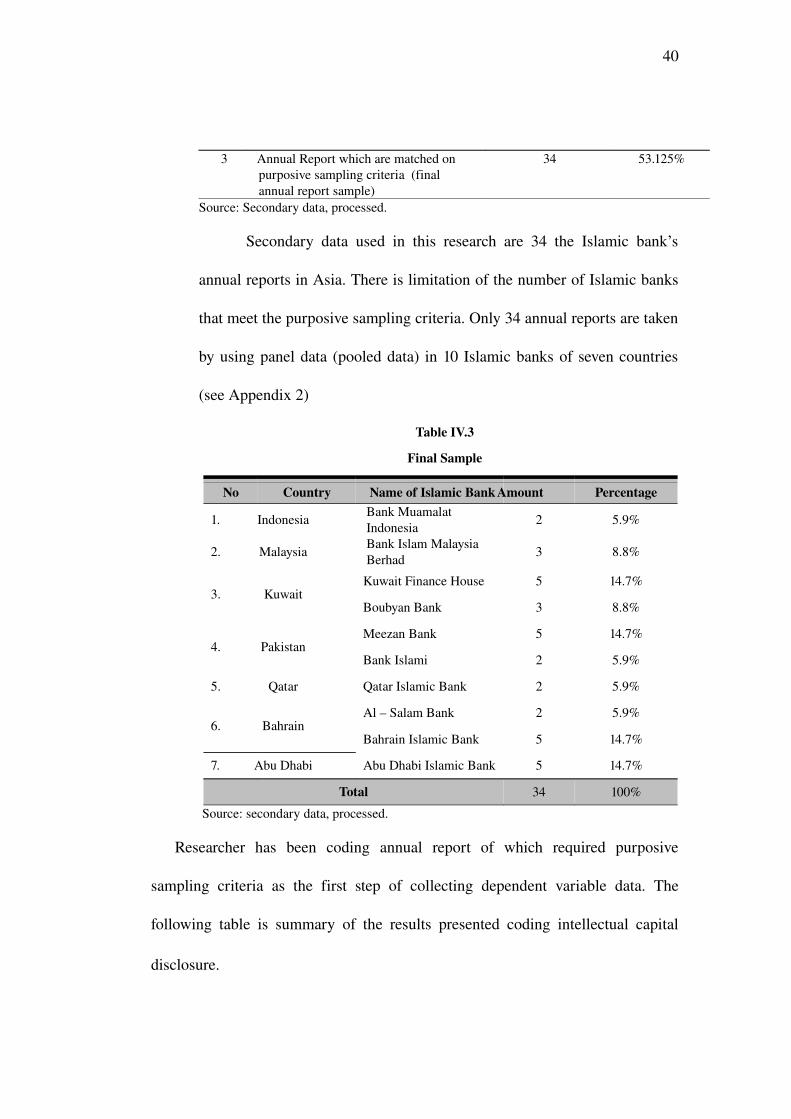


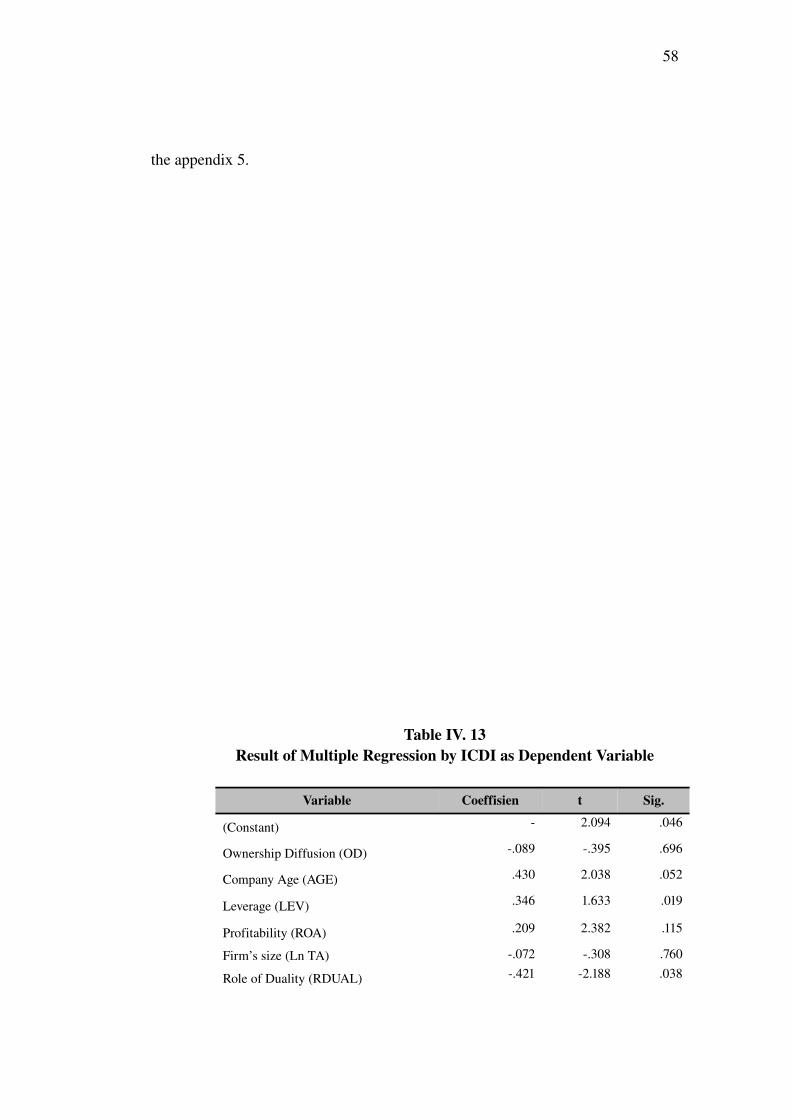


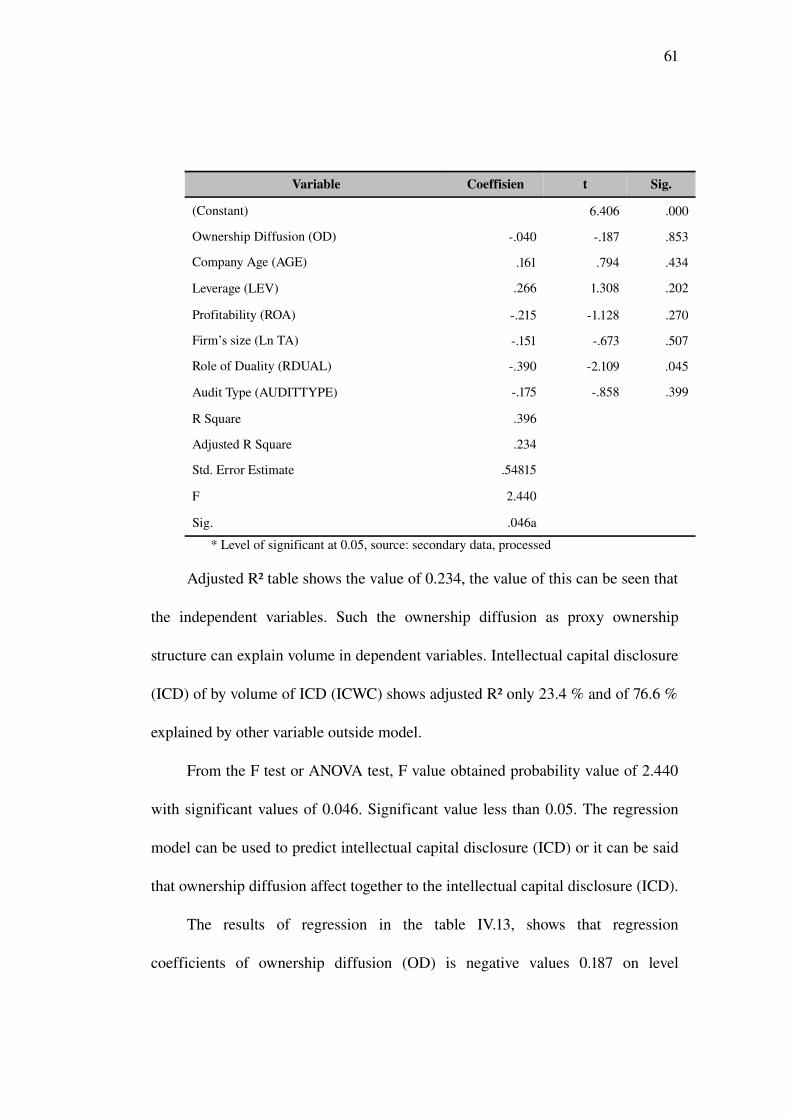


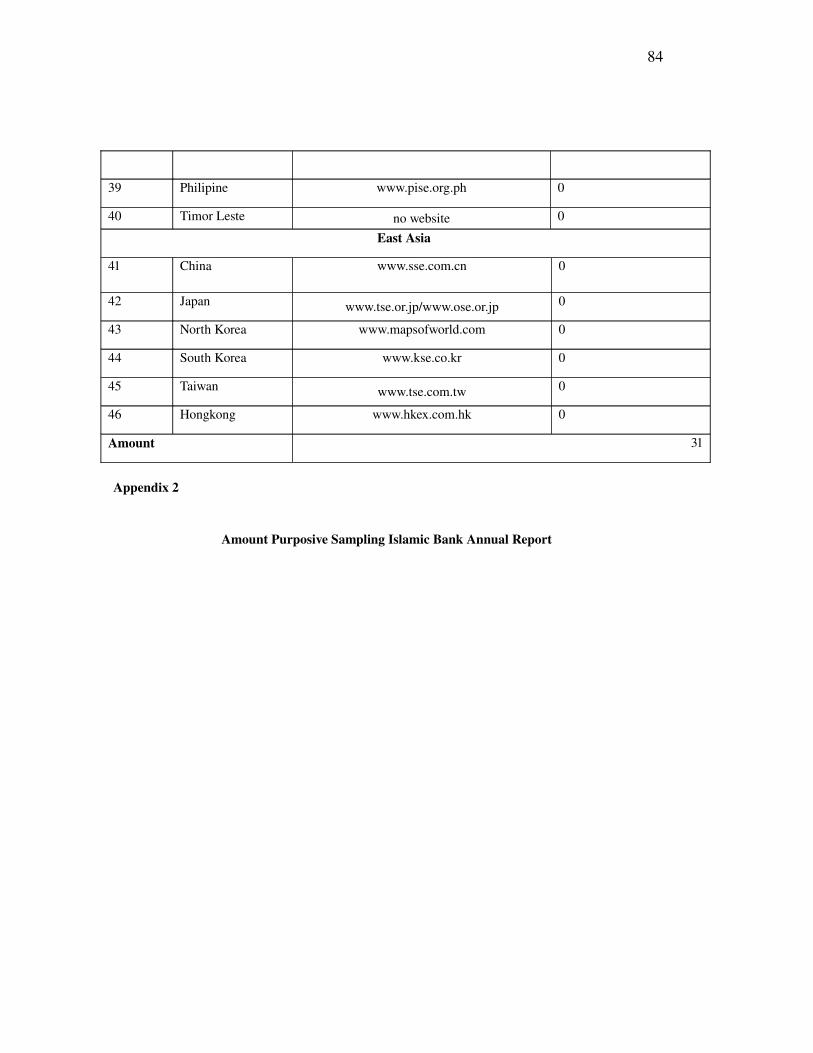


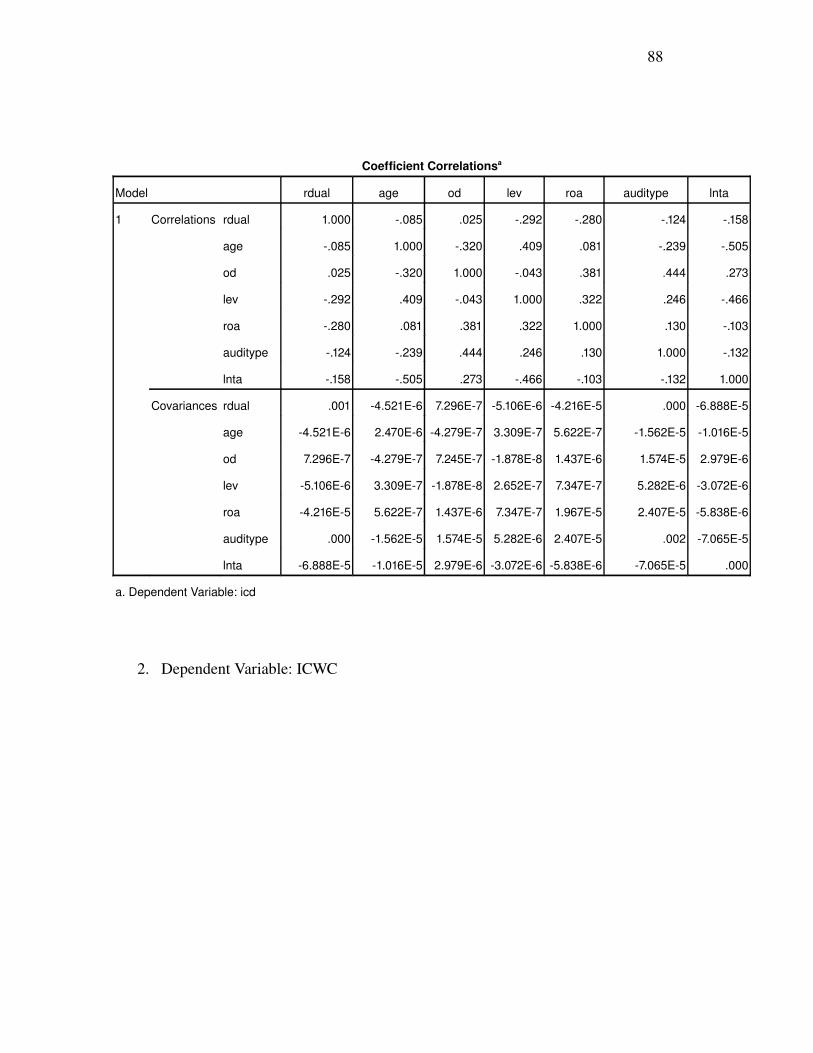


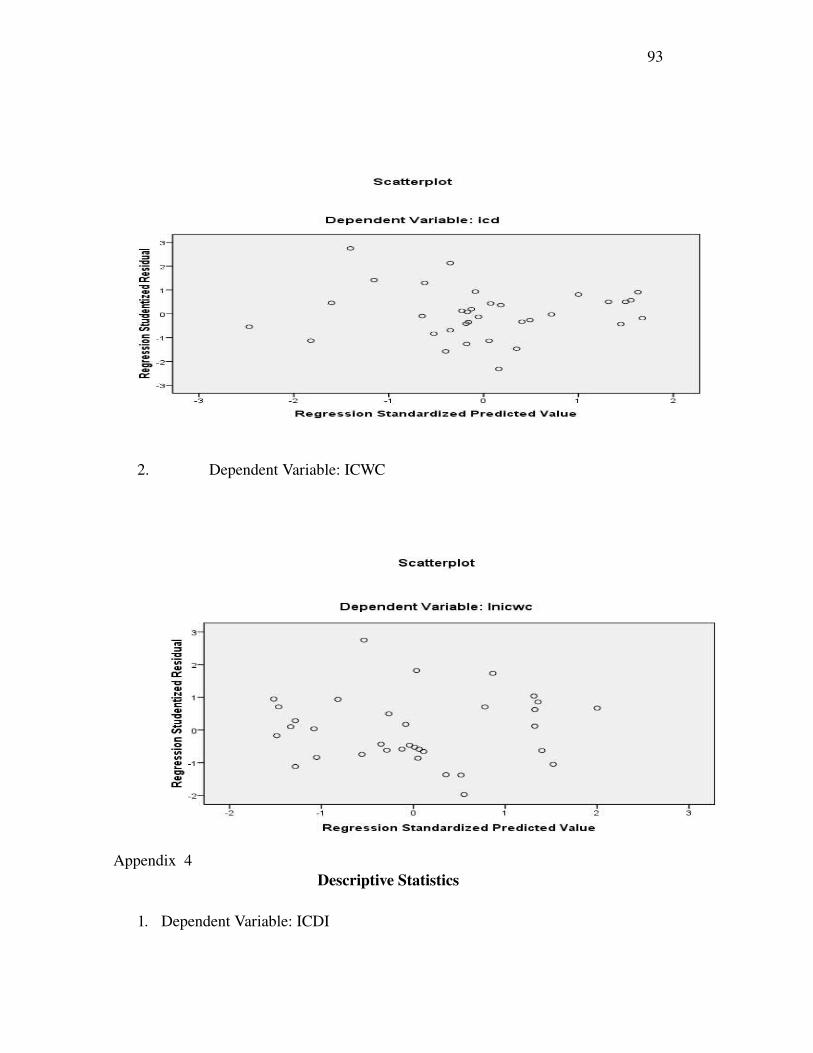

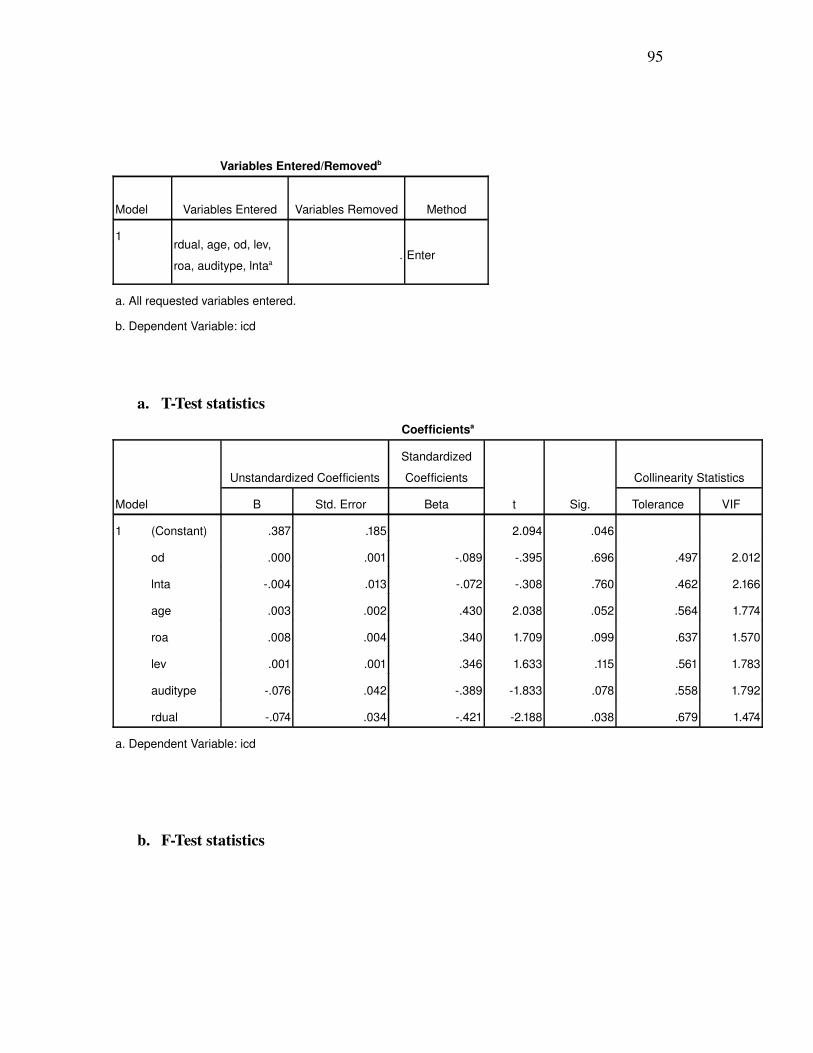

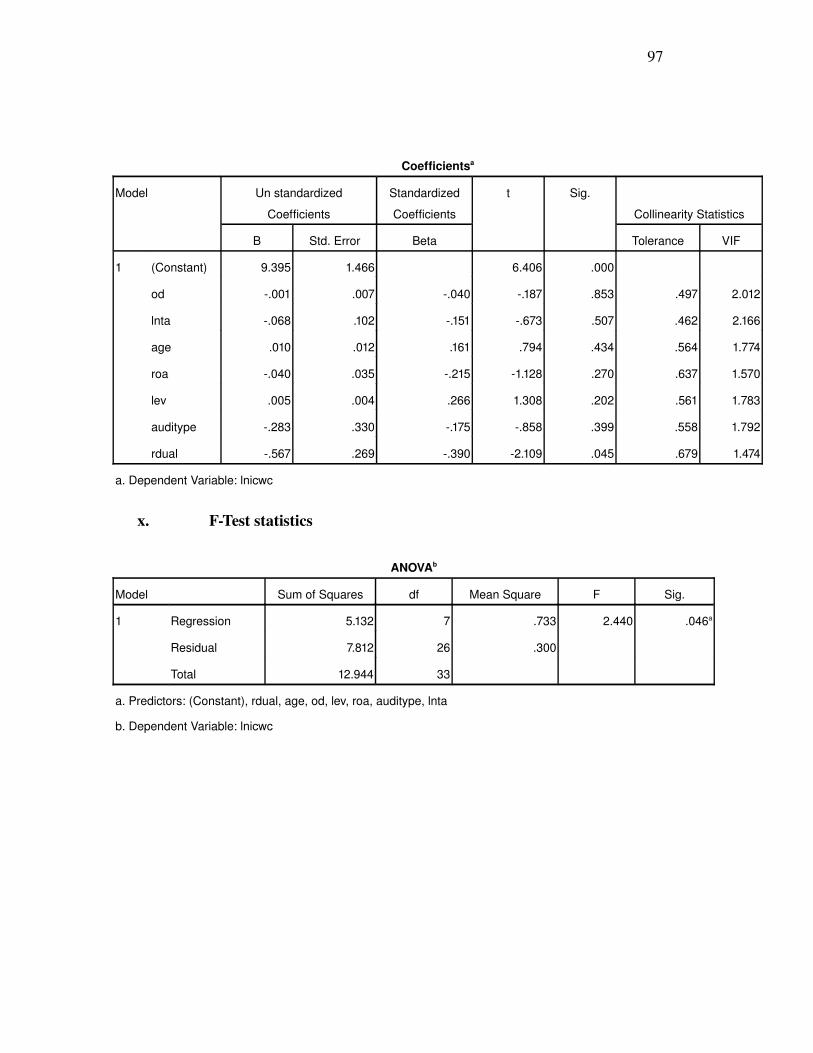


![[Slideshare] adab-lesson#10 [j]-(istiqomah-pleased)-2-may-2012](https://static.documents.pub/doc/80x56/54c8e1214a7959f80b8b45a9/slideshare-adab-lesson10-j-istiqomah-pleased-2-may-2012.jpg)


