724 TheStokes-Einstein Law for Diffusion in Solution. By Christina Cruickshank Miller, B.Sc., P h .D., Carnegie Research Scholar, Chemistry Department, University of Edinburgh. (Communicated by Sir James Walker, F.R.S.—Received July 18, 1924.) Einstein* has shown that the relation between molecular movement and diffusion in a liquid may be expressed by the following equation, when the particles move independently of each other :— ( 1 ) D being the diffusion constant and A2 the mean square of the deviation in a given direction in time t. Further, if it be assumed that the particles possess the same mean kinetic energy as gas molecules at the same temperature, the following equation holds -r2 2RT t N ’ C ( 2) where R is the gas constant, N Avogadro’s number, T the absolute temperature, and C a constant, which we might call the frictional resistance of the molecule. Hence, D RT 1 N * C* ( 3) Under the foregoing assumptions equations (2) and (3) hold equally well for dissolved molecules and particles of greater dimensions. Nowr, for spherical particles moving in a medium of proportionately small molecules, Stokes has shown that a hydrodynamic relation holds, namely :— C - 6rcZr, (4) where r is the radius of a diffusing particle and Z is the viscosity of the diffusion medium. By substitution in (3) we obtain for D the following relation :— D RT 1 N * 6tt Zr ( 5) This is known as the Stokes-Einstein equation, and is valid only when the aforementioned conditions are fulfilled. Equation (5) has been experimentally * ‘Ann. d. Physik’ (4), vol. 17, p. 549 (1905); vol. 19, p. 371 (1906); ‘Zeit. fur Elektrochem.,’ vol. 14, p. 235 (1908). on May 18, 2018 http://rspa.royalsocietypublishing.org/ Downloaded from
Transcript
724
The Stokes-Einstein Law for Diffusion in Solution.
By Christina Cruickshank Miller, B.Sc., P h .D., Carnegie Research Scholar, Chemistry Department, University of Edinburgh.
(Communicated by Sir James Walker, F.R.S.—Received July 18, 1924.)
Einstein* has shown that the relation between molecular movement and diffusion in a liquid may be expressed by the following equation, when the particles move independently of each other :—
( 1 )
D being the diffusion constant and A2 the mean square of the deviation in a given direction in time t. Further, if it be assumed that the particles possess the same mean kinetic energy as gas molecules at the same temperature, the following equation holds
-r2 2RT t N ’ C (2)
where R is the gas constant, N Avogadro’s number, T the absolute temperature, and C a constant, which we might call the frictional resistance of the molecule.
Hence,D RT 1
N * C* (3)
Under the foregoing assumptions equations (2) and (3) hold equally well for dissolved molecules and particles of greater dimensions.
Nowr, for spherical particles moving in a medium of proportionately small molecules, Stokes has shown that a hydrodynamic relation holds, namely :—
C - 6rcZr, (4)where r is the radius of a diffusing particle and Z is the viscosity of the diffusion medium.
By substitution in (3) we obtain for D the following relation :—
D RT 1N * 6ttZr
(5)
This is known as the Stokes-Einstein equation, and is valid only when the aforementioned conditions are fulfilled. Equation (5) has been experimentally
* ‘ Ann. d. P hysik ’ (4), vol. 17, p. 549 (1905); vol. 19, p. 371 (1906); ‘ Zeit. fur Elektrochem.,’ vol. 14, p. 235 (1908).
on May 18, 2018http://rspa.royalsocietypublishing.org/Downloaded from
The Stokes-Einstein Law fa Diffusion in Solution. 725
verified for the diffusion of the comparatively large particles of suspensoids. Within recent years attempts have been made to test its validity for diffusing molecules. This has been done in a number of ways.
Method 1.—The diffusion constant is determined for different substances in the same solvent at constant temperature, and r is calculated under the assumption that Dr is constant. The value of r can be ascertained by other methods, and a comparison drawn.
T. and A. A. Svedberg* found for the radius of the molecules of some organic substances values which at least roughly agree with our views of chemical structure. Oholmf doubted the validity of the equation.
Method2.—The influence of temperature is investigated for the same substance diffusing in the same solvent. J. D. R. and F. E. C. Scheffer! studied the diffusion of mannitol in water, and found that equation (5) is valid within the limits of experimental error. More recently, Cohen and Bruins§ determined the diffusion coefficients of tetrabromethane in tetrachlorethane at temperatures between 0° and 50° C. They concluded that there is a deviation from equation(5) in the sense that the temperature coefficient of the speed of diffusion is less than is to be expected.
Method 3.—The diffusion coefficient of a certain substance is estimated in different solvents at the same temperature. According to equation (5) the product DZ should be constant.
Thovert|| investigated the diffusion of phenol in ten different solvents, and found that DZ varied between the values of 92 and 99. Later he examined^ the diffusion of one hundred and thirty organic substances in water, methyl alcohol and benzene, and found that, in general, the diffusion constant tends to vary inversely as the viscosity of the solvent.
Oholm**, studying the diffusion of organic substances in water and ethyl alcohol, found that the viscosity coefficients of solutions of different substances and their inverse diffusibilities give values which run practically parallel. Later,** he found that the product DZ, for bromoform and glycerine diffusing in ether, acetone, benzene and various alcohols, is not constant. * * * § **
* ‘ Zeit. fur phys. Chem.,’ vol. 76, p. 145 (1911).f ‘ Meddel. Nobelinst.,’ vol. 2, Nr. 23 (1913).J * Proc. Kon. Akad. v. Wet. te Amsterdam,’ vol. 19, p. 148 (1916).§ ‘ Zeit. fiir pliys. Chem.,’ vol. 103, p. 404 (1923).|| ‘ C. R. Acad. Sc.,’ vol. 138, p. 481 (1904).If ‘ Ann. de Phys.,’ vol. 2, p. 415 (1914).
** ‘ Meddel. Nobelinst.,’ vol. 2, Nr. 24 (1913); vol. 2, Nr. 26 (1913).
on May 18, 2018http://rspa.royalsocietypublishing.org/Downloaded from
Bummer* found that, for a certain substance diffusing in different media, the molecular radius does not remain constant.
With regard to the relation between D and Z, it appears that variation in the value of D depends to a considerable extent on the variation of the viscosity of the solvent, but recent results indicate that the product DZ varies by an amount in excess of the experimental error.
It was sought to study further the effect of varying viscosity on the diffusion of dissolved molecules by performing experiments with iodine in dilute solution as the diffusing substance. The diffusion of iodine has not been previously studied to any extent. Eulerf quotes the values of the diffusion constant of iodine in water, benzene and carbon bisulphide. Edgar and DiggsJ found the diffusion constants of iodine in solutions of potassium iodide.
As solvents, organic liquids of varying chemical constitution were used. In addition, determinations were made of the diffusion constants of iodine in a number of aqueous salt solutions.
E xperimental.Diffusion Apparatus.
Graham’s second experimental method was adopted for the estimation of the diffusion constant. I t consists in layering a definite volume of solution beneath three times that volume of pure solvent. After a certain time the liquid is removed in four equal portions, which are reserved for analysis.
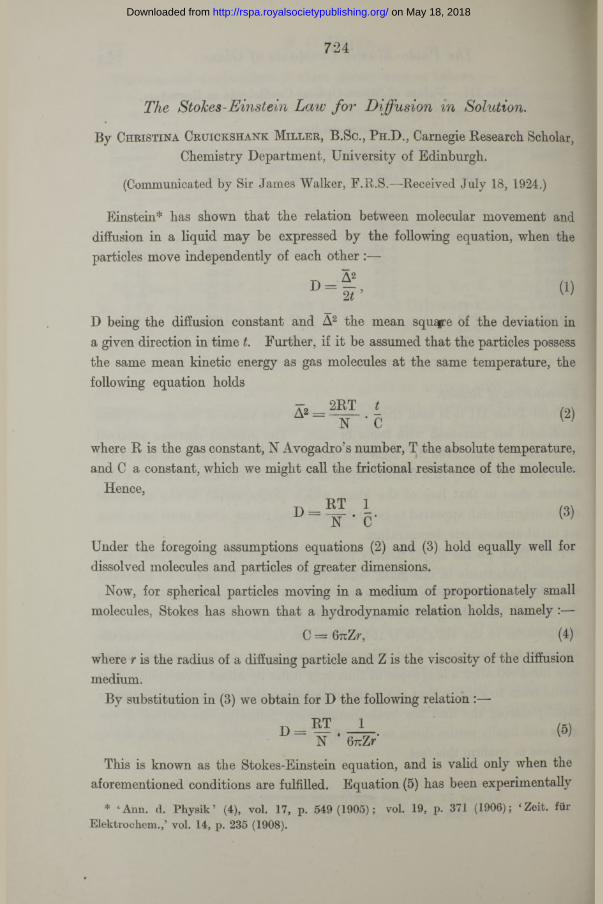
The apparatus used was very similar in form to Svedberg’s§ modification of Scheffer’s|| apparatus. From time to time, as need arose, slight alterations were made, and the ultimate form was that shown in the diagram.
The diffusion tube was made from uniform glass tubing one and a quarter inches wide, and had a flat bottom. I t was provided with a three-holed, tightly fitting rubber stopper, through which passed a small tap-funnel and a long capillary tube (a), reaching to the bottom of the diffusion tube. A small tube (b) gave an atmospheric connection, and could be attached to a gasometer when it was desired to remove the liquid through (a) by displacement with air. The lower half of the stem of the tap-funnel was made of capillary tubing, and on to the stop-cock was fused a long handle, which, when the apparatus was immersed, enabled one to turn the stop-cock without putting the hand in
* ‘ Zeit. fur anorg. Chem.,’ vol. 109, p. 31 (1919).t ‘ Wied. Ann.,’ vol. 63, p. 273 (1897).J ‘Jour. Amer. Chem. Soc.,’ vol. 38, p. 253 (1916).§ ‘ Zeit. fur phys. Chem.,’ vol. 76, p. 145 (1911).|| ‘ Zeit. fur phys. Chem.,’ vol. 2, p. 390 (1888).
on May 18, 2018http://rspa.royalsocietypublishing.org/Downloaded from
The Stokes-Einstein Law for Diffusion in Solution. 727
water. A piece of string tied between the neck of the tap-funnel and the handle prevented the latter from falling back too far. A small rubber stopper with a long narrow tube was placed in the neck of the tap-funnel.
Entrance of water into the apparatus was prevented by attaching to the end of (a) a small tube, as shown, and to (6) a calcium chloride tube. When the apparatus was immersed in water only the air connection tubes and the top part
, of (a) were above the surface.
Steady Temperature Surrounding for Diffusion Apparatus.Despite the fact that Kawalki* and others have found thermostats to be of
little use in work on diffusion, a thermostat was employed for a considerable time to give a constant temperature medium for the apparatus.
A large number of unsatisfactory results were obtained with organic solvents, and it was proved that the main disturbance was caused by convection currents.
* ‘Wied. Ann.,’ vol. 52, p. 177 (1894).
on May 18, 2018http://rspa.royalsocietypublishing.org/Downloaded from
The thermostat ultimately used was a large copper bath containing 200 litres of water. Temperature control was effected by means of a large thermo- regulator which just fitted into the bath. The regulator contained 650 c.c. of chloroform, a liquid which proved to be very suitable. In order to combat the effect of variable gas pressure, a gas-pressure regulator was specially designed by a member of the departmental staff.* After its installation no difficulty was experienced in maintaining temperature constant to 0-01° C. for weeks at a time.
The bath was stirred about 8 inches from the bottom by a brass paddle consisting of four six-inch blades. The stirring gear was fixed entirely apart from the bath, and driving power was derived from a hot-air engine. In order to have very vigorous stirring at certain times, perforated composition tubing was arranged on the bottom of the bath, and the tubing attached to an air blast.
A remarkable effect was observed during the performance of a large number of test experiments with organic solvents. Better results were obtained when cold tap-water was run into the bath at the foot and warm water removed at the surface, so that while the thermostat was in use tap-water was run into it, the quantity depending on the temperature. The temperature of the atmosphere also seemed to affect the experiments. I t is probable that certain combinations of the temperature of the atmosphere, and of the temperature and amount of cold water added, rendered the thermostat a suitable medium in which to perform diffusion experiments. In order to maintain a fairly steady temperature round the bath, a box of asbestos millboard was made to fit entirely over it.
Other experiments with organic solvents were performed with greater success in a thermostatic room. The diffusion tubes were placed in a large bath of water at room temperature. As a very slight rise or fall of temperature was sufficient to upset the experiments, the time spent in the room was reduced to the absolute minimum.
Volumes of Liquids Used.At the start of an experiment a diffusion tube contains four equal “ layers ”
of liquid, of which the upper three are pure solvent. In all the experiments for which results are quoted later 10 c.c. constituted a liquid “ layer.” It was thought that by using this volume the unavoidable experimental error was a minimum. As it was necessary to know h, half the height in cms. of a liquid layer, the diffusion tubes were carefully calibrated in the usual manner.
* W. Murray, ‘ Jour. Chem. Soc.,’ vol. 125, p. 461 (1924).
on May 18, 2018http://rspa.royalsocietypublishing.org/Downloaded from
The Stokes-Einstein Law for Diffusion in Solution. 29
Solvents Used.
Experiments were performed with the following liquids : methyl and ethyl alcohols, ether, ethyl and amyl acetates, acetic acid, anisole, phenetole, pentane, heptane, benzene, toluene, m-xylene, chloroform, carbon tetrachloride, carbon bisulphide, bromobenzene, ethylene dibromide, acetylene tetrabromide, methyl and ethyl iodides. These solvents were purified and dried before use.
Aqueous solutions of inorganic salts were also used as solvents for iodine. The salts chosen wTere the bromides and iodides of sodium, potassium and ammonium. They were thoroughly dried and made up in solutions of strengths, one, two, three and four times normal.
Normality of Iodine Solutions.
Fairly concentrated solutions have, as a rule, been used in diffusion experiments. Thus, Oholm* used chiefly normal and half-normal solutions, and Dummerj* 10-20 per cent, solutions. Thovert, j however, used only 2 per cent, solutions in most of his researches.
More concordant values of the diffusion constant are obtained by the use of concentrated solutions owing to the greater density difference between solvent and solution. Since, however, the Stokes-Einstein equation pre-supposes a dilute solution of the diffusing substance, it is advisable to keep the concentration as low as possible. The diffusion constant changes with decreasing concentration of the diffusing substance to a limiting value. If, therefore, values of the diffusion constant are obtained at high concentrations, it is necessary to obtain the limiting value by extrapolation, a procedure which is not very satisfactory.
Accordingly, in the following experiments with organic solvents the iodine solutions used were about 0 • 10 normal. In the case of the aqueous salt solutions the strength of the iodine was 0-05 normal, except for normal bromide solutions, where the normality had to be reduced to 0-02-0-025 owing to the slight solubility of the iodine.
Prevention of Leakage in the Stop-cocks of the Tap-funnels.I t was necessary to ensure that there wras no leakage of iodine solution
through the closed stop-cocks, and to have the ends of the latter protected from the entrance of water.
* * Meddel. Nobelinst.,’ vol. 2, Nr. 26 (1913).-j- ‘ Zeit. fur anorg. Chem.,’ vol. 109, p. 31 (1919).J ‘ Ann. de Phys.,’ vol. 2, p. 369 (1914).
on May 18, 2018http://rspa.royalsocietypublishing.org/Downloaded from
When liquids, insoluble in phosphoric acid, were in use, a few drops of syrupy phosphoric acid were placed on the centre part of the stop-cock, and the end parts were smeared with vaseline. With aqueous solutions the whole stop-cock was smeared with vaseline, and with alcohols it was smeared with melted rubber. The use of ethyl acetate as a solvent presented difficulties owing to the readiness with which it dissolved vaseline, melted rubber, phosphoric acid and water. A moderately concentrated sugar solution was ultimately used on the centre part of the stop-cock. As before, vaseline protected the ends.
Performance of Experiments.
Solvent and solution were heated up to 20° C., the temperature of experiment, and 30 c.c. of solvent were measured into a diffusion tube. The stem of the tap- funnel was filled by suction with iodine solution. Into the bulb (c) of the tap- funnel was measured, roughly, 10 c.c. of the same solution, which was then allowed to run out until the bulb was just empty. Thereupon a small air bubble and a length of about 5 cms. of pure solvent were sucked into the capillary part of the stem of the tap-funnel. The reasons for this were as follows :—Experiment has shown that when the stem of the tap-funnel was completely filled with iodine solution, iodine diffused prematurely from the foot of the stem, and, further, that when this occurred the experiment was very often a failure. By observing the air bubble it was also possible to regulate to a certain extent the rate of entry of iodine solution into the diffusion tube. The escape of the air bubble through the liquid had no disturbing effect.
With aqueous solutions it was better to have no air bubble in the stem of the tap-funnel, as the pressure necessary to dislodge the bubble caused the iodine solution to rush suddenly into the tube.
10 c.c. of a standardised iodine solution were next measured into the bulb of the tap-funnel, and allowance was made for the small quantity which later passed into the long capillary exit tube. When the stopper and fittings of the diffusion tube were fixed in position the whole apparatus was immersed in the thermostat water until, as already indicated, only the capillary exit tube (a) and the air-connection tubes were above the surface of the water. The tube was clamped in a vertical position.
The apparatus was left untouched for two or more hours, and then the iodine solution was run carefully under the pure solvent. The time taken was usually 5-15 minutes. Undue extension of the time did not appear to be a benefit, and it seemed that the speed of addition did not matter a great deal, provided that the iodine solution passed smoothly under the solvent.
on May 18, 2018http://rspa.royalsocietypublishing.org/Downloaded from
The Stokes-Einstein Law for Diffusion in Solution. 731
The final operation was the removal of the four liquid layers by displacement with air. The level of water in the bath was lowered to one-half inch below the end of the long capillary tube (a). Just beneath the end of (a) was brought a 10 c.c. standard bulb tube, with a long narrow neck. The bulb tube was then raised up and supported, so that its neck fitted over (a) and the bulb part remained immersed. Liquid was thus collected at thermostat temperature. Along with the first 10 c.c. was collected the small amount of liquid in the capillary tube during the experiment. The time taken to collect a layer was usually 5-10 minutes.
The amount of iodine in the layers was estimated with a solution of sodium thiosulphate ten times weaker than the original iodine solution. An iodine solution half the strength of the thiosulphate was used for titrating back.
The number of experiments simultaneously performed for one solvent was, on an average, three.
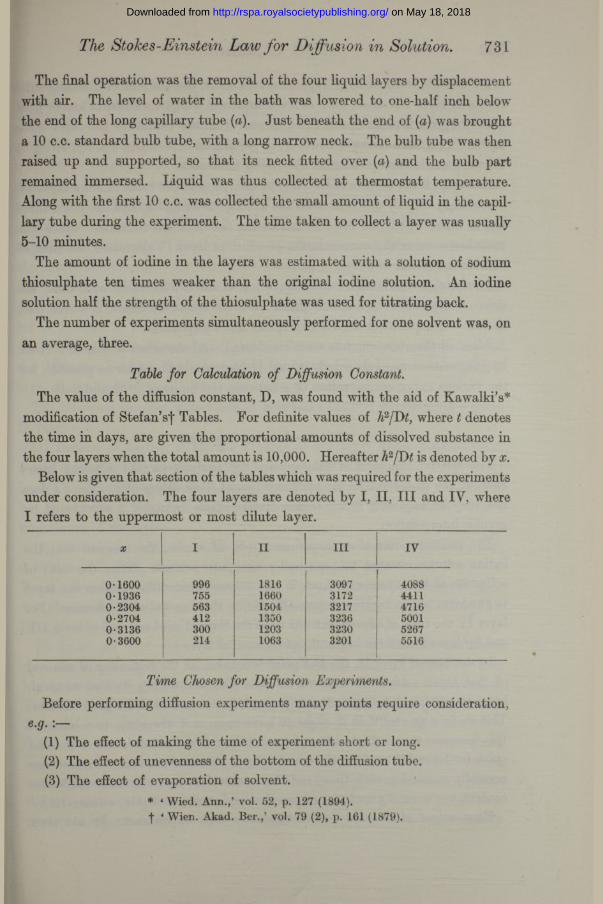
Table for Calculation of Diffusion Constant.The value of the diffusion constant, D, was found with the aid of Kawalki’s*
modification of Stefan’sf Tables. For definite values of h2/Dt, where t denotes the time in days, are given the proportional amounts of dissolved substance in the four layers when the total amount is 10,000. Hereafter h2/J)t is denoted by x.
Below is given that section of the tables which was required for the experiments under consideration. The four layers are denoted by I, II, III and IV, where I refers to the uppermost or most dilute layer.
Time Chosen for Diffusion Experiments.Before performing diffusion experiments many points require consideration,
e.y. .(1) The effect of making the time of experiment short or long.(2) The effect of unevenness of the bottom of the diffusion tube.(3) The effect of evaporation of solvent.
* ‘ Wied. Ann.,’ vol. 52, p. 127 (1894). f ‘Wien. Akad. Ber.,’ vol. 79 (2), p. 161 (1879).
on May 18, 2018http://rspa.royalsocietypublishing.org/Downloaded from
First of all, if the time of experiment be short, the amount of diffusing substance in layer I is small, and, as a consequence, a slight accidental loss or gain of solute gives a value of x rather different from the values for the other three layers. I t is not advisable, however, to prolong an experiment unduly, owing to the existence of many external disturbing influences.
Secondly, if the bottom of the tube be uneven, and the value of for layer IY accordingly slightly different from the average determined from the other three layers, there will be an error in estimating the diffusion constant. Since this error increases as the concentration of solute in layer IV decreases, the time of experiment should be short.
Lastly, since the amount of evaporation of solvent increases with time, the time of experiment should be short. On the whole, therefore, it seems that the time of experiment should be kept as short as possible.
After all the above factors were considered, and the effect of loss of solvent by evaporation was calculated, it was decided to obtain as far as possible, for the various experiments, values of x between the limits of 0 • 32 and 0 • 19.
Calculation of R esults.
The relative amounts of solute found by analysis for the different layers enabled one to determine, for each experiment, four values of x. Since x does not vary linearly with concentration, intermediate values of x were found by graphic interpolation.
The starting point of an experiment was, of course, the moment that the iodine solution started to pass under the pure solvent. Since the time of collection of the layers was short, it was assumed that diffusion from one layer to the layer above continued normally during the removal of the former. For layer IY the time of experiment was until the beginning of removal of layer III, and for layer I until the beginning of removal of layer I.
In the case of layer II, the end point was taken as the beginning of removal of that layer. After the removal of layer III, and during its own removal, layer II continued to lose iodine to layer I, but ceased to make good the loss. This made x greater than it ought to have been, and, therefore, to counteract this increase, the smallest value of t was taken. In a similar manner the end point for layer III was the same as for layer IV when the iodine content was normally increasing with time, and the same as for layer II when the iodine content was normally decreasing from the maximum (see Table, column III).
Four values of D were thus obtained for each experiment. It was then
on May 18, 2018http://rspa.royalsocietypublishing.org/Downloaded from
The Stokes-Einstein Law fo r Diffusion in Solution. 733
necessary to calculate from these a mean value, taking into account the fact that they were not of the same relative importance.
Kawalki and later investigators determined the mean D value in the following way. They multiplied D for each layer by the theoretical change, P, in the quantity of solute, determined from tables, between values of x directly above and below the x value obtained by experiment. The sum of the four products was thereupon divided by the sum of the four P values.
This method was not considered entirely satisfactory for the majority of the experiments performed. First of all, for a perfectly normal diffusion experiment the four D values ought to be the same. Owing, however, to the many disturbing influences this was rarely the case. I t was found that, for a number of experiments with a given solvent, layer IV usually offered a fairly constant value for D, in spite of irregularity in the values given by the other layers. After careful study it was assumed that, when diffusion did not proceed too far, and the difference between the values of D for layers I and II was under 20 per cent., the value for layer IY was approximately correct.
The following changes were made in Kawalki’s method of obtaining a mean D value:—
(1) Instead of finding P for the x value of the layer under consideration, P was determined for each layer, for the supposedly normal value of x given by layer IV. Disturbing influences caused deviations from the normal values of x, but it was the P values of these normal values which indicated the relative importance of the layers.
(2) Instead of taking the same P values for all values of x between, say, 0-2704 and 0-2304, curves were drawn showing the variation of P with x. P was taken for a difference in xof 0-01. From the curves a definite P value was obtainable for every value of x. By determining P for layers I, II and IV for a given value of x, the P value of layer III was calculable.
(3) In 80 per cent, of the satisfactory experiments performed it was found that the D value of layer III was greater than the D value of layer IV. It is highly probable that convection currents were responsible for the discrepancies. For moderately satisfactory experiments they affected layers I, II and III. Layer III lost iodine, which was gained by layers I and II. For values of x below 0-275, the loss of iodine in layer III caused a decrease in x, and consequent increase in the normal D value. The gain of iodine in layers I and II caused once more a decrease in x and increase in D. In other words, the two effects did not counteract each other. As so many experiments were affected to a greater or less extent by convection currents, it was thought that a more nearly
on May 18, 2018http://rspa.royalsocietypublishing.org/Downloaded from
correct mean value of D would be obtained by subtracting the DP value for layer III from the sum of the other three, and dividing the resultant number by the corresponding algebraic sum of the P values.
When the normal value of x slightly exceeded 0-275, but layer III contained less than the normal amount of iodine, there were two possible values of x. The lower value was, however, chosen. I t was assumed that since, normally, layer III would have contained almost the maximum amount of solute, disturbing influences had caused the maximum to be reached and passed.
There was no justification for the use of section (3) of the new method of calculation in those cases where convection currents had not arisen, and the chief error was probably one of analysis. I t was difficult, however, to set a limit to its applicability, and therefore, as its use appeared to be justifiable for the majority of the experiments, it was used for all. With the most satisfactory experiments there was little difference in the results obtained by Kawalki’s method and the new method.
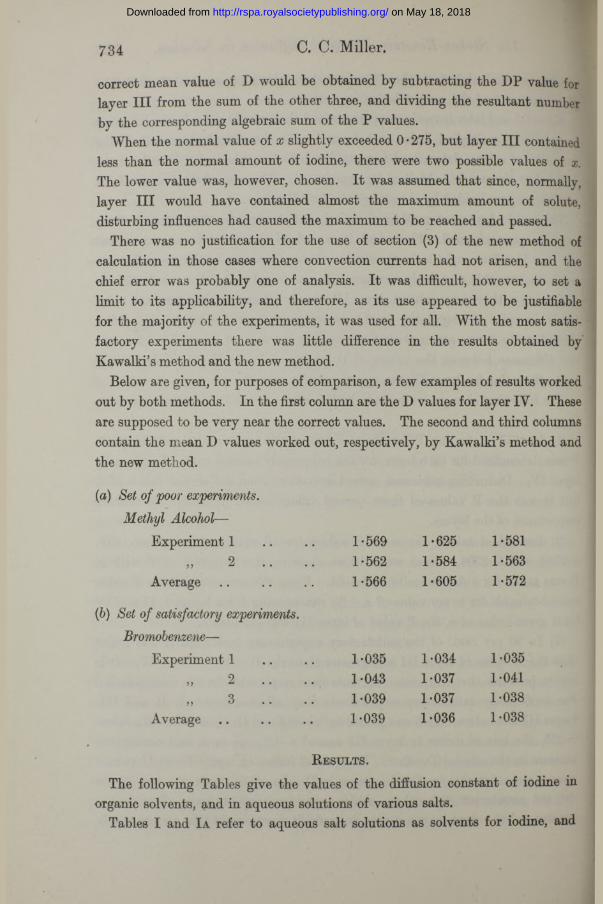
Below are given, for purposes of comparison, a few examples of results worked out by both methods. In the first column are the D values for layer IV. These are supposed to be very near the correct values. The second and third columns contain the mean D values worked out, respectively, by Kawalki’s method and the new method.
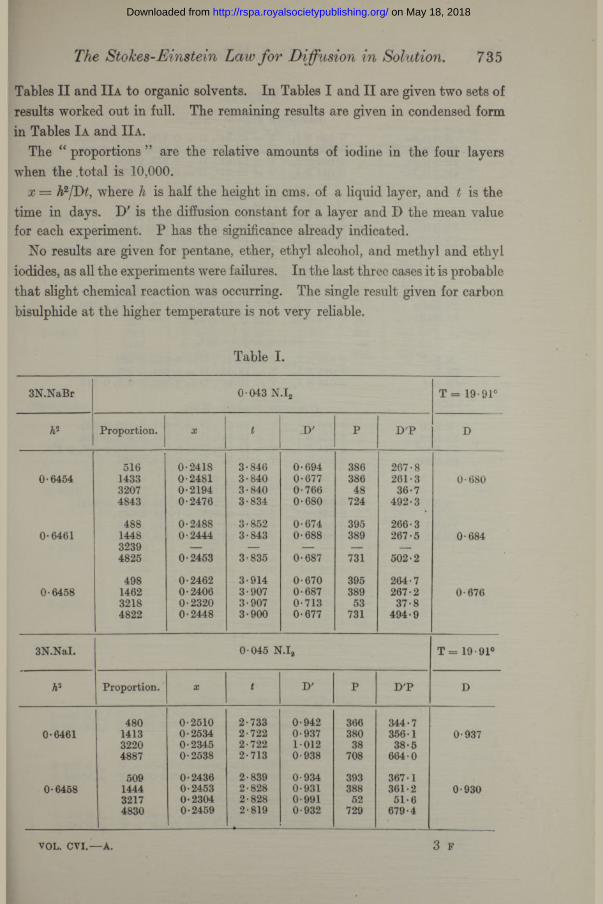
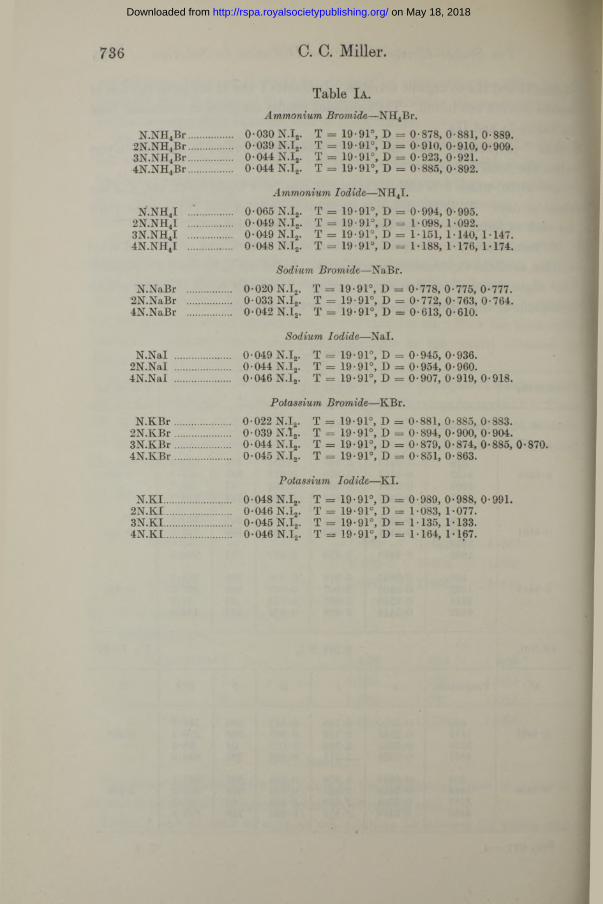
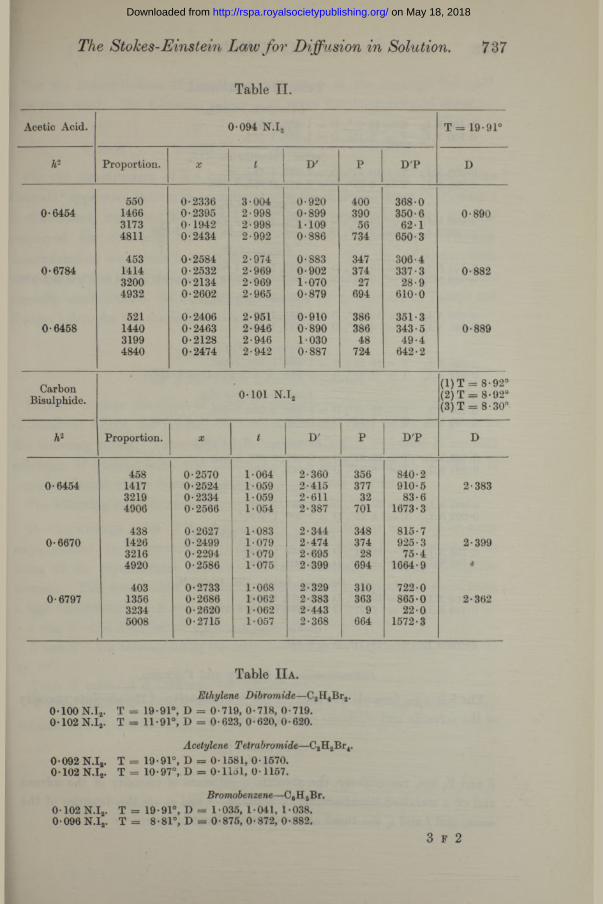
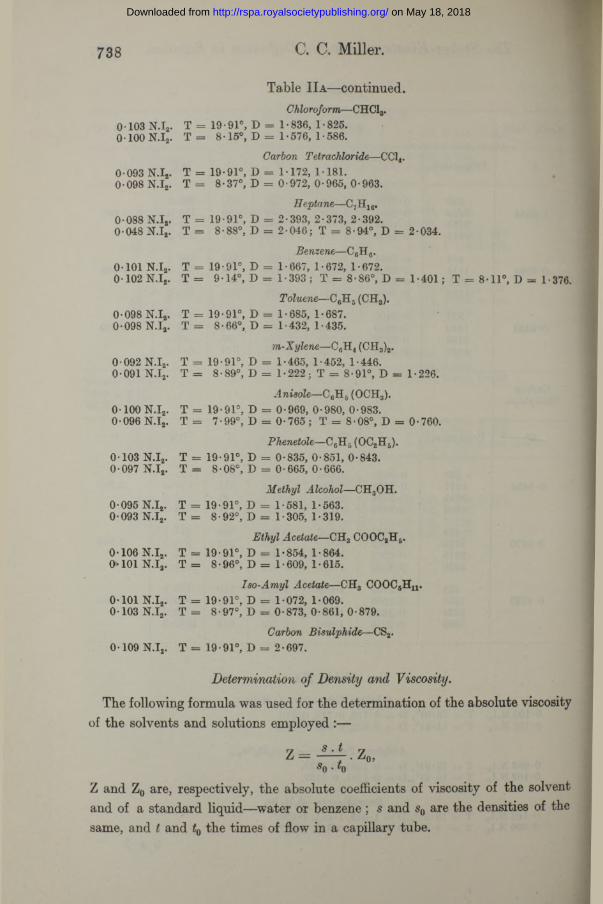
Tables II and I Ia to organic solvents. In Tables I and II are given two sets of results worked out in full. Tbe remaining results are given in condensed form in Tables Ia and I Ia.
Tbe “ proportions ” are tbe relative amounts of iodine in tbe four layers when tbe .total is 10,000.
x — h2/Dt, where h is half tbe height in cms. of a liquid layer, and t is tbe time in days. D' is tbe diffusion constant for a layer and D the mean value for each experiment. P has tbe significance already indicated.
No results are given for pentane, ether, ethyl alcohol, and methyl and ethyl iodides, as all the experiments were failures. In the last three cases it is probable that slight chemical reaction was occurring. The single result given for carbon bisulphide at the higher temperature is not very reliable.
The Stokes-Einstein Law for Diffusion in Sohition. 735
N.NH4B r............... 0-030 N.I2. T = 19-91°, D = 0-878, 0-881, 0-889.2N.NH4B r............... 0-039 N.I2. T = 19-91°, D = 0-910, 0-910, 0-909.3N.NH4Br............... 0-044 N.I2. T = 19 -91°, D = 0-923, 0-921.4N.NH4B r............... 0-044 N.I2. T = 19-91°, D = 0-885, 0-892.
Ammonium Iodide—NH4I.
N.NH4I . .............. 0-065 N.I2. T = 19-91°, D = 0-994, 0-995.2N.NH4I ................ 0-049 N.I2. T = 19-91°, D = 1-098, 1-092.3N.NH4I ............... 0-049 N.I2. T = 19-91°, D = 1-151, 1-140, 1-147.4N.NHJ ................ 0-048 N.I2. T = 19-91°, D = 1-188, 1-176, 1-174.
Sodium Bromide—NaBr.
N.NaBr ............... 0-020 N.I2. T = 19-91°, D = 0-778, 0-775, 0-777.2N.NaBr ................ 0-033 N.I2. T = 19-91°, D = 0-772, 0-763, 0-764.4N.NaBr ................ 0-042 N.I2. T = 19-91°, D = 0-613, 0-610.
Sodium Iodide—Nal.
N.Nal .................... 0-049 N.I2. T = 19-91°, D = 0-945, 0-936.2N.NaI .................... 0-044 N.I2. T = 19-91°, D = 0-954, 0-960.4N.NaI .................... 0-046 N.I2. T = 19-91°, D = 0-907, 0-919, 0-918.
Potassium Bromide—KBr.N .K B r.................... 0-022 N.I2. T = 19-91°, D = 0-881, 0-885, 0-883.
2N .K Br.................... 0-039 N.I2. T = 19-91°, D = 0-894, 0-900, 0-904.3N .K Br.................... 0-044 N.I2. T = 19-91°, D = 0-879, 0-874, 0-885, 0-870.4N .K B r.................... 0-045 N.I2. T = 19-91°, D = 0-851, 0-863.
Potassium Iodide—KI.
N.KI........................ 0-048 N.I2. T = 19-91°, D = 0-989, 0-988, 0-991.2N.KI........................ 0-046 N.I2. T = 19-91°, D = 1-083, 1-077.3N.KI........................ 0-045 N.I2. T = 19-91°, D = 1-135, 1-133.4N.KI........................ 0-046 N.I2. T = 19-91°, D = 1-164, 1-167.
on May 18, 2018http://rspa.royalsocietypublishing.org/Downloaded from
Chloroform—CHC13.0-103 N.I2. T = 19-91°, D = 1-836, 1 ■ 825.0-100 N.I2. T — 8-15°, D = 1-576, 1-586.
Carbon Tetrachloride—CC14.0-093 N.I2. T = 19-91°, D = 1-172, 1-181.0-098 N.I2. T = 8-37°, D = 0-972, 0-965, 0-963.
Heptane—C7H16.0-088 N.I2. T = 19-91°, D = 2-393, 2-373, 2-392.0-048 N.I2. T = 8-88°, D = 2-046; T = 8-94°, D = 2-034.
Benzene—C6H8.0-101 N.I2. T = 19-91°, D = 1-667, 1-672, 1-672.0-102 N.I2. T = 9-14°, D = 1-393; T = 8-86°, D == 1-401 ; T == 8-11°, D = 1-376.
Toluene—C6H3 (CH3).0-098 N.I2. T = 19-91°, D = 1-685, 1-687.0 • 098 N.Ia. T = 8 • 66°, D = 1 • 432, 1 • 435.
m-Xylene—C6H4 (CH3)2.0-092 N.I2. T = 19-91°, D = 1-465, 1-452, 1-446.0-091 N.I2. T = 8-89°, D = 1-222; T = 8-91°, D = 1-226.
Anisole—C6H5 (OCH3).0-100 N.I2. T = 19-91°, D = 0-969, 0-980, 0-983.0-096 N.I2. T = 7-99°, D = 0-765; T = 8-08°, D = 0-760.
Phenetole—C6H5 (OC2H5).0-103 N.I2. T = 19-91°, D = 0-835, 0-851, 0-843.0-097 N.I2. T = 8-08°, D = 0-665, 0-666.
Methyl Alcohol—CH3OH.0-095 N.I2. T = 19-91°, D = 1-581, 1-563.0-093 N.I2. T = 8-92°, D = 1-305, 1-319.
Ethyl Acetate—CH3 COOC2H5.0-106 N.I2. T = 19-91°, T> =1-854, 1-864.0-101N .I2. T = 8-96°, D = 1-609, 1-615.
Iso-Amyl Acetate—CH3 COOC5Hu .0-101 N.I2. T = 19-91°, D = 1-072, 1-069.0-103 N.I2. T = 8-97°, D = 0-873, 0-861, 0-879.
Carbon Bisulphide—CS2.0-109 N.I2. T = 19-91°, D = 2-697.
Determination of Density and Viscosity.The following formula was used for the determination of the absolute viscosity
of the solvents and solutions employed :—
Z and Z0 are, respectively, the absolute coefficients of viscosity of the solvent and of a standard liquid—water or benzene ; s and s0 are the densities of the same, and t and t0 the times of flow in a capillary tube.
on May 18, 2018http://rspa.royalsocietypublishing.org/Downloaded from
The Stokes-Einstein Law for Diffusion in Solution. 739
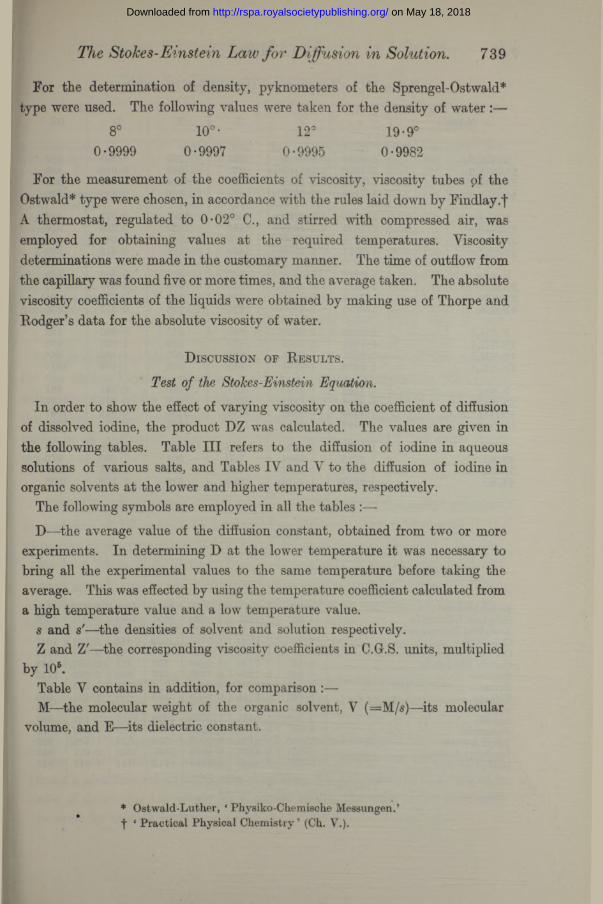
For the determination of density, pyknometers of the Sprengel-Ostwald* type were used. The following values were taken for the density of water :—
8° 10° • 12° 19-9°0-9999 0-9997 0-9995 0-9982
For the measurement of the coefficients of viscosity, viscosity tubes of the Ostwald* type were chosen, in accordance with the rules laid down by Findlay.f A thermostat, regulated to 0-02° C., and stirred with compressed air, was employed for obtaining values at the required temperatures. Viscosity determinations were made in the customary manner. The time of outflow from the capillary was found five or more times, and the average taken. The absolute viscosity coefficients of the liquids were obtained by making use of Thorpe and Rodger’s data for the absolute viscosity of water.
D iscussion of R esults.
Test of the Stokes-Einstein Equation.
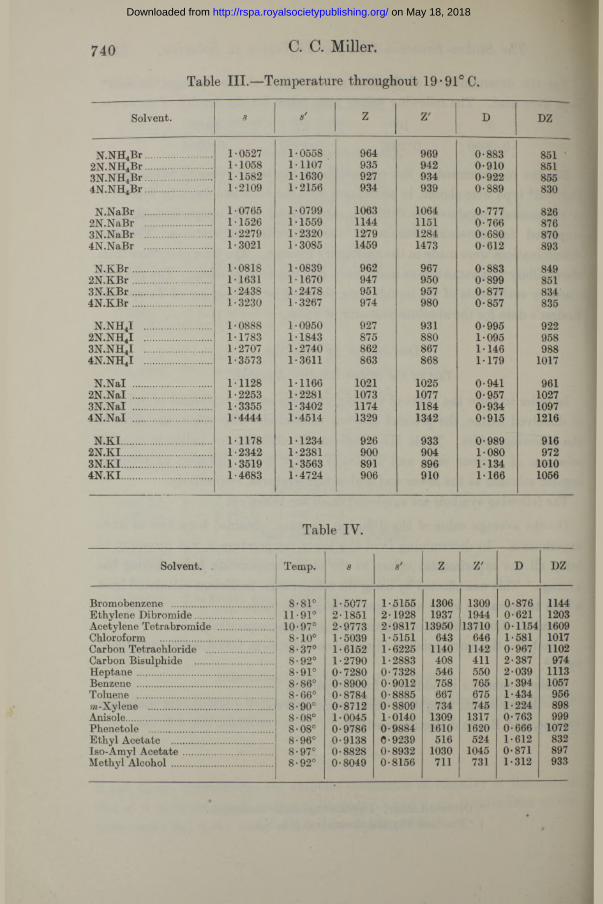
In order to show the effect of varying viscosity on the coefficient of diffusion of dissolved iodine, the product DZ was calculated. The values are given in the following tables. Table III refers to the diffusion of iodine in aqueous solutions of various salts, and Tables IV and V to the diffusion of iodine in organic solvents at the lower and higher temperatures, respectively.
The following symbols are employed in all the tables :—D—the average value of the diffusion constant, obtained from two or more
experiments. In determining D at the lower temperature it was necessary to bring all the experimental values to the same temperature before taking the average. This was effected by using the temperature coefficient calculated from a high temperature value and a low temperature value.
s and s'—the densities of solvent and solution respectively.Z and Z'—the corresponding viscosity coefficients in C.G-.S. units, multiplied
by 106.Table V contains in addition, for comparison:—M—the molecular weight of the organic solvent, V (=M —its molecular
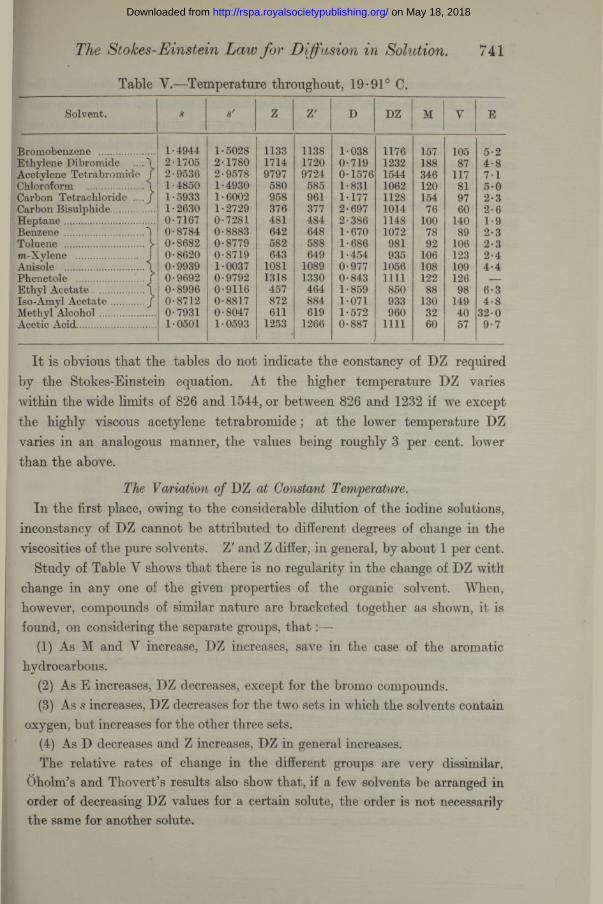
I t is obvious that the tables do not indicate the constancy of DZ required by the Stokes-Einstein equation. At the higher temperature DZ varies within the wide limits of 826 and 1544, or between 826 and 1232 if we except the highly viscous acetylene tetrabromide ; at the lower temperature DZ varies in an analogous manner, the values being roughly 3 per cent, lower than the above.
The Variation of DZ at Constant Temperature.In the first place, owing to the considerable dilution of the iodine solutions,
inconstancy of DZ cannot be attributed to different degrees of change in the viscosities of the pure solvents. Z' and Z differ, in general, by about 1 per cent.
Study of Table V shows that there is no regularity in the change of DZ with change in any one of the given properties of the organic solvent. When, however, compounds of similar nature are bracketed together as shown, it is found, on considering the separate groups, th a t :—
(1) As M and V increase, DZ increases, save in the case of the aromatic hydrocarbons.
(2) As E increases, DZ decreases, except for the bromo compounds.(3) As s increases, DZ decreases for the two sets in which the solvents contain
oxygen, but increases for the other three sets.(4) As D decreases and Z increases, DZ in general increases.The relative rates of change in the different groups are very dissimilar.
Oholm’s and Thovert’s results also show that, if a few solvents be arranged in order of decreasing DZ values for a certain solute, the order is not necessarily the same for another solute.
on May 18, 2018http://rspa.royalsocietypublishing.org/Downloaded from
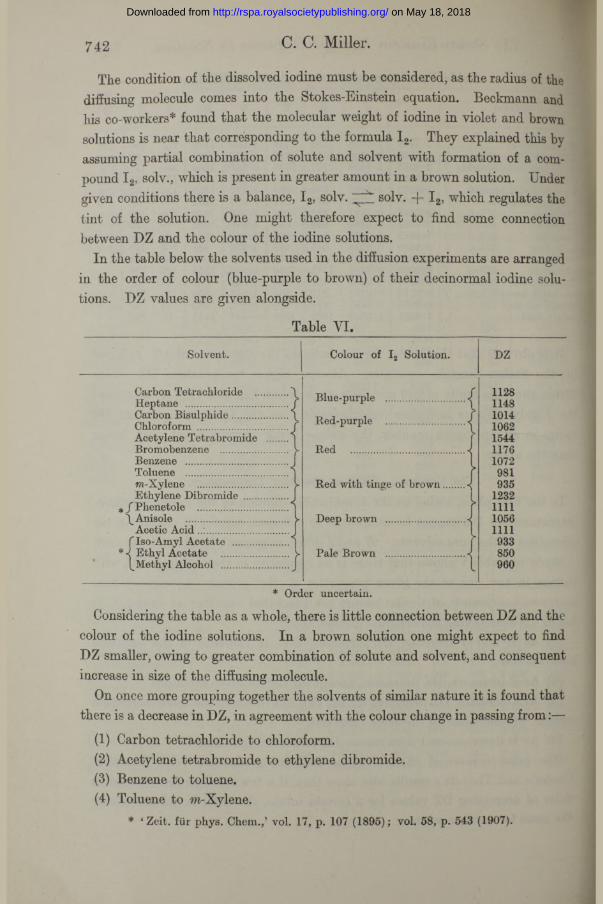
The condition of the dissolved iodine must be considered, as the radius of the diffusing molecule comes into the Stokes-Einstein equation. Beckmann and his co-workers* found that the molecular weight of iodine in violet and brown solutions is near that corresponding to the formula I 2. They explained this by assuming partial combination of solute and solvent with formation of a compound I2, solv., which is present in greater amount in a brown solution. Under given conditions there is a balance, 12, solv. solv. -j- I 2, which regulates the tint of the solution. One might therefore expect to find some connection between DZ and the colour of the iodine solutions.
In the table below the solvents used in the diffusion experiments are arranged in the order of colour (blue-purple to brown) of their decinormal iodine solutions. DZ values are given alongside.
Acetic A c i d ..................flso-Amyl Acetate .........
* ̂ Ethyl Acetate ............(^Methyl Alcohol ............ i
Colour of I2 Solution.
Blue-purple .......................
Red-purple .......................
Red ...................................
Red with tinge of brown...
Deep brown .......................
Pale Brown .......................
DZ
1128114810141062154411761072981935
1232111110561111933850960
* Order uncertain.
Considering the table as a whole, there is little connection between DZ and the colour of the iodine solutions. In a brown solution one might expect to find DZ smaller, owing to greater combination of solute and solvent, and consequent increase in size of the diffusing molecule.
On once more grouping together the solvents of similar nature it is found that there is a decrease in DZ, in agreement with the colour change in passing from:—
(1) Carbon tetrachloride to chloroform.(2) Acetylene tetrabromide to ethylene dibromide.(3) Benzene to toluene.(4) Toluene to m-Xylene.
* ‘ Zeit. fur phys. Chem.,’ vol. 17, p. 107 (1895); vol. 58, p. 543 (1907).
on May 18, 2018http://rspa.royalsocietypublishing.org/Downloaded from
The Stokes-Einstein Law for Diffusion in Solution. 743
Variation in DZ might be due to non-fulfilment of the condition required by Stokes’ law that the solvent molecules must be small compared with those of the solute. According to Sutherland* DZ should assume a higher value as the solvent molecules increase in size with respect to the molecules of a given solute. Thus, in the extreme case of a small molecule moving amongst larger solvent molecules, he supposes that the former travels more or less in the gaps which would be left if the solvent molecules were forced almost into permanent contact with each other. Where this “ slipping ” is a maximum, he represents D by the formula:—
D RT 1 N * i'
The other extreme case, where the “ slipping ” is nil, is represented by the ordinary Stokes-Einstein equation.
If, for a given solute, DZ, according to the Stokes-Einstein equation, have the value 1, then the value given by Sutherland’s equation is 1*5. In Tables III to V it is interesting to note that if acetylene tetrabromide be omitted, the ratio of the highest value of DZ to the lowest is just slightly less than 1-5.
With regard to the high values of DZ obtained when iodine diffuses in organic solvents containing bromine, the following points are of interest:—
In estimating the diffusion coefficients of organic substances in water, methyl alcohol and benzene, for the purpose of testing the relation MD2 = a constant, Thovertf found that compounds containing halogens give, in general, a value of MD2 somewhat higher than that obtained for a large range of alcohols, phenols, etc. A study of his tables shows that in chloro-compounds the effect is less than in bromo- and iodo-compounds. With regard to similarly constituted bromo- compounds, MD2 usually increases with increase in the amount of bromine.
OholmJ likewise drew attention to the fact that the introduction of the halogens into aliphatic and aromatic organic compounds usually increases their diffusibilities, the effect being greatest for iodine and least for chlorine.
Iodine itself gives in methyl alcohol and benzene a value of MD2 comparable with the highest values found by Thovert.
The abnormally high DZ values for iodine diffusing in bromo-compounds seem to depend on the amount of bromine, and probably on its nature of combination with the rest of the solvent molecule. The close chemical relation between bromine and iodine may also affect the diffusibility of the latter.
* ‘ Phil. Mag.’ (6), vol. 9, p. 781 (1905). f ‘ Ann. de Phys.,’ vol. 2, p. 421 (1914). t * Meddel. Nobelinst.,’ vol. 2, Nr. 24, p. 26 (1913).
on May 18, 2018http://rspa.royalsocietypublishing.org/Downloaded from
Diffusion experiments were performed with methyl and ethyl iodides as solvents in order to find the effect of iodo-compounds on the diffusion of iodine. Unfortunately no satisfactory results were obtained, owing, probably, to slight chemical reaction in the solvents.
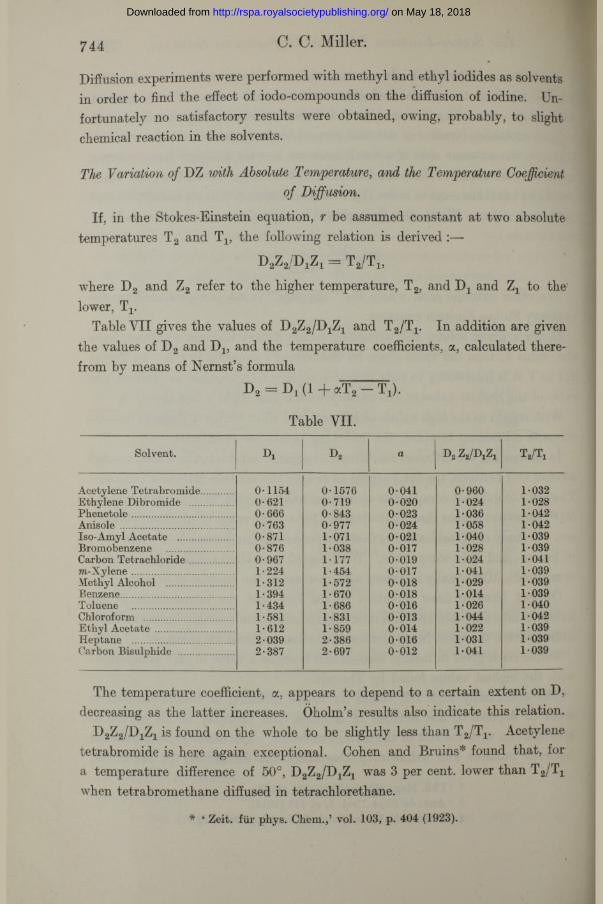
The Variation of DZwith Absolute Temperature, and the Temperature Coefficientof Diffusion.
If, in the Stokes-Einstein equation, r be assumed constant at two absolute temperatures T2 and Tx, the following relation is derived :—
D2Z2/DiZi = T2/T l5
where D2 and Z2 refer to the higher temperature, T2, and Dx and Zx to the lower, Tr
Table VII gives the values of D2Z2/D1Z1 and T2/Tx. In addition are given the values of D2 and Dx, and the temperature coefficients, a, calculated therefrom by means of Nernst’s formula
The temperature coefficient, a, appears to depend to a certain extent on D, decreasing as the latter increases. Oholm’s results also indicate this relation.
D2Z2/DXZX is found on the whole to be slightly less than T2/Tx. Acetylene tetrabromide is here again exceptional. Cohen and Bruins* found that, for a temperature difference of 50°, D2Z2/D1Z1 was 3 per cent, lower than T2/Tx when tetrabromethane diffused in tetrachlorethane.
There is an essential difference in the DZ values obtained for bromides and those for iodides. While the former differ little from the mean —850 (approx.)— the latter are higher and increase with increasing normality of the dissolved salts.
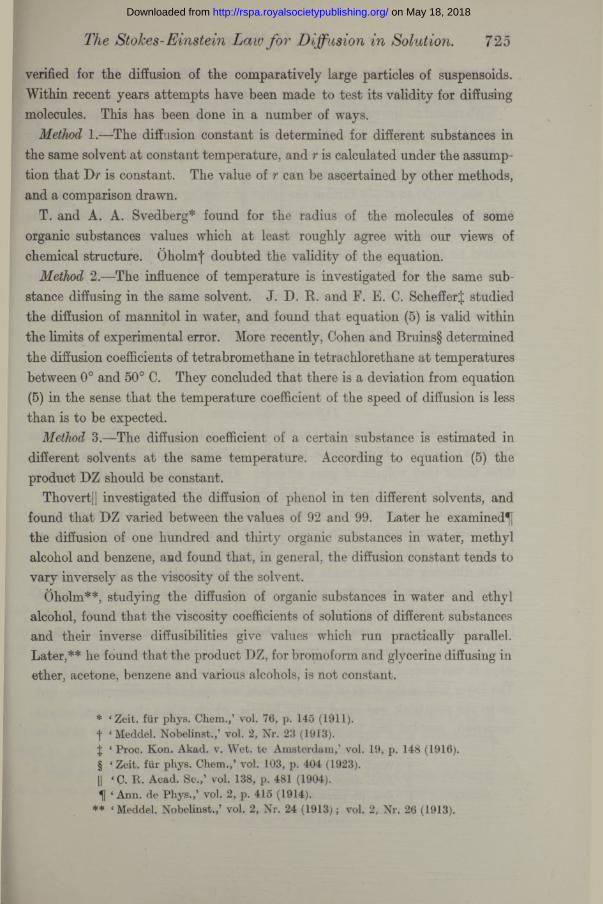
Graphs were drawn in order to compare the variation of D with the variation in the fluidity, F, of the solvents. Since DZ for bromides is fairly constant, it was assumed that the value for water is also 850 and that D is 0-85. Using this latter value all the diffusion constants were recalculated with reference to that for water as 1*00.
Graphs A and B show how D and F vary with the normality of the bromide and iodide solutions respectively, values being referred to water = 1000. Values of D and F are plotted on the same graph. The different effects of bromides and iodides on the rate of diffusion of dissolved iodine are clearly illustrated.
NORMALITY NORMALITYNORMALITY
G r a p h A .
NO RM ALITY NORMALITY NORMALITY
G r a p h B .
on May 18, 2018http://rspa.royalsocietypublishing.org/Downloaded from
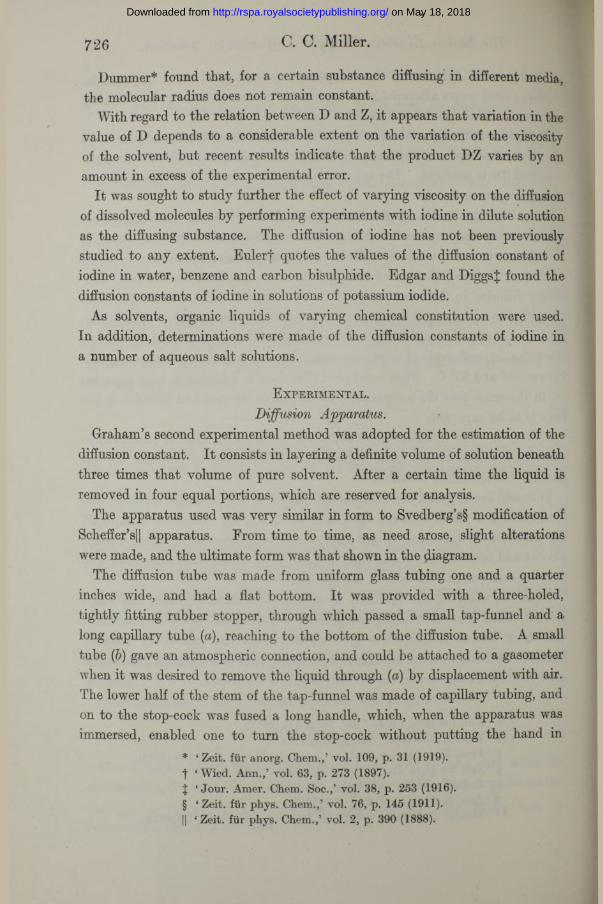
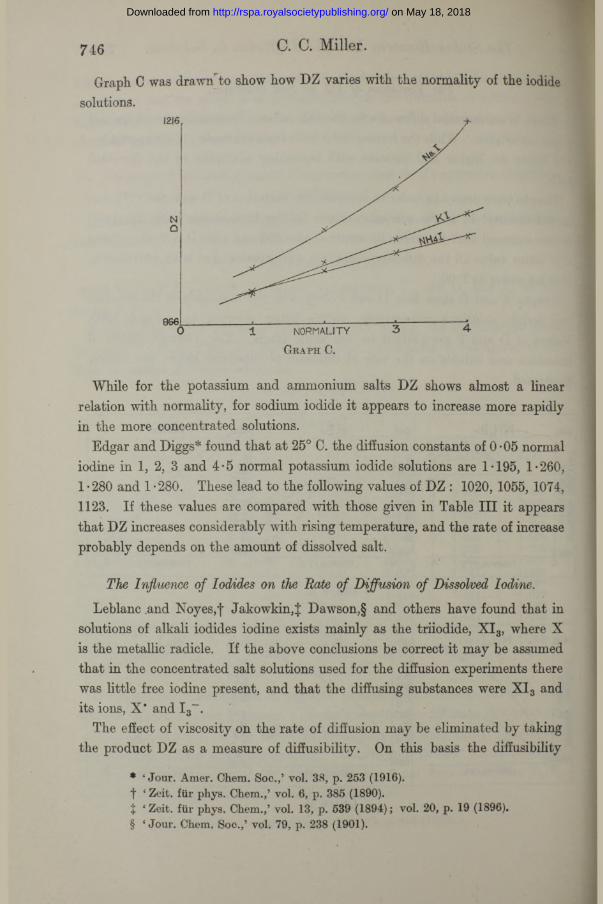
Graph C was drawn to show how DZ varies with the normality of the iodide solutions.
NORMALITY
G r a p h C .
While for the potassium and ammonium salts DZ shows almost a linear relation with normality, for sodium iodide it appears to increase more rapidly in the more concentrated solutions.
Edgar and Diggs* found that at 25° C. the diffusion constants of 0-05 normal iodine in 1, 2, 3 and 4-5 normal potassium iodide solutions are 1*195, 1*260, 1*280 and 1*280. These lead to the following values of DZ : 1020, 1055, 1074, 1123. If these values are compared with those given in Table III it appears that DZ increases considerably with rising temperature, and the rate of increase probably depends on the amount of dissolved salt.
The Influence of Iodides on the Rate of Diffusion of Dissolved Iodine.
Leblanc .and Noyes,f Jakowkin,| Dawson,§ and others have found that in solutions of alkali iodides iodine exists mainly as the triiodide, XI3, where X is the metallic radicle. If the above conclusions be correct it may be assumed that in the concentrated salt solutions used for the diffusion experiments there was little free iodine present, and that the diffusing substances were X I3 and its ions, X* and I 3~.
The effect of viscosity on the rate of diffusion may be eliminated by taking the product DZ as a measure of diffusibility. On this basis the diffusibility
* ‘ Jour. Amer. Chem. Soc.,’ vol. 38, p. 253 (1916).f ‘ Zeit. fur phys. Chem.,’ vol. 6, p. 385 (1890).f ‘ Zeit. fur phys. Chem.,’ vol. 13, p. 539 (1894); vol. 20, p. 19 (1896).§ ‘ Jour. Chem. Soc.,’ vol. 79, p. 238 (1901).
on May 18, 2018http://rspa.royalsocietypublishing.org/Downloaded from
The Stokes-Einstein Law for Diffusion Solution. 747
of dissolved iodine increases with increase in concentration of the dissolved iodide.
Since the diffusion constant of an undissociated molecule is, in general, less than that of its component ions, one would expect the diffusibility of X I3 and its ions to decrease wdtli increase in the amount of dissolved halide, owing to reduction of the degree of ionisation by the large excess of a common ion. This is not so.
Abegg and Bose* deduced theoretically that when an electrolyte diffuses in a large excess of its cation the speed of diffusion approaches that of its anion and vice versa. Since the migration velocities of Na*, K ' and NH4‘ exceed that of I3~, the diffusibility of X I3 and its ions should be diminished in presence of XI. This is not the case.
I t appears that the phenomena connected with the diffusion of iodine in solutions of XI cannot be explained by simply considering the electrolytic effects produced by dissociation of X I3 and XI.
Parsonsf thought that there are no complexes formed between iodine and potassium iodide, and explained the high solubility of iodine in aqueous potassium iodide solutions as being due to its “ solution in a dissolved solid.” Now Bell and Buckley % conclude that iodine can only combine to a very slight extent with sodium and potassium bromides in aqueous solutions ; hence, since DZ for bromides is fairly constant, one might expect to find DZ for iodides more nearly constant than it is, if Parsons’ conception be correct.
The process of diffusion of one substance in the solution of another is evidently of considerable complexity. I t has not been studied to any great extent with dilute solutions of the diffusing substance. Thovert,§ who employed fairly concentrated solutions of the diffusing substance, investigated the diffusion not only of electrolytes in solutions of electrolytes, but of electrolytes and nonelectrolytes in solutions of non-electrolytes. He used a two-layer system, and found that as the diffusing substance passed upwards there was a displacement upwards or downwards of the third component. His results serve to show that there are forces at work independent of those connected with the phenomena of electrolytic dissociation.
If we suppose that iodine is present as X I3 in a solution of XI, then in all probability we have to deal with the diffusion of XI3 and XI. Since the * * * §
* * Zeit. fur phys. Chem.,’ vol. 30, p. 545 (1899).f ‘ Jour. Phys. Chem.,’ vol. 11, p. 659 (1907).j ‘ Jour. Amer. Chem. Soc.,’ vol. 34, p. 10 (1912).§ ‘ Ann. de Phys.,’ vol. 2, p. 405 (1914).
on May 18, 2018http://rspa.royalsocietypublishing.org/Downloaded from
748 The Stokes-Einstein Law for Diffusion in Solution.
diffusion constant of X I3 increases with the amount of XI added, it is highly probable that XI diffuses downwards, “ pushing up ” the XI3, and giving a greater concentration of XI in the lower layers.
Summary.
(1) Diffusion experiments with dilute solutions of iodine were performed at temperatures between 8° and 20°, in order to test the applicability of the Stokes-Einstein equation.
(2) Under certain conditions a thermostat was found to be a satisfactory constant-temperature medium in which to perform such experiments. Later, a thermostatic room was found to be, on the whole, more suitable.
(3) The rate of diffusion, D, was measured in numerous organic solvents, and in various solutions of alkali bromides and iodides. The viscosity coefficients, Z, of the solvents were also determined.
(4) The Stokes-Einstein equation was tested by finding whether or not the product DZ was constant for the various solvents.
(5) With regard to organic solvents it appeared, from the observed inconstancy of DZ, that the Stokes-Einstein equation is not applicable to the diffusion of ordinary dissolved molecules of the size of the iodine molecule.
(6) The variability of DZ was apparently not connected in any simple way with the following properties of the solvents—molecular weight, molecular volume, density, viscosity, or dielectric constant. There was no obvious relation between DZ and the colour of the iodine solutions.
(7) For fifteen organic solvents and twenty-four aqueous solvents, the relative values of DZ were found to lie within the limiting values derived on the one hand from the Stokes-Einstein equation for large diffusing molecules and on the other from the expression given by Sutherland for small diffusing molecules.
(8) With regard to salt solutions as solvents, DZ was found to be fairly constant for various bromide solutions. For iodide solutions the product increased appreciably, and almost linearly, as the concentration of the dissolved salt increased.
(9) The temperature coefficient of diffusion was shown to increase rather irregularly as the diffusion constant decreased.
(10) It was found that, on an average, DZ scarcely increased with rising temperature to the extent required by the Stokes-Einstein equation.
(11) The process of diffusion is evidently very complicated, partly owing to non-fulfilment of Stokes’ law by the diffusing molecules. In addition, there are
on May 18, 2018http://rspa.royalsocietypublishing.org/Downloaded from
complications due to downward diffusion of the solvent, or to upward or downward displacement of its constituents if the diffusion medium is a solution of another substance.
The writer wishes to take this opportunity of expressing her thanks to Prof. Sir James Walker, F.R.S., who suggested the investigation, and who has given much helpful criticism and advice during the course of the work.
The Structure of Graphite.
By J. D. Bernal, B.A.
(Communicated by Sir William Bragg, F.R.S.—Received July 28, 1924.)
The crystallographic information on the subject of graphite is scanty. It has generally been accepted as hexagonal with a well-marked basal cleavage ; but besides the cleavage face few other faces have ever been observed on it. Kenngott,* the earliest observer, seems to have obtained the best crystal, and measured planes, to which he gave the indices 1011 and 1121, making angles of 58° and 70° 18' respectively with the basal plane 0001. (These results are strikingly confirmed by X-ray measurements, which make the corresponding angles 58° 8' and 70° 13'.) Nordenskioldf considered graphite monoclinic, on account of the variability of its angles ; but his conclusions were questioned by Sjogren,J who, in a very full paper, adduced a number of reasons (twinning, percussion and etch figures, thermal conductivity) to show that it was hexagonal. Quite recently the researches of Gaubert§ have added a knowledge of the optical properties of graphite. In very thin flakes it is transparent, uniaxial and negatively birefringent, with a refractive index of about 2. This settles definitely that it has trigonal hexagonal symmetry.
The X-ray analysis of graphite has lagged considerably behind that of the * * * §
* Hintze, * Mineralogie,’ vol. 1.f ‘ Pogg. Ann.,’ vol. 96, p. 110 (1855).J * Min. Mag.’ (Aug., 1885).§ ‘ Comptes Rendus,’ vol. 177, pp. 1123-1125 (1923).
on May 18, 2018http://rspa.royalsocietypublishing.org/Downloaded from