Oxidation of Palladium Surfaces Submitted by Dipl.-Phys. Mira Todorova in the Faculty II-Mathematics and Natural Sciences at the Technical University Berlin to obtain the degree DOCTOR RERUM NATURALIUM Thesis accepted Committee: Head of the Committee: Prof. Dr. Wolfgang Richter Referee: Prof. Dr. Eckehard Sch¨ oll Referee: Prof. Dr. Matthias Scheffler Exam date: 15 March 2004 Berlin 2004 D 83
Transcript
Oxidation of Palladium Surfaces
Submitted by
Dipl.-Phys.
Mira Todorova
in the Faculty II-Mathematics and Natural Sciences
at the Technical University Berlin
to obtain the degree
DOCTOR RERUM NATURALIUM
Thesis accepted
Committee:
Head of the Committee: Prof. Dr. Wolfgang Richter
Referee: Prof. Dr. Eckehard SchollReferee: Prof. Dr. Matthias Scheffler
Exam date: 15 March 2004
Berlin 2004D 83
Oxidation von Palladium-Oberflachen
Vorgelegt von
Diplom-Physikerin
Mira Todorova
Von der Fakultat II-Mathematik und Naturwissenschaftender Technischen Universitat Berlin
zur Erlangung des akademischen Grades
DOCTOR RERUM NATURALIUM
genehmigte Dissertation
Promotionsausschuss:
Vorsitzender: Prof. Dr. Wolfgang Richter
Berichter: Prof. Dr. Eckehard SchollBerichter: Prof. Dr. Matthias Scheffler
Tag der wissenschaftlichen Aussprache: 15. Marz 2004
Berlin 2004D 83
Preface
The interactions of oxygen atoms with transition metal surfaces play an impor-tant role for technologically relevant processes such as corrosion or heterogeneouscatalysis. Gaining a deeper insight into the behaviour of oxygen on this metalsurfaces appears therefore desirable.In the present work the oxygen interactions with the (111) and (100) surfacesof palladium are investigated using density-functional theory. The concept ofab-initio atomistic thermodynamics is employed to determine the stability of var-ious O-phases subject to the chemical potential of oxygen. Furthermore, thebehaviour of O-atoms on Pd is compared to experiments and existing theoreticalfindings for Ru, Rh and Ag, the neighbouring 4d transition metals in the periodictable.Regarding Pd(111) it was found, that sub-surface oxygen incorporation is initiallyalways less favourable than on-surface chemisorption due to the additional latticedeformation cost in the former case. Penetration into the crystal begins after acritical O-atom coverage, θc, lying in the range between 0.50ML and 0.75ML,is reached. A comparison with similar data for Ru, Rh and Ag shows that θc
decreases progressively from Ru to Ag. It is, furthermore, quite similar to thecritical coverage at which oxide phases become thermodynamically more stablethan the chemisorbed adlayers. This points towards the incorporation of sub-surface oxygen being a limiting step for the oxide formation on transition metalsurfaces.On the Pd(100) surface the (
√5 ×
√5)R27o surface oxide was identified to be
a strained, but commensurable thin PdO(101) layer, which is largely stabilisedthrough a strong coupling to the underlying substrate. A comparison of calcu-lated and measured core-level shifts (including final-state effects) shows that thisassignement is compatible with high-resolution core-level spectroscopy data. ASTM-simulation program was incorporated into the program-package used forthe calculations, thus making the comparison to scanning tunneling mictroscopydata possible as well.An analysis of the stability of different oxygen phases on Pd(111) and Pd(100)with regard to the surrounding oxygen gas phase shows, that the surface oxideson this surfaces represent the most stable phases over a wide range of environ-mental conditions far exceeding the stability range of bulk PdO. Comparison with
corresponding experimental data in the pressure range between 10−9 and 1 barand temperatures up to 1000K discerns kinetic hindrances to the formation ofboth the surface and the bulk oxide even at temperatures as high as 600K andatmospheric pressures.
Zusammenfassung
Die Wechselwirkung von Sauerstoffatomen mit Ubergangsmetalloberflachen spielteine wichtige Rolle in technologisch relevanten Prozessen wie Korrosion oderKatalyse. Es erscheint daher wunschenswert, einen tieferen Einblick in das Sauer-stoffverhalten auf Ubergangsmetalloberflachen zu gewinnen.In der vorliegenden Arbeit werden mittels Dichtefunktional-Theorie Sauerstoff-Wechselwirkungen mit den (111) und (100) Oberflachen von Palladium unter-sucht. Mit Hilfe der ab-initio, atomistic thermodynamics Methode wird des Weit-eren die Stabilitat der verschiedenen O-Phasen in Abhangigkeit des chemischenPotentials von Sauerstoff bestimmt. Das Verhalten von O auf Pd wird mit Ex-perimenten und vorhandenen theoretischen Ergebnissen fur Ru, Rh und Ag, denbenachbarten 4d Ubergangsmetallen im Periodensystem, verglichen.Bezuglich Pd(111) wurde gefunden, dass die Besetzung von Platzen unterhalbder Oberflache stets mit einer starken Verzerrung des Metallgitters verbundenist, wodurch Sauerstoffeinbau anfangs weniger gunstig als die Chemisorption aufder Oberflache ist. Das Eindringen in den Kristall beginnt erst ab einer kritischenO Bedeckung, θc, welche im Bereich zwischen 0.50ML und 0.75ML liegt. EinVergleich mit ahnlichen Daten fur Ru, Rh und Ag zeigt, dass θc von Ru bis Agstetig kleiner wird und zudem sehr ahnlich ist zu der kritischen Bedeckung, abder bereits die Oxidphasen thermodynamisch stabiler als die chemisorbierte Ad-sorbatlage werden. Dies deutet darauf hin, dass das Eindringen des Sauerstoffsein limitierender Schritt fur die Oxidbildung auf Ubergangsmetalloberflachen ist.Auf der Pd(100) Oberflache wurde das (
√5×
√5)R27o Oberflachenoxid als eine
verspannte, dunne PdO(101) Schicht identifiziert, welche wesentlich durch einestarke Kopplung zu dem unterliegenden Substrat stabilisiert wird. Diese Zuord-nung ist kompatibel mit Daten aus Hochaufgeloste Rumpfelektronen Spektro-skopie, wie der Vergleich von berechneten mit gemesenen Rumpf-Niveau Ver-schiebungen zeigt. Um einen Vergleich mit entsprechenden RastertunnelmikroskopDaten zu ermoglichen, wurde ein STM-Simulationsprogramm in das benutzteProgrammpaket eingebaut.Eine Untersuchung der Stabilitat von verschiedenen Sauerstoffphasen auf Pd(111)und Pd(100) in Abhangigkeit von der umgebenden Sauerstoffgasphase zeigt, dassdie Oberflachenoxide auf diesen Oberflachen uber einen grosseren Bereich sta-bil sind als das bekannte Volumenoxid PdO. Ein Vergleich mit entsprechenden
experimentellen Daten im Druckbereich zwischen 10−9 bis 1 bar und Tempera-turen bis 1000K identifiziete deutlich kinetische Limitierungen bei der Bildungdes Oberflachen- und des Volumenoxides selbst noch bei Temperaturen bis 600Kund atmospharischen Drucken.
7.1 Surface oxide on the Pd(111) surface . . . . . . . . . . . . . . . . 907.2 Stability plot for O/Pd phases on the Pd(111) surface . . . . . . . 927.3 Stability plot for O/Pd phases on the Pd(100) surface . . . . . . . 957.4 Comparison of the experimental and theoretical (p,T)-phase dia-
gram for the O/Pd(100) system . . . . . . . . . . . . . . . . . . . 967.5 (4× 4) surface oxide on Ag(111) . . . . . . . . . . . . . . . . . . . 977.6 Stability plot for O/Ag phases on the Ag(111) surface . . . . . . . 98
A.1 Cohesive energy of palladium as a function of k-points/coverage. . 105A.2 Surface energy of palladium as a function of k-points/coverage. . . 107A.3 Binding energy for O(1×1)/Pd(111) as a function of k-points/coverage.108A.4 Binding energy difference for O(1 × 1)/Pd(111) as a function of
4.1 Binding energies for on-surface adsorption . . . . . . . . . . . . . 324.2 Sturctural parameters for 0.25ML oxygen adsorbed in fcc-hollow . 354.3 Workfunction and dipole moment dependence on the O coverage
c , for oxide formation . . . . 475.3 Binding energies for sub-surface adsorption . . . . . . . . . . . . . 505.4 Coverage dependence of the binding energy for fcc/tetra-I site oc-
cupation. . . . . . . . . . . . . . . . . . . . . . . . . . . . . . . . . 515.5 Bondlength O-Pd for (2× 2)− (2 Ofcc + Otetra−I)/Pd(111) structure 535.6 Change in workfunction and dipole moment of the (0.50 Ofcc/0.25 Otetra−I)
6.3 Calclulated O1s SCLS for the PdO(101)/Pd(100) model . . . . . 80
7.1 µO(T, p0) . . . . . . . . . . . . . . . . . . . . . . . . . . . . . . . . 897.2 Stability of different oxygen phases on the Pd(111) surface . . . . 917.3 Stability of different oxygen phases on the Pd(100) surface . . . . 94
A.1 Parameter combinations used for the lattice constant determination104A.2 Basis set parameters used for the surface calculations . . . . . . . 106A.3 Convergence tests for the surface oxides on the Pd(100) surface . 110
The interactions of oxygen atoms with transition metal surfaces play an impor-tant role in applications ranging from catalysis to corrosion. In the context ofheterogeneous catalysis, one of the key reactions studied, is the catalytic oxi-dation of CO on transition metals. This is due not only to its technologicalimportance (e.g. in car exhaust catalytic converters, where the active componentare transition metals such as Pt, Pd and Rh) but also to its ”simplicity”.Catalysis clearly involves a number of complex processes, namely the dissociationof molecules and the creation of chemically active species, the subsequent inter-action and reaction between the particles to form a product, which then desorbsfrom the surface. Furthermore, it is possible (maybe likely) that the catalystmaterial is modified by some fragment of the reactant molecules (e.g. O) andthereby create an active species.In recent years, the question has been raised, whether the metals are really theones which further the CO to CO2 conversion. The technical reactions proceedat rather oxidising condition with atmospheric pressures and elevated tempera-tures. It is therefore feasible, that the transition metal surfaces do not remainunaffected. Oxides, which only come into being in such an environment, mayactually be the reactive centers, as has been indicated by experiments address-ing the CO oxidation over Ru(0001) and Pt(110) surfaces [1, 2]. This change ofemphasis from the metallic substrate to oxide surfaces has also led to the identi-fication of oxide or ”surface oxide” structures which appear on the (111) surfacesof Pd [3] and silver [4, 5]. Furthermore, the formation of a palladium oxide on thePd(100) surface has been connected to a significant increase in the CO oxidationrate [2].These findings call for a deeper, atomistic understanding of the oxidation of tran-sition metal surfaces, in particular an investigation of the ease (or resistance) ofoxide formation that could then become relevant in the catalytic applications. Tothis end the interactions of the palladium (111) and (100) surfaces with oxygenatoms are studied in the present work with density-functional theory [6, 7] (DFT).To account for temperature and pressure effects, the stability of different surface
1
2 CHAPTER 1. INTRODUCTION
phases is then assessed using the concept of ab-initio, atomistic thermodynamics[8, 9, 10, 11, 12, 13, 14, 15].The oxidation sequence can be roughly divided into pure on-surface (dissocia-tive) adsorption, surface-oxide formation, and oxide film growth. As the oxygenchemisorption at single-crystal metal surfaces is often perceived to represent theinitial step in the oxidation process, numerous studies aiming to understand theelementary processes involved in the oxidation reactions on Pd exist. The rangeof the employed experimental techniques is wide. For the O/Pd(111) systemthe following picture arises from this work. Above 200K dissociative adsorptionof oxygen [16] leads to a (2 × 2) ordered overlayer, attributed to 1/4ML [17]O sitting in the threefold hollow sites [18]. Higher oxygen coverages have beenachieved at higher O2 pressures and elevated temperatures, or by using strongeroxidants, such as NO [17] or NO2 [19]. At higher coverages on-surface adsorptionseems to compete with (surface) oxide formation, and depending on the oxygendosage, oxidant gas and substrate temperature either a (
√3 ×
√3)R30o [17], a
complex [3, 17] or a (1× 1) [20, 21] low-energy electron diffraction (LEED) pat-tern have been reported. In joint experimental and DFT studies, the detailedatomic structure causing the complex LEED pattern has been recently identifiedas a surface oxide containing about 0.7ML of oxygen atoms [3] and the 0.25MLO (2× 2) structure has been analysed in detail [22].On the theory side, there are few calculations devoted to the O/Pd(111) system.The molecular and dissociative chemisorption of NO on the unrelaxed Pd (100)and (111) surfaces has been studies with DFT [23]. The effect of cluster sizeon the properties of the oxygen atom on Pd(111) has been looked at [24]. Theexperimentally observed [18] molecular precursor states populated during the dis-sociative adsorption of O2 on the basal surface of palladium have been confirmedtheoretically [25].The oxidation of the Pd(111) and the Pd(100) surfaces is qualitatively similar[26, 27]. The major difference between the two is that the (100) surface is farmore reactive towards O2 [27]. The adsorption of oxygen atoms on the Pd(100)surface leads to the formation of at least four ordered surface structures, as re-vealed by LEED investigations [28, 29, 30, 31]. The initially forming p (2 × 2)and c (2× 2) structures, have been attributed to simple atomic oxygen overlayersat coverages 0.25ML and 0.50ML. At higher coverages, either a (5 × 5) or a(√
5 ×√
5)R27o structure is observed, depending on the exposure temperatureand pressure. It has been suggested that the former corresponds to a PdO(110)plane [28]. The latter has been assigned to a rumpled PdO(001) plane on top ofa distorted Pd(100) surface [32, 33]. The incompatibility of this assignment witheither HRCLS, STM or DFT, triggered the search for a new structure. Conse-quently, it is suggested in this work that the (
√5 ×
√5)R27o surface oxide is a
strained, but commensurable PdO(101) film on top of Pd(100).A further point of interest is the ease of oxide formation at the Pd(111) andPd(100) surfaces. Since all the calculations in this work are performed on the
3
basis of density-functional theory, a parameter free characterisation of their oxi-dation behaviour can be made on an atomistic scale. The study of oxygen-metalinteractions on the palladium (111) surface gives insight into the differences be-tween the adsorption of oxygen on the surface and in the sub-surface region.While the first is governed by the extend of the d-band filling, the second dependsalso on the ease with which the surface can be deformed. A comparison to similarstudies available for ruthenium, rhodium and silver [4, 34, 35] makes it possibleto identify the ease of oxygen incorporation as the crucial step, which determinesthe on-set of oxide formation on this elements. This is linked to the materialproperties of the late 4d transition metals, which have a decisive influence on thepoint when O starts to penetrate into the surface. In view of this (the initialincorporation of O into a the transition metal surface) it can be expected thatoxide formation on the more open (100) surface proceeds much easier, comparedto the basal one. Indeed, one finds that from a thermodynamic point of view,the formation of the surface oxide on the Pd(100) surface sets in immediatelyafter the stability of phases containing oxygen, exceeds the stability of the cleansurface. For comparison, on the Pd(111) surface the (2 × 2) adlayer structureis also found to be thermodynamically stable. What makes such a conclusionpossible, is the knowledge of the varied oxygen structures studied on the (100)and the (111) surfaces and the use of the ab-initio, atomistic thermodynamicsapproach. In this context, the identification of the (
√5×
√5)R27o structure as a
strained, but commensurable PdO(101) film on Pd(100) plays an important role.It was a collaboration between theory and experiment, which made this identifi-cation possible. Comparing an experimentally measured ”phase diagram” to thetheoretical one, leads to the assessment of regions in (T, p) space, in which kinetichindrances to the oxide formation play a role. They point towards limitations ofboth the thermodynamic theory and experiment.This work is organised as follows. The theoretical background, i.e the many-body hamiltonian and the basics of DFT are described in the next chapter. Theprogram package used for the calculations and the way to model surfaces arepresented, as well. Chapter 3 proceeds with a study of the bulk and clean surfaceproperties, before turning to the investigation of the oxygen atom interactionswith the palladium surfaces. The chemisorption of O on the Pd(111) surface andthe ensuing ordered structures are the subject of chapter 4. Hereby the relaxationbehaviour upon oxygen atom adsorption on the basal surface of palladium is com-pared to the relaxation behaviour of Ru, Rh and Ag, its 4d neighbours. Alreadyhere one finds indications for the importance the materials properties of this el-ements have for the ease of oxide formation on them. This are then discussed indetail in the following chapter 5, in which structures with mixed on-/sub-surfaceoxygen site occupation are studied. The arguments leading to the rejection ofan existing model for the (
√5 ×
√5)R27o structure and its identification as a
PdO(101) thin film, are presented in chapter 6. There a short introduction toSTM simulations is given, as they were implemented into the WIEN97 program,
4 CHAPTER 1. INTRODUCTION
using the Tersoff-Hamann approximation, as part of this work. How to deter-mine surface core-level shifts is described, as well. Finally, in chapter 6, the toolsnecessary to construct a stability plot of different phases, using the concept ofab-initio, atomistic thermodynamics are presented. The accumulated data on theO/Pd(111) and O/Pd(100) systems is used to construct such plots for them andthe limitations of this method are discussed.
Chapter 2
Theoretical approach
Advances in computer power in recent years and the development of efficient first-principles electronic structure methods have given the theoretical treatment ofsurface structures and processes an enormous boost. The two main approaches todetermine the total energy of a particular systems, which is a prerequisite for thetheoretical description of surfaces, are either wave-function or electron-densitybased methods, originating from quantum-chemistry and solid-state physics, re-spectively. Each of them has the same footing, namely the quantum mechanicaldescription of atoms and electrons. Electronic structure calculations of solids aredominated by density functional theory (DFT), which is also the method used inthe present work.
2.1 The many-body problem
In order to analyse the physical and chemical properties of a system, it is nec-essary to know and diagonalise its Hamiltonian. Considering, however, that thesystems of interest in solid state physics, typically consist of many particles ofthe order of Avogadro’s constant NA = 6.022 × 10²³mol−1, not the knowledge,but the diagonalisation of the Hamiltonian presents a problem. In fact, it isstraightforward to write the many-body Hamiltionian down, as the only funda-mental interactions of concern (in solid state physics) are the electrostatic ones.In principle, relativistic effects should be included, but for simlicity only the non-relativistic case is discussed in the following. Magnetic effects are neglected, asnot being relevant for the present work. Therefore, a system of Nn nuclei withcoordinates RI and Ne electrons at positions ri can be described by thenon-relativistic Schrodinger equation with the Hamiltonian
H = Tnucl + Tel + Vnucl−nucl + Vel−nucl + Vel−el . (2.1)
5
6 CHAPTER 2. THEORETICAL APPROACH
Here Tnucl and Tel represent the kinetic energy of nuclei and electrons, respectively,and are given by the following expressions
Tnucl = −Nn∑I=1
~2
2MI
∇2RI
, Tel = −Ne∑i=1
~2
2mi
∇2ri. (2.2)
The Laplacian operators ∇2RI
and ∇2ri
involve differentiation with respect to theI-th nuclei, at position RI and the i-th electron, at position ri, while MI and mi
denote their respective masses. The repulsive Coulomb interactions between thenuclei are represented by
Vnucl−nucl =1
2
Nn∑I,J=1I 6=J
ZIZJe2
4πε0 | RI −RJ |, (2.3)
where ZI and ZJ are the atomic numbers of nuclei I and J. Magnetic interactionsdue to the spin of the electrons and the spins of the nuclei could be consideredin eq. (2.3) and in the equations representing the electrostatic potential energydue to the interactions between electrons and nuclei and the repulsion betweenthe electrons,
Vel−nucl = −Ne∑i=1
Nn∑I=1
ZIe2
4πε0 | RI − ri |, Vel−el =
1
2
Ne∑i,j=1i6=j
e2
4πε0 | ri − rj |, (2.4)
as well. The factor 1/2 in the expressions for Vnucl−nucl and Vel−el ensures thatthe interactions between the same pair of particles are not counted twice.Now one has the means to describe any physical and chemical property of asystem by solving the many-body Schrodinger equation
HΨ(R, r) = EΨ(R, r). (2.5)
The whole physical information except for the symmetry of the wave functions,Ψ(R, r), is contained in the Hamiltonian. The only thing that has to be con-sidered when solving this equation are the appropriate quantum statistics and,especially for heavier elements with very localised wave functions for the coreelectrons, relativistic effects are important, since the localisation leads to highkinetic energies of these electrons.Unfortunately, a closed form solution of the Schrodinger equation is not possible,except for one particular case (the hydrogen atom) or for academic problems.To make a solution, at least within reasonable accuracy feasible, approximationshave to be made. Still, even approximate solutions are far from being trivial.
2.2. BORN-OPPENHEIMER APPROXIMATION 7
2.2 Born-Oppenheimer Approximation
The first approximation in a hierarchy of such, is the Born-Oppenheimer [36](BO) or also called adiabatic approximation. It is based on the observation thatthe electrons are much lighter (ca. 104 to 105 times) than the nuclei1. Hence itis supposed that electrons would instantaneously follow the motion of the nuclei,as they are much faster. The reaction time of electrons to a perturbation of thesystem is on a femto-second (10−15 s) scale, while atom cores react on a pico-second (10−12 s) scale. Therefore, it is assumed that as a first approximation themotions of the two systems (Ne electrons and Nn nuclei) are decoupled, i.e. theelectrons stay in their ground state for any configuration of the nuclei. The nucleidistribution determines then the potential in which the electrons move. It shouldbe kept in mind, however, that electron-phonon coupling is neglected, since onlythe current nuclei configuration is important. This means, that phenomena likeconventional superconductivity or structural instabilities in some low-dimensionalsystems, such as the Jahn-Teller effect, cannot be described by the adiabaticapproximation.In practice, the full Hamiltonian is split. An electronic Hamiltonian Hel for fixednuclear coordinates R is defined as
Hel(R) = Tel + Vel−nucl + Vel−el, (2.6)
and the Schrodinger equation for the electrons for a given fixed configuration ofthe nuclei is
Hel(R)Φ(r, R) = Eel(R)Φ(r, R). (2.7)
In both equations, the nuclear coordinates R are not meant to be variables, butparameters. The nuclei, in turn, are assumed to move according to the atomicSchrodinger equation
(Tnucl + Vnucl−nucl + Eel)Λ(R) = EnuclΛ(R). (2.8)
The potential energy surface (PES) or Born-Oppenheimer energy surface, V BO =Vnucl−nucl+Eel, is taken to be the potential energy for the nuclear motion. Strictlyspeaking, this motion should be treated quantum mechanically. In practice, itis sufficient to solve a classical equation of motion for the nuclei, as quantum-mechanic effects, such as zero point vibrations or tunneling, are not really im-portant. The only notable exception is hydrogen [37].The properties of the systems and phenomena disscussed in the present work canall be understood on the basis of the Born-Oppenheimer approximation. It hasbeen also successfully applied in the theoretical description of different processesat surfaces. Still, the BO approximation is only justified, when there is no cross-ing of potential curves for different electronic states. But even then, in the caseof states which have different symmetry, it might be a good approximation.
1Exceptions are hydrogen and helium, for which this approximation may be problematic.
8 CHAPTER 2. THEORETICAL APPROACH
2.3 Density-functional theory
The separation of nuclear and electron motion does unfortunately not reduce theorder of the many-body problem. Such a reduction can be achieved if the many-electron problem is reformulated in terms of an effective one-electron picture.In one of the earliest wave function based approximations, the Hartree-Fock (HF)method [38, 39], the many-electron wave function, Φ(r, R), for a system of Ne
electrons, is represented as a Slater determinant2 of one-electron wave functions.This wave function is then used as a trial wave function, and the ground state ofHel is determined from a variational principle.The representation of the wave function by a single determinant function includesFermi statistics (”exchange” effects), but does not account for all correlation ef-fects. Suffice it to say, that electronic screening is not described properly. In asomewhat unhappy definition, any effects not considered in HF are termed ”corre-lation effects”, i.e. the correlation energy is then the difference between the exactand the HF energy of a system (Ec = Etot − EHF
tot ). Electron correlation effectsare commonly included in post HF methods, such as Møller-Plesset perturbationtheory, Configuration-Interaction (CI) method or Coupled-Cluster (CC) theory.Such methods are, however, computationally very demanding and are currentlylimited to rather small number of atoms, typically about 10-20 [40].The limitaion to systems with rather small number of atoms are entcounteredalso by quantum Monte Carlo [41] (QMC) methods. QMC techniques are basedon random sampling and can provide very accurate results.In contrast, density-functional theory [6, 7, 42, 43] (DFT), has proven to be quiteefficient for solving the many-body problem also for extended systems. DFT isa method based not on representation of the many-body wave function, but onthe electron density. Its origins can be traced back to the works of Thomas andFermi in the 1920s [44, 45].
2.3.1 The Hohenberg-Kohn theorems
The rigorous foundation of density-functional theory is put forward by a landmarkpaper by Hohenberg and Kohn(1964)3, in which they prove the following twotheorems.
2The many electron wave function written in the form of a determinant, i.e.
Φ(r, R) =1√Ne!
∣∣∣∣∣∣∣∣∣φ1(r1) φ2(r1) · · · φNe
(r1)φ2(r2) φ2(r2) · · · φNe
(r2)...
......
...φ1(rNe
) φ2(rNe) · · · φNe
(rNe)
∣∣∣∣∣∣∣∣∣ . (2.9)
3Walter Kohn was awarded the Nobel Prize in chemistry (1998) ”for his development of thedensity-functional theory”.
2.3. DENSITY-FUNCTIONAL THEORY 9
Theorem1 states that the ground-state density n0(r) of a system of interactingelectrons in an external potential, Vel−nucl (potential of the atom-cores), uniquelydetermines this potential, within an additive constant. This means that anyobservable of this system, i.e. also the ground-state energy, can be written as afunctional of the density,
Ev[n] =
∫n(r)Vel−nucl(r)dr + FHK [n]. (2.10)
The Hohenberg-Kohn functional, FHK [n], does not depend on the external po-tential and is therefore universal. It comprises the kinetic-energy functional forinteracting electrons Tel and the electron-electron interaction potential
FHK [n] = Tel[n] + Vel−el[n] . (2.11)
Theorem2 states that upon variation the energy functional Ev[n] assumes itsminimum value for the ground-state electron density n0(r),
E0 = Ev[n0] ≤ Ev[n] , (2.12)
if the admissible functions are restricted by the condition∫n(r)dr = Ne , n(r) ≥ 0 . (2.13)
Here the integral over the electron density gives the number of the electrons,Ne. The minimisation of the total energy is carried out under the constraintof electron number conservation, using the Lagrange method of undeterminedmultipliers. In this method the constraint is represented in such a way, that itis exactly zero when satisfied, i.e.
∫n(r)d(r)−Ne = 0. The constrained is then
multiplied by the undetermined constant (the Lagrange multiplier) and added tothe functional. Then the minimum of this expression requires that its differentialis equal to zero, which means that a necessary condition for the minimum is givenby
δEv[n]− µ [
∫n(r)d(r)−Ne] = 0 . (2.14)
This leads to the Euler-Lagrange equation:
µ =δEv[n]
δn(r)= Vel−nucl(r)−
δFHK [n]
δn(r). (2.15)
Thus, the Lagrange multiplier µ is the chemical potential of the electrons. Eq.(2.15) is the basic working equation of DFT.A subtle aspect of the close association of electron density with ground state inthe Hohenber-Kohn theorems is the existence of a one to one mapping between
10 CHAPTER 2. THEORETICAL APPROACH
ground-state wave functions and v-representable electron densities 4. In otherwords, the ground-state properties are fuctionals of the electron density, only ifthe density is v-representable. The v-representability condidition may present aserious difficulty, since many ”reasonable” densities have been shown to be non-v-representable [46]. Fortunately, DFT can be formulated in a way that onlyrequires the density both in functionals and in variational principle to satisfy theweaker N -representability 5 condition [43].This formulation is, so far, still exact. The problem of using many-body quantumwave functions with 1023 coordinates, has been reduced to the variation of afunction of three coordinates. Unfortunately, the Hohenberg-Kohn theorems onlyassert the existence of an universal density functional, but do not tell how toconstruct it.
2.3.2 Kohn-Sham equations
A crucial step towards turning density-functional theory into a practical tool forcalculations is provided by a scheme for the treatment of the variational problem,proposed by Kohn and Sham [7] (KS). They invented an indirect approach to thekinetic-energy functional Tel[n] by introducing orbitals in such a way, that thekinetic energy is computed to good accuracy, leaving a small residual correction,which is handled separately.The essence of the KS scheme is the existence of an auxiliary system of non-interacting particles, with kinetic-energy Ts and local single-particle potential vs,such that the ground-state density, n0(r), of the interacting systems equals theground-state density, ns,0(r), of the auxiliary system. This means, that fromthe ”auxiliary” one-particle Schrodinger equation [−(h2/2m)∇2 + vs(r)]φs,i(r) =εiφs,i(r) one gets the representation of n0(r) in terms of the lowest Ne single-particle orbitals as
n0(r) =Ne∑i=1
| φs,i(r) |2 . (2.16)
Assuming that a potential, vs(r), generating the density, as given by the aboveequation, exists, uniqueness of this potential follows from the Hohenberg-Kohntheorem. Thus the single particle orbitals φs,i(r) = φs,i([n]; r) and the non-interacting kinetic-energy
Ts[n] =N∑i
〈φs,i(r) | −~2
2m∇2
i | φs,i(r)〉, (2.17)
4A density is v-representable, if it is associated with the antisymmetric ground-state wavefunction of a Hamiltonian of the form Hel = Tel +Vel−el +Vel−nucl with some external potentialVel−nucl(r).
5A density is N -representable, if it can be obtained from some antisymmetric wave function.Any nonnegative, continuous and normalised density n is N -representable.
2.3. DENSITY-FUNCTIONAL THEORY 11
are unique functionals of the density, as well.Although uniquely defined for any density, the quantity Ts[n] is not the exactkinetic-energy functional Tel[n], as given in eq. (2.11). To set up a problem ofinterest in such a way that Ts[n] is exactly its kinetic-energy component, thefunctinal of eq. (2.11) is rewritten as, F [n] = Ts[n] + VH [n] + Exc[n], where, bydefinition, Exc[n] is the exchange-correlation energy functional of the interactingsystem
Therefore, for a particular external potential v(r) leading to ground-state densityn0(r), Eq. (2.10) can be written in the form
Ev[n] = Ts[n] +
∫n(r)v(r)dr +
1
2
e2
4πε0
∫ ∫n(r′)n(r)
| r− r′ |drdr′ + Exc[n] . (2.19)
The variational principle leads to the Euler-Lagrange equation (cf. eq. 2.15)
µ = veff (r) +δTs[n]
δn(r), (2.20)
where the Kohn-Sham effective potentail is defined as
veff ([n]; r) = v(r) +1
2
e2
4πε0
∫n(r′)
| r− r′ |dr′ + vxc([n]; r) , (2.21)
and the exchange-correlation potential is the functional derivative of Exc[n],
vxc([n]; r) =δExc([n]; r)
δn(r). (2.22)
Equation (2.20) with the constraint (2.14) is exactly the same one as obtainedfrom conventional density-functional theory when it is applied to a system ofnon-interacting electrons moving in an external potential vs(r) = veff (r). Thismeans, that for a given veff (r), the density n(r) that satisfies the Euler-Lagrangeequation (2.20) is obtained by solving the Ne one-electron equations
− ~2
2m∇2 + veff ([n]; r)
φ0,i = ε0,iφ0,i , (2.23)
where
n(r) =Ne∑i=1
| φ0,i(r) |2 . (2.24)
The equations (2.21), (2.23) and (2.24) are refered to as Kohn-Sham equations.Since the effective potential veff depends on the density through the exchange-correlation potential (cf. 2.22), it is evident that the Kohn-Sham equations have
12 CHAPTER 2. THEORETICAL APPROACH
to be solved self-consistently. One starts from some initial guessed density n[0](r)(quite often taken to be a superposition of atomic densities) and constructs veff (r)from (2.21). From (2.23) and(2.24) a new density n[1](r) is determined. In eachnew iteration a mix of old and new density is used. The cycle is repeated until acertain convergence criterion is fulfilled.Once the self-consistent electron density is obtained it can be used to computethe ground state electronic total energy via (2.19) or from the expression
E0 =N∑i
εi −1
2
e2
4πε0
∫ ∫n0(r
′)n0(r)
| r− r′ |drdr′ + Exc[n0]−
∫vxc([n0]; r)n0(r)d(r) ,
(2.25)where the sum i is only over the filled states.Given the auxiliary nature of the KS orbitals it can be expected that they haveno simple physical meaning. Strictly speaking, this is true. However, from theasymptotic behaviour of the density, derived once from DFT and once from themany-electron Hamiltonian, it has been possible to identify the highest occupiedKS orbital as the ionisation potential [47], i.e. δEv[n]/δn(r) = −I = µ. Fur-thermore, Janak [48] has proven that the derivative of a generalisation of thetotal energy with respect to orbital occupation is equal to the eigenvalue of theeffective one-electron Hamiltonian for an orbital, regardless of the detailed formof Exc[n],
εi =∂Ev[n]
∂ni
. (2.26)
The generalisation of DFT is constructed by introducing occupation numbers ni
for each single-particle state and defining the charge density as
n(r) =∞∑i
ni|φ0,i|2 . (2.27)
With the above two equation, the transition from a state with Nel – to a statewith (Nel− 1) – electrons plus one free electron with energy zero, for an extendedsystem, can be written as:
ENel−1i − ENel = −
∫ 1
0
εi(ni) dni , (2.28)
where the unoccupied state is denoted by i. This integral can be approximatedusing the mean value theorem of integration by evaluating the function inside theintegral only at midpoint n = 1/2, i.e. ENel−1
i − ENel ≈ εi(ni = 1/2), which iscalled the Slater-Janak ”transition state.”By the introduction of Nel one-electron wave functions, the KS equations allowthe indirect but exact handling of the dominant part (Ts[n]) of the true kineticenergy Tel[n]. However, one is now required to solve a set of Nel equations, in
2.3. DENSITY-FUNCTIONAL THEORY 13
contrast to the one equation needed in the original formulation (cf. Chapter2.3.1). The only remaining problem is the ignorance regarding the exchange-correlation functional, Exc. An explicit form for Exc[n] is needed to specify theKS equation, therefore a number of approximations have been (and still are)developed.
2.3.3 Exchange-correlation energy functionals
The simplest approximation for the exchange-correlation energy function, is thelocal-density approximation (LDA). The exchange-correlation energy of the homo-geneous electron gas, i.e., a system with a constant electron density [49] is known.In LDA this exchange-correlation energy for the homogeneous electron gas is alsoused for non-homogeneous situations. In other words, the exchange-correlationenergy of an inhomogeneous system can be obtained by using the density ofthe homogeneous electron gas to approximate the inhomogeneous density in anypoint locally,
ELDAxc [n] =
∫n(r)εLDA
xc (n(r))dr. (2.29)
The LDA is a good approximation for systems with slowly varying electron den-sity, but for strongly inhomogeneous systems like, e.g. atoms or molecules, orreactions at surfaces, LDA results may not be sufficiently accurate. Usually LDAshows over-binding, i.e. binding and cohesive energy turn out to be too largecompared to experiment. This overbinding also leads to lattice constants andbond lengths that are smaller compared to the experimental values.An improvement on LDA is the generalised gradient approximation (GGA),
EGGAxc [n] =
∫n(r)εGGA
xc (n(r),∇n(r))dr, (2.30)
in which also a gradient of the density is included in the exchange-correlationenergy. There are a number of approaches representing the exchange-correlationfunctionals within the GGA, which differ basically only in the determinationof the coefficients for the differential term. Often the functional is split in twoparts, i.e., for the exchange, EGGA
x , and for the correlation, EGGAc , which are then
developed separately. Usually theoretical considerations regarding the known be-haviour of the exact, but unknown functionals, play a role in the development,but sometimes empirical parameters are used.There are a number of failures of DFT with present-day functionals, which in-clude that van der Waals forces are not properly described, the Kohn-Sham po-tential falls off exponentially for large distances instead of ∝ 1/r, band gaps ofsemiconductors are underestimated in both LDA and GGA by approximately50%, cohesive energies are overestimated in LDA and underestimated in GGA,strongly correlated materials (such as NiO) are predicted as metals and not as
14 CHAPTER 2. THEORETICAL APPROACH
antiferromagnetic insulators. The problem in the development of a more accurateexchange-correlation functional is the reliable description of the non-locality ofthis functional.In the present work both LDA and GGA, in the form proposed by Perdew et al.(PBE) [50], were used to determine the bulk properties of palladium. For thesurface calculation only GGA results will be presented.
2.4 The FP-LAPW method
The primary computational task in DFT is the solution of the KS equations fora given crystalline structure and chemical composition. To make this solutionfeasible in a periodic potential, the wave functions, φ, are inevitably expanded,by a set of basis functions ϕ:
φ =∑
i
ciϕi (2.31)
Still, in any practical implementation the computational effort increases signif-icantly with the number of electrons that have to be taken into account.Theobservation that the chemical binding is determined almost entirely by the va-lence electrons, while the influence of the core electrons is negligible, has givenrise to the idea to replace the core electrons by an effective potential, so that theydo not have to be taken explicitly into account. This is done in pseudopotentialplane wave methods (PPW) [51, 52] and the set of functions chosen as a basis areplane waves. However, the use of pseudopotentials represents an approximation.For some elements, there is a significant interaction between core and valence elec-trons, or one may be interested in properties due to the core electrons. Such casesmake all-electron calculations desirable, e.g. the (full potential) Korringa-Kohn-Rostocker method (KKR) [53, 54], the linear muffin-tin orbital method (LMTO)[55, 56, 57], the full-potential linear augmented plane waves method (FP-LAPW)[58]. In the mentioned methods the unit cell is partitioned in two regions (cf.Fig. 2.1), each of which is described by a different potential. The KKR methodis Greens-function based. The functions used in both LMTO and LAPW methodsare hybrids, constituted by solutions suitable for the two kinds of potentials andjoined continuously at the boundary of the two disjoint regions. In both methodsatom-like functions are used as basis for the wave-function expansion inside thespheres. Outside, Henkel- and Bessel-functions are used in the LMTO method,while plane waves are used in the LAPW method. They are augmented insidethe muffin-tin spheres. In the following the LAPW method will be described insome detail.
2.4. THE FP-LAPW METHOD 15
RI
I
r
RMT
ISri
Figure 2.1: Partitioning of the unit cell into non-overlapping atomic spheres withradia RI
MT and interstitial region (IS).
2.4.1 The APW- and LAPW-Methods
The idea to partition space into two disjoint regions was proposed by Slater al-ready 1937 [59]. He noted that the potential, while being nearly spherical, variesstrongly close to an atomic nucleus, but is much smoother between nuclei. There-fore, it seems reasonable to divide space into (i) non-overlapping spheres, centeredat the atomic sites RI (cf. Fig.2.1) and (ii) interstitial (IS), which comprises allof the remaining space. The effective potential is approximated by a muffin-tinpotential: Veff is constant in the interstitial and radially symmetric within thespheres with muffin-tin (MT) radius, RI
MT. Since plane waves are solutions ofthe Schrodinger equation for a constant potential, they are a good choice to de-scribe a smoother potential region. The wave functions inside the spheres aresolutions of the Schrodinger equation for a spherical potential, ul(ri, ε)Ylm(ri).The solutions, ul(ri, ε) of the radial Schrodinger equation
− ~2
2m
d2
dr2+
~2
2m
l(l + 1)
r2+ V00(r)− ε
rul(r, ε) = 0 , (2.32)
depend on the energy ε as a parameter.The Ylm(ri) are spherical harmonics, withYl−m(ri) = (−1)mY ∗
lm(ri). The spherical part, V00, of the potential expansion isgiven by
V (r) =∞∑l=0
l∑m=−l
Vlm(r)Ylm(r) | ri | ≤ RMT. (2.33)
The resulting augmented plane wave (APW) basis functions, intorduced by Slater,are given by
ϕAPWk+G (r) =
1√Ωei(k+G)·r r ε IS
∑lm Almul(ri, ε)Ylm(ri) | ri | ≤ RMT
(2.34)
where ri = r−RI and Alm are expansion parameters.Augmented plane waves can be defined for any wave vector k and any energy ε,
16 CHAPTER 2. THEORETICAL APPROACH
there is no constraint relating the two quantities. The augmented plane waveshave, however, to be defined in such a way that they are continuous at the shpereboundary, for the kinetic energy to be well defined. This requirement definesthen the expansion coefficients Alm for any given combination of k and ε. Thereis no matching of derivatives at the sphere boundary, so that the APW basisfunctions have in general a kink at RMT and their derivatives are discontinuousat the boundary 6. A further drawback is the energy dependence of the functionsul(ri, ε), leading to a non-linear eigenvalue problem, which is computationallyquite demanding.This problem is solved in the linearised augmented plane waves method (LAPW).In it both the basis functions and their first derivative are required to be con-tinuous at the boundary between core and interstitial region. The additionalmatching in slope will yield smooth basis functions 7. Since the matching criteriaare striclty mathematical, the shape of the resulting linear combination will differin general from the shape of the physical solution ul(ri, ε). Only an approximatesolution of the Schrodinger equation is possible, but the associated error is rathersmall [55]. The more important change is, that the radial functions ul(ri, ε) areexpanded around a fixed energy
where u is the energy derivative u = (dul(r, ε)/dε) |ε=εl. The fixed energy εl
should be in the middle of the corresponding energy band. The additional termO((ε− εl)
2) leads to a 2nd order error in the wave functions and a 4th order errorin the bandenergy.All this makes the LAPW functions
ϕLAPWk+G (r) =
1√Ωei(k+G)·r r ε IS
∑lm[Almul(ri, εl) + Blmul(ri, εl)]Ylm(ri) | ri | ≤ RMT
(2.36)
more flexibile. Due to the small error the LAPWs are a good basis set choice fora relatively large energy region, making it often possible to treat all valence bandby just one linearisation energy, εl.
6The kinetic energy can be computed by either of the two intergals,∫
φ∗i (−∇2)φj dr or∫(∇φ∗i )(∇φj) dr. Ordinarily, it can be shown by integration by parts that the two ingrals are
equal, but if a function has anywhere a discontinuous slope, they differ by a suface integral overthe surface of discontinuity. The first representation of the kinetic energy is more common, butthe second integral is the more fundamental form, as it is the one which directly enters thevariational principle from which the Schrordinger equation is derived. In the case of the APWbasis functions the second integral is the correct one to use [59]. It should be stressed, that thesurface contribution is not due to the kinks in the APW basis functions, but enters naturallyfrom the variational expression.
7There will be no surface contribution to the kinetic energy.
2.4. THE FP-LAPW METHOD 17
Now the Kohn-Sham wave functions can be expanded in this basis
φk =∑G
cGϕk+G . (2.37)
A problem is encountered when states with the same l quantum number, butsignificantly different energies have to be treated. That are states with a differentmain quantum number n, since for each l there is only one energy parameterεl. An attempt to describe both states by just one εl, would lead to a poordescription of one or both of them, depending on the choice of the linearisationparameter. This problem is solved by treating states which are not in the valenceregion, but too delocalised to be treated as core (which is the case for transitionmetals), as semi-core states described by local orbitals. The idea is to simplyadd a further function ul(ri, εl) to the expansion within the MT-spheres, with asecond linearisation energy εl
(2.38)The coefficients Alm, Blm and Clm are determined by the requirement that ϕlo(r)should be normalised and have zero value and slope at the sphere boundary. Alocal orbital is independent of k andG, it has a specific l-character and belongsto only one atom. The local orbitals are ”local” in the sense that they areconfined exclusively to the MT-region and are identically zero outside the muffin-tin sphere.
2.4.2 The FP-LAPW method
The restriction to spherical symmetric potentials in the core region and constantpotential in the interstitial region can be lifted, further improving the LAPWmethod. Annalogous to the wave function the potential is represented by
V (r) =
∑
G V effG eiG·r r ε IS
∑lm V eff
lm (ri)Ylm(ri) | ri | ≤ RMT
(2.39)
A lot of computational time can be saved by using the symmetry of the system todetermine the relevant l,m coefficients for the expansion in spherical harmonics,Ylm. This would mean that a smaller number of terms in the electron densityexpansion have to be considered.There is a maximum l quantum number, lmax, which determines the size of the(l,m) representation for both wavefunction and potential inside the MT-spheres,
18 CHAPTER 2. THEORETICAL APPROACH
but it is different for φ and V . Furthermore, | G |≤ Gpot determines the highestreciprocal lattice vector in the sum used to describe the potential in the interstitialregion. By increasing these values the quality of the full-potential description canbe improved systematically. These are values, which should be carefully tested,to determine an optimal basis set for a calculation.The program used in this work, WIEN 97 [60] is based on the FP-LAPW methodand will be described in the following.
2.4.3 The supercell method
A consequence of using periodic boundary conditions is, that a unit cell is re-peated an infinite amount of times in either of the three directions in space x, y, z.This simplifies calculations for a bulk solid, as one has only to care about settingup the appropriate unit cell and using the whole symmetry of the system.
Going from bulk to a surface means a break in
Figure 2.2: Illustrationof the supercell approach.Shown is the supercell usedto perform calculations forthe adsorption of a fullmonolayer of oxygen atomson the Pd(111) surface.
symmetry. A surface calculation can be set upby introducing a vacuum region into the unit cell.There are two ways to do this. If a vacuum regionis introduced in every direction in space one endsup with a cluster, which should then represent thesolid with the according surface. However, in thisapproach the properties of the surface depend verymuch on the size of the cluster. To be able to give agood description of the surface huge clusters, con-sisting of many atoms in one unit cell have to beused, which would make such a calculation compu-tationally very expensive.A different way to describe the surface is given bythe supercell approach, which is used in the presentwork. In this approach a vacuum region is intro-duced just in one direction, e.g z. This partitionsthe unit cell in regions where there is a solid (slab)and regions with vacuum. The periodic boundaryconditions ensure, that the slab is infinite in x, ydirection, but also, that the slab is repeated aninfinite amount of times in z direction. To avoidspurious effects due to an interaction between con-
sequent slabs, one has to make sure, that the vacuum region between them is bigenough. As can be seen in Fig. 2.2 a slab has two surfaces. A slab should bethick enough, so that surface-surface interaction is negligible for the quantitiesof interest. Ideally, a slab would be so thick, that it is bulk-like in the middle.Both vacuum- and slab-thickness have to be tested, to ensure a good descriptionof the surface properties.
2.4. THE FP-LAPW METHOD 19
Atoms or molecules are usually adsorbed on both surfaces simultaneously. Thisensures, that at least inversion symmetry is retained, if possible. The presence ofinversion symmetry reduces the computational effort by a factor of four, since theperformed calculations are in real (and not in imaginary) space. The adsorptionof atoms or molecules on just one side of a slab can also give rise to a huge dipolemoment. The correction for this is simple [61] but not implemented in the WIENcode. Consequently in the present work the oxygen atoms are always adsorbedon both sides of the slab.
2.4.4 Integration over the Brillouin zone
To determine the electron density a summation over all occupied states has tobe performed. For a solid this means that an integration over the Brillouin zone(BZ) or its irreducible part, when symmetry is accounted for, has to be performed.Numerically an integration is solved by transforming an integral into a sum overa finite number of k-points:∫
BZ
1
ΩBZ
dk −→∑k
wk . (2.40)
The two predominant methods used to choose the k-points in the Brillouin zoneare the tetrahedron method [62] and the special points method [63].In the WIEN 97 program the special points method after Monkhorst and Packis used, in which the integrations are performed as weighted sums over a grid ofrepresentative k-points. Initially a grid is constructed in the full Brillouin zoneusing given divisions of the reciprocal lattice vectors; the grid is chosen so thatit is offset from Γ by 1/2 division in each direction. Sets of symmetry relatedk-points are identified by sequentially applying the symmetry operations. Onerepresentative k-point is then chosen from each set of equivalent points, andassigned a weight, w(k), equal to the number of points in the set divided by thetotal number of points in the grid. These are the special points and associatedweights.For metals, where bands cross the Fermi energy, EF , there is a discontinuity inthe occupation and consequently also in the integration over the Fermi surface.The result is a bad convergence behaviour. For this reason the temperature israised artificially and the determined free energy is interpolated back to T = 0 K,after the integration.
2.4.5 Forces in the FP-LAPW method
The determination of forces acting on the atoms, i.e. the change in energy due toa displacement of the atoms, opens up a good possibility to determine the ground-state geometry. Assuming that the external potential depends parametrically on
20 CHAPTER 2. THEORETICAL APPROACH
the position of the nuclei, v(r; Ri), it follows from eq. (2.19) that the gradientof the ground-state energy is given by [64, 65]:
−∂Ev
∂RI
= −∫
∂v(r, RI)∂RJ
n(r, RI) dr−∫
δEv
δn
∂n(r, RI)∂RJ
dr . (2.41)
The first term is the Hellmann-Feynman force, which descibes the pure electro-static interaction of the electron charge density n(r, RI) and the potential ofthe ions, v(r, RI). The second term is due to the incomplete basis set, givingrise to inaccuracies in the calculated electron density. This term would disappearif the variatonal problem was solved exactly. Since the basis set functions inthe LAPW method are discontinuous in their second derivative, this leads to aposition dependent discontinuity in the kinetic energy, which requires a furthercorrection to the Hellmann-Feynman forces [66]. Calculation of forces is possiblein WIEN97 [67]. This is quite important for the determination of relaxations atsurfaces.
2.4.6 The Program WIEN 97
The calculations presented in this work were performed with the program packageWIEN 97 [60]. It is based on the FP-LAPW method and developed for calcu-lations of crystals, i.e., periodic boundary conditions are implemented. A flowchart of the program is shown in Fig. 2.3. The program is divided into two parts- initialisation and main program (self-consistent cycle). Each of them is dividedin sub-programs, connected by scripts.In the initialisation the geometric and electronic structure of the system of in-terest are set up. The symmetry of the system and the k-points, which will beused, are determined. During the initialisation electron densities of free atomsare calculated and superposed to get an initial guess for the charge density usedin the self-consistent cycle.In the main part of the programm, as a first step a potential is generated fromthe input charge density. With the Hamiltonian determined by this potentialthe eigenvalue problem is solved for the valence electrons. From the calculatedeigenfunctions a new valence electron density is obtained. The core electron en-ergy and density are determined by a fully relativistic self-consistent calculationin the crysal potential. In the end, the new valence and core electron densitiesare mixed 8 with the old electron density, using a Broyden mixing scheme [58].Ideally, covergence is reached, when old and new electron density do not differ.In practice, the convergence with respect to some convergence criteria is tested.
8The time required to perform a self-consistent calculation using the LAPW method isproportional to the number of iterations needed to reach self-consistency. It is, therefore,improtant to choose an efficient mixing of input and output electon densities. Problems like”charge sloshing” (oscillations of charge between two parts of a cell, characteristic especiallyfor large unit cells) can be entcountered otherwise.
2.4. THE FP-LAPW METHOD 21
Initialisation
Computation of the Potentialfrom the electron density n(r)
Determination of theeigenvalues and eigenfunctions forthe valence region
Computation (full relativistic treatment) of the core states and core-electron densities
Determination of the valence electron densityfrom the eigenfunctions
Construction of a new electrondensity from the valence, coreand old electron density
Convergence ?Stop
No
Yes
Figure 2.3: Flow chart of the WIEN program. The self-consistent part of theprogram is shown in detail.
If the convergence criteria is fulfilled, the ground-state has been found, otherwisethe cycle is repeated.
22 CHAPTER 2. THEORETICAL APPROACH
Chapter 3
Properties of the bulk and cleansurface
When dealing with surfaces it is improtant to remember that a surface is notan entity on its own, but connected to the bulk. This means that characteristicfeatures of the bulk material will probably have a strong influence on the surfaceproperties and behaviour. To mention but one example - the introduction ofunwanted strain effects into a system may easily occur, if the equilibrium latticeconstant is not determined in advance. Though this work will focus on surfaces,from the above it is clear that a study of the bulk and its features is crucial, ifone wants to gain understanding of surfaces.It should be further pointed out, that adsorption of atoms or molecules usuallyalters the structural and electronic properties of the surface they are adsorbed on.Effects due to the interaction of the adsorbed atoms/molecules can be identifiedby comparison to the clean surface, which is then taken as a reference.Therefore, the properties of the palladium bulk and the clean (100) and (111)surfaces will be the focus of this chapter.
3.1 Properties of the bulk
Palladium is one of the late 4d transition metals. It has 46 electrons and a nearlyfull 4d shell. Its neighbours in the periodic table are ruthenium, rhodium (to theleft) and silver (to the right). The equilibrium crystal phase of Pd has a face-centered cubic Bravais lattice, with one atom in the primitive unit cell [68]. Itsmeasured lattice constant at room temperature is aexp = 3.89 A [69], which meansthat the distance between two Pd atoms in the bulk is 2.75 A. Consequently, themuffin-tin spheres in the calculation (which should not overlap) are chosen tobe RMT(Pd) = 2.37 bohr = 1.25 A 1. Since the number of plane waves needed to
1Here and in the following atomic units are used: ~ = me = e = 1; 4πε0 = 1.1 bohr = 0.529177 A
23
24 CHAPTER 3. PROPERTIES OF THE BULK AND CLEAN SURFACE
3.6 3.8 4 4.2 4.4
a [Å]
0.0
0.2
0.4
0.6
0.8
1.0
∆E [e
V]
PdGGA
a0 = 3.944 Å
B = 163 GPa
3.4 3.6 3.8 4 4.2
a [Å]
0.0
0.2
0.4
0.6
0.8
1.0
1.2
∆E [e
V]
PdLDA
a0 = 3.838 Å
B = 220 GPa
Figure 3.1: Calculated equilibrium lattice constant for palladium, determinedwith both GGA (left) and LDA (right).
describe the wavefunction decreases, as the interstitial region becomes smaller,one would typically like to make any muffin-tin radius as big as possible.Some of the most important bulk cohesive properties are derived from the depen-dence of the total energy function on the volume of the primitive unit cell 2. Theequilibrium unit cell volume V = V0 (and hence the equilibrium lattice constanta0) is determinied by minimisation of the total energy function, E(V ), with re-spect to V . The bulk modulus, on the other hand, is related to the curvature ofthe of the total energy function, E(V ), close to the equilibrium value. It definesthe way a system reacts against isotropic compression and is given by
B(T, V ) = V∂2E
∂V 2
∣∣∣∣T
. (3.1)
In practice, one evaluates the energy for different primitive unit cell volumes, i.e.,different lattice constants, and then interpolates between them using the equationof state of the solid. In the present work the Murnaghan equation of state [70, 71],
E(V ) = E(V0) +B0V0
B′0(B
′0 − 1)
[B′
0
(1− V0
V
)(V0
V
)B′0
−1
], (3.2)
is used 3. Here, B′0 is the derivative of the bulk modulus with respect to pressure,
evaluated at p = 0.For the determination of the lattice constant several sets of parameters were used.These and further tests performed to determine the optimal basis sets used for
2The volume of the primitive unit cell is given by V = |a1 · a2 × a3| = 14 a3, where a1, a2
and a3, are the primitive translation vectors of the face centered cubic Bravais lattice and atheir length.
3This equation is based on the assumption, that the bulk modulus depends linearly on theapplied uniform pressure, p, i.e. B(T, p) = B0(T ) + B′
0(T ) p.
3.2. CLEAN SURFACE 25
the different systems discussed in this work, are described in Appendix A 4.The equilibrium lattice constant for palladium is determined for both GGA,a0 = 3.944 A and LDA, a0 = 3.838 A. Comparison to the experimental latticeconstant mentioned above shows that the DFT-GGA result slightly overestimates(by 1.3 %) and the LDA result underestimates (by 1.4%) the experimental result.This behaviour has been noticed also for other metals [4, 34, 35]. The reason isthe following: LDA typically causes an over-binding, which results in a smallerlattice constant. The opposite effect observed in GGA is a consequence of thecorrection, which GGA constitutes and which is too big. The determined bulkmoduli are B0 = 163GPa and B0 = 220GPa for GGA and LDA, respectively.The experimental value is Bexp = 181GPa [69].These results are in line with other FP-LAPW calculations. In Ref. [72] the equi-librium lattice constant and the bulk modulus are determined to be: a0 = 3.95 A,B0 = 1.63GPa for GGA and a0 = 3.85 A, and B0 = 2.22GPa for LDA. In Ref.[73] the values for the lattice constant are a0 = 3.95 A (GGA) and a0 = 3.85 A(LDA). Previous pseudopotential DFT-GGA calculations find the lattice con-stant to be a0 = 3.98A [25] and a0 = 4.01A [22] overestimating the experimentalvalue as well.The cohesive energy is obtained by the following relation,
Ec = Ebulktot (a0)− Eatom
tot , (3.3)
with Ebulktot (a0) being the ground state total energy per atom (calculated at the
equilibrium lattice constant) and Eatomtot , the energy of an free atom. The calcu-
lation for the Pd atom was performed in a cell with sides (13× 14× 15) bohr, toavoid spherical averaging. Dispersion does not play a role for a free atom, there-fore it is sufficient to use one k-point, i.e. (1/2; 1/2; 1/2)π
awas used in the present
work. It should be stressed that it is important to perform a spin-polarised cal-culation for the atom.With this procedure the energy of palladium is determined as Ec = 3.64 eV/atom.The experimental value is E0 = 3.94eV [69].
During the course of this work, the necessity to perform calculations concern-ing the oxygen adsorption on Ag(111) arose. The equilibrium lattice constantdetermined for silver is a0 = 4.15 A and the bulk modulus is B0 = 81GPa,obtained by using DFT-GGA.
3.2 Clean surface
Cleaving a bulk in any direction leads to the creation of a surface. A surfaceis called ideal or ”truncated bulk” if it remains unchanged after the cleavage.
4Only deviations from the usually employed basis sets will be explicitly mentioned through-out the text.
26 CHAPTER 3. PROPERTIES OF THE BULK AND CLEAN SURFACE
However, it is obvious that the bonding situation of the atoms at the surface isdifferent compared to the bulk. Some bonds have been severed and the resultingforces, which act on the atoms, lead to a displacement from their bulk-like posi-tions. Basically, there are two kinds of rearrangements that may occur. Overallchanges in the surface layer(s), with atoms moving in a way that changes theperiodicity of the surface are called reconstructions. Motions involving wholelayers of atoms, but no rearrangement of atoms within a layer, i.e. the lateralperiodicity is retained, are called relaxations [74].The two surfaces considered in this work
Figure 3.2: View of an fcc crystalwith 111 facets and one 100 face (tothe front). The primitive vectors ofeach surface, spanning a (1x1) cellare shown as well.
are the (111) and the (100) (shown in Fig.3.2). The (111) is close packed and has asixfold symmetry axis. The (100) surfaceis more open and has a fourfold symmetryaxis. All the unit vectors have a lengthequal to the next nearest neighbour dis-tance:
√2a0/2, where a0 is the bulk lattice
constant. On the (111) surface they forman angle of 120 and they are perpendicu-lar to each other on the (100) surface.The cleaving of a crystal, results in theformation of two surfaces of area A. Thisis not a spontaneous process and requiresa certain amount of energy. As a conse-quence, the internal energy, E, which defines the properties of any system withN particles and entropy S increases by an amount proportional to A. The internalenergy for one half of the crystal is then
E = TS − pV + µN + γA, (3.4)
where the proportionality constant γ is called surface energy. It is the energyneeded to create a surface and its unit is energy per area. The surface energyis an important quantity, which plays a key role for the determination of theequilibrium shape of a crystal. A general expression for the surface energy canbe obtained by identifying the Gibbs free energy (G = E − TS + pV ) in theequation above:
γ =1
A[G−Nµ] . (3.5)
For the simple case of an fcc crystal without a basis, which is the case for bothPd(111) and Pd(100), this formula can be further simplified:
γ =1
2A(Eslab
tot (NPd)−NPd · Ebulktot ). (3.6)
Eslabtot and Ebulk
tot are the ground state total energies of a slab (with NPd palladiumatoms) and of the bulk, determined by DFT. The factor 1
2takes into account,
3.2. CLEAN SURFACE 27
that the slab has two (equivalent) surfaces. Should the surfaces not be equivalent,the above formula (3.6) cannot be applied. At the absolute zero (T = 0K), invacuum (p = 0atm) and neglecting zero point vibrations, the calculated surfaceenergy for Pd(111) is γ = 0.56 eV/atom and for Pd(100), γ = 0.88 eV/atom.
Both the Pd(111) [75, 76] and Pd(100) [28] surface do not reconstruct, so oneonly has to be concerned with relaxations. When a surface relaxes, the topmostlayer moves either inward or outward, diminishing or increasing the distance be-tween the surface layers. Subsequent layers can be affected as well, though oftentheir displacement is less pronounced. Depending on the character of the atomicbonds in the bulk (if they are more ionic or more covalent), there are differentmodels which try to explain the relaxations on a microscopic level. For an ionicsolid, held together by coulomb forces, rather than local bonds, the surface con-figuration is determined by a balance between those and the core repulsion. Dueto the predominant long-range attraction between the atoms in the crystal, thelattice is compressed. Creation of a surface, releases the compression, so thatthe surface of the crystal should expand. For covalent compounds without long-range core attractions a contraction is often observed. It is explained in terms ofreinforcement of the bond to lower laying layers through the unsaturated bondsof the surface atoms.For the surface relaxation of metals, various models have been proposed. Themodel by Finnis and Heine [77], to mention but one of them, is based on theconcept of Smoluhowski smoothing [78]: if a perfect crystal is cut along theboundaries of Wigner-Seits cells, an artificial surface is created. Due to the sym-metry and neutrality of each Wigner-Seits cell, there will be no electrostatic forceacting on a nucleus, if the charge density is not allowed to relax. After relaxation,however, the density smoothens out and the charge redistribution gives rise toan inward electrostatic force on the top-layer nuclei.When a metal surface forms, the atoms of the top layer often move towards thebulk 5, diminishing the interlayer spacing, dij. The next layer relaxes in the oppo-site direction, i.e. outwards, expanding the distance to the following layer. Thedisplacement in the atomic positions is smaller and is further damped toward theinside of the bulk. For the 111 direction in a fcc crystal the distance betweensubsequent layers in the bulk (or unrelaxed clean surface), is db =
√3a0/3, where
a0 is the equilibrium lattice constant. The change in interlayer spacing is then(in %):
∆dij = [(dij − db)× 100]/db. (3.7)
For the clean Pd(111) surface an almost negligible contraction of d12 = 0.03%with respect to the bulk value db = 2.277 A is found for the topmost Pd-Pd inter-layer spacing. The distance between the second and third layer shows a similarlyinsignificant expansion of d23 = 0.08%.
5There are cases in which the top layer relaxes outwards, e.g. Beryllium.
28 CHAPTER 3. PROPERTIES OF THE BULK AND CLEAN SURFACE
The atomic arrangement of atoms at solid surfaces can be determined experimen-tally with high accuracy using low energy electron diffraction (LEED) measure-ments. Several studies are available for the clean Pd(111) surface, with whichthe calculations are in good agreement. In Ref. [75, 76, 79] only a slight expan-sion (ca. 1%) of the first interlayer spacing d12 is found, which (according to theauthors) might also be due to the presence of some residual hydrogen. In Ref.[22, 80, 81] no indication of surface relaxations is found. In the last reference thisis further supplemented by similar DFT findings. The value mentioned for thebulk interlayer spacing is 2.25 A [75, 76, 79].In its almost nonexistent surface relaxation, clean palladium (111) differs from itsleft-hand neighbours in the periodic table, which both show an appreciable firstinterlayer contraction: -3.9% at Ru(0001) [82] and -1.8% at Rh(111) [35]. Thisbehaviour reflects the variation of the metal bond strength with increasing d-bandoccupation as discussed by Methfessel et al. [83]. The magnitude of the relax-ation exhibited over the transition metal series shows a parabolic dependence onthe d-band filling. It mirrors the bonding-antibonding parabola and is thereforelargest for a half-full d-band. As the d-band is subsequently filled from Ru to Pd,being almost fully occupied in the case of the latter, the very small contractionfor the Pd(111) clean surface is to be expected. For Ag, as the right-hand nobleneighbour of Pd in the periodic system, the increase in sp-charge leads even to a0.5% expansion.
The workfunction Φ of a crystal surface is defined as the minimum energy requiredto remove an electron from the crystal to any point outside the surface, at adistance small compared to the surface dimensions, but large compared to thelattice constant a0. Therefore, the workfunction is by definition
Φ = φ(∞) + EN−1 − EN . (3.8)
Here φ(∞) is the total electrostatic potential far from the surface, EN and EN−1
are the ground-state energies of a neutral N -electron crystal and of the singlyionised crystal (one electron is removed from the system), respectively. Theelectron-spillout at the surface leads to the creation of a dipole layer, which theelectron has to overcome, in order to leave the solid. This requires work. Theworkfunction can be therefore expressed in terms of the change in electrostaticpotential across the dipole double layer and the chemical potential, i.e., using thedefinition of the chemical potential µ = ∂E/∂N = EN − EN−1 [84]
Φ = φ(∞)− µ = [φ(∞)− φ ]− µ . (3.9)
φ is the average of the total electrostatic potential over the metal and µ is thebulk chemical potential relative to the interior potential.In the case of a metallic system, the chemical potential is equal to the Fermienergy, EF , the value of the highest occupied Kohn-Sham eigenvalue, therefore
Φ = φ(∞)− EF . (3.10)
3.2. CLEAN SURFACE 29
-8 -6 -4 -2 0 2∈ − ∈f (eV)
0
1
2
3
Den
sity
of
stat
es (
stat
es/e
V) bulk
clean surface
Figure 3.3: Total DOS for palladium bulk (grey shaded area) and for the Pd(111)surface top layer atoms (black line).
Since the workfunction is related to the dipole barrier at the surface, which anelectron must transcend in order to escape from the solid, it is obviously depen-dent on the surface termination. This is reflected in the values calculated for twoof the low index surfaces of Pd. The value of the workfunction at the Pd(111)surface is Φ = 5.25 eV, while Φ = 5.16 eV is obtained for the (100) surface. Fromphotoelectric experimentas the workfunction for a polycrystalline Pd sample ismeasured to be 5.12 eV [85] and 5.6 eV for crystalline Pd(111) [86]. The no-ticeable difference between theory and experiment (0.35 eV) is in line with otherGGA calculations. In Ref. [83] the following values obtained from FP-LMTOcalculations are reported: Φ(Pd(111)) = 5.53 eV and Φ(Pd(100)) = 5.30 eV.
In the end, it is interesting to take a look at the changes the density of states(DOS) undergoes at a surface. The total DOS of a palladium bulk and the totalDOS of the surface layer atoms of a Pd(111) surface are shown in Fig. 3.3. TheDOS is comprised mostly of d-states. A narrowing of the d-band at the surface,compared to the bulk, is clearly seen. This can be understood by the followingsimple model [87]. At the surface the coordination of the atoms is reduced com-pared to the bulk. For the surface to retain its charge neutrality, the center of thed-band shifts. This shift is negative for less than half-filled d-bands and positivein the opposite case. This shift increases with the number of broken bonds at thesurface.For palladium, which has an almost full d-band the band center moves upwards,i.e. towards EF .
30 CHAPTER 3. PROPERTIES OF THE BULK AND CLEAN SURFACE
Chapter 4
Oxygen adlayers on Pd(111)
This chapter will focus on the on-surface chemisorption of oxygen on Pd(111) forcoverages up to one monolayer (ML). For a fully adsorbate covered surface, i.e.1ML, the number of oxygen atoms on the surface equals the number of substrateatoms in the first layer. A prerequisite for such a study is the knowledge of thesites available for on-surface adsorption, some of which are shown in Fig.4.1.
The high symmetry sites on the (111) sur-
Figure 4.1: View of the Pd(111)surface. The palladium atoms arerepresented by the large white (1stlayer) and grey (light grey: 2ndlayer, dark grey: 3rd layer) circles.The small dark circles depict theoxygen atoms in different adsorptionsites. The (1x1) cell, spanned by theprimitive vectors a1 and a2 is shownas well.
face are: on-top, bridge, and two hollowsites - hcp and fcc. (The sub-surface siteswill be discussed in the following chapter).An atom adsorbed in an on-top site (notshown in Fig.4.1) is situated just abovea substrate atom of the first layer. Thebridge position is found between two firstlayer atoms. The two three-fold hollowsited differ only slightly - an oxygen atomin fcc is located above a palladium atom ofthe third layer, while an hcp site is abovea palladium atom of the second layer. Forand hexagonal close packed material (e.g.Ru) the situation is the same, with the soleexception that the ”fcc” site has no atombelow it.The two primitive vectors of the (111) sur-face are also shown in Fig. 4.1. Theyform an angle of 120 and are connected tothe equilibrium lattice constant a0 throughthe equation |a1| = |a2| =
√2a0/2, as
metioned in the previous chapter.When an atom (or molecule) is adsorbed on a surface, it usually favours a givenhigh symmetry site. Such a preference is identified by comparing the energetics
31
32 CHAPTER 4. OXYGEN ADLAYERS ON PD(111)
of different geometries with the adsorbate in varying sites. The structure withthe lowest energy is then the most stable one, within the subset of consideredadsorbate phases at a certain coverage.
4.1 Energetics
To investigate the chemisorption of O on the Pd(111) surface, the oxygen coverageis increased from 0 to 1 monolayer (ML) in quarter ML steps. Zero coverage,obviously, corresponds to the clean surface.The central quantity obtained from the DFT calculations is the average bindingenergy of oxygen defined as
Eb(θ) = − 1
NO
(EO@M − EM −NO
(1
2EO2
)), (4.1)
where NO is the total number of O atoms (on-surface or sub-surface) present inthe unit-cell at the considered coverage. EO@M, EM and EO2 are the total energiesof the slab containing oxygen, the corresponding clean metal (111) slab and ofan isolated oxygen molecule, respectively. The definition is such, that a positivenumber indicates that the dissociative adsorption of O2 is exothermic (stable)and a negative number indicates endothermic (unstable).
Table 4.1: Binding energies (in eV/atom) for O on Pd(111), relative to the dis-sociation energy of the oxygen molecule, for the investigated surface structures.The differences in binding energies, ∆E, calculated relative to the respectivefcc-hollow site value, are also given.
The calculated binding energies for the considered sites are summarized in Ta-ble 4.1. The oxygen prefers adsorption in the highly-coordinated hollow sites,in agreement with previous high-resolution electron energy loss spectroscopy(HREELS) [18] data and previous DFT calculations [25]. Furthermore, a prefer-ence for the fcc site over the hcp site is revealed, which is with ≈ 0.2 eV almostconstant over the whole considered coverage range. For the two borderline casesat 0.25ML and 1ML coverage the bridge site between two palladium atoms wasalso tested. As expected [18, 25], it turned out to be less stable than adsorptionin the hollow sites and is therefore not considered further. Still, it is interesting
4.1. ENERGETICS 33
to notice, that in both the O (2 × 2) and the O (1 × 1) the brigde site is about0.5 eV less stable than the fcc sites, suggesting that the diffusion barrier also doesnot vary much with coverage.The energy difference between the two hol-
0.25 0.50 0.75 1.00
Oxygen coverage (ML)
0
0.3
0.6
0.9
1.2
1.5
Bin
ding
Ene
rgy
(eV
/ato
m)
fcchcp
Figure 4.2: Calculalted binding en-ergies of oxygen on Pd(111) in fcc-(solid circle) and hcp- (open square)hollow sites, for various coverages,with respect to the dissociation en-ergy of oxygen
low sites is similar to the one found onRh(111) [35], while for O/Ru(0001) [34] itis large for lower coverages and only be-comes as small as 0.1 eV for 1ML. Thepreference for the fcc adsite on fcc Pd(111)is also consistent with observation on thebasal plane of Ru, Rh and Ag, where oxy-gen is always found to occupy those sitesthat continue the bulk layer sequence (i.e.fcc on fcc Rh, Ag; hcp on hcp Ru) [4, 34,35]. In this respect and similar to the con-clusions of the study by Seitsonen et al.[22], this calculations cast severe doubt onthe interpretation of ion scattering databy Steltenpohl and Memmel, determiningthe hcp site as the most stable O adsorp-tion site on Pd(111) [88]. However, at thispoint one can not rule out, that the top layer of Pd(111) shifts upon oxygen ad-sorption (e.g. at steps), assuming a hcp stacking at the surface. Such a situationmay confuse an experimental analysis. Calculations for Ru(0001) [89] show thatsuch a shift is in fact likely, at least for Ru.A marked decrease in the binding energy with increasing oxygen coverage is ob-served, cf. Fig. 4.2. This weakening of the adsorbate-substrate bond reflects theoverall repulsive lateral interactions within the more and more densely packedelectronegative overlayer. It favours the formation of dilute adlayer struturesover dense islands. Should the slope of E(θ) have had the opposite incline oxy-gen islands would have been the prefered structure. However, no conclusions canbe drawn as to which ordered or disordered overlayers may actually form as athermodynamik phase (allowing also for metastable states) on the basis of thefew ordered structures calculated here. Such a statement requires the additionalevaluation of a larger set of structures, leading to the construction of a latticegas Hamiltonian, thus making the subsequent Monte Carlo calculations possible[90].It is instructive to compare the interactions of palladium with oxygen, once more,to its 4d neighbours. Detailed studies on the oxygen adsorption in the coveragerange up to 1ML on Ru(0001), Rh(111) and Ag(111) are available from DFT cal-culations [4, 34, 35]. In particular the study by Ganduglia-Pirovano and Scheffleron Rh(111) [35] used a FP-LAPW setup analogous to the one of this work. Theother two studies use the pseudo-potentials approach. The O/Ru(0001) system
34 CHAPTER 4. OXYGEN ADLAYERS ON PD(111)
has been also investigated with the FP-LAPW method [82]. To complete thestudy for all four elements within one method using a similar setup, severalcalculations for O on Ag(111) were performed 1. This data is used to plot the de-pendence of the binding energy on coverage, for the most stable oxygen adsoptionsite on the basal plane of each of the considered elements, cf. Fig. 4.3. A similardecrease over the investigated coverage range, which agrees even in magnitude, isobserved. While this suggests similar lateral interactions at these four surfaces,the absolute bond strength decreases progressively throughout the sequence oflate 4d TMs.
In contrast to the highly exothermic
0.25 0.50 0.75 1.00Oxygen coverage (ML)
-1.0
0.0
1.0
2.0
3.0
Bin
ding
Ene
rgy
(eV
/Ato
m)
Ru
Rh
Pd
Ag
Figure 4.3: Calculated binding energyfor on-surface O chemisorption on thebasal surface on the late 4d transi-tion metals. Shown is the energyof the most stable adsorption site ineach case, i.e. hcp on Ru(0001) andfcc on Rh(111), Pd(111) and Ag(111).Data: O/Ru(0001) [82], O/Rh(111) [35],O/Ag(111) - this work, basis set de-scribed in footnote 1.
binding of oxygen on Ru(0001), thebond strength on Ag(111) is alreadyso small, that dissociative adsorptionwould be endothermic for coverages be-yond 0.5ML. The reason for this grad-ual weakening of the bond strength isthe continued filling of the d-band to-wards the right of the periodic table.The consequence is an increased oc-cupation of antibonding oxygen-metalstates, which weakens the bonding [91].To illustrate this concept, the projectedlocal density of states for each of thefour elements at a full ML coveragewith oxygen, are shown in Fig. 4.4.The gray shaded area corresponds tothe metal d projected DOS, while thedark shaded area shows the O p-states.The interaction of the adsorbate stateswith the narrow d-band of the metalsgives rise to a split in the oxygen statesinto two states situated on both sides of the d-band. One state is bonding withrespect to the adsorbate and the metal d-states and the other, above the d-band,is antibonding. A comparisson of the four pictures shows that a continued fillingof the metal d-states goes hand in hand with the population of antibonding statesof oxygen. While for ruthenium the weight is on the side of the bonding states,the picture is completely reversed for silver.
1RMT = 2.36 bohr, ROMT = 1.3 bohr, wave function expansion inside the muffin tin spheres up
to lwfmax = 12, potential expansion up to lpot
max = 4, and local orbitals for the 4s and 4p semicorestates of Ag, as well as for the O 2s. The energy cutoff for the plane wave representation in theinterstitial region between the muffin tin spheres was Emax
wf = 17Ry for the wavefunctions andEmax
pot = 169Ry for the potential. A (12 × 12 × 01) Mohnkhorst-Pack grid with 19 irreduciblek points, was used for the Brillouin zone intergration. To obtain the same sampling of the
4.1. ENERGETICS 35
0 1 2 3
4
-4
-8
Ene
rgy
(eV
)
Ru
EF
0 1 2 3Density of sta
Rh
0 1 2 3tes (states/eV)
Pd
0 1 2 3
Ag
Figure 4.4: Density of states for 1ML O adsorbed on the basal surface of the late4d transition metals, projected on the metal 4d states (grey) and oxygen 2p states(black). All calculations were performed with FP-LAPW using the following basisset paramters: Ru - basis set as described in Ref. [89]; Rh - RO
MT = 2.2 bohr, allremaining parameters are as described for palladium in A.0.2; Ag - s. footnote 1.
4.1.0.1 Oxygen induced surface relaxations
The presence of adsorbates can perturb the periodicity of the clean surface. Itwas shown in the preceding discussion that the oxygen-palladium interactionsare sufficiently strong to favour the creation of commensurable overlayers, whichthen may have larger surface unit cells. Since the adsorbate coverage in the sub-monolayer range was increased in quarter monolayer steps, (2 × 2) cells can beused to describe the ensuing structures. In the following, a detailed description
Table 4.2: Calculated structural parameters in A for the O-(2 × 2)/Pd(111)structure with O in the fcc-hollow position. For the interlayer distances, thecenter of mass of each Pd layer is used. dO−Pd indicates the bondlength and∆z1, ∆z2 the buckling in the first and second outermost layers, respectively.The percentual relaxations are calculated with respect to the bulk value (positivevalue means expansion, negative contraction). The experimental LEED data andpseudopotential DFT-GGA values are from Ref. [22].
reciprocal space for bigger surface cells, this number was reduced accordingly.
36 CHAPTER 4. OXYGEN ADLAYERS ON PD(111)
Figure 4.5: Top and side view of the atomic geometry of (2×2)-O/Pd(111). Thesmall dark grey cirlces represent the oxygen atoms. The large white and greycircles represent the palladium atoms, where those lying in the same plane andequivalent under the threefold symmetry have the same colour. The arrows (notdrawn to scale) indicate the direction of the displacements of the substrate atomswith respect to the bulk positions.
of the relaxed atomic geometries for the most stable stuctures (i.e. oxygen ad-sorbed in fcc hollow site) at different coverages, is given. For each case the oxygenoverlayer and the two outermost Pd(111) layers were fully relaxed. To determineinterlayer distances, the center of mass of each layer is used.At a 0.25ML coverage one fourth of the available hollow sites are occupied givingrise to an O (2×2) structure, see Fig. 4.5. This is the only hitherto experimentallyanalysed structure. The calculated geometry parameters are in good agreementwith the existing LEED data [22], as summarised in Table 4.2. Oxygen pushesits three Pd neighbours a little bit radially away (0.03 A) and lifts them up. Thisis counteracted by a downward movement of the remaining undercoordinated Pdatom in the (2 × 2) cell, leading to a modest first and (indirectly) second layerbuckling of 0.09 A and 0.10 A, respectively. Overall this changes the slight com-pression of the clean surface d12 into a small expansion, but in total the firstinterlayer relaxation is still negligible.Due to the lowered symmetry the relaxation pattern for the O (2 × 1) struc-ture, corresponding to 0.50ML oxygen coverage, is a bit more complex, cf. Fig.4.6 (left). An upward, sideward (0.06 A) movement of the twofold O-coordinatedsurface Pd atoms displaces the oxygen by 0.05 A from the ideal fcc site towardsthe top side. This goes hand in hand with a downward movement of the onefoldO-coordinated Pd surface atoms, yielding a substantial 0.16 A first-layer buck-ling. The oxygen-induced increase of d12 found for the 1/4ML phase continues
4.1. ENERGETICS 37
Figure 4.6: Top and side view of the atomic geometry of (2 × 1)-O/Pd(111) tothe left, and of 3O (2× 2) to the right.
and results in a +2.0% expansion with respect to the bulk value. The distancebetween second and third layer is also expanded (+0.9%). In addition the secondlayer is still quite buckled (0.10 A).Further increase of the oxygen coverage to θ = 0.75ML leads back to a threefoldsymmetry structure, the 3O (2× 2), shown in Fig. 4.6 (right). Here the bucklingis less pronounced (0.09 A and 0.05 A in first and second layer respectively), butthe overall relaxation pattern is the same as before: oxygen is slightly pushedlaterally away from the highest coordinated surface atoms, while the three Pdatoms, that are equivalent under the threefold symmetry have moved slightly(0.04 A) closer to each other. The first and second interlayer spacing is furtherexpanded (+2.6% and +1.3%). It comes therefore as a surprise that this layerrelaxation trend is not continued, and even reversed, in the final O(1× 1) struc-ture (where lateral displacements are not possible by symmetry). Whereas d23
is found to be expanded to now +1.8%, the first interlayer distance suddenlyexhibits a significant contraction of -1.7%.As a first step towards understanding this somewhat puzzling result and to en-sure that it is not just an artefact of the calculation, the total-energy landscapefor the O (1 × 1) was mapped out as a function of the relaxation. For varyingvalues of d12 and d23 the interlayer distances were kept fixed, while the oxygenlayer was relaxed. The ensuing result shows a very shallow energy corrugationof only 0.05 eV. A local minimum, separated by a small energy barrier (0.02 eV)from the global minium, seems to exist at about d12=2.0% and d23= 1.0%. Theglobal minium is quite spreadout. Still, it lies in the same region as the reportedfirst palladium layer contraction.The question arises if this result is due to the adsorbed oxygen or a true fea-ture of palladium. Performing the same study for the clean metal surface, i.e.
Figure 4.7: Calculated change in the mean outermost layer spacing relative tothat of a bulk-teminated surface, as a function of oxygen coverage. The resultsfor Ru(0001) and Rh(111) are taken from Refs. [35, 82]. The results for Ag(111)are from the already mentioned FP-LAPW calculations (cf. footnote 1)
determinining the energy for different fixed values of d12 and d23, show a fairlysymmetric energy surface with just one minimum. It is, however, once again veryshallow, indicating already that the observed contraction for the full monolayeroxygen coverage is largely due to the properties of palladium.
A comparison to the neighbouring 4d elements may help to shed light into therelaxation behaviour of Pd. The results obtained within the FP-LAPW methodare used once again, to exclude any additional uncertainties, possibly due tothe use of pseudo-potentials in the studies on Ru(0001) [34] and Ag(111) [4] 2.The calculated changes in mean interlayer distance d12 as a function of cover-age, with oxygen each time in the most stable adsites (i.e. fcc on Rh, Pd, Ag;and hcp on Ru) are displayed in Fig 4.7 and show significant differences betweenthe four metals. For the clean surfaces, the aforediscussed strong contraction forRu(0001) is lifted gradually from Rh(111) to Pd(111) and Ag(111). Furthermore,oxygen adsorption induces a strong increase of the outermost interlayer distanceon Ru(0001) and Rh(111), that is almost linear with coverage. This is a reflectionof the strong oxygen-metal bonds formed in these systems, weakening the remain-ing backbonding of the first-layer atoms to the underlying substrate. At Ag(111)on the other hand, d12 stays first more or less constant, and then even contractsat full ML coverage. This has likewise been attributed to the rather weak O-Ag
2Overall a very good agreement with the surface geometries described in the pseudopotentialstudies, was obtained for Ru(0001) and Ag(111). In particular, all oxygen-induced lateraldisplacements and buckling in the first two layers are found to be very similar for all fourmetals for all on-surface structures – both in magnitude and directions. Correspondingly, onecan consider these details in the relaxation pattern to be a mere consequence of the specificadsorption geometry with O in the threefold hollow sites.
4.1. ENERGETICS 39
0.00 0.25 0.50 0.75 1.00
Oxygen coverage (ML)
0.0
0.3
0.6
0.9
1.2
1.5
∆ Φ
(eV
)
fcchcp
0.25 0.50 0.75 1.000.24
0.26
0.28
0.30
0.32
0.34
0.36
µ (D
ebye
)
fcchcp
Figure 4.8: Calculated workfunction change (left) and dipole moment (right) forO on Pd(111) as a function of the oxygen coverage θ, for the two most stableon-surface adsorption sites, i.e. fcc (filled circle) and hcp (empty triangle) hollowsites.
bonds that are no longer able to significantly disturb the metal surface geometry[4] 3. Within this picture, O/Pd(111) appears as a borderline case. Initially, theO-Pd bond is still strong enough to induce a progressive expansion of the firstinterlayer distance with increasing O coverage, cf. Fig. 4.7. Yet, compared toRu and Rh the bond strength is already so weak that this expansion is muchless pronounced (smaller slope). And in the O (1 × 1) structure, the repulsivelateral interactions among the adsorbates have further weakened the O-Pd bondso much, that the outward relaxation can no longer be sustained and the surfaceprefers to contract, resembling in this aspect the Ag(111) surface. Of course,this tentative assignment glosses over many details, as e.g. reflected in the al-most constant O-Pd bondlength of 1.98 ± 0.01 A over the whole sub-monolayercoverage range, which resembles much more the values found on Ru(0001) andRh(111), rather than the 2.1 A obtained for Ag.
4.1.0.2 Electronic structure
Proceeding towards the electronic properties of the O/Pd(111) system, first thechange in the workfunction ∆Φ(θ), relative to the clean surface, is considered asa function of oxygen coverage. For the clean surface the calculated workfunction
3It should be mentioned, however, that the character of the bonding on Pd and Ag is quitedifferent. In Ag the bonding is goverened largely by d − d repulsion and s-bonding. The Pd4d-band is almost completely full. The additional electron, when going from Pd to Ag can,therefore, go only partly into the d-band, and then at its antibonding end. For a more then half-full d-band, each additional d-electron, reduces the inward relaxation of the localised d-bonds.The increase sp-charge (for Ag), increases the inward relaxation effect of the Smoluchowskismoothing [83]. Therefore, Ag-Ag attraction is due to the s-electrons, while the O-Ag bondingis probably due mostly to 4d-electrons.
40 CHAPTER 4. OXYGEN ADLAYERS ON PD(111)
-
-
-
-
OPd
-
-
-
-
O
Pd
(e/A )o 3
-0.33
-0.27
-0.21
-0.15
-0.09
-0.03
0.03
0.09
0.15
0.21
0.27
0.33
Figure 4.9: Difference electron density plot for 0.25ML (left) and 1.00ML (right)oxygen adsorbed on Pd(111) in fcc-hollow site. The contour plot depicts the[211] plane perpendicular to the (111) surface. Areas of electron accumulationand depletion have positive and negative signs respectively, contour lines aredrawn at 0.06 e/A3. The small black lines to the left of each picture show theapproximate position of the respective atom layers, i.e. one oxygen and threepalladium layers.
is 5.25 eV (see chapter 3.2). As shown in Fig. 4.8 (left), ∆Φ(θ) rises almostlinearly with coverage for both hollow adsorption sites, but is slightly larger forthe fcc site. Both curves exhibit a typical curvature reflecting a depolarisationwith increasing covarage. To the right in Fig. 4.8 the adsorbate-induced dipolemoment is shown, for which the depolarisation is also visible - it decreases byabout 20% from a quarter to full monolayer coverage.The adsorbate dipole moment is a direct consequence of the adsorbate-inducedelectron density redistribution, which is shown in Fig. 4.9. The difference electrondensity is determined by subtracting from the electron density of the chemisorbedsystem, n∆(r), both that of the clean Pd(111) surface (nsub(r)), and that ofthe isolated adsorbate layer (nad(r)), the interatomic distances of the latter twocorresponding exactly to those the adsorbate system [92]:
n∆(r) = n(r)− nsub(r)− nad(r). (4.2)
A difference electron density analysis might also allow the identification of orbitalsinvolved in the interactions between adsorbate and substrate, hence, it yields amicroscopic understanding of the binding mechanism.The difference electon density plot for the O (2× 2) (Fig. 4.9 (left)) and O (1× 1)(Fig. 4.9 (right)) structures, with O adsorbed in the fcc hollow site, depict aplane perpendicular to the surface. Obviously for the 0.25ML case (left), the
4.1. ENERGETICS 41
perturbation of the surface due to the oxygen atom is localised mostly on theoxygen atom itself and on its neares neighbour Pd atom. For oxygen adsorbedin the hcp site, the result is essentially the same, rendering the small differencefound between the O binding energy of these two sites comprehensible. Thesymmtery of the orbitals involved in the bonding suggests that it (the bonding)occurs through a hybridisation of the 2p-orbitals of the oxygen and the palladium4dxz/4dyz states. Furthermore, the electron density of the oxygen atom is quitepolarised, and enhanced on the vacuum side. The palladium orbitals pointingtowards the oxygen are depleted, while the ones pointing away from it, have anenhance electron density. The resulting (inward pointing) surface dipole momentmay be quantified via the Helmholtz equation [93, 94, 95]
µ = (1/12π)A ∆Φ/θ, (4.3)
where A is the area per (1x1) surface unit cell (in A2). The induced work functionchange, ∆Φ(θ) = Φ(θ) − Φclean is given in eV and the coverage θ in ML. Thenthe dipole moment is measured in Debye.
Table 4.3: Change in the workfuntion and dipole moment for O in fcc hollow onPd(111) with coverage.
Comparing the difference elelctron density pictures for the O (2 × 2) and theO (1× 1) structures, it is noticeable that the electron density distribution for thefull monolayer case is rather delocalised. This is reflected in the decrease of thesurface dipole moment µ with increasing oxygen coverage (cf. Fig. 4.8).The adsorbate-adsorbate interactions, obviously, also af-
M K
Γ
Figure 4.11: SurfaceBrillouin zone.
fect the density of states (DOS). The DOS for the cleanPd(111) surface, the 1/4ML and 1ML O/Pd(111) struc-tures with O in fcc sites is shown in Fig. 4.10. Compar-ing the DOS of the clean surface with the DOS of eitheradsorbate structures (cf. Fig. 4.10 (a)), reveals the O-Pd bonding and antibonding states. They are seen evenbetter in the difference DOS 4, Fig. 4.10 (b), and arelocated just below and just above the nearly fully occu-pied palladium d-band. The bonding states are around5-8 eV below the Fermi-level and the antibonding statesaround and just above the Fermi level.An appreciable splitting is seen in the O-Pd bonding peaks at the lower end of the
4The difference DOS shows the adsorbate induces change, i.e. ∆N = NO@M −NM [92].
Figure 4.10: Left (a): Calculated total density of states (DOS) for a one-foldcoordinated surface Pd atom in the (2x2)-O/Pd(111) system (solid line) and athreefold O-coordinated Pd atom in the (1x1)-O/Pd(111) structure (dashed line).The DOS of the top layer Pd atom of the clean surface is shown as a grey area.Left (b): Corresponding difference of the DOS. Right: Surface band structure ofO (1x1)/Pd(111) (solid lines). The grey area corresponds to the projected Pd bulkband structure, and the circle segments reflect the oxygen p-orbital character ofthe bands: px (orange), py (blue) and pz (red). The radia scale with the projectiononto the corresponding spherical harmonics within the oxygen muffin-tin spheres.
d-band for the full monolayer – 4 peaks are clearly discernable. At this coveragethe formation of an adsorbate band structure is expected [92], shown to the rightin Fig. 4.10. The three lower peaks (-7.2 eV to -5.8 eV) are clearly due to thebonding states of the O2p orbitals (the antibonding states are seen just abovethe Fermi energy in the surface bandstructure plot). The peak around -4.7 eVhas mainly d character and can be traced back to a state which splits off the bulkd-band at the K point (cf. Fig. 4.11).
It is again instructive to compare these findings with the detailed results availablefor O at the other late 4d TMs [4, 34, 35]. Concerning the DOS the obviousdifference between Ru, Rh, Pd and Ag is the progressively higher lying Fermi-level in the 4d-band, yielding an about half-filled band in Ru and a fully occupiedband in Ag. Since the O-metal interactions give rise to bonding and antibondingstates located at the lower and upper edge of the 4d-band, the filling of the d-band towards the right of the periodic table populates the antibonding states.As already mentioned in section 5.5, the consequence is a substantially weakened
4.1. ENERGETICS 43
oxygen bond strength, decreasing roughly by 1 eV for each element towards theright within this late 4d series. Despite this appreciable change in the energetics,the nature of the O-metal bond as arising primarily from the interaction with the4d-states does not change, and correspondingly difference electron density plotse.g. as published for the O(2 × 2) phase on Ru(0001) [34], on Rh(111) [35], onPd(111), cf. Fig. 4.9, and Ag(111) [4] are exceedingly alike.Concerning the workfunction a similar increase with oxygen coverage has beenreported for Ru(0001), Rh(111) and Ag(111). On the prior two surfaces, eventhe absolute magnitude of the rise is very similar to the one found for Pd(111).At least for coverages up to 3/4ML, as both Ru and Rh exhibit a saturation of∆Φ for the O(1× 1) structure, i.e. the value of the workfunction remains almostconstant for 0.75 ML < θ ≤ 1.00 ML. Pd(111) does not show such a saturationand is in this respect more similar to Ag(111), for which a monotonic increaseup to the full monolayer was computed. However, this rise is more than twice aslarge compared to the one at the basal plane of Ru, Rh and Pd. This trend isconsistent with the observation that the difference in electronegativity betweenO and Ru, Rh and Pd seems to be almost constant, while it is slightly higherfor Ag [96]. Similar to the conclusion obtained from the surface relaxations, Pdappears therefore as a borderline case in this late 4d series, which shows highsimilarities to its lefthand neighbours for lower O coverages, but switches at thefull oxygen ML coverage to resemble more Ag.
44 CHAPTER 4. OXYGEN ADLAYERS ON PD(111)
Chapter 5
Oxygen incorporation into thePd(111) surface
Proceeding with the investigation of the oxygen-palladium system, this chapteraddresses the issue of oxygen incorporation into the (111) surface of this transitionmetal. The initail penetration of oxygen into the region between first and secondsubstrate layer will be studied, as well as the implications this has for oxideformation. Furthermore, the question about the amount of oxygen that can besolved in the bulk will be investigated.To study the penetration of O into the Pd(111) surface, one has to look at theseveral available sub-surface sites. There are three high-symmetry interstitialsites, that have to be taken into account: one octahedral site with sixfold Pdcoordination (henceforth referred to as
Figure 5.1: High-symmetry sub-surfaceadsorption sites, available between twolayers of an fcc or hcp metal. Big lightballs depict the metal atoms, small darkballs - the adsorbate.
octa) and two tetrahedral sites withfourfold Pd coordination (henceforthreferred to as tetra-I and tetra-II). Theocta and the tetra-I sites are locateddirectly below the on-surface fcc andhcp sites, respectively, whereas the tetra-II site is found below a surface Pd atom,as sketched in Fig. 5.1. (In a bulk ma-terial one would have to consider onlyan ”octa” and one ”tetra” site - therewould be no distinction between ”tetra-I” and ”tetra-II”. Close to the surfacethe sites have a reduced symmetry (only C3V symmetry), making such a differ-entiation necessary.) The same sites are also present at the (0001) surface of anhcp metal (i.e. Ru).Each of the three sub-surface sites was considered for the oxygen adsorption onpalladium along with the available on-surface sites. However, for each consid-ered coverage, adsorption in a sub-surface site alone was energetically always lessfavourable than adsorption in a threefold-hollow site. In most cases pure
45
46CHAPTER 5. OXYGEN INCORPORATION INTO THE PD(111) SURFACE
Table 5.1: Binding energies (in eV/atom) for O adsorbed in one of the availablehigh-symmetry sub-surface sites on Pd(111), relative to the dissociation energyof the oxygen molecule.
sub-surface adsorption is even endothermic, cf. Table 5.1.It was seen in the preceding chapter, that the binding energy for on-surface ad-sorption, decreases progressively not only throughout the sequence of elements, inwhich the 4d-states are successively filled, but increasing oxygen coverage causesa decline as well. In the case of palladium the full monolayer coverage came outjust exothermic, whereas for silver, coverages beyond 1/2ML were already en-dothermic. In this regard, one has to consider that oxygen may start penetratinginto the Pd(111) surface even before a full monolayer is adsorbed on it.
5.1 Thermodynamic model
The coverage, at which oxygen incorporation into the surface should begin, canbe estimated with the help of a thermodynamic equilibrium model proposed byKing and coworkers [97], already from the data available for the on-surface adsorp-tion. The model assumes that the critical coverage, θthd
c , at which the transitionbetween a chemisorbed phase and the appearance of an oxidic film occurs is ther-modynamically, not kinetically, determined, meaning that below θthd
c the heat ofadsorption of the chemisorbed phase is higher than the heat of formation of theoxide. This reasoning has been applied successfully to explain experimental dataon the critical coverage for oxide formation on Ni(100) and Ag(111) [97].The binding energy, Eb, of oxygen adsorbed on any of the so far discussed tran-sition metals, decreases with coverage (cf. Fig. 4.3). This allows to approximatethe integral heat of adsorption as ∆Had(θ) ≈ Eb(θ) · θ. Then, the above state-ment translates as follows: Repulsive interactions between the O adatoms drivethe differential heat of adsorption, ∂(∆Had)/∂θ , down sharply with increasingcoverage, until at θthd
c it is equal to the heat of formation of an oxide,
[∂(∆Had)/∂θ]θthdc
= ∆Hoxidef . (5.1)
To evaluate the differential heat of adsorption,
∂
∂θ∆Had(θ) ≈
∂
∂θ[Eb(θ) · θ] = Eb(θ) + θ · ∂Eb
∂θ, (5.2)
5.2. INITIAL OXYGEN INCORPORATION 47
the computed values for Eb and their change with coverage, ∂Eb/∂θ, are needed.The later are easily obtained from the slope of the calculated binding energycurves, Eb(θ), which are roughly linear with coverage (cf. Fig. (4.3)):
Eb(θ) ≈ Eb(0.25 ML) + (θ − 0.25 ML)∂Eb
∂θ, (5.3)
The heat of formation, ∆Hoxidef , of the most stable bulk oxide phase for each of
the considered metals is: ∆Hf (RuO2) = 3.4 eV [89], ∆Hf (Rh2O3) = 3.8 eV [98],∆Hf (PdO) = 0.9 eV [99] and ∆Hf (Ag2O) = 0.2 eV [100], available from DFTcalculations 1. After solving eq. (5.1) for the critical coverage,
θthdc =
∆Hoxidef − Eb(0.25 ML) + 0.25 ML · dEb
dθ
2dEb
dθ
, (5.4)
one obtains the values listed in Table 5.2 for the coverage at which the transitionto an oxide should occur. Therefore, within this model, it is expected that the
Ru Rh Pd Agθthd
c [ML] 0.84 0.56 0.32 0.23
Table 5.2: Calculated critical thermodynamic coverage (in ML), θthdc , for the
oxide formation on the late 4d transition metals.
oxide phase will become more stable only after almost a full ML of oxygen isadsorbed on the Ru surface. This value decreases sequentially for Rh and Pd,until it is less than a quarter of a ML for Ag.
5.2 Initial oxygen incorporation
The thermodynamic model gives the coverage relevant for oxide formation, butdoes not account for the microscopic processes underlying the phase transitionfrom an adsorbate layer to an oxide 2. Trying to supplement the thermodynamicresult with microscopic information, the incorporation of the first O atom into thesub-surface region of Pd(111), which initiates the oxide formation, is addressedin the following.Occupation of sub-surface sites will commence when a structure containing oxy-gen in sub-surface sites becomes energetically more stable than its counterpartwith the same total oxygen coverage, θtot, but with O adsorbed just on the
1To determine θthdc the heat of formation of the oxide is needed per oxygen atom, i.e.,
2Here and in the following the term ”oxide” does not necessarily have to mean three-dimensional bulk oxide. While the oxide phase observed on Ru(0001) is RuO2(110) [1], Pdand Ag show an affinity towards the formation of surface oxides [3, 101, 102]. Surface oxideswill be discussed in the following chapters.
48CHAPTER 5. OXYGEN INCORPORATION INTO THE PD(111) SURFACE
Figure 5.2: Top view of all possible on-surface/sub-surface site combinations fortotal coverages: a) θtot = 1ML, b) θtot = 0.75ML, c) θtot = 0.50ML. Inequivalentgeometries with the same site occupation are denoted with (a) and (b), the (a)-geometries being the more stable ones. Big spheres correspond to palladiumatoms (white = surface layer, light grey = second layer). O atoms = smallspheres (gray = on-surface, black = sub-surface. Sub-surface oxygen atoms inthetra-II sites are invisible in this representation and are shown schematically assmall white circles.
5.2. INITIAL OXYGEN INCORPORATION 49
surface. This implies that the stability and properties of structures, contain-ing both on-surface and sub-surface oxygen, at coverages up to one monolayer,0 < θtot ≤ 1ML, have to be studied.Such a study was carried out employing (2×2) cells. The limitation to relativelysmall cells does, of course, not allow to pinpoint the exact coverage, at which thefirst oxygen atom will penetrate into the surface. Still, one will hadly be able todetermine the exact coverage, even if much bigger cells were used, which is notreally feasible. Besides, even the use of (3 × 3) cells does not seem reasonable,provided that one is able to obtain the needed information from a (2×2) cell cal-culation. Already such a calculation makes it possible to define a coverage range,in which the oxygen penetration into the surface will start. Therefore, one canhope to perform a trend study concerning the initial oxygen incorporation intothe basal surface of each of the 4d transition metals, considered in the preceding,even by using ”just” (2× 2) cells.The use of (2×2) unit cells means that the average binding energy of fully relaxedgeometries containing from Ntot = 1 (θtot = 0.25ML) to Ntot = 4 (θtot = 1.00ML)oxygen atoms is calculated. Of this Ntot oxygen atoms, O ≤ Nsub ≤ Ntot canbe located below the surface. Considering that there are two threefold hollowsites available for surface adsorption and three high-symmetry interstitial sitesbetween the first and the second metal layer, a vast host of possible combina-tions has to be taken into account. In particular, one has to be aware, that incases of mixed occupation several symmetry inequivalent structures, for the samecombination of on-surface and sub-surface sites, may exist. Since for every given(θtot, Nsub/Ntot), structures with site occupation of (Ntot −Nsub) on-surface O ineither fcc or hcp, and Nsub O atoms in either of the three sub-surface sites, haveto be tested, this may result in as many as 12 trial geometries per coverage.To investigate the incorporation of the first atom into the surface, one has tolook at structures with Nsub = 1. All such structures with mixed on-surface/sub-surface site occupation, which are possible at the different considered coverages(θtot =1.00ML, Nsub/Ntot =1/3), (θtot =0.75ML, Nsub/Ntot =1/2), (θtot =0.50ML,Nsub/Ntot =1/1), are shown in Fig. 5.2. Two symmetry inequivalent geome-tries exist for each case. For two of them, namely fcc/octa and hcp/tetra-I, onesite combination can be, however, excluded from the beginning, since in it oneon-surface and one sub-surface oxygen atom sit directly above each other (notshown). Due to the strong repulsion arising between the electronegative oxygenswhen they get close to each other (as seen in the previous chapter), it is clearfrom the start, that these two geometries will be unfavourable.Starting with (θtot =1.00ML, Nsub/Ntot =1/3), all structures shown in Fig. 5.2were relaxed using a coarse basis set3. The calculated binding energies are dis-
3The parameters which differ from the ones used for the converged calculations are thefollowing: The energy cutoff for the plane wave representation of the wave function in theinterstitial region between the muffin tin spheres was Emax
wf = 15Ry. A (4×4×1) Mohnkhorst-Pack grid with 4(7) irreducible k points, depending on symmetry, was used for the Brillouin
50CHAPTER 5. OXYGEN INCORPORATION INTO THE PD(111) SURFACE
Sites Coverage θon-/sub-surface 0.50 ML 0.75 ML 1.00 ML
Table 5.3: Binding energies (in eV/atom) for O, adsorbed in one of the availablehigh-symmetry sub-surface sites on Pd(111), relative to the dissociation energy ofthe oxygen molecule. The energy cutoff for the wavefunctions in the interstitialregion was Ewf
max =15Ry. For θ = 0.75ML and θ = 1.00ML a (4 × 4 × 1)Monkhorst-Pack (MP) grid with kir = 4, kir = 7 or kir = 13, in the irreduciblepart of the Brillouin zone, depending on symmetry and coverage. For θ = 0.50MLa (6 × 6 × 1) MP grid, with kir = 7 or kir = 13, (depending on symmetry) wasused.
played in Table 5.3.The prerogative was to get a feeling which structures may be relevant for furtherconsideration. Since the use of a coarser basis set, does not influence the sequenceof the different geometries with respect to their stability, but merely introducesa bigger absolute error into the calculated binding energies, such a procedure islegitimate. Analysing the obtained energies reveals, that for each pair of symme-try inequivalent site combinations, the one, in which a greater number of oxygenatoms are located as far away from each other (within the (2 × 2) unit cell) aspossible, is always the more stable one, which is another manifestation of the re-pulsive oxygen-oxygen interactions. Furthermore, cases, in which the on-surfaceoxygen atoms are adsorbed in an fcc place (this was the most stable adsorp-tion site for pure on-surface adsorption), are favoured over the ones with oxygenatoms in hcp position. Most probably the coupling to the substrate plays also arole, since in most geometries the tetrahedral sites seem to be favoured over theoctahedral site. The gained knowledge allows for a less thorough testing of thelower coverage cases. For θtot = 0.75ML all the fcc/sub-surface oxygen atomscombinations, as well as the hcp/octa (as the most stable site combination, ofthe hcp/sub-surface group) structure were relaxed with the coarser basis set4.
zone integration.4Here a (4× 4× 1) MP-grid corresponds to kir = 7 or kir = 13, depending on symmetry.
Table 5.4: Binding energies (in eV/atom) change with coverage for the moststable geometry with mixed O site occupation, i.e. fcc/tetra-I (a), on Pd(111),relative to the dissociation energy of the oxygen molecule. For convenience, thebinding energies for adsorption in fcc (Table4.1) and tetra-I (Table 5.1) positionare also shown.
The same is also true for θtot = 0.50ML 5. All the geometries with mixed siteoccupation that were considered, are summarised in Table 5.3.Each time the fcc/tetra-I (a) combination was the energetically preferred one andwas consequently relaxed with the converged basis set. The resulting bindingenergies are listed in Table 5.4. For convenience, the binding energies for adsorp-tion in fcc and tetra-I positions are shown, as well. Thus it is easy to detect, thatat a total coverage of θtot = 0.75ML and θtot = 1.00ML the fcc/tetra-I (a) sitecombination is more stable than pure on-surface adsorption. At 1/2ML coveragethe on-surface adsorption site remains the preferred one, which means that in-corporation of oxygen into the surface will start at some point after the Pd(111)surface is covered by half a monolayer O, but before a 3/4ML coverage is reached.
5.3 The mixed Ofcc/Otetra−I structures
In the following, the main structural and electronic properties of the stablefcc/tetra-I site combination, i.e., at θtot = 1ML and θtot = 0.75ML are describedin more detail.The two relaxed structures (2 × 2) − (3 Ofcc + Otetra−I)/Pd(111) and (2 × 2) −(2 Ofcc + Otetra−I)/Pd(111) are shown in Fig. 5.3. Each of them has, apart frominversion symmetry, a mirror plane along the longer diagonal of the unit cell,but no rotation axes are found. Due to the additional presence of sub-surfaceoxygen, which reduces symmetry, these geometries exhibit a much more complexrelaxation pattern compared to the afore discussed pure on-surface chemisorptioncases, cf. chapter 4. A number of similarities in the relaxation behaviour of dif-ferent atoms in the two structures are detected. The three first layer palladiumatoms in the vicinity of the sub-surface oxygen move sidewards away from it andare lifted up, increasing the volume, which the sub-surface O has at its disposal.The fourth palladium atom is pushed away and downward, as the on-surface
5Here a (6 × 6 × 1) MP-grid corresponds to kir = 7 or kir = 13, depending on symmetry.The fcc/tetra-II (b) case was not considered.
52CHAPTER 5. OXYGEN INCORPORATION INTO THE PD(111) SURFACE
Figure 5.3: Top and side view of the atomic geometries (a) (3 Ofcc +Otetra−I)/Pd(111) and (b) (2 Ofcc + Otetra−I)/Pd(111). The small circles repre-sent the oxygen atoms. The large circles represent the palladium atoms, wherethose lying in the same plane and equivalent with respect to the mirror symmetryhave the same colour. The arrows (not drawn to scale) indicate the direction ofthe displacements of the substrate atoms from their ideal (bulk-like) positions.
oxygen atom(s) in the immediate neighbourhood of the sub-surface oxygen, tryto increase their distance to it, moving towards an on-top position. The slightchange in the position of the second on-surface oxygen atom, seems therefore tobe rather a consequence of the displacement of the surrounding palladium atoms.The vertical relaxations for the (0.75Ofcc/0.25Otetra−I)/Pd(111) system are asfollows: the distance between the first two palladium layers is increased by23% (d13 = 2.81 A), 6 with a buckling of ∆z1 = 0.28 A for the first and ∆z2
= 0.36 A for the second layer. The expansion between second and third layeris d34= 2.42 A (6%). The buckling of the first and second palladium layers ofthe (0.50Ofcc/0.25Otetra−I)/Pd(111) geometry is ∆z1 = 0.28 A and ∆z2 = 0.36 A,respectively, and thus identical to the values determined for the higher coveragecase. Still, the reduced on-surface O coverage is reflected in the slightly smallerexpansion between the palladium layers. For the distance between the first andthe second layer d13 = 2.79 A (22%) is calculated, while d34 = 2.35 A (3%).It is interesting to notice, that the O-Pd bondlength, listed for the (2 × 2) −(2 Ofcc + Otetra−I)/Pd(111) geometry in Table 5.5, remains relatively constant forboth structures, assuming values between 1.9 A and 2 A. The numbers found for
6The center of mass of each layer is used to calculated the distance between them. Thenumenclature is as follows (cf. Fig. 5.3): d01 - distance between the on-surface oxygen layerand the first Pd layer; d12 and d23 are the distances between the sub-surface oxygen layer andthe first, respectively second, palladium layers; d13, d34 are the interlayer distances betweenfirst and second, and second and third palladium layers, respectively.
Table 5.5: Bondlength (in A) between O and Pd in the (2 × 2) − (2 Ofcc +Otetra−I)/Pd(111) structure. Notation is as follows: Pd2 is the palladium atomof the second layer, located directly below the sub-surface oxygen atom and Pd1
stands for the Pd atoms of the 1st layer. The indications in the brackets and theindices of the oxygen atoms refer to Fig. 5.3.
pure on-surface chemisorption were in the same range.
It is furthermore instructive to compare the coverage dependence of the work-function for the situation of mixed on-/sub-surface site occupation, to the caseof pure on-surface chemisoption. To this end, the change in workfunction uponincreasing oxygen coverage relative to the clean surface is shown in Fig. 5.4. In-corporation of oxygen into the sub-surface region, lowers the workfunction. Theshift remains almost constant, ≈ 0.2 eV, for all the mixed fcc/tetra-I structures,
cf. Table 5.4. The decline of Φ is the
0.00 0.25 0.50 0.75 1.00
Oxygen coverage (ML)
0.0
0.3
0.6
0.9
1.2
1.5
∆ Φ
(eV
)
fccfcc/tetraI
0.25 0.50 0.75 1.000.22
0.24
0.26
0.28
0.30
0.32
0.34
0.36
µ (D
ebye
)
fccfcc/tetraI
Figure 5.4: Dependence of the calcu-lated workfunction (left) and dipole mo-ment (right) on the oxygen coverage θfor the most stable geometry at eachconsidered coverage. At θtot = 0.75MLand θtot = 1ML both fcc and thefcc/tetra-I combinations are shown.
consequence of a competition arisingbetween sub-surface and on-surface oxy-gen for the bonding charge of the sur-face Pd atoms. This makes the on-surface O species slightly less negativelycharged (seen by a comparison of theinitial state shift of the O2s core-levels),compared to a situation with no sub-surface oxygen involved. One can fur-ther see, that the slope of the work-function rise remains the same as θtot
increases, regardless if one considersjust on-surface or just mixed site oc-cupation. This reflects the depolarisa-tion with increasing coverage.It was argued in the preceding chap-ter, that the reduction of the inwardpointing dipole moment due to an en-hanced density at the surface oxygen atom with coverage, is a consequence ofthe growing repulsive interactions withing a more and more densely packed over-layer. It is therefore expected, that the presence of an oxygen atom below thesurface, will further reduce the dipole. This is demonstrated by the dramatic
54CHAPTER 5. OXYGEN INCORPORATION INTO THE PD(111) SURFACE
Table 5.6: Change in the workfunction, Φ, and dipole moment, µ, of the((θ− θsub) Ofcc/0.25 Otetra−I) geometry with O coverage. The change of the work-function with respect to the clean Pd(111) surface is listed for pure on-surfacechemisorption (O in fcc hollow) and mixed fcc/tetra-I adsorption, as well.
change of µ as the (0.50 Ofcc/0.25 Otetra−I) structure becomes more stable thanthe (2× 2)− 3 Ofcc/Pd(111) structure.To gain insight into the bonding mechanism of the Ofcc/Otetra−I structures, itis helpful to take a look at the difference electron density of the (2 × 2) −(2 Ofcc + Otetra−I)/Pd(111) geometry, shown in Fig. 5.5 (left). A strong depletionof the 4dxz,yz states of the surface palladium atom(s) bonded to both Ofcc andOtetra−I occurs, while the electron density at the oxygen atoms is increased. Itseems likely, that the linear Ofcc − Pd−Otetra−I coordination allow the stronghybridisation of the Pd 4dxz,yz orbital with the Ofcc and Otetra−I species, and alsoscreens the electrostatic interactions between them. A reason for the move of theon-surface O atom (marked as 1 in Fig. 5.3) towards an on-top position (withrespect to the first layer palladium atom) might be, that the repulsive interac-tions between this atom and the sub-surface oxygen are not screened. However,it is equally possible that this lateral displacement is due to purely geometricreasons and is caused by the strong upward relaxation of the three palladiumatoms surrounding the sub-surface oxygen. The same arguments can be ap-plied to the (2 × 2) − (3 Ofcc + Otetra−I)/Pd(111) structure, in which a linearOfcc − Pd−Otetra−I alignment exists as well. There, the two on-suface oxygenatoms (darker color in Fig. 5.3) in the vicinity of the sub-surface oxygen, havemoved away from it (by 0.21 A, cf. Fig. 5.3), while no lateral displacement isobserved for the remaining on-surface oxygen (participating in the linear align-ment).The difference electron density plot points toward a strong coupling between theO-Pd-O ”trilayer” and the underlying palladium atoms, which is mediated pre-dominantly be the hybridisation of Pd 4dz2 orbital with the O2s orbitals of thesub-surface oxygen atom. The coupling can be visualised, shown to the right ofFig. 5.5, by the following procedure. One has to obtain a self-consistent elec-tron density for the O-Pd-O ”trilayer”, nO−Pd−O(r), and the substrate, nsub(r),(the (2× 2)− (2 Ofcc + Otetra−I)/Pd(111) geometry, without the ”trilayer”). Theinteratomic distances of the latter two corresponding exactly to the ones of therelaxed (0.50 Ofcc/0.25 Otetra−I) geometry. Then this electon densities are sub-
5.3. THE MIXED OFCC/OTETRA−I STRUCTURES 55
O1 O2
PdO
Pd
O1 O2Pd
O
Pd
(e/A )o 3
-0.33
-0.27
-0.21
-0.15
-0.09
-0.03
0.03
0.09
0.15
0.21
0.27
0.33
Figure 5.5: Difference electron density plot for the (2 × 2) − (2 Ofcc +Otetra−I)/Pd(111) structure visualising the bonding (left) and the coupling ofthe O-Pd-O trilayer to the Pd(111) substrate (right). The contour plot depictsthe [211] plane perpendicular to the (111) surface. Regions of electron accumula-tion and depletion have positive and negative signs respectively, contour lines aredrawn at 0.06 e/A3. The nomenclature O1 and O2 refers to the two on-surfaceoxygen atoms makred as ”1” and ”2” in Fig. 5.3.
tracted from that of the (0.50 Ofcc/0.25 Otetra−I) system. The coupling can bequantified by the equation
Ecoupling =1
2(Eall − EO−Pd−O − Esub) . (5.5)
Here Eall is the energy of the whole system, EO−Pd−O is the energy of the ”tri-layer” and Esub is the energy of the substrate, as described above. Division bytwo is necessary on account of the two surfaces present in a slab. Thus it wasdetermined that the coupling of the ”trilayer” to the substrate is 3.41 eV/(2× 2)cell for the (0.50 Ofcc/0.25 Otetra−I) structure and 3.83 eV/(2 × 2) cell for the(0.75 Ofcc/0.25 Otetra−I) system. The coupling in the geometry with more on-surface oxygen is somewhat stronger compared to the lower coverage case. Thisis most probably a consequence of repulsive interactions between the sub-surfaceatom and its two on-surface O neighbours (as compared to one in the lower cover-age case), which push the sub-surface atom further to the outside of the ”trilayer”(compare d12 for both structures in Fig. 5.3), thus closer to the atom beneathit. The ”coupling-plot” shows, that the interaction between the Pd atoms (seenon the left side of the plot) is smaller than the coupling between the sub-surfaceO and the Pd atom of the second substrate layer. As the distance between thepalladium atoms in the ”trilayer” and the palladium atoms of the substrate layer
56CHAPTER 5. OXYGEN INCORPORATION INTO THE PD(111) SURFACE
beneath has increased quite a lot, it is probable, that most of the coupling is theresult of the interactions between the O and Pd atoms.It was argued in the beginning of this chapter, that one of the factors playinga role towards favouring one structure over another is the coupling between the”trilayer” atoms to the palladium atoms of the second layer. In this respect,it is interesting to compare the coupling of an ”unfavourable” geometry, e.g.(2× 2)− (3 Ohcp + Oocta)/Pd(111), to the stable one at the same coverage. Thecoupling calculated for the (0.75 Ohcp/0.25 Oocta) is 1.51 eV/(2× 2) cell, which isless than half the value obtained for the stable on-/ sub-surface site combination(0.75 Ofcc/0.25 Otetra−I), supporting the assumption.
5.4 Stability of sub-surface oxygen
Insight into the formation of surface oxides at the late 4d transition metals [103]can be gained by comparing the initial incorporation of oxygen into Ru(0001) [89],Rh(111) [104], Pd(111) and Ag(111) [100]. On each of this metals the fcc/tetra-Isite combination is always found to be either the most stable one or energeticallyvery close to the most stable geometry. Therefore, the computed average bind-ing energies of the mixed fcc/tetra-I structures, along with the values for oxygenchemisorbed in fcc sites on the surface and tetra-I sites below the surface, areused to visualise the O penetration into the basal surface of each metal, shownin Fig. 5.6. Since the highest binding energy is found for the pure on-surfacechemisorption phase at 1/4ML coverage, its value is chosen as zero reference.Each subsequent contour line in the plot corresponds to a 0.1 eV less stable Eb.The white circles shown in the palladium plot mark the actually calculated bind-ing energies, cf. Table 5.4. The change in adsorption site preference from pureon-surface chemisorption at low coverages to mixed on-/sub-surface site occupa-tion, as more and more oxygen is put on the surface, can be traced by the gradualchange of the contour line slopes in the plot, at their intersection point with thex-axis. Between θtot = 0.50ML and θtot = 0.75 ML the slope is actually reversedfrom negative to positive, indicating that occupation of sub-surface sites becomesmore favourable, than the continued filling of the on-surface ones.Pure on-surface chemisorption ((Nsub/Ntot) = 0%) is favoured for both Ru andRh in the whole sub-monolayer coverage range. This means, that oxygen in-corporation will only start after completion of a full O (1 × 1) adlayer on thesurface, θc ≈ 1ML, in agreement with experimental findings [105, 106]. Still,the shallower valley in the Rh contour plot might account for a small, but finiteconcentration of sub-surface O already at total coverages slightly below 1ML atelevated temperatures [107]. The critical coverage for Ag surpasses the palladiumvalue, so that only a small on-surface coverage may be stabilised before oxygengoes sub-surface, again, in reasonable agreement with experiment, which findsinitial surface oxides at Pd(111) and Ag(111) at local coverages of ≈ 0.7ML and
Figure 5.6: Average binding energy Eb as a function of the total oxygen coverageof which the fraction Nsub/Ntot is located below the surface (on-surface in fcc andsub-surface in tetra-I site). The highest Eb is always found for the pure on-surfacechemisorption phase at θtot = 0.25ML (chosen as zero reference, black area), witheach contour line at 0.1 eV steps toward less stable Eb. The white circles in thepalladium plot denote the actually calculated binding energies, displayed in Table5.4. Data: Ru, Rh and Ag [103].
58CHAPTER 5. OXYGEN INCORPORATION INTO THE PD(111) SURFACE
Ru Rh Pd Ag
θc (ML) 1.00 1.00 0.50 0.25θthd
c (ML) 0.89 0.59 0.33 0.24
Table 5.7: Critical coverage (in ML) for oxide formation at the late 4d transitionmetals, determined from the calculations, θc, and by use of the thermodynamicmodel, θthd
c .
≈ 0.4ML, respectively [3, 97].A comparison to the afore described θthd
c , above which the bulk oxide phase be-comes thermodynamically stable, reveals, that for the considered 4d transitionmetal (TM) sequence, the critical coverages for initial O incorporation followboth the same trend and have approximately the same value, cf. Table 5.7. Thesimilarity of θc and θthd
c reflects an important bottleneck function of the initialO incorporation in the oxidation sequence of the considered surfaces: If θc wassignificantly smaller than θthd
c , sub-surface O could exist as a stable phase in thecoverage range up to θthd
c . This is apparently not the case, and oxygen is onlyincorporated at coverages, where the bulk oxide is about to become stable. Theclose correlation of θthd
c with existing experimental data on the critical coverage
for oxide formation [97, 108] then
0.25 0.50 0.75 1.00Oxygen coverage (ML)
-1.0
0.0
1.0Bin
ding
Ene
rgy
(eV
/Ato
m)
RuRhPdAg
Figure 5.7: Calculated binding energies forsub-surface O incorporation into the tetra-Isites below the fully relaxed surface (no on-surface O present). The energy zero is theenergy of a free O2 and the clean surface atits equilibrium geometry. Data: Ru [82], Rh[104], Ag [100].
implies that at θtot ≈ θc ≈ θthdc
not only is O incorporated intothe sub-surface region, but a phasetransition, towards the formationof a surface oxide, is initiated. Thus,the role of sub-surface oxygen isthat of a metastable precursor, andat not too low temperatures thephase transition will proceed nearlyinstantaneously after the first in-corporation of oxygen below thesurface. With this interpretation,the initial incorporation of O maybe used as a good measure to un-derstand the ease of oxide forma-tion of these TM surfaces.Setting out to analyse the obtainedlowering of θc from Ru(0001) toAg(111), it is helpful to look upon
structures containing both on- and sub-surface O as a ”co-adsorbate system”, asthe different sites available to the two types of oxygen allow to distinguish themas two species. In this sense the stability of such structures can be discussed in
5.4. STABILITY OF SUB-SURFACE OXYGEN 59
terms of separate properties of the on- and sub-surface O, as well as the inter-actions between them. The latter can be determined by comparing the bindingenergies computed for the mixed structures with the averaged binding energiesof two calculations where O is only present in either the fcc or the tetra-I sitesat the corresponding coverages. The so computed values are found to be rathersmall, i.e. < 0.2 eV, which is comprehensible since part of them are effectivelyscreened by the TM atoms in between (as discussed for Pd and Ag [100]). There-fore, this interactions are neglected in the following and the initial sub-surfaceincorporation of O, is addressed just in terms of the separate stability of on- andsub-surface oxygen.The computed binding energies for structures that contain from one (θtot =0.25ML) up to four (θtot = 1ML) sub-surface oxygens in tetra-I sites are shownin Fig. 5.7. Considering the filling of the metallic d-band as the ruling quantityto determine the O-metal bond strength across the elements, one would typi-cally expect decreasing binding energies from Ru to Ag as in the on-surface Ochemisorption case depicted in Fig. 4.3. Interestingly, this is not the case, and inparticular for Ru and Rh the energies are by several eV less favourable than forchemisorption in the (also highly coordinated) on-surface hollow sites. The mainreason behind this different behaviour in Figs. 4.3 and 5.7 is the lattice distortioncreated by the sub-surface oxygen. The deformation caused by the O incorpora-tion into the metal surface is clearly seen by comparing the electron density plotsshown in Fig. 5.8. The first picture shows the clean Pd(111) surface, followed bya bulk-truncated geometry with 1ML oxygen incorporated in a tetra-I site. Thelast two pictures show the relaxed (1 × 1) − Otetra−I/Pd(111) structure, but theoxygen is removed from the tetra-I site, in the last one, showing the empty dis-torted lattice. In all relaxed structures the sub-surface O-metal bond lengths areeach about 2 A. Yet, these O-metal bond lengths are incompatible with the spaceavailable inside a frozen metal lattice. For Ru, which has the smallest latticeconstant of the four considered materials, the tetra-I site would only allow for anO-metal bond length of 1.65 A. This situation gradually becomes better for theother elements, yet even for Ag, which has the largest lattice constant, this valueis with 1.80 A still significantly too small. To achieve its optimal bondlengththe sub-surface oxygen induces a substantial local expansion of the metal lattice,
Element Ru Rh Pd Ag
Bbulk0 (GPa) 320 259 163 81
Ebulkcohesive (eV) 6.74 6.10 3.64 2.56dbulk
111 (A) 2.15 2.21 2.27 2.40
Table 5.8: Bulk modulus (in GPa), cohesive energy (in eV) and distance be-tween the 111 planes (in A) for the late 4d transition metals; Ru [82], Rh [35],Ebulk
cohesive(Ag) [4].
60CHAPTER 5. OXYGEN INCORPORATION INTO THE PD(111) SURFACE
Figure 5.8: Electron density plots of the: a) clean Pd(111); b) bulkt-runcated(1×1)−Otetra−I/Pd(111) geometry; c) relaxed (1×1)−Otetra−I/Pd(111) geometry;d) (1 × 1) − Otetra−I/Pd(111) geometry, with Otetra−I removed. The numberscorrespond to the structure shown in the picture above them, and show thebinding energy (eV), the average O-TM bondlength in A and the relaxation, dueto the oxygen in %, for the late 4d transition metals. Data for relaxed Ru [82];data for relaxed Rh [109].
which is as much as 53% for the considered Ru case. Still, the energy required todistort the corresponding TM lattice is with almost 2 eV quite high for Ru, butgradually decreases toward silver. This lattice deformation energy scales roughlylike the bulk cohesive energy or the bulk modulus, cf. Table 5.8. The energy costof distorting the metal lattice can be approximately removed by computing thebinding energy of the sub-surface oxygen with respect to a metal surface whichhas been already deformed into the final adsorption geometry (shown in Fig.5.8 (d)). This causes a significant increase in the binding energy, particularly forRu and Rh, cf. Fig. 5.9. It does not remove, however, the preference of Ru andRh for sub-surface island formation, as seen by the slope of the Eb(θ) curves inboth Fig. 5.7 and Fig. 5.9. Palladium shows no such preference, whereas in silverquite the opposite is observed - the repulsive interactions between the adsorbateatoms lead to a decrease in the binding energy with increasing coverage, whichwas also the case for pure on-surface adsorption. The affinity toward island for-mation on Ru and Rh is understandable in view of the high cost for a distortionof the lattice. Their sharing of the relaxation costs is apparently so favourable,that it overcomes even the electrostatic repulsion between the oxygens. As thelattice is easily deformed for Ag, the repulsion between O atoms plays once againa dominant role in determining their behaviour with increasing sub-surface cov-erage.
5.5. BULK DISSOLVED OXYGEN 61
0.25 0.50 0.75 1.00Oxygen coverage (ML)
-1.0
0.0
1.0
2.0
3.0Bin
ding
Ene
rgy
(eV
/Ato
m)
Ru
Rh
Pd
Ag
Figure 5.9: Calculated binding energies for sub-surface O incorporation into thetetra-I sites below the fully relaxed surface (no on-surface O present). The energyzero is the energy of a free O2 and the clean surface at the (artificial) geometryof the respective adsorbate system (cf. text). Data: Ru [82], Rh [109].
The gradual decrease in the deformation cost from Ru to Ag all but compen-sates the d-band related weakening of the O-metal bond strength, resulting inthe rather similar stability of sub-surface O in all four elements. Due to thislattice distortion cost, sub-surface oxygen is in the low coverage limit always lessstable than on-surface chemisorption. Yet, with increasing on-surface coverage,the repulsive interaction among the more densely packed adsorbates decreasesthe preference for on-surface adsorption; eventually oxygen penetration may thenbecome more favourable than a continued filling of the on-surface sites. Corre-spondingly, the critical total coverage, θc, beyond which penetration starts islowered, as the lattice deformation cost become lower, i.e. it decreases from Ruto Ag.
5.5 Bulk dissolved oxygen
It was seen in the above discussion that the penetration of oxygen into the pal-ladium lattice is not as costly, as e.g. Ru. Appart from this, on purely entropicgrounds, there will always be a finite concentration of oxygen defects in a bulkmaterial, even though the creation of such a defect costs energy. Therefore, itis interesting to consider what is the amount of oxygen which can be dissolvedin a palladium crystal. In order to answer this question, it is necessary to knowthe binding energy of an oxygen atom found in an interstitial site inside thebulk. The octahedral site is the high-symmetry site with the largest volume,which means that an oxygen atom placed in it will be least squeezed in. For this
62CHAPTER 5. OXYGEN INCORPORATION INTO THE PD(111) SURFACE
reason, the binding energy of an O atom in an octa site of a large (4 × 4 × 4)palladium bulk unit cell with 97 atoms, was calculated. Relaxation of the nearestPd neighbours is allowed, but due to the finite size of the supercell, long rangeelastic interactions of the metallic lattice are not properly accounted for in theresulting binding energy of Eb = −0.70 eV. Estimating that the later would notimprove the binding energy by more than 0.5 eV makes it possible to state a con-servative upper limit of Eb = −0.20 eV for the binding energy of bulk dissolvedoxygen. This number brings the bulk dissolved oxygen in the stability range ofsub-surface oxygen (cf. Table5.1). Therefore and because of the vast number ofavailable interstitial sites, it is conceivable that a considerable amount of oxygenmay be deposited into a sample at finite temperatures.The number, NO, of oxygen atoms solved in the bulk at temperature T dependson the total number, N , of available interstitial sites. To estimate NO the Gibbsfree energy [68] has to be minimised:
∂G
∂NO
∣∣∣∣T,p
=∂
∂NO
[Etot − TSconf + pV
]T,p
= 0 (5.6)
The reservoir for the oxygen solved in the bulk is the oxygen atmosphere, whichis described by an O pressure p and a temperature T . The change in the internalenergy of the system upon ”adsorption” of an oxygen atom in a bulk interstitialsite is given by Etot = −NO(Eb + ∆µO) (Eb > 0 is exotherm), with ∆µO(T, p) =µO(T, p) − 1
2EO2 . Usually, the number of available sites N exceeds by far the
number of defect sites NO (NO N). Then, the configurational entropy is
Sconf = kB lnZ(NO) , (5.7)
where kB is the Boltzmann constant and the partition function is given by
Z =N · (N − 1) · · · (N −NO − 1)
1 · 2 · · ·NO
=N !
(N −NO)!NO
. (5.8)
For the considered case Stirling’s formula, lnN ! ≈ N (lnN−N), valid for N, NO 1 can be used:
TSconf = kBT
[NO ln
(1− NO
N
)−N ln
(1− NO
N
)]. (5.9)
The contribution of the pV term in the Gibbs free energy is negligible [89] com-pared to the entropy contribution. Therefore, from the minimisation of G(T, p)one gets the formula
NO
N= e[Eb+∆µO(T,p)]/kBT . (5.10)
Obviously, the concentration NO/N of oxygen atoms in a bulk depends on theoxygen pressure and on the temperature. For pO = 10−12 atm, characteristic for
5.5. BULK DISSOLVED OXYGEN 63
UHV, and using the upper limit obtained for the binding energy, a concentrationof 1.28 × 10⁻¹⁴ and 2.42 × 10⁻¹³ for T = 300K and T = 800K, respectively, iscalculated 7. The oxygen concentration in the bulk decreases as the temperatureis raised, to leave the sample for the ”more attractive” gas phase.Most surface science experiments quantify uptakes in ML, which makes it seemreasonable to convert this numbers into monolayers. The volume of an octahedralinterstitial site in a palladium crystal is
V octa =
[(√2a0
2
)2
· sin60]·√
3a0
3= 1.53× 10⁻²³cm3. (5.11)
Therefore, the number of octa sites found in a Pd crystal of 1 cm3 volume is6.52× 1022 sites/cm3, and a coverage of 1ML corresponds to
1 atom
(√
2a0/2)2 · sin60= 1.48× 10¹⁵atoms/cm2. (5.12)
Hence the above stated concentrations translated into the equivalents of 5.66 ×10⁻⁷ ML and 1.06× 10⁻⁵ ML at room temperature and T = 800K, respectively.In a similar study concerned with the oxygen dissolution in a ruthenium crys-tal [89], the negligible amount of 1.38 × 10⁻²⁴ ML at room temperature and2.73 × 10−12 ML at T = 800K is found. This notable difference in the sol-vent behaviour of the two elements towards oxygen reflect once more the alreadydiscussed differences in their material properties. The volume of an interstitialoctahedral site in palladium is about 10% bigger compared to ruthenium, anddeformation of palladium is much less costly than deformation of ruthenium.The greater amount of oxygen solved in palladium is therefore not astonishing.Unfortunately, such studies are not yet available for Rh and Ag, but one wouldexpect the number of oxygen atom solved in Rh to be intermediate between theones found for Ru and Pd, whereas the palladium value will be exceeded in Ag.
7The values for the chemical potential of oxygen are calculated using eq. (7.6) with theappropiate value for 1/2µO2(T, p) taken from Table (7.1). Thus, ∆µO(T = 300K, p =10−12 atm) = −0.627 eV and ∆µO(T = 800K, p = 10−12 atm) = −1.803 eV.
64CHAPTER 5. OXYGEN INCORPORATION INTO THE PD(111) SURFACE
Chapter 6
The (√
5×√
5)R27o surface oxideon the Pd(100) surface
After the formation of chemisorbed phases, studied in the preceding chapters,further oxidation of the palladium low index surfaces leads to the formationof surface oxides. Traditionally such initial surface oxides were considered to beclosely-related, thin versions of the corresponding bulk oxides, but recent atomic-scale characterisations especially at Pd [3, 101] and Ag [102, 100, 110] surfacesrevealed structures, that have often only little, if any resemblance to the bulkcounterparts. The observed surface oxides usually have a low degree of order
at the surface and highly complex, large
Figure 6.1: View of the Pd(100)surface. The palladium atoms arerepresented by the large white (1stlayer) and grey (dark grey: 2ndlayer) circles. The small light greycircles depict the oxygen atoms indifferent adsorption sites. A (1x1)cell, spanned by the primitive vec-tors a1 and a2 is shown as well.
unit-cell geometries, which are just a fewof the difficulties one encounters, when at-tempting to characterise them microscopi-cally.Considering the oxidation of palladium, itseems logical to proceed with an investi-gation of the corresponding surface oxides.The surface oxide on the Pd(111) surface 1
has been identified [3] to be an incomensu-rable O-Pd-O layer. This means, that onehas to use very large unit cells in order to in-vestigate it. Therefore, this chapter will fo-cus on the (
√5×
√5)R27o surface oxide ob-
served on the Pd(100) surface, which turnsout to be a comensurable structure.A view of the (100) surface is shown in Fig.6.1. Three high-symmetry sites are presenton this surface: on-top, bridge and hollow. Just like on the (111) surface, an
1More details about its structure will be given in the next chapter.
65
66CHAPTER 6. THE (√
5×√
5)R27O SURFACE OXIDE ON THE PD(100) SURFACE
atom adsorbed in an on-top site is located directly above an atom of the firstsubstrate layer, while the brigde position is between two first layer substrateatoms. There is only one fourfold hollow site on the (100) surface, in contrastto the two threefold hollow sites found on the (111) surface. The two primivevectors of the (100) surface are perpendicular to each other and have the length|a1| = |a2| =
√2a0/2.
Experimentally [27, 28, 29, 30, 31, 111] the ordered surface structures p(2 × 2)and c(2×2) have been observed for the oxygen adsorption on Pd(100). A p(2×2)structure corresponds to a 0.25ML 2 oxygen coverage. It has the same orienta-tion as the cell shown in Fig. 6.1, but covers a four times larger surface area,i.e., its sidelength is (2 · |a1|). A c(2× 2) cell corresponds to a 0.50ML coverage.It is half as big as a p(2 × 2) cell and rotated by 45 with respect to it. Theexperimental studies (LEED [111] and STM [27]) found the O atoms adsorbedin the fourfold hollow sites. Therefore the calculations performed for the oxy-gen adsorbate phases on Pd(100) at different coverages were carried out only forthe hollow site. The results of this calculations 3 are summarised in Table 6.1.The structural data for the p(2 × 2) structure compare well to the experimen-
Table 6.1: Binding energies, relative to the dissociation energy of the oxygenmolecule (in eV/atom), workfunctions, and structural parameters for O adsorbedon the Pd(100) surface. dO−Pd is the oxygen palladium bondlength. dO1 is thedistance betwenn the oxygen layer and the first Pd layer. d12 and d23 are thedistances between first and second, and second and third palladium layers, re-spectively. The center of mass of the corresponding layer is used to determine theinterlayers distance between them. ∆z2 is the buckling of the second palladiumlayer. The bulk distance is db = 1.97A.
tal results [111]: dO−Pd = 2.11 A, dO1 = 0.830 ± 0.020 A, d12 = 2.01 ± 0.015 A,d23 = 1.94± 0.015 A, and ∆z2 = 0.115± 0.010 A (The nomenclature is the sameas in Talbe 6.1).
2One monolayer coverage means, that the number of oxygen atoms equals the number of Pdatoms in a Pd(100) plane.
3The parameters used for this calculations are described in A.0.2.
6.1. HRCLS DATA 67
Upon further oxidation, the two adsorption phases (p(2 × 2) and c(2 × 2)) arefollowed by an intermediate (5 × 5) surface oxide, which will not be further in-vestigated in this work. Finally, the (
√5 ×
√5)R27o surface oxide (abbreviated√
5 phase in the following) concludes the series of ordered phases observed onPd(100), for T > 400K, before three-dimensional cluster growth sets in [27].The identification of the
√5 phase, which was made possible by a collaboration
between experiment and theory [103], will be discussed in the following. Start-ing with a presentation of the experimental results, it will be shown that theyare incompatible with an existing model [32, 33] proposed for this surface oxidephase. Afterwards a new structural model for the
√5 phase will be presented.
6.1 HRCLS data
Core electron wave functions are relatively compact and are generally assumednot to participate in the bonding itself. Their energies are however quite sensi-tive to changes in the electrostatic potential of an atom in different environments.At surfaces, the core-level energies of the substrate change relative to the bulk,giving rise to so-called surface core-level shifts (SCLSs). This shifts can be mea-sured for both clean and adsorbate covered surfaces by high resolution core-levelphotoemission spectroscopy (HRCLS) [112].A SCLS, which reflects the changes in the electronic distribution at an unper-turbed surface, i.e. before the excitation of a core-hole, is called initial state.However, a total SCLSs comprises not only initial, but also final state effects,which are due to the different screening capabilities of the already core-ionisedsystem at the surface and in the bulk [113].From an initial state viewpoint, the core-level shifts at clean transition metal sur-faces, are well understood in terms of the narrowing of the surface valence d banddue to the lowered coordination [113] (cf. Fig. 3.3). The center of a less (more)than half full d band moves down (up) in energy, in order to maintain charge neu-trality. The ensuing change in potential acts on the core electrons and inducesa positiv SCLS (to higher binding energies) for the early and a negative SCLS(to lower binding energies) for the late transition metals. This trend involves achange in sign across the series and is confirmed by theoretical and experimentalstudies [113, 114, 115, 116]. The negative (initial state) SCLS calculated 4 for theclean Pd surface (e.g. -0.38 eV for Pd(111) and -0.43 eV for Pd(100)) fit quitenicely, as well.Interactions of the O2p levels with the Pd 4d levels upon oxygen adsorption onthe Pd(111) surface, leads to the formation of bonding and antibonding statesclose to the lower and upper edge of the 4d band (cf. Fig. 4.10), as discussed inChapter 4. The resulting broadening of the d band requires an adjustment of theband center, in order to maintain local charge neutrality. The band shifts down
4The way to calculate SCLS will be described in section 6.4.3.
68CHAPTER 6. THE (√
5×√
5)R27O SURFACE OXIDE ON THE PD(100) SURFACE
in energy (just opposite to the clean surface case), reflected in more and morepositive SCLSs as the number of oxygen atoms on the surface increases. This hasbeen confirmed experimentally and theoretically for, e.g., the oxygen adsorptionon Ru(0001) [117] and Rh(111) [118].The evolving sequence of ordered structures, which form on the Pd(100) surfacewith increasing oxygen coverage, is depicted in Fig. 6.2 by the experimentalHRCL spectra for the O1s and the Pd 3d5/2 levels. The two known adsorptionphases, p(2 × 2) and c(2 × 2), are fol-
Figure 6.2: Experimental HRCL spec-tra of the O1s and the Pd 3d5/2 levelsfor the sequence of ordered structuresthat form on Pd(100) with increasingoxygen coverage. The photon energieswere 650 and 400 eV respectively [101]
lowed by the intermediate (5 × 5) sur-face oxide, before finally the
√5 phase
is obtained.A quite surprising feature seen in theO 1s spectrum of the
√5 phase are two
distinct sharp peaks in contrast to thesingle peak observed at all lower cover-age structures. As the Pd 3p levels arelying energetically very close, they atfirst hinder a definite assignment to theO1s levels. Since no similar featuresare observed at the low binding-energyside of the Pd 3d spectrum and afterchanging the photon energy to vary theescape depth of the photoelectrons, itwas concluded that they must originatefrom oxygen atoms close to the surface.It is possible to approximately removethe contribution of the Pd 3p levels bysubtracting the Pd 3p spectrum recordedfrom the clean surface. The correspond-ing HRCL spectra for the
√5 phase,
now recorded at higher photon energiesof 900 eV and 650 eV for the O 1s andPd 3d levels, respectively, are shown in Fig. 6.3. The two peaks, which have aratio of about 1:1, are still clearly distinguishable and are shifted by ≈ 0.75 eVwith respect to each other. On the basis of this analysis the presence of at leasttwo oxygen species, in close to equal amounts, situated at or near the surface ofthe
√5 phase, is anticipated.
The Pd 3d5/2 spectra in Fig. 6.2, shows at least three oxygen-induced compo-nents, at -0.32 eV, +0.38 eV and +1.30 eV, that are resolved experimentally. Apositive surface core-levels shift indicates a higher binding energy with respectto the reference Pd bulk component. From the simple initial-state arguments de-scribed above, it is expected that increasing oxygen coordination yields positiveSCLS for the Pd 3d5/2 level. In a previous study, concerning the intermediate
6.2. THE LEED MODEL 69
oxide structure at Pd(111) [3], a component shifted by +1.3 eV was attributedto Pd atoms fourfold coordinated to oxygen. One would, therefore, expect thatthe component shifted by +1.30 eV is due to similar highly oxygen coordinatedPd atoms, while the peak shifted by +0.38 eV should be assigned to Pd atomscoordinated to less oxygen atoms (possibly two or three). It was argued in thepreceeding that the narrowing of the d band due to a reduced coordination atthe surface, leads to negative SCLSs. For this reason, the component shifted by-0.32 eV is likely to originate from Pd atoms at the interface between the Pd(100)substrate and the thin oxidic film.
6.2 The LEED model
A previous tensor LEED analysis suggested the√
5 phase to correspond essen-tially to a rumpled PdO(001) plane on top of Pd(100) [32, 33], cf. Fig. 6.4 (a). (Itis abbreviated in the following with ”LEED model”.) As all the oxygen atoms in aPdO(001) plane are equivalent (with respect to their Pd coordination), one wouldtypically not expect their core-levels to split. Nevertheless, it is conceivable, thatthe waviness of the PdO(001) overlayer, due to the inequivalent positions of thePd atoms in it with respect to the underlying Pd(100) substrate, could affect thecore-level shifts of the O atoms. Therefore, the published atomic positions werefirst used as input to the DFT calculation. The obtained SCLS were comparedto the present HRCLS data and found to be incompatible. The LEED modelwas then subjected to a complete structural relaxation. The resulting final stateSCLSs after relaxation are shown in Fig. 2 and are still difficult to reconcile withthe experimental data: The large splitting of the O1s spectrum is not reproducedand almost identical O 1s positions are obtained for all O atoms in the structure.The agreement of the Pd 3d SCLSs is not much better, obtaining computed shiftsthat are split into two distinct groups in contrast to the four component structureseen experimentally.Geometrically, the structural relaxation in DFT almost completely removes mostof the strong rumpling introduced in the LEED study to fit the experimentalI(E)-curves, and the substrate/oxide interface smoothens out at a large interfacedistance indicating a very weak coupling. The palladium atoms of the substrate,in turn, try to assume more bulk like positions, moving to fill the voids still seenbetween the PdO rows. In the end, the absolute average binding energy per Oatom, Eb, of the LEED model was still not very high (Eb = + 0.32 eV/O atomwith respect to molecular oxygen), making it even more doubtful that this is theright structure to describe the Pd(100)-(
√5×
√5)R27o-O phase.
Finally, STM (scanning tunneling microscopy) measurements of the√
5 phase, acorresponding image of which is shown in Fig. 6.3 (left), revealed that neighbour-ing bright rows are shifted by half a nearest neighbour distance with respect to
70CHAPTER 6. THE (√
5×√
5)R27O SURFACE OXIDE ON THE PD(100) SURFACE
528530532
O1s
334335336337
Pd3d
Binding Energy (eV)
−2−101234
PdO(001)
PdO(100)
PdO(101)
−1012
I 4f I 2f II
I 4f I 2f II
I 2f II
0 0.5 1
Surface Core−Level Shifts (eV)
Figure 6.3: Top panel: measured HRCL spectra of the O1s and the Pd 3d5/2 levels
from the Pd(100)-(√
5×√
5)R27o-O phase at higher photon energies (900 eV and650 eV for O 1s and Pd 3d, respectively) and with the Pd 3p contribution of theclean surface removed. Bottom panel: Calculated final-state shifts for the threestructural models shown in Fig. 6.4. For Pd 3d the bulk-level is employed toalign theoretical and experimental spectra. For O1s the lowest-energy theoreticalpeak is simply aligned to the lowest-energy experimental peak (see text). Notethat only the PdO(101) layer on Pd(100) exhibits a split O 1s spectrum withtwo significantly shifted components. See Fig. 6.4 for the nomenclature usedto describe the atoms from which the various theoretical Pd core-level shiftsoriginate.
6.3. SEARCHING FOR A NEW MODEL 71
each other, in contrast to what would be expected from the PdO(001) geometrydepicted in Fig. 6.4 (a).STM is based on the quantum mechanical tunneling between the surface of ametal or a doped semi-conductor and a metal tip, moved over the probe withthe help of a piezo-ceramic control system, at less than 1 nanometer above it[119]. Applying a voltage causes a tunneling current to flow over the contact,the magnitude of which depends on the distance from the surface and its elec-tronic structure. Scanning over the probe with a tip makes it possible to generatepictures of the surface. It is important to note that in STM the atoms are notnecessarily what is imaged. Rather the tunneling current between surface andSTM tip is monitored. There are two modes of operation. The first one is aconstant current mode, in which the distance between tip and surface is varied toensure a constant current flow. The second is the constant height mode, in whichthe tip is moved at a constant height (as indicated by the name) over the surfaceand the changes in the current are measured. The experimental STM images inFig. 6.3, are taken in the constant current mode and the tunneling parametersare: voltage U = 0.76V and current I = 0.57 nA.Returning to the surface oxide, one can conclude on the basis of the STM find-ing, from the absence of a split in the calculated O1s spectrum (HRCLS) andthe low energetic stability (DFT), neither of which is compatible with the preva-lent LEED
√5 model, that the rumpled PdO(001) overlayer on Pd(100) is most
probably not the structure corresponding to the√
5 phase.
6.3 Searching for a new model
Considering the vast number of possibilities for the structure of the√
5 surfaceoxide, it is helpful to have in advance as much information about it as possible,before attempting to find an alternative geometry. Therefore, the experimentalSTM data are further analysed. The STM image shows two different phases, theupper one of which has a ring like structure and is identified to be the surfaceoxide. In the bottom right half of the STM image shown in Fig. 6.3 a coexist-ing domain of the p(2 × 2) on-surface adsorption phase is seen. In the p(2 × 2)structure the oxygen atoms are chemisorbed in the fourfold hollow sites of theunderlying Pd(100) substrate [28, 29, 30, 31, 111]. A simulation of this struc-ture5 is superimposed onto the experimental image and highlighted by a blackline around it. It shows that the oxygen atoms appear as dark spots in the STMimage, which allows the construction of a Pd(100) lattice (filled dark circles),overlaying the experimental image in Fig. 6.3 (right). Each of these dark spotsis situated directly over a palladium atom of the Pd(100) lattice, defining the
5The STM images (here and in the following) are simulated from the self-consistent chargedensity employing the Tersoff-Hamann approximation [120]. More details about the simulationsare given in section 6.4.2.
72CHAPTER 6. THE (√
5×√
5)R27O SURFACE OXIDE ON THE PD(100) SURFACE
2f
Pd
O
(a)2f 4f
(b)2f 4f
(c)
PdO(001)/Pd(100) PdO(100)/Pd(100) PdO(101)/Pd(100)Eb = 0.32 eV Eb = 0.92 eV Eb = 1.36 eV
III
Figure 6.4: Top- and side-view of the three structural models considered forthe Pd(100)-(
√5×
√5)R27-O phase using low index PdO surfaces. All models
assume an oxygen coverage of 0.8ML. (a) PdO(001) layer on Pd(100) [32, 33],(b) PdO(100) layer on Pd(100), and (c) PdO(101) layer on Pd(100). The
√5
unit-cell is sketched in the top-view pictures (solid line), while the dashed linesindicate the direction of atomic rows seen in the STM images. The DFT bindingenergy of the three models clearly reveals the PdO(101) layer on Pd(100) as themost favourable model. 2f and 4f denote two- and fourfold coordinated first-layer Pd atoms, and relate to the labels in Fig. 6.3 used to specify the atomicorigin of the various computed core-level shifts.
fourfold hollow site.If one additionally assumes that the bright protrusion in the STM image cor-respond to the geometric positions of the Pd atoms, the Pd sub-lattice of thesuspected surface oxide layer can also be drawn into the STM image, as done inFig. 6.3 (right). This results in a total of three Pd atoms per
√5 unit cell, which
form a rather open ring-like layer, the structure of which does not resemble anybulk-like PdO planar nearest-neighbour environment at all. The latter would beobtained, if a fourth palladium atom was present in the
√5 unit cell in the posi-
tion of the large dark spots seen in the image. Analysing the relative positions ofthe two superimposed lattices (drawn into the experimental image), reveals thatthe dark spots are situated directly on top of a hollow substrate site, which wouldgive a straightforward explanation of why these latter Pd atoms do not show upin the STM images. The Pd atoms over the Pd(100) hollow sites are expected torelax inward giving rise to a large corrugation within the surface oxide overlayer.
6.3. SEARCHING FOR A NEW MODEL 73
Figure 6.5: Left: STM image showing a domain boundary between the Pd(100)-(√
5×√
5)R27-O and the p(2× 2) phase (lower part of the image). Right: Thesame STM image but with a Pd(100) lattice superimposed (grey circles). Thisshows directly that in the
√5 phase bright spots (assigned to Pd atoms, white
circles) are shifted in neighbouring rows by half a nearest neighbour distance, andthat the dark spots (Pd atoms in hollow sites) coincide with hollow sites of theunderlying Pd(100) substrate (Tunnel parameters: U=0.76 V, I=0.57 nA). STMsimulations performed for both structures (each confined by a black square) aresuperimposed onto the left image.
While the STM images allow a tentative determination of the positions of thePd atoms, they do not allow for any conclusion about the position and numberof O atoms in the
√5 unit cell. The latter can be, however, discerned from the
HRCLS measurement. The spectra, cf. Fig. 6.2, was calibrated with the p(2×2)(0.25ML) and c(2× 2) (0.50ML) adsorbate structures known from the previousLEED work [28, 29, 30, 31, 111], which allowed for a rough estimate of θ ∼ 0.8MLto be obtained. This corresponds to four O atoms per
√5 unit cell.
With this information about the position of the palladium atoms of the surfaceoxide and the Pd(100) substrate, relative to each other, as well as the numberof Pd and O atoms per
√5 unit cell, namely 4 of each, one can proceed and set
up structural models for the√
5 phase, and investigate their compatibility withthe remaining data. The most appealing choice for a model, assuming that the√
5 phase is indeed some form of surface oxide on Pd(100), are then PdO-likeoverlayers. A systematic look at all low-index PdO planes, leads to two orienta-tions in which the lateral arrangement of the Pd atoms corresponds to the onededuced from the STM data. These are the PdO(100) and PdO(101), shown inFig. 6.4 (b) and 6.4 (c). It should be stressed that due to the tetragonal unit-cell of PdO [121] the PdO(001) plane and the Pd(100) plane are not equivalent,meaning that the LEED model features precisely an orientation, which does notfit the STM data, as seen by comparing Fig. 6.4 (a) and Fig. 6.3.
74CHAPTER 6. THE (√
5×√
5)R27O SURFACE OXIDE ON THE PD(100) SURFACE
(a) (b) (c)
Eb = 0.09 eV Eb = - 0.25 eV Eb = - 0.44 eV
Figure 6.6: Top view of structural models, in which the overlayer does not re-semble any PdO surface, considered for the Pd(100)-(
√5 ×
√5)R27-O phase.
In each, the position of the Pd atoms is initially fixed to the one determined ongrounds of analysing the STM images. The positions of the oxygen atoms is cho-sen such, that some of them are in hollow and some are in bridge sites betweenthe overlayer Pd atoms, thus producing differently coordinated O atoms at thesurface (s. text). Big circles: Pd atoms (dark: overlayer, dark grey: 1st substratelayer, light grey: 2nd substrate layer); small white circles: O atoms.
6.4 The new model: PdO(101)/Pd(100)
6.4.1 Geometric consideration
A closer look at the PdO(100) and PdO(101) overlayers, filtered out as possiblecandidates for a new structural model, reveals that each of them has 4 Pd and 4O atoms per
√5 unit cell, which fits nicely the previously described experimental
estimations. The only difference between them is the vertical position of the oxy-gen atoms, all of which are above the Pd layer in the case of PdO(100), while forPdO(101) groups of two are located above and below the surface, respectively.Both structures were fully relaxed and, interestingly, each turned out to be signif-icantly more stable than the afore discussed LEED model, providing the final ev-idence for the incorrectness of the latter. More precisely, the PdO(101)/Pd(100)√
5 geometry is found to be the most stable of the three, having an average bind-ing energy of Eb = 1.36 eV/O atom, while the corresponding number for the othertwo structures is Eb = 0.92 eV/O atom for the PdO(100)/Pd(100) overlayer andEb = 0.32 eV/O atom for PdO(001)/Pd(100) (the LEED model). It should bestressed, that the PdO(101)/Pd(100) structure is thus more than 1 eV/O atom(!) more stable than the LEED model.Taking into account, that the surface oxide might have a structure totally dif-ferent from an PdO-layer, some further geometries were tested. As core-levelshifts are known to be particularly influenced by the coordination of an atom,first geometries in which the oxygens have a different local environment wereconsidered. Such geometries, in which the initial position of the Pd atoms are
6.4. THE NEW MODEL: PDO(101)/PD(100) 75
fixed to the ones determined by the STM analysis are displayed in Fig. 6.6. Itcan be seen that the combinations chosen for the lateral position of the oxygenatoms is always such, that some of them are found in hollow and some of them inbridge sites between Pd atoms. As a result, the O atoms at the surface are alwaysdifferently coordinated, which could possibly generate a split O 1s core-level spec-trum. Yet, in all such combinatorial cases (with O in hollow and bridge sites),the obtained binding energies are significantly lower than the PdO(101)/Pd(100)model 6. Tested were also two geometries (not shown) in which the palladiumatoms were slightly displaced from the STM-analysis based positions and a com-bination of O located above and below this Pd layer, but neither of them broughtan energetic improvement over the most stable model.
Finally, it is considered that the dark holes seen
Figure 6.7: Total energylandscape, correspondingto different PdO(101) reg-istries over the Pd(100)substrate. The white dotsshow the positions of the Pdatoms of the first substratelayer. The energy of themost stable geometry istaken as reference.
in the STM image could mean, that the palladiumatom located over the fourfold hollow side, PdH inFig.6.4, is really absent. With bulk Pd as reservoirfor the removed Pd atom, such a model is found tobe less stable, as well (Eb=0.32 eV/atom).The last series of tests comprised a search for theoptimal position of the overlayer atoms over thePd(100) substrate. This was done by shifting thewhole PdO(101) overlayer laterally over the sur-face, resulting in 10 additional inequivalent struc-tures, which had to be taken into account. Anyfurther displacement of the PdO layer leeds to ageometry, which had been already calculated. Theatoms of both the substrate and the overlayer, butfor one Pd atom of the PdO-layer, were relaxed.The resulting energy landscape is shown in Fig.6.7. The energy of the most stable geometry istaken as zero and appears as dark areas in the plot.
Their repeated appearance is due to the repetition of structures with the sameregistry, which reemerge, as the overlayer is shifted over the substrate. Thismeans, e.g., that an atom which was previously in a bridge position with respectto the underlying substrate moves to a hollow position, while the reverse is truefor the Pd atom, which was originally in the hollow position. The ”registry”search did not reveal an energetically more stable structure. It can thereforebe concluded, that each of the performed DFT calculations strongly favours theinitially chosen PdO(101)/Pd(100) structure for the
√5 phase.
6.4.2 Compatibility with the STM data
To ensure the compatibility of the proposed model, PdO(101)/Pd(100) with theSTM data, STM images of this structure have to be simulated. To make such
6The displayed structures were not fully relaxed. Still, considering the evolvement of thebinding energy as the forces on the atoms become smaller, it is not expected, that the energywill improve by more than 0.4 eV, which is a conservative limit.
76CHAPTER 6. THE (√
5×√
5)R27O SURFACE OXIDE ON THE PD(100) SURFACE
simulations possible, it was necessary to implement the according programs intothe WIEN package7.A system, which has to be considered in a STM theory is comprised of tip andprobe. It is rather complex and cannot be treated without some approximations.A lack of knowledge about the precise atomic structure and chemical compositionof the tip, is just one of the encountered problems.A rather simplified theory of STM, which is used in the present work, is basedon the modified Bardeen approach[122, 123]. The tip is regarded as a small per-turbation of the system and applying Fermi’s Golden rule the tunneling currentcan be expressed as [123]
I(r) = 4π
∫ +∞
−∞[f(ε− eU)− f(ε)]nt
d(r, ε− eU)nd(r, ε)|M |2dε, (6.1)
where f is the Fermi function, U is the applied voltage and consequently eU is thedifference between the Fermi energies, EF , of the tip and of the surface. The localdensity of states for the tip and the surface are nt
d(r, ε) =∑
i |φti(r)|2δ(ε− εi) and
nd(r, ε) =∑
j |φj(r)|2δ(ε − εj). The tunneling matrix M between tip and probecan be expressed as the integral over any surface lying entirely within the vacuumbarrier region separating the two systems,
Mi,j =1
2
∫(φt ∗
i ∇φj − φj∇φt ∗i )dS. (6.2)
In the limit of small voltage and temperature, the Fermi functions can be ap-proximated and eq. (6.1) simplified. It then takes the form:
I(r) = 4π
∫ EF +eU
EF
ntd(r, ε− eU)nd(r, ε)|M |2dε, (6.3)
where EF denotes the Fermi function of the sample.In the theory of Tersoff and Hamann [120], the easiest imaginable approximationis used for the unknown tip-states - they are assumed to have s-like character.The tip is then modeled by a locally spherical potential centered at it, and thecurrent can be expressed as
I(r, U) ∝∫ EF +eU
EF
nd(r, ε)dε, (6.4)
or using the discrete states of a supercell calculation, the integral can be evaluatedas the sum, Nd(r, U), over the charge density of the Kohn-Sham-Eigenfunctionsin the considered interval
I(r, U) ∝ Nd(r, U) =∑
EF≤εi≤EF +eU
nd(r, εi) =∑
EF≤εi≤EF +eU
|φi(r)|2. (6.5)
7The details are given in the Appendix.
6.4. THE NEW MODEL: PDO(101)/PD(100) 77
In other words, the tunneling current in the Tersoff-Hamann picture is simplyproportional to the local density of states of the surface at the position of the tip,and is given by the properties of the surface alone, i.e., tip-surface interactions donot influence the measured current in this model. This makes simulations of STMimages rather straightforward. The only thing that is needed, is the local densityof states at a certain distance from the surface, which is a standard informationevaluated in electronic structure methods.STM images for each of the structures shown in Fig. 6.4 were simulated fromthe self-consistent charge density employing the Tersoff-Hamann approximation.The constant current STM mode is modeled by plotting the interpolated heightdestribution above the surface where the integrated electron density within 0.5eV around the Fermi-level remains constant. This constant value is hereby chosenin such a way that it roughly corresponds to the electron density about 6 A abovethe surface 8. The three images are displayed next to each other in Fig. 6.8.
They obviously look quite different from
Figure 6.8: Simulated STM im-ages for the PdO(001)/Pd(100)(left), PdO(100)/Pd(100) (middle),PdO(101)/Pd(100) (right).
one another. To make comparison to ex-periment easier, each of them was super-posed onto the experimental image, butonly the PdO(101)/Pd(100) inset comple-mented it, cf. Fig. 6.3 . It is now easy toverify the initial assumptions done duringthe analysis of the experimental STM im-age. The bright spots can be immediatelyidentified as the protrusions of the three
Pd atoms in their ring-like arrangement in the PdO-layer. The palladium atomabove the hollow site, PdH (cf. Fig 6.4), is indeed seen as a dark hole. Theinitial interpretation is, however, not correct. It was assumed, that the origin ofthe strong indentation in the STM image is the inward relaxation of this atom.The calculated 0.17 A relaxation towards the substrate is however not that large.The appearance of the PdH as dark spots is therefore rather an electronic, than ageometric effect. This demonstrates, that one should be careful with the interpre-tation of STM images and resort to a simulation or some different experimentaltechnique to verify assumptions, since the relation between an STM picture andthe real geometric structure is not necessarily simple.Dark spots at the PdH position are also seen in the simulation of the PdO(100)/Pd(100) structure, shown in Fig. 6.8 (middle). Here, it is not that clear whetherthey are a consequence of the geometric structure or of electronic effects, sincethe inward relaxation of this atom is 0.52 A. In the PdO(001)/Pd(100) picture,on the other hand, cf. Fig. 6.8 (left), one can be quite sure, that the observeddark rows are due to the geometry, as can be easily discerned by comparison tothe structure shown in Fig. 6.4 (left).
8A suficient criteria concerning the reliability of the Tersoff-Hamann model is that there isno substantial interactions between surface and tip. This means, that for metal surfaces thetip-sample separation has to be larger than 5-6 A [124].
78CHAPTER 6. THE (√
5×√
5)R27O SURFACE OXIDE ON THE PD(100) SURFACE
6.4.3 Surface core-level shifts
What remains to be seen, is if the surface core-level shifts (SCLSs) of the newmodel can be reconciled with the experimental HRCLS data, as well. The SCLS,∆SCLS, is defined as the difference in energy needed to remove a core electroneither from the surface or from the bulk,
Here Esurface(bulk)(nc) is the total energy of the system considered as a functionof the number of electrons nc in the corresponding core level c of a surface orbulk atom, respectively [113]. It was mentioned already, that SCLSs comprise ofinitial and final state effects. In the initial state approximation the SCLS arisessimply from the variation of the computed orbital eigenergies before the excitaionof the core electron and are given by
∆initialSCLS ≈ −[εsurface
c (nc)− εbulkc (nc)], (6.7)
where, εsurfacec (nc) and εbulk
c (nc) are the Kohn-Sham eigenvalues of the particularcore state c. Final state effects are due to the different screening capabilities ofthe already core-ionised system at the surface and in the bulk. A full calculationof the SCLSs, involves an additional component due to the screening contributionfrom the valence electrons in response to the created core hole. It is determinedby calculating the total energy of an impurity with a core hole in the selected corestate. The SCLS is then the difference of two total energies, with the impuritylocated once at the surface and once inside the bulk [125]. This difference canalso be obtained approximately via the Slater-Janak transition state approach(cf. Chapter 2.3.2) of evaluating total energy differences [48, 126]. Equation(6.6) can be transformed into the form of eq. (6.7) using the mean value theoremof integration:
E(nc − 1)− E(nc) =
∫ nc−1
nc
∂E(n′)
∂n′dn′ ≈ −εc(nc − 1/2), (6.8)
as exemplified in Ref. [117]. The initial state SCLS’s can be directly obtainedfrom the normal all-electron scheme, but the total SCLS’s require an additionalself-consistent impurity calculation, where one atom is ionised by removing halfan electron from the considered core level. This latter approach, from which thetotal SCLS is derived, takes both initial and final state effects (in the spectroscopicsense) into account, so that the results can be compared with the experimentalvalues.The necessity to align theoretical and experimental spectra might arise. Findinga reasonable value to use as an anchor for such an alignment may present a prob-lem. In the case of the Pd 3d SCLSs the position of the bulk value is a well defined
Table 6.2: Calculated and measured Pd 3d surface core-level shifts for thePdO(101)/Pd(100) model in eV. The computed values are separated into initial-state and screening contribution, yielding the total final-state shift that can becompared to experiment. See Figs. 6.3 and 6.4 for the notation to describe thevarious first (I) and second (II) layer atoms.
reference value, which can be employed. More problematic is the alignment of ex-perimental and theoretical O 1s data. Several possible alignment procedures andproblems one may encounter when using them are listed in the following. First,one could use the position of the palladium bulk value as reference for all thedata. Since the two types of orbital eigenvalues (i.e. of Pd and O) have, however,a different convergence behaviour with respect to the basis set, such an alignmentmight require the use of very high cutoff parameters. A second possibility is theuse of the Fermi-level position. For system with high oxygen loads like surfaceoxides, band bending can not be excluded and can present a problem, especiallyfor experiment. A further possible alignment level is the value of the electrostaticpotential in the middle of a slab. Any of this procedures should make it possibleto align experimental and theoretical data to give (of course) the same result.The only information needed in the present discussion is about the existence (ornon-existence) of a split in the O 1s spectrum. This difference in relative O 1slevel positions of various atoms within the same geometry is well defined andindependent of the reference zero used. Therefore, just in order to present thetheoretical and experimental data in the same plot a rather crude, but simplealignment approach is used. The position of the lowest theoretical O 1s core-levelposition has been equated to the lowest lying experimental one in Fig. 6.3, forpurely graphical purpose. This does not enter, however, the physical argument.A comparison of the computed final-state SCLS for the different models, pre-sented in Fig. 6.3, makes it immediately apparent that only the O1s core-levelspectrum of the PdO(101) exhibits an appreciable split, due to the presence ofboth on- and sub-surface O atoms in it. The O1s core-levels of the LEED model
80CHAPTER 6. THE (√
5×√
5)R27O SURFACE OXIDE ON THE PD(100) SURFACE
Initial Screening Final
on-surface, OBr 0 0 0OH 0.15 0 0.15
sub-surface, OsubBr 0.53 -0.03 0.50
OsubH 0.70 -0.07 0.63
Table 6.3: Calculated O1s surface core-level shifts for the PdO(101)/Pd(100)model in eV. The lowest lying value is taken as reference. Notation of the variousO atoms, according to Fig. 6.9.
are lying almost on top of each other, as one would expect, since all of them havethe same coordination. In the case of PdO(100) a negliglible split (≈0.17eV),arising due to the strong corrugation of the overlayer, is observed.On the palladium site, the three groups of shifts are obtained for both thePdO(100)/Pd(100) and PdO(101)/Pd(100), shown for the later in Table 6.2.As both of them contain the same groups of Pd atoms in the PdO-overlayer, onewould expect also similar shifts of the Pd 3d levels. The obtained Pd 3d shiftsof +0.9 eV and +0.4 eV are due to fourfold and twofold oxygen coordinated Pdatoms in the PdO(101) overlayer, PdBr/H and PdBr/PdH in Fig. 5, and comparereasonably with the two experimental peaks that had already been assigned todifferently coordinated Pd atoms on the basis of initial-state arguments. Theremaining experimentally resolved peak with a small negative shift had similarlybeen attributed to the top Pd substrate atoms at the interface, which in the cal-culations exhibit almost vanishing SCLSs (Pd1 in Fig. 6.9).Obviously, the PdO(101)/Pd(100) model is also compatible with the experimen-tal HRCLS data. Of course, such split in the O1s is expected solely on the basis ofa geometry containing an equal amount of both on- and sub-surface oxygen. Thesignificant rumpling together with a different coordination of the sub-surface Oto the underlying substrate, yields even slightly different shifts for the two atomsof each oxygen species, cf. Table 6.3. Averaging the contributions within eachgroup, a computed initial (final) state shift of 0.55 eV (0.49 eV) between the O1s peaks due to on- and sub-surface oxygen atoms, is obtained, in reasonableagreement with the measured value of 0.75 eV.
6.5 Strained PdO(101)/Pd(100)
The new structural model for the√
5 phase is essentially a strained and rum-pled PdO(101) film on top of Pd(100). The PdO(101) in-plane lattice constantis almost equal to that of a
√5 unit-cell on Pd(100), with the unit surface area
of the commensurable film found here smaller by only 1.4% than for unstrainedPdO(101). The vertical relaxations and the rumpling of the PdO(101)/Pd(100),
6.5. STRAINED PDO(101)/PD(100) 81
6.23
6Å
OH OHsub
OBr OBrsub
PdH
PdBr
PdBr/H
PdOOH 0.54Å OBr 0.54Å
OHsub 0.42Å OBr
sub 0.48Å
PdBr/H 0.03Å
PdH0.17Å PdBr
0.07ÅPdO
Pd 0.02Å Pd 0.03Å
Pd 0.01Å Pd 0.02ÅPd1
PdO2.35Å
Pd11.95Å (−1.0%)
Pd2
Figure 6.9: Top- and side-view of the PdO(101)/Pd(100) model for the√
5-phase.The rumpling of both the O and Pd atoms in the PdO overlayer and of the Pdatoms in the topmost substrate layer is given with respect to the center of mass ofthe respective layers. In the bottom right, also the average layer distance betweenthese center of mass are indicated.
82CHAPTER 6. THE (√
5×√
5)R27O SURFACE OXIDE ON THE PD(100) SURFACE
each calculated with respect to the center of mass of the corresponding layer,are shown in Fig. 6.9. Comparison to the PdO(101) in a stochiometric termi-nation, reveals that the thin PdO(101) layer is more compressed perpendicularto the surface, compared to the O-Pd-O surface layer of the former. One canimmediately think of two possible reasons why this is so. First, it could be anindication that the atoms in the layer are more strongly bound to each other.Comparing the average binding energy determined for the PdO(101)/Pd(100)sructure, i.e. Eb= 1.36 eV, to the biniding energy of determined for PdO(101)in a stochiometric termination, Eb= 2.31 eV 9, this possibility can be, however,ruled out. The second possibility, would be that the surface oxide reacts to theslight latteral expansion by a compression prependicular to it, so that the O-Pdbondlenght attains its optimum value. As this bondlength does not change ap-preciably from the surface oxide to the bulk and has a value of ≈ 2 A, (this wasalso the bondlength oxygen preferably had when chemisorbed on the Pd(111)surface), this rather favours the second assumtion.It is interesting to compare the SCLS of a PdO(101) in a stochiometric termina-tion to the shifts seen for the surface oxide. The Pd 3d and O1s SCLS in the initialstate for both structures are shown in Fig. 6.10 10. As expected, all the oxygenbonded Pd atoms exhibit a positive shift. The two Pd(100) substrate atoms (withthe positive shift) are in the vicinity of the subsurface oxygens. The other secondlayer Pd atoms resemble more atoms of the clean surface (- 0.51 eV), as they arefurther away from the oxygen atoms and are not as influenced by them. As thePd atoms of the PdO layer are also almost decoupled from these second layerPd atoms, as well, they experience an environment similar to the one on a cleansurface, which explains such a shift. The on-surface O atoms in the surface oxideresemble the on-surface O atoms in PdO(101) as they experience almost the samebonding situation. The sub-surfce oxygen atoms, on the other hand, do not re-semble their sub-surface counterpart in PdO(101), but seem more bulk-like. Thisis true in particular for the Osub
H , which has a more bulk like environment. Thisoxygen atom is almost equidistant to all its Pd (next)neighbours, which is notthe case for the Osub
Br . The workfunction of the PdO(101)/Pd(100), Φ = 5.40 eVis somewhat higher than the value Φ = 5.32 eV for the stochiometric PdO(101).This is propably due to the lack of the second next O-Pd-O layer, which would bepresent in a PdO(101), leading to an incresed charge accumulation on the surfaceoxide side (compared to PdO(101)) and therefore to a somewhat bigger inwardpointing dipole moment.It is intersting to notice that the PdO(101) orientation is not found to be apreferred growth direction of PdO crystallites, as found experimentally [127].Calculations [99] also show that already the bulk PdO(100) orientation shown
9J. Rogal, private communiction10All the PdO(101) SCLS were calculated by J. Rogal. The same muffin-tin radia, RMT, as
for the surface oxide calculations were used.
6.5. STRAINED PDO(101)/PD(100) 83
-0.4-0.20.00.20.40.60.81.0
SCLS(eV)
I4f I2fII
(bulk)4f
II
I4f I3f
Pd3d
-1.0-0.8-0.6-0.4-0.20.00.2
SCLS(eV)
PdO(101)/Pd(100)
PdO(101)
OH
subO
Br
subO
HO
Br
Osub
Oad
Obulk
O1s
Figure 6.10: Calculated initial state Pd 3d and O1s SCSL shifts for thePdO(101)/Pd(100) structure (upper part) and a PdO(101) surface (lower part).The reference value for the Pd 3d shifts is the value in a Pd bulk calculationand for the O 1s shifts, the value of O in a PdO bulk calculation is used, bothindicated by dashed grey lines. Notation for PdO(101)/Pd(100) core-levels is asin Fig. 6.3. Labels for PdO(101): ”I4(3)f” - fourfold (threefold) O coordinated1 layer Pd atoms, ”II” - 2 layer Pd atoms (4-fold O coordinated), ”4f (bulk)” -Pd atom of the PdO bulk (also 4-fold O coordinated. The PdO bulk calculationswere done by J. Rogal (using the same RMT, as were used for the surface oxidecalculations.
84CHAPTER 6. THE (√
5×√
5)R27O SURFACE OXIDE ON THE PD(100) SURFACE
in Fig. 6.4 (middle) exhibits a significantly lower surface energy (33 meV/A2)compared to the stochiometric PdO(101) termination, 57 meV/A2. The stochio-metric PdO(101) termination is considerably more stable than the other two waysof cleaving PdO in the (101) direction. Interestingly, the PdO(100) orientationis in the commensurable thin film geometry discussed here energetically not asfavorable as the PdO(101)/Pd(100)
√5 model. Evidently, the presence of oxygen
at the oxide/metal interface yields a stronger coupling to the underlying substrateand is ultimately responsible for the higher stability of the PdO(101)/Pd(100)surface oxide geometry. The coupling of the various oxide films to the Pd(100)substrate can be calcultated using eq. (5.5). Thus a coupling of 117 meV/A2,is calculated for PdO(101)/Pd(100), while the value for the PdO(100)/Pd(100)structure is 109meV/A2.This example of the stabilisation of a higher energy crystal face in a thin oxidefilms due to strong interfacial coupling to the substrate adds another interestingaspect to the new physics found recently in studies concerning oxide formation atTM surfaces. Among other findings, the formation of incommensurable domainsof low energy oxide faces has been reported for ruthenium single crystals [1, 128],delineating the opposite case to the results presented here, i.e. when the oxideorientation is more important than a good coupling to the underlying substrate.Apparently, the lower thermal stability of palladium oxides compared to RuO2
increases the importance of the oxide/metal interface. This is further supportedby the surface oxide structure found on Pd(111), which does not resemble anyPdO bulk orientation at all [3]. Experimentally, oxide thicknesses below about 20A have been found in all of these cases, indicating either a slow growth kineticsonce the thin films have formed or a thermodynamic hindrance to form thickbulk oxides. This could be of interest in oxidation catalysis, where such oxidepatches forming on TM surfaces in the reactive environment are now discussedas the actually active material [1, 129, 130, 131]. In this context it is interestingto notice that the binding energy of the two on-surface O atoms in the PdO(101)surface oxide, Eb(OBr) = 1.34 eV/atom and Eb(OH) = 1.42 eV/atom11, do notdiffer much from the average binding energy determined for this structure. Fur-thermore, they lie in a medium range which might indeed be useful for catalysis,as comprised by the principle of Sabatier 12. If a continued growth of these oxidefilms is not possible their structure will always remain significantly affected by theinterfacial coupling. For thicker films, interfacial coupling will be progressivelyless influential, so that an initially stabilised higher energy oxide orientation asfound in the present work should eventually become liable to faceting. The cor-
11The binding energies of the individual O atoms in the PdO(101)/Pd(100) structure canbe calculated by removing the atom of interest from its position in the PdO(101) layer, i.e.creating a O vacancy in its place, and relaxing the new structure. Then one can calculte thebinding energy by Eb(O) = 1
12The principle of Sabatier states that a material should be a good catalyst if it bindsatoms/molecules with an energy lying in a medium range.
6.5. STRAINED PDO(101)/PD(100) 85
responding three-dimensional cluster growth has indeed been observed for thecontinued oxidation of both Pd(100) and Pd(111) [26, 27].
86CHAPTER 6. THE (√
5×√
5)R27O SURFACE OXIDE ON THE PD(100) SURFACE
Chapter 7
Thermodynamic stability/Phasediagrams
In order to gain atomic-scale understanding of the oxidation behaviour of palla-dium, the interactions between oxygen and the low index Pd(111) and Pd(100)surfaces were studied in the preceding chapters using DFT. However, one of thetechnological applications, which has led to the widespread use of palladium, isits high reactivity for the CO oxidation reaction. Whether a species is active ornot depends on many factors, not the least of which are the temperature andpressure, at which this reaction takes place. Temperature and pressure can affectthe stability of structures and this point was not considered so far. Clearly, theeffect of T and p has to be accounted for, which can be done using the approachof ”ab-initio atomistic thermodynamics” [8, 9, 10, 11, 12, 13, 14, 15].In the following the basic ideas of this concept will be described and then ap-plied to determine the stability range of various O-phases on the (111) and (100)surfaces of palladium.
7.1 Ab-initio atomistic thermodynamics
The consideration of realistic oxygen pressures and temperatures in ab-initio the-ory, can be achieved by explicitly taking the O environment, in terms of ”ab-initioatomistic thermodynamics”, into account. This concept is based on the assump-tion, that the surface is in equilibrium with the surrounding gas phase. It will beoutlined in the following how the combination of thermodynamics and DFT canbe applied to obtain the lowest energy surface structure with a surrounding gasphase, making it possible to construct a (T, p)-diagram of the stability regions ofdifferent surface phases.The oxygen atmosphere with which a considered surface is in contact is describedby the O pressure p and a temperature T . The environment then acts as a reser-voir, since it can supply oxygen to the substrate or take oxygen from it, without
changing the temperature and pressure. The surface free energy, determined by
γ(T, p) = [G(T, p,NPd, NO)−NPdµPd −N0µ0]/A (7.1)
is minimised by the most stable surface composition and geometry. Here µPd isthe chemical potential of a Pd atom in the bulk and µO is the chemical potentialof an O atom in the gas phase, while NPd and NO are the respective number ofatoms. Furthermore, γ(T, p) is normalised to energy per unit area by dividingthrough a surface area A.In experiment usually the O2 pressure and temperature are varied. It is there-fore most useful to consider the stability of the surface structure with respect toµO(T, p). It is important to note that experimentally (and assuming that ther-modynamic equilibrium applies), µO can only be varied within certain bounds. Ifthe oxygen chemical potential becomes too low, all oxygen would leave the sam-ple, i.e. the oxide would decompose into solid Pd and oxygen gas. This meansthat in a pure oxygen environment, the condition for the stability of a bulk oxide(MxOy) is
gbulkMxOy
< xgbulkM + yµO, (7.2)
i.e.
∆µO >1
y
[gbulkMxOy
− xgbulkM − y
2Etotal
O2
]. (7.3)
Here ∆µO is defined as µO − (1/2)EtotalO2
. For T = 0K the bracket on the righthand side equals half of the low temperature limit of the heat of formation,Hf (T = 0 K, p = 0 atm), of the bulk oxide. As the(T,p)-dependence of thebulk phases is rather small, the right hand side will still be quite close to theHf (T = 0 K, p = 0 atm)-value, even for higher temperatures. Therefore theabove can be rewritten to give the stability condition
∆µO &1
yHf (T = 0 K). (7.4)
On the other hand, the most oxygen rich-condition can be defined, as the pointbeyond which gas phase O would start to condense on the sample. Since the criti-cal temperature for oxygen condensation is too low, compared to the temperatureused e.g. under catalytic conditions, a condensation phase does not exist in thetemperature range of interest. Still, an appropriate and well-defined estimate ofthe upper limit is ∆µO < 0.The Gibbs free energy of formation of the palladium oxide at zero temperatureand pressure is determined by
∆Gf (0, 0) : 2Pd(s) + O2(g) → 2PdO(s)
∆Gf (0, 0)(PdO) ≈ 1
2E(2PdO)− E(O) + 2Eb − 2E(Pd) = −0.869 eV1 (7.5)
1J.Rogal, private communication.
7.1. AB-INITIO ATOMISTIC THERMODYNAMICS 89
T µO(T, p0) T µO(T, p0)100 K -0.08 eV 600 K -0.61 eV200 K -0.17 eV 700 K -0.73 eV300 K -0.27 eV 800 K -0.85 eV400 K -0.38 eV 900 K -0.98 eV500 K -0.50 eV 1000 K -1.10 eV
Table 7.1: µO(T, p0) in the temperature range of interest to the present study.The entropy and enthalpy changes used to obtain µO(T, p0) were taken from theJANAF thermochemical tables at p0 = 1 atm [132].
The T and p dependence is given mainly by the oxygen chemical potential, µO,i.e. by the O2 gas phase atmosphere:
µO(T, p) =1
2
[Etotal
O2+ µO2(T, p0) + kBT ln
(pO2
p
)], (7.6)
where the temperature dependence of µO2(T, p0) includes the contributions fromrotations and vibrations of the molecules, as well as the ideal-gas entropy atp0 = 1 atm. The latter quantities can be computed from first principles, yieldingresults that are at the temperature range of interest, virtually indistinguishablefrom the experimental values listed in thermodynamic tables [132]. The valuesused for µO2(T, p0) in the present work are taken from Ref. [89] and are listedin Table 7.1. The above formula further allows to convert results obtained asa function of the oxygen chemical potential, into pressure scales at any specifictemperature.As a main point of interest in this chapter is to investigate the effect of pressureand temperature on the stability of the various structures analysed in the previouschapters, one can follow the approach of Li, Stampfl and Scheffler[100] to evaluatethe Gibbs free energy of adsoprtion and compare it to other possible states of thesystem like on- or sub-surface oxygen phases or the bulk oxide. The Gibbs freeenergy of adsorption can be written as
∆G(∆µO) ≈ − 1
A
[Etotal
O@Pd − EtotalPd −NO
(E 1
2O2
+ ∆µO
)]=
NO
A
[Ebind
O@Pd + ∆µO
].
. (7.7)
Here, EtotalO@Pd and Etotal
Pd are the total energies of the surface with and withoutoxygen coverage of NO oxygen atoms per surface area A. In the second line, thefirst terms in the brackets have been identified with the average binding energyof oxygen in the particular surface configuration and with respect to 1/2Etotal
Figure 7.1: Surface oxide on the palladium (111) surface. The figure is takenfrom Ref. [3]. (a) unit cell of the Pd5O4 surace oxide, (b) experimental (SXRD)and theoretical (DFT) positions of the atoms in the unit cell, as multiples ofthe unit vectors of the adlayer, (c) Seven times replicated Pd5O4 overlayer onthe Pd(111) substrate resulting in the lowest energy concerning the registry ofthe oxygen layer to the substrate. The black lines show the supercell, the whitesquare indicates the unit cell of the adsorbate.
7.2 Stability Range on Pd(111)
Starting with the Pd(111) surface, the above described formalism is used to studythe stability of the different O-Pd phases on it. The binding energies for thestable oxygen adsorbate phases on Pd(111) are listed in Table 7.2, which meansthat for 3/4ML and 1.00ML coverages, the mixed Ofcc/Otetra−I combinations areconsidered. The structure at the bottom of the table is the surface oxide identifiedon the Pd(111) surface [3], which has not been discussed so far.This surface oxide is a O-Pd-O layer with a rather complicated structure, shownin Fig. 7.1. The site of its unit cell has the length
√6. Therefore, this structure
has been termed ”(√
6×√
6)−O” , in spite of the facts that it is a square structureon a substrate with threefold symmetry. It has 5 palladium and 4 oxygen atomsper unit cell and the oxygen coverage corresponds to 0.67ML. The unit cellis commensurate in the direction of one cell diagonal (marked as ”2
√3” in Fig.
7.1 (a)) and compressed along the other diagonal to reach commensurability. Theoxygen atoms in the layer are quite buckled (≈ 0.85 A). There are two kinds ofoxygen atoms in the Pd5O4 layer. Half of the O atoms are threefold coordinatedand bonded only to in-plane Pd atoms, the other half is fourfold coordinatedand bonded also to the sub-surface Pd atoms, above which they are located.Four palladium atoms per unit cell are coordinated to two neighbouring oxygenatoms. The remaining palladium atom is coordinated to four oxygen atoms. Thefourfold coordinated Pd atoms are located above densely packed Pd atom rows
Table 7.2: The binding energies of different O/Pd(111) stable phases, and thestructures they correspond to, are shown in the first two columns. The func-tional dependence of the change in Gibbs free energy on the chemical potential,∆G(∆µO), and the endpoints of the lines shown in Fig.7.2, calculated by thisformula, are shown as well.
of the substrate, indicated by dashed lines in Fig. 7.1 (c). In contrast to thepreviously discussed surface oxide on the Pd(100) surface, the ”(
√6×
√6)−O”
structure has neither the stochiometry nor structural similarity to any plane ofthe bulk PdO oxide.The (
√6 ×
√6) cell covers an area of 6.92 Pd(111) unit cells. This information
is used to calculate the surface area of the surface oxide
A(√
6×√
6) = 6.92
[(abulk
0√2
)2
sin60]= 46.752A
2. (7.8)
As the calculations for the (√
6×√
6)−O were performed with a different (pseudo-potential) code, the binding energies are shifted with respect to the ones deter-mined in the present work. This can be seen by comparing the energies of theO (2×2)/Pd(111) and O (2×1)/Pd(111) structures of this work to the publishedones, i.e. 1.36 eV and 0.95 eV [3]. To better compare to the data of the presentwork, this information is used to shift the value determined for the binding en-ergy of the surface oxide (1.24 eV) to 1.38 eV (this value is used in the following).Such a shift does not affect the stability range of the different structures seenthe stability diagram (Fig. 7.2), since only the difference between the energies ofvarious structures matters for the plot 2. Redrawing the figure (not shown) withthe energies from Ref. [3] results in a overall shift of the plot, but the width ofthe various stability regions is not affected.Apart from the binding energies, Table 7.2 shows the dependence of the Gibbs
2Should one use the value 1.24 eV [3] for the binding energy of the surface oxide, the stabilityrange of the surface oxide becomes smaller, but it still exceeds the stability of the bulk oxide.
Figure 7.2: Computed Gibbs free energy of adsorption (left) for the p(2 × 2)and the hypothetical p(2× 1) on-surface adsorption phase, as well as for the so-called (
√6×
√6)-O surface oxide on Pd(111). The stability range of the surface
oxide extends beyond that of the bulk oxide, given by ∆µO & −0.9 eV, but thereis also a finite range in which an ad-layer forms the thermodynamically moststable phase. The dependence on ∆µO is translated into (p,T)-phase diagram(right). In the bottom of each figure, the ”material type” which is stable in thecorresponding range of O chemical potential is listed and indicated by differentcolors.
free energy of adsorption, ∆G(∆µO), on the oxygen chemical potential for eachconsidered case. The resulting stability diagram is shown in Fig. 7.2. The rangeof O chemical potential in which an according phase is thermodynamically stableis indicated by different background colours. At the bottom of each shaded region,the the corresponding stable phase is listed, as well. The Gibbs free energy ofadsorption of the clean Pd(111) surface is obviously not dependent on the oxygenchemical potential. For low µO it will be the most stable phase. As the oxygenpressure increases, i.e. increasing oxygen chemical potential, it gets harder tostabilise an oxygen deficient surface. Therefore a phase containing oxygen willeventually become more stable than the clean surface. For the considered (111)surface, the intersection point between the dashed line (∆G(∆µO) of the cleansurface) with the line representing ∆G(∆µO) of the p(2× 2) phase, indicates thechemical potential at which the 0.25ML adsorbate phase becomes the favouredone. Obviously, the higher the oxygen content of a considered surface structureis, the steeper the decrease of ∆G(∆µO) will be with increasing chemical poten-tial. In the limit of an infinitely thick bulk oxide on top of the metal substrate,this will result in a vertical line that crosses the zero-axis at the stability con-dition for the bulk oxide in eq. (7.4). This value was determined earlier to be∆Gf (PdO) = −0.869 eV (cf. eq. (7.5)). For any higher ∆µO the bulk oxide willbe the stable phase. The region of bulk oxide stability is indicated in Fig. 7.2,as well.The interesting question about the stability of the thin surface oxides, which are
7.3. STABILITY RANGE ON PD(100) 93
found on both palladium surfaces considered in this work, arises. The previousdiscussion revealed that these thin films hardly resemble their bulk counterpartsand/or are influenced by a strong coupling to the underlying metal substrate.Due to this coupling and structures particularly suited for layered configurations,one may expect the stability range of surface oxides to exceed that of the ac-cording bulk oxide. This is indeed seen in the diagram, which shows that the(√
6×√
6)-O structure becomes stable much earlier than the bulk oxide.Therefore the ∆G(∆µO) plot can be summarised as follows: After the formationof the well studied p(2 × 2) on-surface adsorption phase, a further increase inoxygen pressure leads to the formation of the surface oxide, the stability of whichexceeds that of the bulk oxide. This means, that from a thermodynamic pointof view, only one of the O adsorbate structures discussed in connection withPd(111) is relevant during the oxidation of this surface, since immediately afterit the surface oxide should become stable. However, a thermodynamic picturetotaly disregards kinetic effects, which may well hinder the formation of a certainphase at conditions (i.e. p, T ) derived from thermodynamics.Using eq. (7.6) the ∆G vs. ∆µO plot can be transformed into a (T,p)-phase di-agram. The different thermodynamically stable phases are separated from eachother by lines (black lines in Fig. 7.2 (right)) of constant chemical potential Theycorrespond to the vertical lines in the ∆G(∆µO) plot, given by the borders of thegrey shaded areas in the left-hand side part of the figure. It is important to noticethat these lines are parallel to each other, but shifted. Their inclination is such,that they run always from the lower left part of the (T,p)-diagram, i.e. lowertemperature and pressure, to the upper right side of it, i.e. higher temperatureand pressure. This should invariably be the case in thermodynamic equilibrium.The binding energy enters eq. (7.7). Therfore, changes in the binding energy canshift the lines of constant chemical potential, which separate the stability regionof different phases. This means, that there is some uncertainty in the position ofthe drawn lines. Within the uncertainty limit estimated for the binding energies,this may mean a shift of up to 100K in the temperature, and up to two ordersof magnitude in the pressure scales.
7.3 Stability Range on Pd(100)
During the oxidation of the Pd(100) surface a p(2 × 2) and a c(2 × 2) orderedad-layer structure with O in a fourfold hollow site [27, 111], as well as an ensuing(√
5×√
5)R27-O surface oxide phase, which has been studied in the precedingchapter, have been identified. The calculated binding energies of the possible Oadsorbate structures, for oxygen coverages up to 1ML with oxygen adsorbed inthe fourfold hollow site, as well as the average binding energy determined for thesurface oxide, are all listed in Table 7.3. They were used to obtain the ∆G(∆µO)plot for the Pd(100) surface displayed in Fig. 7.3. The most striking feature of
Table 7.3: The calculated binding energies of different O/Pd(100) stable phases,and the structures they correspond to, are listed in the first two columns. Thefunctional dependence of the change in Gibbs free energy on the change in chem-ical potential, ∆G(∆µO), and the endpoints of the lines shown in Fig.7.3, calcu-lated by this formula, are shown as well.
the plot is the ∆µO-range, in which the surface oxide has the lowest Gibbs freeenergy of adsorption (in comparison with all the considered structures). It notonly exceeds the one of the PdO bulk, as discussed previously and already seenfor the basal surface of palladium, but also the range in which the on-surfaceadsorption phases are more stable than the clean Pd(100) surface. This means,that the latter on-surface phases never correspond to a thermodynamically stablephase, and their frequent observation in UHV experiments [27, 111] appears tobe the mere outcome of the limited O supply offered, as well as of kinetic barrierse.g. for O penetration at the low temperatures employed (UHV experiments aretypically performed by depositing a finite number of ad-atoms, rather than bymaintaining a given gas pressure).Comparing this to the results shown in Fig. 7.2, it is evident that there areenvironmental conditions for which the surface oxide may already be thermody-namically stable on Pd(100), while on-surface adsorption still prevails on Pd(111).
Recently an experimental ”surface phase diagram” for Pd(100) has been obtainedby means of in-situ surface X-ray diffraction(SXRD) measurements [133]. Theoxidation of the Pd(100) surface was monitored over the pressure range from 10−6
to 103 mbar and up to sample temperatures of 1000K. The formation of both the(√
5×√
5)R27 surface oxide [101] and the transformation to a three-dimensionalbulk oxide films have been seen. As the oxide growth thicker the (
√5×
√5)R27
structure disappears from the surface, i.e. the initially formed PdO(101) planedoes not continue to grow but instead restructures. This is in agreement with theobservation that the (101) orientation is a high-energy facet of PdO [99], and also
Figure 7.3: Computed Gibbs free energy of adsorption (left) for the p(2 × 2)and the c(2× 2) on-surface adsorption phase, as well as for the (
√5×
√5)R27-
O surface oxide on Pd(100). The stability range of the surface oxide extendsonce more beyond that of the bulk oxide, cf. Fig. 7.2, but no adlayer formsa thermodynamically stable phase. The surface oxide is the first oxygen phasestable after the clean surface. The (p,T)-phase diagram is shown again on theright side.
with experimental observations concerning the preferred growth direction of PdO[127]. It also supports the assumption that the strong coupling to the substrate,which was important for the stabilisation of the one O-Pd-O layer thick surfaceoxide, is no longer that important as the oxide film grows thicker.The experimental and theoretical (T,p)-phase diagram (cf. Fig. 7.3), are com-pared in Fig. 7.4. The measured points are indicated in Fig. 7.4 (left). Thedrawn ”phase boundaries” are rough estimates to guide the eye. Most strikingly,the (
√5×
√5)R27 structure is found under a wide variety of conditions – even
at an oxygen pressure of 103 mbar and a sample temperature of 575K only theformation of this surface oxide is observed and no indications for the growth ofa thicker oxide film (on the currently experimentally accessible time scale of theorder of 1 hr) is found.A gratifying overall agreement between theory and experiment in this wide rangeof environmental conditions is encountered. There are, however, also notable dif-ferences that go beyond the uncertainties underlying both the experimental andtheoretical approach. This is particularly the observation of the (
√5×
√5)R27
surface oxide in the top left corner of the experimental diagram, i.e. at lowertemperature and high pressures. A central assumption of theory, which predictsthe stability of the bulk oxide under such conditions, was a full thermodynamicequilibrium between surface and gas phase. Therefore this deviation between theexperimental and theoretical (T,p)-phase diagram may be interpreted as a reflec-tion of kinetic limitations to the growth of the bulk oxide under such conditions.Such a limitation is indeed apparent even by taking the experimental data ontheir own. If the surface was fully equilibrated with the environment, the eval-
Figure 7.4: Left: (T,p)-diagram showing the measured phases in the wholerange of experimentally accessible conditions from UHV to ambient pressure.The ”phase boundaries” (see text) are rough estimates to guide the eye. Right:Corresponding surface phase diagram, as calculated by first-principles atomisticthermodynamics. The dashed line indicates the thermodynamic stability of thep(2× 2) adphase, if formation of the surface oxide was kinetically inhibited.
7.3. STABILITY RANGE ON PD(100) 97
Figure 7.5: Figure taken from Ref. [134]. Shown is the p (4 × 4) surface oxideforming on the Ag(111) surface.The unit cell is indicated. Oxygen atoms arerepresented by small dark circles. Silver atoms of the oxide layer are indicatedby grey cricles. The white circles represent the Ag(111) substrate.
uated phase boundaries would have to follow lines of constant oxygen chemicalpotential, which is the single determining quantity if thermodynamics applies.It was pointed out in the preceding discussion, that lines of constant chemicalpotential are always parallel to the phase boundaries, as shown in the theoreticaldiagram. For the bulk/surface oxide boundary drawn in Fig. 7.4 (left) (evenconsidering all uncertainties) this is clearly not the case.Similarly, the observation of the p(2 × 2) adsorbate phase in experiment, whichaccording to theory is never a thermodynamically stable phase, might be a sign ofkinetic hindrance to the formation of the (
√5×
√5)R27 phase. For comparative
reasons, the corresponding line has also been marked in the theoretical plot, i.e.dashed line in the right part of Fig. 7.4, denoting the area, where the p(2 × 2)would turn out more stable than the clean surface, if the surface oxide can notform.
It would be intersting to compare the results obtained for the stability of variousO/Pd phases on the (100) and (111) surfaces of palladium, to the situation onAg(111). The atomic structure of the surface oxide identified on the Ag(111)surface [5] is shown in Fig. 7.5. The surface oxide is a commensurable p (4× 4)oxide phase. The structure has been termed ”(4 × 4)”, because the area of the(√
3 ×√
3)R30 surface unit cell is practically four times that of clean (1 × 1)-Ag(111). The difference in the length of the lattice vectors is 1.2% [134]. Al-though the (mentioned) surface unit cells are commensurable, the positions ofthe Ag atoms within the (
√3 ×
√3)R30 oxide surface cell are, all except one,
incommensurable with those of the Ag(111) surface.The surface oxide consists of a ”O-Ag-O” trilayer and has a ring-like structure.
Figure 7.6: Figures taken from Ref. [110]. Left: Gibbs free energy of adsorptionfor various low energy O/Ag structures on the Ag(111) surface as a function of theO chemical potential. The labels ”0.75ML”, ”1.25ML”, and ”2.25ML” indicatethe O-concentrations in the corresponding oxide-like structures. The (4 × 4)structure has the label ”0.375”ML. Right: Phase diagram for O at Ag(111) as afunction of pressure and temperature, showing the stable structures.
Its structure is very similar to a trilayer of Ag2O(111) [110], except there is oneatom missing in the indicated cell (cf. Fig. 7.5). This missing atom would havebeen located directly on top of the Ag atom in the (111) surface below.The stability plot of different O/Ag(111) phases and the corresponding phase-diagram, shown in Fig. 7.6, are taken from Ref. [110]. As one would expect fromthe previously discussed Pd cases, at low oxygen chemical potentails the cleanAg(111) surface is the most stable phase. With increasing µO eventually a lowcoverage (1/16ML) of oxygen on the surface in fcc-hollow sites becomes thermo-dynamically more stable than the clean surface. It is followed by a θ = 1/9MLand a θ = 1/4ML structure, before the surface oxide becomes stable. The (4×4)surface oxide phase is labeled ”0.375 ML” (according to its oxygen coverage) andis observed in the range −0.54 eV ≤ ∆µO ≤ −0.325 eV. One should notice, thatthe stability range of the surface oxide exceeds the one of the bulk oxide, as wasalso seen for surface oxides on palladium. Interestingly, an investigation of thestability of various intermediate precursors suggested in the oxidation pathwayfrom Ru(0001) to RuO2(110) revealed no range of oxygen chemical potentails forwhich they might be stable [135]. Therefore one could tentatively expect thatsurface oxides play a thermodynamic role more for the 4d transition metals to-wards the right of the periodic table, where the decreasing thermal stability of the
7.3. STABILITY RANGE ON PD(100) 99
bulk oxides and the lowered bulk modulus of oxide and metal phase enhance theinfluence of the oxide coupling to the metal substrate. The result is a tendencyto form commensurable, though possibly non-bulk like surface oxides.A transformation of the stability plot for Ag(111) into a (T, p) phase diagram (cf.Fig. 7.6 (right)), shows that the surface oxide is stable in a temperature rangeof 350-530K and atmospheric pressure (p = 1atm), while the di-silver oxide isstable up to 350K. Therefore it was concluded [134] that the bulk oxide cannotpossibly be the active phase for industrial reaction of ethylene epoxidation, whichtake place at higher temperatures. The surface oxide on the other hand is stableexactly in such a reagion, therefore it is suggested that it might be an actuatingthe reaction.Similarly, for Pd the stability of the surface oxide on the (100) surface, i.e. the(√
5 ×√
5)R27 structure approaches the region relevant for CO oxidation, incontrast to the bulk phase. Therefore it might be possible, that it is an activephase for this reaction. To draw, however, such a conclusion one has to performfurther investigation. The first one of which would be to study the surface oxidestability in a O+CO athmosphere.
In conclusion, it must be stressed that the method of ab-initio thermodynamicsis a powerful tool, which makes it possible to discern relevant structures andthe conditions under which they are accessible. One should, however, alwayskeep in mind that it is based on the assumption of thermodynamic equilibriumbetween the surface and the surrounding gas phase, the validity of which hasto be verified. The assumption of thermodynamic equilibrium can also lead todeviations between experimental findings and theoretical predictions, as has beendemonstrated for the (T,p)-phase diagram of Pd(100).
At the time when this work started, knowledge about the oxidation behaviour ofthe late 4d transition metals was quite limited. The focus from metal surfacestowards oxide structures, as being the ones important for CO oxidation catalysis,had just shifted. The result is a number of studies, both experimental and theo-retical, devoted to the O adsorption or O+CO co-adsorption on the surfaces ofdifferent metals, which have emerged in recent years.This work aims to give a comprehensive study of the oxygen-palladium interac-tions and gain insight into the formation of oxides on the Pd (100) and (111)surfaces. It is very fortunate that studies concerning the oxygen behaviour onRu(0001), Rh(111) and Ag(111) were already available or evolved simultaneouslyto the work on palladium. The possibility to compare the findings on this fourmaterials is beneficial not only for the understanding of oxide formation on palla-dium, but also sheds light onto the oxide formation of this sequence of elements.Comparing the relative stability of possible adsorbate structures on the basalplane of palladium, leads to the realisation that oxygen incorporation into palla-dium, starts already at sub-monolayer coverages. This incorporation goes hand inhand with a significant distortion of the lattice, which is less costly for a relativelysoft material like palladium, but much harder for ruthenium. Consequently, Oincorporation into the sub-surface region will commence at progressively lowercoverages for the late 4d transition metal sequence from Ru to Ag, implying acorrelation between the oxidation behaviour and material properties, such as thecohesive energy or bulk modulus. The obtained coverage for each of this elementsis very similar to the one, above which the oxide phase becomes thermodynami-cally more stable than chemisorbed O adlayers. This makes the role of sub-surfaceO as a metastable precursor during the oxide formation on them cognizant.This role of the sub-surface oxygen is probably also the reason, why oxide forma-tion on the more open (100) surface of palladium is found to be thermodynam-ically easier to accomplish compared to the basal surface. The (
√5 ×
√5)R27o
surface oxide structure observed on Pd(100) is identified as a strained, but com-mensurable PdO(101) thin film. It is stabilised by a strong coupling to the
101
102 CHAPTER 8. CONCLUSIONS AND OUTLOOK
substrate, which makes it comprehensible, that the stability region of the surfaceoxide exceeds the one of bulk PdO oxide. Still, it is surprising, that it is thermo-dynamically even more stable that the O ad-layers. It is interesting to notice thatthe binding energy of the on-surface oxygens in this structure is quite close to thecalculated average O binding energy for it. As both lie in a medium range thismight be useful for oxidation catalysis, as stated by the principle of Sabatier. Itis therefore interesting to study the adsorption of CO on this surface oxide. Sucha study might help to explain the oscillatory CO oxidation behaviour observedon the Pd(100) surface [2]. The observed roughening and smoothening of thesurface, are attributed to the oxide and to the clean surface, respectively. Thatthe increase in the CO oxidation rate coincides with the roughening of the sur-face, and drops as it becomes smooth once more, might indicate that the surfaceoxide is reduced and oxidised in turn. It may even be that the oxide is formed onone side of the Pd(100) surface and simultaneously reduced on a different side,in agreement with the wave fronts seen in experiment.The different stability range of surface oxides on Pd(111) and Pd(100) which is theoutcome of the thermodynamic study, is another intriguing detail to be consid-ered. These two surfaces form the predominant surface area of Pd nanoparticles[136], which may have far reaching consequences for the oxidation behaviour ofthe latter. It might well be, that under certain (T, p)-conditions the active phasefor CO oxidation could be on-surface adphases on some facets and surface oxideson others. Such a situation can make the overall kinetic data quite complex andthe attempt to model such behaviour very challenging. One will have to go, forsure, at least beyond the thermodynamic approximations, used so far, and em-ploy e.g. kinetic Monte Carlo.
Appendix A
Basis set tests
All the calculations in this work are performed using the full-potential linearisedaugmented plane wave method (FP-LAPW), described in chapter 2, as imple-mented into the WIEN97 program package. The use of a finite basis set requirescareful testing of the different parameters, which determine its quality. Herebyone has to strive for the minimal set, which will give acceptable results, sincethis makes calculations even of comparatively large systems feasible and, besides,saves computer time.There are, of course, numerous parameters one can think of, but typically only afew of them have a significant influence on performance and quality. The mainparameters which have to be tested are:
• k-point set: the number of irreducible k-points within the Brillouin zone(BZ), needed to describe the dispersion of the bands.
• energy cutoff: In the interstitial region both the wave function and thepotential are expanded in a plane wave bases (cf. eq. (2.38) and eq. (2.39)),which should be infinite in the ideal case. Since this is not possible inpractice, a reasonable truncation point is determined. Consequently, theconvergence of the basis set is dependent on this cutoff parameters - Emax
wf
for the wave function and Emaxpot for the potential expansion.
• angular momenta: Inside the muffin-tin spheres the wave functions and thepotential are expanded in spherical harmonics, which means that angularmomenta come into play. These are:lwfmax - maximum number of angular momenta for the wave functions insidethe spheres,lwfnsmax
- maximum number of angular momenta for off-diagonal matrix ele-ments in the Hamiltonian,lpotmax - maximum number of angular momenta for the potential inside thespheres.
Table A.1: Combinations of basis set parameters used for the determination ofthe equilibrium lattice constant, for both GGA and LDA.
For the surface calculation additionally the thickness of the slab and of the vac-uum region are of profound importance. Consecutive slabs have to be decoupled,which requires a certain thickness of the vacuum region. On the other hand, thisregion should not be unproportionally thick, as this will slow down the calculationand influence the size of matrix.
A.0.1 The bulk calculations
Palladium has a fcc-lattice, which make the usual bulk calculations quite simpleand rather fast. Therefore, one can afford to test some of the mentioned param-eters extensively.In a first step the equilibrium lattice constant of palladium is determined. Theexperimental value for the lattice constant is 3.89 A. It is expected, that the the-oretical lattice constant is not too far away from this value. For this reason,self-consistent calculations for lattice constants, some of which are smaller andother bigger compared to the experimental value, are performed. For the GGAcalculation a is varied from 3.60A up to 4.30A in 0.05A steps. For the LDA cal-culation the range is 3.50A to 4.20A, once more using 0.05A steps. A muffin-tinradius of RMT(Pd) = 2.37a0 = 1.25 A is used.Several combination of the above described basis set parameters are used, forboth LDA and GGA, to determine the equilibrium lattice constant. They arelisted in Table A.1. For each case the equilibrium lattice constant and bulk mod-ulus are determined, using the Murnaghan equation of state. For LDA the valuesvaried between 3.836 A and 3.842 A, while the bulk modulus was in the range220GPa to 228GPa. For GGA a0 was in between 3.950 A and 3.943 A and thebulk modulus 162GPa to 167GPa. For further calculations the values mentionedin Chapter 3, i.e. a0(LDA) = 3.838 A and a0(LDA) = 3.944 A, are used.The value of the lattice constant is influenced mainly by the different k-points andthe different cutoffs for the wave function in the interstitial Emax
wf . The changein angular momenta and of the potential cutoff Emax
pot hardly play a role. To de-termine the best values for the wave function cutoff, Emax
wf , and the number ofk-points, self-consistent calculations are performed for either of them. This canbe done in two ways. Such calculations can be performed either for two different
Figure A.1: The cohesive energy of palladium as a function of coverage (left)and of k-points (right). Shown is change with respect to the ”overkill” value, i.e.k-points in a (15× 15× 1) MP grid and Ewf
max = 15Ry, Ec = 3.64 eV.
lattice constants and then the difference in total energy as a function of eitherEmax
wf or k-points can be plotted to determine the convergence threshold. Typi-cally, the convergence of total energies relative to each other, as seen by such aplot, is much faster, compared to the mere convergence of a total energy alone.The second possibility is to determine the convergence of a physical quantity, e.g.the cohesive energy, with respect to the parameter set. Both ways are employedin the present work.Calculations for lattice constants a1 = 3.88 A and a2 =3.89 A are performed.Hereby Emax
pot = 169Ry, lpotmax = 6, lwf
max = 12 and lwfnsmax
= 6 are used. The k-pointsvariation is performed for Emax
wf = 9.68Ry and the wave function cutoff is testedfor a (7× 7× 1) MP grid, corresponding to 20 k-points in the irreducible part ofthe BZ. In such a way it was determined that Emax
wf ≥ 9.68Ry and kir. ≥ 20 aresufficient for the change in the total energy difference to be less than 5meV.It became necessary to reduce the muffin-tin radius to RMT = 2.25 a0 = 1.19 A, inorder to perform calculations for the Pd(111) surface. For this reason, the sametests are also performed with the latter radius. Thus it is determined, that thewave function cutoff has to be increased, i.e. Emax
wf ≥13.3Ry, to achieve the sameaccuracy.The result of the tests performed to determine the convergence of the cohesiveenergy (for RMT = 2.25 a0) are shown in Fig. (A.1). To make the plots easierto read, the calculated cohesive energy values are given with respect to the valuedetermined in the best (”overkill”) calculation, i.e. 120 k-points in the irreduciblepart of the BZ and Ewf
max = 15Ry, which is Ec = 3.64 eV. The first thing that isnoticeable is that the convergence of the cohesive energy with either wave func-tion cutoff or k-points is worse, compared to the difference in total energies. Itis due to the description of the Pd-atom, the energy of which was determined ina box with side length (13× 14× 15) a0, a k-point at (1/2; 1/2; 1/2) and ROOT
106 APPENDIX A. BASIS SET TESTS
parameter clean Pd(111) surface clean Pd(100) surfaceand O/Pd(111) system and 0/Pd(100) system
RMT (Pd) 2.25 a0 1.80 a0
RMT (O) 1.30 a0 1.30 a0
lwfmax 12 12lnsmax 6 6lpotmax 4 4Emax
wf 17Ry 20RyEmax
pot 169Ry 169RyMP grid;kir for (1× 1) u.c. (12× 12× 1); 19 (12× 12× 1); 28MP grid;kir for (2× 2) u.c. (6× 6× 1);7 (6× 6× 1); 6MP grid;kir for surface oxide - (4× 4× 1); 8
Table A.2: The basis set parameters used for calculations of the palladium (111)and (100) surfaces.
sampling, used for the k space integration. The calculate the cohesive energy thevalue of both the bulk and the ”atom in a box” are taken at the same Ewf
max value.From the dependence of Ec on the k-points it can be concluded, that either Ewf
max
= 19 Ry and (9 × 9 × 9) MP-grid or Ewfmax = 17Ry and (12 × 12 × 12) MP-grid
are sufficient for the cohesive energy to be converged to within 20meV of theoverkill value. On the other hand, that plot of the cutoff dependence shows thateither Ewf
max = 19Ry and (10×10×10) MP-grid or, once again, Ewfmax = 17Ry and
(12×12×12) MP-grid, is enough to be within the same range. Therefore, one canconclude that Ewf
max = 17Ry and (12 × 12 × 12) MP-grid is a good combinationto use.
A.0.2 The surface calculations
The basis set parameters used for the calculations of both the Pd(111) andPd(100) clean and adsorbate/surface oxide covered surface, are listed in TableA.2. For each the generalised gradient approximation (GGA-PBE) [50] is usedfor the exchange-correlation functional. The 4s and 4p semi-core states of Pd, aswell as the O2s are described by local orbitals. To improve the convergence atemperature broadening of 70meV with a Fermi function is used to calculate theFermi energy, EF . The influence of the different ”smearing” methods was testedfor for the bulk calculation, but is found to be of no consequence for the obtainedresults at all.The Pd(111) surface is modeled by a 7 layer palladium slab and a 17 A thickvacuum region. The 7 layer slab ensures, that there are 5 palladium layers inbetween oxygen atoms in sub-surface positions.
Figure A.2: The surface energy of palladium as a function of coverage (left) andof k-points (right). Shown is change with respect to the ”overkill” value, Es =0.59 eV.
The Pd(100) surface is modeled by a 5 layer palladium slab and ≈ 15 A vacuumensure the decoupling of the surfaces of consecutive slabs. For the modeling ofthe
√5 the various PdO layers are added on either side of the five layers Pd(100)
slab.It was already mentioned in Chapter 4 that a central quantity obtained from aDFT calculation is the binding energy. It should be noted, that the calculationof Eb involves the total energies of the O-metal system, EO@M , the clean metalslab, EM , and of an isolated oxygen molecule. Each of this energies depends onthe quality of the basis set. To assess this quality, and judge the extend of theerror due to the approximations made during the calculation, one has to carefullytest different parameters of the basis set. As the repulsion between the oxygenatoms increase with coverage, the two extremes one is faced with are the cleansurface, bereft of any O, and the completely oxygen covered surface, i.e. 1ML.The convergence of sub-monolayer coverage cases, is expected to lay in between.Therefore, the clean and the 1ML O covered surface are discussed in the follow-ing.One characteristic feature of the clean surfaces is the surface energy. Conse-quently, the convergence of γ with coverage and k-points is determined. Theresults for the surface energy of the Pd(111) surface are shown in Fig.A.2. Tomake the k-points sampling in reciprocal space comparable, the bulk calculationsare performed for a crystal with a (111) orientation. The surface energy in eachpoint is determined by using the total energies of a slab and a bulk, calculatedwith the same basis set, i.e. same cutoff, k-points, angular parameters etc. Foreither Emax
wf or k-points, γ ≤ 0.02 eV compared to the best value, is achieved forEmax
wf = 16Ry and 12 irreducible k-points, corresponding to a (9 × 9 × 1) MPgrid. The error is reduced to γ ≤ 0.01 eV for Emax
wf = 17Ry and kir. = 19, i.e. a(12× 12× 1) MP grid.
Figure A.3: Binding energy for O(1× 1)/Pd(111) as a function of coverage (left)and of k-points (right). The change in binding energy for 1.0ML O adsorbed infcc site is shown with respect to the ”overkill” value, Eb = 0.16 eV.
For the surface covered with oxygen atoms, the convergence of the averagebinding energy as a function of wave function cutoff and k-points sampling isstudied, since this is one of the main quantities of interest, after all. The resultsfor the (1× 1)− Ofcc/Pd(111) structure are shown in Fig. A.3. The same basisset is used to calculate Eb in each point. It is seen that the absolute value of thebinding energy is Eb < 0.2 eV for Emax
wf = 17Ry and kir. = 19, i.e. a (12× 12× 1)MP grid. This value is, however reduced to Eb < 0.02 eV, if one considers thedifference between the binding energy of the (1× 1)−O/Pd(111) structure withthe oxygen atom adsorbed once in fcc and once in hcp place, as seen in Fig.A.4. As the main error is introduced by the DFT description of the atomic andmolecular oxygen, a possible error cancellation is least effective for the absolutevalue of the binding energy, as can be seen from the above. Density-functionaltheory, even within the GGA, is known to poorly describe gas phase oxygen andgives in particular the binding energy for molecular oxygen O2 wrong by about0.5 eV per oxygen atom [35].Due to the small bondlengh the energy of the oxygen molecule cannot be calcu-lated directly with a muffin-tin radius of RO
MT = 1.3 bohr, chosen in the surfacecalculations. Therefore, one makes use of the relationship for EO2 ,
EO2 = 2EO + D, (A.1)
where D is the dissociation energy of the O2 molecule. To determine this energyone has to calculate both the energy of an oxygen atom on its own and the dis-sociation energy of the oxygen molecule.The energy of the isolated oxygen atom is computed in a cell with sides (13 ×14× 15) bohr, to avoid spherical averaging of the electron density of the O atom.The k-point at (1/2; 1/2; 1/2) is used for the sampling of the Brillouin zone. Thetotal energy is computed for Emax
Figure A.4: Dependence of the difference in binding energy between O adsorbedin fcc site and hcp site for the O(1× 1)/Pd(111) as a function of coverage (left)and of k-points (right). The value of the ”overkill” calculation is taken, onceagain, as reference.
the Eb the value at the according wave function cutoff is used.The molecular binding energy D, on the other hand, is determined employing asmaller RO
MT of 1.1 bohr within a (13 × 14 × 18) bohr unit cell (again avoidingspherical averaging) and using Γ-point sampling 1. Due to the smaller muffin-tinradius the kinetic-energy cutoff for the plane-wave basis needed for the interstitialregion has been increased to 34Ry. Thus the dissociation energy of the oxygenmolecule is determined to be Eb = 3.101 eV/O atom.As the poor description of the oxygen molecule directly affects the binding ener-gies of the various structures investigated in this work, it is interesting to considerif there is a workaround this problem. Following the approach of Li et al. [100],it is possible to determine the total energy of molecular oxygen, Etot
O2, not via gas
phase calculations, but by employing the approximate equation for the PdO heatof formation, ∆Hf , into which only the total energies of bulk PdO and Pd bulk,Etot
PdO,bulk and EtotPd,bulk, enter, i.e.,
1/2EtotO2
≈ EtotPdO,bulk − Etot
Pd,bulk + ∆Hf (300K, 1atm). (A.2)
At the expense of discarding a completely first-principles type description, onecan use the experimental ∆Hf (300K, 1atm) and thus arrive at Etot
O2without hav-
ing to resort to atomic calculations. Throughout the work only the stabilityof various structures all including the same number of oxygen atoms is com-pared. This means, that the difference between the standard computation ofbinding energies, i.e. by using the gas-phase computed Etot
O2and the value ob-
tained from eq. A.2 will result in a constant shift in the calculated Eb. With∆Hexp
f (300K, 1atm) = 0.88 eV 2 [132], this shift amounts to 0.43 eV per O atom
1The calculation of the molecular binding energy was performed by J. Rogal.2The value determined from DFT [99] is ∆Hf = 0.869 eV. Therefore, it hardly matters (in
Table A.3: The average binding energy of the relaxed geometries of different struc-ture models considered for the (
√5 ×
√5)R27o-O surface oxide on the Pd(100)
surface, for various wave function cutoffs, Emaxwf , and k-points. PdO(101)/Pd(100)
(a) corresponds to a 5 Pd layer slab in the middle plus a PdO(101) layer on bothsides, while for PdO(101)/Pd(100) (b) 7 Pd layers are sandwiched between thePdO(101) layers on both sides of the slab. For the two other structures 3 Pdlayers plus the oxide layer, i.e. PdO(100) or PdO(001), are used. kir. = 8 corre-sponds to a (4× 4× 1) MP grid, and kir. = 18 corresponds to a (6× 6× 1) MPgrid.
with a lower stability of the ∆Hf -derived binding energies and not including zero-point vibrations. This indicates the sizable uncertainty in the absolute bindingenergy values and correspondingly dictates a cautious judgment on the endo- orexothermicity of a structure. The determination of the binding energy is thenlikely to represent an upper limit to the real stability of the different consideredstructures.An increase of the potential expansion up to lpot
max = 6 was also considered, but ithardly affected the relative binding energies. What remains to be estimated, isthe error due to the finite slab size and size of the vacuum region. To this end thevacuum region is increased from 15 eV to 20 eV, but the change in the absolutebinding energy is just 0.02 eV. To appraise the thickness of the slab, calculationsfor slabs with 5 to 11 layers with 1ML oxygen atoms were performed. Althoughthe absolute binding energies are lowered by up to 65meV, the obtained ∆Eb arewithin ±30meV.For the (100) surface of palladium, the above described basis set results in a verygood agreement with the structure determination of the p(2×2) phase reported bya LEED study [111]. As the main concern are the surface oxide structures, severaltest were performed to assess the convergence of the average binding energy per Oatom with respect to the basis set parameters. Of these, the PdO(101)/Pd(100)structure, is the most thorough tested one. The calculated binding energy forvarious structural models considered for the (
√5 ×
√5)R27o-0 surface oxide on
the Pd(100) surface are listed in Table A.3. Each structure is relaxed, so thatthe forces on the atoms are ≤ 5mRy/a.u.. It can be seen that regardless of thestructure, the average binding energy changes by 0.2 eV when the wave functioncutoff is increased from 17Ry to 20Ry and by only 0.04 eV when it is further
111
increased to 24Ry for the PdO(101)/Pd(100) structure. Concerning the k-points,there is almost no a change in Eb between kir = 8 ((4× 4× 1) MP grid) and kir
= 18 corresponds to a (6× 6× 1) MP grid.An increase of the slab thickness has a greater effect on the value of the av-erage binding energy, but does not affect the evolvement with Emax
wf , nor therelative stability of the different structures with respect to each other. (Forthe PdO(001)/Pd(100) a thicker slab was also considered, but not relaxed thor-oughtly).Accounting for all these tests a conservative estimate of ±50meV for the nu-merical uncertainty when comparing relative binding energies can be given. Therelative energetic stabilities of the various tested overlayer models on the Pd(100)surface are also converged to within ±50meV per O atom. As this error affectsneither the evolvement of Eb(θ) with coverage nor the energetic sequence amongconsidered structures, it has no influence on the physical conclusions.
112 APPENDIX A. BASIS SET TESTS
Appendix B
STM simulations
During the course of this work the necessity arose to perform STM simulations.To be able to do so, some existing programs in the WIEN package had to bemodified and an additional, comparatively small program had to be written, toevaluate the electron density using the Tersoff-Hamann approach.
B.1 LAPW5
So far it was only possible to determine the electron density in one (specified)plane, using the LAPW5 program from the WIEN package. To perform an STMsimulation one needs information about the electron density in three dimensions.Therefore the program LAPW5 was modified in such a way, that makes thedetermination of the electron density in a set of parallel planes (at differentheight) possible. Thereby one gets information about the electron density inx-,y- and z-directions. In the following the different changes made to parts ofLAPW5 are described.
• param.inc fileAn additional parameter was added to the param.inc file: NZDIM. This isa dimensioning parameter for the number of points in z-direction, thereforeits value should be at least as big as the number of points one would liketo consider for the z-direction.
• case.in5 file In the case.in5 file (an input file for LAPW5) the extension ofthe planes and their number is specified. This file needs to have the formshown in Table B.1. The modifications with respect to the input file neededfor the original version of the program, are highlighted.
line 1-4: four points in the unit cell (origin, x-end, y-end, z-end), specifyingthe volume, in which electron density will be calculated. In the originalLAPW5 program, only 3 such points were needed (origin, x-end, y-end).
113
114 APPENDIX B. STM SIMULATIONS
0 0 2 3 # x, y, z, divisor of origin3 0 2 3 # x, y, z, divisor of x-end0 3 2 3 # x, y, z, divisor of y-end0 0 3 3 # x, y, z, divisor of z-end
4 3 3 # number of shells10 10 90 # number of points in x,y and z dir,
# (ratio close to lenght ratio)RHO # RHO—DIFF—OVER; ADD—SUB or blankANG VAL NODEBUG # ANG—ATU; VAL—TOT; DEBUG—NODEBUG
Table B.1: The new case.in5 file
line 6 : the number of x, y and z grid points in the volume are specified. Todetermine the charge density only in one plane (as in the original LAPW5program), the coordinates of the points (line 1-4) should have the samez-coordinate and just 1 point in z-direction should be considered.The remaining part of the file, is not changed compared to the original in-put file. When more than one cell should by plotted, one has to make sure,that the number of x and y points in each cell is the same. For example, ifone wants to use 9 points per cell and has in total 5 cells, the value, whichhas to be specified in case.in5 for the number of z-points is 41 (for eachdirection in a plane, i.e. x and y). For the images simulated in chapter6 approximately 1 point per 0.5 A was used. Furthermore, the distancebeween the different planes in which the electron density was determinedwas 0.06A. It was tested that increasing this values does not change theobtained images.
• main1.f fileIn this subroutine the axes of the plot and the grid points are determined.Most modifications had to be made here.In the following the some details about the changes made to this program,together with some explanations about their purpose, are described.
– The following variables were modified or added:
∗ VEC(3,4): its dimensions in the original programm were VEC(3,3)
∗ VZ(3): z-vector for the plot
∗ IZ(3): z-coorinate (height) of a plane
– The origin and endpoints of the plot are determinedSo far only three points had to be specified in case.in5: for the origin,for the x-end and for the y-end of the plot. Now a fourth point mustbe added to consider the z-direction.
B.1. LAPW5 115
– Gridpoints in plot are specifiedIn the original program the grid, on which points the charge densitywas determined, had (NPX × NPY) points. In the changed versionthere are (NPX × NPY × NPZ) points.
– Plot axisThe plot area was determined just by two vectors in the original pro-gram. Now three vectors, defining the three axes of the plot are neededand have to be detemined. The calculated vectors are written also tothe output file, case.output5, thus one can make sure that the plottingarea is indeed what one had in mind. The lenght of this vectors is alsowritten in the case.output5 file.
• prtrh.f fileIn this subroutine the charge density is transformed into a form suitablefor plotting, i.e. multiplied with spherical harmonics. This subroutine wasmodified in such a way, that it now also considers the new dimension, wheninformtion about the electron density is read/ written from/to the outputfile case.rho. The electron density needed as input for the STM simulationprogram is contained in this file.
Now the electron density is available for each point on the three dimensional gridin a volume specified by the vectors given in case.in5. This information is thenevaluated in the program STM, which reads out the height, at which the densitybecomes lower, than some threshold value. Therefore, this programm enables oneto draw a isosurface of constant density.
The receipt one has to follow to perform an STM-Simulation is the following:
• A converged calculation, i.e. a converged density is needed.
• The LAPW2 program has to be run once more to get a case.clmval file.Hereby, one should specify the energy window at the Fermi energy, in whichthe states should be determined.
• Run LAPW5 to gets the electron density on the three dimensional grid.
• Simulate an STM-image by running STM.fInput file: The STM.f programm requires a file STM.rho as input, so onehas to copy the case.rho file to STM.rho.Output file: The output file is called STM.out and is suitable for plottingwith XFarbe. If one wants to use an other plotting programm, it might benecessary to change the format of the output.
116 APPENDIX B. STM SIMULATIONS
Bibliography
[1] H. Over, Y.D. Kim, A.P. Seitsonen, S. Wendt, E. Lundgren, M. Schmid, P.Varga, A. Morgante, and G. Ertl, Science 287, 1474 (2000).
[2] B.L.M Hendriksen, Model catalyst in action - high-pressure scanning tunnel-ing microscopy, Ph.D. thesis, Universiteit Leiden, 2003.
[3] E. Lundgren, G. Kresse, C. Klein, M. Borg, J.N. Andersen, M. De Santis,Y. Gauthier, C. Konvicka, M. Schmid, and P. Varga, Phys. Rev. Lett. 88,246103 (2002).
[4] W.X. Li, C. Stampfl and M. Scheffler, Phys. Rev. B 65, 075407 (2002).
[5] C.I. Carlisle, D.A. King, M.-L. Bocquet, J. Cerda, and P. Sautet, Phys. Rev.Lett. 84, 3899 (2000).
[6] P. Hohnberg and W. Kohn, Phys. Rev. B 136, 846 (1964).
[7] W. Kohn and L. Sham, Phys. Rev. A 140, 1133 (1965).
[8] C.M. Weinert and M. Scheffler, In: Defects in Semiconductors, H.J. vonBardeleben (Ed.), Mat. Sci. Forum 10-12, 25 (1986).
[9] M. Scheffler, In: Phisics of Solid Surfaces - 1987, J. Koukal (Ed.), (Elsevier,Amsterdam 1988); M. Scheffler and J. Dabrowski, Phil. Mag. A 58, 107(1988).
[10] E. Kaxiras, Y. Bar-Yam, J.D. Joannopoulos, and K.C. Pandey, Phys. Rev.B 35, 9625 (1987).
[41] W.M.C. Foulkes, L. Mitas, R.J. Needs, and G. Rajagopal, Rev. Mod. Phys.73, 33 (2001).
[42] R.M. Dreizler and E.K.U. Gross, Density functional theory: an approach tothe quantum many-body problem, Springer Verlag, Berlin (1990).
[43] R.G. Parr and W. Yang, Density functional theory, Oxford University Press,New York (1989).
[44] L.H. Thomas, Proc. Camb. Phil. Soc. 23, 542 (1927).
[45] E. Fermi, Rend. Accad. Lincei 6, 602 (1927); E. Fermi, Z. Phys. 48, 73(1928); E.Fermi, Rend. Accad. Lincei 7, 342 (1928).
[46] M. Levy, Phys. Rev. A 26, 1200 (1982).
[47] C.-O. Almbladh and U. von Barth, Phys. Rev. B 31, 3231 (1985).
[48] J.F. Janak, Phys. Rev. B 18, 7165 (1978).
[49] D.M. Ceperley and B.J. Alder, Phys. Rev. Lett. 45, 566 (1980).
[50] J. Perdew, K. Burke, and M. Ernzerhof, Phys. Rev. Lett. 77, 3865 (1996).
[51] M. Payne, M. Teter, D. Allan, T. Arias, J. Joannopoulos, Rev. Mod. Phys.64, 1045 (1992).
[52] G. Kresse, J. Furthmller, Phys Rev B 54, 11169 (1996).
[53] J. Korringa, Physica 13, 392 (1947).
[54] W. Kohn and N. Rostoker, Phys. Rev. 94, 1111 (1954).
[55] O. Andersen, Phys. Rev. B, 12, 3060 (1975).
[56] H. Skriver, The LMTO method: Muffin-tin orbitals and electronic structure,Spinrger Verlag, Berlin (1984).
[57] S. Savrasov and D. Savrasov, Phys. Rev. B 46, 12181 (1992).
[58] D.J. Singh, Planewaves, Pseudopotentials and the LAPW method, KluwerAcademic, Boston (1994).
120 BIBLIOGRAPHY
[59] J. Slater, Phys. Rev. B 51, 846 (1937).
[60] P. Blaha, K. Schwarz, and J. Luitz, WIEN97, A Full Potential LinearizedAugmented Plane Wave Package for Calculating Crystal Properties, Karl-heinz Schwarz, Techn. Universitat Wien, Austria, (1999). ISBN 3-9501031-0-4.
[61] J. Neugebauer and M. Scheffler, Phys. Rev. B 46, 16067 (1992).
[62] J. Rath and A. Freeman, Phys. Rev. B 11, 2109 (1975).
[63] H. Monkhorst and J. Pack, Phys. Rev. B 13, 5188 (1976).
[64] M. Scheffler, J.P. Vigneron, and G.B. Bachelet, Phys. Rev. Lett. 49, 1765(1982).
[65] M. Scheffler, J.P. Vigneron, and G.B. Bachelet, Phys. Rev. 31, 6541 (1985).
[66] R. Yu, D. Singh, and H. Krakauer, Phys. Rev. B. 43, 6411 (1991).
[67] B. Kohler, S. Wilke, M. Scheffler, R. Kouba, and C. Ambrosch-Draxl, Com-put. Phys. Commun. 94, 31 (1996).
[68] N.W. Ashcroft and N.D. Mermin, Solid State Physics, CBS Publishing, AsiaLtd, (1976).
[69] C. Kittel, Einfuhrung in die Festkorperphysik, R.Oldenbourg VerlagMunchen Wien, John Wiley&Sons GmbH Frankfurt am Main (1973), p.128
[70] F. Birch, J. Appl. Phys. 9, 279 (1938).
[71] F.D. Murnaghan, Proc. Nat. Acad. Sci. 30, 244 (1944).
[72] J. da Silva, The nature and behavior of rare-gas atoms on metal surface,Dissertation, TU Berlin (2002).
[73] J. Rogal, Elektronenstruktur und Stabilitat von Pd und PdO (Dictefunction-altheorierechnungen), Diplomarbeit, FU Berlin (2002).
[74] R.I. Masel, Principles of adsorption and reaction on solid surfaces, JohnWiley&Sons, New York (1996).
[75] T.E. Felter, E.C. Sowa and M.A. Van Hove, Phys. Rev. B 40, 891 (1989).
[76] A. Barbieri, M.A. Van Hove and G.A. Somorjai, Surf. Sci. 306, 261 (1994).
[77] M.W. Finnis and V. Heine, J. Phys. F 4, L37 (1974).
BIBLIOGRAPHY 121
[78] R. Smoluchowski, Phys. Rev. 60, 661 (1941).
[79] H. Ohtani, M.A. Van Hove and G.A. Somorjai, Surf. Sci. 187, 372 (1997).
[80] F. Maca, M. Scheffler and W. Berndt, Surf. Sci. 160, 467 (1985).
[81] K. Christmann, G. Ertl and O. Schober, Surf. Sci. 40, 61 (1973).
[82] K. Reuter, private comunication; Basis set as described in Phys. Rev. B 65,165403 (2002).
[83] M. Methfessel, D. Hennig, and M. Scheffler, Phys. Rev. B 46, 4816 (1992).
[84] N.D. Lang and W. Kohn, Phys. Rev. B 3, 1215 (1971).
[85] B.E. Nieuwenhuys, R. Bouwman and W.M.H. Sachtler, Thin Solid Films 21,51 (1974).
[86] J.E. Demuth, Chem. Phys. Lett. 45, 12 (1977).
[87] M.C. Dejonqueres, D. Spanjaard, Concepts in Surface Physics, Springer(1993).
[88] A. Steltenpohl and N. Memmel, Surf. Sci. 443, 13 (1999).
[89] K. Reuter, M.V. Ganduglia-Pirovano, C. Stampfl, and M. Scheffler, Phys.Rev. B 65, 165403(2002).
[90] C. Stampfl, H.J. Kreuzer, S.H. Payen, H. Pfnur, and M. Scheffler, Phys.Rev. Lett. 83, 2993 (1999).
[91] B. Hammer and J.K. Nørskov, Theory of adsorption and surface reactions,in NATO ASI Series E331, R. Lambert and G. Pacchioni (Eds.), KluwerAcademic Publishers, Dordrecht (1997).
[92] M. Scheffler and C. Stampfl, Theory of adsorption on metal substrates, Hand-book of surface science, volume 2, K. Horn and M. Scheffler (Eds.), Elsevier(2000).
[93] L.D. Schmidt and R. Gomer, J. Chem. Phys. 45, 1605 (1966).
[94] L.W. Swanson and R.W. Strayer, J. Chem. Phys. 48, 2421 (1968).
[95] Z. Sidorski, I. Pelly and R. Gomer, J. Chem. Phys. 50, 2382 (1969).
[96] L. Pauling, The nature of the chemical bond, 3rd ed. (Cornell UniversityPress, Ithaca, NY, 1960; H.O. Pritchard and H.A. Skinner, Chem. Reviews55, 745 (1955).
122 BIBLIOGRAPHY
[97] C.I. Carlisle, T. Fujimoto, W.S. Sim and D.A. King, Surf. Sci. 470, 15(2000), and references therein.
[98] M.E. Grillo, M.V. Ganduglia-Pirovano, and M. Scheffler, (unpublished re-sults).
[99] J. Rogal, K. Reuter, and M. Scheffler, Phys. Rev. B 69, 075421 (2004).
[100] W.X. Li, C. Stampfl, and M. Scheffler, Phys. Rev. B 67, 045408 (2003).
[101] M. Todorova, E. Lundgren, V. Blum, A. Mikkelsen, S. Gray, J. Gustafson,M. Borg, J. Rogal, K. Reuter, J.N. Andersen, M. Scheffler, Surf. Sci. 541101 (2003).
[102] A. Michaelides, M.-L. Bocquet, P. Sautet, A. Alavi and D. A. King, Chem.Phys. Lett. 367, 344 (2003).
[103] M. Todorova, W.X. Li, M.V. Ganduglia-Pirovano, C. Stampfl, K. Reuter,and M. Scheffler, Phys. Rev. Lett. 89, 096103 (2002).
[104] M.V. Ganduglia-Pirovano, K. Reuter, and M. Scheffler, Phys. Rev. B 65,245426 (2002).
[105] C. Stampfl, S. Schwegmann, H. Over, M. Scheffler, and G. Ertl, Phys. Rev.Lett. 77 3371 (1996).
[106] K.D. Gibson, M. Viste, E.C. Sanchez, and S. J. Sibener, J. Chem. Phys.110, 2757 (1999).
[107] J. Wider, T. Greber, E. Wetli, T.J. Kreutz, P. Schwaller, and J. Oster-walder, Surf. Sci. 417, 301 (1998).
[108] A. Bottcher and H. Niehus, J. Chem. Phys. 110, 3186 (1999).
[110] W.X. Li, C. Stampfl, and M. Scheffler, Phys. Rev. Lett. 90, 256102 (2003).
[111] D. Kolthoff, D. Jurgens, C. Schwennicke, and H. Pfnur, Surf. Sci. 365, 374(1996).
[112] N. Martensson and A. Nilsson, High Resolution Core-Level PhotoelectronSpectroscopy of Surfaces and Adsorbates, Vol. 35 of Springer Series in SurfaceScience (Springer, Berlin, 1994), p. 65.
[113] D. Spanjaard, C. Guillot, M.C. Desjonqueres, G. Treglia, and J. Lecante,Surf. Sci. Rep. 5, 1 (1985); W.F. Egelhoff, ibid. 6 253 (1987).
BIBLIOGRAPHY 123
[114] J.N. Andersen, D. Hennig, E. Lundgren, M. Methfessel, R. Nyholm, andM. Scheffler, Phys. Rev. B 50, 17525 (1994).
[115] M. Alden, H.L. Skriver, and B. Johansson, Phys. Rev. Lett. 71,2449 (1993).
[116] M. Alden, H.L. Abrikosov, and B. Johansson, N.M. Rosengaard, and H.L.Skriver, Phys. Rev. B 50, 5131 (1994).
[117] S. Lizzit, A. Baraldi, A. Groso, K. Reuter, M.V. Ganduglia-Pirovano, C.Stampfl, M. Scheffler, M. Stichler, C. Keller, W. Wurth and D. Menzel, Phys.Rev. B 63, 205419 (2001).
[118] M.V. Ganduglia-Pirovano, M. Scheffler, A. Baraldi, S. Lizzit, G. Comelli,G. Paolucci, and R. Rosei, Phys. Rev. B 63, 205415 (2001).
[119] G. Binning, H. Rohrer, Ch. Gerber, and E. Weibel, Appl. Phys. Lett. 40,178 (1982); G. Binning, H. Rohrer, Ch. Gerber, and E. Weibel, Phys. Rev.Lett. 49, 57 (1982).
[120] J. Tersoff and D.R. Hamann, Phys. Rev. B 31, 805 (1985).
[121] D. Rogers, R. Shannon, and J. Gillson, J. Solid State Commun. 134, 314(1971).
[122] J. Bardeen, Phys. Rev. Lett. 6, 57 (1961).
[123] C.J. Chen, Introduction to Scanning Tunneling Microscopy, Oxford seriesin optical and imaging science, Oxford University Press, New York (1993).
[125] B. Johansson and N. Mørtensson, Phys. Rev. B 21, 4427 (1980).
[126] J.P. Perdew and M. Levy, Phys. Rev. B 56, 16 (1997).
[127] J. McBride, K. Haas, and W. Weber, Phys. Rev. B 44, 5016 (1991).
[128] Y.D. Kim, A.P. Seitsonen, and H. Over, J. Phys. Chem. B 105, 2205 (2001).
[129] B.L.M. Hendriksen and J.W.M. Frenken, Phys. Rev. Lett. 89, 046101(2002).
[130] C. Stampfl, M.V. Ganduglia-Pirovano, K. Reuter, and M. Scheffler, Surf.Sci. 500, 368 (2002).
[131] K. Reuter and M. Scheffler, Phys. Rev. Lett. 90, 046103 (2003).
124 BIBLIOGRAPHY
[132] CRC Handbook of Chemistry and Physics, CRC press (Boca Raton, FL,1995).
[133] E. Lundgren, J. Gustafson, A. Mikkelsen, J.N. Andersen, A. Stierle, H.Dosch, M. Todorova, J. Rogal, K. Reuter, and M. Scheffler, Phys. Rev. Lett.92, 046101 (2004).
[134] W.X. Li, C. Stampfl, and M. Scheffler, Phys. Rev. B 68, 165412 (2003).
[135] K. Reuter and M. Scheffler, Appl. Phys. A 78, 793 (2004).
[136] J. Szanyi, W.K. Kuhn, and D.W. Goodman, J. Vac. Sci. Techn. A 11(4),1969 (1993).
Acknowledgments
I would like to thank
Matthias Scheffler for giving me the opportunity to do this work at the Fritz-Haber Institut and for his continuous support.
Kasten Reuter, for always taking the time to answer questions or sort out prob-lems. You are the best supervisor one could have wished for. Besides, I reallyenjoyed the last few years. I can think of so many things to say that my listwould grow out of proportion.
Jorg Behler and Jutta Rogal, for all the laughter we shared and the great timewe had (and still have). I am so very grateful, that we share this time in Berlin.
Edvin Lundgren for the nice experiments.
Evgeni Penev, Veronica Pirovano, Caroline Morgan, Sladjana and all other presentand former members of the group, who have helped me or made my time at theFritz-Haber so pleasant.
Uma, for being a friend and the fun I had answering the unexpected questions Iwas sometimes faced with.
Walter, fur all die Kino und Eis Nachmittage. Meiner Familie, dafur dass sieimmer so eng zusammenhalt.
Meinen Eltern und meiner Schwester fur Ihre andauernde Unterstutzung undeinfach dafur, dass sie da sind. Diese Arbeit ist fur euch.


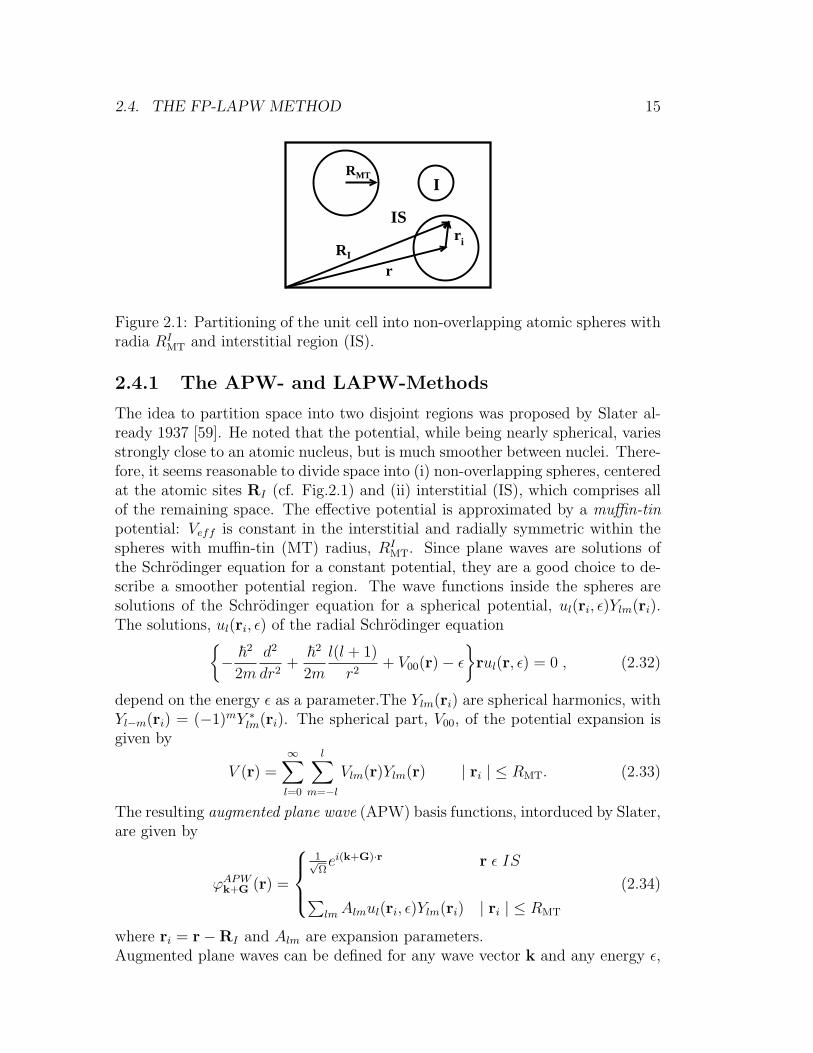


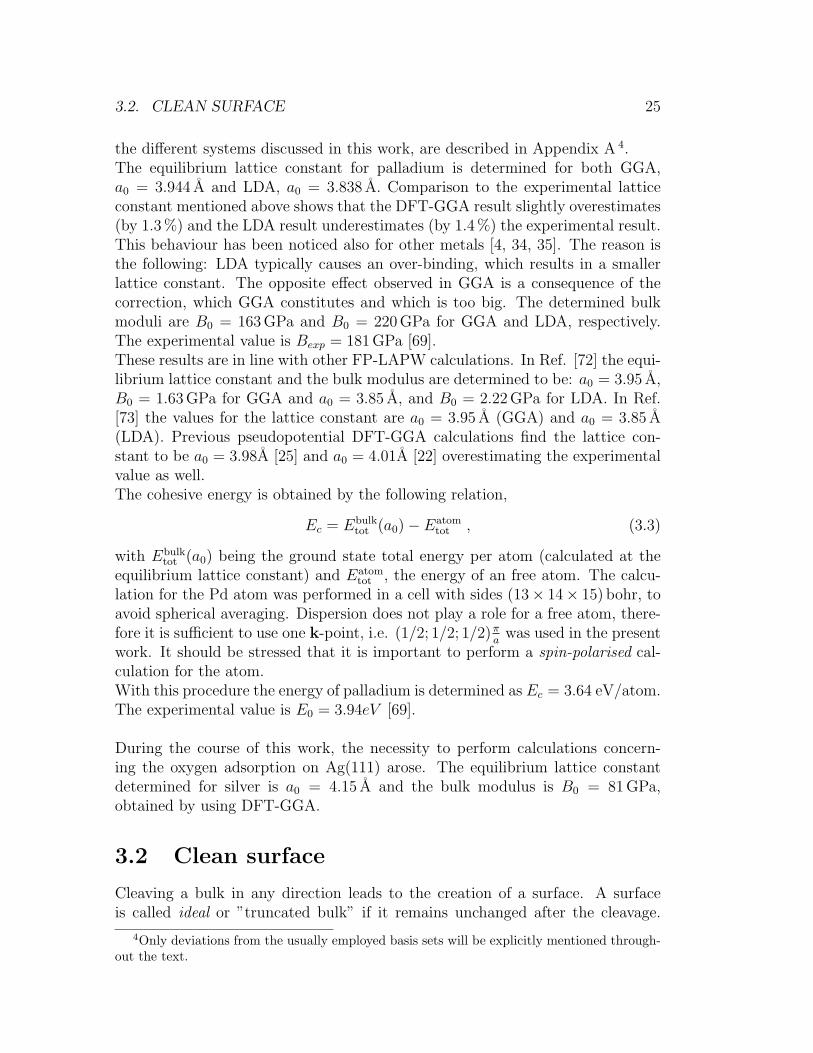
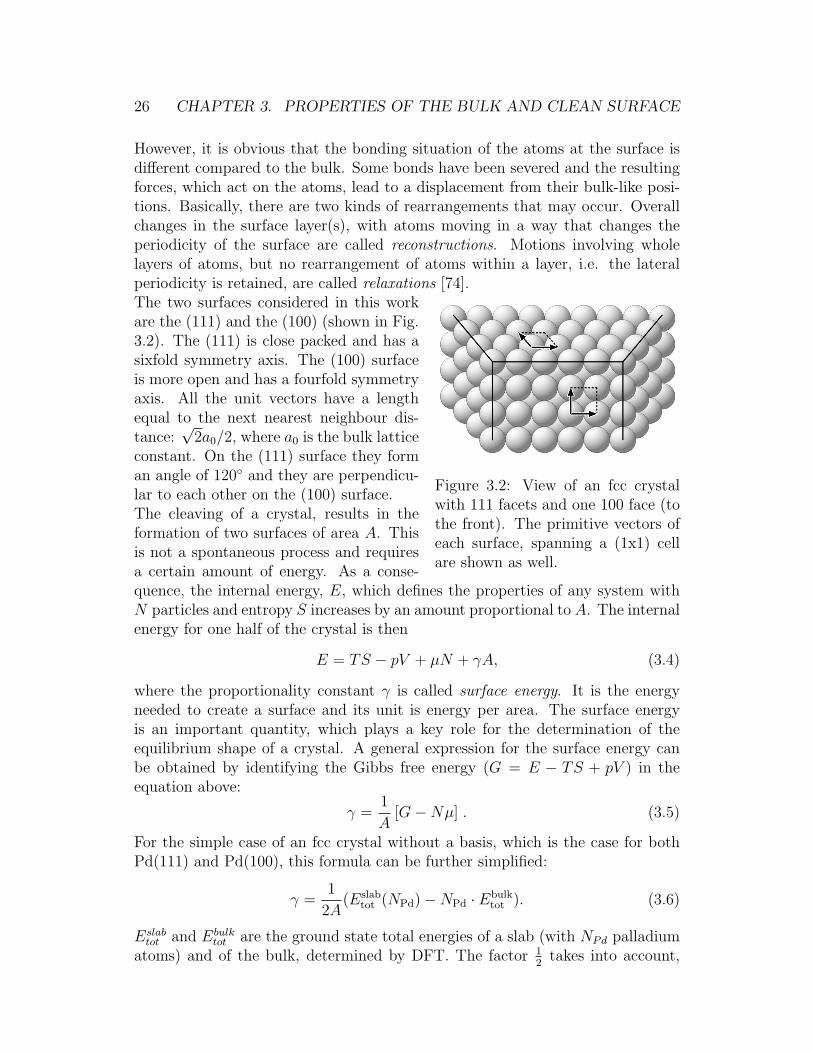
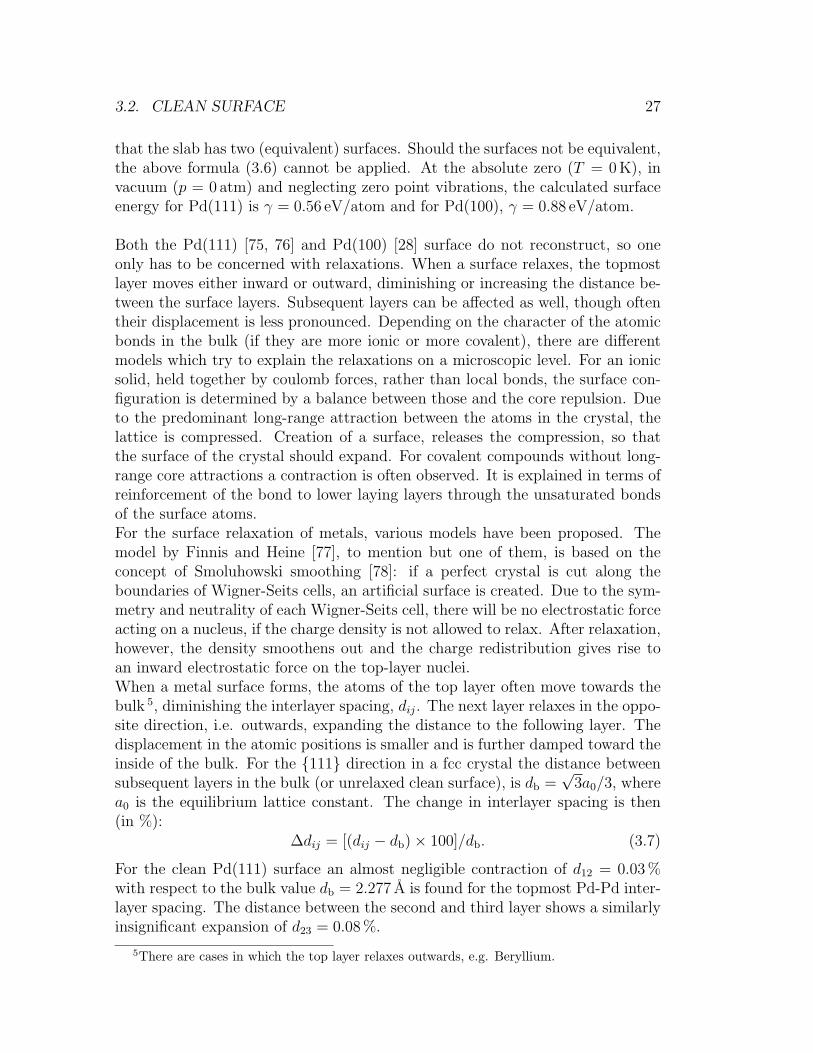

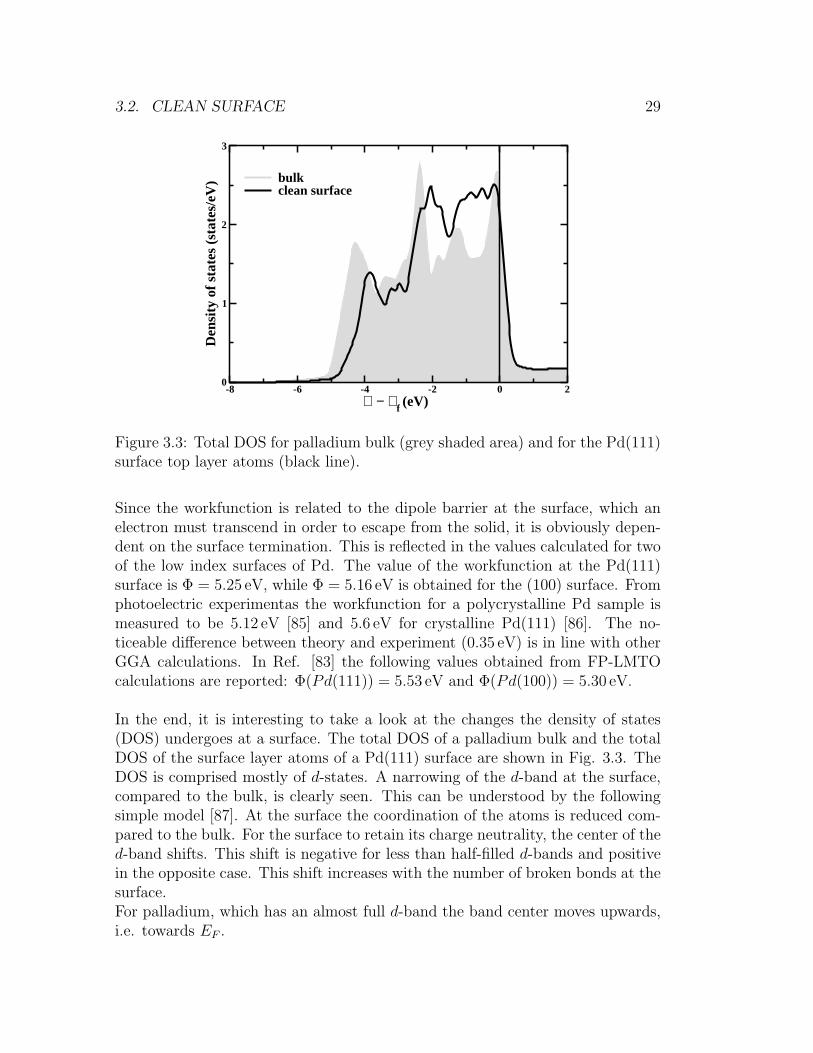


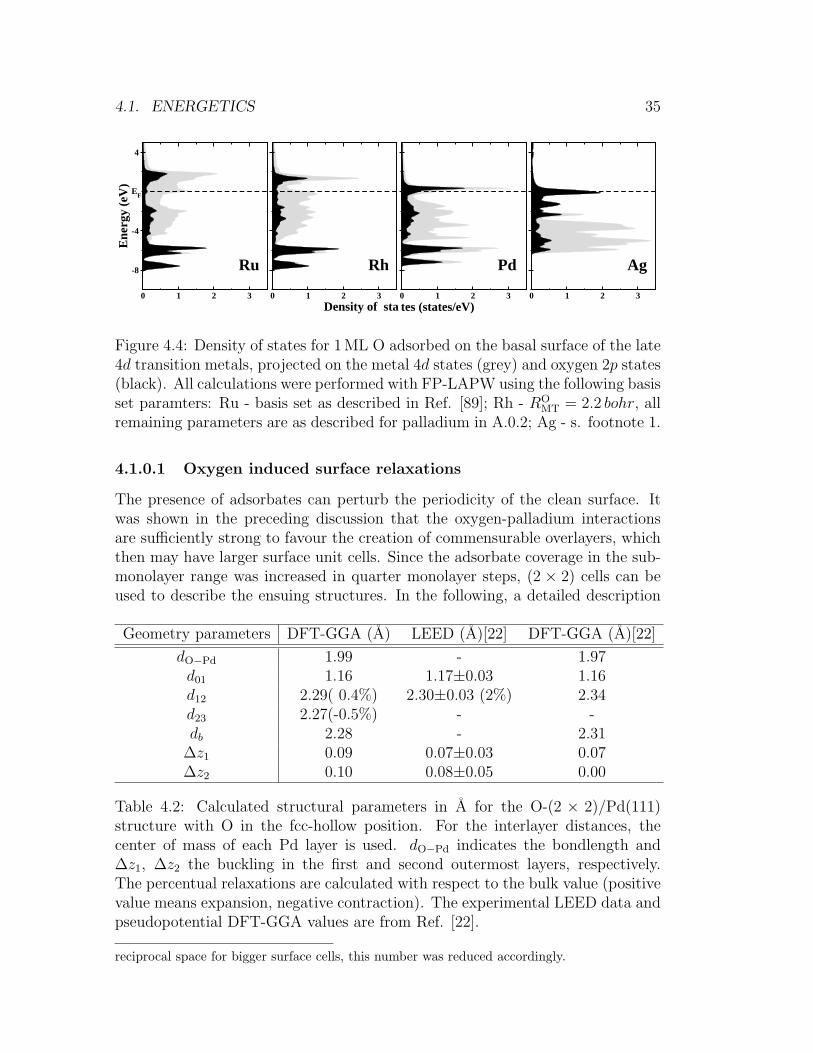

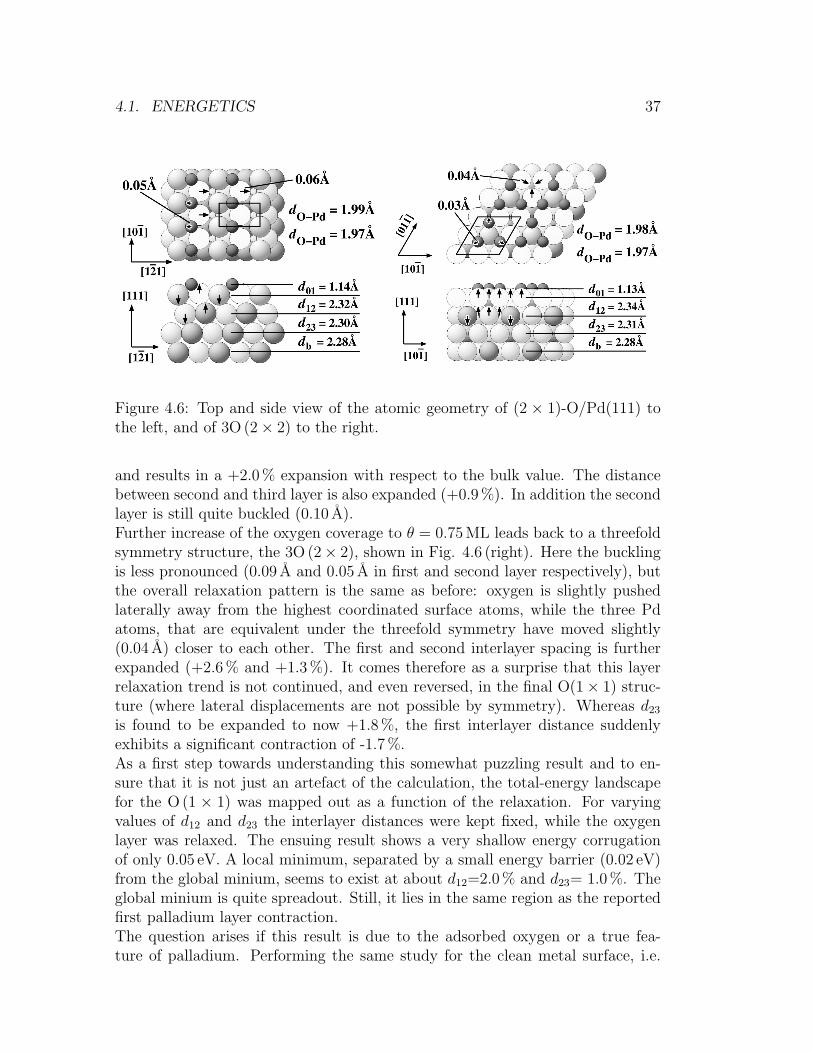


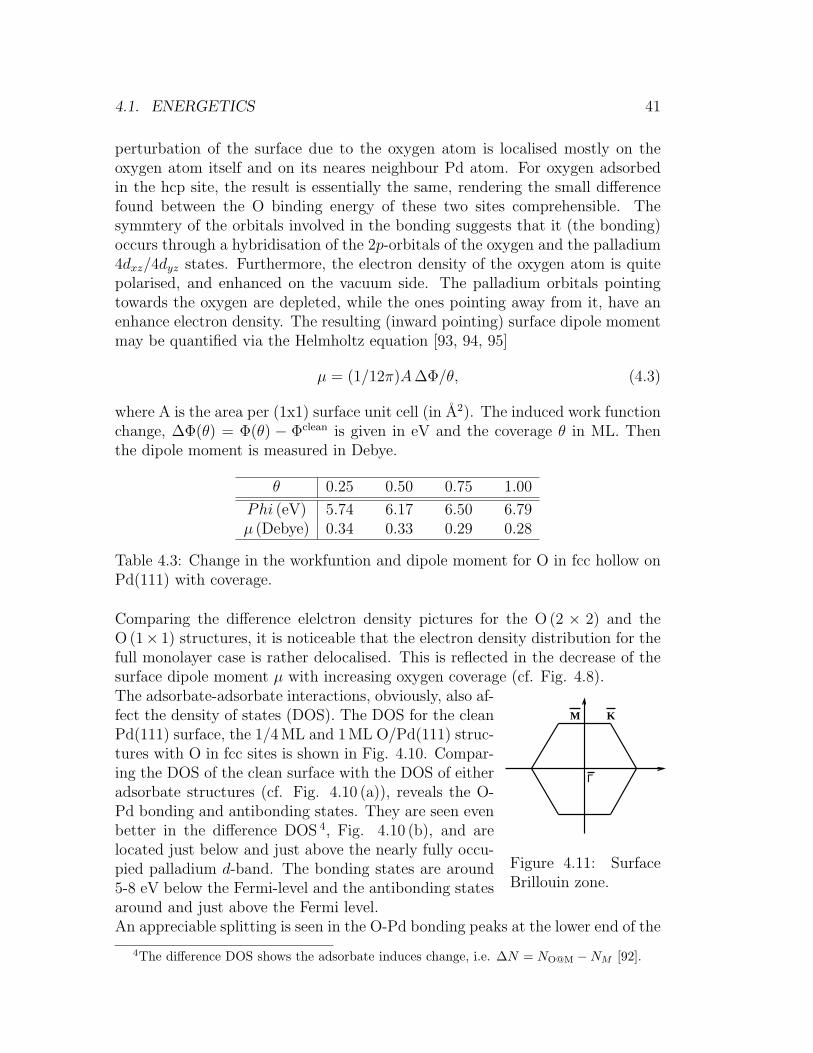


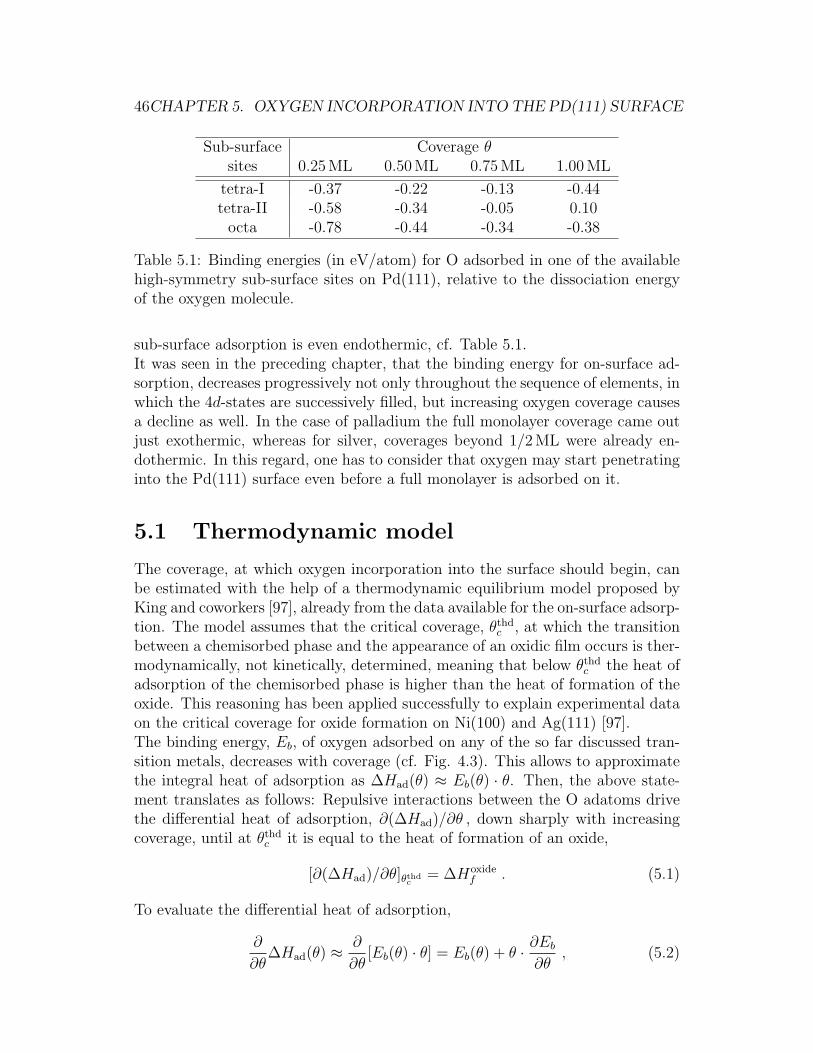


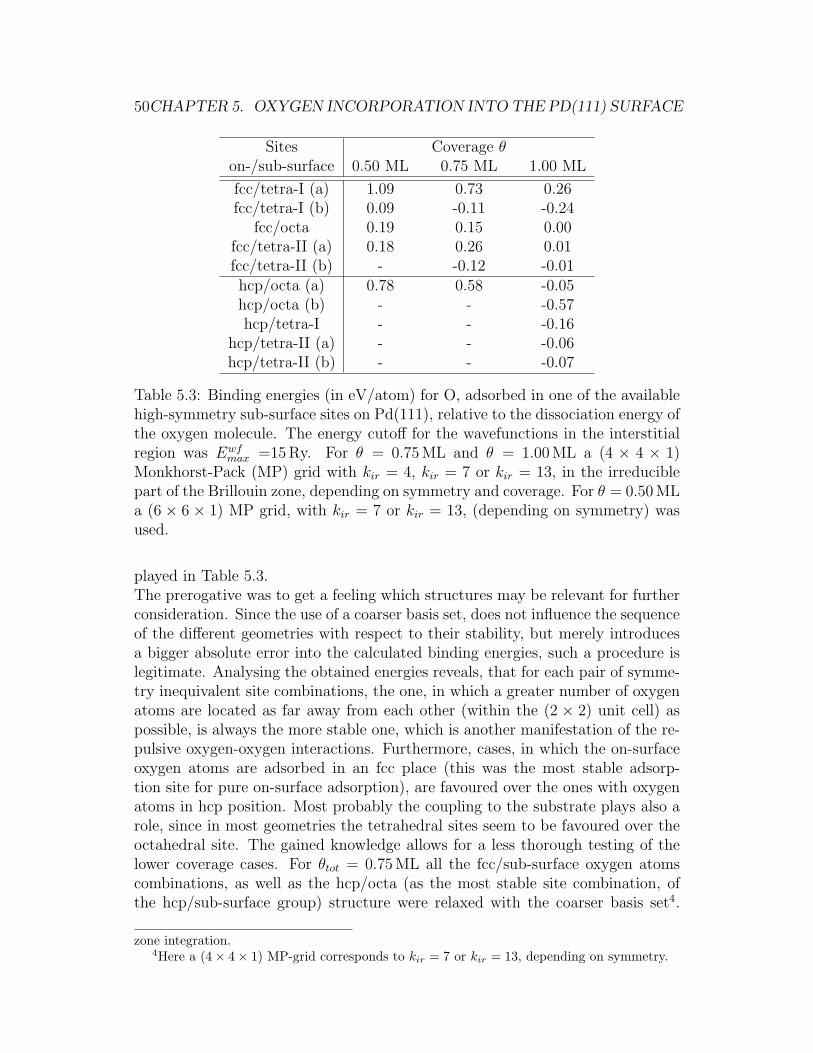


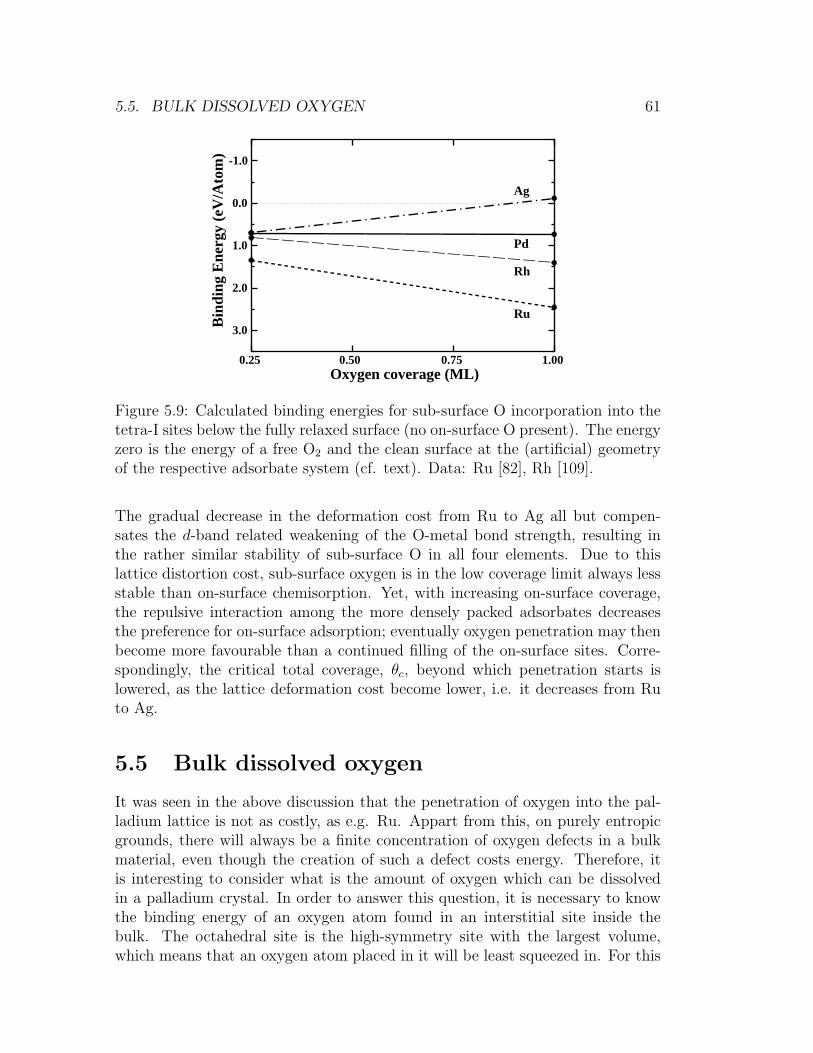


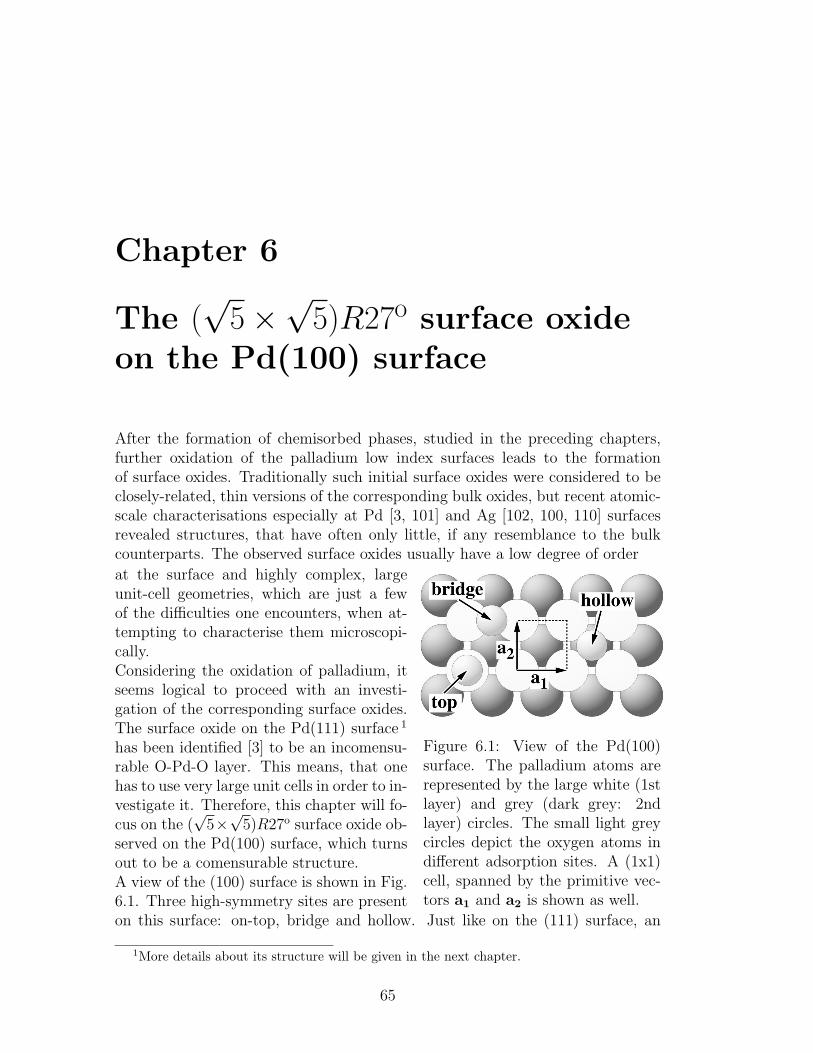
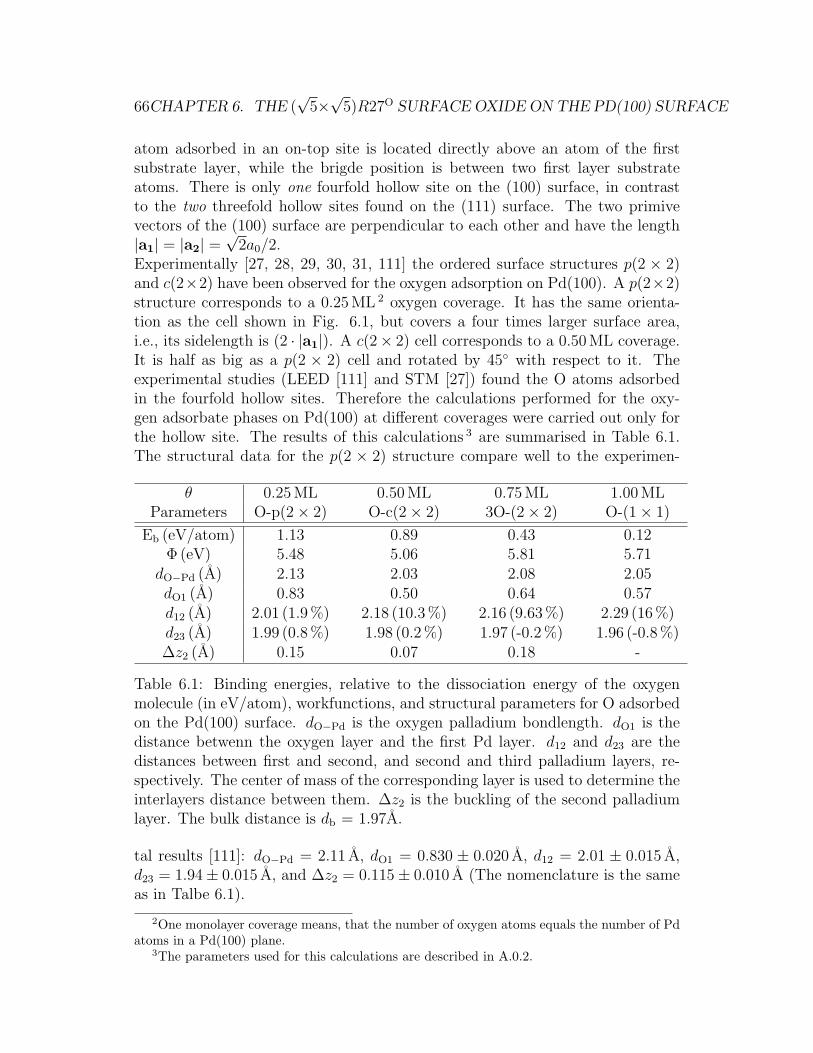

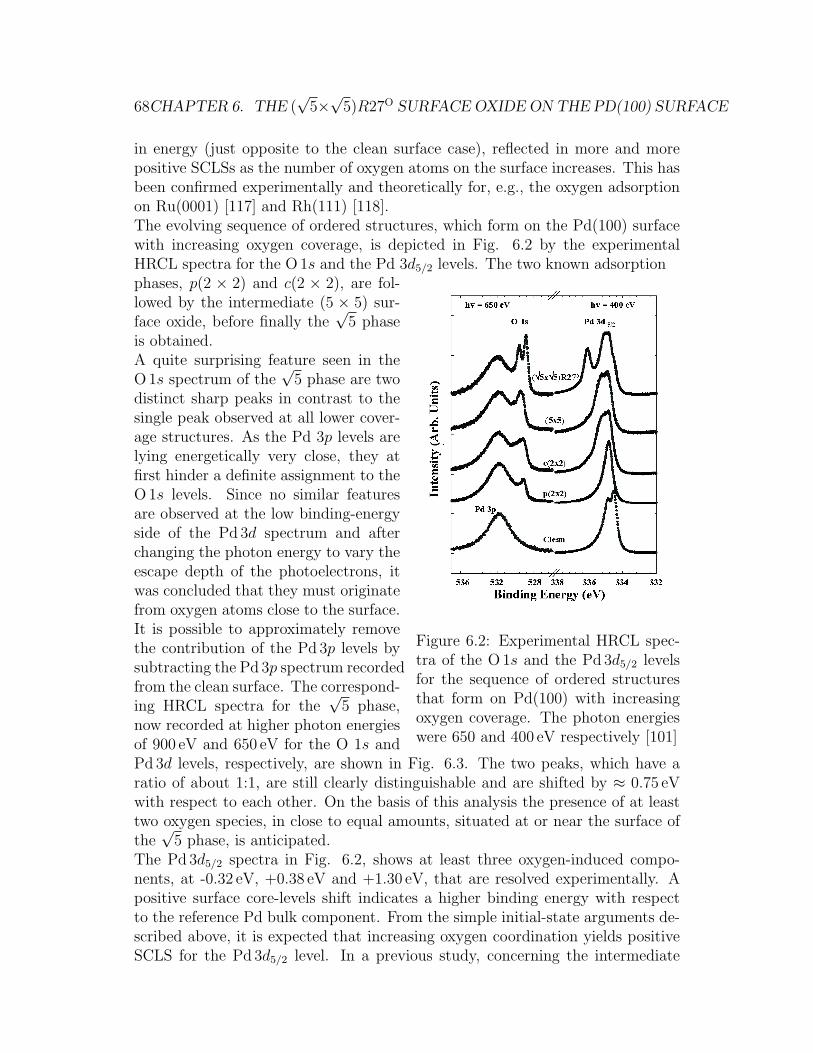
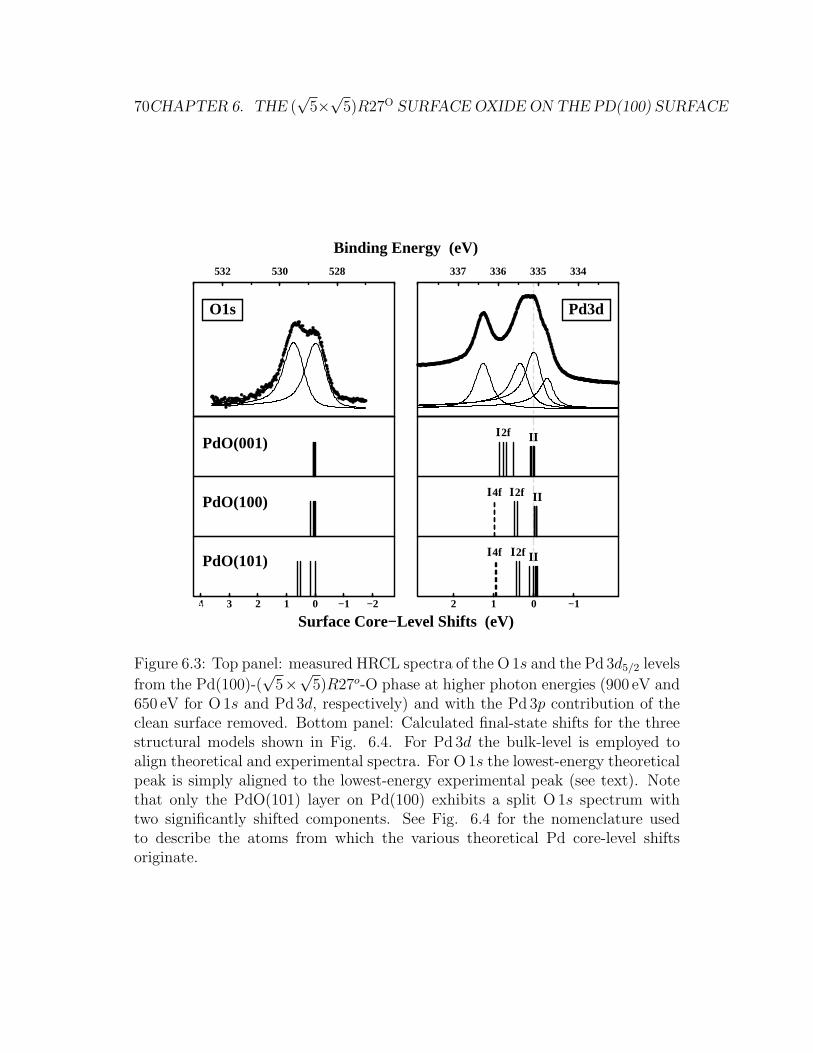

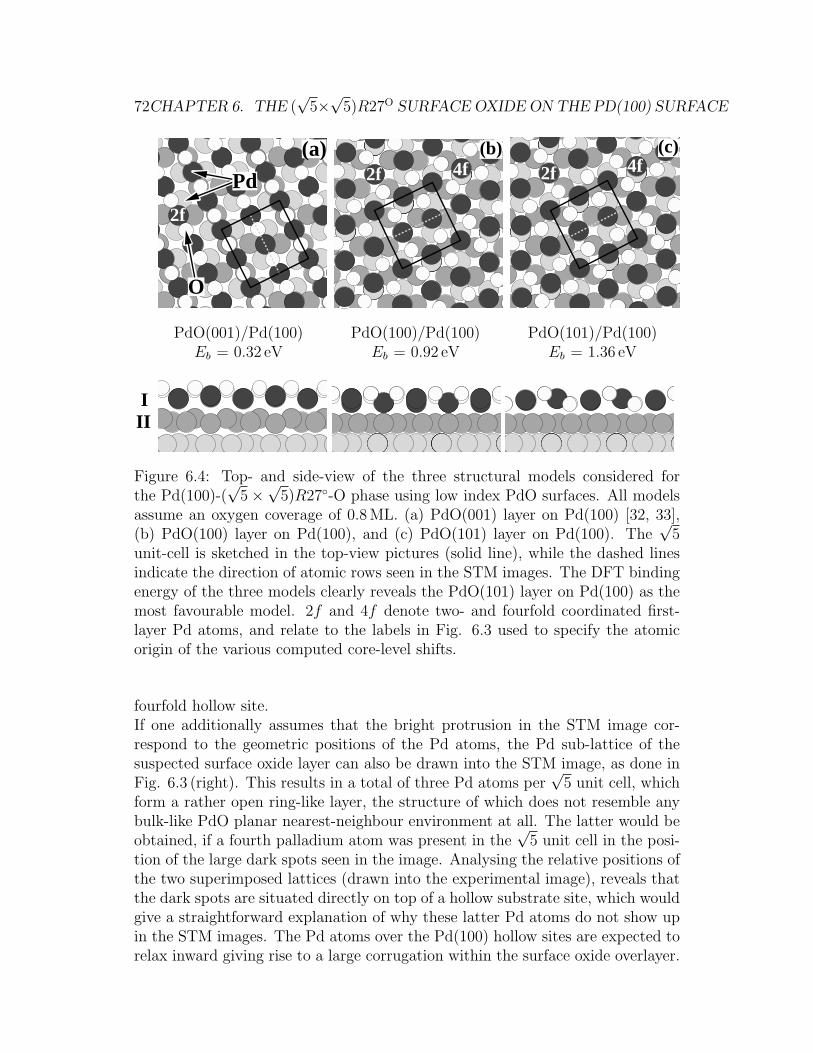
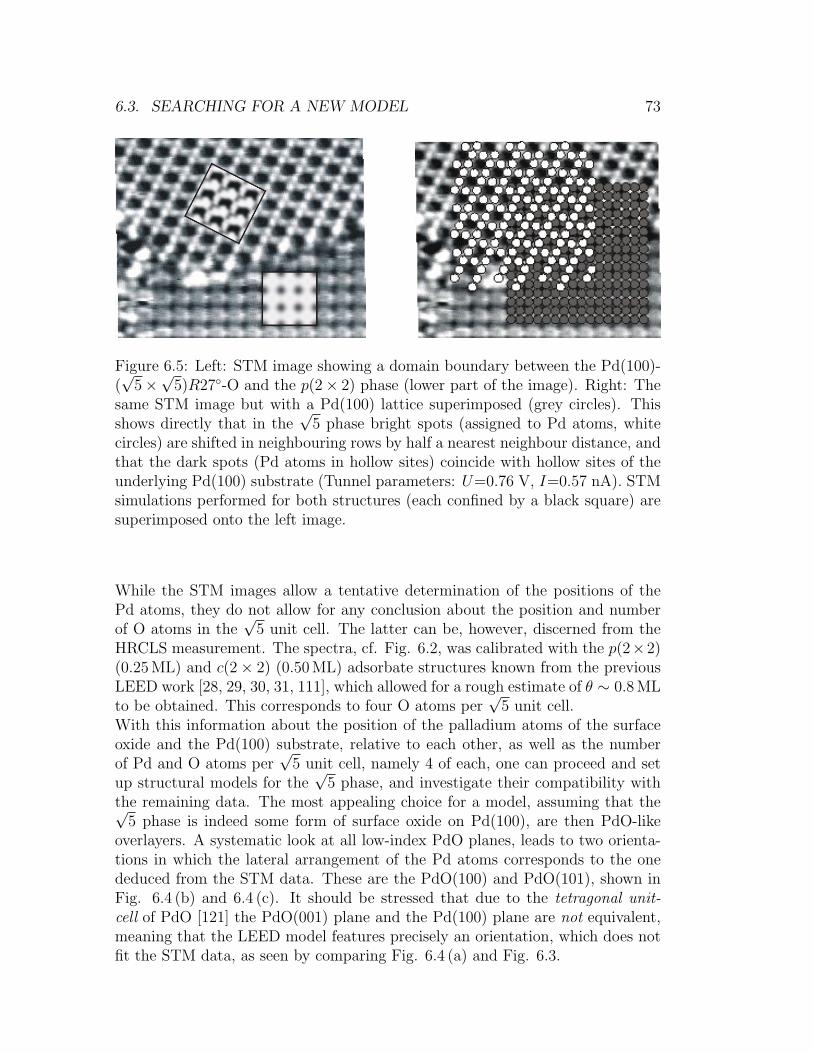

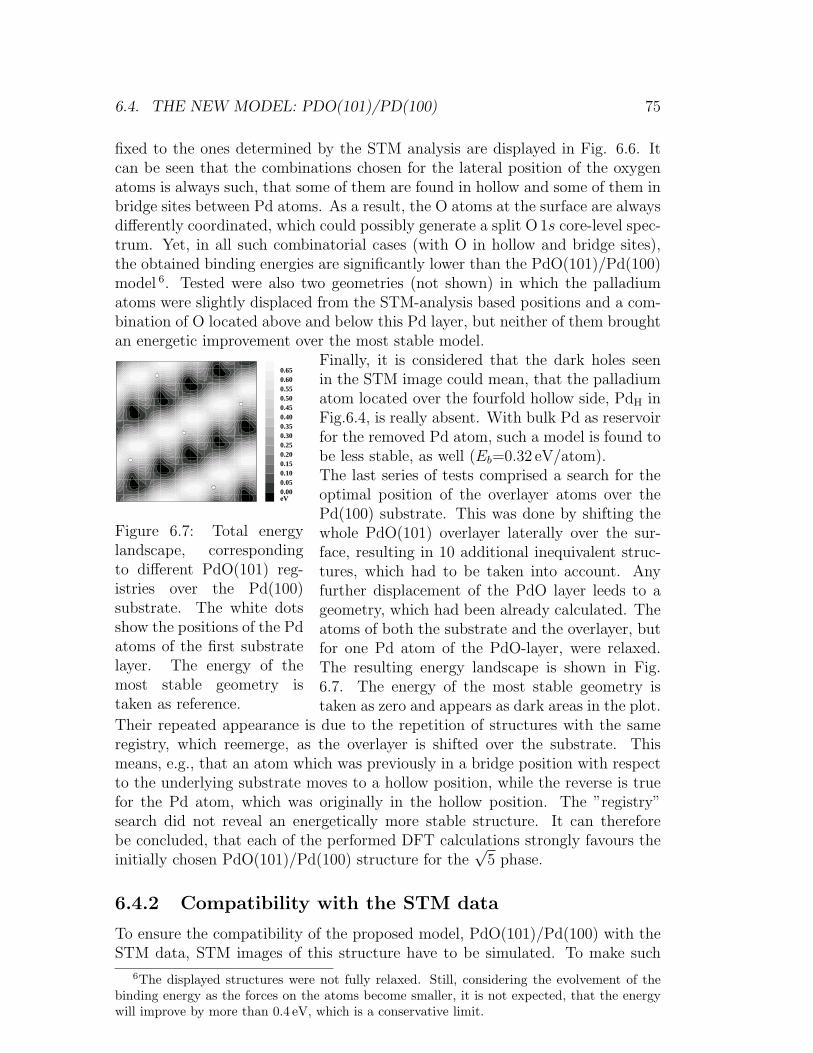


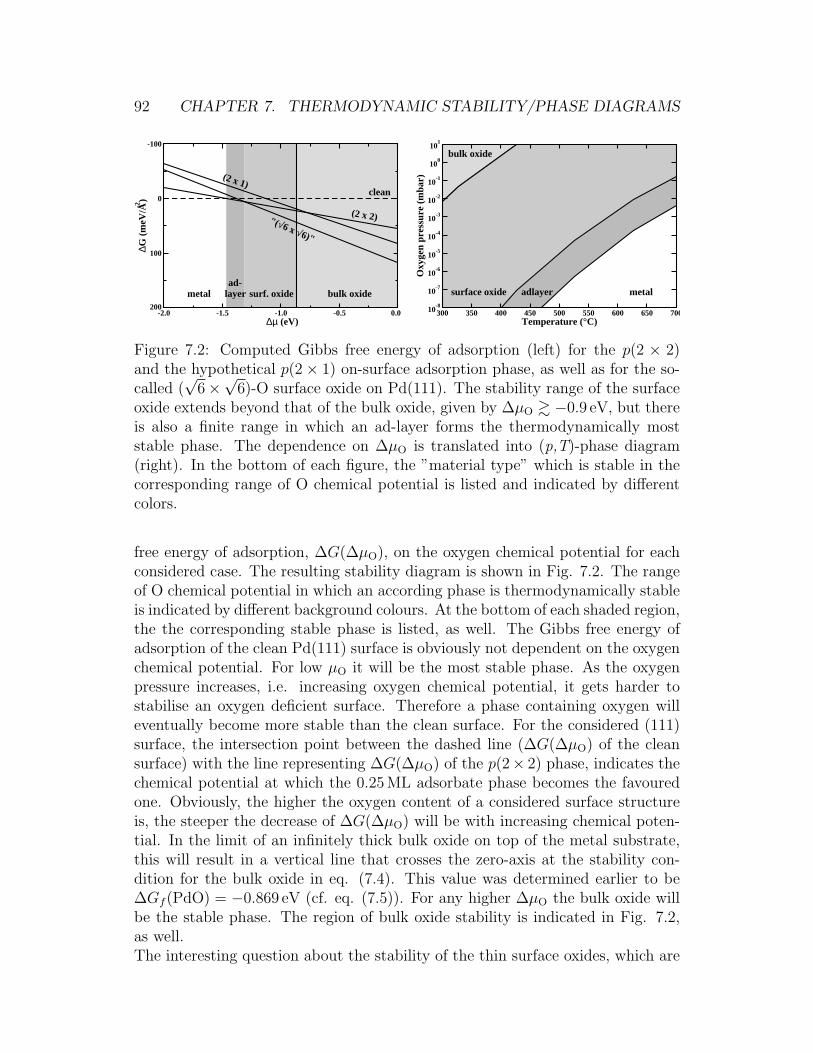

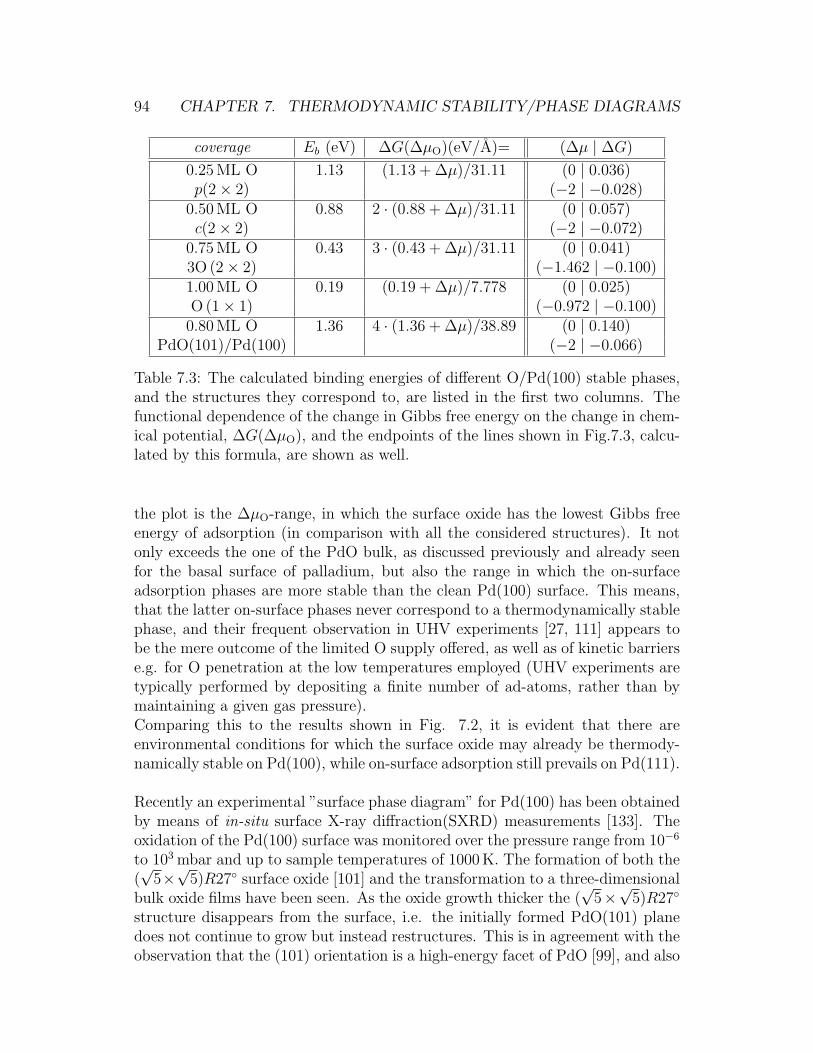


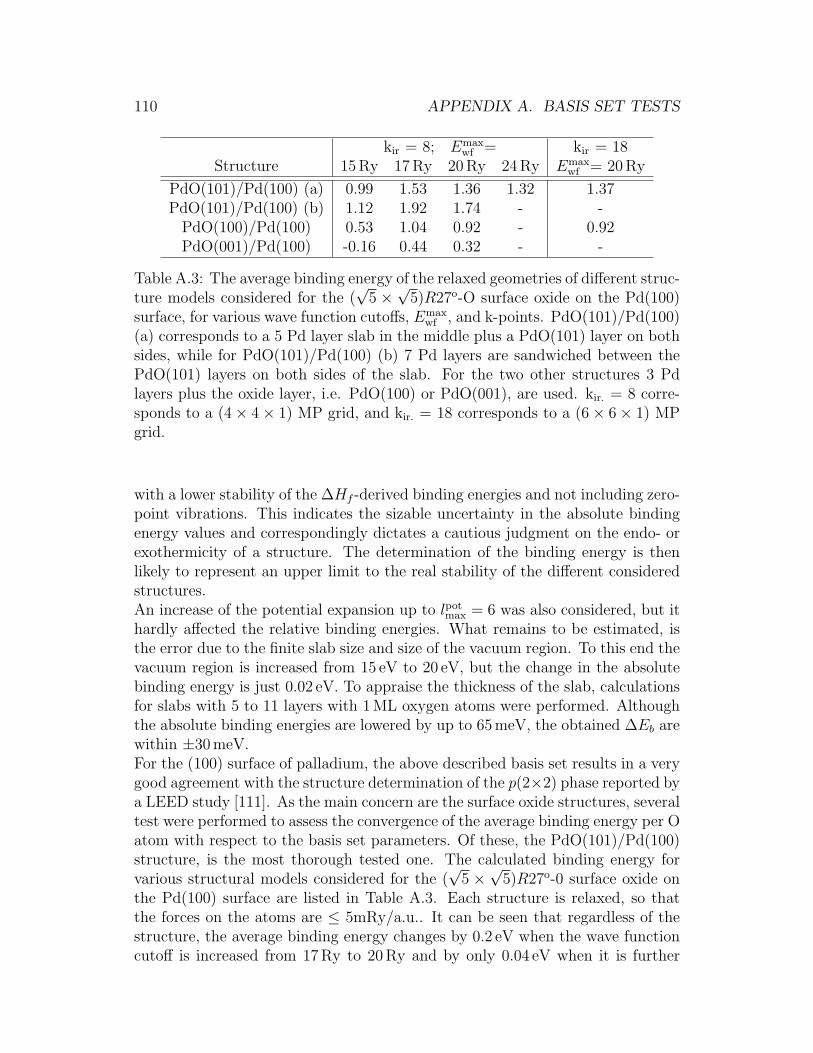


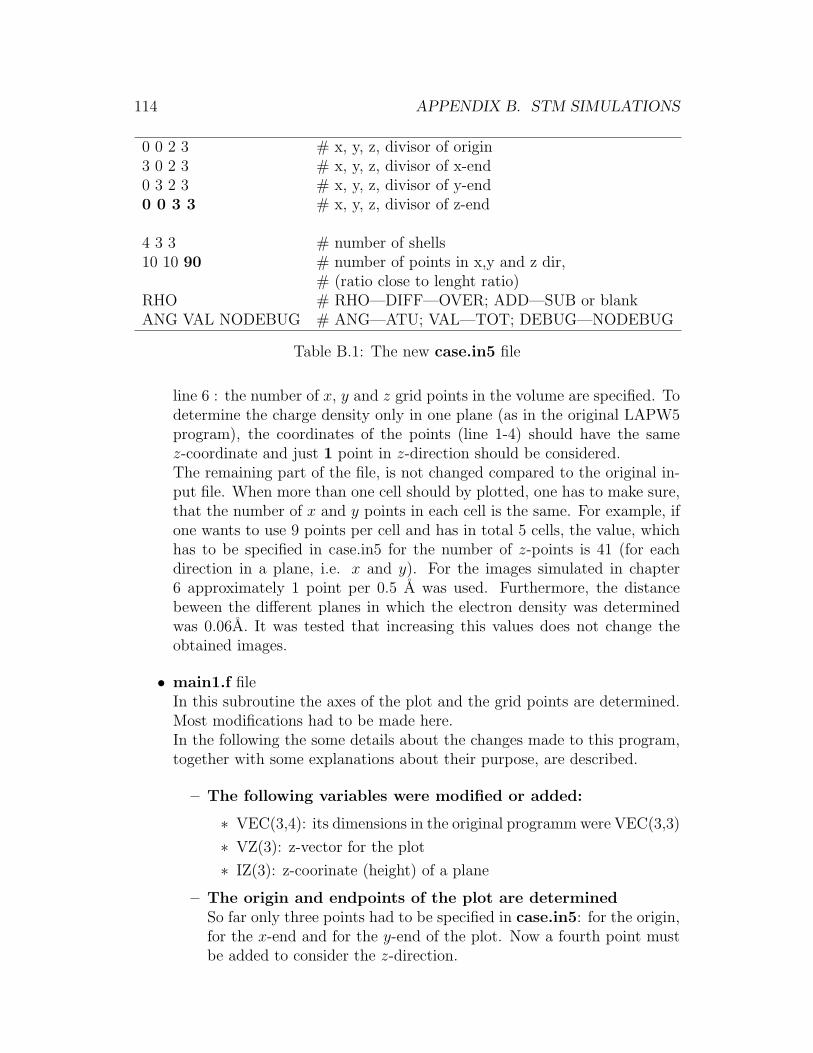


![[Alexander Von Humboldt] Letters of Alexander Von Humboldt](https://static.documents.pub/doc/80x56/577c79791a28abe05492c6ea/alexander-von-humboldt-letters-of-alexander-von-humboldt.jpg)

