Thick and deformed Antarctic sea ice mapped with autonomous underwater vehicles
G. Williams, T. Maksym, J. Wilkinson, C. Kunz, C. Murphy, P. Kimball, H. Singh
SUPPLEMENTARY INFORMATIONDOI: 10.1038/NGEO2299
NATURE GEOSCIENCE | www.nature.com/naturegeoscience 1
© 2014 Macmillan Publishers Limited. All rights reserved.
Supplementary Information
Assessment of Ice Type: First Year versus Multiyear Floes
All of the surveyed floes are most likely to be first year (FY) floes based on multiple
lines of evidence (Table S1, Fig S1, S2). While in most cases MY ice is distinguished
from thinner FY ice by the deep snow cover, thick ice and high freeboard, discrimination
is more difficult in our case where the FY ice was also thick and heavily deformed and
most floes had a deep snow cover. This evidence includes imagery showing lack of ice in
the region at the end of the previous summer, ice morphology, ice properties, and snow
cover characteristics. Evidence of each of the above listed characteristics is given for
each floe in Table S1 along with an indication of whether each property is suggestive of
FY or MY ice.
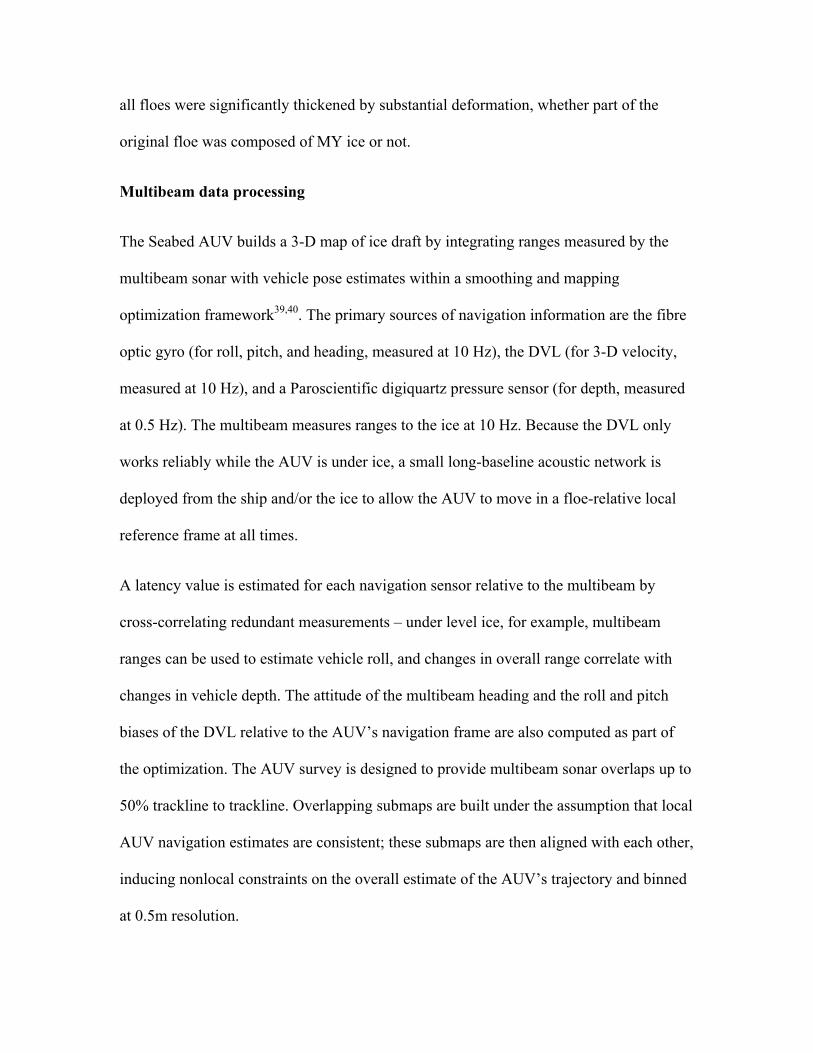
ENVISAT Synthetic Aperture Radar (SAR) for the Bellingshausen Sea (February 14 and
March 26, 2010) and Wilkes Land (March 8, 2012) show open water at the location of
each survey site (Fig. S1). Because of the almost complete melt of ice in the summer of
2010 in the Bellingshausen, MY ice is unlikely to have drifted into the survey areas, with
the exception of floes 1 and 2, where some MY ice floes from north of the Wilkins ice
shelf may have entered the area. However, ice continued to be exported westward from
this area over the next several months, reducing the chance of MY ice being in the survey
area. For Floe 2, which was at the edge of the MY ice in February/March, the ice
thickness of the level pans on this floe was 1.35 m, which is more likely to be from FY
ice. In the embayment between Latady Island and Beethoven Peninsula (Floes 3 and 4)
the direction of export is westward out of the embayment, so MY ice is unlikely to enter
the region after freeze-up. In the Weddell Sea, the survey area is an area of a mixture of
drifting MY and FY pack. The surveyed floes were distinguishable from the much
thicker, high freeboard MY floes nearby which were not surveyed. In Wilkes land (Fig.
S1b) the perennial ice edge was well south of the survey area. Because of the failure of
ENVISAT about a month later, it is not possible to determine if significant MY ice
drifted into the region.
Most previous reports of MY ice indicate very thick (significantly greater than 2m) for
level ice18,37. MY ice typically has lower salinity than FY ice37,38 The structure often
shows signs of significant internal melt and refreezing, particularly at the surface where
superimposed ice with very low δ18O values (< -10 , typical of the overlying snow cover)
formed by freezing of snow melt water on the ice surface is a tell-tale sign of the ice
having survived the summer season18. This is often accompanied by icy and very coarse-
grained dense snow at the base of the snow pack. The lack of any of these features cannot
definitively rule out that a floe is MY ice, but taken together they provide strong evidence
that each floe surveyed is most likely to be FY ice.
Ice and snow property data (salinity, crystal structure, and δ18O) for each floe also
generally supports the case for FY ice (Table S1, Fig. S2). For the Bellingshausen Sea
(Floes 1-5), there was no evidence for superimposed ice based on structure, salinity and
δ18O data in any of the floes, indicating an absence of ice that survived the prior summer.
Salinities in the lower portion of the core (excluding surface snow ice) were low, but
consistent with warm, thick FY ice that had experienced some drainage. Surface salinities
are also consistent with FY ice, although these were affected by flooding and snow ice
formation for all cores except for Floe 3. δ18O values at the surface contrast clearly with a
core from a MY floe in the Weddell Sea located near the surveyed floes (Fig S2, red
curves). The surface δ18O of -12.3 ‰ was accompanied by a salinity of < 1 ‰ (not
shown), and structure data that showed clear evidence for superimposed ice. The
presence of a sunken superimposed ice layer at 100 cm depth shows clearly that the
superimposed ice was not formed this season. This contrasts with all other cores that
show no buried superimposed ice layer. Where surface δ18O in the other cores is
significantly negative (-5 to -10 ‰), it is accompanied by a high salinity (Table S1)
suggestive of snow ice. Snow properties also support FY ice based on a lack of very
dense, icy snow (with the possible exception of floe 5), but surface flooding could also
obscure this.
For the Weddell Sea floes, ice morphology, structure, and salinities all suggest FY ice.
Surface snow and ice melt did lead to a thin (< 20 cm) layer of superimposed ice on each
floe (Table S1 and Fig. S2), but the saturated snow cover and ponding on the surface
indicate that this most likely formed in the month prior to the survey. For Floes 8-10, all
ice property evidence also support FY ice, with salinities typical of FY ice (Table S1).
There was no evidence for superimposed ice. One snow pit on floe 7 did have dense icy
snow at the base.
This evidence suggests that it is most likely that most or all floes are FY ice. Potential
exceptions include Floe 2 based on it’s proximity to MY ice in SAR imagery, Floe 5
based on some snow cover characteristics (though SAR imagery strongly suggests
against this), and Floe 8, based on limited snow cover characteristics. We cannot
definitively rule out that one or more floes, or portions of floes are composed of MY ice.
However, this is not crucial to the conclusions of this study. The AUV surveys reveal that
all floes were significantly thickened by substantial deformation, whether part of the
original floe was composed of MY ice or not.
Multibeam data processing
The Seabed AUV builds a 3-D map of ice draft by integrating ranges measured by the
multibeam sonar with vehicle pose estimates within a smoothing and mapping
optimization framework39,40. The primary sources of navigation information are the fibre
optic gyro (for roll, pitch, and heading, measured at 10 Hz), the DVL (for 3-D velocity,
measured at 10 Hz), and a Paroscientific digiquartz pressure sensor (for depth, measured
at 0.5 Hz). The multibeam measures ranges to the ice at 10 Hz. Because the DVL only
works reliably while the AUV is under ice, a small long-baseline acoustic network is
deployed from the ship and/or the ice to allow the AUV to move in a floe-relative local
reference frame at all times.
A latency value is estimated for each navigation sensor relative to the multibeam by
cross-correlating redundant measurements – under level ice, for example, multibeam
ranges can be used to estimate vehicle roll, and changes in overall range correlate with
changes in vehicle depth. The attitude of the multibeam heading and the roll and pitch
biases of the DVL relative to the AUV’s navigation frame are also computed as part of
the optimization. The AUV survey is designed to provide multibeam sonar overlaps up to
50% trackline to trackline. Overlapping submaps are built under the assumption that local
AUV navigation estimates are consistent; these submaps are then aligned with each other,
inducing nonlocal constraints on the overall estimate of the AUV’s trajectory and binned
at 0.5m resolution.
Error associated with AUV-derived sea ice draft
The errors can be broken down into those due to sensor accuracy, fundamental errors in
the production of the bathymetric maps, errors in vehicle navigation, and any unresolved
errors. For the sensors, the errors are small. The Octans 3000 inertial measurement unit
has an error of ~0.1 degrees in pitch and roll, which translates to about 3 cm error in
range at 20 m. The Imagenex deltaT 245 kHz multibeam sonar has a range error of <4 cm
at that depth. The pressure sensor has an error of < 1 cm. Errors due to sound speed
variation will be ~2 cm. The nominal accuracy is then ~5 cm.
The AUV mapping efforts are a continuation of techniques that have been utilized for
marine mapping41,42 in the areas of marine archaeology, marine geology, coral reef
ecosystems and naval mine counter measures mapping. This methodology has been
validated against optical imagery and photomosaicking techniques40. The error in the
production of these maps is explored in Figure 12 of REF 40. Here, the error can be
computed by examining the variance within individual map bins where there are multiple
ranges due to overlapping swaths. The variance is seen here to be of order 1 cm, so this is
not a significant source of error.
There is greater error in the horizontal dimensions of the map due to positioning errors
relating to navigation. The footprint size of the multibeam at 20m range is ~25 cm. While
draft may vary within the footprint and the range may vary depending on the shape of the
ice underside within that footprint, the effect is negligible averaged over all ranges on the
floe (as demonstrated in Fig. 12 of REF 40). In addition the horizontal position of a given
pixel is constrained by the pose estimate of the AUV by the DVL navigation to ~25 cm.
We have therefore binned the data to 50 cm resolution and this only affects the
positioning of draft elements.
Unresolved errors (e.g. due to unresolved latency in the sensors) are estimated to be < 10
cm by examining the variation in draft over level ice areas. Relative to the measured
mean drafts, this error is small and has no impact on the significance of the results.
Supplementary References
37. Gow A.J., Ackley, S.F., Buck, K.R. & Golden, K. M. Physical and structural
characteristics of Weddell Sea pack ice. CRREL Rep. 87-14 (1987).
38. Haas, C., Thomas, D, & Bareiss, J. Surface properties and processes of perennial
Antarctic sea ice in summer. J. Glaciol, 47, 613–625 (2001)
39. Kaess, M. Ranganathan, A., & Dellaert, F. Incremental Smoothing and Mapping.
IEEE. J. Robotics. 24, 1365–1378 (2008).
40. Kunz, C. & Singh, H. Map Building Fusing Acoustic and Visual Information using
Autonomous Underwater Vehicles. J. Field Robotics, 30, 763–783 (2013).
41. Singh, H., Whitcomb, L., Yoerger, D. & Pizarro, O. Microbathymetric Mapping from
Underwater Vehicles in the Deep Ocean. J. Comp. Vision, 79, 143–161 (2000).
42. Roman, C & H. Singh. Self Consistent Bathymetric Mapping from Robotic Vehicles
in the Deep Ocean, J. Field Robotics, 24, 23–50 (2007).
Supp. Figures
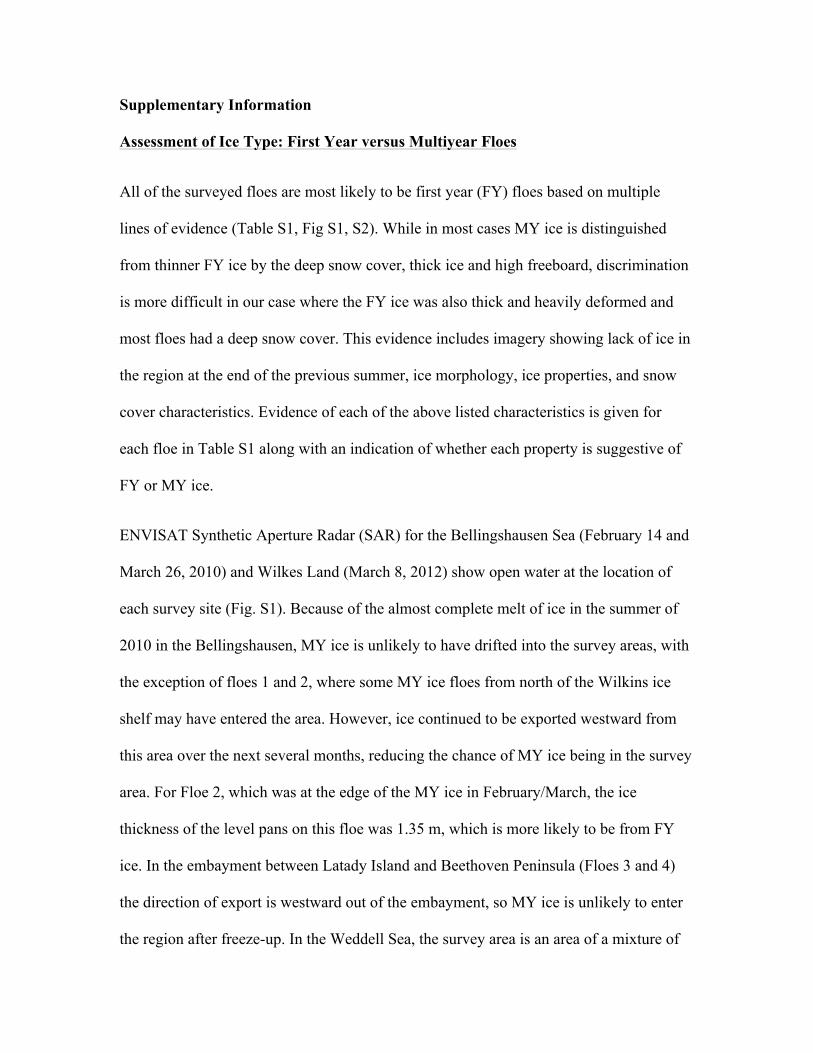
Figure S1: ENVISAT Synthetic Aperture Radar imagery showing location of most
surveyed floes were in open water the summer prior to the surveys. a Composite of
images on Feb 14 and 26, 2010 in the Bellingshausen Sea. Most survey locations were
devoid of perennial ice, and unlikely to have such ice drift into the area after freeze-up. b
Image from March 8, 2012 near Wilkes Land showing retreat of the summer ice cover to
the south of the survey locations.
−75
−70
−72
−70
1 2 3
4
5
Alexander Is.
a.
120
125−66
−64
8910
WIlk
es L
and
b.
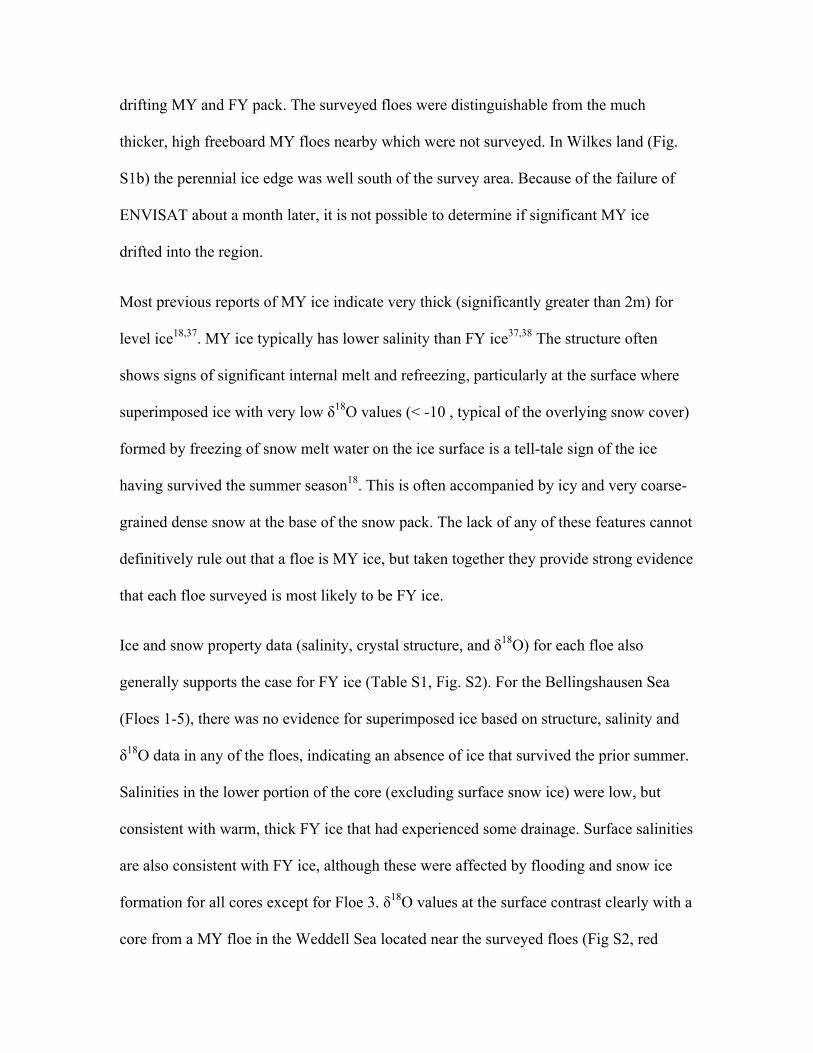
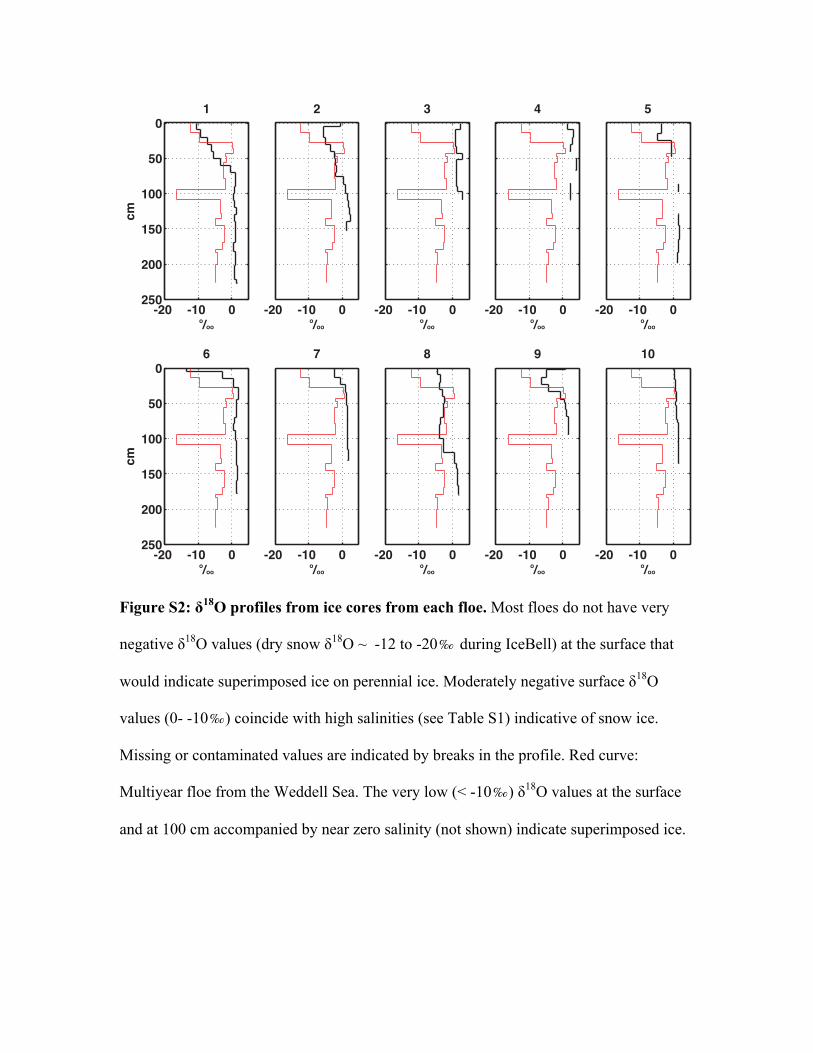
Figure S2: δ18O profiles from ice cores from each floe. Most floes do not have very
negative δ18O values (dry snow δ18O ~ -12 to -20‰ during IceBell) at the surface that
would indicate superimposed ice on perennial ice. Moderately negative surface δ18O
values (0- -10‰) coincide with high salinities (see Table S1) indicative of snow ice.
Missing or contaminated values are indicated by breaks in the profile. Red curve:
Multiyear floe from the Weddell Sea. The very low (< -10‰) δ18O values at the surface
and at 100 cm accompanied by near zero salinity (not shown) indicate superimposed ice.
-20 -10 0
0
50
100
150
200
250o/oo
cm1
-20 -10 0
2
o/oo-20 -10 0
3
o/oo-20 -10 0
4
o/oo-20 -10 0
5
o/oo
-20 -10 0
0
50
100
150
200
250
6
o/oo
cm
-20 -10 0
7
o/oo-20 -10 0
8
o/oo-20 -10 0
9
o/oo-20 -10 0
10
o/oo
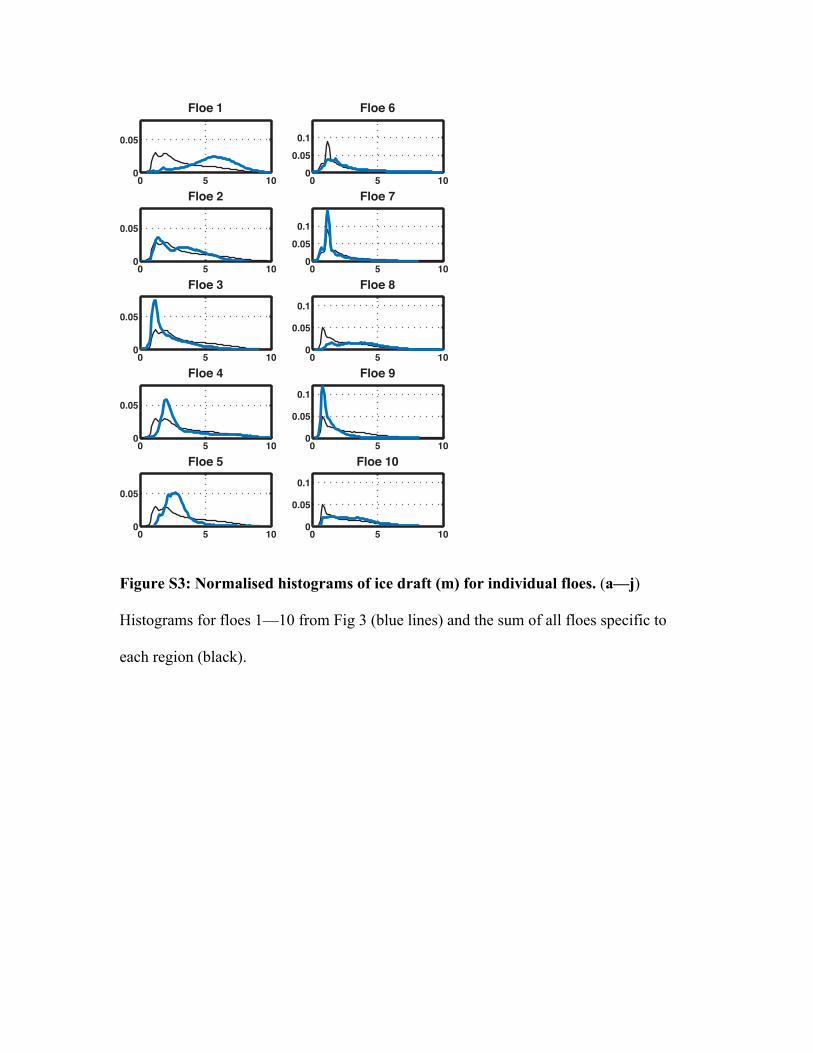
Figure S3: Normalised histograms of ice draft (m) for individual floes. (a—j)
Histograms for floes 1—10 from Fig 3 (blue lines) and the sum of all floes specific to
each region (black).
0 5 100
0.05
Floe 1
0 5 100
0.05
Floe 2
0 5 100
0.05
Floe 3
0 5 100
0.05
Floe 4
0 5 100
0.05
Floe 5
0 5 1000.050.1
Floe 6
0 5 1000.050.1
Floe 7
0 5 100
0.05
0.1
Floe 8
0 5 100
0.05
0.1
Floe 9
0 5 100
0.05
0.1
Floe 10
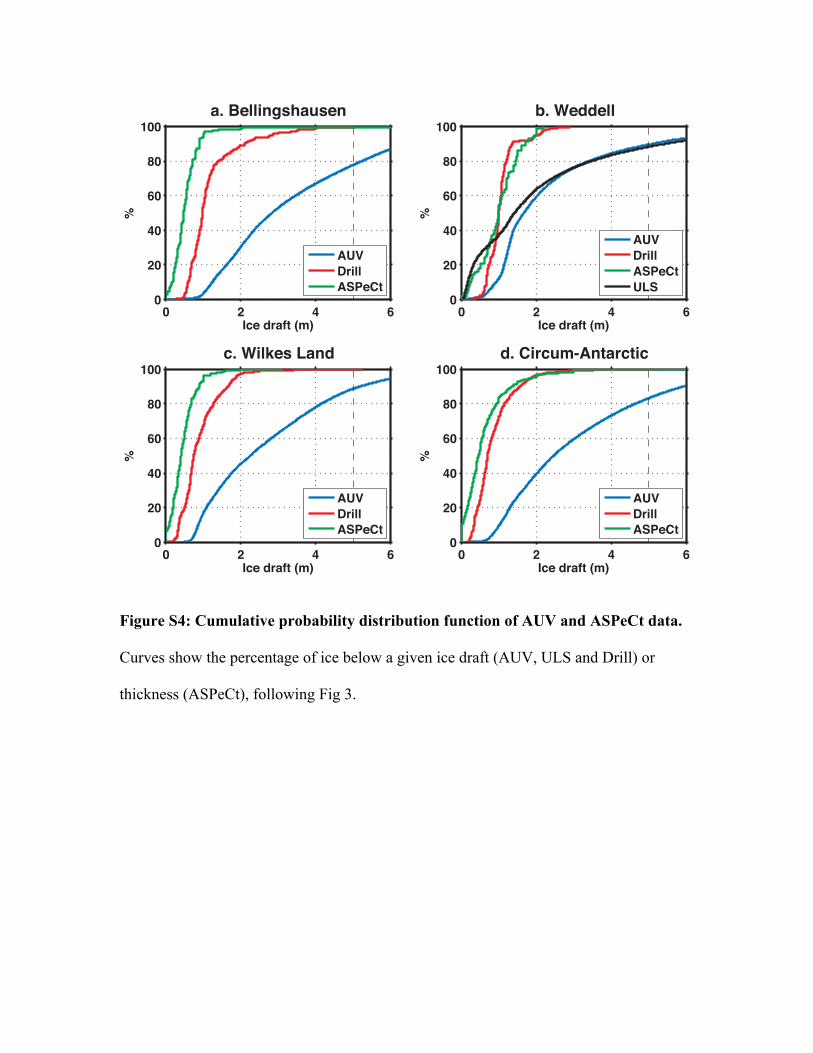
Figure S4: Cumulative probability distribution function of AUV and ASPeCt data.
Curves show the percentage of ice below a given ice draft (AUV, ULS and Drill) or
thickness (ASPeCt), following Fig 3.
0 2 4 60
20
40
60
80
100
Ice draft (m)
%a. Bellingshausen
AUVDrillASPeCt
0 2 4 60
20
40
60
80
100
Ice draft (m)
%
b. Weddell
AUVDrillASPeCtULS
0 2 4 60
20
40
60
80
100
Ice draft (m)
%
c. Wilkes Land
AUVDrillASPeCt
0 2 4 60
20
40
60
80
100
Ice draft (m)
%
d. Circum-Antarctic
AUVDrillASPeCt
Supplementary Tables
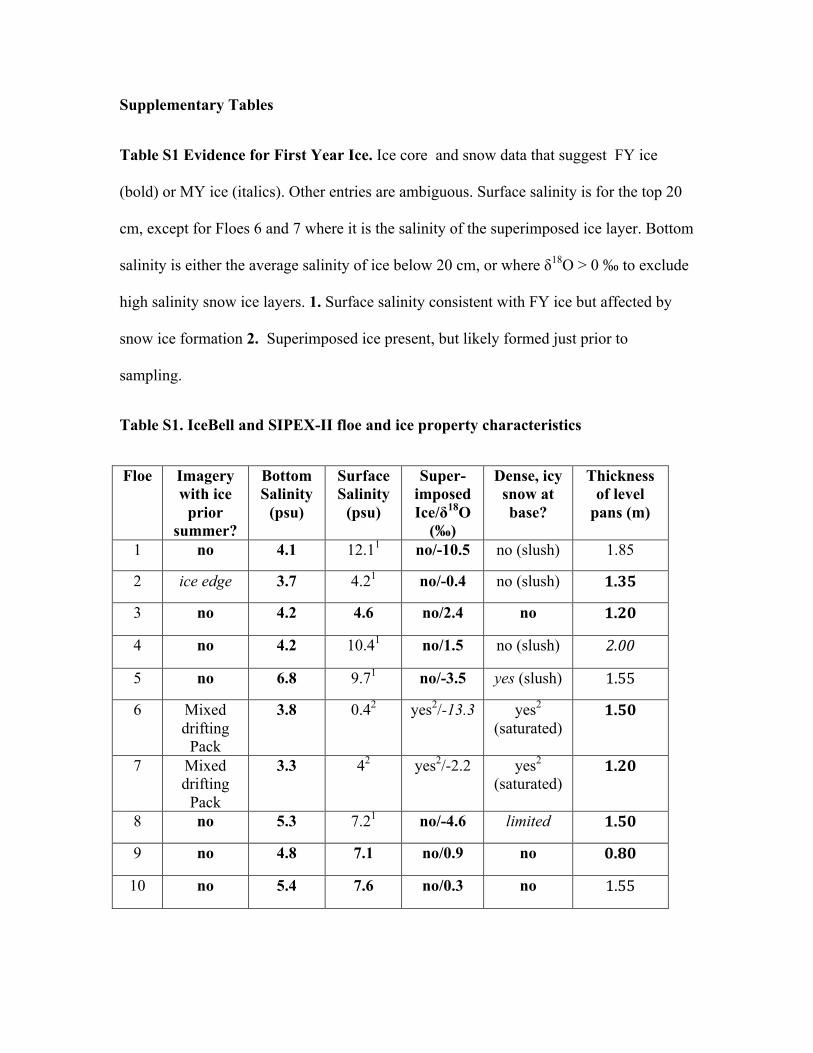
Table S1 Evidence for First Year Ice. Ice core and snow data that suggest FY ice
(bold) or MY ice (italics). Other entries are ambiguous. Surface salinity is for the top 20
cm, except for Floes 6 and 7 where it is the salinity of the superimposed ice layer. Bottom
salinity is either the average salinity of ice below 20 cm, or where δ18O > 0 ‰ to exclude
high salinity snow ice layers. 1. Surface salinity consistent with FY ice but affected by
snow ice formation 2. Superimposed ice present, but likely formed just prior to
sampling.
Table S1. IceBell and SIPEX-II floe and ice property characteristics
Floe Imagery with ice
prior summer?
Bottom Salinity
(psu)
Surface Salinity
(psu)
Super-imposed Ice/δ18O
(‰)
Dense, icy snow at base?
Thickness of level
pans (m)
1 no 4.1 12.11 no/-10.5 no (slush) 1.85
2 ice edge 3.7 4.21 no/-0.4 no (slush) 1.35
3 no 4.2 4.6 no/2.4 no 1.20
4 no 4.2 10.41 no/1.5 no (slush) 2.00
5 no 6.8 9.71 no/-3.5 yes (slush) 1.55
6 Mixed drifting
Pack
3.8 0.42 yes2/-13.3 yes2 (saturated)
1.50
7 Mixed drifting
Pack
3.3 42 yes2/-2.2 yes2 (saturated)
1.20
8 no 5.3 7.21 no/-4.6 limited 1.50
9 no 4.8 7.1 no/0.9 no 0.80
10 no 5.4 7.6 no/0.3 no 1.55
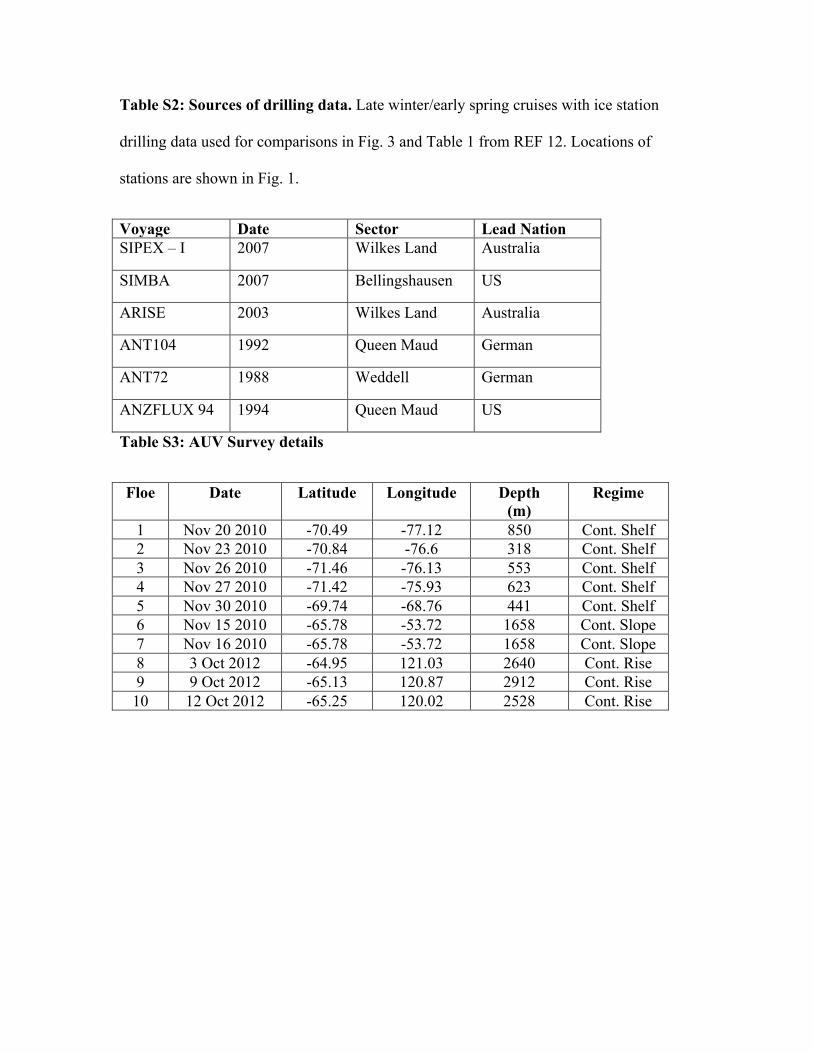
Table S2: Sources of drilling data. Late winter/early spring cruises with ice station
drilling data used for comparisons in Fig. 3 and Table 1 from REF 12. Locations of
stations are shown in Fig. 1.
Voyage Date Sector Lead Nation SIPEX – I 2007 Wilkes Land Australia
SIMBA 2007 Bellingshausen US
ARISE 2003 Wilkes Land Australia
ANT104 1992 Queen Maud German
ANT72 1988 Weddell German
ANZFLUX 94 1994 Queen Maud US
Table S3: AUV Survey details
Floe Date Latitude Longitude Depth (m)
Regime
1 Nov 20 2010 -70.49 -77.12 850 Cont. Shelf 2 Nov 23 2010 -70.84 -76.6 318 Cont. Shelf 3 Nov 26 2010 -71.46 -76.13 553 Cont. Shelf 4 Nov 27 2010 -71.42 -75.93 623 Cont. Shelf 5 Nov 30 2010 -69.74 -68.76 441 Cont. Shelf 6 Nov 15 2010 -65.78 -53.72 1658 Cont. Slope 7 Nov 16 2010 -65.78 -53.72 1658 Cont. Slope 8 3 Oct 2012 -64.95 121.03 2640 Cont. Rise 9 9 Oct 2012 -65.13 120.87 2912 Cont. Rise 10 12 Oct 2012 -65.25 120.02 2528 Cont. Rise


![ANTARCTIC TREATY AND ANTARCTIC TERRITORY PROTECTION … · 463 Revista Chilena de Derecho, vol. 40 Nº 2, pp. 461 - 488 [2013] Villamizar Lamus, Fernando “Antarctic treaty and antarctic](https://static.documents.pub/doc/80x56/5bd437f009d3f209338b8b25/antarctic-treaty-and-antarctic-territory-protection-463-revista-chilena-de-derecho.jpg)


