20
THIEF VALLEY RESERVOIR 1992 SEDIMENTATION SURVEY U.S. Department of the interior Bureau of Reclamation
| Date post: | 24-Jul-2018 |
| Category: |
Documents |
| Upload: | trinhxuyen |
| View: | 216 times |
| Download: | 0 times |
THIEF VALLEY RESERVOIR1992 SEDIMENTATION SURVEY
U.S. Department of the interiorBureau of Reclamation
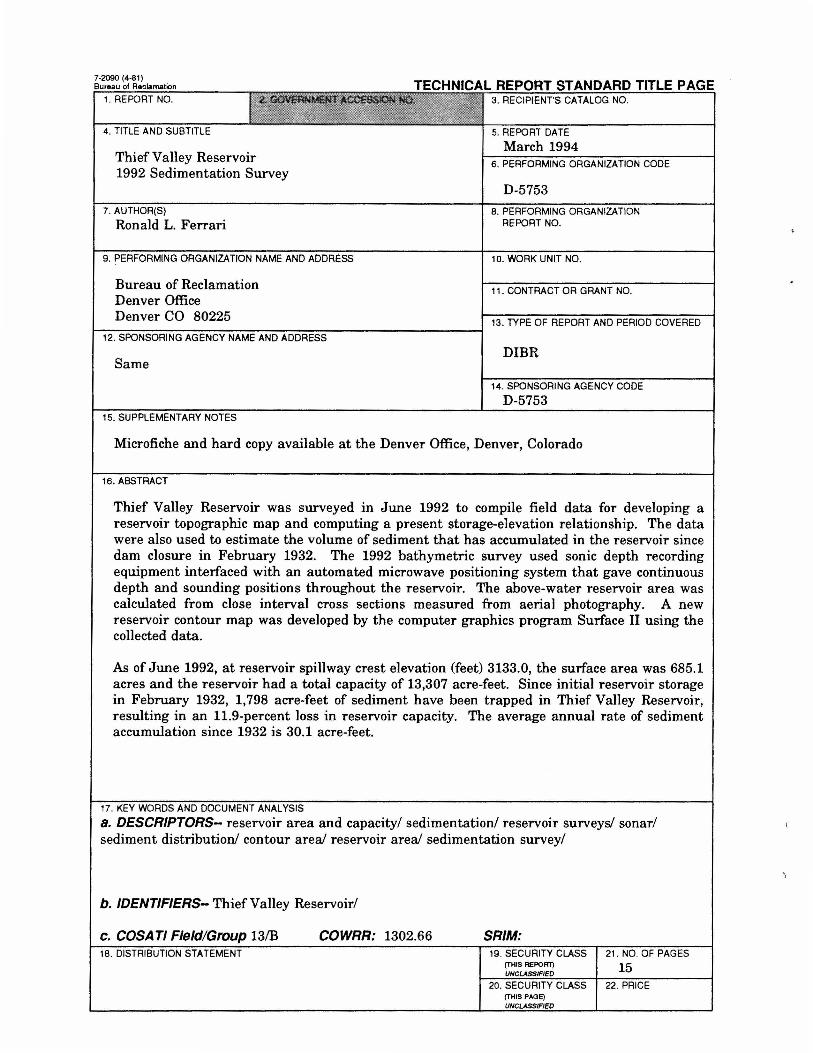
7-2090 (4-81)Bweau of keclamation TECHNICAL REPORT STANDARD TITLE PAGE
1. REPORT NO. NMNTACeS$• 3. RECIPIENTS CATALOG NO.
4. TITLE AND SUBTITLE 5. REPORT DATE
h llMarch 1994
T ief Va ey Reservoir R RM DE1992 Sedimentation Survey
6. PE FO ING ORGANIZATION CO
D-57537. AUTHOR(S) 8. PERFORMING ORGANIZATION
Ronald L. Ferrari REPORT NO.
9. PERFORMING ORGANIZATION NAME AND ADDRESS 10. WORK UNIT NO.
Bureau of Reclamation 11. CONTRACT OR GRANT NO.Denver OfficeDenver CO 80225 13. TYPE OF REPORT AND PERIOD COVERED
12. SPONSORING AGENCY NAME AND ADDRESS
DIBRSame
14. SPONSORING AGENCY CODE
_________________________________________________________ D-575315. SUPPLEMENTARY NOTES
Microfiche and hard copy available at the Denver Office, Denver, Colorado
16. ABSTRACT
Thief Valley Reservoir was surveyed in June 1992 to compile field data for developing areservoir topographic map and computing a present storage-elevation relationship. The datawere also used to estimate the volume of sediment that has accumulated in the reservoir sincedam closure in February 1932. The 1992 bathymetric survey used sonic depth recordingequipment interfaced with an automated microwave positioning system that gave continuousdepth and sounding positions throughout the reservoir. The above-water reservoir area wascalculated from close interval cross sections measured from aerial photography. A newreservoir contour map was developed by the computer graphics program Surface II using thecollected data.
As of June 1992, at reservoir spiliway crest elevation (feet) 3133.0, the surface area was 685.1acres and the reservoir had a total capacity of 13,307 acre-feet. Since initial reservcnr storagein February 1932, 1,798 acre-feet of sediment have been trapped in Thief Valley Reservoir,resulting in an 11.9-percent loss in reservoir capacity. The average annual rate of sedimentaccumulation since 1932 is 30.1 acre-feet.
17. KEY WORDS AND DOCUMENT ANALYSIS
a. DESCRIPTORS- reservoir area and capacity! sedimentation! reservoir surveys! sonar!sediment distribution! contour area! reservoir area! sedimentation survey!
b. IDENTIFIERS- Thief Valley Reservoir!
c. COSATI Field/Group 13/B COWRR: 1302.66 SRIM:18. DISTRIBUTION STATEMENT 19. SECURITY CLASS 21. NO. OF PAGES
(THIS REP0 15UNCL4$S(FlED
20. SECURITY CLASS 22. PRICE(THIS PASS)UNCLASSFIED
THIEF VALLEY RESERVOIR
1992 SEDIMENTATION SURVEY
by
Ronald L. Ferrari
Sedimentation SectionSurface Water Branch
Division of Earth SciencesDenver Office
Denver, Colorado
March 1994
A
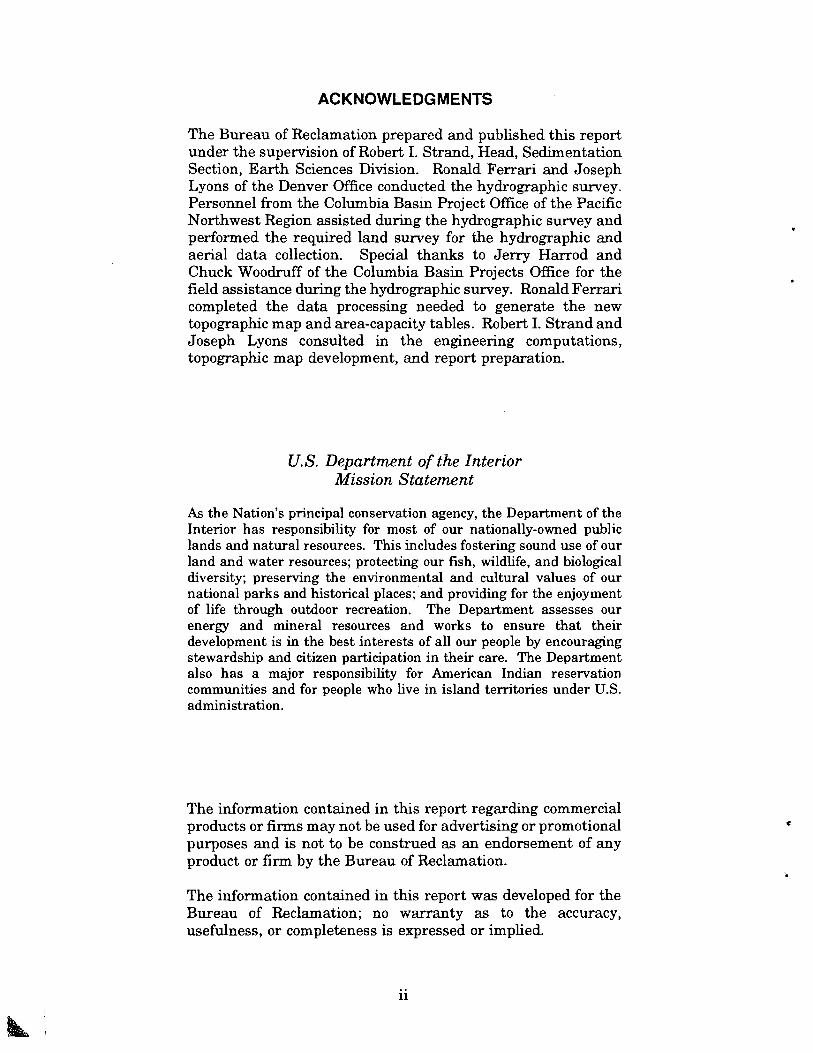
ACKNOWLEDG MENTS
The Bureau of Reclamation prepared and published this reportunder the supervision of Robert I. Strand, Head, SedimentationSection, Earth Sciences Division. Ronald Ferrari and JosephLyons of the Denver Office conducted the hydrographic survey.Personnel from the Columbia Basin Project Office of the PacificNorthwest Region assisted during the hydrographic survey andperformed the required land survey for the hydrographic andaerial data collection. Special thanks to Jerry Harrod andChuck Woodruff of the Columbia Basin Projects Office for thefield assistance during the hydrographic survey. Ronald Ferraricompleted the data processing needed to generate the newtopographic map and area-capacity tables. Robert I. Strand andJoseph Lyons consulted in the engineering computations,topographic map development, and report preparation.
U.S. Department of the InteriorMission Statement
As the Nation's principal conservation agency, the Department of theInterior has responsibility for most of our nationally-owned publiclands and natural resources. This includes fostering sound use of ourland and water resources; protecting our fish, wildlife, and biologicaldiversity; preserving the environmental and cultural values of ournational parks and historical places; and providing for the enjoymentof life through outdoor recreation. The Department assesses ourenergy and mineral resources and works to ensure that theirdevelopment is in the best interests of all our people by encouragingstewardship and citizen participation in their care. The Departmentalso has a major responsibility for American Indian reservationcommunities and for people who live in island territories under U.S.administration.
The information contained in this report regarding commercialproducts or firms may not be used for advertising or promotionalpurposes and is not to be construed as an endorsement of anyproduct or firm by the Bureau of Reclamation.
The information contained in this report was developed for theBureau of Reclamation; no warranty as to the accuracy,usefulness, or completeness is expressed or implied.
11
CONTENTS
.................................................................
......................................................
.......................................................
..........................................................
..................................................
...............................................................................................................
............................................................................................
............................................................
..................................................................
.........................................................................................
.............................................................................
.....................................................................................
Page
9
Introduction 1
Summary and conclusions 2
Description of watershed 2
Reservoir operations 3
Survey method and equipment 3
Reservoir area and capacity 4Original capacity 4Development of 1992 contour areas 51992 revised storage capacity 5
Sediment analyses 6
References 7
TableTABLES
1 Reservoir sediment data summary 82 Summary of 1992 survey results 10
FIGURESFigure
1 Thief Valley Reservoir location map 112 Thief Valley Reservoir Dam, plan and section 123 Thief Valley Reservoir topographic map 134 1992 area and capacity curves 15
in
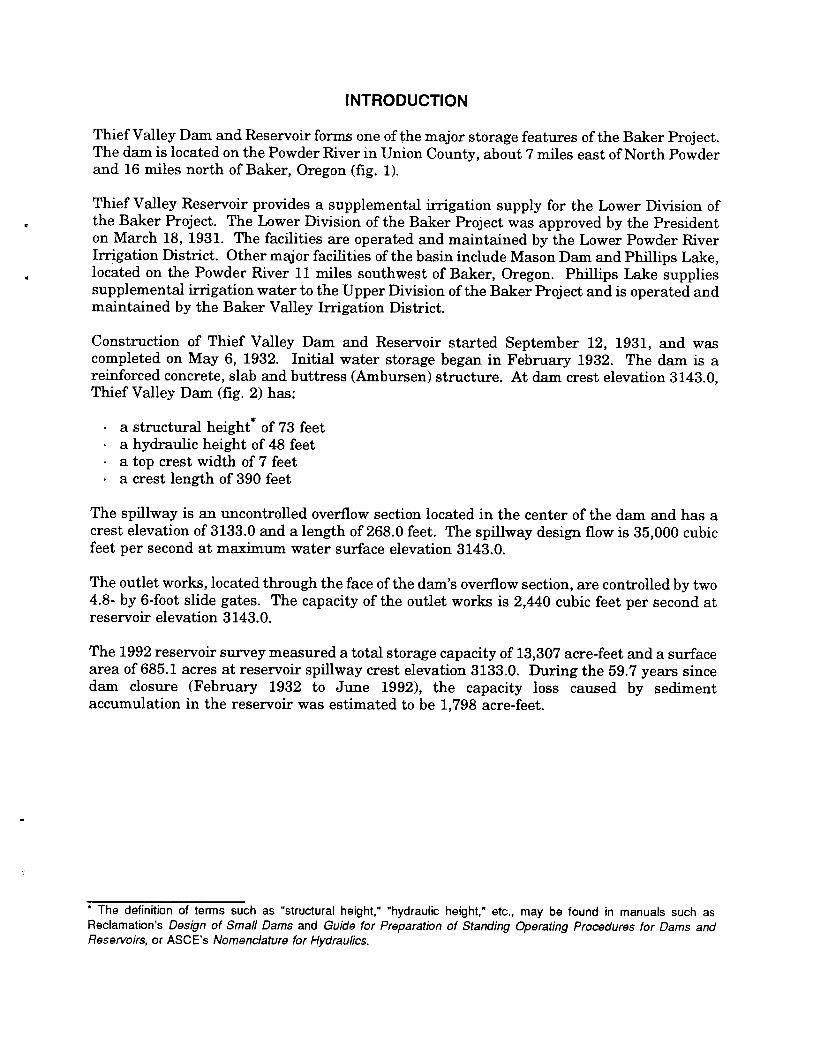
INTRODUCTION
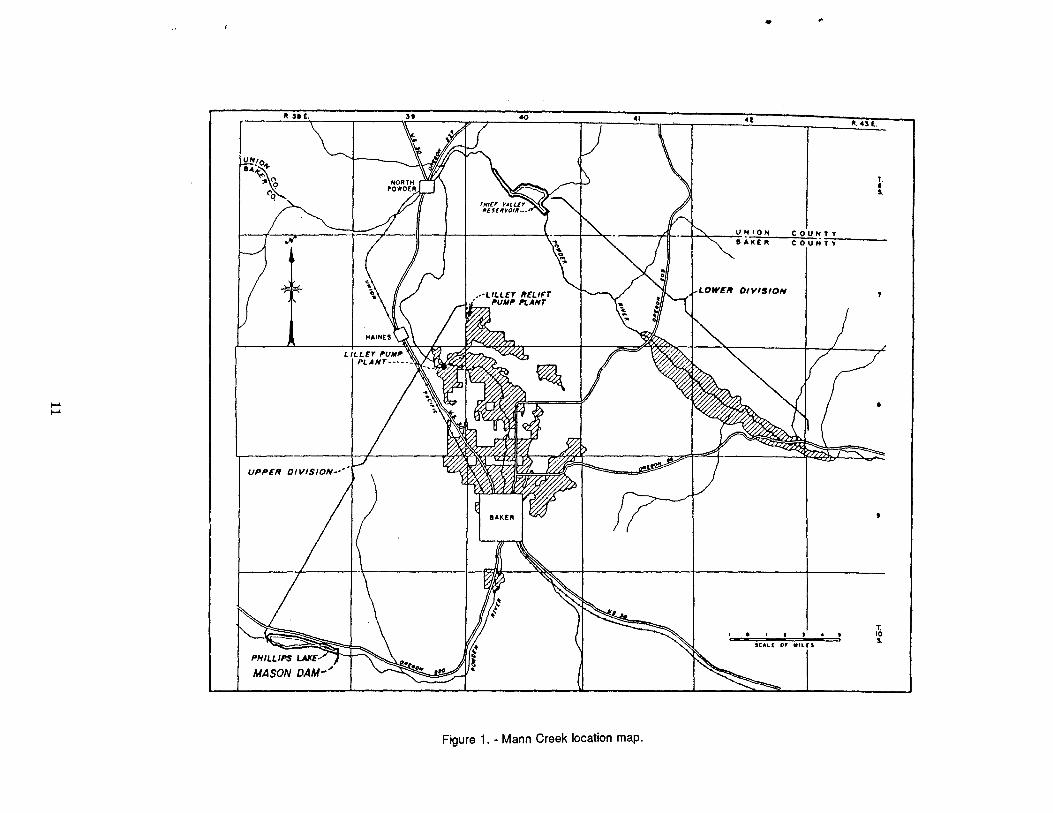
Thief Valley Dam and Reservoir forms one of the major storage features of the Baker Project.The dam is located on the Powder River in Union County, about 7 miles east of North Powderand 16 miles north of Baker, Oregon (fig. 1).
Thief Valley Reservoir provides a supplemental irrigation supply for the Lower Division ofthe Baker Project. The Lower Division of the Baker Project was approved by the Presidenton March 18, 1931. The facilities are operated and maintained by the Lower Powder RiverIrrigation District. Other major facffities of the basin include Mason Dam and Phillips Lake,located on the Powder River 11 miles southwest of Baker, Oregon. Phillips Lake suppliessupplemental irrigation water to the Upper Division of the Baker Project and is operated andmaintained by the Baker Valley Irrigation District.
Construction of Thief Valley Dam and Reservoir started September 12, 1931, and wascompleted on May 6, 1932. Initial water storage began in February 1932. The dam is areinforced concrete, slab and buttress (Ambursen) structure. At dam crest elevation 3143.0,Thief Valley Dam (fig. 2) has:
a structural height* of 73 feeta hydraulic height of 48 feeta top crest width of 7 feeta crest length of 390 feet
The spillway is an uncontrolled overflow section located in the center of the dam and has acrest elevation of 3133.0 and a length of 268.0 feet. The spillway design flow is 35,000 cubicfeet per second at maximum water surface elevation 3143.0.
The outlet works, located through the face of the dam's overflow section, are controlled by two4.8- by 6-foot slide gates. The capacity of the outlet works is 2,440 cubic feet per second atreservoir elevation 3143.0.
The 1992 reservoir survey measured a total storage capacity of 13,307 acre-feet and a surfacearea of 685.1 acres at reservoir spiliway crest elevation 3133.0. During the 59.7 years sincedam closure (February 1932 to June 1992), the capacity loss caused by sedimentaccumulation in the reservoir was estimated to be 1,798 acre-feet.
* The definition of terms such as "structural height," "hydraulic height," etc., may be found in manuals such asReclamation's Design of Small Dams and Guide for Preparation of Standing Operating Procedures for Dams andReservoirs, or ASCE's Nomenclature for Hydraulics.
SUMMARY AND CONCLUSIONS
This report presents the 1992 results of the first extensive sedimentation survey of ThiefValley Reservoir by the Bureau of Reclamation. The primary objectives of the survey wereto:
• gather data needed for developing new reservoir topography• compute area-capacity relationships• estimate storage depletion caused by sediment deposition since Thief Valley Dam closure.
Standard land surveying methods were used to establish horizontal and vertical controlpoints for the aerial and hydrographic surveys. A local horizontal grid system wasestablished for both surveys using monumented control points located on the center line ofthe dam axis overlooking the reservoir area These monuments are Reclamation benchmarks with 1929 National Geodetic Vertical Datums. The bathymetric survey was run usingsonic depth recording equipment interfaced with an automated survey system consisting ofa line-of-sight microwave positioning unit capable of determining sounding locations withinthe reservoir. The system continuously recorded reservoir depth and horizontal coordinatesas the survey boat was steered across close spaced gridlines covering the reservoir area. Thepositioning system provided information to allow the boat operator to maintain course alongthese gridlines. Water surface elevations measured by the land surveyors at the time of datacollection were used to convert the sonic depth measurements to true lake bottom elevations.
The 1992 surface areas at predetermined 5-foot contour intervals were generated by acomputer graphics program that produced a new contour map of the reservoir (fig. 3). Therevised area and capacity tables were produced by a computer program that uses measuredcontour surface areas and a curve-fitting technique to compute area and capacity atprescribed elevation increments.
Table 1 contains a summary of reservoir watershed characteristics and sediment data for the1992 survey. The 1992 survey determined that the reservoir has a storage capacity of 13,307acre-feet and a surface area of 685.1 acres at spillway crest elevation 3133.0. Since closurein February 1932, the reservoir has accumulated an estimated volume of 1,798 acre-feet ofsediment below spillway crest elevation 3133.0. This volume represents an 11.9-percent lossin total capacity and an average annual loss of 30.1 acre-feet. These figures indicate that alarge amount of estimated sediment has accumulated in the reservoir since the originalsurvey, but uncertainties with the original reservoir area data create questions regardingthese sediment accumulation values. The 1992 survey established the present area-capacityof Thief Valley Reservoir, and a resurvey should not be necessary unless major sedimentinflow occurs in the future.
DESCRIPTION OF WATERSHED
The Powder River that drains into Thief Valley Reservoir originates in northeastern Oregonalong the eastern slopes of the Blue Mountains. The watershed above the dam has adrainage area of 910 square miles, of which a calculated 842 square miles contributedsediment inflow during the study period. Sediment from the remaining drainage area wastrapped by Phillips Lake since water storage began in October 1967. The basin rises fromelevation 3094.0 feet at the outlet works to about 9,000 feet along the Elkhorn Ridge, whichforms the northeastern boundary of the Phillips Lake watershed.
2
The basin is elliptical in shape and lies in a south to north orientation. The western andsouthern portion of the basin is forested and steep. Tree cover consists of larch, pine, fir, andvery little underbrush. The central portion consists of a rather broad open basin withrelatively flat terrain. The valley consists of pasture, alfalfa fields, rolling sagebrush coveredhills, and very few trees. Soils are loose and consist of a silty loam of moderate to deepdepths.
RESERVOIR OPERATIONS
The reservoir is a multiuse facility having (following values are from June 1992 area-capacitytables):
7,488 acre-feet of exclusive flood control storage between elevations 3133.0 and 3143.0
13,307 acre-feet of active conservation storage between elevations 3094.0 and 3133.0
0 acre-feet of inactive storage below elevation 3094.0(1992 survey measured a minimumelevation of 3093.8)
Records for Thief Valley Reservoir are very limited. The mean annual runoff of 177,500 acre-feet per year was obtained from Reclamation's project data book (Reclamation, 1981).Records of the reservoir operation were only available from 1961 and ranged from a minimumelevation of 3094.0 in 1961, 1966, 1967, and 1977 to a maximum elevation of 3134.8 in 1984.The limited inflow and end-of-month stage records in table 1 show the extreme annualfluctuation of the reservoir, and this type of operation is assumed to have occurred prior to1961 also.
SURVEY METHOD AND EQUIPMENT
The Thief Valley Reservoir survey was completed using the contour method as outlined byBlanton (1982). The procedure involved collecting adequate coordinate data for developinga reliable contour map by photogrammetric and bathymetric survey methods. ColumbiaBasin Project Office personnel used standard land surveying methods to establish horizontaland vertical control points for both survey methods. A local horizontal grid system wasestablished for both surveys using monumented points located in the reservoir area. Theabove water data were collected by aerial photography when the reservoir was nearly empty.The field survey work for the bathymetric survey involved establishing a triangulationnetwork around the reservoir to provide horizontal and vertical control for all required gridlines and shore stations. No range lines were previously established on the lake and it wasdecided not to establish permanent range lines during this survey. Because of the size andshape of the reservoir, any future survey would also employ the contour method; therefore,permanent range line end markers were not necessary.
The hydrographic survey was run on June 4 and 5, 1992, with the reservoir at water surfaceelevation 3121.9 and 3122.2, respectively. The bathymetric survey was run using sonic depthrecording equipment interfaced with an automated survey system consisting of a line-of-sightmicrowave positioning unit capable of determining sounding locations within the reservoir.This positioning system transmitted line-of-sight microwave signals to fixed shore stationsand converted the reply time to range distances, which the system data logger used tocompute the coordinate position of the sounding boat. The survey system continuously
recorded reservoir depth and horizontal coordinates as the survey boat moved across close-spaced gridlines covering the reservoir area. To produce adequate data for developingcontours of Thief Valley Reservoir, grid spacing of 150 to 200 feet was selected. The systemgave directions to the boat operator to assist in maintaining course along the close-spacedgridlines. During each run, the depth and position data were recorded on a floppy disk forsubsequent processing by Denver Office personnel. A graph plotter was used in the field totrack the boat and ensure adequate coverage during the cOllection process. Water surfaceelevations surveyed at the time of collection were used to convert the sonic depthmeasurements to true lake bottom elevations.
RESERVOIR AREA AND CAPACITY
Original Capacity
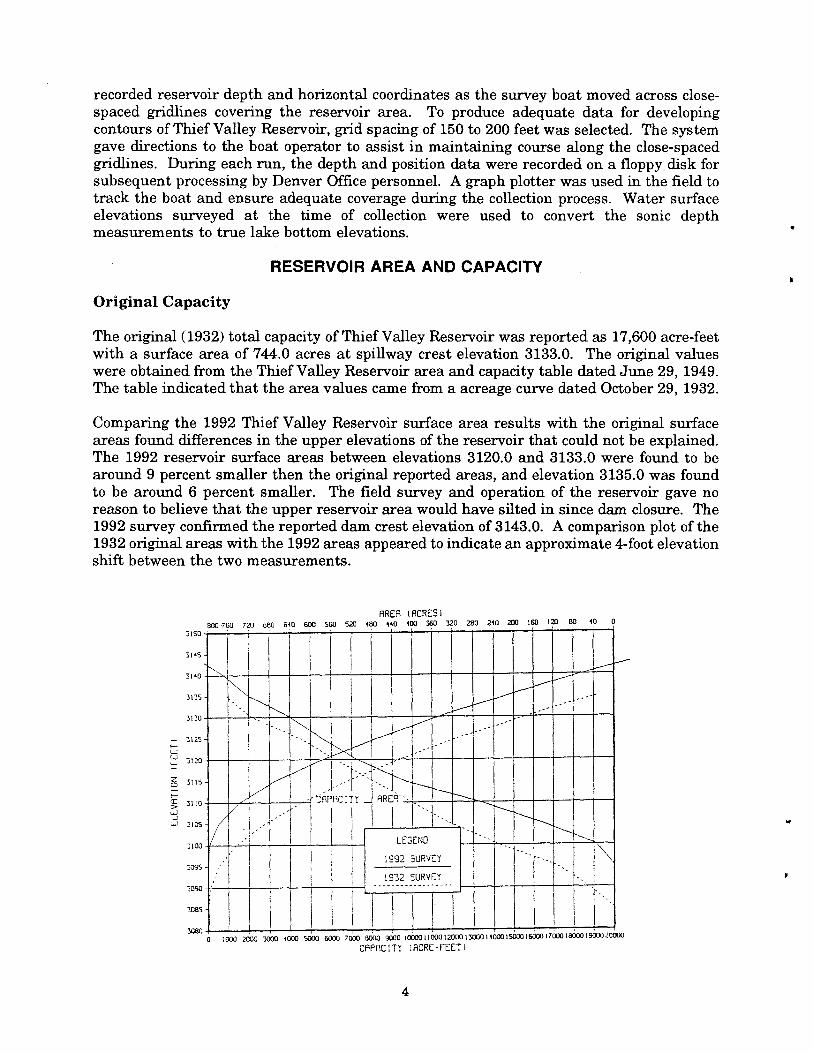
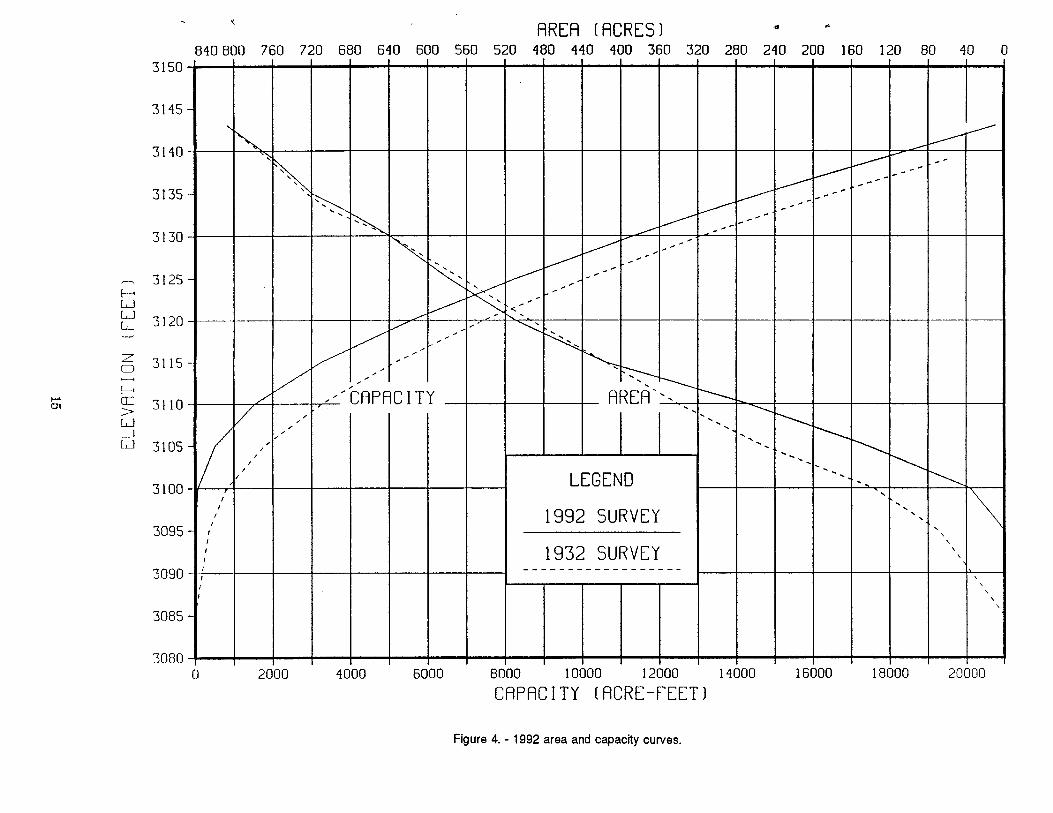
The original (1932) total capacity of Thief Valley Reservoir was reported as 17,600 acre-feetwith a surface area of 744.0 acres at spillway crest elevation 3133.0. The original valueswere obtained from the Thief Valley Reservoir area and capacity table dated June 29, 1949.The table indicated that the area values came from a acreage curve dated October 29, 1932.
Comparing the 1992 Thief Valley Reservoir surface area results with the original surfaceareas found differences in the upper elevations of the reservoir that could not be explained.The 1992 reservoir surface areas between elevations 3120.0 and 3133.0 were found to bearound 9 percent smaller then the original reported areas, and elevation 3135.0 was foundto be around 6 percent smaller. The field survey and operation of the reservoir gave noreason to believe that the upper reservoir area would have silted in since dam closure. The1992 survey confirmed the reported dam crest elevation of 3143.0. A comparison plot of the1932 original areas with the 1992 areas appeared to indicate an approximate 4-foot elevationshift between the two measurements.
3)50
3)45
3110
3135
3 30
3)25
3120
3115
3100
3095
2090
2085
3280
AREA (ACRES808 760 721) 680 610 60)3 560 54) 480 480 40)3 360 320 280 240 160 120 8)) 60 U
- tAPRCIfl1flREfl - - - - __ -
Um1 I 7180318(68)190)4200)4
CAPFICITI ACRE-FEETI
4

Research of these differences found no clear answer that could explain them. For sedimentcomputation purposes, the original datum was shifted 4 feet, and the original capacity wasrecalculated from the shifted area values. The original area of 763 acres at elevation 3135.0became the area at elevation 3139.0. The elevation shift was completed for all of the originalsurface areas as listed in column (4) of table 2. The recalculated capacity values are listedin column (5) of table 2. The original stream bed elevation of 3085.0 was assumed to be thesame.
Development of 1992 Contour Areas
The 1992 contour surface areas for Thief Valley Reservoir were developed by generating acontour map from the collected aerial and underwater coordinate data. Five-foot contourintervals of the lake area were created by a computer graphics software program SURFACEII (Kansas Geological Survey, 1978). A modification of this program by the Denver Officecalculated surface areas of the closed contours of the generated map. The fmal reservoir mapshown on figure 3 was prepared by the Denver Office Computer Drafting Unit of the DraftingSection. The map scale is 1 inch = 500 feet with a contour interval of five feet.
1992 Revised Storage Capacity
The storage-elevation relationships based on the aerial and underwater survey data weredeveloped using the area-capacity computer program ACAP85 (Reclamation, 1985). Surfaceareas at 5-foot contour intervals computed from aerial and underwater survey data were usedas control parameters for computing reservoir capacity. The program computes an area atelevation increments of 0.01 to 1.0 foot by linear interpolation between the 5-foot contourintervals. The program begins by testing the initial capacity equation over successiveintervals to ensure that the equation fits within an allowable error limit, which was set at0.000001 for Thief Valley Reservoir. This capacity equation is then used over the full rangeof intervals fitting within this allowable error limit. For the first interval at which the initialallowable error limit is exceeded, a new capacity equation (integrated from the basic areacurve over that interval) tests the fit until it also exceeds the error limit. Thus, the capacitycurve is defined by a series of curves, each fitting a certain region of data. Final areaequations are derived by differentiating the capacity equations, which are of second orderpolynomial form:
y a + a2x + aax2
where:y capacity,x = elevation above a reference base,a = intercept, anda2 and a3 = coefficients
Results of the 1992 Thief Valley Reservoir area and capacity computations are listed in table1 and columns (6) and (7) of table 2. Listed in columns (4) and (5) of table 2 are the adjustedoriginal surface areas and recomputed capacity values. A separate set of 1992 area andcapacity tables has been published for the 0.01-, 0.1-, and 1-foot elevation increments(Reclamation, 1992). A description of the computations and coefficients output from theACAP85 program is included with these tables. Both the original and 1992 area-capacitycurves are plotted on figure 4. As of June 1992, at reservoir spillway crest elevation 3133.0,the surface area was 685.1 acres and the total capacity was 13,307 acre-feet.
SEDIMENT ANALYSES
Sediments have accumulated in Thief Valley Reservoir to a total volume of 1,798 acre-feetsince dam closure in February 1932. This volume indicates a large amount of accumulatedsediment since the original survey, but the problem with the original reservoir areas (seeoriginal capacity section) creates questions regarding the accumulation value. The averageannual rate of sediment deposition between closure and June 1992(59.7 years) was 30.1 acre-feet, or 0.0338 acre-foot per square mile from the sediment-contributing drainage area. Thestorage loss in terms of percent of original storage capacity was 11.9 percent. Table 1 and2 summarize the Thief Valley Reservoir sediment accumulation and water storage data basedon the 1992 resurvey.
The Powder River downstream from Thief Valley Dam is a Federal Wild and Scenic Riverand has a substantial rainbow trout fishery. In 1991, the Pacific Northwest Regional Officeconducted studies on the sediment releases from Thief Valley Reservoir. The study measuredthe downstream water quality as the sediment deposits on the reservoir bottom were erodedduring extreme reservoir drawdown. The study concluded that maintenance of a 2,200 acre-foot minimum pool would prevent the downstream sedimentation problems. This value wasdetermined from the collected samples and the original capacity table.
The Sedimentation Section, using the 1991 samples and reservoir trap efficiency calculations,concluded that to maintain the downstream water quality, a maximum release along with aminimum pool elevation should be recommended. Also, the maintenance of the minimumpool will increase the reservoir trap efficiency and the sediment buildup within the reservoir.Over time, the sediment buildup within the reservoir will require the minimum pool elevationto be increased to maintain the good downstream water quality.
It is recommended, for maintaining downstream water quality releases, that the reservoiroperation have a minimum pooi elevation of 3104.5 feet and that the maximum discharge notexceed 75 cubic feet per second near the minimum pool level. It is also recommended thatperiodic water samples be taken downstream during low reservoir pool conditions. Thesesamples will better determine the maximum discharge during these conditions plus monitorthe need of increasing the minimum pool elevation. The 1992 survey established the presentarea-capacity of Thief Valley Reservoir, and a resurvey should not be necessary unless majorsediment inflows occur in the future.
REFERENCES
American Society of Civil Engineers,Nomenclature for Hydraulics, ASCE Headquarters, NewYork, 1962.
Blanton, J.O. III, "Procedures for Monitoring Reservoir Sedimentation: Technical Guidelinefor Bureau of Reclamation," Denver Office, Denver, CO, October 1982.
Bureau of Reclamation, Surface Water Branch, ACAP85 User's Manual, Denver Office,Denver, Colorado, 1985.
Bureau of Reclamation, Guide for Preparation of Standing Operating Procedures for Bureauof Reclamation Dams and Reservoirs, U.S. Government Printing Office, Denver, CO, 1987a.
Bureau of Reclamation, Design of Small Dams, U.S. Government Printing Office, Denver, CO,1987b.
Bureau of Reclamation, Estimated Sediment Deposition in Mann Creek Reservoir, Mann CreekProject, Pacific Northwest Region, Boise, Idaho, May 1987c,
Bureau of Reclamation, Denver Office, "Thief Valley Reservoir Area and Capacity Tables,Baker Project," Pacific Northwest Region, Denver, CO, June 1992.
Kansas Geological Survey, SURFACE II GRAPHICS SYSTEM, Lawrence, Kansas, 1978.
7
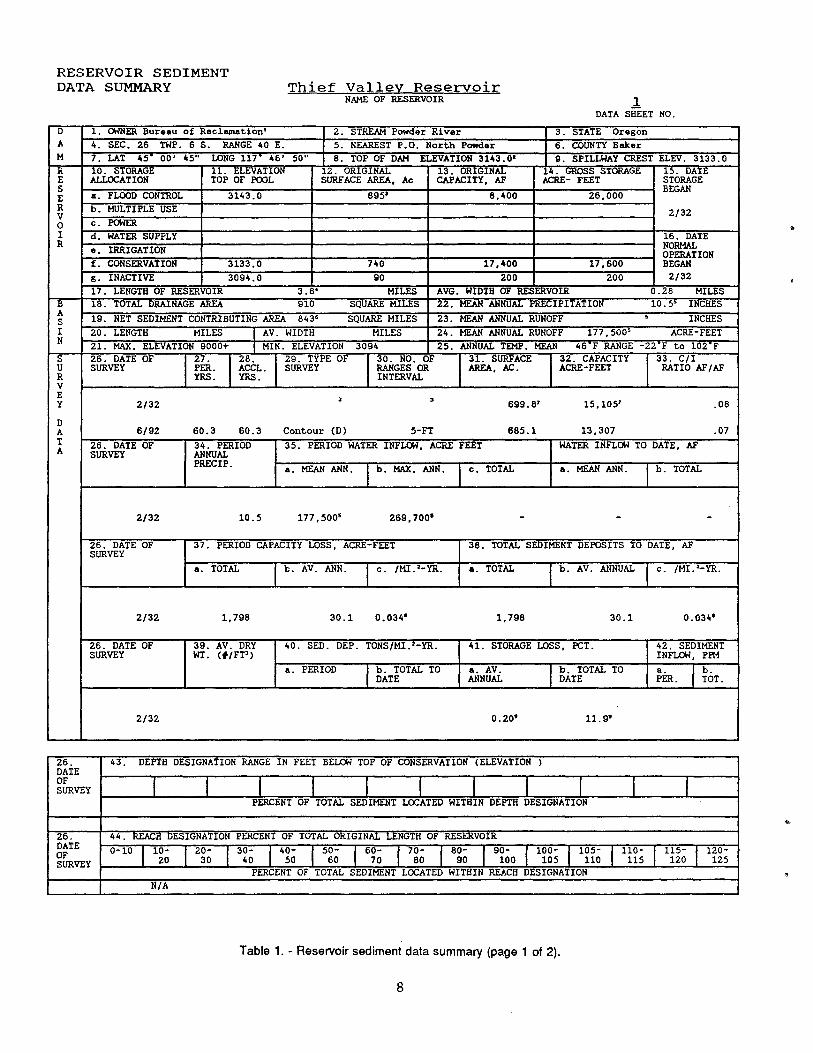
RESERVOIR SEDIMENTThief Valley ReservoirDATA SUMMARY
NAME OF RESERVOIR
DATA SHEET NO.
1. OWNER Bureau of Reclamation' 2. STREAM Powder River 3. STATE OregonA 4. SEC. 26 1W?. 6 5. RANGE 40 E. 5. NEAREST P.O. North Powder 6. COUNTY BakerH 7. LAT 452 00' 45" LONG 117' 46' 50" 8. TOP OF DAM ELEVATION 3143.02 9. SPILLWAY CREST ELEV. 3133.0
T 10. STOR.ALE 11. ELEVATION 12. ORIGINAL 13. ORIGINAL 4. GROSS STORAGE 15. DATEE ALLOCATION TOP OF POOL SURFACE AREA, Ac CAPACITY, #2 ACRE- FEET STORAGE
BEGANa. FLOOD CONTROL 3143.0 895 8,400 26,000
R b. MULTIPLE USE______________ ________________ 2 32
C. POWER_______________ ________________
___ ______ __IR
d. WATER SUPPLY___
16. DATE
e. GA N______________ _______________ ______________ ________________
NORMALOPERATION
f. CONSERVATION 3133.0 740 17,400 17,600 BEGAN
g. INACTIVE 3094.0 90 200 200 2/32
17. LENGTH OF RESEK OIR 3.8 MILES AVG. WIDTH OF RL, RVOIR 0.28 MILES18. TOTAL DRAINAGE AREA 910 SQUARE MILES 22. MEAN ANNUAL PRECIPITATION 10.5 INCHES
19. NET SEDIMENT CONTRIBUTING AREA 843' SQUARE MILES 23. MEAN ANNUAL RUNOFF INCHES
IN
20. LENGTH MILES AV. WIDTH MILES 24. MEAN ANNUAL RUNOFF l77,SOO ACRE-FEET
-21. MAX. ELEVATION 9000+ MIN. ELEVATION 3094 25. ANNUAL TEMP. MEAN 46'F RANGE -22'F to 102'F
r- 26. DATE OF 27. 28. 29. TYPE OF 30. NO. OF 31. SURFACE 32. CAPACITY 33. C/IU SURVEY PER. ACCL. SURVEY RANGES OR AREA, AC. ACRE-FEET RATIO AF/AFFt YRS. YES. INTERVAL
Y 2/32 699.8' 15,105' .08
DA 6/92 60.3 60.3 Contour (D) 5-FT 685.1 13,307 .07T 26. DATE OF 34. PERIOD I 35. PERIOD WATER INFLOW, ACRE FEET WATER INFLOW TO DATE, AFA SURVEY ANNUAL
PRECIP.a. MEAN ANN. b. MAX. ANN. c. TOTAL a. MEAN ANN. b. TOTAL
2/32 10.5 177,500 269,700' - - -
26. DATE OF 37. PERIOD CAPACITY LOSS, ACRE-FEET 38. TOTAL SEDIMENT DEPOSITS TO DATE, AFSURVEY
a. TOTAL b. AV. ANN. c. /MI.2-YR. a. TOTAL b. AV. ANNUAL c. /MI.'-YR.
2/32 1,798 30.1 0.034' 1,798 30.1 0.034'
26. DATE OF 39. AV. DRY 40. SED. DEE'. TONS/MI.-YR. 41. STORAGE LOSS, PCT. 42. SEDIMENTSURVEY WT. (#/FT3) INFLOW, PPM
a. PERIOD b. TOTAL TO a. AV. b. TOTAL TO a. b.DATE ANNUAL DATE PER. TOT.
2/32 0.20' 11.9'
26.DATE
43. DEPTH DESIGNATION RANGE IN FEET BELOW TOP OF CONSERVATION (ELEVATION
OFSURVEY
PERCENT OF TOTAL SEDIMENT LOCATED WITHIN DEPTH DESIGNATION
26. 44. REACH DESIGNATION PERCENT OF TOTAL ORIGINAL LENGTH OF RESERVOIRDATE
SURVEY
0-10 10-20
20-30
30-40
40-50
50-60
60- I70
70-80
1 80- 90- 100- 105-100 105 110
110-115
115-120
120-125
PERCENT OF TOTAL SEDIMENT LOCATED WITHIN REACH DESIGNATION
N/A
Table 1. - Reservoir sediment data summary (page 1 of 2).
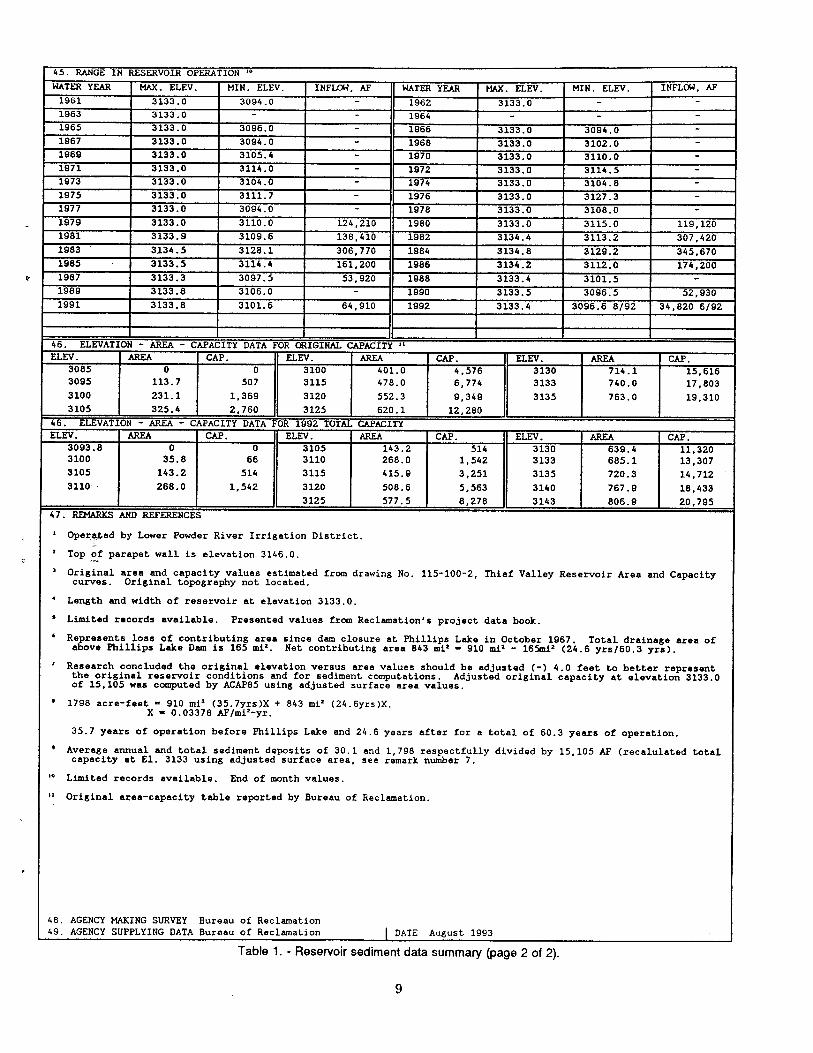
45. RANGE IN RESERVOIR OPERATION '
WATER YEAR MAX. ELEV. MIN. ELEV. INFLOW • Al WATER ELEV. NIH. ELEV. INFLOW • Al
1961 3133.0 3094.0 - 1962 3133.0 - -
1963 3133.0 - 1964 - -
1965 3133.0 3096.0 - 1966 3133.0 3094.0 -
1967 3133.0 3094.0 - 1968 3133.0 3102.0 -
1969 3133.0 3105.4 - 1970 3133.0 3110.0 -
1971 3133.0 3114.0 - 1972 3133.0 3114.5 -
1973 3133.0 3104.0 - 1974 3133.0 3104.8 -
1975 3133.0 3111.7 - 1976 3133.0 3127.3 -
1977 3133.0 3094.0 - 1978 3133.0 3108.0 -
1979 3133.0 3110.0 124,210 1980 3133.0 3115.0 119,1201981 3133.9 3109.6 138,410 1982 3134.4 3113.2 307,4201983 3134.5 3128.1 306,770 1984 3134.8 3129.2 345,6701985 3133.5 3114.4 161,200 1986 3134.2 3112.0 174,2001987 3133.3 3097.5 53,920 1988 3133.4 3101.5 -
1989 3133.8 3106.0 - 1990 3133.5 3096.5 52,9301991 3133.8 3101.6 64,910 1992 3133.4 3096.6 8/92 34,820 6/92
46. ELEVATION - AREA - CAPAI..ITY DATA FOR Cu 1GINAL CAPACITI II
ELEV. AREA CAP. ELEV. AREA CAP. ELEV. AREA CAP.3085 0 0 3100 401.0 4,576 3130 714.1 15,6163095 113.7 507 3115 478.0 6,774 3133 740.0 17,8033100 231.1 1,369 3120 552.3 9,349 3135 763.0 19,3103105 325.4 2,760 3125 620.1 12,280
____________
46. ELEVATION - AREA - LAPACITY DATA FOR 1992 TOTAL CAPACITYELEV. AREA CAP. ELEV. AREA CAP. ELEV. AREA CAP.
3093.8 0 0 3105 143.2 514 3130 639.4 11,3203100 35.8 66 3110 268.0 1,542 3133 685.1 13,3073105 143.2 514 3115 415.9 3,251 3135 720.3 14,7123110 268.0 1,542 3120 508.6 5,563 3140 767.9 18,433
____________ ____________ ____________ 3125 577.5 8,278 3143 806.9 20,795
47. REMARKS AND REFERENCL.
Operated by Lower Powder River Irrigation District.
Top of parapet wall is elevation 3146.0.
Original area and capacity values estimated from drawing No. 115-100-2, Thief Valley Reservoir Area and Capacitycurves. Original topography not located.
Length and width of reservoir at elevation 3133.0.
Limited r.cords available. Presented values from Reclamation's project data book.
Represents loss of contributing area since dam closure at Phillips Lake in October 1967. Total drainage area ofabove Phillips Lake Dam is 165 mi2. Net contributing area 843 mi2 910 m15 - l65mia (24.6 yrs/60.3 yrs).
Research concluded the original elevation versus area values should be adj usted (-) 4. 0 feet to better representthe original reservoir conditions and for sediment computations. Adjusted original c apacity at elevation 3133.0of 15,105 was computed by ACAP85 using adjusted surface area values.
* 1798 acre-feet 910 mi2 (35.7yrs)X + 843 mi2 (24.6yrs)X.X 0.03378 AF/mi2-yr.
35.7 years of operation before Phillips Lake and 24.6 years after for a total of 60.3 years of operation.
Average annual and total sediment deposits of 30.1 and 1,798 respectfully divided by 15,105 Al (recalulated totalcapacity at El. 3133 using adjusted surface area, see remark number 7.
'° Limited records available. End of month values.
II Original area-capacity table reported by Bureau of Reclamation.
48. AGENCY MAKING SURVEY Bureau of Reclamation49. AGENCY SUPPLYING DATA Bureau of Reclamation DATE August 1993
Table 1. - Reservoir sediment data summary (page 2 of 2).
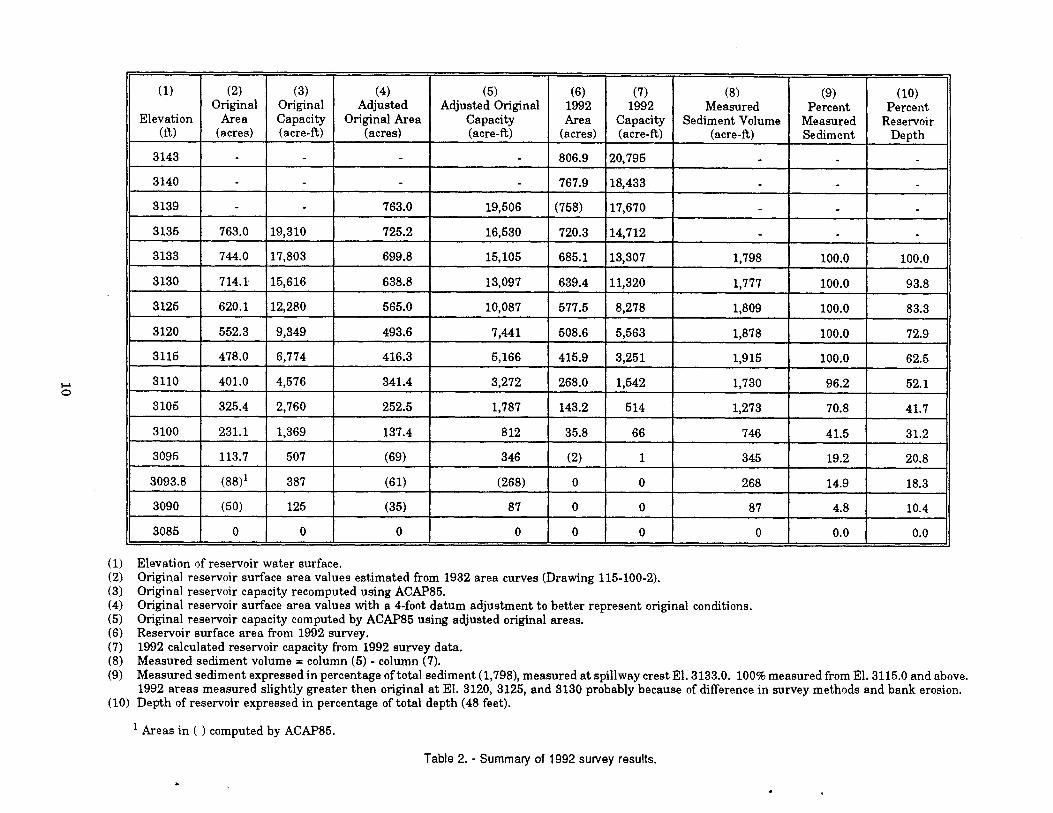
(1)
Elevation(ft)
(2)Original
Area(acres)
(3)OriginalCapacity(acre-ft)
(4)Adjusted
Original Area(acres)
(5)Adjusted Original
Capacity(acre-ft)
(6)1992Area
(acres)
(7)1992
Capacity(acre-if)
(8)Measured
Sediment Volume(acre-if)
(9)Percent
MeasuredSediment
(10)Percent
ReservoirDepth
3143 - - - - 806.9 20,795 - - -
3140 - - - - 767.9 18,433 - - -
3139 - - 763.0 19,506 (758) 17,670 - - -
3135 763.0 19,310 725.2 16,530 720.3 14,712 - - -
3133 744.0 17,803 699.8 15,105 685.1 13,307 1,798 100.0 100.0
3130 714.1 15,616 638.8 13,097 639.4 11,320 1,777 100.0 93.8
3125 620.1 12,280 565.0 10,087 577.5 8,278 1,809 100.0 83.3
3120 552.3 9,349 493.6 7,441 508.6 5,563 1,878 100.0 72.9
3115 478.0 6,774 416.3 5,166 415.9 3,251 1,915 100.0 62.5
3110 401.0 4,576 341.4 3,272 268.0 1,542 1,730 96.2 52.1
3105 325.4 2,760 252.5 1,787 143.2 514 1,273 70.8 41.7
3100 231.1 1,369 137.4 812 35.8 66 746 41.5 31.2
3095 113.7 507 (69) 346 (2) 1 345 19.2 20.8
3093.8 (88)' 387 (61) (268) 0 0 268 14.9 18.3
3090 (50) 125 (35) 87 0 0 87 4.8 10.4
3085 0 0 0 0 0 0 0 0.0 0.0
(1) Elevation of reservoir water surface.(2) Original reservoir surface area values estimated from 1932 area curves (Drawing 115-100-2).(3) Original reservoir capacity recomputed using ACAP85.(4) Original reservoir surface area values with a 4-foot datum adjustment to better represent original conditions.(5) Original reservoir capacity computed by ACAP85 using adjusted original areas.(6) Reservoir surface area from 1992 survey.(7) 1992 calculated reservoir capacity from 1992 survey data.(8) Measured sediment volume = column (5) - column (7).(9) Measured sediment expressed in percentage of total sediment (1,798), measured at spillway crest El. 3133.0. 100% measured from El. 3115.0 and above.
1992 areas measured slightly greater then original at El. 3120, 3125, and 3130 probably because of difference in survey methods and bank erosion.(10) Depth of reservoir expressed in percentage of total depth (48 feet).
1 Areas in ( ) computed by ACAP85.
Table 2. - Summary of 1992 survey results.
ft31E. 40 4,____________ __________________________________________________________ _________________________ __________________________R 45£
NORTH 1.4POWD€
YOIR.
UNION CO UNTYAxt R C 0 U N IT
(LIFT LOWE oiv,s,o
PUMP PLANT
NA HE!
¼L LLtY PUMPPL A NT
UPP(R 0/VISION--' ______
eAKER C
4'/1.
• * I s 0__
PHILLIPS LANE-
MASON DAM-'__
•
__ __ __ __ I__
Figure 1. - Mann Creek Iocaton map.

Space intentionally left blank due to security concerns
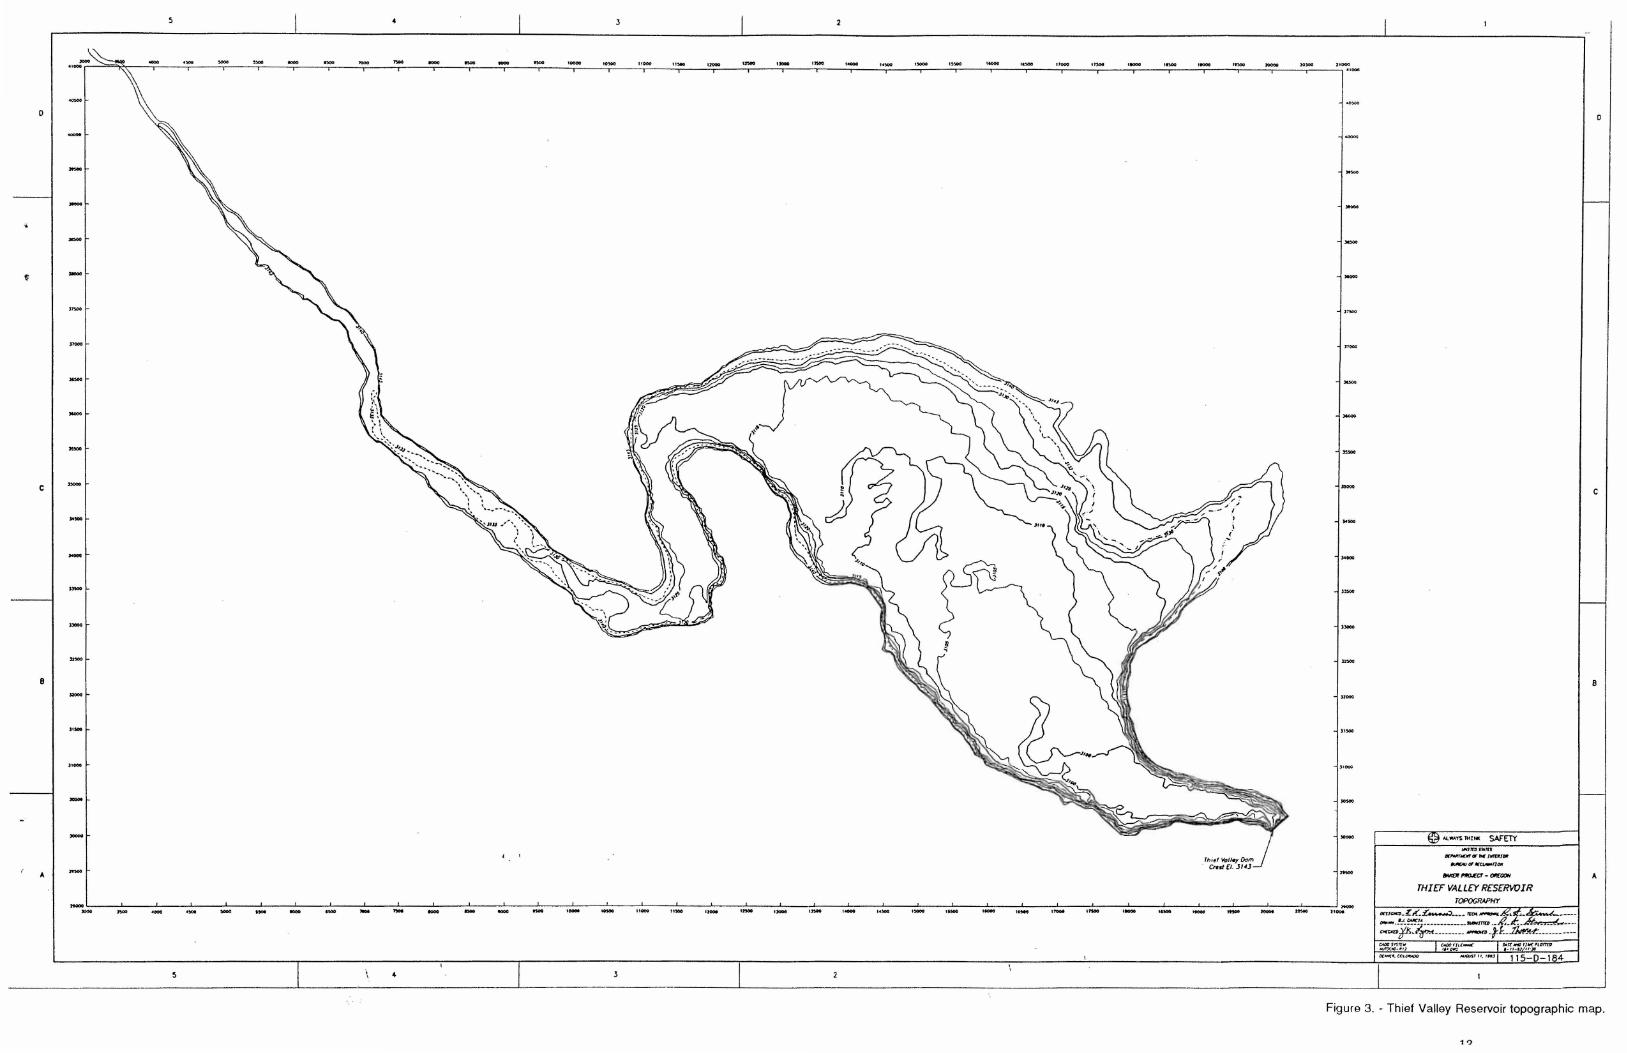
Figure 3. - Thief Valley Reservoir topographic map.
1)
AREA (ACRES)
-
3150
3145
3140
3135
3130
3125
LiLi 3120
3115
ci:Q1 > 3110Li-JLi 3105
3100
3095
3090
3085
3080
840800 760 720 580 640 600 560 520 480 440 400 360 320 280 24 0 200 160 120 80 40 C
- - - - - - - --
•N
N
L--
CAPACIT Y AREA
./7
/
I-
7 -
- -
-
- --/I
'I,
' LEGEND-
1992 SURVEY
1932 SURVEY
fl 200fl 4000 6000 8000 10000 12000 14000 16000 18000 20000
CAPACITY (ACRE-rEET)
Figure 4. - 1992 area and capacity curves.
Mission
The mission of the Bureau of Reclamation is to manage, develop, andprotect water and related resources in an environmentally andeconomically sound manner in the interest of the American Public.


