Working Paper 503 February 2019 Cohesive Institutions and Political Violence Abstract Can institutionalized transfers of resource rents be a source of civil conflict? Are cohesive institutions better at managing conflicts over distribution? We exploit exogenous variation in revenue disbursements to local governments and use new data on local democratic institutions in Nigeria to answer these questions. There is a strong link between rents and conflict far away from the location of the resource. Conflict over distribution is highly organized, involving political militias, and concentrated in the extent to which local governments are non-cohesive. Democratically elected local governments significantly weaken the causal link between rents and political violence. Elections produce more cohesive institutions, and vastly limit the extent to which distributional conflict between groups breaks out following shocks to the rents. Throughout, we confirm these findings using individual level survey data. www.cgdev.org Thiemo Fetzer and Stephan Kyburz Keywords: conflict, ethnicity, natural resources, political economy, commodity prices JEL: Q33, O13, N52, R11, L71
Transcript
Working Paper 503 February 2019
Cohesive Institutions and Political Violence
Abstract
Can institutionalized transfers of resource rents be a source of civil conflict? Are cohesive institutions better at managing conflicts over distribution? We exploit exogenous variation in revenue disbursements to local governments and use new data on local democratic institutions in Nigeria to answer these questions. There is a strong link between rents and conflict far away from the location of the resource. Conflict over distribution is highly organized, involving political militias, and concentrated in the extent to which local governments are non-cohesive. Democratically elected local governments significantly weaken the causal link between rents and political violence. Elections produce more cohesive institutions, and vastly limit the extent to which distributional conflict between groups breaks out following shocks to the rents. Throughout, we confirm these findings using individual level survey data.
www.cgdev.org
Thiemo Fetzer and Stephan Kyburz
Keywords: conflict, ethnicity, natural resources, political economy, commodity prices
The Center for Global Development works to reduce global poverty and improve lives through innovative economic research that drives better policy and practice by the world’s top decision makers. Use and dissemination of this Working Paper is encouraged; however, reproduced copies may not be used for commercial purposes. Further usage is permitted under the terms of the Creative Commons License.
The views expressed in CGD Working Papers are those of the authors and should not be attributed to the board of directors, funders of the Center for Global Development, or the authors’ respective organizations.
Cohesive Institutions and Political Violence
Thiemo FetzerUniversity of Warwick, Pearson Institute at
the University of Chicago, and CEPR
Stephan KyburzCenter for Global Development
Can institutionalized transfers of resource rents be a source of civil conflict? Are cohesive institutions better at managing conflicts over distribution? We exploit exogenous variation in revenue disbursements to local governments and use new data on local democratic institutions in Nigeria to answer these questions. There is a strong link between rents and conflict far away from the location of the resource. Conflict over distribution is highly organized, involving political militias, and concentrated in the extent to which local governments are non-cohesive. Democratically elected local governments significantly weaken the causal link between rents and political violence. Elections produce more cohesive institutions, and vastly limit the extent to which distributional conflict between groups breaks out following shocks to the rents. Throughout, we confirm these findings using individual level survey data.
Thiemo Fetzer and Stephan Kyburz, 2018. “Cohesive Institutions and Political Violence.” CGD Working Paper 503. Washington, DC: Center for Global Development. https://www.cgdev.org/publication/cohesive-institutions-and-political-violence
Appendix to “Cohesive Institutions and Political Violence” .................................................. 45
A. Extended discussion of institutional background ........................................................... 45
B. Additional tables and figures............................................................................................... 59
1 IntroductionThe peaceful division of scarce resources is a distinguishing feature of func-
tioning and successful states. A country’s political system and the cohesiveness
of that system are important for managing resource allocation. Systems in which
different groups in society are meaningfully represented and engaged with politi-
cal processes are likely to be more stable. A lack of cohesive institutions has been
identified as a central feature that may explain the emergence of fragile and low
income development clusters (Acemoglu and Robinson, 2012; Besley and Persson,
2011a).
Natural resource rents – relative to other sources of government revenue – are
particularly prone to trigger violence through a multitude of channels (Collier and
Hoeffler, 1998; Caselli et al., 2015; Berman et al., 2017). Natural resource rents are
distinguishable from other government revenues because they are windfall profits
that mostly directly accrue to the state, as opposed to being indirectly sourced
through taxation. Windfall profits encourage rent-seeking behavior and this contest
for rents may involve violence (van der Ploeg, 2011). Resource wealth is often
associated with repressive regimes, rentier states and clientelism (Brollo et al., 2013;
Besley and Persson, 2011b; Carreri and Dube, 2017).
Understanding why some countries suffer an endowment curse can inform the
design of institutions (Ross, 2015). Leveraging the theoretical framework of Besley
and Persson (2011b), we study three questions. First, do large windfalls of politi-
cally controlled natural resource rents trigger violence to contest or enforce exclu-
sion from these rents? Second, are elected (as opposed to appointed) local govern-
ments more successful in discouraging the use of violence to contest rents? Third,
to what extent does variation in the degree of cohesiveness that these different in-
stitutional setups generate explain why violence is being used to contest rents in
one, but not the other regime.
Our answers provide ample evidence to support the overall theoretical predic-
tions of Besley and Persson (2011b). Further, we confirm an important proposition
that has been left unexplored: do cohesive institutions discourage the use of politi-
cal violence? Besley and Persson (2011b)’s theoretical results strongly depend on a
2
single model parameter capturing the extent to which institutions are constraining
incumbents. Less cohesion implies that more resources are being diverted away
from common public goods, and towards patronage and clientelism, generating
a unique value for a group holding political power. Through this channel, in-
vestments in capacities to forcefully retain power (incumbent) or gain access to it
(opposition) can be rationalized. With fully cohesive institutions, the sharp theoret-
ical predictions break down: the more cohesive institutions are, the less likely it is
that revenue shocks will induce investments in political violence. The central role
that the cohesiveness of institutions plays has not been investigated empirically in
a convincing manner due to a lack of time-variation in institutions. This paper fills
this gap.1
There are at least three main challenges to finding a context that maps well into
the overall theoretical framework and allows for a sharp and clean test of the theo-
retical predictions. First, natural resources can cause conflict through many direct
and indirect channels, posing a significant challenge for non-experimental studies
to causally identify and quantify the relevance of any individual channel.2 Second,
there are few cases where countries exhibit significant and meaningful variation
in their institutional setup that are not confounded with other concurrent changes.
Such broader institutional changes, for example brought about by democratization,
are compound treatments that make it harder to distinguish independent effects of
specific institutional features. Third, measuring and identifying the degree of co-
hesiveness of political institutions is not trivial. While political institutions may
seem non-cohesive from the outset along certain dimensions such as religion, eth-
nicity or identity, the extent to which the public actually perceives institutions as
non-cohesive along such dimensions depends on the extent to which society is
polarized along these lines to begin with.
We argue that Nigeria provides a unique context that allows us to navigate
1While cross-sectional variation across countries is being used to estimate heterogenous effectsin Besley and Persson (2011b), they leave a test of their important Corollary 4 to future research.
2To give a sense for the multitude of channels, the existing literature has suggested – amongothers – that natural resources encourage inter-state conflict (Caselli et al., 2015), secession (Morelliand Rohner, 2015), improve the feasibility of rebellion (Berman et al., 2017); other channels exploredare due to the negative externalities of resource extraction (Sexton, 2018; Humphreys, 2005) and alack of transparency around extraction activity (Christensen, 2017).
3
these challenges. First, we exploit Nigeria’s system of oil revenue sharing across
the three tiers of government. This has several advantages. On the empirical side,
the revenue sharing follows a fixed rule and the size of transfers is guided by the
movements of world oil prices. Further, the spatial concentration of oil wealth in
the South of the country allows us to isolate the effect that institutionalized rents
have on political violence at the local level. Hence, it is not confounded by any
direct effects of extraction activity on violence. Lastly, on the conceptual side, the
revenue sharing matches a key tenet of the theoretical model in Besley and Persson
(2011b): resource rents directly accrue to the incumbent government, generating an
asymmetry between incumbent and opposition over access to rents.3
Second, Nigeria allows us to exploit variation in the extent of local democratic
practice within country and even within constitution over time due to existence of rich
and idiosyncratic variation in the extent to which local governments are appointed
or democratically elected (while holding constant the overall institutional setup).
Lastly, we can leverage the fact that Nigeria is a multi-ethnic society in which
politics is significantly influenced by the ethnic affiliation of population groups
(Alesina et al., 2016; Hodler and Raschky, 2014).
We make three findings. First, consistent with the theoretical prediction in
Besley and Persson (2011b), we document a significant and economically sizeable
link between resource rents and the incidence of political violence. These effects
are driven by positive shocks to resource rents. The ensuing low-intensity conflict
is highly institutionalized involving government repression and militias using tar-
geted violence, though not broad, open rebellions involving riots or protests. The
finding suggests that revenue sharing – an institutional feature common to eleven
African countries (NRGI/UNDP, 2016) – implies a novel type of resource-induced con-
flict: while violence may be used to voice grievances or contest the allocation of
resources, the patterns are inconsistent with all-out civil war, which is not surpris-
ing given that civil war may compromise access to rents in the first place (e.g. se-
cession of non-oil producing areas is not a credible contest goal). Revenue sharing3On the relevance of how this asymmetry may affect the dynamics of civil conflict, see e.g.
Andersen et al. (2017) who exploit the variation that off-shore versus on-shore oil and gas revenueshave on government versus rebel fighting capacity, or Vanden Eynde (2015) who documents thatIndian state governments are more likely to engage in fighting an insurgency if they obtain a highershare of the mineral resource revenues that the insurgency contests.
4
may exacerbate latent low intensity distributional conflicts in places far removed
from physical resources, but we show that this conflict is associated with places
where governance is weak and institutions are non-cohesive.
Second, we find that having an elected local government systematically weak-
ens the link between rents and the incidence of political conflict. Rather than focus-
ing on any individual election – which may be prone to violence directly affecting
its outcome (Long et al., 2017) – we contrast consecutive periods over which lo-
cal governments are elected (as opposed to appointed) and study the systematic
link between shocks to rents and violence across such periods. Our identification
strategy allows us to tackle many plausible endogeneity concerns, while providing
sharp results that match key theoretical predictions in Besley and Persson (2011b).
Further, while our main results are derived from the widely used ACLED conflict
data (and other common conflict data sets), we also turn to individual level micro data
to corroborate our findings, documenting that fear of political violence, actual vic-
timization, and even engagement in conflict broadly follows the pattern suggested
by the aggregate data. Given the still limited availability of data in the African
context, we think this cross-check speaks to the overall robustness of our results
(Berman and Matanock, 2015).
Having an elected local government can affect political violence through a mul-
titude of channels. Our third set of findings highlights that – consistent with the
theoretical predictions – the higher degree of cohesiveness of institutions that elections
(as opposed to appointments) produce seem to drive the results. We construct a
measure of non-cohesiveness capturing the extent to which the ethnic make-up
in an area is aligned with the ethnicity of the state governor. We provide ample
anecdotal evidence suggesting that when local governments are appointed, these
appointments are skewed towards the ethnicity of the state governor. We vali-
date this measure using individual level micro data and document that the link
between political violence and resource rents is strongly driven by this measure of
non-alignment – but only when local governments are appointed, not when they
are elected.
This paper relates to three strands of literature. First, the literature studying
5
the important link between natural resources and civil conflict.4 Dube and Var-
gas (2013)’s seminal paper studies civil conflict in Colombia, comparing oil versus
coffee producing municipalities and finding strong evidence in support of the op-
portunity cost mechanism; Sanchez de la Sierra (2015) studies violence in coltan
and gold mining regions in Congo; Berman et al. (2017) study resource related
conflict in Africa around fine spatial grid cells with mining activity, and Caselli
et al. (2015) focus on interstate conflict over natural resources. Bazzi and Blattman
(2014) provide an overview of the literature exploiting commodity price shocks
to study conflicts, Ciccone (2018) provides new cross-country evidence and asks
important questions about the construction of commodity price shock measures,
while Blattman and Miguel (2010) review the broader literature on civil war. Our
paper differs as we document a new type of resource conflict affecting regions far away
from the physical location of the resource, due to the institutionalized sharing of
resource revenues. This observation highlights a potential problem for empirical
designs that study conflict over physical control of the resource across space: rev-
enue sharing is a spillover that violates the non-interference assumption inherent
in difference-in-difference estimations used in this literature.
We also relate to the literature on how institutions, especially democracy, shape
development outcomes and civil conflict. Martinez-Bravo et al. (2014) find that
the introduction of local village elections in China increased public goods expen-
diture financed by villagers, caused a moderate decline in income inequality, and
likely reduced corruption, while Martinez-Bravo et al. (2017) suggest that elite cap-
ture may persist through democratic transitions. On the latter, Collier and Rohner
(2008) suggest that democracy, due to the possibility of violence having an electoral
cost, may be constraining the use of force. On the other hand, the act of holding
elections may encourage violence to affect turnout (Collier and Vicente, 2014; Eifert
et al., 2010; Long et al., 2017). Natural resource rents may have further effects on
political outcomes, not necessarily involving violence in the form we document
here. Bruckner et al. (2012) document in a cross-country panel setup that positive
4A large literature studies the natural resource curse in terms of economic growth and devel-opment. Some of the papers that substantiated this strand of the literature are Sachs and Warner(1995), Sachs and Warner (1999), Acemoglu et al. (2014) and more recently Cust and Mihalyi (2017)and Harding et al. (2017). A literature overview is provided in Arezki et al. (2011).
6
oil price shocks are followed by moderate improvements in democratic institutions
(measured using the Polity-2 dataset), while Caselli and Tesei (2016) suggest that
resource windfalls make autocratic regimes even more autocratic, while not affect-
ing democratic countries. The concern with this work is the multitude of channels
through which these effects could operate. It highlights the value of working with
subnational data exploiting time variation in a specific democratic institution, while
holding constant the overall institutional context, as we are able to do in this paper.
Yet, it also raises the concern that our subnational time-variation in transition to and
from having elected governments may be endogenous to commodity price cycles.
We find no evidence for this as local governments transition in and out of having
elected local governments quite unsystematically. Lastly, there is also a literature
that exploits time variation in resource shocks on the quality of institutions holding
the overall institutional framework fixed. Carreri and Dube (2017) show how oil
price shocks affect which type of political candidate is elected in oil-producing mu-
nicipalities in Colombia, while Brollo et al. (2013) study how additional resource
revenues accruing to a government induce corruption.
Lastly, we relate to the growing literature on ethnic politics in Africa in general,
and on power sharing as an institution in particular. Francois et al. (2015) describe
how power is shared among African ethnic groups represented by cabinet positions
at the central government level, as a result of outside threats such as revolutions
or coups. They document a strong degree of proportionality between ministerial
positions and ethnic group population shares. Eifert et al. (2010) find that ethnic
identities become stronger before elections when political competition intensifies.
Politicians cultivate favor among their constituents by appealing to ethnic and re-
gional identities (Burgess et al., 2015; Hodler and Raschky, 2014), which may result
in significant ethnic between-group inequality (Alesina et al., 2016). Power sharing
more generally has been suggested to be an important driver of the peace process
in Northern Ireland (Mueller and Rohner, 2017). Fearon and Laitin (2003) suggests
that ethnic diversity is not associated with a higher civil conflict incidence, Rohner
et al. (2013a) document that conflict reduces inter-ethnic trust, while the theoretical
model in Rohner et al. (2013b) suggests that measures fostering inter-ethnic trust
and trade may be effective in avoiding a vicious cycle of conflict. More recently
7
Bazzi and Gudgeon (2015) suggest that for Indonesia, increasing public resources
can increase conflict particularly in ethnically polarized areas.
Lastly, there is a small literature on Nigeria. Sala-i Martin and Subramanian
(2013) suggests that Nigeria’s institutions are negatively affected by the oil wealth
undermining growth; a more historic account of oil wealth and violence is given
by Azam (2009), while Collier and Vicente (2014) examines how voter intimidation
is effective in reducing voter turnout. Fenske and Zurimendi (2017) provides ev-
idence on the long-run effects of oil wealth increasing inequality; analyzing state
capacity, Rasul and Rogger (2017) investigates how management practices in the
Nigerian public sector, such as autonomy of the bureaucrat as well as incentives
and monitoring, affect service delivery.
The remainder of the paper is organized as follows. Section 2 provides back-
ground on the institutional setup and discusses the data used. Section 3 examines
whether political rents induce conflict. In Section 4 we study whether having an
elected local government weakens this link. Section 5 provides evidence of the
underlying mechanism. Section 6 concludes.
2 Institutional Context and a First Look at the DataWe first discuss the Nigerian context and introduce our main data. We focus
on three things: we describe the system of revenue sharing, we provide an account
of local governance in Nigeria and we discuss the observed violence and introduce
our measures of conflict. A more extensive discussion of the institutional and
socio-econonomic context can be found in Appendix A.
2.1 Fiscal federalism, resources and political rentsNigeria is organized as a Federation of States in the Nigerian Constitution of
1999. The constitution stipulates a system of revenue sharing between the three
tiers of government (federal, state and local governments) according to a fixed for-
mula. The collected revenues are an oil production tax and value added tax (VAT).
Oil revenues though make up the most significant share of government revenues
and are important for public finances at all levels of government: in 2013 oil rev-
enues accounted for 75% of all revenues (World Bank, 2013). At the local level,
8
the vast majority of funds are revenue sharing transfers: almost 90% of gross rev-
enues available to local governments is due to disbursements from the federation
account (World Bank, 2013).5 The exogenously sourced monthly allocations to local
governments thus constitute the main source of political rents.
The revenue sharing system stipulates that, of the gross total of public sector
revenues, 20.60% are allocated to local governments, 26.72% are allocated to the
states, and 52.68% are allocated to the federal government (vertical formula).6 Of
the 20.6% allocated to local governments, each of the 774 local governments has
a specific weight ωi, whereby ∑i ωi = 1 (horizontal formula). These weights are
essentially time-invariant and fixed at a baseline year.7 Table 1 highlights that pop-
ulation and landmass are driving the cross-sectional variation in the index weights
ωi. This results in rich cross-sectional variation in the index weights used across
the country. The index weights are shown in panel A of Figure 1.
We digitize data on the monthly allocations and the index weights used in
the allocation formula from the Federation Account Allocation Committee at the
Nigerian Federal Ministry of Finance. This gives us a monthly balanced panel of
allocations across all 774 local government areas for the period June 1999 to July
2014. Variation in the monthly allocations is mostly driven by the variation in oil
prices as the amount of oil produced is quite stable over our sample period.8
The actual allocations are separated into statutory and extraordinary allocations.
Importantly, both of these allocations respect the set of fixed index weights ωi,
which determine the individual shares of total revenues that each local government
receives. The statutory allocations are regular monthly disbursements calculated
based on a benchmark oil price that tracks the spot market price at a discount. Rev-
enues that accrue due to the difference between the spot market and benchmark
5Local governments have limited ability to raise revenues. Ekpo and Englama (2008) documentsthat they usually raise less than 5% of gross revenues with the main source of non-transfer revenuesbeing property tax and market and trading licenses.
6The oil producing states receive 13% percent of oil revenues directly, called the DerivationPrinciple. Our results are robust to excluding the oil producing states wholly from the analysis.Similarly, in our empirical setup we control for state by time fixed effects, which effectively accountsin a non-parametric fashion for the state specific variation in transfers.
7Over our sample period, the allocation formula changed slightly in August 2006 and in October2013.
8Appendix Table A2 provides a formal decomposition of the variance in allocations highlightingthat the bulk of variation is explained by price (as opposed to quantity) variation.
9
price are accumulated in the Excess Crude Account. Extraordinary allocations are
disbursed irregularly from the Excess Crude Account and based on idiosyncratic
political decisions. These allocations can usually be traced back to periods when
significant fiscal buffers were accumulated.9 The total allocations are hence the
monthly combination of statutory and extraordinary allocations. In the empirical
exercises, we focus on the statutory allocations, but use the extraordinary alloca-
tions for robustness checks. Panel B in Figure 1 presents the statutory allocations
against the oil price over time.
2.2 Local political institutionsThe constitution of Nigeria requires that local government councils should be
chosen via local elections every three years. Local councils consist of a number of
councillors and a chairman. The councils have substantial responsibilities for the
provision of education, health care services, and policies to foster local economic
development, but have essentially no independent revenue raising capacity and are
reliant on transfers from the central government. While the constitution stipulates
that local government councils must be elected by the people, state governments
must organize and finance the local government elections.
The first local council elections in the transition from military to democratic
rule were held in November/December 1998. The first term of the original local
councils ended in May 2002. At that time, confusion emerged as the national voter
register used in the 1999 elections had not yet been updated for new elections.10
In June 2002, state governors appointed committees to (temporarily) run the lo-
cal g overnments, called “transition committees”. Elections of local councils have
been controversial ever since.11 In the subsequent years, state governors started
to exploit their idiosyncratic political power to postpone or cancel local elections
9The benchmark price usually tracks the spot market price at a discount resulting in accumula-tion of a fiscal buffer. We describe this in further detail in section A.1 in the appendix. AppendixTable A1 presents a decomposition of within and between LGA variation for these different typesof allocations (overall, statutory, and extraordinary allocations) indicating that the within-LGA vari-ation accounts for the major part of the overall variation in allocations.
10A supreme court ruling in 2002 held that local government elections should not to be held untilthe voter register was updated (reported e.g. in the newspaper This Day, May 8 2002).
11See Kyburz (2017) for a more detailed description of the controversy surrounding local gov-ernment council elections and the appointment of caretaker committees.
10
altogether. As a consequence, many local government councils ceased to be elected
bodies, and became appointed bodies. This results in significant de-facto variation
in local political institutions across Nigeria that we exploit in this paper.
The cohesiveness of local governments depends, inter alia, on whether local
councils are elected by the people or appointed by the state governor. We pre-
sume and provide ample anecdotal and empirical evidence that local government
council elections involve more constituencies in the governing process. Meanwhile
appointments made by the state governor appear to maximize control over local
governments and the distributions of perks to cronies. Panel A of Figure 2 displays
the variation in the overall time that areas have an elected local government council
between 1999 to 2014, while Panel B presents the time-series variation capturing the
share of local governments that are elected at a specific point in time. An in-depth
discussion of local government responsibilities and council elections is provided in
Appendix A.3.
We draw data on the conduct of local government council elections or appoint-
ment of so-called “transition” or “caretaker” committees from a media content
analysis using Nigerian newspapers, presented in more detail in Kyburz (2017).
Since official information on local councils is not available we rely on local news-
papers from which we extract information on local government council elections.12
In particular, we extract information for each of the 774 local government areas on
the dates when local elections were held, the period of tenure of elected councils,
and the periods in which appointed committees were in power.
In our empirical analysis, we use the de facto variation in the ‘state of democracy’
at the local level to analyze whether having an elected local government has a
pacifying effect on civil violence described in the following subsection. We do
not focus on any individual election, but rather focus on consecutive periods in
which local governments are elected (as opposed to appointed). We code a dummy
variable that captures whether a local council is elected (Elected = 1) or appointed
as caretaker committee by the state governor (Elected = 0).
Political control over the local government represents an important source of
12Most information is extracted from Nigerian newspapers This Day/All Africa Global Media, DailyChampion/All Africa Global Media, Vanguard/All Africa Global Media, Daily Trust/All Africa Global Media,and Daily Independent/All Africa Global Media.
11
political rents. Anecdotal evidence suggests that the rents are often used for pa-
tronage, which again may generate economic grievances for marginalized groups.
These grievances are likely to be pronounced in cases where local governments do
not have electoral incentives to share the rents with the local population through
the provision of common public goods (Besley and Persson, 2011b). Because of
the high volatility in oil prices, the flow of allocations into local accounts is both
hard to predict and opens the floodgates to misappropriate public funds. There are
numerous accounts of mismanagement of public funds, lowering trust in the local
governments and creating grievances among the population. Cancelling elections
and appointing committees instead is likely to reinforce these grievances and to
lead to hostilities between political interest groups.13
Grievances among the population and cleavages between ethnic groups may
intensify when politicians use ethnic identities to distribute perks. Periods of non-
elected caretaker governments presumably exacerbate the prevalence of ethnic pol-
itics as state governors are likely to appoint co-ethnic cronies (Burgess et al., 2015;
Hodler and Raschky, 2014). In a regime with appointed local governments, the
non-aligned ethnic groups may be excluded from any political rents. They possi-
bly resort to violence to contest the control of the local government and improve
their bargaining power. On the other hand, the group in power may use violence
and repression to prevent opposition groups from accessing rents. We provide both
anecdotal and empirical evidence for the relevance of these mechanisms in Section
5, and use micro-data to corroborate our findings. Elected local governments, by
virtue of being more inclusive, make political institutions more cohesive and sig-
nificantly reduce the incidence of resource-rent induced conflict by sharing rents
more broadly.
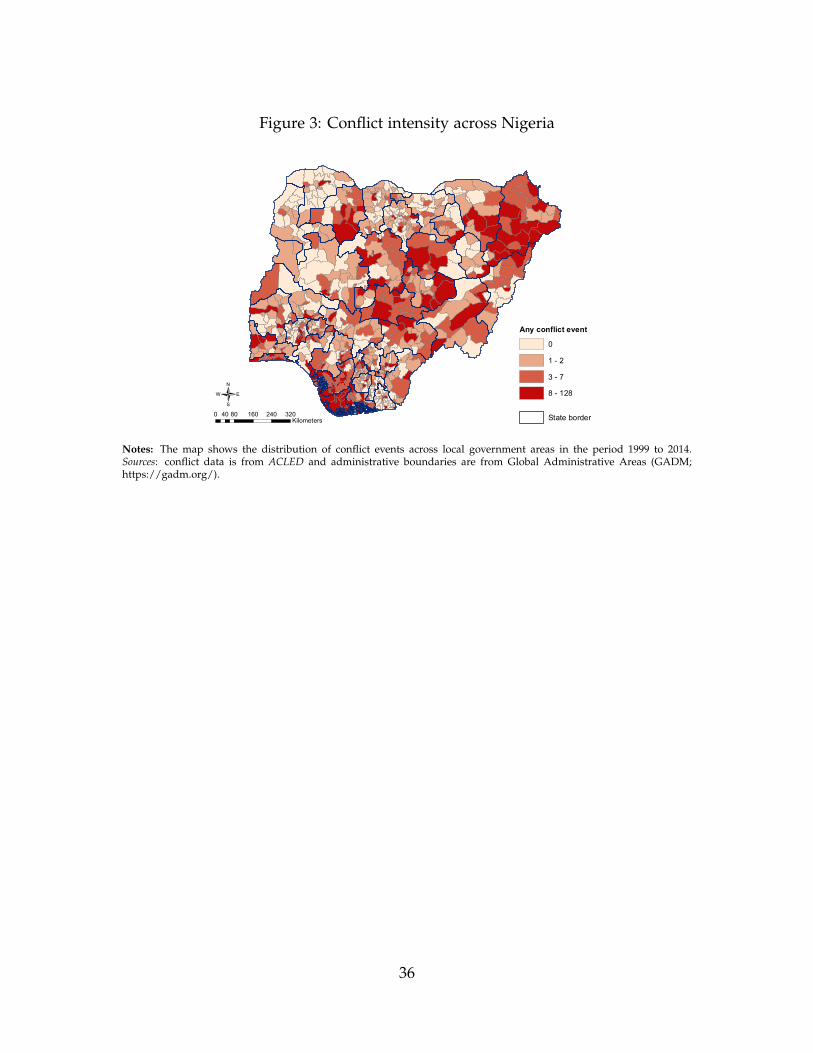
2.3 Political violenceNigeria is in a state of low-intensity conflict. Small scale violent events cause
numerous casualties each year all over the country. We propose that these conflicts
are — to a large extent — contests between political factions for the control over
13In appendix A.1, we provide a detailed description of the public finance management at thelocal government level and how the erratic nature of revenue allocations may facilitate embezzle-ment.
12
local governments. Control of local government councils brings with it the perks
of the allocations from the Federation Account. While in some local government
areas, the distribution of institutionalized resource rents may be resolved through
peaceful means, in other cases rival political groups use physical intimidation, vi-
olent repression and force to gain access to rents.
The variation in conflict across Nigeria that we use in our empirical analysis
is displayed in Figure 3, indicating the number of violent events for each of the
774 local government areas from 1999 to 2014. Civil conflict data over the entire
sample period is drawn from the Armed Conflict Location and Event Data Project
(ACLED).14 Raleigh and Dowd (2015) provide a detailed description of variables
and coding methodology. The ACLED project provides details of geographic lo-
cations of conflict events, including latitude and longitude, dates, and additional
information on the actors involved. In particular, it codes the actions of rebels,
governments, and militias within unstable states, allowing an analysis of the local
level factors and the dynamics of civil and communal conflict.
We provide detailed anecdotal evidence about these low-intensity conflicts be-
tween political groups in Appendix A.2. There are many accounts of violent con-
flicts over the resource rents that are disbursed to local governments every month.
Violence is reported to be associated with the misconduct of local government
chairmen, mismanagement of local public finances such as failure to pay salaries,
the embezzlement of public funds, and failure to provide education and health
care. The acts of fraud are used by opposing political groups to mobilize and
provoke violent reactions and contest their share of the allocation. Importantly,
we will see that this violence is concentrated around positive shocks to political rents
and does not seem to involve mass-mobilization involving protests and riots, but rather
involves violence orchestrated by the incumbent resorting to the military and po-
litical militia groups.
Violent clashes between political factions may also coincide with local elections.
We report a significant increase in civil violence in the month leading up to local
14The ACLED conflict events data is available at https://www.acleddata.com/. We use alter-native conflict data to check the robustness of our results. Specifically, we use data from UppsalaConflict Data Program Georeferenced Event Dataset, available at http://ucdp.uu.se/, and theGlobal Terrorism Database GTD, available at https://www.start.umd.edu/gtd/.
where the dependent variable yjst indicates the incidence of conflict in local gov-
ernment area j, state s, and month t. Allocjst are the monthly disbursements to a
local government area.15 Throughout, we control for LGA-specific fixed effects, αj,
and more importantly state-by-time fixed effects, δst. While we obtain very simi-
lar results using less demanding specifications, the inclusion of state-by-time fixed
effects is appealing for two reasons: first, states participate in the revenue sharing
and thus, controlling for state by time fixed effects flexibly controls for the extent
to which resources flow into the state (as opposed to LGA’s); second, they remove
any state-specific non-linear conflict trends.
Our central coefficient of interest is γ. We expect this coefficient to be positive,
γ > 0, indicating that positive shocks to rents increase the incidence of repres-
sion and political violence. In the context of the theoretical model of Besley and
15Appendix Tables A3, A4 and A5 highlight that our results are robust to alternative temporalresolutions, working with intensity (as opposed to incidence) measures and other estimation meth-ods to account for the count data nature. We prefer the monthly resolution as this allows us todirectly address concerns that our estimates are affected by increased conflict around elections.
14
Persson (2011b), the mechanism is simple: more rent accruing to the incumbent
government, all else constant, increases the value of holding political power for the
incumbent (and of gaining political power for the opposition) as this secures the
ability to grant transfers to the own group if institutions are not cohesive. As a
result, both the incumbent and the opposition invest in violence.
In addition to the OLS estimation, we use an instrumental variable approach to
counter any endogeneity or measurement concerns in the monthly disbursements
to local governments. Equation 2 represents the first-stage specification. The central
input to the revenue sharing formula is the variable ωj, which captures a local
authority’s share in the overall revenue allocation and is decomposed as presented
in Table 1. The second ingredient is a measure of the Oil pricet which drives the
The underlying identifying assumption for γ in specification 3, representing the
causal effect of natural resource rents on conflict, is that there is no other indirect
way by which the interaction between ωj × Oil pricet affects conflict other than
through the allocations. This would be a concern if there were other transfers
or government schemes that are linked to the specific ωj used for the revenue
allocations. It would also be a concern if oil price shocks had a further differential
effect on e.g. economic activity in different locations that is not captured through
the interaction with the allocation weight.
As we will show, the revenue sharing formula is followed very closely, so that
one can question the necessity of an instrumental approach. Therefore, we do not
show IV estimation coefficients in the result tables to conserve space. We next
present the results.
15
3.2 ResultsThe main results, focusing on the periods in which local governments are ap-
pointed, are presented in Table 2. The table includes outcomes from the OLS and
the instrumental variable estimation exercises. The results in Table 2 demonstrate
a significant and considerable relationship between civil conflict measures, as re-
ported in the ACLED database, and inflows of resource revenues during periods
when local governments are appointed. The effects are sizeable: the point estimate
in column (1) suggests that a one standard deviation increase in allocations is as-
sociated with a more than doubling of the conflict event incidence relative to the
average incidence. This implies that revenue sharing and resource rents are a major
source of political conflict and violence. Columns (2) – (4) study the three types of
events covered in ACLED: “battles” – involving any interaction between organized
combatants, “violence against civilians”, and “protests/riots”. We see that rents
are most strongly associated with an increasing incidence of battles and violence
against civilians, while we observe a null result for protests and riots. We discuss
this further below.
Columns (4) – (8) cover the groups involved in conflict, distinguishing between
the military, political militias, communal militias, and rebels. The results indicate
that the effects are mostly driven by conflict events involving the military, political
and communal militias, and not by rebel violence. The latter is a telling null result:
rebel groups, as per ACLED’s definition are “political organizations whose goal
is to counter an established national governing regime by violent acts [...] with
a stated political agenda for national power (either through regime replacement
or separatism)”. Yet, as we argued earlier, secession is not a viable contest goal
for the vast majority of Nigeria that is non-oil producing, as secession would cut
these areas off from further transfers. Therefore, a null result here is not surprising.
Lastly, in columns (9) – (10) we further decompose column (6), to study between
which actors conflict unfolds: most events involve political militias either fighting
the military or targeting civilians.
A comparison of the OLS and the IV results (Panel A and B) reveal a limited
need for instrumenting in the first place since the gross statutory allocations are al-
most fully explained by the interaction term. The weak-IV test statistic is far from
16
any levels that would merit concern regarding the weakness of the instrument.16
Since the allocation rule is being tightly followed and the OLS and IV results are
very similar throughout, for brevity, we do not report the IV estimates in the re-
mainder of this paper.
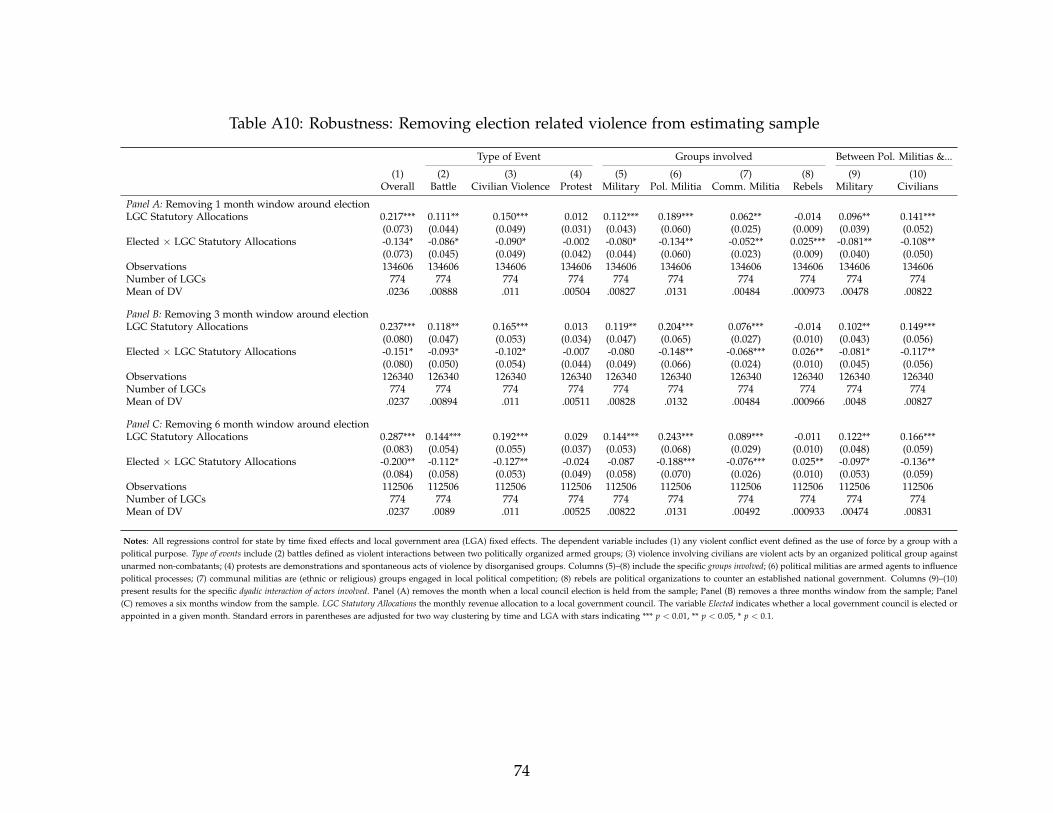
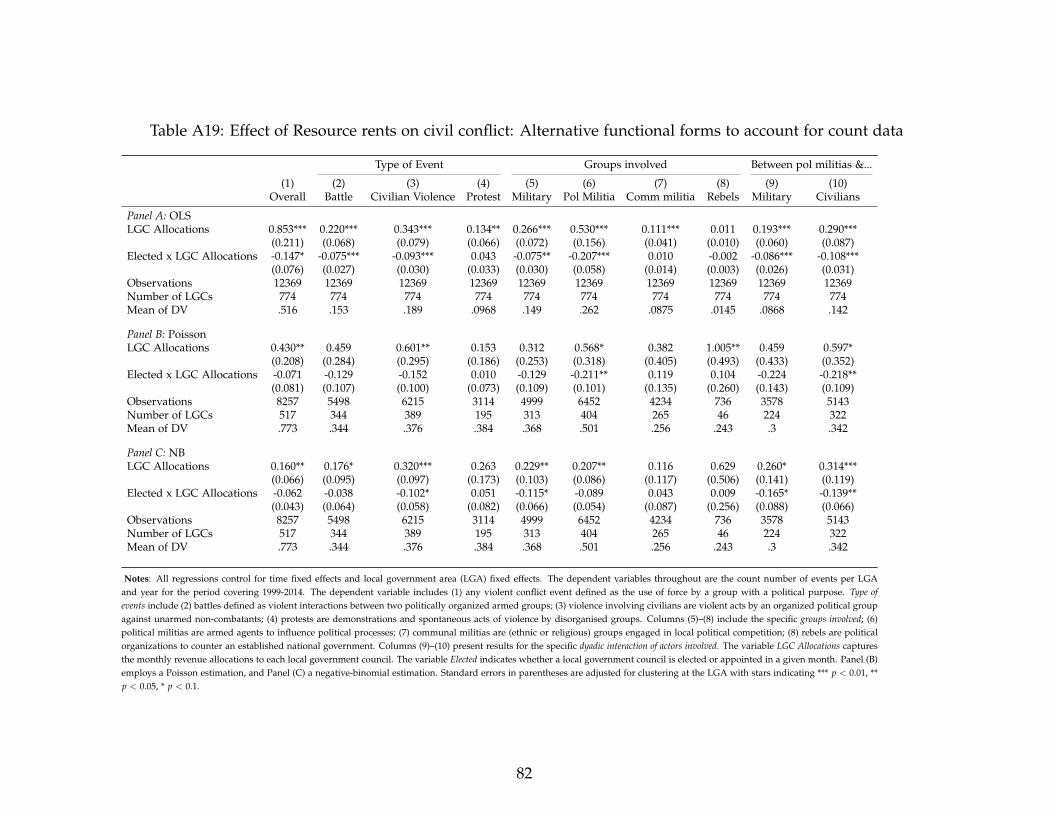
3.3 RobustnessOur baseline results are robust to a battery of checks. We obtain very similar
results when varying the temporal resolution of our data to be quarterly or annual
rather than monthly in Table A3, or when considering alternative transformations of
our conflict measures to measure plain conflict levels, per capita measures or logarith-
mic transformations in Table A4. We show that our results are robust to alternative
functional forms in Table A5. We obtain very similar results when estimating Pois-
son, negative-binomial or plain OLS on event counts. Similarly, we can flexibly
control for the individual subcomponents of the revenue sharing formula weights in
Table A6. We obtain very similar results using different conflict data altogether,
shown in Table A7, where we draw in the Uppsala Conflict Data Program data
set and the Global Terrorism Database, and remove Boko-Haram conflict events
from ACLED to illustrate that the effects are not driven by this particular conflict.
Finally, we also check whether extraordinary allocations that are triggered when
fiscal buffers accumulate (while still following the allocation rule) have a different
effect on conflict – finding no evidence that this is the case in Table A8.
Is there a differential effect in oil producing areas? In Appendix Table A9 we
explore whether the link between resource rent and conflict in LGAs in states that
produce oil (Panel A) or LGAs that have a known oil field (Panel B). There is
only limited evidence of a slightly weaker relationship between resource rents and
conflict in areas that are (likely) produce oil. This suggests that the conflict we
capture is over the distribution of natural resource rents and not over the control
of the actual physical source of the resource wealth.
Discussion The analysis suggests that resource revenue sharing may itself be as-
sociated with instability and violence in areas far removed from the actual location
16This is not surprising as in Appendix Table A2, we see that the R2 of the de-facto first stagereaches 98%. The specification without time and location fixed effects reaches an R2 of 86%, sug-gesting that the allocation rule is very closely followed.
17
of oil production. We believe that we are the first to document this institution-
alized spillover effect.17 This has broader implications. Revenue sharing, which is
quite common across the world, may imply a violation of the non-interference as-
sumption inherent to papers exploiting difference-in-difference designs comparing
natural resource producing areas to non-producing areas. Further, the conflict that
we document is institutionalized – not involving mass riots or protests – which we
would a-priori expect if resources are misappropriated. As we will see, the con-
flict is mainly driven by positive shocks to resource revenues, while negative shocks,
if anything, are associated with slightly less conflict. The null result on protests
and riots suggests that citizens may be poorly informed about revenue allocations
or have a systematically different attitude to the misallocation of natural resource
revenues as opposed to taxes (see e.g. Gadenne, 2017; Martınez, 2017). Yet, as we
will show next, the link between violence and political rents strongly depends on
the underlying institutions, suggesting that revenue sharing may only contribute
to instability if institutions are weak.
4 Do Elected Local Governments Promote Peace?We next study whether local democratic institutions can reduce the resource
rents induced civil conflict.
4.1 Empirical specificationOur main estimating equation thus becomes
where now in addition the subindex i indicates an individual response and the
allocation variables are constructed as described above. We control for LGA fixed
effects αj and time fixed effects δt, along with the election status and some addi-
tional control variables capturing respondent characteristics in Xijt.
The results are presented in Table 4. A consistent image emerges: locally ac-
cruing resource rents increase individual fear of being a victim of political violence
(columns 1 and 2), increase the actual victimization (columns 3 and 4) and impor-
tantly, indicate that they increase the propensity of individuals to engage in violent
acts (columns 5 and 6). Once an LGA has an elected government, these associations
are significantly weaker.
5 Do Differences in Cohesiveness of Institutions Ex-
plain these Effects?We next study whether elected local governments – by improving the cohesive-
ness of local governments – weakens the link between resource rents and conflict.
23
5.1 Anecdotal evidenceAs in other African countries, ethnicity plays an important role in Nigerian pol-
itics. We exploit the ethnic affiliation of state governors, who are known to make
local government appointments along ethnic lines. There is ample anecdotal evi-
dence to support this. For example, in Adamawa State, Governor Murtala Nyako,
who was in office between 2007 and 2014, belongs to the Hausa-Fulani ethnicity
that makes up 31% of the state population. In 2011, Governor Nyako was accused
of favoring his Fulani co-ethnics when appointing local governments:
He [Nyako] was accused of concentrating a large percentage of his ap-
pointments among his fellow Fulani ethnic stock especially to his kiths
and kin of Mayo Belwa where he hails from. (Leadership, 23/02/2011)
Similarly, young people of the Oron ethnic group complained about being marginal-
ized in Akwa Ibom State, denouncing that there has never been a governor elected
from their own ethnic group
Some Oron youths in Akwa Ibom on Tuesday protested over undue
marginalisation of the Oron nation by the current administration. En-
weme [a commentator] said that since the creation of the state, no Oron
man had ever been an acting governor, not to talk about being a gover-
nor. If you take a look at Oron nation, you will testify that nothing is
happening here. (PM News, 24/12/2014)
To construct a measure of cohesion, we build a detailed map of the population
shares of different ethnic groups in LGAs across Nigeria, exploiting the fact that
the DHS survey rounds record the ethnicity of the respondents. We combine the
data pertaining to all individual DHS surveys. The dominant ethnic group across
LGAs based on population shares is presented in Appendix Figure A5. Figure A6
in the Appendix displays the population shares of the ethnic groups mentioned
above across Adamawa and Akwa Ibom State to illustrate the anecdotes. We use
this to construct a measure of exclusion from political power based on the ethnicity
of the state governor, which we describe next.
24
5.2 Measuring non-cohesivenessAs suggested, when local governments are appointed by the state governor,
ethnicity is known to play a central role influencing appointments. To leverage
this, we collected data on the ethnic affiliation of state governors and use the DHS-
derived data giving us the ethnic makeup of the population across LGAs. Under
the assumption that local governments are appointed along ethnic lines, with the
state governor favoring members of his own ethnic group, these appointments are
likely to have heterogeneous effects across the local government areas. In particular,
in areas in which the local population is of the same ethnic group as the state
governor, institutions seem relatively more cohesive compared to areas where the
governor’s co-ethnic population share is small.
Our measure of non-cohesiveness captures the share of the local population
that is of a different ethnic group to the state governor. Formally, denote Ekt the
ethnic group of the governor in state k at time t. We infer the population share of
the politically excluded ethnic group in LGA j at time t, under the assumption of
appointments happening along ethnic lines, as
Excludedjt = ∑i 6=Ekt
pit (6)
where the ethnic group population shares are inferred from combining all existing
DHS data rounds containing that information. Since governors have limited terms
in office, the governor’s ethnicity is also changing over time, which produces a
limited degree of time-variation in our measure of excluded ethnic groups. We
can think of this measure as the inverse of the cohesiveness parameter, implying
that areas and time periods with larger excluded populations (Excludedjt → 1), are
vulnerable to intergroup violence.
To assess whether our measure of exclusion is picking up a meaningful signal,
we again turn to the Afrobarometer surveys. For some survey rounds, the data
provides the ethnic affiliation of respondents, which allows us to measure at the
individual level whether individuals from a different ethnic group to that of the state
governor feel that their own ethnic group is treated unfairly. Appendix Table A21
highlights that this appears to be the case, suggesting that our measure of ethnic
25
non-alignment is picking up some grievances. This validation exercise, together
with the anecdotal evidence, suggests that ethnic politics is likely to matter and
that our measure of exclusion should carry some signal relevant to the theory. We
now bring this measure to bear on the data.
5.3 Empirical specificationWe perform two related empirical tests with slightly less demanding empirical
specifications. First, rather than ignoring any potential level effect of having an
elected local government on conflict, we study whether the data suggests such
a level effect and whether this is driven by areas in which a large share of the
population is of a different ethnic group to the state governor.
In particular, we estimate
yjst = αj + ηElectedjst × Excludedjt (7)
+ ν× Electedjst + ξ × Excludedjt + δt + ε jst
As suggested, this amounts to a direct test of Corollary 4 in Besley and Persson
(2011b), which proposes that there is a strictly lower likelihood of conflict in places
that have more cohesive institutions. As such, we would expect that any level
effect of having an elected local government on conflict incidence should be driven
by areas manifesting non-cohesiveness, i.e. those that stand out with high values
in Excludedjt. Hence, in the above specification, we expect the estimate on the
interaction coefficient η to be negative, η < 0. This implies that in areas where there
are appointed local governments and large shares of the population are excluded
from political power, the reduction in conflict would be most pronounced.
The second exercise builds on the previous analysis and directly tests whether
the link between resource rents and conflict is driven by places that have non-
cohesive institutions. We use our measure of ethnic exclusion, Excludedjt, to proxy
for the cohesiveness parameter. If having an elected local government makes insti-
tutions more cohesive, our measure for capturing the degree of non-cohesiveness
when local governments are appointed should cease to meaningfully correlate with
resource rent-induced conflict.
Relative to the main estimation specifications 1 and 4, we add an array of inter-
26
action terms to estimate how effects are heterogeneous in Excludedjt. Further, due
to lack of statistical power, we need to make the time fixed effects less demand-
ing – rather than including state-by-time fixed effects, we now include only simple
time fixed effects. Here, we expect that resource rent induced conflict is most pro-
nounced in areas with a significant share of the local population excluded from
political power, when local governments are appointed. On the other hand, when
local governments are elected, these areas should be mostly driving the weakening
of the relationship between rents and conflict.
5.4 ResultsWe present these results in turn. Table 5 presents results from the first analysis,
estimating whether having an elected local government has an effect on levels of
conflict. Panel A presents the estimation of just the plain difference-in-difference
estimation. Throughout the majority of estimated coefficients indicate that having
an elected local government is associated with less conflict. The results indicate
that conflict incidence is around 50% lower during time-periods when local gov-
ernments are elected as opposed to appointed.
Panel B studies a heterogeneous effect version, using the measure of ethnic
exclusion. As expected, the reduction in conflict is mostly driven by places that
would see a significant share of the local population excluded from political power,
when appointments are made based on the ethnicity of the state governor. This
suggests that more cohesive institutions, which elections seem to generate, are
associated with distinctly lower levels of conflict.
We next turn to study how resource rents and our implicit measure of the de-
gree of cohesion interact. These results are presented in Table 6. In Panel A, we
document that indeed during periods when local governments are appointed, vi-
olence is concentrated in areas with a significant sized population excluded from
political power. In Panel B, we study how this relationship changes when expand-
ing the sample to include periods when local governments are elected, adding the
relevant interaction terms. The results demonstrate that the exclusion of ethnic
groups during periods when local governments are appointed is driving the link
between exogenous resource revenue shocks and conflict. This result is compelling
27
as it illustrates the important role local elections may play in forming cohesive gov-
ernments at the local level. It suggests that elected local governments are able to
resolve contests over the allocation of resources in a peaceful manner.
We thus find ample evidence that the transition towards having elected local
governments is systematically associated with changing conflict dynamics. The
differential degrees of cohesion that the two distinct institutional setups (appointed
versus elected) generate are at the heart of understanding political violence. While
the level effect may be subject to some debate regarding potential excludability, we
think we have a convincing case about the exogeneity of the interaction terms we
study. Lastly, we turn again to micro-survey data to substantiate these conclusions.
5.5 Are elected local councils perceived to handle resources dif-
ferently?The results so far suggest that political violence ceases to be associated with
resource rents during periods when local governments are elected. We provided
evidence suggesting that this is substantively driven by the systematic exclusion of
ethnic groups from political power when local governments are appointed. This
suggests that elected (as opposed to appointed) local governments are perceived to
be managing resources very differentially.
We investigate whether having elected local governments improves perceptions
of the quality of local governance. This directly maps into the previous analysis:
does the perception of quality, corruption and distrust in government evolve in a
fashion correlated with inflow of rents? As before we use consecutive rounds of the
Afrobarometer survey data measuring how the relationship between the approval
of local governments, the extent of trust and the perception of corruption change
as a function of rents.
The results are presented in Table 7. Columns (1) and (2) suggest that resource
rents are associated with negative perceptions of local governments during periods
when local governments are appointed. Having elected local governments signif-
icantly weakens this link. In columns (3) and (4) we perform a similar exercise
studying the perception of corruption: resource rents are associated with increased
perception of corruption, yet, only when local governments are appointed. Lastly,
28
in columns (5) and (6) we show that when local governments are appointed, re-
source rents are associated with lower levels of trust. Again this relationship is
significantly weaker when local governments are elected, with consistent patterns
throughout.
These results, together with the results presented in Table 6, suggest that elected
local governments are capable of resolving the contest for resource rents in an insti-
tutional form within the local government, and not invoking violence. The change
in the relationship between resource rents and improved approval and trust of
people in the local government suggests that electoral incentives may improve the
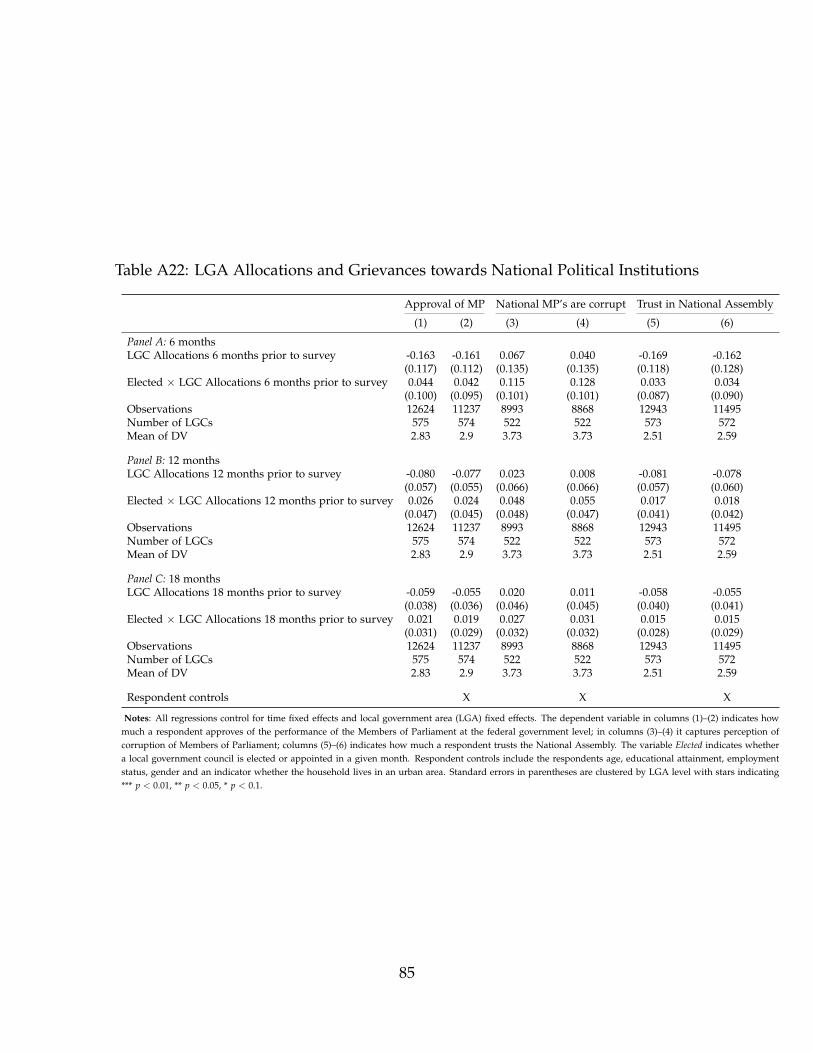
quality of resource management and sharing. We highlight with a type of placebo
exercise that these results are specific to the perception of the quality of local gov-
ernments and are not confounded by concurrent changes in the perceptions of
quality of government at other levels of government. Leveraging the fact that sim-
ilar measures of the perceptions of the quality governance are collected for the
Federal Parliament and State level institutions, we show in Appendix Table A22
and A23 that there are no similar patterns between resource rents, election status
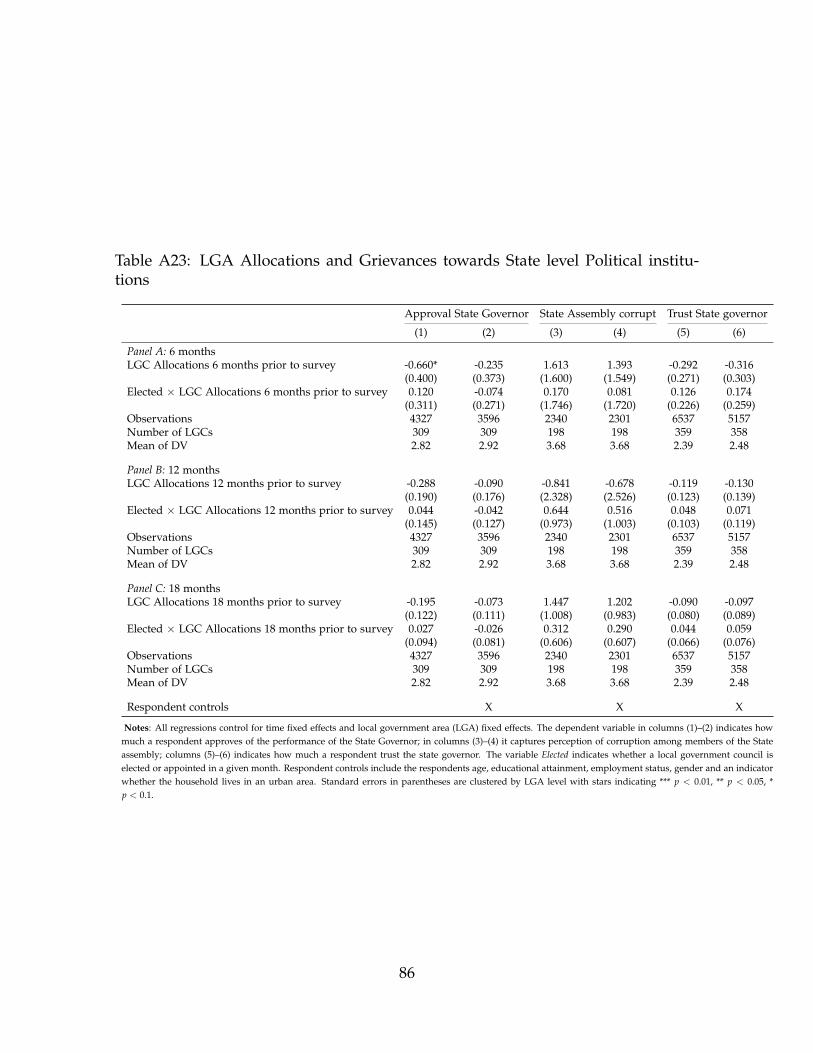
of local governments and perceptions of federal or state level institutions.
6 ConclusionWhether scarce resources are allocated in a concordant and peaceful manner or
invoke coercion and violence is an important question that guides a lot of political
economy research. This contributes to our understanding of how a particular type
of democratic institution – elected local governments – can shape and moderate
the interactions between groups in a peaceful fashion. This question is particularly
relevant to countries with significant resource wealth, such as Nigeria, as demo-
cratic oversight and a tight institutional framework are proposed to be critical for
ensuring that countries are not cursed by their resource wealth. While the theo-
retical work has suggested the importance of institutions, empirical research into
these questions has struggled to provide compelling evidence.
Exploiting within-country variation in democratic institutions at the local level
in Nigeria, we show that having an elected local government is key to explaining
why resource rents are associated with conflict in some places but not in others.
29
In doing so, we are able to exploit institutional features that significantly relax
identification concerns, while at the same time matching key tenets of theoretical
models. In particular, we exploit the sharing of natural resource revenues across
tiers of government according to a fixed formula, which ensures that we can rule
out any direct effects that the extraction activity can have on political violence.
Rather, we can focus exclusively on the impact of these rents and document that,
when local governments are appointed, rents are associated with instability and
political violence. We show, consistent with the theory, that the underlying mech-
anism is working through the different degrees of cohesion that the two means of
selection of local governments provide. The more disconnected local governments
are from the local population – proxied by the ethnic make-up – the more likely it
is that a positive shock to resource rents is associated with political violence. We
confirm these findings in a rich empirical framework, and substantiate and validate
our findings using individual level micro survey data.
ReferencesAcemoglu, D., S. Naidu, P. Restrepo, and J. Robinson (2014). Democracy Does
Cause Growth. forthcoming, Journal of Political Economy 14-09, 80.
Acemoglu, D. and J. A. Robinson (2012). Why Nations Fail: the Origins of Power,Prosperity, and Poverty (1st ed.), Volume 20. New York: Crown Business.
Alesina, A., S. Michalopoulos, and E. Papaioannou (2016). Ethnic Inequality. Journalof Political Economy 124(2), 428–488.
Andersen, J. J., F. M. Nordvik, and A. Tesei (2017). Oil and civil conflict: On andoff (shore).
Arezki, R., T. Gylfason, and A. Sy (2011). Beyond the curse: policies to harness thepower of natural resources (1 ed.). Washington, DC: International Monetary Fund.
Azam, J. (2009). Betting on displacement: Oil, violence, and the switch to civilianrule in Nigeria. TSE Working Paper.
Bazzi, S. and C. Blattman (2014). Economic Shocks and Conflict: Evidence fromCommodity Prices. American Economic Journal: Macroeconomics 6(4), 1–38.
Bazzi, S. and M. Gudgeon (2015). Local Government Proliferation , Diversity, andConflict. Mimeo.
Berman, E. and A. M. Matanock (2015). The Empiricists’ Insurgency. Annual Reviewof Political Science 18(1), 443–464.
30
Berman, N., M. Couttenier, D. Rohner, and M. Thoenig (2017). This Mine is Mine!How Minerals Fuel Conflicts in Africa. American Economic Review 107(6), 1564–1610.
Bertrand, M., R. Burgess, A. Chawla, and G. Xu (2017). The Glittering Prizes :Career Incentives and Bureaucrat Performance. Mimeo.
Besley, T. and T. Persson (2011a). Pillars of prosperity: The political economics of devel-opment clusters. Princeton University Press.
Besley, T. and T. Persson (2011b). The Logic of Political Violence. The QuarterlyJournal of Economics 126(3), 1411–1445.
Blattman, C. and E. Miguel (2010). Civil War. Journal of Economic Literature 48(1),3–57.
Brollo, F., T. Nannicini, R. Perotti, and G. Tabellini (2013). The Political ResourceCurse. American Economic Review 103(5), 1759–1796.
Bruckner, M., A. Ciccone, and A. Tesei (2012). Oil Price Shocks, Income, andDemocracy. Review of Economics and Statistics 94(2), 389–399.
Burgess, R., R. Jedwab, E. Miguel, A. Morjaria, and G. Padro i Miquel (2015). TheValue of Democracy: Evidence from Road Building in Kenya. American EconomicReview 105(6), 1817–1851.
Carreri, M. and O. Dube (2017). Do Natural Resources Influence Who Comes toPower, and How? The Journal of Politics 79(2), 502–518.
Caselli, F., M. Morelli, and D. Rohner (2015). The Geography of Interstate ResourceWars. The Quarterly Journal of Economics 130(1), 267–315.
Caselli, F. and A. Tesei (2016). Resource Windfalls, Political Regimes, and PoliticalStability. Review of Economics and Statistics 98(3), 573–590.
Christensen, D. (2017). Concession Stands: How Mining Investments Incite Protestin Africa. forthcoming, International Organization.
Ciccone, A. (2018). International Commodity Prices and Civil War Outbreak : NewEvidence for Sub-Saharan Africa and Beyond. (October).
Collier, P. and A. Hoeffler (1998). On economic causes of civil war. Oxford EconomicPapers 50(4), 563–573.
Collier, P. and D. Rohner (2008). Democracy, Development, and Conflict. Journal ofthe European Economic Association 6(2-3), 531–540.
Collier, P. and P. C. Vicente (2014). Votes and violence: Evidence from a fieldexperiment in Nigeria. Economic Journal 124(574), 327–355.
Cust, J. F. and D. Mihalyi (2017). Evidence for a presource curse ? oil discoveries,elevated expectations, and growth disappointments. Mimeo.
31
Dube, O. and J. F. Vargas (2013). Commodity Price Shocks and Civil Conflict:Evidence from Colombia. The Review of Economic Studies 80(4), 1384–1421.
Eifert, B., E. Miguel, D. N. Posner, and W. Blackwell (2010). Political Competitionand Ethnic Identification in Africa Citation Terms of Use. American Journal ofPolitical Science 542(89), 494–510.
Ekpo, A. H. and A. Englama (2008). Fiscal federalism in Nigeria: Issues, challengesand agenda for reform. In P. Collier, C. C. Soludo, and C. A. Pattillo (Eds.),Economic Policy Options for a Prosperous Nigeria, pp. 221–243. Springer.
Fearon, J. D. and D. D. Laitin (2003). Ethnicity, Insurgency, and Civil War. AmericanPolitical Science Review 97(01), 75.
Fenske, J. and I. Zurimendi (2017). Oil and ethnic inequality in Nigeria. Journal ofEconomic Growth 22(4), 397–420.
Francois, P., I. Rainer, and F. Trebbi (2015). How Is Power Shared in Africa? Econo-metrica 83(2), 465–503.
Gadenne, L. (2017). Tax Me, but Spend Wisely? Sources of Public Finance andGovernment Accountability. American Economic Journal: Applied Economics 9(1),274–314.
Girard, V., A. Kudebayeva, and G. Toews (2018). Oil, Rents and Labor Conflicts:Evidence from Kazakhstan. Mimeo.
Harding, T., R. L. Stefanski, and G. Toews (2017). Boom Goes the Price: Giantresource discoveries and real exchange rate appreciation. Mimeo.
Hodler, R. and P. A. Raschky (2014). Regional Favoritism. The Quarterly Journal ofEconomics 129(2), 995–1033.
Hsiang, S. M. (2013). Visually-Weighted Regression. Working Paper, PrincetonUniversity.
Humphreys, M. (2005). Natural resources, conflict, and conflict resolution: Uncov-ering the mechanisms. Journal of Conflict Resolution 49(4), 508–537.
Kyburz, S. (2017). Local Elections, State Capture, and Development in Nigeria: IsManna from Heaven Devilish? Mimeo.
Long, J. D., A. C. Shaver, and A. L. Wright (2017). The Logic of Insurgent ElectoralViolence. forthcoming, American Economic Review.
Martınez, L. R. (2017). Sources of Revenue and Government Performance: Theoryand Evidence from Colombia. mimeo.
Martinez-Bravo, M., P. Mukherjee, and A. Stegmann (2017). The Non-DemocraticRoots of Elite Capture: Evidence From Soeharto Mayors in Indonesia. Economet-rica 85(6), 1991–2010.
32
Martinez-Bravo, M., G. Padro i Miquel, N. Qian, and Y. Yao (2014). Political Reformin China: The Effect of Local Elections. Journal of Economic Literature.
Morelli, M. and D. Rohner (2015). Resource concentration and civil wars. Journal ofDevelopment Economics 117, 32–47.
Mueller, H. and D. Rohner (2017). Can Power-sharing Foster Peace? Evidence fromNorthern Ireland. CEPR Discussion Paper No. DP12382.
Raleigh, C. and C. Dowd (2015). Armed conflict location and event data project(ACLED) codebook.
Rasul, I. and D. Rogger (2017). Management of Bureaucrats and Public ServiceDelivery: Evidence from the Nigerian Civil Service. Economic Journal.
Ross, M. L. (2015). What Have We Learned about the Resource Curse? AnnualReview of Political Science 18(1), 239–259.
Sachs, J. and A. Warner (1995). Natural resource abundance and economic growth.European Economic Review 3.
Sachs, J. D. and A. M. Warner (1999). The big push, natural resource booms andgrowth. Journal of Development Economics 59(1), 43–76.
Sala-i Martin, X. and A. Subramanian (2013). Addressing the natural resourcecurse: An illustration from Nigeria. Journal of African Economies 22(4), 570–615.
Sanchez de la Sierra, R. (2015). On the Origin of States: Stationary Bandits andTaxation in Eastern Congo. Mimeo.
Sexton, R. (2018). A New Resource Curse: How Externalities and GovernanceShape Social Conflict. ESOC Working Paper.
van der Ploeg, F. (2011). Natural Resources: Curse or Blessing? Journal of EconomicLiterature 49(2), 366–420.
Rohner, D., M. Thoenig, and F. Zilibotti (2013a). Seeds of distrust: conflict inUganda. Journal of Economic Growth 18(3), 217–252.
Rohner, D., M. Thoenig, and F. Zilibotti (2013b). War Signals: A Theory of Trade,Trust, and Conflict. The Review of Economic Studies 80(3), 1114–1147.
Vanden Eynde, O. (2015). Mining Royalties and Incentives for Security Operations:Evidence from India’s Red Corridor. PSE Working Paper.
World Bank (2013). Nigeria Economic Report. pp. 1–38.
33
Figure 1: Formula based oil revenue sharing: Formula index weights, oil price movements and time series variationin statutory local government allocations
Panel A: Index weights Panel B : Overall allocations
FAAC Total Index Weight0.0233 - 0.03000.0301 - 0.03450.0346 - 0.04050.0406 - 0.04980.0499 - 0.0946
0 80 160 240 32040Kilometers
/State border
Notes: Panel A: Total Index Weight for each local government area based on the horizontal revenue sharing formula of 2006. Panel B: Monthly variation in overall revenueallocations made to local governments (right scale), and monthly prices of Brent Crude oil (left scale).
34
Figure 2: Spatial and temporal variation in the elected versus appointed local government area status
Time share w. elected LGC0.23 - 0.490.50 - 0.610.62 - 0.710.72 - 0.830.84 - 1.00
0 80 160 240 32040Kilometers
/State border
Notes: Panel A: Share of months with an elected local government for each local government area in the period 1999 to 2014. Panel B: Monthly time series variation in theshare of local government areas with an elected government council over time.
35
Figure 3: Conflict intensity across Nigeria
0 80 160 240 32040Kilometers
/
Any conflict event01 - 23 - 78 - 128
State border
Notes: The map shows the distribution of conflict events across local government areas in the period 1999 to 2014.Sources: conflict data is from ACLED and administrative boundaries are from Global Administrative Areas (GADM;https://gadm.org/).
Figure 4: Positive and Negative Resource Shocks Under Elected and Appointed Regime
(a): Appointed Local Council (b): Elected Local Council
Notes: The figure presents results from bootstrapped lowess regressions on the residuals of the dependent variable, after having demeaned the data by LGA and state-by-timefixed effects. The method first computes lowess regressions from 1000 bootstrapped samples of the demeaned data. It then calculates density estimates of the predictionsfrom the lowess regressions for several hundred cuts along the y-axis and distributes a specified color proportional to that density estimate. The resulting figure displays theuncertainty in the regressions visually. The median value of the bootstrapped lowess predictions is indicated as a solid white line, while OLS regressions are indicated as agreen line. Figure (a) presents the results for periods with appointed local councils, while Figure (b) displays the results for periods with elected local councils.
Notes: All regressions control for state by time fixed effects and local government area (LGA) fixed effects. The dependent variable includes (1) any violent conflict event defined as theuse of force by a group with a political purpose. Type of events include (2) battles defined as violent interactions between two politically organized armed groups; (3) violence involvingcivilians are violent acts by an organized political group against unarmed non-combatants; (4) protests are demonstrations and spontaneous acts of violence by disorganised groups.Columns (5)–(8) include the specific groups involved; (6) political militias are armed agents to influence political processes; (7) communal militias are (ethnic or religious) groups engagedin local political competition; (8) rebels are political organizations to counter an established national government. Columns (9)–(10) present results for the specific dyadic interaction ofactors involved. The main explanatory variable is the monthly revenue allocation to a local government council. The instrumental variable estimation in Panel (B) uses the index weightinteracted with the oil price as instrument. Standard errors in parentheses are adjusted for two way clustering by time and LGA with stars indicating *** p < 0.01, ** p < 0.05, * p < 0.1.
39
Table 3: Resource rents and conflict – moderating effect of having an elected local government
Type of Event Groups involved Between Pol. Militias &...
Notes: All regressions control for state by time fixed effects and local government area (LGA) fixed effects. The dependent variable includes (1) any violent conflict event defined as the use of forceby a group with a political purpose. Type of events include (2) battles defined as violent interactions between two politically organized armed groups; (3) violence involving civilians are violent acts byan organized political group against unarmed non-combatants; (4) protests are demonstrations and spontaneous acts of violence by disorganised groups. Columns (5)–(8) include the specific groupsinvolved; (6) political militias are armed agents to influence political processes; (7) communal militias are (ethnic or religious) groups engaged in local political competition; (8) rebels are politicalorganizations to counter an established national government. Columns (9)–(10) present results for the specific dyadic interaction of actors involved. The main explanatory variable is the monthly revenueallocation to a local government council. The variable Elected indicates whether a local government council is elected or appointed in a given month. The instrumental variable estimation in Panel (B)uses the index weight interacted with the oil price as instrument. Standard errors in parentheses are adjusted for two way clustering by time and LGA with stars indicating *** p < 0.01, ** p < 0.05, *p < 0.1.
40
Table 4: Resource rents, elected (vs appointed) local governments and individuallevel victimization and participation in conflict
Fear of political violence Physically attacked Engage in violence
(0.034) (0.034) (0.013) (0.014) (0.007) (0.009)Observations 4570 4498 13823 12331 6837 5446Number of LGCs 367 367 575 574 359 357Mean of DV .684 .683 .143 .15 .0301 .0272Respondent controls X X X
Notes: All regressions control for time fixed effects and local government area (LGA) fixed effects. The dependent variables in column (1)–(2) indicateshow much a respondent personally fears to become a victim of political intimidation or violence; columns (3)–(4) indicates how often the respondentor someone in the respondent’s family has been physically attacked in the past year; columns (5)–(6) indicates whether how often respondent has usedforce or violence for a political cause. Panel (A) uses the sum of monthly revenue allocations in the last 6 months, Panel (B) in the last 12 months, andPanel (C) in the last 18 months. The variable Elected indicates whether a local government council is elected or appointed in a given month. Respondentcontrols include the respondents age, educational attainment, employment status, gender and an indicator whether the household lives in an urbanarea. Standard errors in parentheses are clustered by LGA level with stars indicating *** p < 0.01, ** p < 0.05, * p < 0.1.
41
Table 5: Inclusion of Ethnic Groups Through Elections and Conflict: Estimation of effect on conflict levels
Type of Event Groups involved Between Pol. Militias &...
Notes: All regressions control for state by time fixed effects and local government area (LGA) fixed effects. The dependent variable includes (1) any violent conflict event defined as the use of forceby a group with a political purpose. Type of events include (2) battles defined as violent interactions between two politically organized armed groups; (3) violence involving civilians are violent acts byan organized political group against unarmed non-combatants; (4) protests are demonstrations and spontaneous acts of violence by disorganised groups. Columns (5)–(8) include the specific groupsinvolved; (6) political militias are armed agents to influence political processes; (7) communal militias are (ethnic or religious) groups engaged in local political competition; (8) rebels are politicalorganizations to counter an established national government. Columns (9)–(10) present results for the specific dyadic interaction of actors involved. The main explanatory variable Elected indicates whethera local government council is elected or appointed in a given month. The variable Non-aligned ethnic group measures the population share that is of a different ethnic group than the state governor.Standard errors in parentheses are adjusted for two way clustering by time and LGA with stars indicating *** p < 0.01, ** p < 0.05, * p < 0.1.
42
Table 6: Inclusion of Ethnic Groups Through Elections and Conflict: Triple Difference-in-Differences with AllocatedRents
Type of Event Groups involved Between Pol. Militias &...
Notes: All regressions control for time fixed effects. Panel A is estimated off the sample with appointed local governments and includes LGA fixed effects, while Panel B includes the periods with elected local governmentsand a separate set of LGA fixed effects for periods in which governments are elected. The dependent variable includes (1) any violent conflict event defined as the use of force by a group with a political purpose. Type ofevents include (2) battles defined as violent interactions between two politically organized armed groups; (3) violence involving civilians are violent acts by an organized political group against unarmed non-combatants; (4)protests are demonstrations and spontaneous acts of violence by disorganised groups. Columns (5)–(8) include the specific groups involved; (6) political militias are armed agents to influence political processes; (7) communalmilitias are (ethnic or religious) groups engaged in local political competition; (8) rebels are political organizations to counter an established national government. Columns (9)–(10) present results for the specific dyadicinteraction of actors involved. The variable Elected indicates whether a local government council is elected or appointed in a given month. The variable Non-aligned ethnic group measures the population share that is of a differentethnic group than the state governor. LGC Allocations captures the monthly revenue allocation to a local government council. Standard errors in parentheses are adjusted for two way clustering by time and LGA with starsindicating *** p < 0.01, ** p < 0.05, * p < 0.1.
43
Table 7: Individual Level Perception of Local Governance
Approval of LGC Council LGC Councillors corrupt Trust in LGC
(0.031) (0.030) (0.031) (0.031) (0.026) (0.026)Observations 12670 11284 9032 8902 13054 11614Number of LGCs 573 572 522 522 575 574Mean of DV 2.84 2.9 3.77 3.78 2.51 2.58
Respondent controls X X X
Notes: All regressions control for time fixed effects and local government area (LGA) fixed effects. The dependent variable in columns (1)–(2) indicateshow much a respondent approves of the performance of the local government councillor (4-point Likert scale); in columns (3)–(4) it captures how many ofthe local councillors a respondent thinks are involved in corruption; columns (5)–(6) indicates how much a respondent trusts the local government council(4-point Likert scale). Panel (A) uses the sum of monthly revenue allocations in the last 6 months, Panel (B) in the last 12 months, and Panel (C) in thelast 18 months. The variable Elected indicates whether a local government council is elected or appointed in a given month. Respondent controls includethe respondents age, educational attainment, employment status, gender and an indicator whether the household lives in an urban area. Standard errors inparentheses are clustered by LGA level with stars indicating *** p < 0.01, ** p < 0.05, * p < 0.1.
44
Appendix to “Cohesive Institutions andPolitical Violence”
For Online Publication
Thiemo Fetzer Stephan Kyburz
February 1, 2019
Section A provides a more detailed discussion of the institutional context in
Nigeria. Section B provides additional figures and tables.
A Extended Discussion of Institutional BackgroundIn this section, we describe the institutional context in further detail. First, we
explain what the main characteristics of Nigerian fiscal federalism are and how
local and state governments are mainly funded by oil revenues. Second, we de-
scribe the role of local government council elections and how we use Nigerian
news media to collect data on the conduct of local elections and the appointment
of caretaker committees by state governors. Third, we describe the geo-referenced
data employed to measure violent events and how different local political regimes
may be associated with conflict.
A.1 Fiscal federalism, oil revenues and local government financeNigeria exhibits a system of fiscal federalism with rules defined in the Nigerian
Constitution (Federal Republic of Nigeria, 1999). The largest part of tax revenues
are paid into a centrally managed Consolidated Revenue Fund of the Federation,
the Federation Account. This federation account is mostly alimented from tax
revenue on oil and value-added tax (VAT). Oil tax revenues comprise a major part
of overall tax revenues, and are fundamental for public finances at all government
levels; e.g. in the year 2013, they amounted to 75% of budgetary revenues (World
Bank, 2013). The centrally collected tax revenues are then allocated to the 3 tiers of
government, the federal government, the states and the local government councils
according to a specific allocation formula by the Federation Account Allocation
Committee (FAAC) under the auspices of the Revenue Mobilisation Allocation and
45
Fiscal Commission according to the Constitution of the Federal Republic of Nigeria
(1999).1
Under the 1999 constitution, at least 13% percent of oil revenues must directly
flow back to the oil-producing states to account for their status as the source of
revenues. This rule is known as the derivation principle (Federal Republic of Nige-
ria, 1999).2 Subsequently, the collected tax revenues are divided by a vertical and
horizontal allocation formula. The vertical allocation formula states that 52.68 per-
cent of revenue allocations are disbursed to the federal government, 26.72 percent
to the state governments and the FCT (Abuja), and 20.60 percent to the local gov-
ernments. The share of revenues that accrues to the state and local government
councils, is then further divided according to a horizontal allocation formula that
makes allowance for geographic and socio-economic characteristics of the respec-
tive administrative unit. These geographic and socio-economic indicators of the
formula are (i) equality 40%; (ii) population 30%; (iii) internal revenue generation
Effort 10%; (iv) landmass and terrain 10%; (v) education 4%; (vi) health 3% (pri-
mary school enrolment); (vii) water supply 3% (rainfall).3 Panel (A) in Figure 1
presents a map representing the revenue allocation index weight for each of the
774 local government areas. Table 1 presents descriptive statistics for the various
demographic and socio-economic characteristics comprising the allocation index
weights calculated for each local government by the FAAC. Population and land-
mass are by far the most important factors when it comes to explaining the cross
1The Revenue Mobilisation Allocation and Fiscal Commission is comprised of a chairman andone member from each state and the Federal Capital Territory, Abuja. The Federation AccountAllocation Committee is constituted of the Federal Minister of Finance, representatives of each state(usually the states’ commissioners of Finance and their accountants-general), and representativesfrom fiscal and monetary related federal agencies such as the Central Bank, and the Customs andFederal Inland Revenue Services (Maystadt and Salihu, 2015).
2The states benefiting from the derivation principle are Abia, Akwa Ibom, Bayelsa, Cross River,Delta, Edo, Imo, Ondo, and Rivers. Anambra recently also became an oil producing state, yet theyhaven’t benefited from the derivation principle during our study period.
3The landmass and terrain factor is further equally divided into one constant part for all localgovernment areas according to terrain conditions in the state (50% of 10%), and a second partmeasuring the size of the landmass of each local government area (50% of 10%). The internalrevenue generation effort is further divided into one part applying to each local government councilin each state equally (75% of 10%), and one part depending on the individual revenue effort of eachlocal government council (25% of 10%). The water supply factor is further equally divided intoan equality part applying to all local government councils equally in each state (50% of 3%), andterritorial spread of rainfall depending on each local government area’s rainfall (50% of 3%).
46
sectional variation in the overall index. On the other hand, factors such as Equality,
Terrain and Rainfall share do not vary across the country.
Data on monthly allocations and the index weights are published by the FAAC
of the Federal Ministry of Finance. We assemble the monthly allocation data to a
balanced panel including all 774 local government areas for the period June 1999
to July 2014.4 The information on the monthly allocations is communicated by the
Accountant-General of the Federation in Abuja each month.
Oil revenues that aliment the Federation Account depend both on the price
of crude oil and the magnitude of oil production. We hence obtain data on the
crude oil price from Thomson Reuters5 and monthly oil product data from Nige-
rian National Petroleum Corporation. The relevant variable to drive the variation
behind changes in monthly allocations to local government areas appears to be the
oil price, and not the production quantity. Table A2 in the appendix highlights
that the amount of variation in the monthly levels of oil production is significantly
smaller compared to the variation in monthly oil prices. Monthly Nigerian crude
oil production varies around a mean of 2.32 million barrels with a standard devia-
tion of 0.17 million barrels, while monthly oil prices vary around a mean monthly
price of USD 64.21 with a standard deviation of USD 34.97, suggesting that the
bulk of the variation in allocations is due to price variation. This is relevant to the
extent that prevailing world oil prices are unaffected by Nigerian oil production.
In our empirical analysis, we investigate whether oil producing states are af-
fected differently by violence compared to non-oil states. We hence collect data on
the location of oil and gas fields from the Nigerian National Petroleum Corpora-
tion (NNPC) across Nigeria. We construct a dummy that is equal to 1 in case a
local government area is intersecting an oil field. This measure includes not only
producing oil fields, but also fields that are under exploration. In total 63 local
government areas do have an oil or gas field. Additionally, we also create an indi-
cator variable to mark states as oil producing. As discussed in the paper, Appendix
Table A9 demonstrates that violence in oil-producing areas – as in the rest of the
country – appears to be driven by the statutory allocations to the local government
4The data was available on www.faac.gov.ng in April 2015. The website is currently not online(August 2017).
5We use the Brent Crude Oil Price extracted from Thomson Reuters Datastream.
47
councils.
Statutory and extraordinary allocations Federal allocations of oil revenues can
be roughly divided into two categories of disbursements. Statutory allocations are
calculated based on a benchmark price of oil determined at the beginning of each
year and are regularly disbursed each month. Extraordinary allocations are disbursed
irregularly and are based on idiosyncratic political decisions. Such augmented
allocations originate from the Excess Crude Account (ECA). The ECA was established
2004 in order to collect resource revenues that accrue due to the difference between
the yearly benchmark oil price and the actual market price. Its objective was to
account for the volatility in crude oil prices to protect planned budgets (Central
Bank of Nigeria, 2012). Essentially, it was set up as a “rainy day fund”.6
The ECA was surrounded by controversies throughout its existence (Central
Bank of Nigeria, 2012). It was subject to the whims of political leaders, which
raised serious concerns about transparency and accountability. It was meant to de-
link government expenditure from oil revenues in order to insulate the Nigerian
economy from external shocks. Due to surging oil prices, the funds collected in the
ECA increased almost fourfold from $ 5.1 billion to over $ 20 billion by Novem-
ber 2008. Due to budget deficits at all government level as a consequence of the
financial crisis and falling oil prices, the ECA decreased to less than $ 4 billion in
2010. The augmentation payments to the three tiers of government from the ECA
are rather unexpected as they are due to unexpected changes in oil prices.
A large part of accumulated funds was depleted in the year 2009, when in
February the state governors asked for the sharing of $ 4 billion from the account.
The newspaper Leadership reported that the Conference of Nigerian Political Parties
(CNPP) to make public the actual use of $ 130 billion accruing to the ECA since
2000.
In the year 2009, there was a $ 2 billion stimulus package paid out to the three
tiers of government. The federal government received $842, the 36 states received $
799.648 million while the 774 local government councils got the balance of $ 358.4
6In 2010, Nigeria’s National Economic Council approved the creation of a national sovereignwealth fund to replace the Excess Crude Account. The establishment of the Nigeria SovereignInvestment Authority was signed into law on 25 May, 2011 (Nigeria Sovereign Investment Autor-ity, 2015). The wealth fund operates three separate funds, the Stabilisation Fund (SF), the FutureGenerations Fund (FGF), and the Nigeria Infrastructure Fund (NIF).
48
million. The state with the largest amount paid out was Rivers with $ 108.7 mil-
lion, while the state with the smallest amount received was Ebonyi with $ 10.4
million (Daily Trust, 19 October 2009). Vanguard (2 April, 2009) reports that Presi-
dent Yar Adua succumbed to the pressure of state governors to deplete the ECA.
So it became a additional source of extra money for the three tiers of government.
Local government responsibilities According to the constitution (Federal Repub-
lic of Nigeria, 1999), economic planning and development is in joint responsibility
of state and local government councils. The constitution instructs local govern-
ments to form an economic planning board. While the local governments appear
to be a tier of government that are an executing body for the state governments,
they have indeed substantial autonomy. Most important, they are responsible to
provide primary education and primary health care services.7 Local governments
should build and maintain the physical infrastructure of primary health centres,
payment of all staff salaries and ensuring the centres sufficient stock of medicines
and other resources. With regard to education, local governments bear the respon-
sibility to execute government education policies and to run primary schools on
a daily basis (for further details see Albin-Lackey, 2007). Further responsibilities
include such diverse tasks as the provision of adult and vocational education, and
the development of agriculture and natural resources (other than the exploitation).8
Overall, the local governments play a prominent role in providing public goods that
are important in the citizens everyday life. The absence of a functioning local gov-
ernment may thus create grievances among the local population and lower its trust
in institutions.7According to Khemani (2006), the real responsibility of providing education and health care
services is indeed delegated to local governments, although the constitution puts the task in the jointresponsibility of state and local governments. An informative account of how local government arede-facto responsible for providing education and health care services is given in (Albin-Lackey,2007), in 5 case studies of local governments (Etche, Khana, Tai, Akuku/Toru, and Obio/Akpor). AWorld Bank report describes in an insightful way how local governments can outperform other localgovernment areas if the local government council is active and willing to implement progressivepolicies (see World Bank, 2002, p. 46).
8The local government council further makes recommendations to the State commission oneconomic planning on diverse issues such as the construction and maintenance of roads, streets,street lightings, drains, the provision and maintenance of public conveniences, sewage and refusedisposal, the control and regulation of shops, kiosks, restaurants, bakeries, and other places for thesale of food, and the licensing, regulation, and control of the sale of liquor (Federal Republic ofNigeria, 1999).
49
Local government finance management With the transition to democratic rule in
1999, the Nigerian fiscal system was decentralized rapidly. According to a World
Bank report, the share of sub-national budget spending in the consolidated budget
increased from 23% in 1999 to 46% in 2005 (World Bank, 2007). The sub-national
budget expenditure already was almost four times higher in 2005 than in 1999 in
real terms, while the expenditure at the local level in fact grew even faster than
at the state level, so that sub-national budget systems have become more decen-
tralized. This followed a stricter implementation of federal allocations than in the
1990s.
The bulk of gross revenues at local level originate from disbursements out of the
federation account. Local governments can raise internally generated revenues as
well. Their ability and the extent to which they do, however, is very limited. Over-
all they raised less than 5% of gross revenues through internally generated means
in the period 2001–2005 (Eboh et al., 2006). This is not surprising as tax powers
available to local governments are limited to minor subjects, such as property tax
and market and trading licences.9 As local governments hence heavily depend on
the allocations of resource revenues from the Federation Account, which heavily
fluctuate with global oil prices, their fiscal situation is highly volatile and unsus-
tainable (World Bank, 2013).
Various reports and newspaper articles describe the mismanagement of public
finances at the local level. Human Rights Watch (HRM, 2007) conducted a detailed
analysis of local government finances in a number of local government areas in
Rivers State, which apparently is a difficult task as local government councils treat
the budgets and financial reports as closely guarded secrets. HRM specifically in-
vestigated how local finances are managed, focusing on expenditures for education
and health care (Albin-Lackey, 2007).
By Rivers State law, the legislative body in each local government is to approve
or vote down annual budgets presented by the chairperson of the LGC. Legisla-
tive councils are also entitled to review the end-of-year expenditure reports that
are submitted by the chair. This check on the chairperson’s handling of local bud-
gets – although theoretically important – ended up being an opportunity for local
councils members to ask for bribes, as a device for self-enrichment, in return for9A full list of tax powers is provided in Ekpo and Englama (2008).
50
passing the budget. Many local councillors see the budget process as the best op-
portunity to claim their share of the allocated revenues. Once the councillors got
their requested share of the pie, the chairmen are left free and unconstrained to
spend the remaining allocations according to their preferences and not accounted
in the budget process (Albin-Lackey, 2007).
Substantial revenues are declared in the local budget process for projects that
are never properly implemented or are even non-existent. One local government
chairman in Rivers State spent huge sums on e.g. a “demonstration fish pond”
that was never operational and payment of more than 100 “functional commit-
tee/protocol officers” whose responsibilities were entirely unclear (Albin-Lackey,
2007). According to the newspaper Daily Champion, in Oshimili local government
area, N 2 million were apparently spent on erosion control, yet there was no visi-
ble sign of such a project. Another example of very poor budget implementation
is Warri South local government, where millions of Naira have been allocated to
landscaping the chairman’s house, construction/renovation of market stalls, the
purchase of generator transformers, the provision of a solar water scheme, the con-
struction of drains/culverts, the maintenance of parks and gardens, the construc-
tion of motor parks in selected towns, and the construction of television viewing
centres. Yet, none of these projects were actually implemented.10 These examples
of the local public finance management provide both an insight into the variety of
projects that are budgeted and the poor implementation in many cases. Although
these are just examples, they represent larger inefficiencies of public finance man-
agement at the local level, as described in detail in (Albin-Lackey, 2007).
The failure to pay salaries, is another example of the poor public finance man-
agement at the local level (Albin-Lackey, 2007, p. 13). It is reported that in LGCs
in Rivers State, salaries for public sector workers are routinely withheld while the
funds that were set aside to pay them disappear. In other local governments, it is
alleged that non-existent workers are on the payroll of local governments, which is
another way for local politicians to siphon away public funds (Albin-Lackey, 2007,
p. 34).
While citizens at the local level observe that local government council mem-
10These accounts of poor public finance management can be in found in the newspaper The DailyChampion, 22 June, 2007.
51
bers enrich themselves, the provision of health care and education is miserable.
According to a civil society organization in Port Harcourt11, the local government
chairs have no objectives other than getting paid to do nothing. Except for pay-
ing salaries, the local governments have ceased to perform any duties assigned to
them. Some local government chairmen apparently do not even reside in their local
governments, but only come back to pay out salaries and to distribute the remain-
der of the monthly allocations as patronage. While there are few positive accounts
of local finance management, the overall assessment is usually rather devastating.
An official of the Federal Economic and Financial Crimes Commission stated: “To
say that [local government] everywhere is a disaster is not a fair assessment, but
it is not far from the truth.” (Albin-Lackey, 2007, p.25). A positive example in the
use of increased local public finances is Tai LGC. According to HRM, Tai LGC used
the allocated revenues to implement numerous projects such as renovating schools,
building new classroom blocks, and constructed 7 new health care centres. The Tai
LGC compiled a list of all projects undertaken and also made it public. Many of
the projects were undertaken at the request of the communities within the local
government (Albin-Lackey, 2007, p.27).
It becomes clear that local governments public finance management is poor, yet
differs in capacity across LGAs. Because of the high volatility in oil prices, the flow
of allocations into local accounts is both hard to predict and opens the floodgates
to misappropriate public funds. This brings us back to the main variation we
use in our empirical framework. As mentioned above and shown in Table A1,
the within-LGA variation in allocations is considerable and driven by global oil
prices (see Table A2). This high volatility makes the processes in public finance
management, such as paying public servants’ salaries or providing public goods,
difficult and non-transparent and calls for strong political factions to appropriate
its share, using force if necessary.
A.2 Violent contest for institutionalized rentsThe poor local governance and mismanagement or outright embezzlement of
public funds possibly creates grievances within the local population. It may even
lead political groups to use force in order to contest for their share of the oil revenue
11Port Harcourt is the capital and largest city in Rivers State.
52
pie. The contest for these institutionalized rents that flow through local and state
governments is a possible cause of low-intensity conflict throughout Nigeria as all
governments are benefiting from the revenue allocations.
Data on civil conflict over the entire sample period is drawn from the Armed
Conflict Location and Event Data Project (ACLED).12 The ACLED project provides
details on geographic locations of conflict events in terms of latitude and longitude,
dates, and additional information on the actors involved. In particular, it codes the
actions of rebels, governments, and militias, allowing an analysis of the local level
factors and the dynamics of civil and communal conflict. The variation in conflict
events across Nigeria that we use in our empirical analysis is displayed in Figure 3,
depicting the number of violent events for each of the 774 local government areas
over the period 1999 to 2014.
Nigeria is in a state of low-intensity conflict. Generally small scale violent events
cause numerous casualties each year. We propose that these kinds conflicts are –
to a large extent – contests between political factions for the control over local gov-
ernments. The control of local government councils brings with it the perks of
the allocations from the Federation Account. While in some local government ar-
eas, the political contest for the institutionalized resource rents may work through
peaceful means, in other cases the contest is likely to be fought with physical in-
timidation and force. In the following, we provide anecdotal evidence for these
low-intensity conflicts across Nigeria.
One case of such low-intensity conflict is reported in the newspaper This Day
about violent incidences in Afikpo and Ivo local governments, Ebonyi State. Several
cases of gross misconduct and malpractice of local government officers triggered
off protest, lead to the destruction of property and the murder of a prominent busi-
nessman, the Divisional Police Officer (DPO) in charge of Ivo local government, and
the vice principal of a secondary school. It finally developed into a “full-blown”
conflict. The newspaper article also suggests that governing politicians should stop
to use state resources and machinery to hound and intimidate perceived opponents
(This Day, 18 September, 2001). The communal conflicts in Ebonyi state continued,
as reported by the newspaper Vanguard in October 2008. The newspaper described
12The ACLED conflict events data is available at https://www.acleddata.com/. Raleigh andDowd (2015) provide a detailed description of variables and coding methodology.
how the upsurge in violence between communities in the state can be traced to the
monthly allocations from the Federation Account (Vanguard, 28 October, 2008).
Further evidence of violence related to public misuse of funds is reported by
Human Rights Watch (2007) for Khana and Etche local governments, Rivers State.
In Khana, political opponents tried to remove the chairman from office, yet failed,
which again created an increased level of violence and insecurity. In 2006, op-
position forces burnt down a part of the new local government secretariat in a
night-time attack. The very public revolt has helped to cast light on the rampant
government malfeasance and its impact on the health and education sectors. The
chairman was accused of having channelled large sums of money into dubious or
non-existent projects, and that he also passed some of that money on to thugs to
enforce his will in Khana (Albin-Lackey, 2007).
In Etche local government, chairman Nwuzi was elected into office in 2004. By
the end of 2005, local government councillors charged him of misappropriating a
large portion of what they called “huge monthly allocations to the council”. Their
grievances were also triggered by the alleged failure to pay salaries and other al-
lowances that were due to them. Councillors also accused the chairman of using
“thugs equipped with dangerous weapons” to intimidate them into abandoning
their request to get their share of the allocations paid into to local governments
account in the first 18 months of the chairman’s office (Albin-Lackey, 2007, p. 64).
According to the report, local councillors were even forced by thugs, also known
as the chairman’s “boys”, to sign loyalty oaths to stop asking for their share of
the accounts. Apparently, the local government chairman Nwuzi had to pay large
amounts of the monthly allocations to his political “godfather”, the Rivers State
Commissioner for Sport who helped him to win office. When the chairman had
to flee after a heated confrontation with local residents over the replacement of an
electrical transformer, he apparently shot wildly into the crowd killing one person
(Albin-Lackey, 2007, p. 65).
Even the Boko Haram conflict is reported to be related to local government mis-
management by local observers. In an opinion article in the Daily Trust, Kaka Bolori
writes how the Boko Haram violence is related to government mismanagement:
If one is to summarize the entire Boko Haram conflict, I can simply say
it is an organized crime between few aggrieved original Boko Haram
54
members and those who are in the helm of affairs of government. In
other words, the conflict is all about fraud, theft and embezzlement
occurring within or against the state, local governments’ finances and
people of Borno. (Daily Trust, 15 December, 2015)
Overall, there is plenty of anecdotal evidence of violence related to the contest
over resource rents disbursed to local governments as monthly allocations from the
Federation Account. Violence is reported to be associated with the misconduct of
local government chairmen and their failure to provide education and health ser-
vices, mismanagement of local public finances such as omission of paying salaries,
or the embezzlement of public funds. The acts of fraud provokes violent reactions
by opposing political groups who want to claim their share of the pie.
A.3 The role of local government electionsCivil violence and riots are often related to elections, be they general elections or
local government elections. Figure A4 in the appendix depicts a surge in violence
around local government council elections. The role of local elections with regard
to civil violence is thus a priori unclear. Local elections may be a trigger event for
violence, when opposition parties perceive that elections are not held in a free and
fair manner and demand a level playing field. The event of a local election may in
this case be an opportunity for political factions to show their strength and support
by the people, using violent means if necessary.13 In this paper we mainly focus
on the systematic violence that is not specifically related to elections, but happens
throughout the term periods of local politicians.
The Nigerian Constitution of 1999 stipulates that local government councils
must be elected by the people (Federal Republic of Nigeria, 1999). Even though
the federal structure of governance includes three tiers of government, the con-
stitution gives the state governments considerable influence over the organization
and regulation of local government councils and holding local elections. The main
13One of the worst violent outbreaks around a local government council election, reportedaround the World, was the clash between members of People’s Democratic Party (PDP) and mem-bers of the All Nigerian Peoples Party (ANPP) over a local election result in Jos city, Plateau state.761 people were killed, schools, churches and mosques burnt to the grounds in the post-electionviolence, as the PDP claimed their victory. The opposition probably realised that a defeat would cutthem off from the allocations for years to come. For further details, see BBC News, 29 November2008.
55
problem with the constitutional provision guaranteeing local elections is that it
treats the local governments not rigorously as an independent tier of government.
In contrast to the Independent National Electoral Commission that supervises
the general elections, State Independent Electoral Commissions are appointed by
the state government. It is the body to organise, undertake, and supervise local
government elections. It consists of a chairman and no less than five but not more
than seven other members (Federal Republic of Nigeria, 1999). Furthermore, the
state governor has to provide the financing for the conduct of local council elections
so that local officials hinge on the intentions and decisions of the governor.
The first post-autocratic local government councils elections were held in Novem-
ber/December 1998 as a preparation of the democratic presidential elections in
February 1999, which marked the transition from military to civilian rule. After
the first term of the initially elected local councils ended in May 2002, confusion
emerged as the national voter register was not updated to possibly hold another
local election. In June 2002, most state governors appointed so-called ‘caretaker’ or
‘transition committees’ to (temporarily) run the local governments. Ever since that
decisive moment in 2002 when caretaker committees were appointed, the election
of local governments became a political controversy.14 In the following years, the
local government councils were in many cases not elected bodies of government
anymore, but appointed bodies in many instances. This created de-facto variation
in local political institutions across Nigeria. While some states, like Cross River
or Enugu, local government council elections have been held (almost) consistently
throughout the period from 2004 to 2014, and hence were more democratic in that
sense, other states like Ondo or Yobe state had appointed caretaker committees for
the larger part of that same period (see Figure 2).
We draw data on the conduct of local government council elections or appoint-
ment of caretaker committees from a media content analysis using Nigerian News-
papers, presented in more detail in Kyburz (2017). Since official information on
local councils is not available, we have to resort on media outlets, to gather a con-
sistent picture about local governance in the 774 local government areas. The news-
14See Kyburz (2017) for a more detailed description of the controversy surrounding local gov-ernment council elections and the appointment of caretaker committees.
56
paper articles are collected in the FACTIVA media data base.15 From local Nigerian
newspaper articles, we extract information on local government council elections.16
By using a series of keywords, it is possible to determine for each of the 774 local
government areas the date when local elections were held, the tenure of elected
councils, and the periods when caretaker committees were appointed.
We use the de-facto variation in the ‘state of democracy’ at the local level to
analyze whether local elections have a pacifying effect on civil violence. We cre-
ate a dummy variable that measures for each month the election status of a local
government, hence whether a local council is elected by the people (Elected = 1) or
appointed as caretaker committee by the state governor (Elected = 0).
ReferencesAlbin-Lackey, C. (2007). Chop Fine: The Human Rights Impact of Local Government
Corruption and Mismanagement in Rivers State, Nigeria, Volume 19. Human Rights
Watch.
Central Bank of Nigeria (2012). The Sovereign Wealth Fund. Understanding Mon-
etary Policy Series 18.
Eboh, E. C., U. Amakom, and M. Oduh (2006). Budget and public expenditure
across Nigerian states. Working Paper.
Ekpo, A. H. and A. Englama (2008). Fiscal federalism in Nigeria: Issues, challenges
and agenda for reform. In P. Collier, C. C. Soludo, and C. A. Pattillo (Eds.),
Economic Policy Options for a Prosperous Nigeria, pp. 221–243. Springer.
Federal Republic of Nigeria (1999). The Constitution of the Federal Republic of
Nigeria.
Khemani, S. (2006). Local government accountability for health service delivery in
Nigeria. Journal of African Economies 15(2), 285–312.
15The FACTIVA media data base is a product by Dow Jones and contains news articles and infor-mation from over 9’000 international, national and regional news publications out of 152 countries,including several Nigerian newspapers.
16Most information is extracted from Nigerian newspapers This Day/All Africa Global Media, DailyChampion/All Africa Global Media, Vanguard/All Africa Global Media, Daily Trust/All Africa Global Media,and Daily Independent/All Africa Global Media.
57
Kyburz, S. (2017). Local Elections, State Capture, and Development in Nigeria: Is
Manna from Heaven Devilish? mimeo.
Maystadt, J.-F. and M. K. Salihu (2015). National or Political Cake? The Political
Economy of Intergovernmental Transfers in Nigeria. Economics Working Paper
Series 2015/030, Lancaster University Management School.
Nigeria Sovereign Investment Autority (2015). Annual Report 2015. Abuja, Nigeria.
Raleigh, C. and C. Dowd (2015). Armed conflict location and event data project
(ACLED) codebook.
World Bank (2002). State and Local Governance in Nigeria.
World Bank (2007). Nigeria – A Fiscal Agenda for Change. Public Expenditure
Management and Financial Accountability Review (PEMFAR) Volume 2, 1–22.
World Bank (2013). Nigeria Economic Report. pp. 1–38.
58
B Additional Tables and Figures
Figure A1: Permutation test on gross statutory allocations and election status
010
2030
kden
sity
hrid
2
-.1 -.05 0 .05 .1x
Notes: Permutation test on the interaction effect between gross statutory allocations and the electedstatus dummy. 100 permutations were constructed by randomly reordering spells of appointed vselected governments at the LGA level. Each model is estimated including state by time and LGAfixed effects. The vertical line indicates the estimate that is obtained with the true data. It is clearthat we can safely reject the null hypothesis with a p-value of less than 0.001.
59
Figure A2: Permutation test on election status dummy across 37 states
05
1015
kden
sity
hrid
2
-.1 -.05 0 .05 .1x
Notes: Permutation test after permuting the election status dummy across the 37 states, thus ignor-ing part of the local variation. 100 permutations were constructed by randomly reordering spellsof appointed vs elected governments at the state level. Each model is estimated including time andLGA fixed effects. The vertical line indicates the estimate that is obtained with the true data. Wecan reject the null hypothesis of no effect with a p-value of 0.05.
60
Figure A3: Conventional test for non-linearities
(a): Appointed Local Council (b): Elected Local Council
Notes: The figures are constructed by demeaning the conflict outcome as well as the Gross Statutory Allocations by the location and time fixed effects, sub-setting the sampleinto two parts: one with elected and one with appointed local governments. The residuals of the allocations are subdivided into quintiles and we then estimate a simplespecification using the quintiles as categorical right hand side measures. The resulting point estimates per quintile are plotted out. The figure displays the effect of LGCGross Statutory Allocations per month on civil conflict by quintile of the shock without (left) and with (right) elected LGC. 90% confidence intervals obtained from clusteringstandard errors two way by time and state are indicated.
61
Figure A4: Conflict around election months
Notes: The figure presents estimated coefficients from a regression with the left hand side being a dummyvariable indicating whether there was any conflict event in an LGA and month. The regression removes LGAfixed effects and time fixed effects prior and then regresses the residualized dependent variable on a set ofdummies capturing the time to the election date. Standard errors are clustered at the LGA level and 10%confidence bands are indicated.
62
Figure A5: Distribution of Ethnic Groups across Nigeria
0 80 160 240 32040Kilometers
/ State border
Local Government Area
Notes: The map shows the distribution of ethnic groups across Nigeria. For each local government area thelargest ethnic group is displayed in a different colour. The largest groups are the Yoruba in light blue (South-West), the Hausa-Fulani in pink (North), and the Igbo/Ibo in yellow (South-East) Sources: own calculationsbased on ethnic information in the Demographic Health Surveys. Administrative boundaries are from GlobalAdministrative Areas (GADM; https://gadm.org/)
(a) Hausa-Fulani (b) MumuyeNotes: Panel A presents population shares for the (a) Ibibio and (b) Oron ethnic groups across local government areasin Akwa Ibom State. Panel B presents population shares for the (a) Hausa-Fulani and (b) Mumuye ethnic groups acrosslocal government areas in Taraba State. Sources: Population shares of ethnic groups across local government areas arecalculated based on respondents’ information on ethnicity and language in 5 Demographic Health Surveys (1990, 2003,2008, 2010, 2013). Administrative boundaries are from Global Administrative Areas (GADM; https://gadm.org/).
Table A1: Within- and between LGA variation in different types of FAACAllocations
Variable Mean Std. Dev. Observations
Total Allocations overall 0.305 0.243 N = 140868between 0.074 n = 774within 0.231 T = 182
Statutory Allocations overall 0.206 0.122 N = 140868between 0.040 n = 774within 0.115 T = 182
Extraordinary Allocations overall 0.056 0.131 N = 140868between 0.011 n = 774within 0.131 T = 182
Notes: The table presents a decomposition of the variation in the Federation AccountAllocation Committee (FAAC) allocations within- and between LGA’s. Statutory Allo-cations are calculated based on a benchmark oil price defined at the beginning of eachyear. Extraordinary Allocations are additional revenue transfers from the Excess CrudeAccount (ECA) based on the same allocation formula defined by the FAAC. These allo-cations are subject to idiosyncratic political decisions. Source: information on monthlyallocations is published by the FAAC.
65
Table A2: Decomposition of Allocations by Type and Oil Price used
Overall Allocations Statutory allocations Extra allocations
(1.406) (1.409) (1.438) (0.392) (0.393) (0.403) (1.157) (1.157) (1.196)LGC FE X X X X X XTime FE X X XR2 .693 .713 .972 .828 .833 .987 .203 .204 .967Observations 140868 140868 140868 140868 140868 140868 140868 140868 140868Number of LGCs 774 774 774 774 774 774 774 774 774Mean of DV .305 .305 .305 .206 .206 .206 .0564 .0564 .0564
Panel B: NG Oil productionTotal index × Monthly Nigerian crude production 1.209*** 1.209*** 1.209*** 0.759*** 0.759*** 0.759*** 0.141 0.141 0.141
(0.329) (0.329) (0.339) (0.131) (0.132) (0.136) (0.183) (0.183) (0.189)LGC FE X X X X X XTime FE X X XR2 .132 .151 .943 .228 .233 .964 .00875 .00917 .959Observations 140868 140868 140868 140868 140868 140868 140868 140868 140868Number of LGCs 774 774 774 774 774 774 774 774 774Mean of DV .305 .305 .305 .206 .206 .206 .0564 .0564 .0564
Notes: All regressions control for state by time fixed effects and local government area (LGA) fixed effects. The dependent variable in columns (1)–(3) is the Overall Allocationdetermined by the horizontal allocation formula (index) for each local government council; in columns (4)–(6) the Statutory Allocations calculated based on a benchmark oilprice set at the beginning of each year; in columns (7)–(9) the Extraordinary Allocations that are additional revenue transfers from the Excess Crude Account (ECA). Theexplanatory variable in Panel (A) is an interaction between the total index weight in the allocation formula times the monthly Brent Crude Oil price; in Panel (B) it is aninteraction between the total index weight times the monthly Nigerian crude oil production. Standard errors in parentheses are adjusted to allow for two-way clustering byLGA level and by time with stars indicating *** p < 0.01, ** p < 0.05, * p < 0.1.
66
Table A3: Robustness of the effect of resource rents on civil conflict without elected LGA’s: Different temporal resolu-tion of the data
Type of Event Groups involved Between Pol. Militias &...
Notes: All regressions control for time fixed effects and local government area (LGA) fixed effects. The dependent variable includes (1) any violent conflict event defined as the useof force by a group with a political purpose. Type of events include (2) battles defined as violent interactions between two politically organized armed groups; (3) violence involvingcivilians are violent acts by an organized political group against unarmed non-combatants; (4) protests are demonstrations and spontaneous acts of violence by disorganised groups.Columns (5)–(8) include the specific groups involved; (6) political militias are armed agents to influence political processes; (7) communal militias are (ethnic or religious) groups engagedin local political competition; (8) rebels are political organizations to counter an established national government. Columns (9)–(10) present results for the specific dyadic interaction ofactors involved. Panel (A) uses an annual resolution of the data, and Panel (B) a quarter yearly resolution. Standard errors in parentheses are adjusted for clustering at the LGA with starsindicating *** p < 0.01, ** p < 0.05, * p < 0.1.
67
Table A4: Robustness of the effect of resource rents on civil conflict without elected LGA’s: Transformations of Depen-dent Variable
Type of Event Groups involved Between Pol. Militias &...
Notes: All regressions control for time fixed effects and local government area (LGA) fixed effects. The dependent variable includes (1) any violent conflict event defined as the use of forceby a group with a political purpose. Type of events include (2) battles defined as violent interactions between two politically organized armed groups; (3) violence involving civilians are violentacts by an organized political group against unarmed non-combatants; (4) protests are demonstrations and spontaneous acts of violence by disorganised groups. Columns (5)–(8) include thespecific groups involved; (6) political militias are armed agents to influence political processes; (7) communal militias are (ethnic or religious) groups engaged in local political competition;(8) rebels are political organizations to counter an established national government. Columns (9)–(10) present results for the specific dyadic interaction of actors involved. Standard errors inparentheses are adjusted for clustering at the LGA with stars indicating *** p < 0.01, ** p < 0.05, * p < 0.1.
68
Table A5: Robustness of effect of resource rents on civil conflict without elected LGA’s: Alternative functional forms toaccount for count data
Type of Event Groups involved Between Pol. Militias &...
Notes: All regressions control for time fixed effects and local government area (LGA) fixed effects. The dependent variables throughout are the count number of eventsper LGA and year for the period covering 1999-2014. The dependent variable includes (1) any violent conflict event defined as the use of force by a group with a politicalpurpose. Type of events include (2) battles defined as violent interactions between two politically organized armed groups; (3) violence involving civilians are violent acts byan organized political group against unarmed non-combatants; (4) protests are demonstrations and spontaneous acts of violence by disorganised groups. Columns (5)–(8)include the specific groups involved; (6) political militias are armed agents to influence political processes; (7) communal militias are (ethnic or religious) groups engaged in localpolitical competition; (8) rebels are political organizations to counter an established national government. Columns (9)–(10) present results for the specific dyadic interaction ofactors involved. Panel (B) applies a Poisson estimation, and Panel (C) a Negative-Binomial estimator (NB). Standard errors in parentheses are adjusted for clustering at the LGAwith stars indicating *** p < 0.01, ** p < 0.05, * p < 0.1.
69
Table A6: Robustness of the effect of resource rents on civil conflict without elected LGA’s: Controlling flexibly forformula inputs
Type of Event Groups involved Between Pol. Militias &...
Notes: All regressions control for state by time fixed effects and local government area (LGA) fixed effects. The dependent variable includes (1) any violent conflict event defined as the use of force by a group witha political purpose. Type of events include (2) battles defined as violent interactions between two politically organized armed groups; (3) violence involving civilians are violent acts by an organized political groupagainst unarmed non-combatants; (4) protests are demonstrations and spontaneous acts of violence by disorganised groups. Columns (5)–(8) include the specific groups involved; (6) political militias are armed agents toinfluence political processes; (7) communal militias are (ethnic or religious) groups engaged in local political competition; (8) rebels are political organizations to counter an established national government. Columns(9)–(10) present results for the specific dyadic interaction of actors involved. Each panel uses specific allocation formula sub-index deciles interacted with time fixed effects. Standard errors in parentheses are adjusted fortwo way clustering by time and LGA with stars indicating *** p < 0.01, ** p < 0.05, * p < 0.1.
70
Table A7: Effect of Resource rents on civil conflict: Alternative conflict data
ACLED UCDP GED GTD
(1) (2) (3) (4) (5) (6) (7)Events Fatalities Non Boko Haram Events Fatalities Events Fatalities
Notes: All regressions control for time fixed effects and local government area (LGA) fixed effects. The dependent variable in columns(1)–(3) is based on the ACLED data; in columns (4)–(5) on the Uppsala Conflict Data Program Geo-referenced Event Data, and incolumns (6)–(7) on the Global Terrorism Database. Columns (1), (4), and (6) indicate any conflict event; columns (2), (5), and (7)indicate the number of fatalities in conflict; column (3) only includes conflict events that are not associated with the Jihadist militantorganization “Boko Haram” in northeastern Nigeria. The explanatory variable captures the monthly revenue allocations to each localgovernment council. Panel (A) reports results for any conflict event, and Panel (B) conflict levels. Standard errors in parentheses areadjusted for clustering at the LGA with stars indicating *** p < 0.01, ** p < 0.05, * p < 0.1.
71
Table A8: LGA Extraordinary Allocations and Conflict
Type of Event Groups involved Between Pol. Militias &...
Notes: All regressions control for state by time fixed effects and local government area (LGA) fixed effects. The dependent variable includes (1) any violent conflict event definedas the use of force by a group with a political purpose. Type of events include (2) battles defined as violent interactions between two politically organized armed groups; (3) violenceinvolving civilians are violent acts by an organized political group against unarmed non-combatants; (4) protests are demonstrations and spontaneous acts of violence by disorganisedgroups. Columns (5)–(8) include the specific groups involved; (6) political militias are armed agents to influence political processes; (7) communal militias are (ethnic or religious)groups engaged in local political competition; (8) rebels are political organizations to counter an established national government. Columns (9)–(10) present results for the specificdyadic interaction of actors involved. The explanatory variable is the extraordinary allocation to each local government council from the Excess Crude Account (ECA) on a monthlybasis. Extraordinary allocations are based on idiosyncratic political decisions. The instrumental variable estimation in Panel (B) uses the index weight interacted with the oil price asinstrument. Standard errors in parentheses are adjusted for two way clustering by time and LGA with stars indicating *** p < 0.01, ** p < 0.05, * p < 0.1.
72
Table A9: Conflict in Oil-Producing States and Oil Fields
Type of Event Groups involved Between pol militias &...
(1) (2) (3) (4) (5) (6) (7) (8) (9) (10)Overall Battle Civilian Violence Protest Military Pol Militia Comm militia Rebels Military Civilians
Notes: All regressions control for time fixed effects, state governor fixed effects and local government area (LGA) fixed effects. The dependent variable includes (1) any violent conflict event defined as the use of force bya group with a political purpose. Type of events include (2) battles defined as violent interactions between two politically organized armed groups; (3) violence involving civilians are violent acts by an organized politicalgroup against unarmed non-combatants; (4) protests are demonstrations and spontaneous acts of violence by disorganised groups. Columns (5)–(8) include the specific groups involved; (6) political militias are armed agentsto influence political processes; (7) communal militias are (ethnic or religious) groups engaged in local political competition; (8) rebels are political organizations to counter an established national government. Columns(9)–(10) present results for the specific dyadic interaction of actors involved. In Panel (A) the monthly statutory allocation are interacted with a dummy variable indicating whether a LGA is in a state that has any oil-producingfacilities; in Panel (B) it is interacted with a dummy variable indicating whether a LGA has any oil field. Standard errors in parentheses are clustered by LGA level with stars indicating *** p < 0.01, ** p < 0.05, * p < 0.1.
73
Table A10: Robustness: Removing election related violence from estimating sample
Type of Event Groups involved Between Pol. Militias &...
Notes: All regressions control for state by time fixed effects and local government area (LGA) fixed effects. The dependent variable includes (1) any violent conflict event defined as the use of force by a group with apolitical purpose. Type of events include (2) battles defined as violent interactions between two politically organized armed groups; (3) violence involving civilians are violent acts by an organized political group againstunarmed non-combatants; (4) protests are demonstrations and spontaneous acts of violence by disorganised groups. Columns (5)–(8) include the specific groups involved; (6) political militias are armed agents to influencepolitical processes; (7) communal militias are (ethnic or religious) groups engaged in local political competition; (8) rebels are political organizations to counter an established national government. Columns (9)–(10)present results for the specific dyadic interaction of actors involved. Panel (A) removes the month when a local council election is held from the sample; Panel (B) removes a three months window from the sample; Panel(C) removes a six months window from the sample. LGC Statutory Allocations the monthly revenue allocation to a local government council. The variable Elected indicates whether a local government council is elected orappointed in a given month. Standard errors in parentheses are adjusted for two way clustering by time and LGA with stars indicating *** p < 0.01, ** p < 0.05, * p < 0.1.
74
Table A11: Variance Decomposition of Local DemocracyDummy
(1) (2) (3) (4)
R-squared .0817 .571 .672 .972
LGC FE X X X XTime FE X XState Governor FE XState x Time FE XObservations 148428 148428 143930 148428Number of LGCs
Notes: Table presents a decomposition of the variation in the elec-tion status dummy variable after controlling for different levels offixed effects.
Table A12: Residual Variation to Hold Local Elections: Allocations and Conflict
Allocations ACLED
(1) (2) (3) (4) (5) (6) (7) (8) (9)
LGC Allocations -0.006 0.046(0.018) (0.078)
LGC Extra Allocations -0.017 -0.050(0.023) (0.086)
Notes: The table presents a series of regressions of the elected status indicator variable (Elected) on the different types of allocations fordifferent periods prior to local elections, and conflict events prior to local elections. The residuals in the Elected variable are calculated aftercontrolling for state by time fixed effects and local government (LGA) fixed effects. Column (9) presents the estimation with all relevantexplanatory variables included. Standard errors in parentheses are adjusted for two way clustering by time and LGA with stars indicating*** p < 0.01, ** p < 0.05, * p < 0.1.
75
Table A13: Residual Variation in Local Elections: Formula Inputs and Ethnicity
Notes: The table presents a series of regressions of the elected status indicator variable (Elected) on two weather indicators in columns (1)–(2), temperature and annual rainfall, on the allocationindex and its sub-indices in columns (3)–(6), on an LGA oil field indicator in column (7), and on three ethnic/religious alignment variables in columns (8)–(10), indicating what share of thepopulation is aligned with the state governor’s ethnicity and religion, respectively. Column (10) includes all covariates. The residuals in the Elected variable are calculated after controlling for stateby time fixed effects and local government (LGA) fixed effects. Standard errors in parentheses are adjusted for two way clustering by time and LGA with stars indicating *** p < 0.01, ** p < 0.05,* p < 0.1.
76
Table A14: Robustness: Controlling for State-Governor Specific LGA Fixed Effects
Type of Event Groups involved Between Pol. Militias &...
Notes: All regressions control for state by time fixed effects and separate LGA fixed effects for each state governor. The dependent variable includes (1) any violent conflict event defined as theuse of force by a group with a political purpose. Type of events include (2) battles defined as violent interactions between two politically organized armed groups; (3) violence involving civilians areviolent acts by an organized political group against unarmed non-combatants; (4) protests are demonstrations and spontaneous acts of violence by disorganised groups. Columns (5)–(8) include thespecific groups involved; (6) political militias are armed agents to influence political processes; (7) communal militias are (ethnic or religious) groups engaged in local political competition; (8) rebelsare political organizations to counter an established national government. Columns (9)–(10) present results for the specific dyadic interaction of actors involved. Panel (A) presents estimation resultsfor periods with an appointed local government council (LGC), and Panel (B) includes periods with an elected LGC. The main explanatory variable is the monthly allocation to a LGC. The variableElected indicates whether a LGC is elected or appointed in a given month. Standard errors in parentheses are adjusted for two way clustering by time and LGA with stars indicating *** p < 0.01, **p < 0.05, * p < 0.1.
77
Table A15: LGA Extraordinary Allocations and Conflict
Type of Event Groups involved Between Pol. Militias &...
Notes: All regressions control for local government area (LGA) fixed effects and state by time fixed effects. The dependent variable includes (1) any violent conflict event defined as the use offorce by a group with a political purpose. Type of events include (2) battles defined as violent interactions between two politically organized armed groups; (3) violence involving civilians areviolent acts by an organized political group against unarmed non-combatants; (4) protests are demonstrations and spontaneous acts of violence by disorganised groups. Columns (5)–(8) includethe specific groups involved; (6) political militias are armed agents to influence political processes; (7) communal militias are (ethnic or religious) groups engaged in local political competition;(8) rebels are political organizations to counter an established national government. Columns (9)–(10) present results for the specific dyadic interaction of actors involved. The variable LGC ExtraAllocations indicates the extraordinary allocations to each local government council from the Excess Crude Account (ECA) on a monthly basis. Extraordinary allocations are based on idiosyncraticpolitical decisions. The variable Elected indicates whether a local government council is elected or appointed in a given month. The instrumental variable estimation in Panel (B) uses the indexweight interacted with the oil price as instrument. Standard errors in parentheses are adjusted for two way clustering by time and LGA with stars indicating *** p < 0.01, ** p < 0.05, * p < 0.1.
78
Table A16: Effect of Resource rents on civil conflict: Alternative conflict data
ACLED UCDP GED GTD
(1) (2) (3) (4) (5) (6) (7)Events Fatalities Non Boko Haram Events Fatalities Events Fatalities
Notes: All regressions control for time fixed effects and local government area (LGA) fixed effects. The dependent variable in columns (1)–(3) isbased on the ACLED data; in columns (4)–(5) on the Uppsala Conflict Data Program Geo-referenced Event Data, and in columns (6)–(7) on the GlobalTerrorism Database. Columns (1), (4), and (6) indicate any conflict event; columns (2), (5), and (7) indicate the number of fatalities in conflict; column(3) only includes conflict events that are not associated with the Jihadist militant organization “Boko Haram” in northeastern Nigeria. The variableLGC Statutory Allocations captures the monthly revenue allocations to each local government council. The variable Elected indicates whether a localgovernment council is elected or appointed in a given month. Panel (A) reports results for any conflict event, and Panel (B) conflict levels. Standarderrors in parentheses are adjusted for clustering at the LGA with stars indicating *** p < 0.01, ** p < 0.05, * p < 0.1.
79
Table A17: Effect of Resource rents on civil conflict: Different transformations of dependent variables
Type of Event Groups involved Between Pol. Militias &...
Notes: All regressions control for time fixed effects and local government area (LGA) fixed effects. The dependent variable includes (1) any violent conflict event defined as the use of force by a groupwith a political purpose. Type of events include (2) battles defined as violent interactions between two politically organized armed groups; (3) violence involving civilians are violent acts by an organizedpolitical group against unarmed non-combatants; (4) protests are demonstrations and spontaneous acts of violence by disorganised groups. Columns (5)–(8) include the specific groups involved; (6) politicalmilitias are armed agents to influence political processes; (7) communal militias are (ethnic or religious) groups engaged in local political competition; (8) rebels are political organizations to counter anestablished national government. Columns (9)–(10) present results for the specific dyadic interaction of actors involved. The variable LGC Statutory Allocations captures the monthly revenue allocations to eachlocal government council. The variable Elected indicates whether a local government council is elected or appointed in a given month. Standard errors in parentheses are adjusted for clustering at the LGAwith stars indicating *** p < 0.01, ** p < 0.05, * p < 0.1.
80
Table A18: Different temporal resolution of the data
Type of Event Groups involved Between Pol. Militias &...
Notes: All regressions control for time fixed effects and local government area (LGA) fixed effects. The dependent variable includes (1) any violent conflict event defined as the use of force by a groupwith a political purpose. Type of events include (2) battles defined as violent interactions between two politically organized armed groups; (3) violence involving civilians are violent acts by an organizedpolitical group against unarmed non-combatants; (4) protests are demonstrations and spontaneous acts of violence by disorganised groups. Columns (5)–(8) include the specific groups involved; (6)political militias are armed agents to influence political processes; (7) communal militias are (ethnic or religious) groups engaged in local political competition; (8) rebels are political organizations tocounter an established national government. Columns (9)–(10) present results for the specific dyadic interaction of actors involved. The variable LGC Statutory Allocations captures the monthly revenueallocations to each local government council. The variable Elected indicates whether a local government council is elected or appointed in a given month. Panel (A) reports results for an annualresolution of the data, Panel (B) for a quarter yearly resolution, and Panel (C) for a monthly resolution. Standard errors in parentheses are adjusted for clustering at the LGA with stars indicating ***p < 0.01, ** p < 0.05, * p < 0.1.
81
Table A19: Effect of Resource rents on civil conflict: Alternative functional forms to account for count data
Type of Event Groups involved Between pol militias &...
(1) (2) (3) (4) (5) (6) (7) (8) (9) (10)Overall Battle Civilian Violence Protest Military Pol Militia Comm militia Rebels Military Civilians
Notes: All regressions control for time fixed effects and local government area (LGA) fixed effects. The dependent variables throughout are the count number of events per LGAand year for the period covering 1999-2014. The dependent variable includes (1) any violent conflict event defined as the use of force by a group with a political purpose. Type ofevents include (2) battles defined as violent interactions between two politically organized armed groups; (3) violence involving civilians are violent acts by an organized political groupagainst unarmed non-combatants; (4) protests are demonstrations and spontaneous acts of violence by disorganised groups. Columns (5)–(8) include the specific groups involved; (6)political militias are armed agents to influence political processes; (7) communal militias are (ethnic or religious) groups engaged in local political competition; (8) rebels are politicalorganizations to counter an established national government. Columns (9)–(10) present results for the specific dyadic interaction of actors involved. The variable LGC Allocations capturesthe monthly revenue allocations to each local government council. The variable Elected indicates whether a local government council is elected or appointed in a given month. Panel (B)employs a Poisson estimation, and Panel (C) a negative-binomial estimation. Standard errors in parentheses are adjusted for clustering at the LGA with stars indicating *** p < 0.01, **p < 0.05, * p < 0.1.
82
Table A20: Robustness: Controlling flexibly for formula inputs
Type of Event Groups involved Between Pol. Militias &...
Panel C: Public Good Access Index Deciles x Time FELGC Statutory Allocations 0.198** 0.109** 0.102** 0.018 0.111** 0.166*** 0.052** -0.014 0.089** 0.112**
Notes: All regressions control for state by time fixed effects and local government area (LGA) fixed effects. The dependent variable includes (1) any violent conflict event defined as the use of force by a group with apolitical purpose. Type of events include (2) battles defined as violent interactions between two politically organized armed groups; (3) violence involving civilians are violent acts by an organized political group againstunarmed non-combatants; (4) protests are demonstrations and spontaneous acts of violence by disorganised groups. Columns (5)–(8) include the specific groups involved; (6) political militias are armed agents to influencepolitical processes; (7) communal militias are (ethnic or religious) groups engaged in local political competition; (8) rebels are political organizations to counter an established national government. Columns (9)–(10)present results for the specific dyadic interaction of actors involved. The variable LGC Allocations captures the monthly revenue allocations to each local government council. The variable Elected indicates whether a localgovernment council is elected or appointed in a given month. Panels (A)–(E) control flexibly for the various allocation formula sub-indices defined by the Federation Account Allocation Committee. Standard errors inparentheses are adjusted for two way clustering by time and LGA with stars indicating *** p < 0.01, ** p < 0.05, * p < 0.1.
83
Table A21: Validation of measure of exclusion of ethnic groups
Alignment with ethnic group of state governor
(1) (2) (3) (4)
Panel A: Own ethnic group treated unfairly (dummy)Person not aligned with governor’s ethnicity 0.046*** 0.034** 0.042*** 0.026*
(0.012) (0.014) (0.013) (0.015)Observations 15980 15980 15978 15978Number of LGCs 579 579 577 577Mean of DV .803 .803 .803 .803
Panel B: Own ethnic group treated unfairlyPerson not aligned with governor’s ethnicity 0.117*** 0.086*** 0.085*** 0.045
(0.029) (0.033) (0.032) (0.038)Observations 15980 15980 15978 15978Number of LGCs 579 579 577 577Mean of DV 3.32 3.32 3.32 3.32
State FE X XLGA FE X XTime FE X X
Notes: The explanatory variable measures whether a respondent perceives the own ethnic group treated unfairly on a 4-point likert scale (Panel A), or at least sometimes (Panel B) to be treated unfairly by the government. The dependent variableindicates whether a respondent is of the same ethnic group as the state governor. Standard errors in parentheses are clusteredby LGA level with stars indicating *** p < 0.01, ** p < 0.05, * p < 0.1.
84
Table A22: LGA Allocations and Grievances towards National Political Institutions
Approval of MP National MP’s are corrupt Trust in National Assembly
(0.031) (0.029) (0.032) (0.032) (0.028) (0.029)Observations 12624 11237 8993 8868 12943 11495Number of LGCs 575 574 522 522 573 572Mean of DV 2.83 2.9 3.73 3.73 2.51 2.59
Respondent controls X X X
Notes: All regressions control for time fixed effects and local government area (LGA) fixed effects. The dependent variable in columns (1)–(2) indicates howmuch a respondent approves of the performance of the Members of Parliament at the federal government level; in columns (3)–(4) it captures perception ofcorruption of Members of Parliament; columns (5)–(6) indicates how much a respondent trusts the National Assembly. The variable Elected indicates whethera local government council is elected or appointed in a given month. Respondent controls include the respondents age, educational attainment, employmentstatus, gender and an indicator whether the household lives in an urban area. Standard errors in parentheses are clustered by LGA level with stars indicating*** p < 0.01, ** p < 0.05, * p < 0.1.
85
Table A23: LGA Allocations and Grievances towards State level Political institu-tions
Approval State Governor State Assembly corrupt Trust State governor
(0.094) (0.081) (0.606) (0.607) (0.066) (0.076)Observations 4327 3596 2340 2301 6537 5157Number of LGCs 309 309 198 198 359 358Mean of DV 2.82 2.92 3.68 3.68 2.39 2.48
Respondent controls X X X
Notes: All regressions control for time fixed effects and local government area (LGA) fixed effects. The dependent variable in columns (1)–(2) indicates howmuch a respondent approves of the performance of the State Governor; in columns (3)–(4) it captures perception of corruption among members of the Stateassembly; columns (5)–(6) indicates how much a respondent trust the state governor. The variable Elected indicates whether a local government council iselected or appointed in a given month. Respondent controls include the respondents age, educational attainment, employment status, gender and an indicatorwhether the household lives in an urban area. Standard errors in parentheses are clustered by LGA level with stars indicating *** p < 0.01, ** p < 0.05, *p < 0.1.