Page 1
THIN-FILM MIXED-METAL MOLECULE-BASED
MAGNETS BY CHEMICAL VAPOR
DEPOSITION
by
Preston Kaj Erickson
A thesis submitted to the faculty of
The University of Utah
in partial fulfillment of the requirements for the degree of
Master of Science
Department of Materials Science and Engineering
University of Utah
December 2011
Page 2
Copyright © Preston Kaj Erickson 2011
All Rights Reserved
Page 3
STATEMENT OF THESIS APPROVAL
The thesis of ____________________________________________________________
has been approved by the following supervisory committee members:
_____________________________________, Chair _____________
_____________________________________, Member _____________
_____________________________________, Member _____________
and by __________________________________________________________, Chair of
the Department of ________________________________________________________
and by Charles A. Wight, Dean of The Graduate School.
Preston Kaj Erickson
Joel S. Miller
Ashutosh Tiwari
Michael Scarpulla
Date Approved
Date Approved
Date Approved
Anil Virkar
Materials Science and Engineering
The University of Utah Graduate School
09/23/11
09/26/11
09/26/11
Page 4
ABSTRACT
A chemical vapor deposition method has been developed for the synthesis of
both Co[TCNE]2 thin-films and VxCo1-x[TCNE]2 thin-films. Both materials have been
previously synthesized by various solution methods. The Co[TCNE]2 thin-films were
characterized by infrared spectroscopy and magnetometer, and were determined to be
identical in structure and magnetic behavior to the analogous solution-prepared samples.
VxCo1-x[TCNE]2, when prepared from solution, showed a composition
dependence of the magnetic properties as well as the infrared characteristics. Higher
cobalt concentrations led to higher coercive fields with respect to V[TCNE]2, which has a
coercive field of ~7 Oe at 5 K. At a composition of V0.3Co0.7[TCNE]2 the coercive field
is ~270 Oe at 5 K. The thin-films of this material showed the same infrared
characteristics, based on composition, as the solution-prepared compounds. There was,
however, no increase in coercive field at any composition, with a maximum coercive
field measured as 10 Oe for a composition of V0.45Co0.55[TCNE]2.
Page 5
Dedicated to my wife, Kristyn, and my son, Bryce, who have been my support and my
sanity through it all.
Page 6
TABLE OF CONTENTS
ABSTRACT.....................................................................................................................
LIST OF FIGURES.........................................................................................................
LIST OF TABLES...........................................................................................................
SYMBOLS AND ABBREVIATIONS.............................................................................
ACKNOWLEDGEMENTS.............................................................................................
Chapters
1 INTRODUCTION............................................................................................ ........
Literature Review......................................................................................................
Project Motivation and Goals...................................................................................
2 SINGLE-METAL TCNE FILMS.............................................................................
Co[TCNE]2...............................................................................................................
V[TCNE]2.................................................................................................................
Conclusions...............................................................................................................
3 MIXED-METAL TCNE FILMS..............................................................................
VxCo1-x[TCNE]2........................................................................................................
Conclusions...............................................................................................................
REFERENCES................................................................................................................
1
1
15
17
17
38
43
46
46
66
67
iii
vi
ix
x
xii
Page 7
LIST OF FIGURES
Figure
1.1. Illustration of different types of magnetic behavior. a) Paramagnetic behavior
where the material has unpaired electrons but no ordered alignment. b)
Ferromagnetic ordering where all spin sites align in the same direction and
parallel to each other. c) Antiferromagnetic ordering where the spin sites align
antiparallel to each other and have equal magnitude. d) Ferrimagnetic
ordering, where spin sites align antiparallel and have unequal
magnitude.............................................................................................................
1.2. A typical magnetic hysteresis loop. The virgin curve rises from the origin to
the saturation magnetization, Ms, but when the applied field is incrementally
taken back to zero the magnetization does not return to zero, but a remnant
magnetization, Mr remains. The applied magnetic field in the opposite
direction required to return the material’s magnetization to zero is called the
coercive field, Hcr.................................................................................................
1.3. Structures of a) 7,7,8,8-tetracyano-p-quinodimethane (TCNQ), b)
decamethylferrocene (FeCp*2), and c) tetracyanoethylene (TCNE)...................
1.4. Hysteresis loops at 5 K for the VxCo1-x[TCNE]2!zCH2Cl2 (0.1 ! x ! 0.9)
solid solutions (x = 0.9, ! ; x = 0.7, ◯ ; x = 0.5, △ ; x = 0.3, ▽ ; x = 0.1,
! ), and physical mixture consisting of V[TCNE]2!zCH2Cl2 and of
Co[TCNE]2!zCH2Cl2 in 1:1 ratio (!). The top left inset shows the physical
mixture data in a smaller scale, and the bottom right inset shows the
coercive field, Hcr, dependence upon x (line is a guide for the eye)....................
1.5. !CN absorption ranges for structurally characterized forms of TCNE.................
1.6. !CN IR spectra of VxCo1-x[TCNE]2!zCH2Cl2 (0 ! x ! 1)......................................
Page
4
6
8
12
14
16
Page 8
2.1. The chemical vapor deposition apparatus for single-metal thin-films.................
2.2. Infrared spectra of Co[TCNE]2 thin-films. Dotted lines are guides for the
eye........................................................................................................................
2.3. Infrared spectra of film 1b exhibiting changes to IR after exposure to air.
Dotted lines are guides for the eye.......................................................................
2.4. Illustration of the formation of the TCNE dimer, C4(CN)8, where two TCNE
radical anions combine to form a stable dimer with no unpaired electrons.........
2.5. Comparison of film 1i with four preparations of what was expected to be
Co[TCNE]2 from solution....................................................................................
2.6. !T(T) for film 1i. The increasing slope of !T at room temperature indicates
the presence of ferromagnetic impurities, in this case unreacted cobalt from
the deposition.......................................................................................................
2.7. Honda plot determination of cobalt impurity concentration in film 1i. The
slope of the line in the high field region (low 1/H) can be used to determine
the parts per million of cobalt in the film............................................................
2.8. !T(T) for film 1i, both uncorrected (solid circles) and corrected for 475 ppm
cobalt impurites (hollow circles). Note how the corrected version now
levels off and is flat at room temperature............................................................
2.9. 1/! vs. T for film 1i, both uncorrected (solid circles) and corrected for 475
ppm cobalt impurites (hollow circles). The corrected version is now linear
and can be extrapolated to its x-intercept according to the Curie-Weiss law......
2.10. The apparatus used to produce V(CO)6...............................................................
2.11. Infrared spectra of both V[TCNE]2 films. Dotted lines are guides for the
eye........................................................................................................................
2.12. M(T) plot of film 2c. Extrapolation of the most linear region before it levels
off (added line) give an estimate for Tc. 275 K is an uncharacteristically low
Tc for V[TCNE]2..................................................................................................
3.1. New tube for the introduction of carbonyls into the deposition zone of the
CVD apparatus.....................................................................................................
19
25
27
29
30
33
35
36
37
40
42
44
47
vii
Page 9
3.2. Cross section of the CVD chamber at the midpoint............................................
3.3. Compositin map of film 3h measured by EDS. Values are fraction of
vanadium, x, in VxCo1-x[TCNE]2.........................................................................
3.4. Photograph of film 3b showing regions of different composition visible with
no magnification..................................................................................................
3.5. Infrared spectra of mixed-metal VxCo1-x[TCNE]2 films. Dotted lines are
guides for the eye.................................................................................................
3.6. Infrared spectra comparison of Co[TCNE]2, V[TCNE]2, and two mixed-
metal VxCo1-x[TCNE]2 films. Dotted lines are guides for the eye......................
3.7. Magnetic data for film 3h. a) !T(T) and b) 1/!(T). The negative x-intercept
in 1/!(T) indicates antiferromagnetic coupling....................................................
3.8. !T(T) data for film 3d. The first measurement (solid circles) shows magnetic
ordering up to ~350 K and a flat !T above Tc. The second measurement
(hollow circles) shows the film’s behavior after exposure to 400 K. Tc has
decreased considerably and the positive slope indicates cobalt impurities
resultant from film decomposition.......................................................................
3.9. Hysteresis data at 5 K for film 3i. a) Hysteresis loop shown to 5 T. b) Zoom
on the coercive field, ~10 Oe...............................................................................
3.10. Hysteresis data at 5 K for film 3b. a) Hysteresis loop shown to 5 T. b)
Zoom on the coercive field, ~180 Oe..................................................................
3.11. Hysteresis data at 5 K for film 3d. a) Hysteresis loop shown to 5 T. b)
Zoom on the coercive field, ~105 Oe..................................................................
53
54
56
57
59
60
62
63
64
65
viii
Page 10
LIST OF TABLES
Table
2.1. Deposition parameters for Co[TCNE]2 films......................................................
2.2. Deposition parameters for V[TCNE]2 films........................................................
3.1. Deposition parameters for VxCo1-x[TCNE]2 films...............................................
3.2. Composition of VxCo1-x[TCNE]2 films measured by EDS..................................
Page
22
41
50
52
Page 11
SYMBOLS AND ABBREVIATIONS
Tc critical temperature
H applied field
Hcr coercive field
Oe Oersted
M magnetization
Mr remnant magnetization
Ms saturation magnetization
TCNE tetracyanoethylene
CVD chemical vapor deposition
z ionic charge
!CN wavenumber of C!N stretch
SCCM standard cubic centimeters per minute
KBr potassium bromide
IR infrared spectroscopy
" magnetic susceptibility
T temperature
# Weiss constant
C Curie constant
Page 12
g Landé factor
S total spin quantum number
CCo concentration of cobalt
m slope
x fraction of V in VxCo1-x[TCNE]2
SEM scanning electron microscope
EDS energy dispersive x-ray spectroscopy
xi
Page 13
ACKNOWLEDGEMENTS
Thanks go to Dr. Joel S. Miller for supervising me in this project, for prodding and
leading as needed, and for helping me develop a strong research and work ethic; Bretni
Kennon, for getting me off to the right start; Amber McConnell and Jack DaSilva, for
their help with magnetic measurements and interpreting magnetic data; Christopher
Kareis, for many discussions on procedure and methodology; Endrit Shurda, for help
with infrared spectroscopy and interpretation; Josh Sussman for assistance with EDS; all
members of Dr. Miller’s research group, for their friendship and support.
Thanks go to Dr. Ashutosh Tiwari and Dr. Michael Scarpulla, for being on my
committee, and for their confidence in me; the Materials Characterization Lab, for
allowing me to use the scanning electron microscope; Nathan Gray and Jason Stoker, for
their friendship and support; the Department of Energy for funding.
Thanks go to my wife, Kristyn, and my son, Bryce, for putting up with me while in
graduate school, and for always being there with support and understanding when things
were hard; to all of my family, for their continued support and for instilling in me a
wonder for the world and a need to continue discovering for all of my life.
Page 14
CHAPTER 1
INTRODUCTION
Magnets are an integral part of modern technology. Advances in research on
magnets and magnetic phenomena drive progress in many technological fields, including
popular consumer-geared products like sound systems and computer data storage. As the
range of products demanding high magnetic performance increases, especially in new and
unexpected environments, there is a need to find novel magnetic materials that can fill
new criteria and excel under diverse conditions. These materials must have comparable
or superior magnetic properties to traditional magnets and should be as easy or easier
(including cost and energy considerations) to manufacture. The following literature
review outlines the origins and principles of magnetism relevant to this thesis, as well as
specific materials and issues leading up to the development and realization of this project.
Literature Review
Magnetism
The phenomenon of magnetism was first observed several millennia ago.1 Only
relatively recently, however, has a fundamental understanding of magnetism and its
behaviors been established due to quantum mechanics. In-depth quantum theories and
Page 15
mathematical models are beyond the scope of this paper,2 but an introduction to a few
basic concepts in magnetism applicable to this project are included.
The essential component to magnetism lies in the spin associated with an unpaired
electron.3 Atoms (and molecules) have energy states, called orbitals, which are occupied
by electrons. Every electron has a specific set of four quantum numbers that is unique
from all other electrons in an atom. One of those numbers is the spin quantum number
with possible values of either +1/2 (spin up) or -1/2 (spin down). For this reason, each
orbital can only accommodate two electrons, one spin up and one spin down. Electrons
fill orbitals from low energy to high energy and will generally fill each with two
electrons. The spins of these two electrons oppose each other with regard to how they
interact with an external magnetic field, and materials with only paired electrons are
termed diamagnetic, meaning they will weakly repel a magnetic field. When there are
unpaired electrons, they interact with and are weakly attracted to an applied magnetic
field. Materials with unpaired electrons are termed paramagnetic.
How these unpaired electrons interact with each other depends on the material.
The first question is whether or not the material will order magnetically, and if it does,
does it exhibit ferromagnetic or antiferromagnetic coupling. Ordering occurs when spins
within the material overcome their random alignment and strongly couple with each
other.3 If the coupling becomes great enough, the sites will more or less all align in the
same direction in a magnetic field, and when this happens, the material is “ordered”
magnetically.
2
Page 16
For materials that do order, there is a temperature called the critical temperature,
Tc, which is the temperature at which the electron spins will align themselves (parallel or
antiparallel) into an ordered system. If a material does order, there are three main types
of magnetic ordering it can display, as shown in Figure 1.1. The first is ferromagnetism,
where all spin sites align themselves parallel to each other and point in the same
direction.
The second is antiferromagnetism, where spin sites align themselves antiparallel
to each other, meaning they point in opposite directions.6 The difference between the two
is that in the ground state, at zero kelvin and in zero applied field, an antiferromagnet
would show no magnetism because the oppositely aligned magnetic moments would
exactly cancel each other, whereas the ferromagnet would show a strong magnetic field
due to the alignment of the spin sites. Above Tc, however, even antiferromagnets display
a magnetic response due to thermal energy and other factors.6
The third type of magnetic ordering is called ferrimagnetism. This occurs when
spin sites align themselves antiparallel as in antiferromagnets, but the magnitude on one
type of spin site is not equivalent to the other, as shown in Figure 1.1. In this case, there
is a larger magnetic moment in one direction than the other, giving it a net magnetic
moment. How a magnetic material orders is important, but equally important is, once
magnetized, how it behaves in an applied magnetic field. Included in this aspect of
magnetic behavior are hysteresis and coercive field, the two most important concepts of
magnetism to this project.
3
Page 17
a) paramagnetic
c) antiferromagnetic
b) ferromagnetic
d) ferrimagnetic
Figure 1.1: Illustration of different types of magnetic behavior. a) Paramagnetic
behavior where the material has unpaired electrons but no ordered alignment. b)
Ferromagnetic ordering where all spin sites align in the same direction and parallel to
each other. c) Antiferromagnetic ordering where the spin sites align antiparallel to each
other and have equal magnitude. d) Ferrimagnetic ordering, where spin sites align
antiparallel and have unequal magnitude.
4
Page 18
Hysteresis and Coercive Field
The coercive field of a magnetic material is the measure of how resistant it is to a
reverse magnetic field that would demagnitize the sample.3 An easy way to visualize the
coercive field is to look at a typical hysteresis loop, shown in Figure 1.2. To create the
hysteresis loop, a sample starts at the origin with no intrinsic magnetization and zero
applied magnetic field. A magnetic field, H, is then incrementally applied and the sample
begins to interact with the field, its electron spins aligning with the applied magnetic field
to magnetize the sample. Ideally, at some point, the sample will reach a saturation point,
Ms, at which there is no more potential for the material to increase in magnetization with
an increased applied field. The applied field is then incrementally reduced back to zero,
and a negative field of equal magnitude to the positive field is applied. It is then reversed
and taken to the maximum positive applied field again to complete the loop. If the
sample displays hysteretic behavior (meaning that it does not return to the origin), there
are two points of interest.
The first is the remnant magnetization, Mr, or how magnetized the sample is when
the applied field returns to zero. Another point is the coercive field, Hcr, measured in
Oersted (Oe). Essentially, when the sample is saturated, it would require a reverse
magnetic field of magnitude equal to the coercive field to return the sample to zero
magnetization. Materials with a high coercive field (>100 Oe) are termed “hard”
magnets and are used in applications demanding a more permanent magnetization, such
as in the hard drive of a computer. Alternatively, materials with a low coercive field (<10
Oe), or “soft” magnets, are used in applications where sensitivity to small magnetic
5
Page 19
Figure 1.2: A typical magnetic hysteresis loop. The virgin curve rises from the origin to
the saturation magnetization, Ms, but when the applied field is incrementally taken back
to zero the magnetization does not return to zero, but a remnant magnetization, Mr
remains. The applied magnetic field in the opposite direction required to return the
material’s magnetization to zero is called the coercive field, Hcr.
Hcr
Mr
Magnetization, M
Applied Field, H
-M
-H
Ms
6
Page 20
changes is important, such as in voltage transformers for AC current, where a higher
coercive field leads to greater energy loss each time the current is reversed. The material
components of a magnet have a big effect on the coercive field, and that is an important
consideration in finding new magnetic materials.
Molecule-Based Magnets
Traditional magnets are made of metals or ceramics. These materials can have
high critical temperatures making them good room-temperature magnets, but they also
require high-temperature processes to make, which are simple but high in energy cost and
often high in material cost as well. It was advantageous to identify new magnetic
materials that could be processed at low temperatures and still exhibit similar properties
to traditional magnetic materials. Furthermore, any new class of materials discovered
with certain properties – magnetic, electrical, etc. – opens the door for new and improved
applications. For these and other reasons, research in new magnetic materials was
started, especially in the realm of organic-based magnets.
The idea that there could be organic-based magnetic materials stemmed from the
discovery of metal-like electrical conductivity in some organic materials.4 One material
in particular provided a breakthrough: [FeIIICp*2][TCNQ] where TCNQ = 7,7,8,8-
tetracyano-p-quinodimethane and Cp* = pentamethylcyclopentadiene (Figures 1.3a and
1.3b, respectively). This material exhibited two magnetically ordered phases, one being
antiferromagnetic in the ground state and ferromagnetic in an applied field, and the other
ferromagnetic in the ground state. Each ion has one unpaired electron. In an attempt to
7
Page 21
N N
N N
N N
N N
Fe
a)
b)
c)
Figure 1.3: Structures of a) 7,7,8,8-tetracyano-p-quinodimethane (TCNQ), b)
decamethylferrocene (FeCp*2), and c) tetracyanoethylene (TCNE).
8
Page 22
stabilize the ferromagnetic state, a molecule similar to, but smaller than, TCNQ was used
in its place. Tetracyanoethylene (TCNE), shown in Figure 1.3c, was identified, resulting
in [FeIIICp*2][TCNE], which showed the desired results, having a ferromagnetic ground
state.5 The only limitation to this new material was its extremely low value of Tc at 4.8
K. These organic-based magnets were novel and it was surprising that they exhibited
magnetic behavior, but to become a viable substitute to traditional magnets in
technological applications, the critical temperature needed to be higher than room
temperature (~300 K).
V[TCNE]2
Different metal atoms were substituted in the structure above which led to the
discovery of [MnIIICp*2]+[TCNE]•– with a Tc of nearly 9 K, at the time a very high Tc for
a molecule-based magnet.6 Knowing that V0(C6H6)2 has a similar electronic structure to
MnIIICp*, Miller and coworkers reacted it with TCNE to hopefully attain a similar or
slightly higher Tc.7 To their surprise, they not only created a molecule-based magnet, but
one that was magnetic at room temperature.
V[TCNE]2 measured a Tc above 350 K, making it a magnet at room temperature.8
The coercive field was measured as 0.2 ± 0.1 Oe at 300 K to 7.8 ± 0.1 Oe at 2 K.9 These
values place V[TCNE]2 as a soft magnet, limiting its potential applications. Further
adding to this compound’s limitations were two facts: (1) it is pyrophoric, meaning it will
combust (or at the very least, decompose) if exposed to oxygen and (2) as prepared from
9
Page 23
dichloromethane (CH2Cl2) the material thermally decomposed around 350 K, making a
determination of the true Tc difficult and any application above 350 K unattainable.9
In response to the thermal degradation of the material, different solvents were
considered in place of CH2Cl2. It was found that some solvents adversely affected the Tc,
lowering it below room temperature.10 Others were shown to thermally stabilize the
material while not affecting Tc. However, this did not eliminate the pyrophoric property
of the material.
A chemical vapor deposition (CVD) technique was developed to produce a thin
film of the material.11 The ability to make V[TCNE]2 directly from precursors in the
vapor phase eliminated the necessity for a solvent altogether and a purer material resulted
with no effects from solvent inclusion in the structure. The film was also found to be
relatively more air stable than the bulk powder samples. To further protect the film from
the deleterious effects of air, a transparent, Parylene polymer coating was devised for the
film that would be relatively impermeable to air but would not affect the magnetic
properties.12 Neither of the above methods (solvent enhancement or thin-film deposition)
solved the issue of V[TCNE]2 being a soft magnet, however.
VxCo1-x[TCNE]2
As a solution to the limitation of having a small coercive field, Miller et al.
proposed the substitution of some of the vanadium in V[TCNE]2 with cobalt, making a
substitutional alloy VxCo1-x[TCNE]2.13 Cobalt(II) ions are known to contribute a large
magnetocrystalline anisotropy, which is a key cause of coercive field, when substituted in
10
Page 24
small amounts for other metallic ions, as in manganese ferrite (MnFe2O4).3 When cobalt
was substituted in small amounts for manganese in this compound in concentrations as
little as Mn0.9Co0.1Fe2O4, the anisotropy constant was changed by an order of magnitude.
This provided adequate justification for the hope that cobalt in V[TCNE]2 would increase
the coercive field. What was found when substituting cobalt in V[TCNE]2 is shown in
Figure 1.4.13 All measurements were taken at 5 K. First, in the upper left-hand corner is
a hysteresis loop for a physical mixture of V[TCNE]2 and Co[TCNE]2. As seen, the
coercive field of this mixture is the same, or close to that of pure V[TCNE]2, indicating
that any effects seen by the addition of cobalt in a substitutional alloy are real and not just
those of a physical mixture. The main body of the plot shows several hysteresis loops
measured for VxCo1-x[TCNE]2 at various compositions of x. Though the graph is
cluttered, it is clearly evident that where any cobalt is present in the compound, the
coercive field far exceeds that of pure V[TCNE]2 or the physical mixture of both.
Further, in the lower right-hand corner of the plot is an inset showing the coercive field
with respect to vanadium concentration, x. The points at x = 1.0 and x = 0.0 were
manually added as a guide for establishing a trend. The effect of cobalt addition on
coercive field reaches a maximum where x = 0.3, with a coercive field of approximately
280 Oe.
Co[TCNE]2
Little had been done as far as Co[TCNE]2 is concerned because it was found to be
paramagnetic with no magnetic ordering.13 One report indicates that a Co[TCNE]2 thin-
11
Page 25
Figure 1.4: Hysteresis loops at 5 K for the VxCo1-x[TCNE]2!zCH2Cl2 (0.1 ! x ! 0.9) solid
solutions (x = 0.9, ! ; x = 0.7, ◯ ; x = 0.5, △ ; x = 0.3, ▽ ; x = 0.1, ! ), and physical
mixture consisting of V[TCNE]2!zCH2Cl2 and of Co[TCNE]2!zCH2Cl2 in 1:1 ratio (!).
The top left inset shows the physical mixture data in a smaller scale, and the bottom right
inset shows the coercive field, Hcr, dependence upon x (line is a guide for the eye).13
12
Page 26
film had been made but no details on the conditions of the experiment were given and no
attempt to explain the data was made.14
Infrared Spectroscopy
TCNE. Much has been done to identify the infrared (IR) characteristics of
TCNE, as the cyanide (C!N) stretch in TCNE (Figure 1.3c) is IR visible and highly
sensitive to structural properties and formal charge.15 The typical absorptions in the IR of
many different structural and ionic forms of TCNE are shown in Figure 1.5. If one
knows the structure and charge of a specific TCNE-containing compound, one should be
able to predict where the peaks will fall in the IR spectrum, and vice-versa. Realistically,
much ambiguity arises due to the fact that the peak intensities and the decision to report
shoulders as well as peaks were matters of preference for the several researchers whose
data are represented in this map.15 Furthermore, if more than one conformation of TCNE
is present in the compound, peaks may overlap or obscure one another, creating more
difficulty in narrowing down specific phases present in the material. However, one major
trend is evident from these data: the average absorption in the cyanide region will fall
into a certain zone, depending on the charge, z, on the [TCNE]z molecule. If the TCNE is
neutral (z = 0), the average absorption will occur above 2210 cm-1; for z = 1-, between
2210 and 2150 cm-1; and for z = 2-, below 2150 cm-1.15 Thus, at the least, the charge on
the TCNE can be determined and can show that TCNE has reacted and been reduced.
VxCo1-x[TCNE]2. Infrared spectroscopy is an important way of characterizing the
mixed films of varying composition. As this region is highly sensitive to structure and
13
Page 27
Figure 1.5: !CN absorption ranges for structurally characterized forms of TCNE.15
14
!CN, cm-1
I. .1 "-ITCNEI'- (18'-) I I
I. • i ITCNEI'- (1'-) IJ 1 ",-IC,(CN), I'- (15, 4) i . • • • I
I. • • i i ITCNEI,'-(14) I
I. • 1 I I c;s~ &1 "ans~,-ITCNEI,'-l13c,d) I
I.. •• • •• i ITCNEI,'-l13a,b) • I
I. ",-rrCNEr- I • •• • I
O"-I~CNEr- (l:T->
I •
• ITCNEr- (n I. I I : T}2-TC~E (27) :
•
•
1'4-TC~EO (19) :
I i • • 1'-~CNE ' ~-1 (18) : I
DO'T~NE <D~,1)
• I ITcNEom 1 1
•
I
Page 28
composition (see above), the differences in vanadium and cobalt concentrations should
reveal subtle differences in the IR. Figure 1.6 shows the composition range from x = 0.0
to x = 1.0 and their accompanying IR spectra.13 Note that the x-axis increases in
wavenumber left-to-right, which is opposite the traditional notation. The most readily
noticeable feature of this plot is the shift in energy of the most intense peak, from 2152
cm-1 in pure V[TCNE]2 to 2171 cm-1 in pure Co[TCNE]2. Other transitions, while
present, are less prevalent and more ambiguous to define.
Project Motivation and Goals
The motivation and goals for this project were two-fold. First, Co[TCNE]2 had
not been fully explored as a thin-film material. Thus, the development and identification
of a reproducible CVD route was sought. Obtaining the IR and magnetic data for these
thin-films was necessary to compare with available bulk material data as well as establish
a base line for future exploration into this material, as current research shows that there
may be magnetically ordered phases or solvent complexes of this material.16
The second, and by far the larger priority of the project, was the deposition and
characterization of films with varied composition of vanadium and cobalt in the form
VxCo1-x[TCNE]2. In powder samples, the addition of cobalt has been shown to increase
the material’s coercive field, and the coercive field appears to be tunable based on the
amount of cobalt in the substitutional alloy. Successful deposition of VxCo1-x[TCNE]2 as
a thin-film would allow the enhanced magnetic properties to be available in a form of the
material that could also be protected from oxygen via a polymeric coating.
15
Page 29
Figure 1.6: !CN IR spectra of VxCo1-x[TCNE]2!zCH2Cl2 (0 ! x ! 1).13
16
Page 30
CHAPTER 2
SINGLE-METAL TCNE FILMS
The procedure for synthesizing V[TCNE]2 thin-films is known.17 Not all
conditions and details are reported in the literature, however, but are recorded in
laboratory notebooks. Supplementary information was received by contacting the
individuals who conducted research on this material. That procedure and the
accompanying apparatus design were adapted to successfully implement deposition of
Co[TCNE]2, and the resultant films have been characterized by infrared spectroscopy as
well as on the magnetometer.
Co[TCNE]2
Experimental
Starting materials. Crude tetracyanoethylene (TCNE) and cobalt carbonyl
(Co2(CO)8) were obtained commercially and required purification by sublimation before
use. The TCNE was sublimed under static vacuum in a water-cooled sublimator at 60 °C.
Sublimation of ~15 g of TCNE took approximately three days to go to completion.
Sublimation removes water and any other contaminants from the TCNE, resulting in clear
crystals (any yellow tint would indicate the continued presence of water and would
Page 31
require a second sublimation) which are then stored in an inert atmosphere to protect
them from future water contamination. The Co2(CO)8 was sublimed in an ice-cooled
sublimator under static vacuum at room temperature for approximately seven hours.
Care was taken to make sure the Co2(CO)8 was not ever exposed to air by sealing the
sublimator under vacuum inside a nitrogen-filled glove box before sublimation.
Furthermore, the seal was not broken until the Co2(CO)8 was collected in the glove box.
The Co2(CO)8 crystals were bright orange, and were stored in a freezer at -20 °C to
prevent them from thermal degradation. The materials were then ready for use in
deposition.
Chemical vapor deposition apparatus. Due to the novelty and small scale of
this project, a unique apparatus was designed and implemented for chemical vapor
deposition (CVD). The glassware was tested rigorously both outside and inside the glove
box in which all depositions would occur to confirm that appropriate vacuum levels, flow
rates, and temperatures were attainable. The final apparatus for depositing single-metal
TCNE films is shown in Figure 2.1.
The glass CVD tube was approximately 20 in long and had a diameter of 1.3 in.
The inside tubes had a diameter of 1 cm and met in the middle with a 0.5 in gap between
them. A resistive heater (Watlow Thinband C/NSTB1G3J1-A12) wrapped around the
outer chamber over the TCNE boat, and a thermocouple (OMEGA Chromel Alumel Type
K) attached to the outside of the glass near this heater monitored and controlled its
temperature via a temperature controller (Red Lion Model T-16 Temperature/Process
Controller). The T-shaped glass holder for the Co2(CO)8 was submerged in a silicon oil
18
Page 32
1)
Flo
w V
alves
7)
Contr
ol
Wir
es
3)
Res
isti
ve
Hea
ter
8)
Ther
moco
uple
s
5)
TC
NE
9)
Subst
rate
12)
To V
acuum
Gau
ge
10)
Subst
rate
Hold
er
11)
Vac
uum
Out
14)
Co (
CO
)2)
N In
22
8
13)
Tem
per
ature
Contr
oll
ers
16)
Pel
tier
Cooli
ng U
nit
15)
Sil
icon O
il B
ath
4)
TC
NE
Boat
6)
Flo
w C
ap
1
2
3 45
6
7
8 91
0
11
127
13
14
8
15
16
1
2
17
17)
Hea
t S
ink a
nd F
an
Fig
ure
2.1
: T
he
chem
ical
vap
or
dep
osi
tion a
ppar
atus
for
single
-met
al t
hin
-fil
ms.
19
Page 33
bath mounted on a Peltier cooling unit, which uses the thermoelectric effect to achieve
adequately low temperatures.18,19 Another thermocouple rested in the silicon oil to
monitor and control that temperature as well. Substrates for film deposition were
mounted in a square glass tube and centered in the deposition chamber for maximum
exposure to the deposited film. A hose was connected to an Edwards E2M5 two-stage
vacuum pump outside the glove box which pulled nitrogen from the box through the
deposition chamber and out the vacuum line. This created both the necessary nitrogen
flow to carry the vapors to the center of the chamber as well as a sufficient vacuum level
inside the chamber with a minimum value of 10 torr. With this equipment set up and
ready inside the glove box, the system was ready for film deposition.
Chemical vapor deposition. TCNE was placed in a small glass boat on the left
side of the chamber, and Co2(CO)8 in a T-shaped glass boat on the right, as shown in
Figure 2.1. The TCNE was heated to 45-55 °C (depending on the run), ensuring
sublimation inside the chamber, and the Co2(CO)8 cooled to 10 °C to maintain an
acceptable rate of sublimation. Nitrogen flow (measured in standard cubic centimeters
per minute, SCCM) carried the sublimed TCNE at 120-150 SCCM and the Co2(CO)8 at
100 SCCM to the center of the tube where they reacted and deposited on the substrates.
At first, microscope slide glass (VWR) was cut into squares roughly 1/8” to a side and
mounted with grease in the square tube substrate holder. Attempts to characterize these
films magnetically failed and led to the conclusion that the glass was too thick and there
was not enough film on them to register a magnetic signal. To correct this issue,
microscope cover slides (VWR micro cover glass) were used in the place of the slides
20
Page 34
themselves. The cover slides (~3/4” to a side) were placed in the substrate holder whole,
and were large enough to not need grease to hold them in place. Potassium bromide
(KBr) plates were used as substrates for infrared spectroscopy characterization in all
films.
The vapor phase reaction of TCNE and Co2(CO)8 should follow the formula:
4TCNE (v) + Co2(CO)8 (v) ! 2Co[TCNE]2 (s) + 8CO(g) (2.1)
A stoichiometric amount of these starting materials was measured out for the first few
films, but the precursors did not sublime at proportional rates to accommodate the
stoichiometry, so when one component was exhausted, the other would still sublime and
could possibly deposit on top of the film as a contaminant. It was determined that the
best method was to interrupt the deposition before either material was exhausted to
maintain the stoichiometry of the film. Thus, there was no need to accurately measure
the starting materials beforehand. Instead, between 50 to 75 mg of Co2(CO)8 and around
100 mg of TCNE were used in the CVD apparatus, which would deposit between 1 and 2
mg of film on the 3/4” glass slide over about four hours of deposition.
The deposition parameters of eight Co[TCNE]2 films are listed in Table 2.1.
Films 1a-f were deposited on the thicker microscope slide glass, whereas films 1g-j were
deposited on cover slide glass in order to provide less noise in magnetic characterization.
Characterization. Infrared spectroscopy data were collected on a Bruker Tensor
37 Infrared Spectrometer, with scans from 400 to 4000 cm-1 (±1 cm-1). KBr was used as
21
Page 35
Film
Notebook
Number
Temperature
of TCNE*
(ºC)
Temperature
of Co2(CO)8*
(ºC)
Flow Rate
over TCNE‡
(SCCM)
Flow Rate
over
Co2(Co)8‡
(SCCM)
1a PKE01-095 55 10 150 100
1b PKE01-097 55 10 150 100
1c PKE01-099 50 10 120 100
1d PKE01-149a 55 10 150 100
1e PKE01-149b 55 10 150 100
1f PKE01-109 50 10 120 100
1g PKE01-111 50 12 120 100
1h PKE01-113 50 10 120 100
1i PKE01-127 45 10 120 100
1j PKE01-139 45 10 120 100
Table 2.1
Deposition parameters for Co[TCNE]2 films.
!"#3 ºC‡ #5 SCCM
22
Page 36
the substrate for all IR measurements. Each film was measured after deposition was
complete. To measure the effect of time and air exposure on the film, one sample (film
1b) was measured multiple times up to a week after deposition, and then exposed to air
and measured several more times.
Magnetic data were collected on a Quantum Design MPMS 5T SQUID
magnetometer. The films deposited on glass, both microscope slides and cover slides,
were used in the magnetic measurements. The film-covered glass slides were packed into
gelatin capsules (glass wool was used with the original microscope slides to prevent them
from moving) during measurements. Measurement of the magnetic susceptibility with
respect to temperature of the films was taken from 5-300 K. Also measured on the
magnetometer for some films was the magnetization versus the applied field, and for only
samples 1i and 1j, magnetic hysteresis.
Results and Discussion
Film deposition. Each deposition situation outlined in Table 2.1 successfully
deposited a film. Neither the run time for the depositions nor the amount of starting
material had any significant effect on the resulting amount of film. As discussed, film
deposition was interrupted before either starting material was exhausted in all films
except for the first two in order to prevent potential contamination by unreacted material.
For films 1a through 1e, with the exception of 1c, the temperature and flow rate on the
TCNE side were set to 55 ºC and 150 SCCM, respectively. In these films, the TCNE
sublimed quickly and moved too fast through the deposition zone. This resulted in some
23
Page 37
deposited film, but incurred a large loss of TCNE, either through the vacuum pump or
deposited along the walls of the deposition tube. For films 1c and 1f-h, the flow rate over
TCNE was decreased to 120 SCCM and the temperature of the TCNE was decreased to
50 ºC. This increased the yield of actual film, and decreased the waste of TCNE, but still
exhibited some waste in the form of excess TCNE. The final two Co[TCNE]2 films, 1i
and 1j, were further cooled to 45 ºC on the TCNE, which effectively eliminated
observable waste while maintaining good yield on the films.
Infrared spectroscopy. The samples deposited on KBr plates were used in
infrared spectroscopy (IR). The IR spectra for all cobalt films except for film 1d, 1e (for
which data is not shown), and 1j (for which no KBr pellet was prepared) are shown in
Figure 2.2. All of the films exhibited similar spectra, with only slight variations in
relative intensities of peaks and shoulders. The key region in the IR for chemistry
involving TCNE is the C!N region as discussed previously, which exhibits characteristic
absorptions based on the different ionic character of TCNE and how it is coordinated to
other atoms.15 All of these absorptions occur in the 2000-2300 cm-1 range and shifts in
these peaks indicate changes in composition and structure.
The IR spectrum of bulk Co[TCNE]2 is shown in Figure 1.6. This IR shows
absorption peaks at 2224 and 2171 cm-1, as well as a shoulder at 2112 cm-1. The spectra
of the cobalt films in Figure 2.2 show sharp absorption peaks at 2225 and 2172 cm-1, with
a shoulder at about 2110 cm-1. Thus, the data from these thin-films match data from the
bulk samples that have been reported.
24
Page 38
Wavenumber, cm-1
Tra
nsm
itta
nce
(ar
bit
rary
)
1a1b
1c
1f
1h
1g
1i
2041
2110
2173
2225
Figure 2.2: Infrared spectra of Co[TCNE]2 thin-films. Dotted lines are guides for the
eye.
25
Page 39
A study was also done on how the film held up after time and when exposed to air.
An IR spectrum was taken of film 1b incrementally for nine days after deposition, and
then for two days after exposure to air. The key region with the effects of time and air on
the film are displayed in Figure 2.3. After nine days, the spectra show no noticeable
differences. After just two hours in air, however, the shoulder located at about 2110 cm-1
began to disappear. Furthermore, the two major peaks shifted slightly as can be seen in
Figure 2.3. The absorptions shifted from 2225 and 2172 cm-1 to 2222 and 2177 cm-1,
respectively. Although not a very large shift in values, this shift, along with the
disappearance of the shoulder, indicates the beginning of a change in the film due to
decomposition, or perhaps a slight shift in the structure of the film.
Co[C4(CN)8]. Co[TCNE]2 from solution is reported as paramagnetic with no
magnetic ordering, but with cobalt’s ability to increase coercive field in a material and a
similarly composed V[TCNE]2 material exhibiting room temperature magnetism, it stood
to reason to investigate further into why this material showed only paramagnetic
behavior.
Recent research has shown that several different routes can be employed to
synthesize what should result in bulk Co[TCNE]2 from solution.16 The first is the
reaction of Co2(CO)8 in a dichloromethane (CH2Cl2) solution with TCNE, the most
analogous route to the vapor phase CVD reaction of the same components. The second is
the reaction of cobalt thiocyanate [Co(NCS)2] and tetrabutylammonium tetracyanoetylene
(NBu4TCNE), also in acetone (OCMe2). The third is the reaction of
26
Page 40
Wavenumber, cm-1
Tra
nsm
itta
nce
(ar
bit
rary
)
After Deposition
After 9 Days
After 2 hrs in Air
2110
2172
2225
Figure 2.3: Infrared spectra of film 1b exhibiting changes to IR after exposure to air.
Dotted lines are guides for the eye.
27
Page 41
bis(acetonitrile)diiodocobalt(II) (CoI2(NCMe)2) and TCNE in acetonitrile (MeCN). The
fourth is the same as the second, but in CH2Cl2 instead of acetone.
The carbonyl route yielded a black, amorphous powder that could not be
structurally characterized. The second route yielded crystals characterized as
Co[C4(CN)8](OCMe2)2. [C4(CN)8]2- is a dimer that forms from TCNE, pictured in Figure
2.4. Upon annealing the acetone was removed, resulting in Co[C4(CN)8]. The third route
yielded Co[TCNE][C4(CN)8]1/2, the only one to have TCNE still in the structure. The
fourth yielded Co[C4(CN)8](NCMe)2, a solvated compound with only the dimer present
again. It is unresolved whether or not the latter two compounds exhibit more than simply
paramagnetic behavior, but their magnetic behavior is different than that of the first route
and the thin-films.
The IR spectra of the products of these four reactions are compared with film 1i in
Figure 2.5. The IR spectra indicate that the cobalt carbonyl synthetic method is identical
to the thin-films. These two products, though amorphous, are very similar in IR to the
Co[C4(CN)8](OCMe2)2 from solution, as well as this compound when desolvated. The
latter two products are quite different in the IR from the first three. These IR data
indicate that the films may not contain TCNE radical anions but the TCNE dimer,
C4(CN)8, instead. This consideration will be important when interpreting the magnetic
data of these Co[TCNE]2 thin-films and in comparing them with V[TCNE]2 films.
However strong the evidence for these films being Co[C4(CN)8], the cobalt-
containing films will still be referred to as Co[TCNE]2 throughout the remainder of this
report to maintain consistency.
28
Page 42
Figure 2.4: Illustration of the formation of the TCNE dimer, C4(CN)8, where two TCNE
radical anions combine to form a stable dimer with no unpaired electrons.
29
CN
NC CN
CN
NC CN
CN
NC
NC
CN
CN
NC CN
.-
2-
.-
NC
NC
NC
Page 43
30
Figure 2.5: Comparison of film 1i with four preparations of what was expected to be
Co[TCNE]2 from solution.16
U:\Preston Erickson\IR-Spectra\Co[TCNE]x\PKE01-127.3 PKE01-127 KBrU:\Endrit\IR3\ES-III-77.0 ES-III-77 KBrU:\Endrit\IR3\ES-III-73.0 ES-III-73 KBrU:\Endrit\IR3\ES-III-87 dry.0 ES-III-87 dry KBrU:\Endrit\IR3\ES-III-16.0 ES-III-16 KBrU:\Endrit\IR3\ES-III-27.0 ES-III-27 KBr
27/05/201129/04/201105/04/201118/08/201122/11/201007/12/2010
18001900200021002200230024002500
Wavenumber cm-1
-20
020
40
60
80
100
120
140
Tra
nsm
itta
nce [
%]
1) Film
2) Amorphous (from carbonyl)
3) Co[C4(CN)8](OCMe2)2
4) Co[C4(CN)8] (dry)
5) Co[TCNE][C4(CN)8]1/2
6) Co[C4(CN)8](NCMe)2
12
3
4
5
6
Tra
nsm
itta
nce
(A
rbit
rary
)
Wavenumber, cm-1
Page 44
Magnetic characterization. Initial measurement attempts from the first few
films failed due to lack of sample signal in the magnetometer. The Delrin holder used for
the measurements had too large a signal compared to the film, and drowned out the
sample’s signal. For this reason, magnetic data were not collected from films 1a-c. A
change in packing technique and the use of gelatin capsules, which have a weaker
diamagnetic signal compared to Delrin holders, afforded magnetic data for films 1d-f.
Beginning with film 1g, cover slide glass was used in place of microscope slide glass to
further reduce the amount of diamagnetic noise in magnetic measurements. This also
allowed much more film to be packed in a gelatin capsule, as the cover slide could be
broken up and packed in as opposed to the precut pieces of microscope slide.
Based on bulk data, Co[TCNE]2 should be paramagnetic.13 As such, it should
follow the Curie-Weiss law:
(2.2)
C
T – !" =
where " is the magnetic susceptibility, T is the temperature, and ! is the Weiss Constant,
which is a measure of coupling within the material. The Curie constant, C, is also
material-dependent, and
(2.3)g2S(S+1)
8C =
31
Page 45
where g is the Landé g-factor (which in isotropic cases " 2) and S is the value of the spin
on the sites that are coupled. Assuming g = 2, simplification of Equations (2.2) and (2.3)
leads to an equation that gives a value for "T that only depends on the value of the spins
in the material.
(2.4)S(S+1)
2" T =
In a "T(T) plot, if the sample is above its critical temperature or does not order, the data
should level off and be flat as the temperature approaches room temperature. This value
should agree with the tabulated value calculated from its spin values. If these films are
Co[TCNE]2, with the [TCNE]•– radical anions present, Co2+ has a spin of 3/2 and each
[TCNE]•– will contribute a spin of 1/2, giving a room temperature "T value of 2.625 emu
K/mol. If they are Co[C4(CN)8], Co2+ has a spin of 3/2 and [C4(CN)8]2- has no spin. This
S = 3/2 system should give a "T value of 1.875 emu K/mol at room temperature. Figure
2.6 shows the plot of "T(T) gathered for film 1i. This does not behave as expected for a
paramagnetic system. The fact that it does not flatten out as it approaches room
temperature indicates the presence of ferromagnetic impurities, which in this case would
be cobalt metal impurities from the deposition.
To determine the amount of cobalt impurity in the films, the magnetization of the
film, M, was measured as a function of the applied field, H. A plot is then built with "
(M/H) on the y-axis and 1/H on the x-axis. This plot has a linear region at high field (low
32
Page 46
0
2
4
6
8
10
12
0 50 100 150 200 250 300
Co[TCNE]2, PKE01-127
!T
, em
u K
/mo
l
Temperature, T, K
Figure 2.6: !T(T) for film 1i. The increasing slope of !T at room temperature indicates
the presence of ferromagnetic impurities, in this case unreacted cobalt from the
deposition.
33
Page 47
1/H) which can be fit to find the slope using a least squares method. The plot, known as
a Honda plot, for the high field region of this measurement is shown in Figure 2.7. In
order to find the amount of impurities, the following formula is used:
(2.5)m
163CCo = x106
where CCo is the concentration of cobalt impurities in parts per million (ppm), m is the
slope of the line, and 163 is a factor based on the number of Bohr magnetons per gram of
cobalt.20 Using Equation (2.5), the data in Figure 2.7 gives an impurity concentration of
834 ppm. This is not unexpected, as it is expected that some sublimed Co2(CO)8 does not
react with TCNE, but instead deposits as metallic cobalt on the film. However, when this
amount of cobalt was taken into account in the data workup, it overcorrected and gave a
negative "T(T) value. Manually adjusted, the "T(T) plot levels off for a value of 475 ppm
cobalt. This is shown in Figure 2.8.
A plot of 1/"(T) also yields important information about a magnetic material.
According to the Curie-Weiss Law, such a plot for a paramagnetic material should be
linear with a slope of 1/C and an x-intercept at T = !. Magnetic ordering will change the
shape of this plot below the critical temperature (for ordering materials, ! in the Curie-
Weiss law is replaced by Tc), but above Tc, the data should be linear. As can be seen in
Figure 2.9, the plot of 1/" vs. T is not linear. When corrected with 475 ppm of cobalt
34
Page 48
0
5 10-5
0.0001
0.00015
0.0002
0.00025
0 0.0002 0.0004 0.0006 0.0008 0.001 0.0012
Honda Plot, PKE01-127
!,
em
u/m
ol
1/H, 1/Oe
!= 0.1359(1/H) + 0.0001
Figure 2.7: Honda plot determination of cobalt impurity concentration in film 1i. The
slope of the line in the high field region (low 1/H) can be used to determine the parts per
million of cobalt in the film.
35
Page 49
0
2
4
6
8
10
12
0 50 100 150 200 250 300
Co[TCNE]2, PKE01-127, 475 ppm Co
!T
, em
u K
/mo
l
Temperature, T, K
Figure 2.8: !T(T) for film 1i, both uncorrected (solid circles) and corrected for 475 ppm
cobalt impurites (hollow circles). Note how the corrected version now levels off and is
flat at room temperature.
36
Page 50
Figure 2.9: 1/! vs. T for film 1i, both uncorrected (solid circles) and corrected for 475
ppm cobalt impurites (hollow circles). The corrected version is now linear and can be
extrapolated to its x-intercept according to the Curie-Weiss law.
37
0
20
40
60
80
100
0 50 100 150 200 250 300
Co[TCNE]2, PKE01-127, 475 ppm Co
1/!
, m
ol/
em
u
Temperature, T, K
Page 51
again, however, the plot becomes linear, with an x-intercept (the ! value) of -5.2 K. A
negative value of ! indicates antiferromagnetic coupling.
These results, corrected for cobalt impurities, show a very strong paramagnetic
trend with no indication of magnetic ordering. These data agree well with bulk data
available for Co[TCNE]2.
Overview of results. Structural characterization and infrared characterization by
another group member of samples prepared from solution have shown evidence these
films could be Co[C4(CN)8], not Co[TCNE]2. Further research is needed to confirm what
the resulting structure of these films is. Regardless, thin-films of Co[TCNE]2 have been
made and positively identified by comparing the IR spectra of the film to its bulk
counterpart. No magnetic ordering is evident in these films at the temperatures tested
(5-300 K), indicating that Co[TCNE]2 is paramagnetic in this range. Furthermore, data
suggest antiferromagnetic coupling based on the 1/"(T) x-intercept value of -5.2 K.
Unreacted cobalt deposited on the film in varying concentrations film-to-film, but it was
possible to adjust the magnetic data to correct for these impurities by employing a Honda
plot.
V[TCNE]2
V[TCNE]2 has been made and extensively characterized as both a bulk material
and as a thin-film. The motivation for depositing V[TCNE]2 thin-films for this project
was simply to establish that the apparatus could reproduce past results and to establish a
baseline for mixed-metal depositions involving vanadium.
38
Page 52
Experimental
Starting materials. Vanadium carbonyl, V(CO)6, was prepared from dry
orthophosphoric acid, H3PO4, and tetraethylammonium vanadiumcarbonyl, [Et4N]
[V(CO)6], according to the literature prep and in the apparatus shown in Figure 2.10.17
6.0 g of [Et4N][V(CO)6] mixed with 40 g of H3PO4 yielded 1.5 g of V(CO)6. TCNE was
prepared by the same sublimation process described previously.
Chemical vapor deposition. The CVD process for V[TCNE]2 is very similar to
that for Co[TCNE]2. The parameters are listed in Table 2.2. For films 2a and 2b, no
magnetic data were collected, and only a KBr pellet was included to collect infrared data.
Film 2c was deposited solely on a cover slide with the intention of collecting magnetic
data.
Characterization. Infrared data were collected the same as the Co[TCNE]2
films. Magnetic data were collected on the same MPMS 5T SQUID magnetometer, but
the temperature range was from 10-400 K, as the Tc was expected to be above room
temperature.
Results and Discussion
Infrared spectroscopy. The IR spectra of the two V[TCNE]2 films for which
data were collected, films 2a and 2b, are shown in Figure 2.11. The slight variations in
peak position of these two films can probably be attributed to slight differences in the
molecular orientation as a consequence of different deposition parameters, as film 2a was
deposited with the TNCE at 50 ºC and the carbonyl at 10 ºC, whereas film 2b was
39
Page 53
Figure 2.10: The apparatus used to produce V(CO)6.17
40
Water Bath at 40°C
Dry Ice and Isopropanol V(CO)6
Page 54
Film
Notebook
Number
Temperature
of TCNE*
(ºC)
Temperature
of V(CO)6*
(ºC)
Flow Rate
over TCNE‡
(SCCM)
Flow Rate
over
V(CO)6‡
(SCCM)
2a PKE01-101 50 10 150 100
2b PKE01-105 55 19 150 100
2c PKE01-147 45 17 120 100
Table 2.2
Deposition parameters for V[TCNE]2 films.
!"#3 ºC‡ #5 SCCM
41
Page 55
Wavenumber, cm-1
Tra
nsm
itta
nce
(arb
itra
ry)
2a
2b
2245
2212
2193
2155
2085
Figure 2.11: Infrared spectra of both V[TCNE]2 films. Dotted lines are guides for the
eye.
42
Page 56
deposited with the TCNE at 55 ºC and the carbonyl at 19 ºC. Nevertheless, the spectra
show the same number of peaks with varying intensities, and both fall in the expected
range of V[TCNE]2 established in the bulk phase displayed in Figure 1.6.
Magnetic data. Only one set of magnetic data was collected for a V[TCNE]2
thin-film from this apparatus, for film 2c. The magnetization, M, versus the temperature,
T, is displayed in Figure 2.12. This film exhibits magnetic ordering, but not at the
expected value of 350 K. On an M(T) plot, the Tc of a material can be estimated by
extrapolating the most linear portion of the curve as the curve approaches M = 0.
Applying this method to film 2c, the estimated Tc for this film is ~275 K. Again, it is
unclear why such a deviation from expectation would occur, but it would have to do with
differences in how the film deposited on the glass substrate.
Conclusions
Both V[TCNE]2 and Co[TCNE]2 films have been made. The Co[TCNE]2 film,
instead of having the expected structure Co[TCNE]2, exhibits characteristics in the IR
and magnetically that point to it possibly being Co[C4(CN)8], thus providing an initial
explanation to its paramagnetism. The Co[TCNE]2 films have been further corrected to
account for the presence of ferromagnetic impurities, in this case unreacted cobalt metal
that deposits on top of the film.
The V[TCNE]2 films have the same IR characteristics as their bulk counterparts.
The one film characterized magnetically shows ordering up to a Tc of ~275 K, lower than
the expected value of >350 K, but it can be confidently assumed that adjustment of
43
Page 57
0
100
200
300
400
500
600
700
0 50 100 150 200 250 300 350 400
V[TCNE]2, PKE01-147
Ma
gn
eti
za
tio
n, M
, e
mu
Oe
/mo
l
Temperature, T, K
Figure 2.12: M(T) plot of film 2c. Extrapolation of the most linear region before it
levels off (added line) give an estimate for Tc. 275 K is an uncharacteristically low Tc for
V[TCNE]2.
44
Page 58
deposition parameters would produce films with ordering temperatures equal to that of
the bulk material and thin-films produced in the past.
45
Page 59
CHAPTER 3
MIXED-METAL TCNE FILMS
Once the chemical vapor deposition apparatus was set up and the procedure for
making single-metal TCNE films was established, the focus of this research turned to a
novel material, a mixed-metal film of composition VxCo1-x[TCNE]2.
VxCo1-x[TCNE]2
Experimental
Starting materials. The starting materials for these films are the same as those
described in Chapter 2. Both TCNE and Co2(CO)8 were purified from commercially
available sources by sublimation. V(CO)6 was prepared by reaction of [Et4N][V(CO)6]
and phosphoric acid, H3PO4 as described previously.17
Chemical vapor deposition apparatus. The majority of the glassware used in
the CVD apparatus for the single-metal TCNE films were used for the mixed-metal
TCNE films. The major difference, however, was the necessity to facilitate the
introduction of two metal carbonyls in vapor phase into the center of the chamber at the
same time. Governed by the availability of only one peltier unit for cooling the
carbonyls, the new design arrived upon for the carbonyl tube is shown in Figure 3.1.
Page 60
Co (CO)2 8
V(CO)6
Figure 3.1: New tube for the introduction of carbonyls into the deposition zone of the
CVD apparatus.
47
Page 61
This new tube consists of an outer tube the same diameter as the original tube, but down
the center of this outer tube is a smaller tube. Each tube has an input isolated from the
other, and the two vapor streams meet less than half an inch before the end of the tube.
Furthermore, it was necessary to keep the Co2(CO)8 and the V(CO)6 separated as
long as possible because, in experimenting with having both carbonyls in the same holder
(in the single-metal film setup), the metals both mirrored out significantly before flowing
down the tube, and no film deposited. Further testing was performed to see if the
carbonyls preferred the outer tube or the inner tube. The V(CO)6 performed the same in
either tube, but when the Co2(CO)8 was placed in the inner tube it mirrored out before the
end of the tube and no film resulted. Thus, the Co2(CO)8 was always placed to go down
the outer tube, and the V(CO)6 down the inner tube, as designated in Figure 3.1.
A minor modification to the carbonyl boats was necessary, as the carbonyl holder
for the single-metal TCNE films was large enough that two could not sit side-by-side in
the silicon oil bath on the peltier unit. For this reason, two holders were made that were
small enough to sit side-by-side and allow both carbonyls to be cooled to an appropriate
temperature.
Chemical vapor deposition. With the ideal temperature for the TCNE set (45
ºC) to minimize waste, and the ideal flow rates for the TCNE (120 SCCM) and carbonyls
(100 SCCM), the main variable to determine was the ideal temperature for the carbonyls.
In the single-film depositions, the Co2(CO)8 was kept at 10 ºC and the V(CO)6 at 17 ºC.
As the goal of this project was to create a film with as high a coercive field as possible,
which in bulk samples occurs at x = 0.3, it was decided to maintain both carbonyls at 17
48
Page 62
ºC. This should allow for more Co2(CO)8 to evolve and hopefully shift the composition
of the films towards V0.3Co0.7[TCNE]2. A few other temperatures were used to compare,
but 17 ºC was used most of the time. All mixed-metal TCNE films were deposited on
cover glass slide. The deposition parameters for all of the mixed-films attempted are in
Table 3.1.
Characterization. The instrumentation for infrared and magnetic
characterization are the same as previously described in Chapter 2. Two main sets of data
were run for each mixed-metal TCNE film: susceptibility versus temperature from
10-400 K and hysteresis at 5 K up to 5 tesla (T).
In addition to infrared spectroscopy and magnet data, two more tools were used to
characterize these films. A scanning electron microscope (SEM) (Hitachi 5-3000N in the
Materials Characterization Lab, Materials Science and Engineering Department) was
used to observe the surface of the films, checking for uniformity and other observable
features. An attachment on the SEM (EDAX PV7746) was used for energy dispersive x-
ray spectroscopy (EDS), which gives information about the composition of a material and
was used specifically to detect the ratio of vanadium to cobalt in these films.
Results and Discussion
Composition of films. The amount of vanadium and cobalt varied greatly from
film to film. Initially, the KBr pellets used for IR spectra were the only samples analyzed
by EDS, but it was discovered that the films did not deposit uniformly across both
substrates, and the average composition on the KBr could vary greatly from the average
49
Page 63
Film
Notebook
Number
Temperature
of TCNE*
(ºC)
Temperature
of Carbonyls*
(ºC)
Flow Rate
over
TCNE‡
(SCCM)
Flow Rate
over
Carbonyls‡
(SCCM)
3a PKE01-117 45 17 120 100
3b PKE01-119 45 17 120 100
3c PKE01-121 45 17 120 100
3d PKE01-125 45 17 120 100
3e PKE01-129 45 13 120 100
3f PKE01-131 45 26 120 100
3g PKE01-133 45 10 120 100
3h PKE01-135 45 15 120 100
3i PKE01-137 45 17 120 100
3j PKE01-143 45 17 120 100
3k PKE01-145 45 10 120 100
Table 3.1
Deposition parameters for VxCo1-x[TCNE]2 films.
!"#3 ºC‡ #5 SCCM
50
Page 64
composition on the cover glass. The amounts of vanadium and cobalt (represented as
percentage of total metal content) present in the films are reported in Table 3.2. There are
three main areas of variation for compositions in these films: different compositions
between two samples, different composition between the KBr pellet and cover glass of
the same sample, and a composition gradient within the film on a single substrate.
Regarding the differences in composition from sample to sample, no ready
explanation can be proposed with the data present. Most of the films were deposited
under the same conditions, yet they show a large spread in compositions. This can only
be attributed to unexpected variables that have not been accounted for, such as the exact
position of the substrates in relation to the input tubes, exact time run, or the surface area
of starting material crystals (affecting sublimation rates). Future work on this project
should attempt to duplicate conditions from sample to sample as precisely as possible.
The simplest explanation for the variation in composition across a substrate has to
do with geometry. A cross section of the deposition chamber at the center, where the
substrates are placed, is shown in Figure 3.2. The cover slide is longer than the side of
the square substrate holder is wide, and is therefore sitting at an angle. The KBr pellet is
small enough to sit flat against the glass of the substrate holder. The metal carbonyls
come out at the center of the tube, and both presumably react with TCNE to form the
resulting films. If one of the carbonyls is heavier, more volatile, or more reactive than the
other, it is feasible that a composition gradient would arise on a substrate solely based on
this factor. A map of values of x, the vanadium fraction in VxCo1-x[TCNE]2 on the KBr
pellet of film 3h, is shown in Figure 3.3. There is a clear gradient from bottom to top
51
Page 65
Film
% of V and Co in
VxCo1-x[TCNE]2
on KBr Error*
% of V and Co in
VxCo1-x[TCNE]2
on Glass Error*
3a V: 54
Co: 46± 3
V: 32
Co: 68± 5
3b V: 83
Co: 17± 1
V: 36
Co: 64± 5
3c No Data Available -- V: 72
Co: 28± 5
3d V: 86
Co: 14± 3
V: 36
Co: 64± 12
3e No Data Available -- V: 56
Co: 44±10
3f No Film -- No Film --
3g No Film -- No Film --
3h V: 56
Co: 44± 14 No Data Available --
3i V: 76
Co: 24± 4
V: 50
Co: 50± 22
3j V: 52
Co: 48± 1
V: 45
Co: 55± 11
3k No Data Available -- V: 53
Co: 47± 16
Table 3.2
Composition of VxCo1-x[TCNE]2 films measured by EDS.
52
* Error reported as one standard deviation of the available data.
Page 66
CVD Outer Wall
Cover SlideKBr Pellet
Substrate Holder
Carbonyl
Tube
Figure 3.2: Cross section of the CVD chamber at the midpoint.
53
Page 67
.36
.30
.35
.50
.57
.65
.70.54
.67
.58
.64
.75
.51
.37
.40
.52
.32.30
.56
.63
.68
.71
.75
.64
.53
.70
.71 .67
.54
.54
.51
.76
Figure 3.3: Compositin map of film 3h measured by EDS. Values are fraction of
vanadium, x, in VxCo1-x[TCNE]2.
54
Page 68
which could be a result of geometry. Figure 3.4 is a photograph where regions of
different composition are visible by eye on film 3b.
This effect may also play a role in the difference in composition between the
cover glass and the KBr pellet, as the glass is much closer to where the carbonyls enter
the reaction zone. This would account for the fact that the compositions on glass exhibit
a wider spread than on KBr (indicated by the larger standard deviations in the data set).
One trend established in films with data for both KBr and glass compositions is
that the KBr always has a higher vanadium concentration than the corresponding cover
slide. This may also be a geometric factor, but there may be another factor in this trend.
The metals may show preferential deposition, favoring one substrate to the other. It is
impossible to tell if these composition differences are from one factor or the other, or a
combination of the two, but these are the most apparent theories at the time.
Infrared spectroscopy. All of the IR spectra of the mixed-metal TCNE films (3f
and 3g not included because no film resulted from those depositions) are shown in Figure
3.5. All of the spectra are similar in the C!N region (between 2000 cm-1 and 2300 cm-1).
In the region between 2000 cm-1 and 2100 cm-1, the first half of the films exhibit an
unidentified broad peak that is more intense than the peaks of interest, but this trend
disappears in the second half of the films. As of now, no explanation has been offered for
this feature.
The interest in infrared data for these films is in comparison with pure V[TCNE]2
and Co[TCNE]2. As a reminder, Figure 1.6 shows the composition gradient for the bulk
materials. The IR’s of four films, 1c, 2b, 3e, and 3h, starting with pure V[TCNE]2 on top
55
Page 69
Figure 3.4: Photograph of film 3b showing regions of different composition visible with
no magnification.
56
Page 70
Wavenumber, cm-1
Tra
nsm
itta
nce
(arb
itra
ry)
3a3b
3c
3d
3h3e
3i
3j3k
2089
2157
2190
2207
Figure 3.5: Infrared spectra of mixed-metal VxCo1-x[TCNE]2 films. Dotted lines are
guides for the eye.
57
Page 71
and moving to pure Co[TCNE]2 on bottom, are shown in Figure 3.6. Film 3e, although
data are not available for the composition of the KBr pellet, exhibits the beginning of a
transition, with the shoulder at 2085 cm-1 decreasing in intensity as well as the small peak
at 2245 cm-1 beginning to disappear. Film 3h, with an average composition of
V0.56Co0.44[TCNE]2, shows more of the transition, with a shoulder beginning to appear at
2041 cm-1, the peak at 2245 cm-1 disappearing completely, and the peak at 2155 cm-1
beginning to shift toward the main cobalt peak at 2173 cm-1.
These infrared data, combined with the EDS data presented above, prove that the
starting materials are reacting and films with composition VxCo1-x[TCNE]2 are indeed
being produced. The final piece of information needed was to look at the magnet data to
see if the inclusion of cobalt increases the coercive field of these thin-films.
Magnetic characterization. Magnetic data were collected for seven of the
eleven mixed-metal TCNE film deposition products. Films 3d, 3e, and 3h exhibited Tc’s
greater than 350 K, which is expected for VxCo1-x[TCNE]2. Films 3i-k showed Tc’s
around 300 K, and film 3b had a Tc of approximately 260 K. Similar to film 2c, the
reason this film’s critical temperature is so low is not known. With all seven
magnetically characterized thin-films ordering magnetically, one goal has been met, to
make magnetic thin-films with both vanadium and cobalt present with TCNE.
The "T(T) and 1/"(T) plots for film 3h are shown in Figures 3.7a and 3.7b,
respectively. The original "T(T) plot had a slight positive slope above the critical
temperature, which was corrected with 500 ppm cobalt. The portion of the 1/"(T) plot
58
Page 72
Wavenumber, cm-1
Tra
nsm
itta
nce
(arb
itra
ry)
2b
3e
1c
3h
2245
2212
2193
2155
2085
2041
2110
2173
2225
Figure 3.6: Infrared spectra comparison of Co[TCNE]2, V[TCNE]2, and two mixed-
metal VxCo1-x[TCNE]2 films. Dotted lines are guides for the eye.
59
Page 73
0
10
20
30
40
50
60
0 50 100 150 200 250 300 350 400
V.56
Co.44
[TCNE]2, PKE01-135
1/!
, m
ol/
em
u
Temperature, T, K
0
20
40
60
80
100
0 50 100 150 200 250 300 350 400
V.56
Co.44
[TCNE]2, PKE01-135
!T
, e
mu
K/m
ol
Temperature, T, K
Figure 3.7: Magnetic data for film 3h. a) !T(T) and b) 1/!(T). The negative x-intercept
in 1/!(T) indicates antiferromagnetic coupling.
a)
b)
60
Page 74
above the critical temperature that begins to behave linearly can be extrapolated (the
dotted line) to a negative ! value which indicates antiferromagnetic coupling.
Another interesting characteristic of these films which has carried over from the
bulk material is that they decompose if heated above 350 K. Since the susceptibility
needs to be measured up to 400 K to get good data, all films decomposed upon
measurement. The "T(T) of film 3d is plotted twice in Figure 3.8, the first curve being
the first time it was measured, and the second curve after being cooled and measured
again. Note how in the second run, there is now a positive slope to "T(T) at room
temperature, indicating the new presence of ferromagnetic impurities, assumed to be
cobalt metal from further decomposition.
The main focus of this project, though, was on hysteresis and coercive field. As a
reminder, bulk V[TCNE]2 has a coercive field of 7.8 Oe at 5 K. Any significant
improvement on this value would be a success. Five of the magnetically characterized
films had coercive fields at 5 K of 10 Oe or less. The hysteresis loop for film 3i is shown
in Figure 3.9. For the other two, films 3b and 3d, the hysteresis measurements were
taken after the films had been exposed to 400 K temperatures. As a result, they both
decomposed before the hysteresis could be measured correctly. The decomposed films
showed hysteresis, however, and the results are interesting: both exhibited coercive fields
above 100 Oe. The hysteresis loop of films 3b and 3d are shown in Figures 3.10 and
3.11, respectively. 3b has a coercive field, Hcr, of ~180 Oe and 3d of ~105 Oe.
The reason these films do not exhibit increased coercive field is not known at this
time. IR data (Figures 3.6 and 1.6) indicate that there is a composition between x = 0 and
61
Page 75
0
50
100
150
200
250
0 50 100 150 200 250 300 350 400
V.36
Co.64
[TCNE]2, PKE01-125
!T
, e
mu
K/m
ol
Temperature, T, K
Figure 3.8: !T(T) data for film 3d. The first measurement (solid circles) shows magnetic
ordering up to ~350 K and a flat !T above Tc. The second measurement (hollow circles)
shows the film’s behavior after exposure to 400 K. Tc has decreased considerably and the
positive slope indicates cobalt impurities resultant from film decomposition.
62
Page 76
Figure 3.9: Hysteresis data at 5 K for film 3i. a) Hysteresis loop shown to 5 T. b) Zoom
on the coercive field, ~10 Oe.
a)
b)
63
-4000
-3000
-2000
-1000
0
1000
2000
3000
4000
-4 104
-2 104
0 2 104
4 104
VxCo
1-x[TCNE]
2, PKE01-137
Ma
gn
eti
za
tio
n, M
, em
u/m
ol
Field, H, Oe
-3000
-2000
-1000
0
1000
2000
3000
-200 -150 -100 -50 0 50 100 150 200
Ma
gn
eti
za
tio
n, M
, em
u/m
ol
Field, H, Oe
Page 77
Figure 3.10: Hysteresis data at 5 K for film 3b. a) Hysteresis loop shown to 5 T. b)
Zoom on the coercive field, ~180 Oe.
a)
b)
64
-3000
-2000
-1000
0
1000
2000
3000
-40000 -20000 0 20000 40000
V0.35
Co0.65
[TCNE]2, PKE01-119
Ma
gn
eti
za
tio
n, M
, em
uO
e/m
ol
Field, H, Oe
-600
-400
-200
0
200
400
600
-200 -150 -100 -50 0 50 100 150 200
Ma
gn
eti
za
tio
n, M
, e
mu
Oe
/mo
l
Field, H, Oe
Page 78
a)
b)
Figure 3.11: Hysteresis data at 5 K for film 3d. a) Hysteresis loop shown to 5 T. b)
Zoom on the coercive field, ~105 Oe.
65
-3000
-2000
-1000
0
1000
2000
3000
-4 104
-2 104
0 2 104
4 104
V0.36
Co0.64
[TCNE]2, PKE01-125
Ma
gn
eti
za
tio
n, M
, em
uO
e/m
ol
Field, H, Oe
-1000
-500
0
500
1000
-200 -150 -100 -50 0 50 100 150 200
Ma
gn
eti
za
tio
n, M
, em
uO
e/m
ol
Field, H, Oe
Page 79
x = 1 (x is the fraction of vanadium) in the mixed-metal TCNE films. This mixed
composition should manifest itself with an increased coercive field as it does when this
material is prepared from solution. Future research will determine if this is always the
result, or if there are CVD routes that will produce a thin-film VxCo1-x[TCNE]2 magnet
with a greater value of coercive field.
Conclusions
A chemical vapor deposition route was designed and implemented for both single-
metal (V[TCNE]2 and Co[TCNE]2) and mixed-metal (VxCo1-x[TCNE]2) thin-films. The
single-metal TCNE films behaved more or less as expected. Most importantly, the
mixed-metal TCNE films deposited successfully a majority of the time. However, no
increase in coercive field was measured for any of these films, regardless of composition.
Further work on this project could continue exploring a CVD route to achieve a higher
coercive field in these mixed-metal TCNE thin-films, creating a viable magnetic material
for several potential applications.
66
Page 80
REFERENCES
1 M. Blackman, “The Lodestone: a Survey of the History and the Physics,” Contemp.
Phys., 24 [4] 319-31 (1983).
2 For an in depth overview on the development of quantum magnetic theories, see: D.C.
Mattis, The Theory of Magnetism Made Simple, World Scientific Publishing Co. Pte.
Ltd., Hackensack, NJ, 2006.
3 D. Craik, Magnetism: Principles and Applications, John Wiley & Sons Ltd., West
Sussex, England, 1995.
4 G.A. Candela, L.J. Swartzendruber, J.S. Miller, and M.J Rice, “Metamagnetic
Properties of One-Dimensional Decamethylferrocenium 7,7,8,8-tetracyano-p-
quinodimethanide (1:1):[Fe(!5-C5Me5)2]+•[TCNQ]-•,” J. Am. Chem. Soc., 101 [10]
2755-56 (1979).
5 J.S. Miller, J.C. Calabrese, H. Rommelmann, S.R. Chittipeddi, J.H. Zhang, W.M. Reiff,
and A.J. Epstein, “Ferromagnetic Behavior of [Fe(C5Me5)2]+•[TCNE]-•. Structural and
Magnetic Characterization of Decamethylferrocenium Tetracyanoethenide,
[Fe(C5Me5)2]+•[TCNE]+••MeCN, and Decamethylferrocenium Pentacyanopropenide,
[Fe(C5Me5)2]+•[C3(CN)5]-,” J. Am. Chem. Soc., 109 [3] 769-81 (1987).
6 G.T. Yee, J.M. Manriquez, D.A. Dixon, R.S. McLean, D.M. Groski, R.B. Flippen, K.S.
Narayan, A.J. Epstein, and J.S. Miller, “Decamethylmanganocenium Tetracyanoethenide,
[Mn(C5Me5)2]••+[TCNE]•––a Molecular Ferromagnet With an 8.8 K Tc,” Adv. Mater., 3 [6]
309-11 (1991).
7 J.S. Miller, “Organometallic- and Organic-Based Magnets: New Chemistry and New
Materials for the New Millennium,” Inorg. Chem., 39 [20] 4392-408 (2000).
8 J.M. Manriquez, G.T. Yee, R.S. McLean, A.J. Epstein, and J.S. Miller, “A Room-
Temperature Molecular/Organic-Based Magnet,” Science, 252 1415-17 (1991).
Page 81
9 K.I. Pokhodnya, D. Pejakovic, A.J. Epstein, and J.S. Miller, “Effect of Solvent on the
Magnetic Properties of the High-Temperature V[TCNE]x Molecule-Based Magnet,”
Phys. Rev. B, 63 174408 - 1-8 (2001).
10 M.S. Thorum, K.I. Pokhodnya, and J.S. Miller, “Solvent Enhancement of the Magnetic
Ordering Temperature (Tc) of the Room Temperature V[TCNE]x ! S (S = Solvent, TCNE
= tetracyanoethylene; x " 2) Magnet,” Polyhedron, 25 1927-30 (2006).
11 K.I. Pokhodnya, A.J. Epstein, and J.S. Miller, “Thin-Film V[TCNE]x Magnets,” Adv.
Mater., 12 [6] 410-13 (2000).
12 K.I. Pokhodnya, M. Bonner, and J.S. Miller, “Parylene Protection Coatings for Thin
Film V[TCNE]x Room Temperature Magnets,” Chem. Mater., 16 [24] 5114-19 (2004).
13 K.I. Pokhodnya, V. Burtman, A.J. Epstein, J.W. Raebiger, and J.S. Miller, “Control of
Coercivity in Organic-Based Solid Solution VxCo1-x[TCNE]2•zCH2Cl2 Room
Temperature Magnets,” Adv. Mater., 15 [14] 1211-14 (2003).
14 R.S. Edelstein, J. Yoo, N.P. Raju, J.D. Bergeson, K.I. Pokhodnya, J.S. Miller, and A.J.
Epstein, “Organic-Based Magnetic Thin Films by Low Temperature CVD,” Mater. Res.
Soc. Symp. Proc., 871E 17.3.1-6 (2005).
15 J.S. Miller, “Tetracyanoethylene (TCNE): The Characteristic Geometries and
Vibrational Absorptions of Its Numerous Structures,” Angew. Chem. Int. Ed., 45 [16]
2508-25 (2006).
16 Unpublished data of E. Shurda in the research lab of J.S. Miller.
17 X. Liu, J.E. Ellis, T.D. Selby, P. Ghalsasi, and J.S. Miller, “Transition Metal Carbonyl
Compounds. Hexacarbonylvanadate(1-) and Hexacarbonylvanadium(0),” Inorg. Synth.,
34 96-103 (2004).
18 G.S. Nolas, J. Sharp, and H.J. Goldsmid, Thermoelectrics: Basic Principles and New
Materials Development, pp. 1-12, Springer-Verlag, Berlin Heidelberg, Germany, 2001.
19 H.J. Goldsmid, Thermoelectric Refrigeration, pp. 202-9, Plenum Press, New York,
1964.
20 CRC Handbook of Chemistry and Physics, 81st Ed., p. 12-119. Edited by D.R. Lide.
CRC Press LLC, New York, 2000.
68


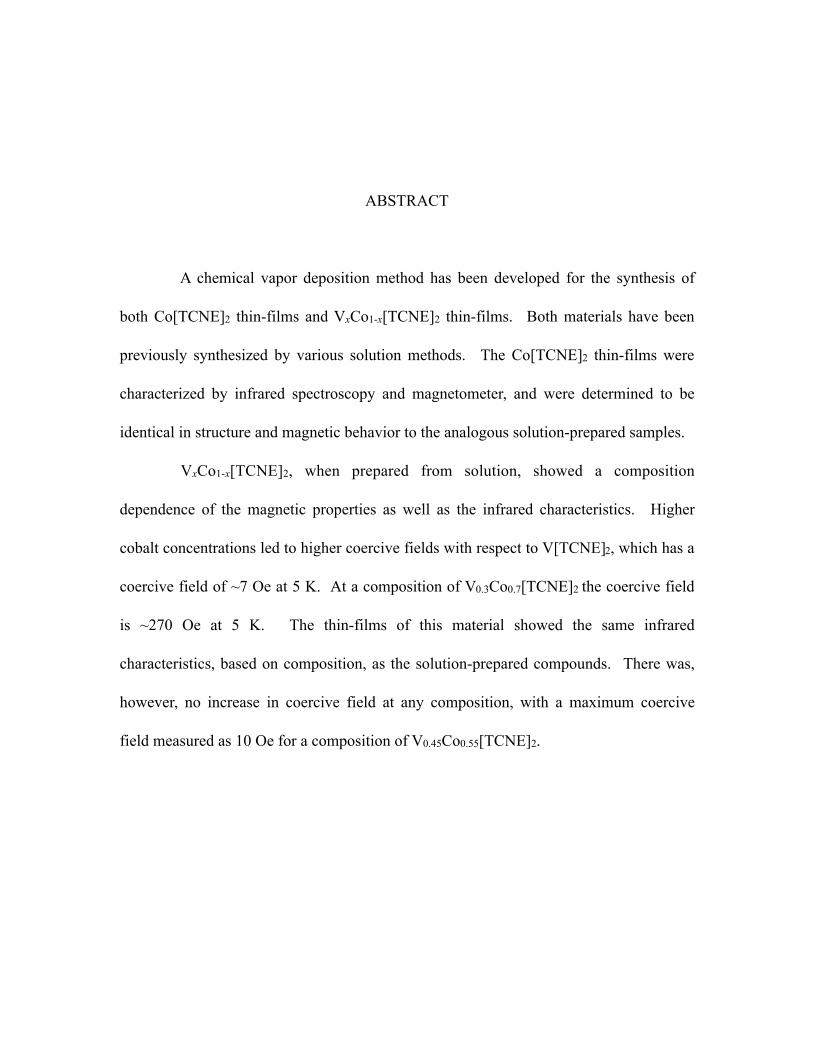


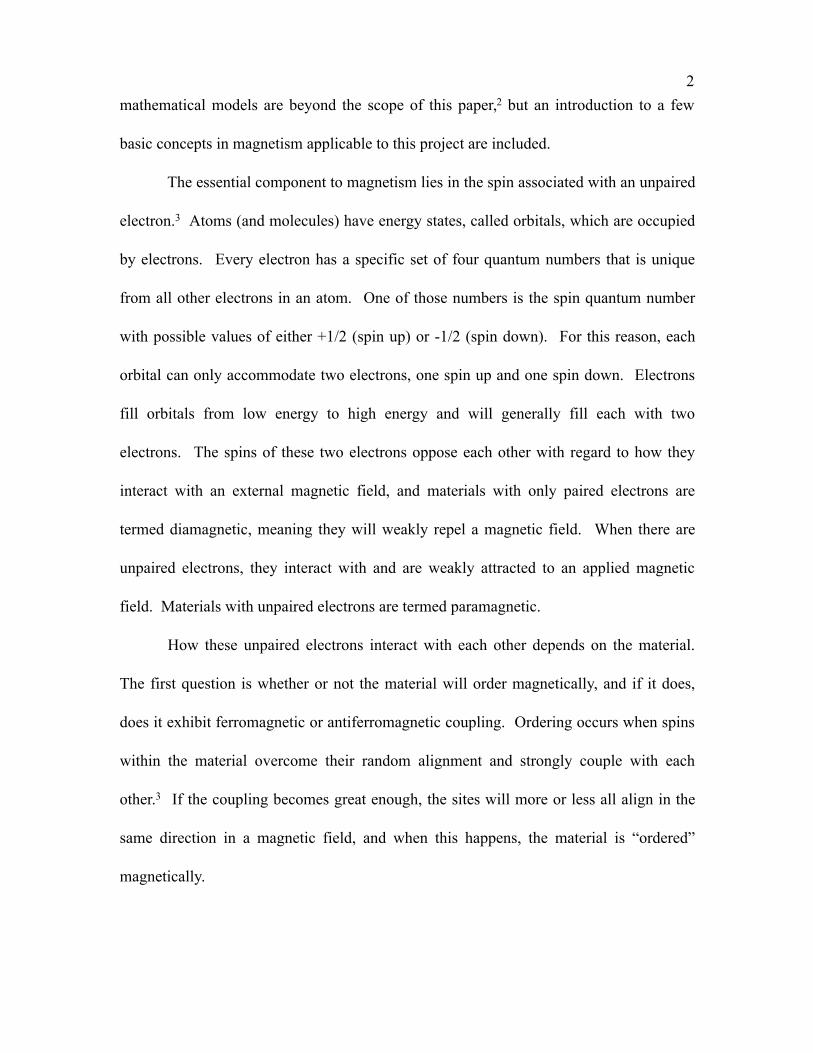


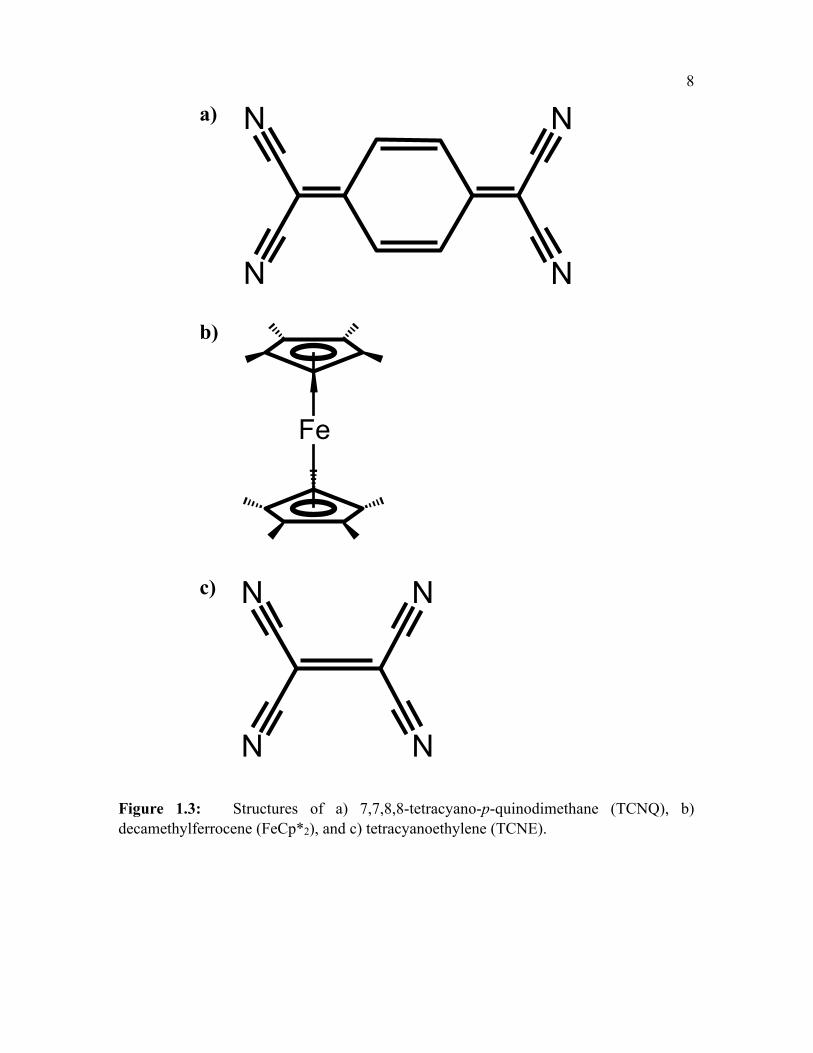

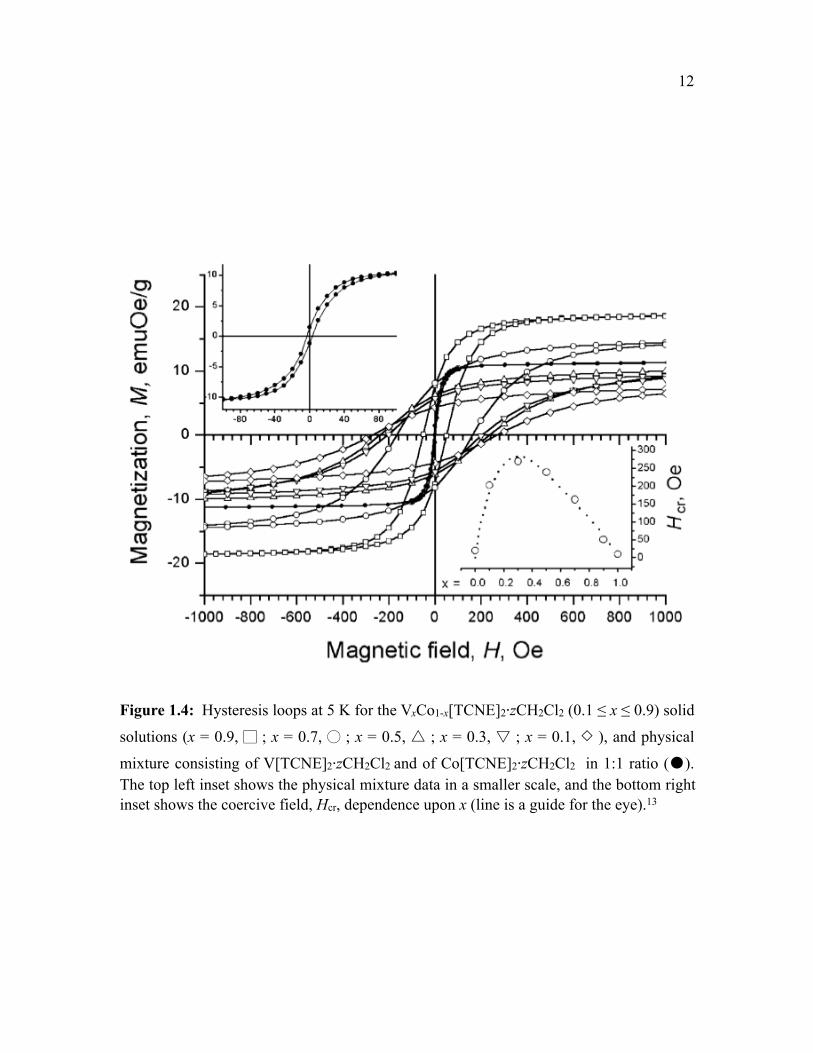


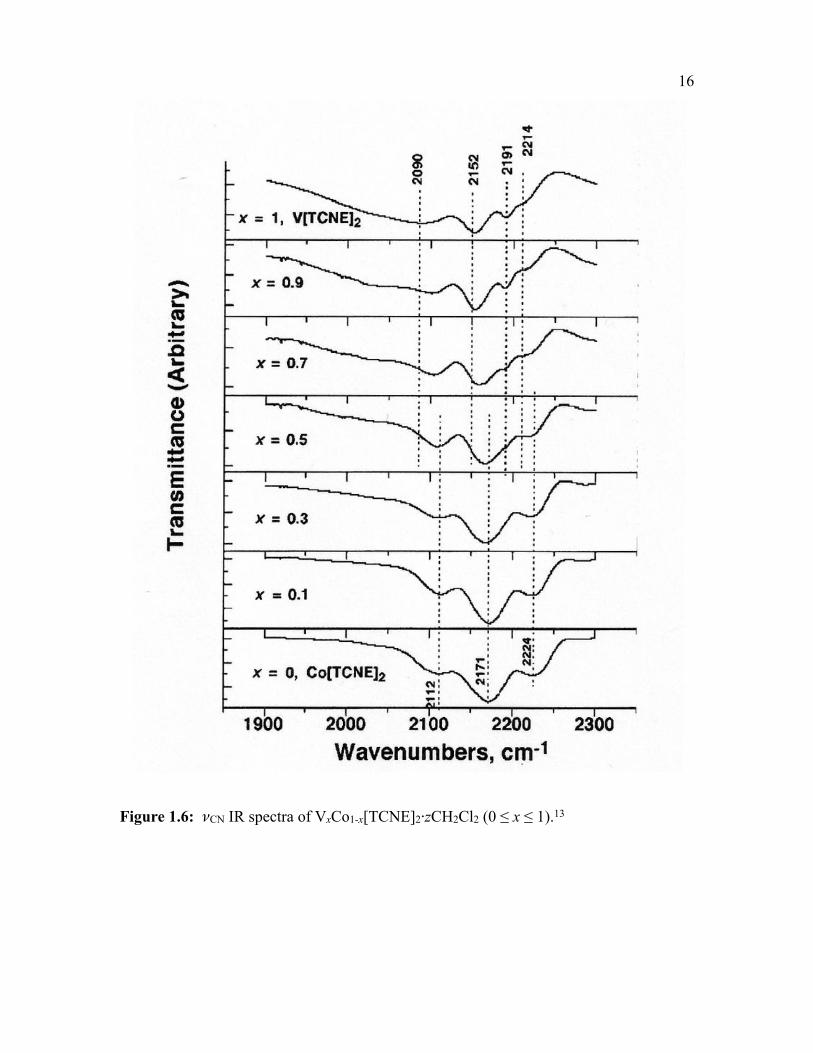


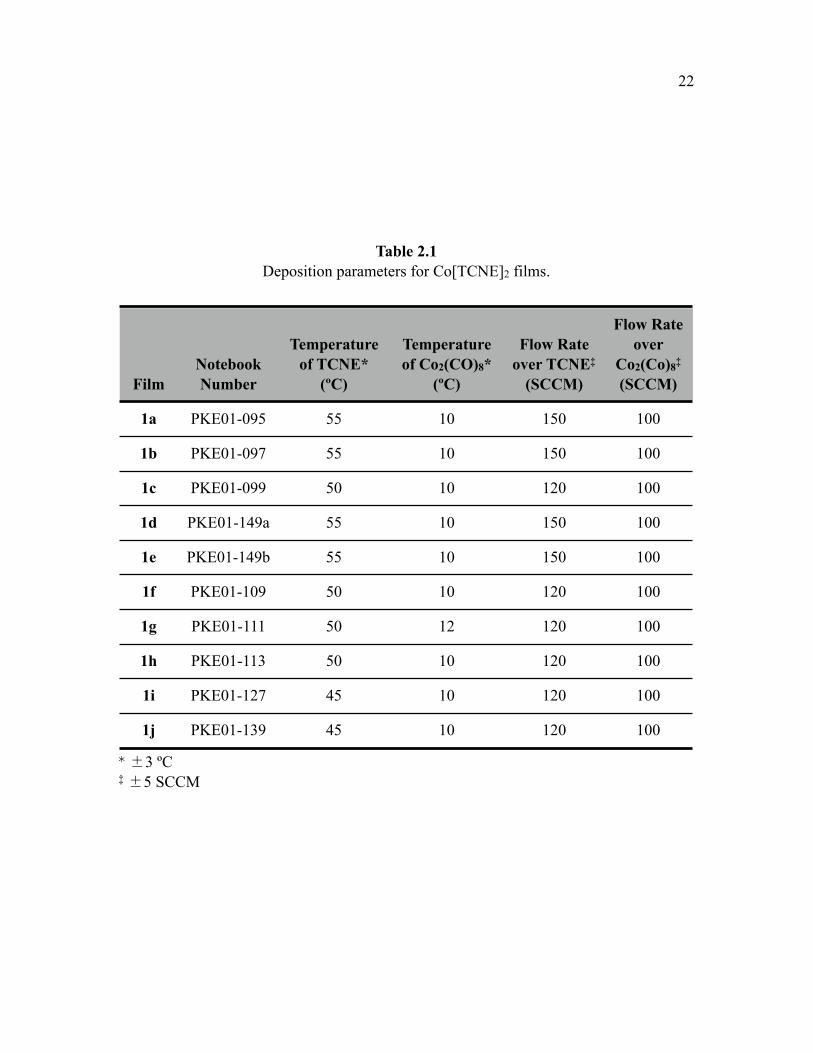

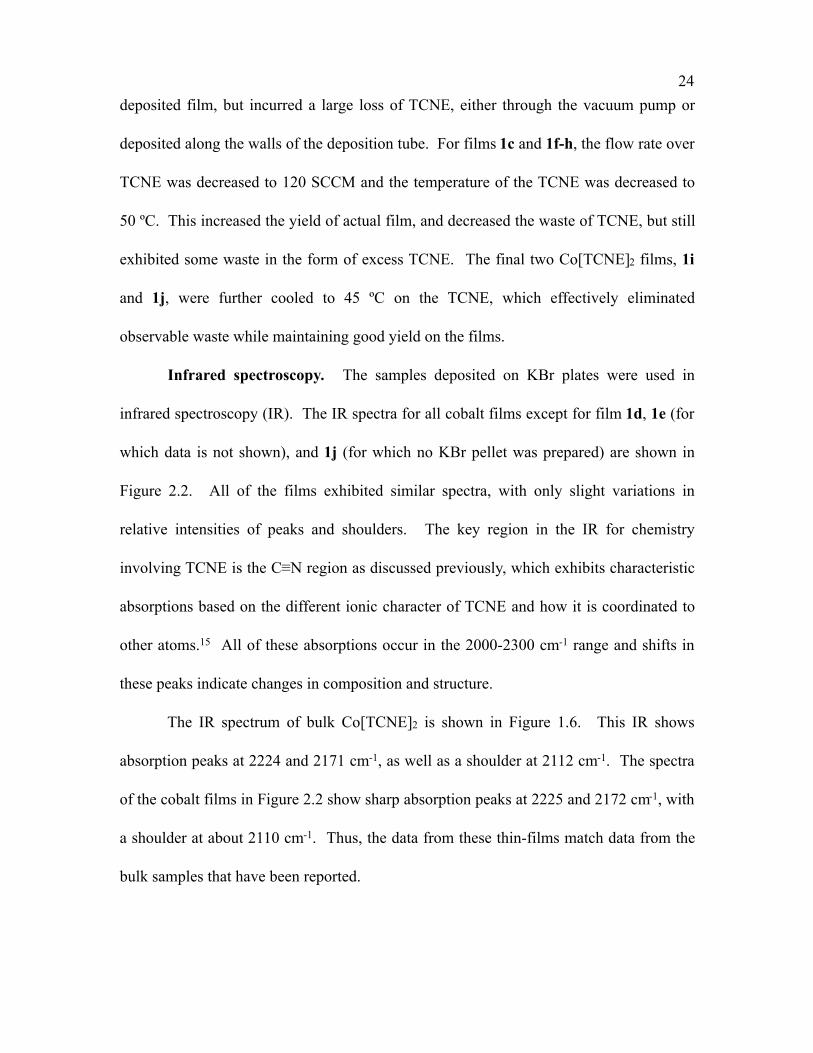
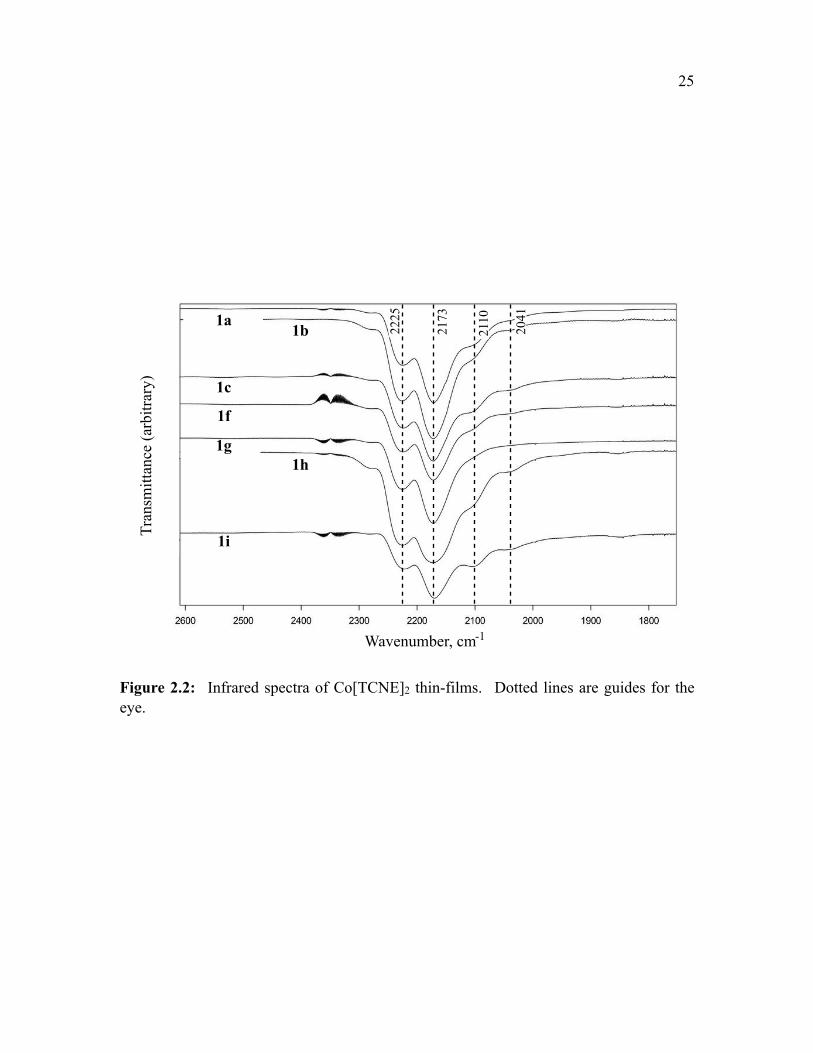

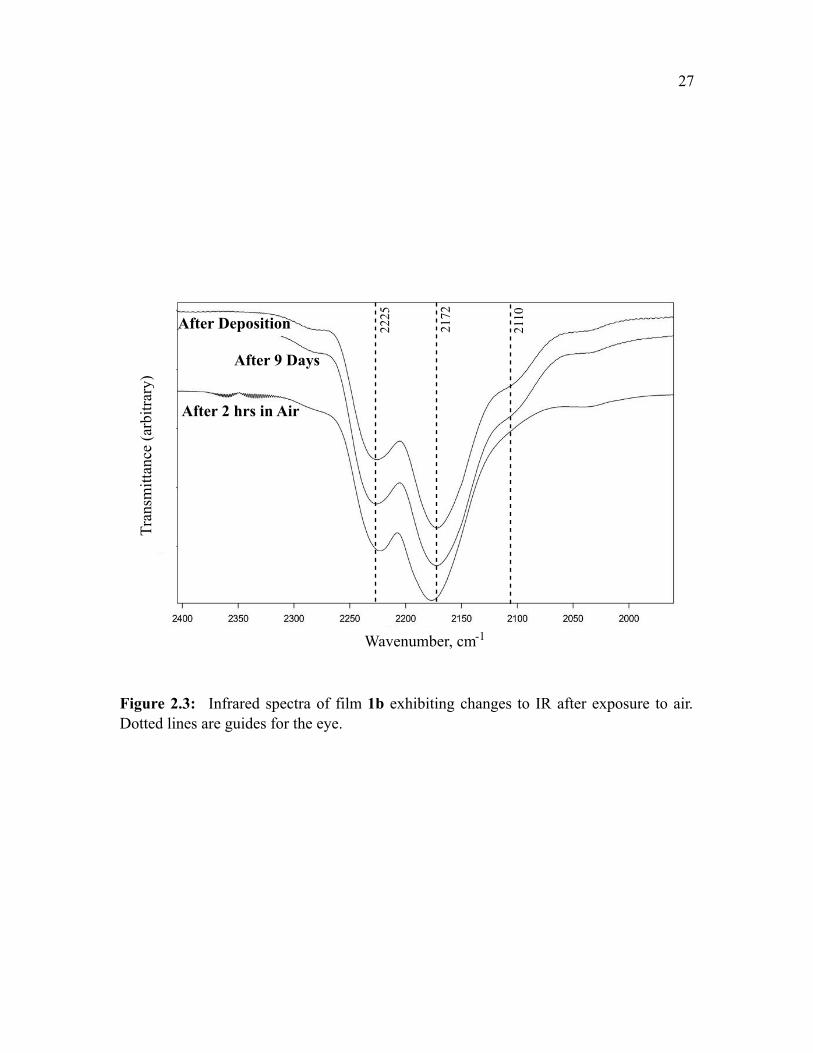

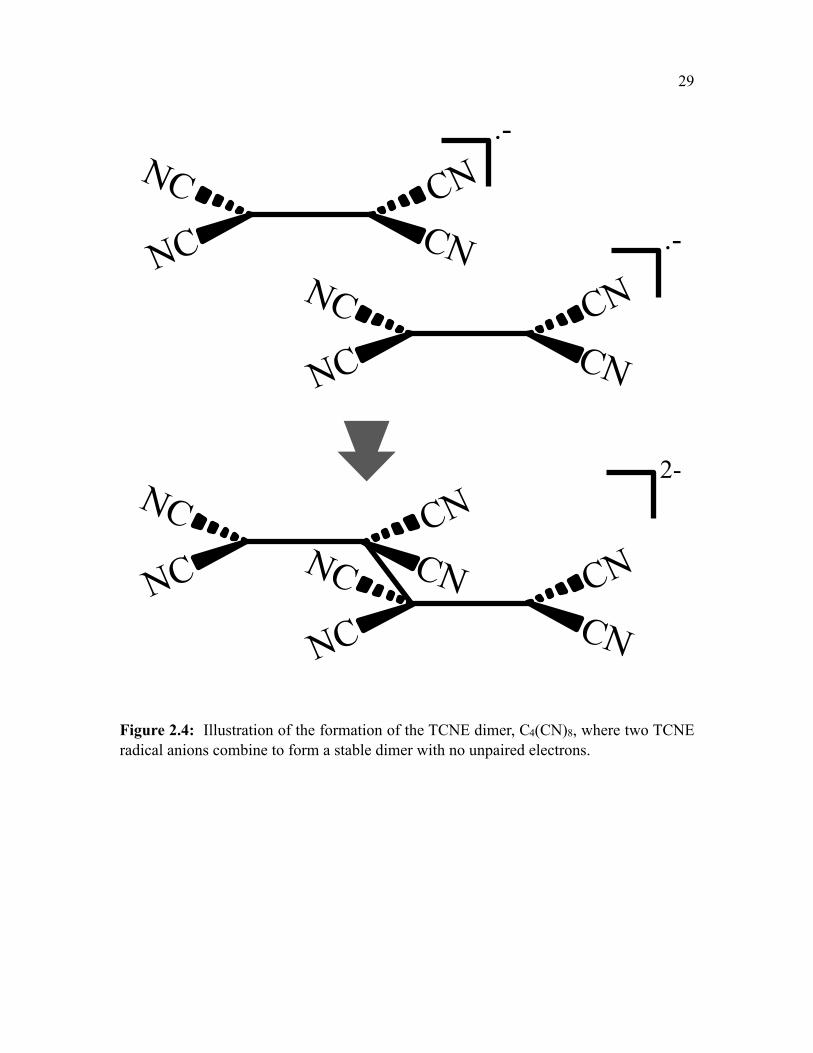
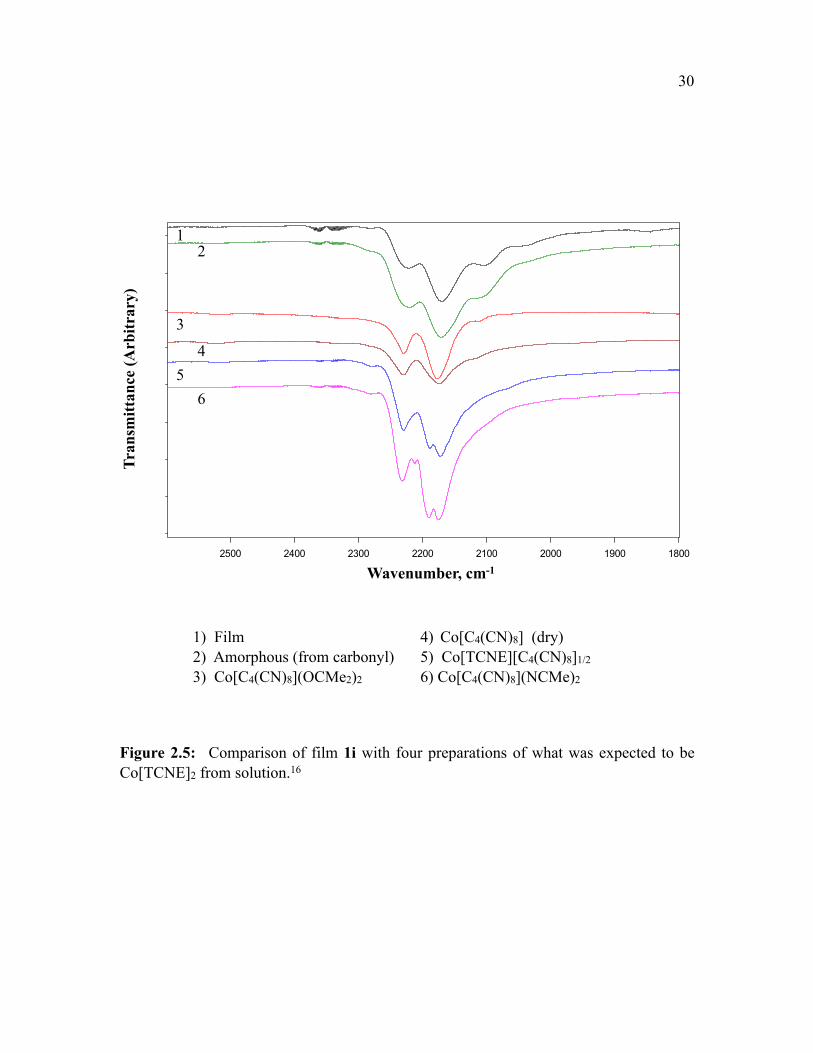
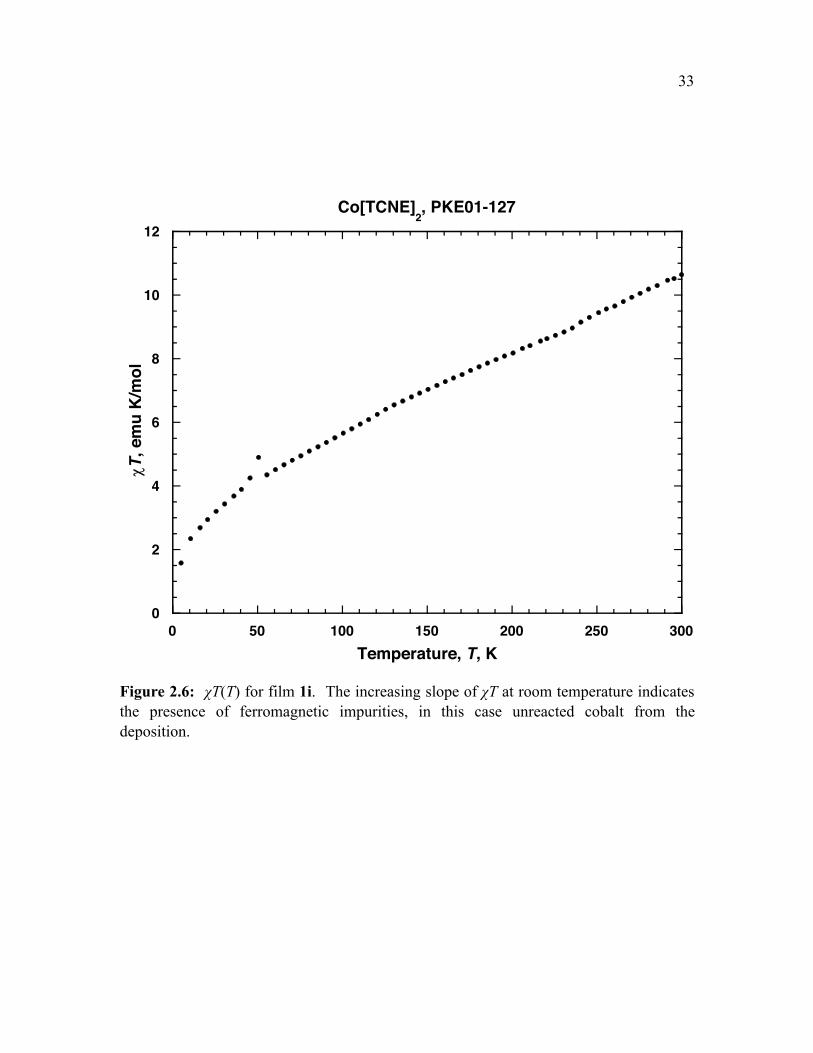

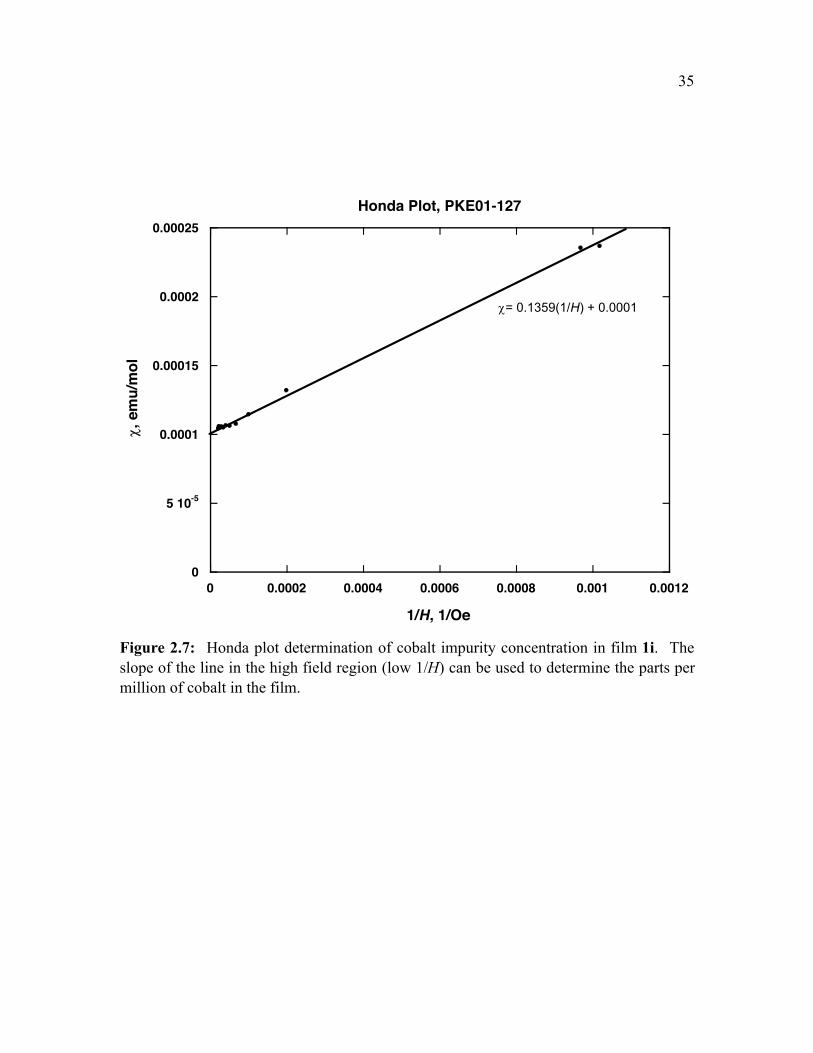
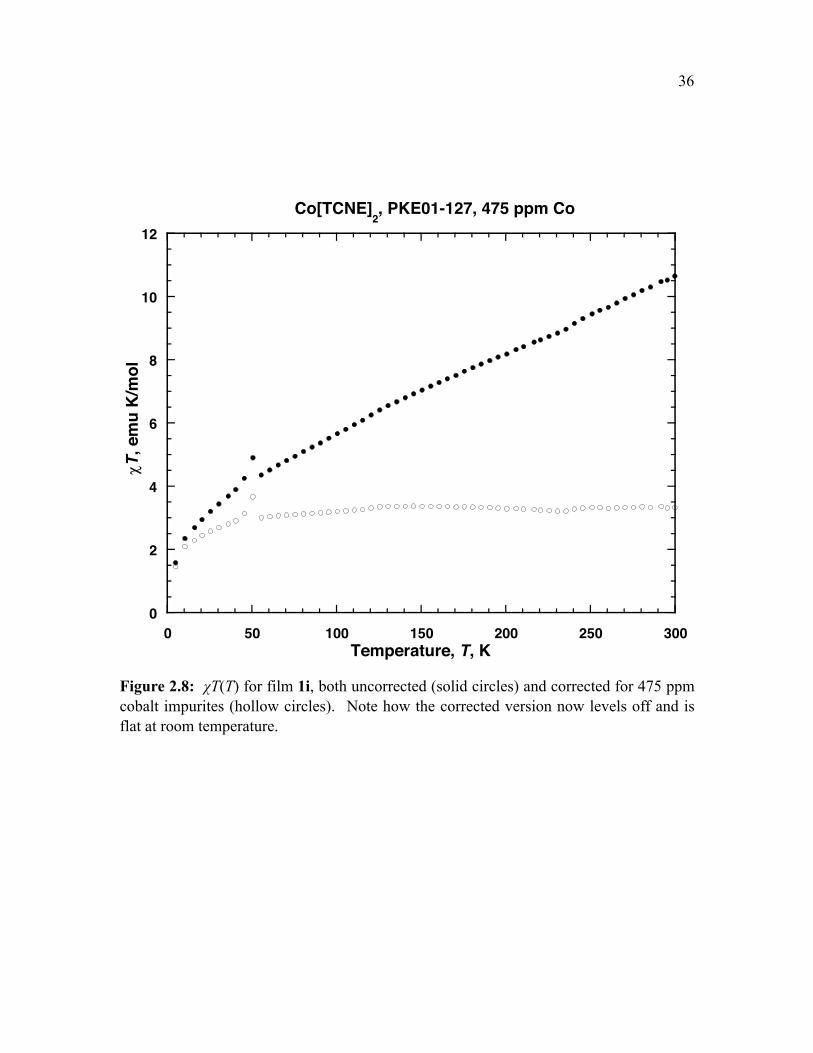


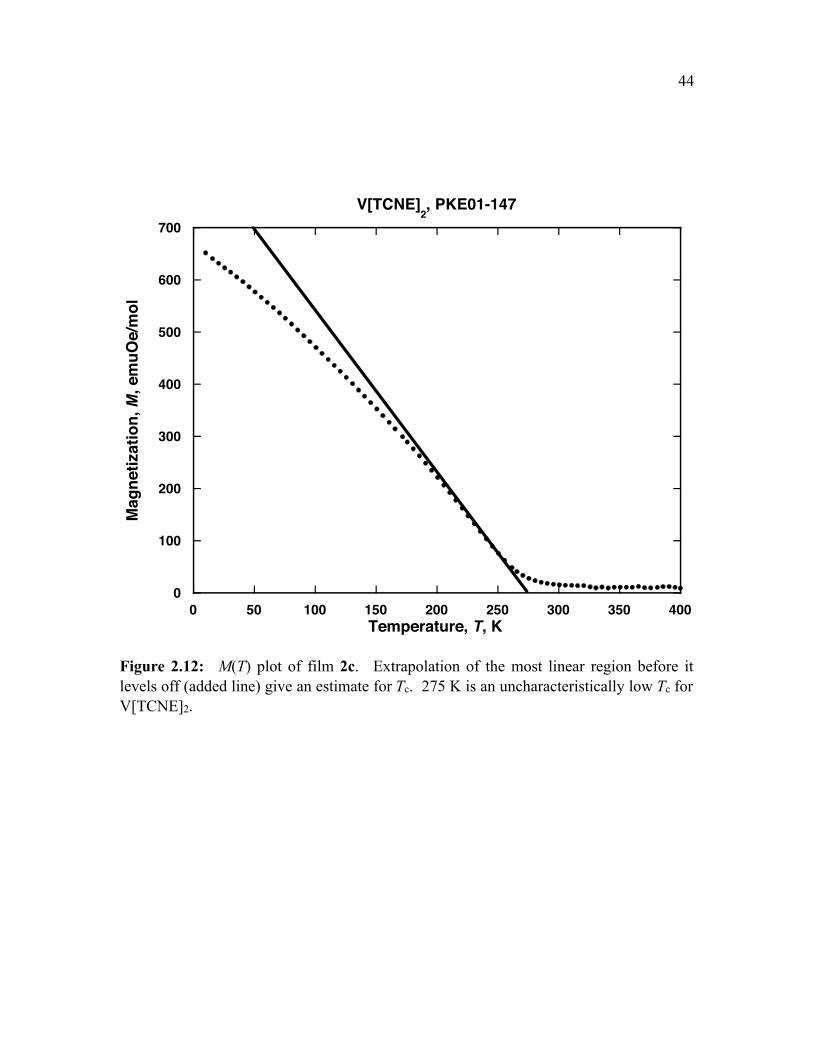

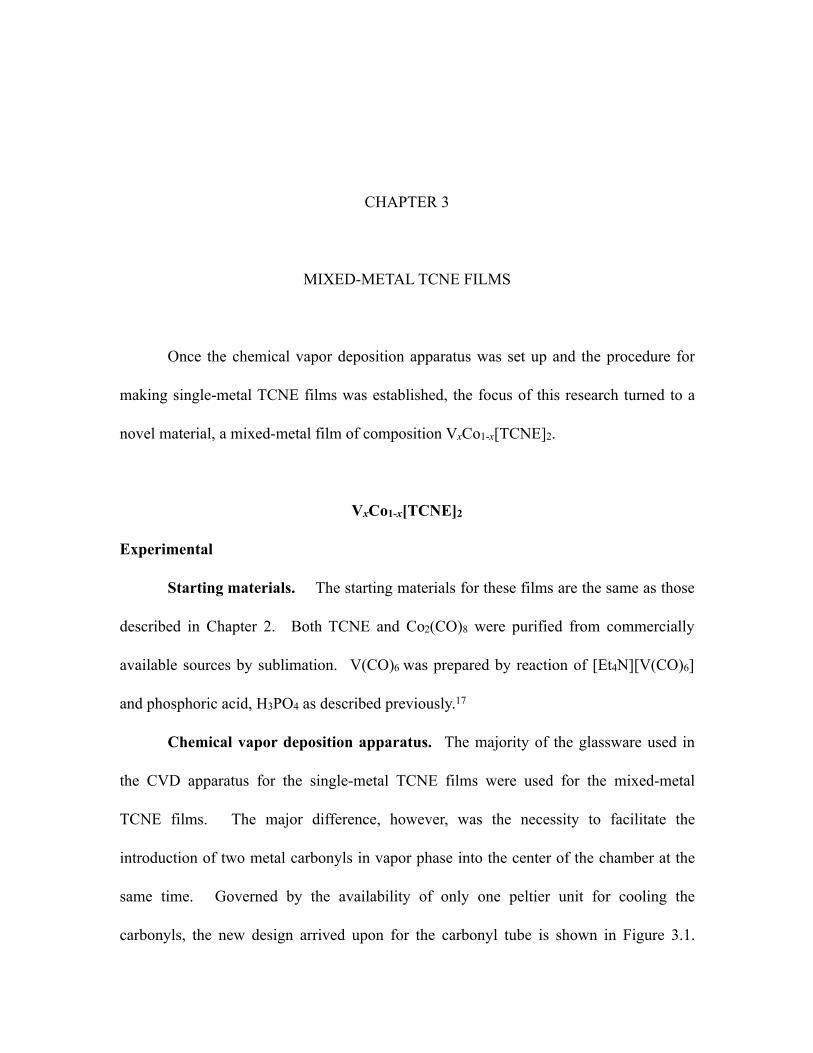

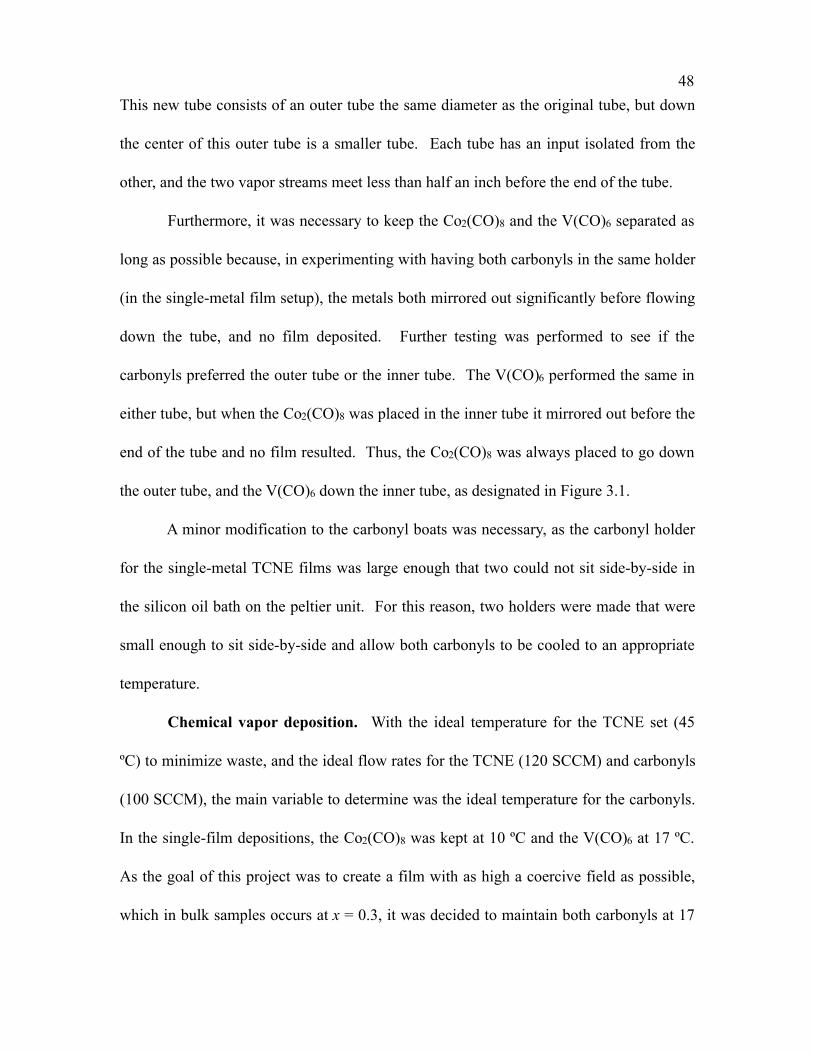
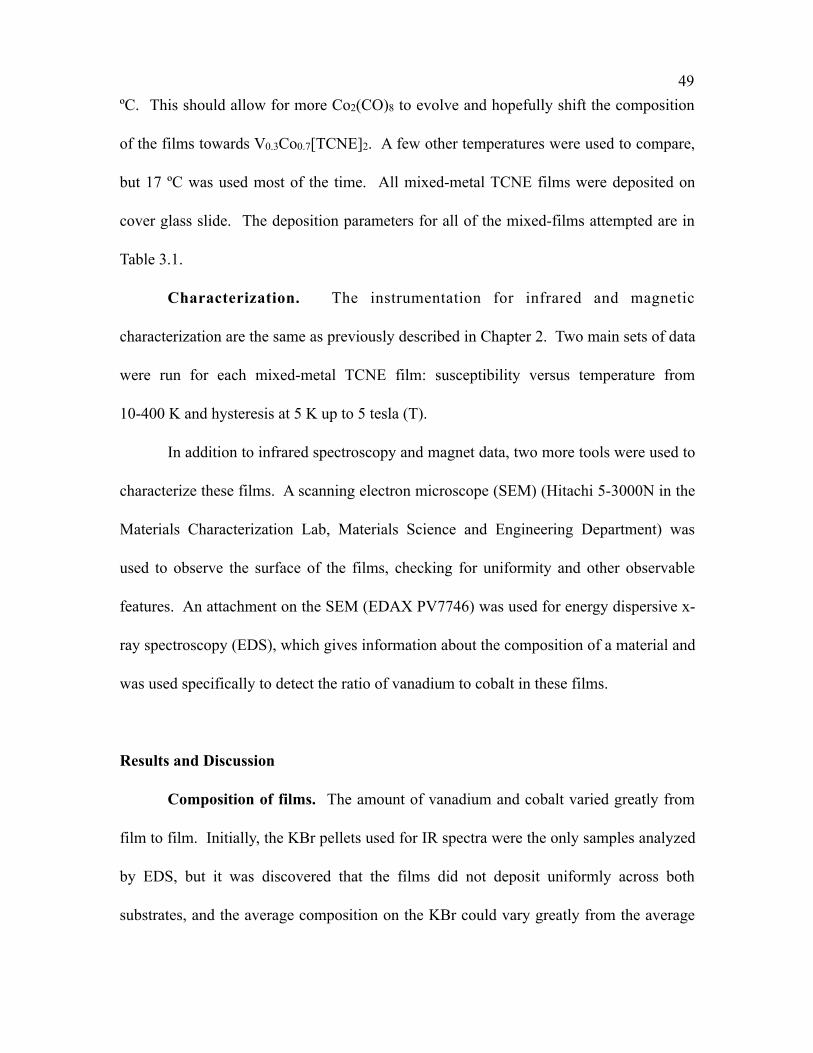

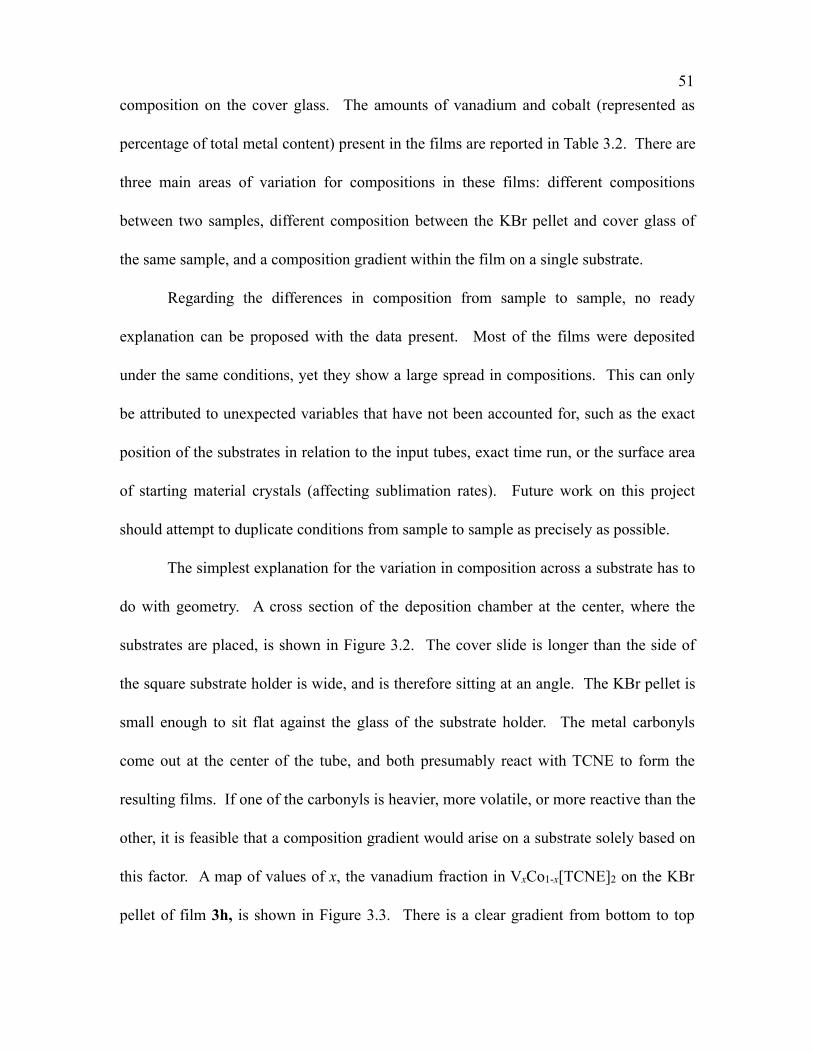

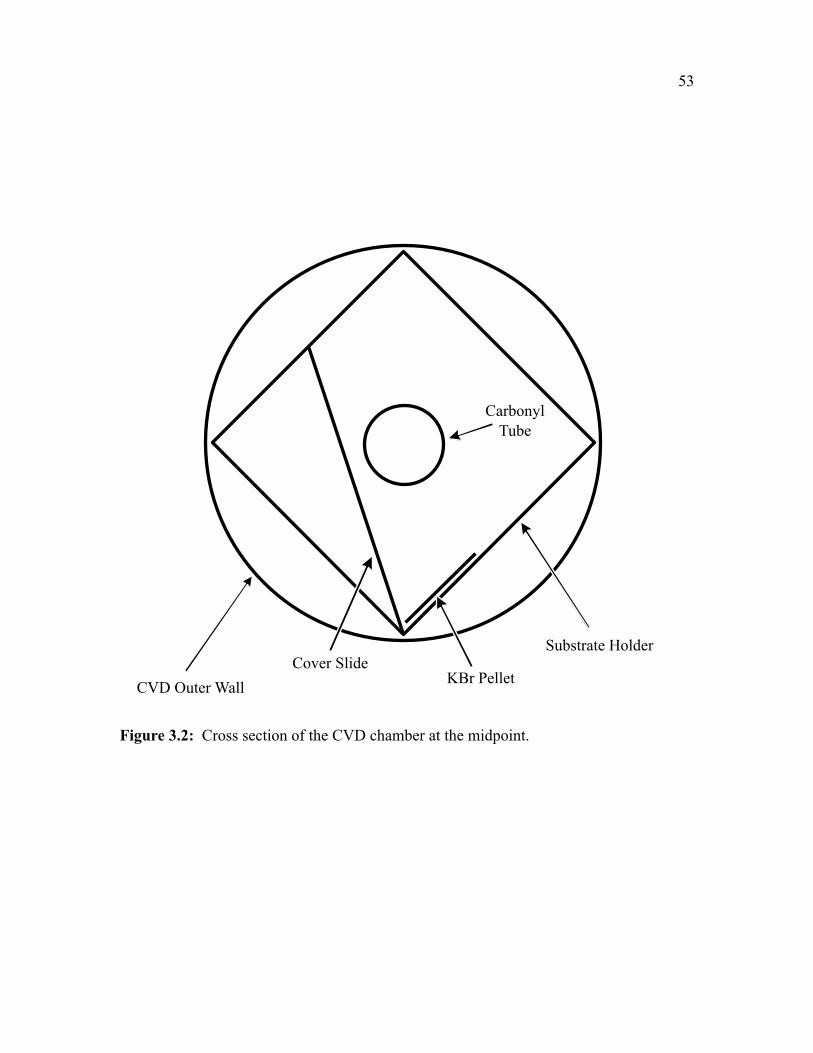

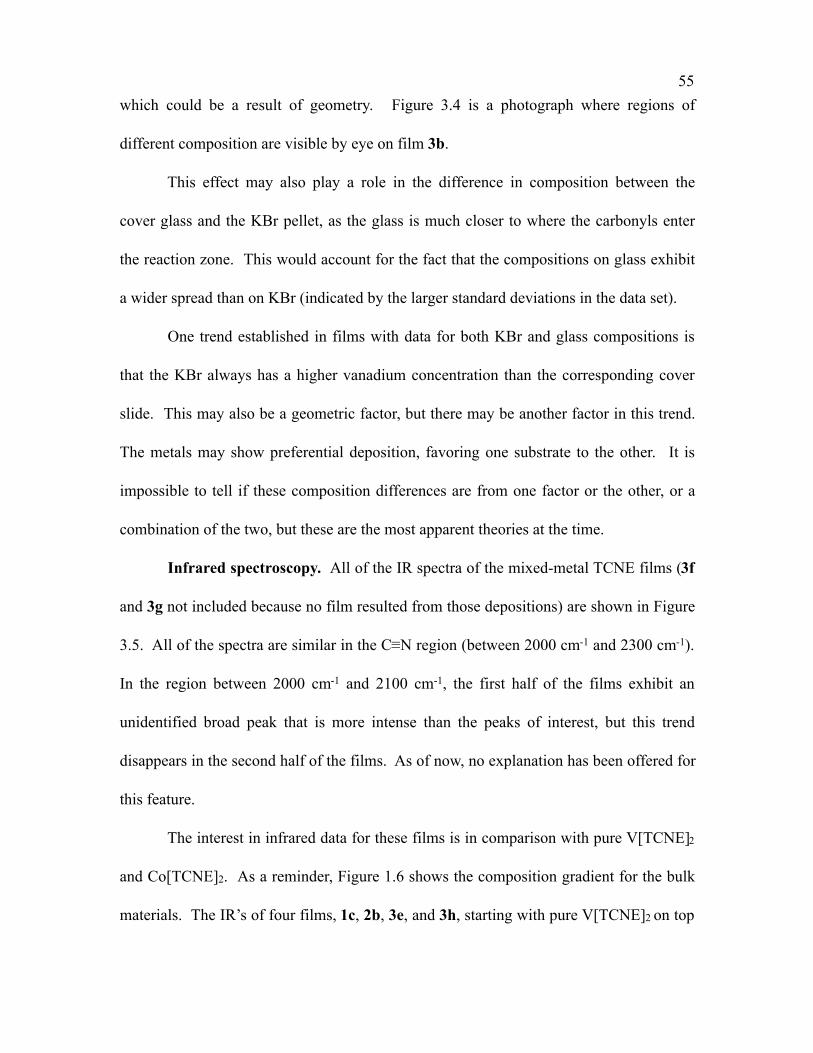
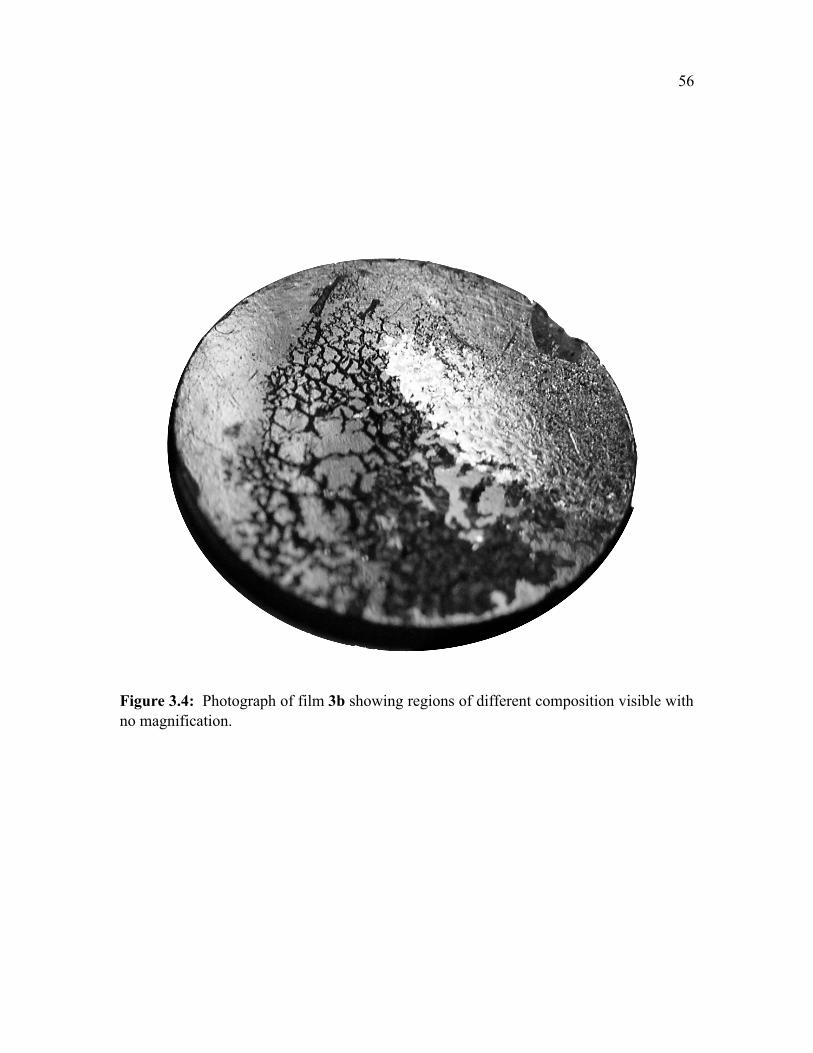


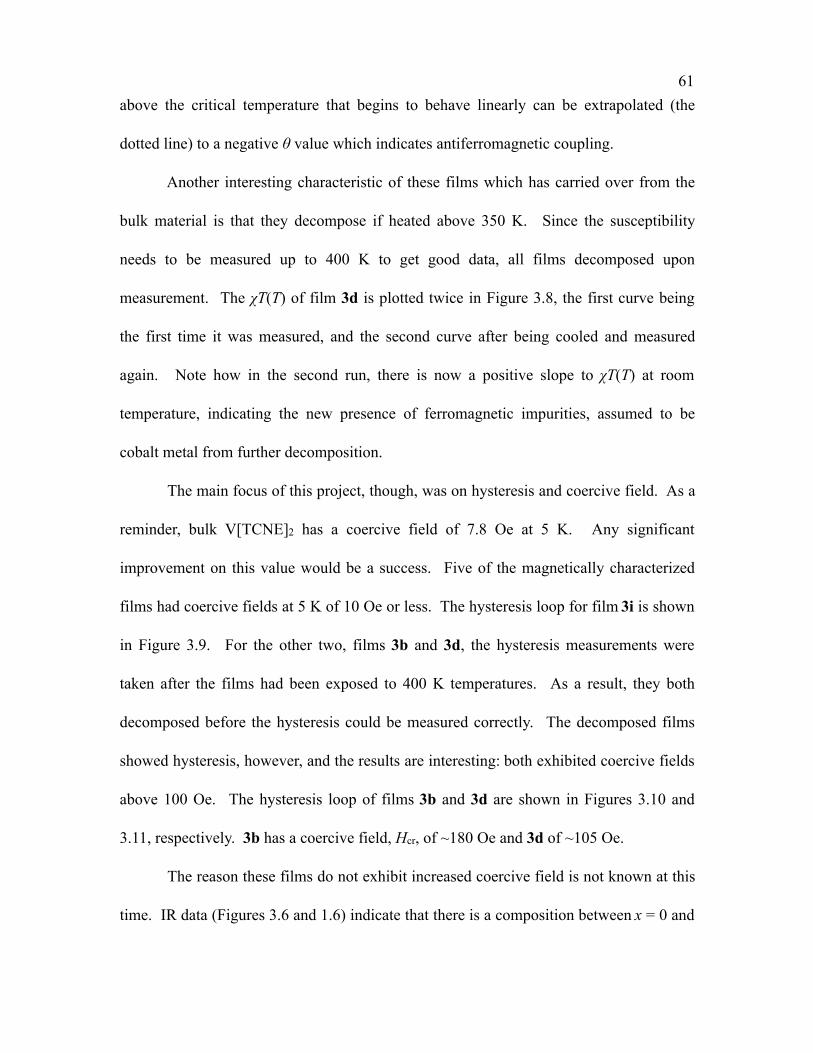


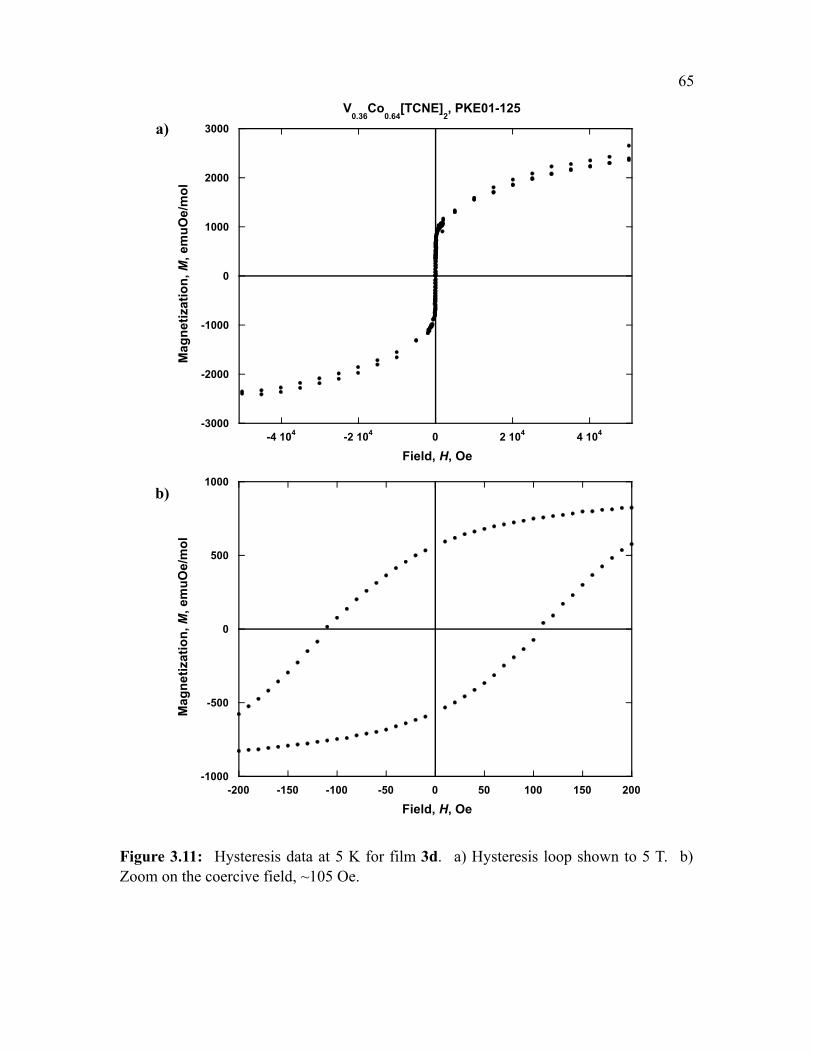


![A Dysprosium Metallocene Single‐Molecule Magnet Functioning …sro.sussex.ac.uk/78160/3/Dy_cation.pdf · 2019-07-02 · single-molecule magnets (SMMs).[1] In addition to the considerable](https://static.documents.pub/doc/80x56/5f718443743c7507a231d656/a-dysprosium-metallocene-singleamolecule-magnet-functioning-sro-2019-07-02.jpg)


