Thin Film Scattering: Epitaxial Layers 5th Annual SSRL Workshop on Synchrotron X-ray Scattering Techniques in Materials and Environmental Sciences: Theory and Application June 1 - 3, 2010 Arturas Vailionis GLAM, Stanford University SIMES, SLAC
Transcript
Thin Film Scattering:Epitaxial Layers
5th Annual SSRL Workshop on Synchrotron X-ray Scattering Techniques in Materials and Environmental Sciences: Theory and Application
June 1 - 3, 2010
Arturas VailionisGLAM, Stanford University
SIMES, SLAC
• Thin films. Epitaxial thin films
• What basic information we can obtain from x-ray diffraction
• Reciprocal space and epitaxial thin films
• Scan directions – reciprocal vs. real space scenarios
• Mismatch, strain, mosaicity, thickness
• How to choose right scans for your measurements
• Mosaicity vs. lateral correlation length
• SiGe(001) layers on Si(001) example
• Why we need channel analyzer
• What can we learn from reciprocal space maps
• SrRuO3 and La0.67Sr0.33MnO3 films example
• Summary
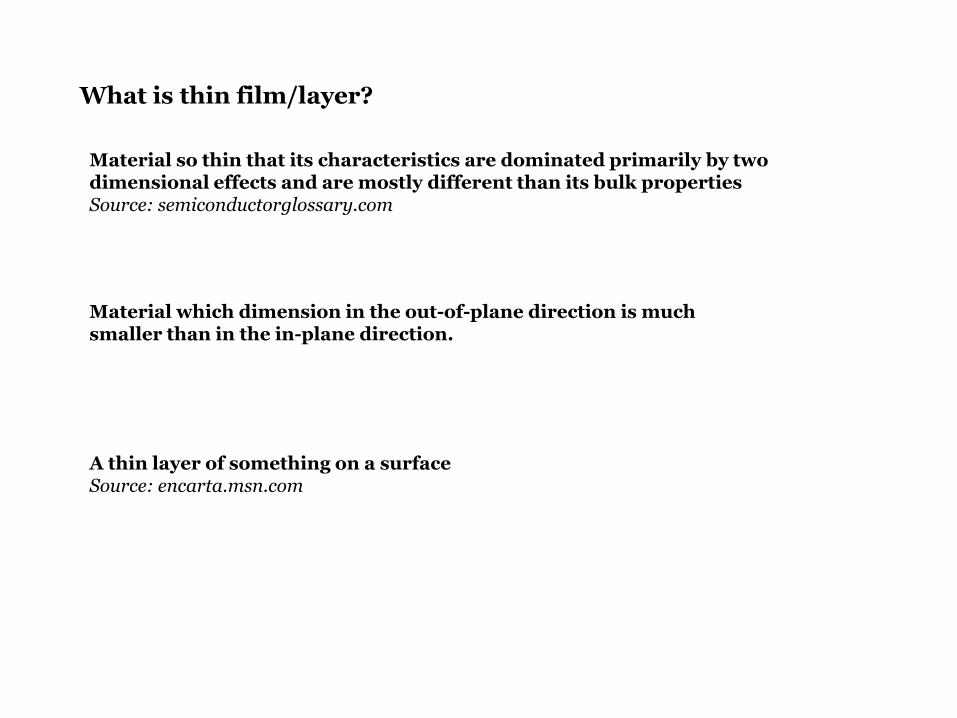
What is thin film/layer?
Material so thin that its characteristics are dominated primarily by two dimensional effects and are mostly different than its bulk propertiesSource: semiconductorglossary.com
A thin layer of something on a surfaceSource: encarta.msn.com
Material which dimension in the out-of-plane direction is much smaller than in the in-plane direction.
Epitaxial Layer
A single crystal layer that has been deposited or grown on a crystalline substrate having the same structural arrangement.Source: photonics.com
A crystalline layer of a particular orientation on top of another crystal, where the orientation is determined by the underlying crystal.
Homoepitaxial layerthe layer and substrate are the same material and possess the same lattice parameters.
Heteroepitaxial layerthe layer material is different than the substrate and usually has different lattice parameters.
Thin films structural types
Structure Type Definition
Perfect epitaxial Single crystal in perfect registry with the substrate that is also perfect.
Nearly perfect epitaxial Single crystal in nearly perfect registry with the substrate that is also nearly perfect.
Textured epitaxialLayer orientation is close to registry with the substrate in both in-plane and out-of-plane directions. Layer consists of mosaic blocks.
Textured polycrystalline Crystalline grains are preferentially oriented out-of-plane but random in-plane. Grain size distribution.
Perfect polycrystalline Randomly oriented crystallites similar in size and shape.
Amorphous Strong interatomic bonds but no long range order.
P.F. Fewster “X-ray Scattering from Semiconductors”
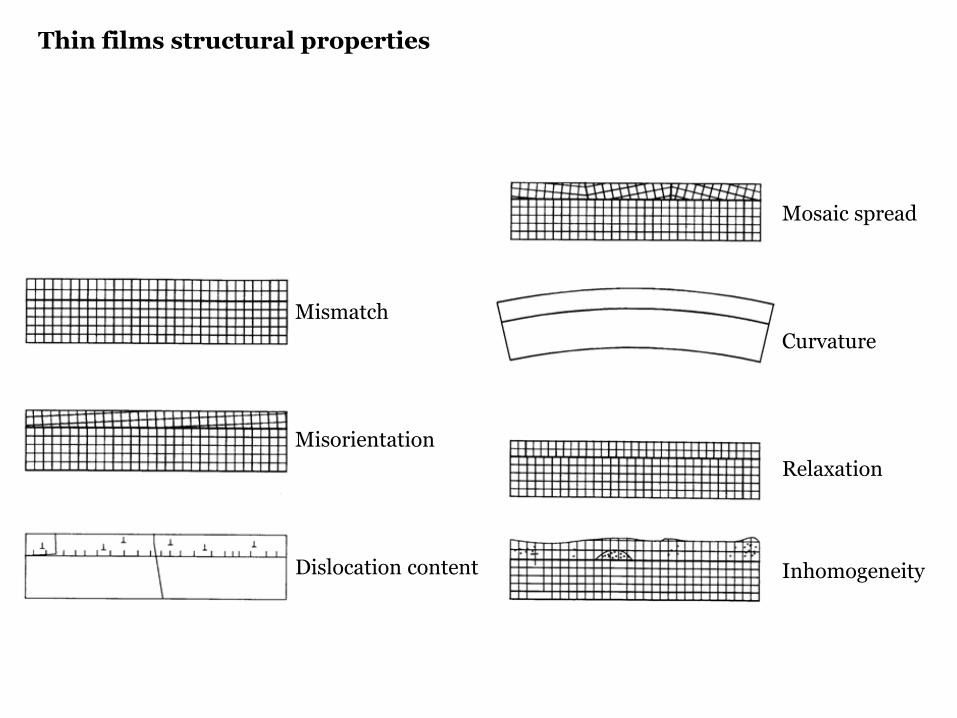
Mosaic spread
Curvature
Relaxation
Inhomogeneity
Mismatch
Misorientation
Dislocation content
Thin films structural properties
Crystalline state of the layers: Epitaxial (coherent with the substrate, relaxed) Polycrystalline (random orientation, preferred orientation) Amorphous
Crystalline quality
Strain state (fully or partially strained, fully relaxed)
Interference fringes observed in the scattering pattern, due to different optical paths of the x-rays, are related to the thickness of the layer:
( )( )21
21
sinsin2 ωωλ
−−
=nnt
Layer Thickness
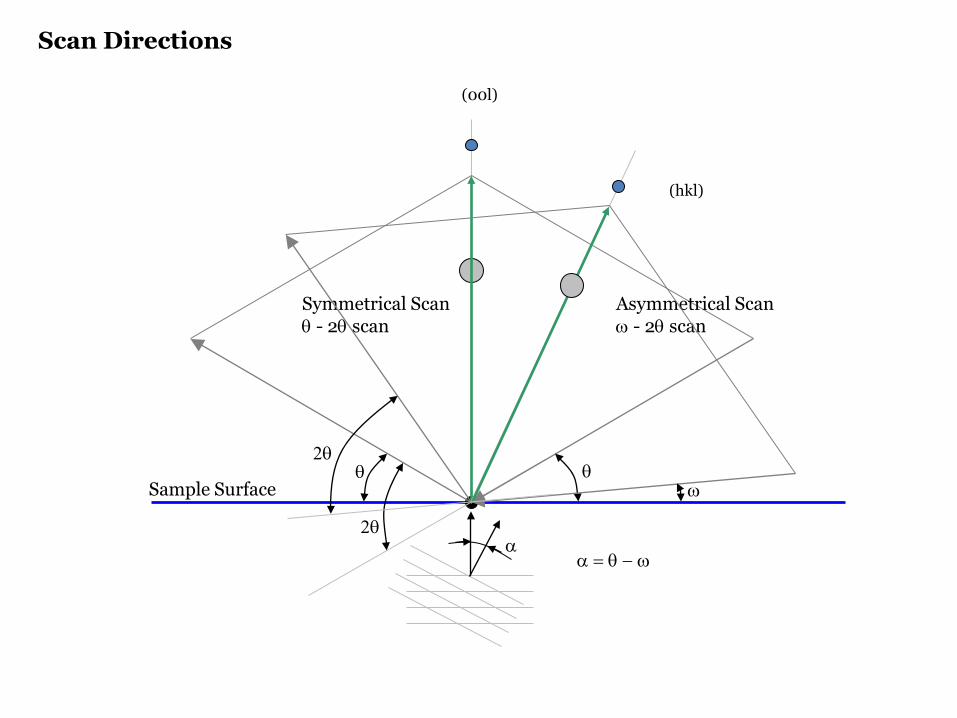
(000)
(00l)
(hkl)
Partially Relaxed + Mosaicity
(000)
(00l)
(hkl)
Partially Relaxed + Thin
(000)
(00l)
ω direction
ω-2θ direction
Mosaicity
Defined by receiving optics (e.g. slits) Defined by incident
optics – monochromator
S
L
Symmetrical scan
(000)
(00l)
ω direction
ω-2θ direction
Symmetrical Scan
receivingslit
analyzercrystal
mosaicity
receivingslit
analyzercrystal
d-spacing variation
Ge content: 50% 40% 30% 20% 10%
Triple axis diffractometry
Open detector
Triple axis
Open detector
Triple axis
(000)
(00l)(hkl)
SymmetricalScan
AsymmetricalScan
(000)
(00l)
(hkl)
(00l) scan
(h00) scan(h00)
ω-scan
ω-2θ scan
h-scan
l-scan
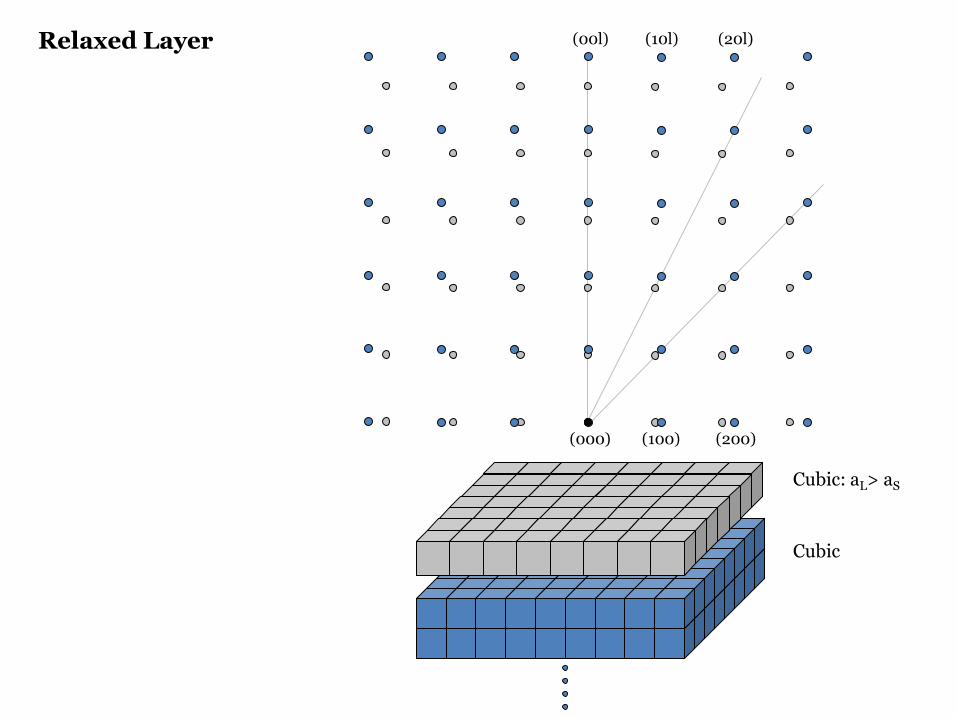
Relaxed SiGe on Si(001)
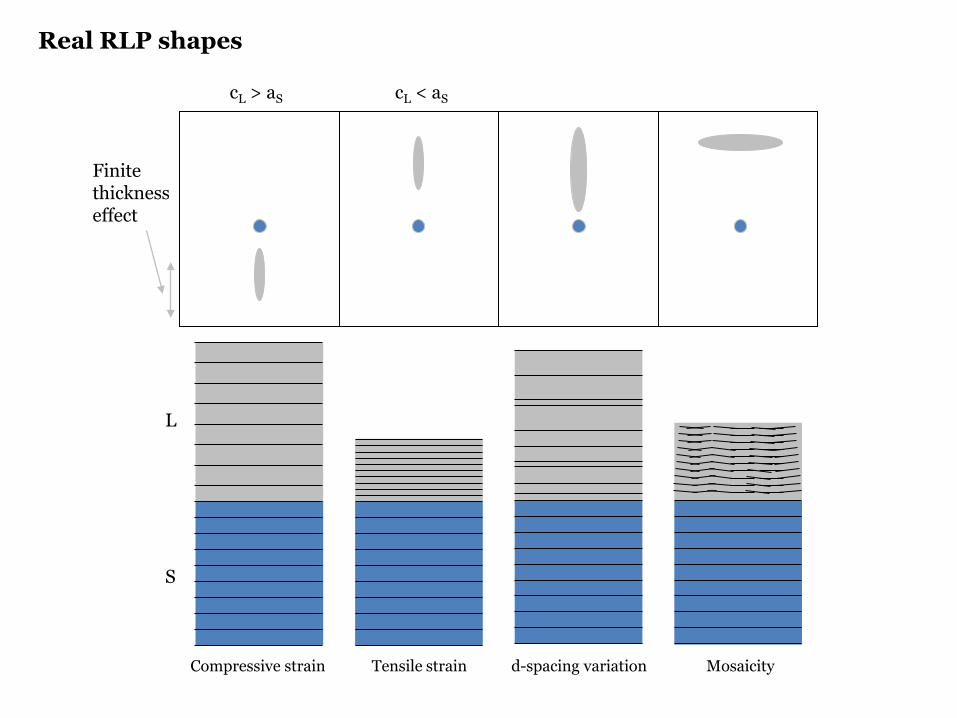
Shape of the RLP might provide much more information
Relaxed SiGe on Si(001)
(oo4) RLM
Si(004)
SiGe(004)
(004) (113)
(000)
(00l)(hkl)
ω-scan
ω-2θ scan
100×−−
=S
RL
SL
aaaaR
The relaxation is defined as:
Relaxation
Grazing incidence Grazing exit Symmetrical scan
To separate the layer tilt from the true splitting we can make grazing incidence and grazing exit measurements:
The effect of tilt on the peak splitting is reversed if the specimen is rotated by 180o about its surface normal.
The splitting due to mismatch will not be affected by such rotation
ϕθθ ∆+∆=∆ gi– grazing incidence
– grazing exitϕθθ ∆−∆=∆ ge
giθ∆ geθ∆ symθ∆
ϕθ −BBθ2 ϕθ +B Bθ2
Bθ2Bθ
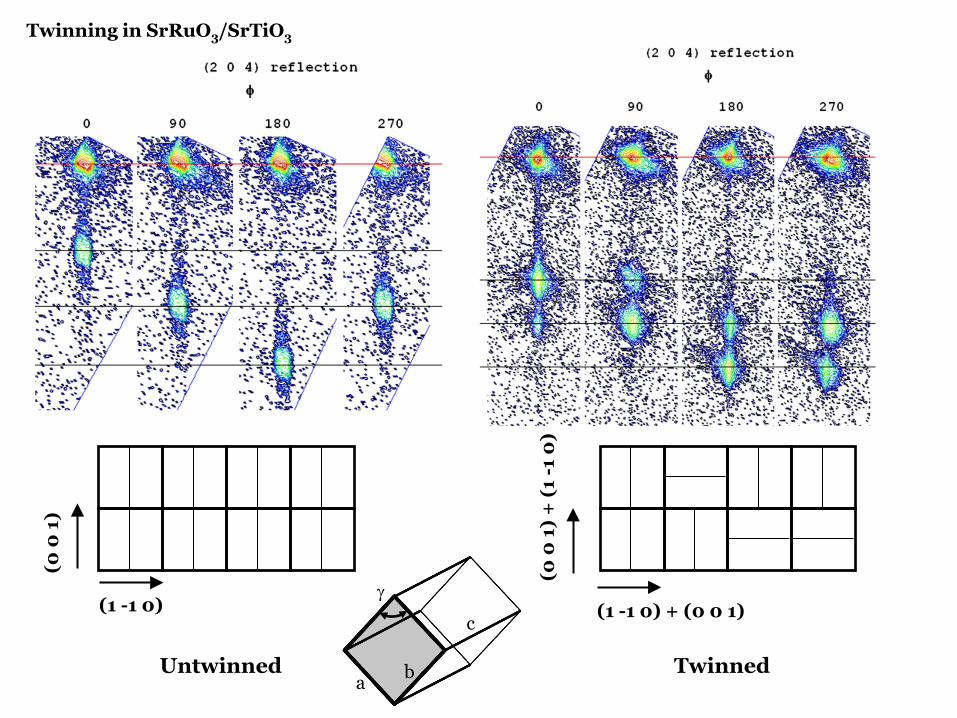
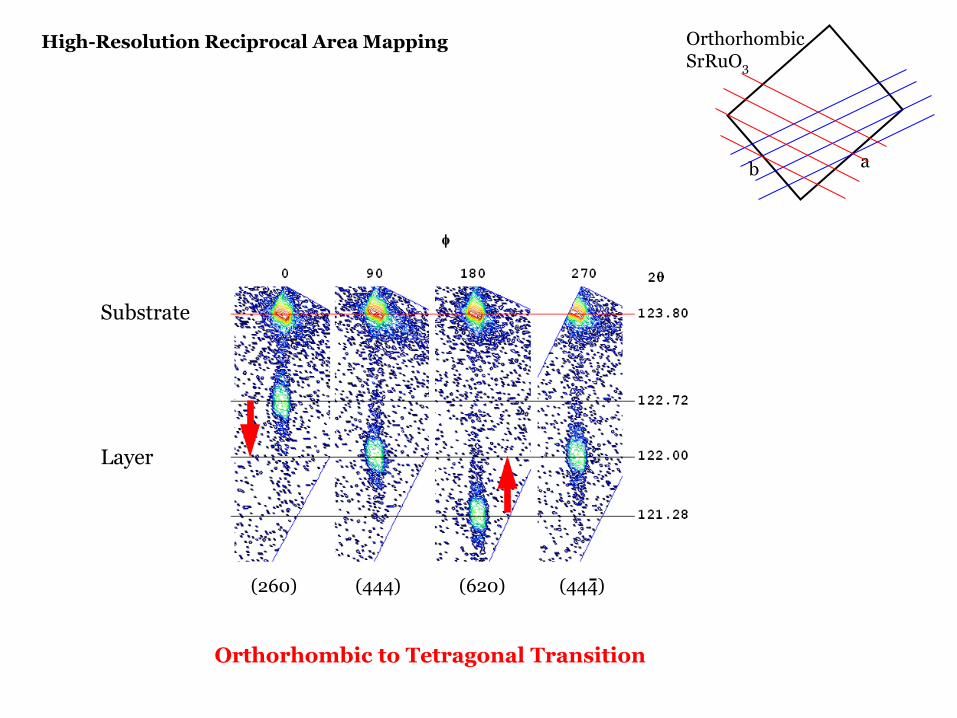
Relaxation
Considering (tetragonal distortion):
φφφθθθ
∆+=∆+=
SL
SL
φ – angle between reflecting plane and the surface
LLL cba ≠=
we obtain cell constants for the (00l )-oriented layer:
2
22
sin2
cossin2
lkhla
lc
LL
LLL
+=
=
θλ
φθλ
−−
−−
=
νν
νν
121
12 LL
RL
aca
The Mosaic Spread and Lateral Correlation Length functionality derives information from the shape of a layer peak in a diffraction space map recorded using an asymmetrical reflection