Page 1
Int. J. Mol. Sci. 2011, 12, 7885-7897; doi:10.3390/ijms12117885
International Journal of
Molecular Sciences ISSN 1422-0067
www.mdpi.com/journal/ijms
Article
Thin Layer Drying Kinetics of By-Products from
Olive Oil Processing
Irene Montero *, Teresa Miranda, Jose Ignacio Arranz and Carmen Victoria Rojas
Department of Mechanical, Energetic, and Materials Engineering, Industrial Engineering School,
University of Extremadura, Avenue Elvas s/n, 06006, Badajoz, Spain;
E-Mails: [email protected] (T.M.); [email protected] (J.I.A.); [email protected] (C.V.R.)
* Author to whom correspondence should be addressed; E-Mail: [email protected] ;
Tel.: +34-924-289600; Fax: +34-924-289601.
Received: 1 September 2011; in revised form: 25 October 2011 / Accepted: 31 October 2011 /
Published: 15 November 2011
Abstract: The thin-layer behavior of by-products from olive oil production was determined
in a solar dryer in passive and active operation modes for a temperature range of 20–50 °C.
The increase in the air temperature reduced the drying time of olive pomace, sludge and
olive mill wastewater. Moisture ratio was analyzed to obtain effective diffusivity values,
varying in the oil mill by-products from 9.136 × 10⁻¹¹
to 1.406 × 10⁻⁹
m2/s in forced
convection (ma = 0.22 kg/s), and from 9.296 × 10⁻¹¹
to 6.277 × 10⁻¹⁰
m2/s in natural
convection (ma = 0.042 kg/s). Diffusivity values at each temperature were obtained using
the Fick’s diffusion model and, regardless of the convection, they increased with the air
temperature. The temperature dependence on the effective diffusivity was determined by an
Arrhenius type relationship. The activation energies were found to be 38.64 kJ/mol,
30.44 kJ/mol and 47.64 kJ/mol for the olive pomace, the sludge and the olive mill
wastewater in active mode, respectively, and 91.35 kJ/mol, 14.04 kJ/mol and 77.15 kJ/mol
in natural mode, in that order.
Keywords: olive oil residues; thin layer; drying kinetics; diffusion coefficient;
activation energy
Nomenclature
At surface of the tray (m2)
AM active mode (forced convection)
OPEN ACCESS
Page 2
Int. J. Mol. Sci. 2011, 12 7886
Deff effective diffusivity (m2/s)
D0 pre-exponential factor (m2/s)
Ea activation energy (kJ/mol)
L thickness of the slab (m)
ma air mass flow rate (kg/s)
M0 initial moisture content (kg water/kg dry matter)
Mt moisture content at time t (kg water/kg dry matter)
M0db initial moisture content, dry basis (kg water/kg dry matter)
Mtdb moisture content at time t, dry basis (kg water/kg dry matter)
MR moisture ratio (dimensionless)
n number of observations
OMW olive mill wastewater
OP olive pomace
PM passive mode (natural convection)
R universal gas constant (8.314 J/(mol K))
R2 coefficient of determination
SLG sludge residue
T temperature (K)
t drying time (h)
W0 initial weight of dried product (kg)
ρ bulk density (kg/m3)
1. Introduction
The high amount of residues derived from the olive oil production, together with its temporary and
highly concentrated generation, causes a serious problem in all areas from which it originated.
Spain is one of the main productive and exporting countries world-wide, producing more than
1 × 10⁶ tons/year of olive oil. According to the Agency for Olive Oil [1], Spain produced 1.11 × 10
6,
1.24 × 10⁶ and 1.03 × 10
6 tons of olive oil in the harvests of 2006/2007, 2007/2008 and 2008/2009,
respectively. The oil extraction in the olive oil mill industry is mainly made using two systems: a three-
phase or two-phase system.
In the three-phase extraction system, the residue consists of olive pomace and olive mill wastewater,
whereas the latter produces an aqueous residue (moisture 90–95%, wet basis), extremely hazardous to
the environment due to its high polyphenolic content [2,3]. Olive pomace constituents are pulp, olive
stone, residual oil and water (moisture 50–55%, wet basis). This residue still contains residual oil (3–
8% in weight) after its extraction, though for its use in small boilers it must be dried out. The most
usual drying system of the olive pomace is in a rotary dryer heated up by a hot gas stream, although this
operation demands a high energy consumption [2,4].
In the two-phase extraction system, the residue consists of olive sludge (moisture 60–70%, wet basis).
This residue is also highly hazardous for the environment due to its high phenolic content [5].
Page 3
Int. J. Mol. Sci. 2011, 12 7887
Sometimes the sludge is three-phase re-processed in order to extract the oil contents, producing olive
pomace and olive mill wastewater as residues.
The three-phase extraction system is the most commonly used in olive oil producing countries.
However, from the 1991/1992 harvest, Spain mainly uses the two-phase system since it is considered
to be a more ecological system as it does not produce olive mill wastewater. Nevertheless, the residue
treatment problem was transferred to the extractors that had to contend with large amounts of
difficult-to-process sludge.
According to olive mill wastewater and sludge characteristics, different treatments have been
investigated. In the case of sludge: thermal treatments [6,7], anaerobic digestion [8], composting and
bioremediation [9]; and in the case of olive mill wastewater: thermal treatments [10], aerobic treatments [11],
centrifugation-ultrafiltration [12], anaerobic digestion [13], composting and bioremediation [14],
fertilizer [15], photocatalysis [16], distillation [17], chemical treatments [18,19], floculation [20],
ultrafiltration [21], etc. Currently, there is no completely efficient system for the management of these
residues, and most of those existing, present some limitations that make their implementation difficult [9].
One of the treatment-assessment options is found in thermal applications, but the high energy
consumption in the drying operations and various economic and technological problems limit its
actual implementation.
Solar drying processes can be a very attractive technology for the treatment of olive oil mill residues
in order to decrease the high energy consumption derived from the drying operations, thus decreasing
the environmental impact of these residues [2,4]. In literature, there are numerous studies on the solar
drying of vegetables, fruit and agricultural and agroindustrial residues [22–37]. However, there are
only a few studies on solar drying at low temperature of olive oil mill residues and most of them are
related to olive pomace. For instance, Akgun and Doymaz [38,39] studied the thin layer drying kinetics
of olive cake (olive pomace in this work) in the drying range temperature of
50–110 °C. Gögüs and Maskan [5] researched the drying process of olive cake at 60–80 °C and Celma [2,3]
studied the drying kinetics of sludge and olive husk at temperatures ranging from 20 to 140 °C.
In this work, the thin layer drying kinetics of the oil mill industry by-products (olive pomace (OP),
sludge (SLG) and olive mill wastewater (OMW)) is examined. The resulting by-products, once dried
out, have a final application as fuel. Therefore, the aim of this study is to determine the effective
diffusivity and activation energy of the olive oil industry waste, in order to establish the feasible
applicability of solar drying, as well as the influence of the operational variables on the drying time,
thus allowing its actual use as a fuel.
The drying process was carried out at low temperatures, in the range of 20–50 °C, in natural and
forced convection in a solar dryer designed, constructed and installed at the Industrial Engineering
School in Badajoz, Extremadura (Spain).
The moisture ratio obtained (MR) in OP, SLG and OMW, in several tests at different temperatures
and operating modes, is shown. Likewise, the effective diffusivity coefficients of moisture transfer and
the activation energy for moisture diffusion have been calculated for the temperature ranges and the
established operation modes.
Page 4
Int. J. Mol. Sci. 2011, 12 7888
2. Material and Methods
2.1. Material
The by-product samples of olive oil production were obtained from an oil mill by-products
treatment plant located in the province of Badajoz, Spain.
The initial moisture content of OP, SLG and OMW was of (55 ± 0.50%), (70 ± 0.50%) and
(90 ± 0.50%) by weight (wet basis), respectively. Six tests were carried out for each product in order to
obtain a reasonable average. As can be observed, oil mill industry residues present high moisture
contents, higher than agricultural residues, wood residues, sewage sludge, brown coal, peat and
bituminous coal [40,41]. With the intention of comparing the drying ratios, the limit moisture established
in the drying process for the three selected by-products was (20 ± 0.50%) by weight (wet basis).
Another necessary parameter for the drying kinetic study is the bulk density. Results obtained for
the selected by-products before and after the drying process are shown in Table 1.
Table 1. Bulk density values of OP, SLG and OMW before and after the drying process.
OP SLG OMW
Bulk density, ρ, before the drying process (kg/m3) 703.2 1065.4 1022.4
Bulk density, ρ, after the drying process (kg/m3) 559.3 601.3 1035.2
Most agricultural residues have low bulk densities. Nevertheless, if the values obtained are
compared with those derived from other biomass residues, by-products from the processed olive
present densities much higher than those from the grain straw (50–120 kg/m3), rice husk (122 kg/m
3),
industrial tomato residue (140 kg/m3), cork dust (285 kg/m
3) or wood splinters (160–235 kg/m
3) [40,41].
Related to conventional fuels [41], pomace and sludge present lower densities than those derived from
the bituminous coal (800–900 kg/m3), and similar values to lignites (560–600 kg/m
3), while olive mill
wastewater presents a much higher density.
2.2. Experimental Set-Up
The solar dryer used in the experimental campaign, described previously by Celma [2] and Montero [42],
consisted mainly of a flat plate collector, a drying chamber, a ventilator and a chimney. The flat
collector is simple type and the drying chamber has two trays with weight sensors where the samples
are placed to be dried. The moisture loss was monitored by the sensors in the trays through the drying
process. The dimensions of these trays are 890 × 280 mm (At = 0.2492 m).
The ventilator allows changing the operation mode: forced or natural convection, that is, active
mode (AM) or passive mode (PM). The chimney improves the performance of the system in passive
mode, thus increasing the passage speed of the drying air. The moisture ratio were obtained (MR) for natural
and forced convection with average flows of 0.042 kg/s (passive mode) and 0.22 kg/s (active mode).
Samples were uniformly distributed on the tray as a thin layer and for each experiment their mass
was kept constant, with a sample thickness of approximately 20–40 mm. The following parameters
(temperature, relative humidity, air flow rate, product weight) were monitored through sensors at
identical intervals in order to be tested and optimized according to Montero [42].
Page 5
Int. J. Mol. Sci. 2011, 12 7889
2.3. Experimental Procedure
Drying experiments were performed in Badajoz, Spain. The samples (OP, SLG and OMW) were
distributed uniformly on the trays as a thin layer. Drying experiments were performed in active and
passive mode with temperatures ranging from 20 °C, 30 °C and 40 °C in AM, and 40 °C and 50 °C in PM.
The tests were made for an initial amount of residue of 2000 g in each of the drying trays. Moisture
loss was monitored at five minute intervals from M0 (55%, 70% or 90%) to 20% of final moisture.
Three replications of each experiment were carried out.
The drying data from the different samples were expressed as MR versus the drying time.
3. Results and Discussion
3.1. Analysis of the Drying Curves
The moisture content values obtained for the range of air temperatures of 20–30–40 °C and 40–50 °C in
AM and PM, respectively, were converted into the moisture ratio, MR. The dimensionless moisture
ratio was calculated using the simplified Equation (1) [2,43]:
0/ MMMR t= (1)
where Mt and M0 are the moisture content at a given time and the initial moisture content, respectively.
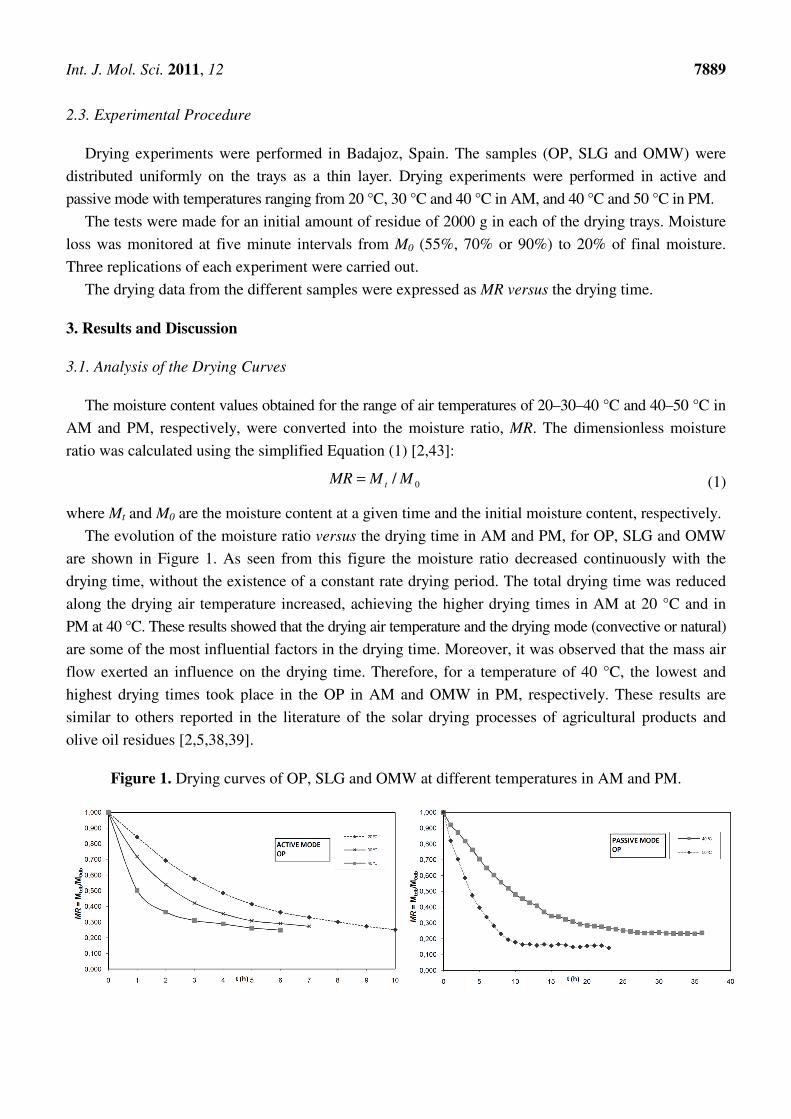
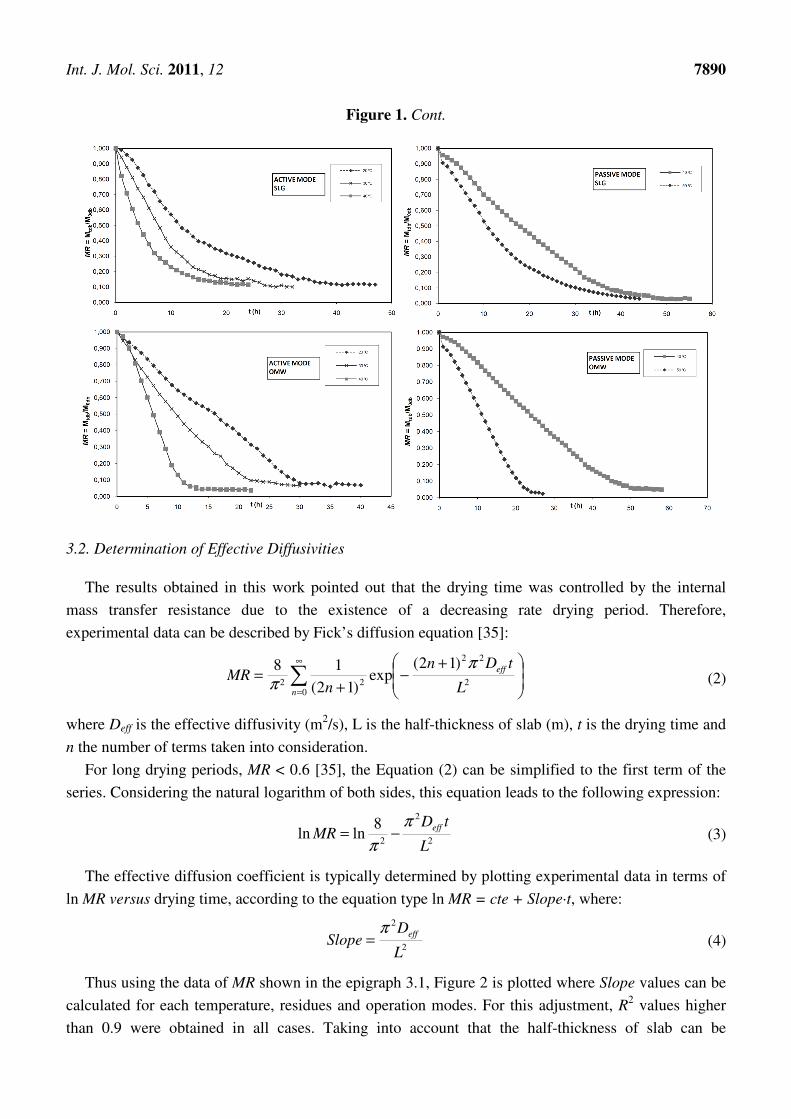
The evolution of the moisture ratio versus the drying time in AM and PM, for OP, SLG and OMW
are shown in Figure 1. As seen from this figure the moisture ratio decreased continuously with the
drying time, without the existence of a constant rate drying period. The total drying time was reduced
along the drying air temperature increased, achieving the higher drying times in AM at 20 °C and in
PM at 40 °C. These results showed that the drying air temperature and the drying mode (convective or natural)
are some of the most influential factors in the drying time. Moreover, it was observed that the mass air
flow exerted an influence on the drying time. Therefore, for a temperature of 40 °C, the lowest and
highest drying times took place in the OP in AM and OMW in PM, respectively. These results are
similar to others reported in the literature of the solar drying processes of agricultural products and
olive oil residues [2,5,38,39].
Figure 1. Drying curves of OP, SLG and OMW at different temperatures in AM and PM.
Page 6
Int. J. Mol. Sci. 2011, 12 7890
Figure 1. Cont.
3.2. Determination of Effective Diffusivities
The results obtained in this work pointed out that the drying time was controlled by the internal
mass transfer resistance due to the existence of a decreasing rate drying period. Therefore,
experimental data can be described by Fick’s diffusion equation [35]:
+−
+= ∑
∞
=
2
22
022
)12(exp
)12(
18
L
tDn
nMR
eff
n
π
π (2)
where Deff is the effective diffusivity (m2/s), L is the half-thickness of slab (m), t is the drying time and
n the number of terms taken into consideration.
For long drying periods, MR < 0.6 [35], the Equation (2) can be simplified to the first term of the
series. Considering the natural logarithm of both sides, this equation leads to the following expression:
2
2
2
8lnln
L
tDMR
effπ
π−= (3)
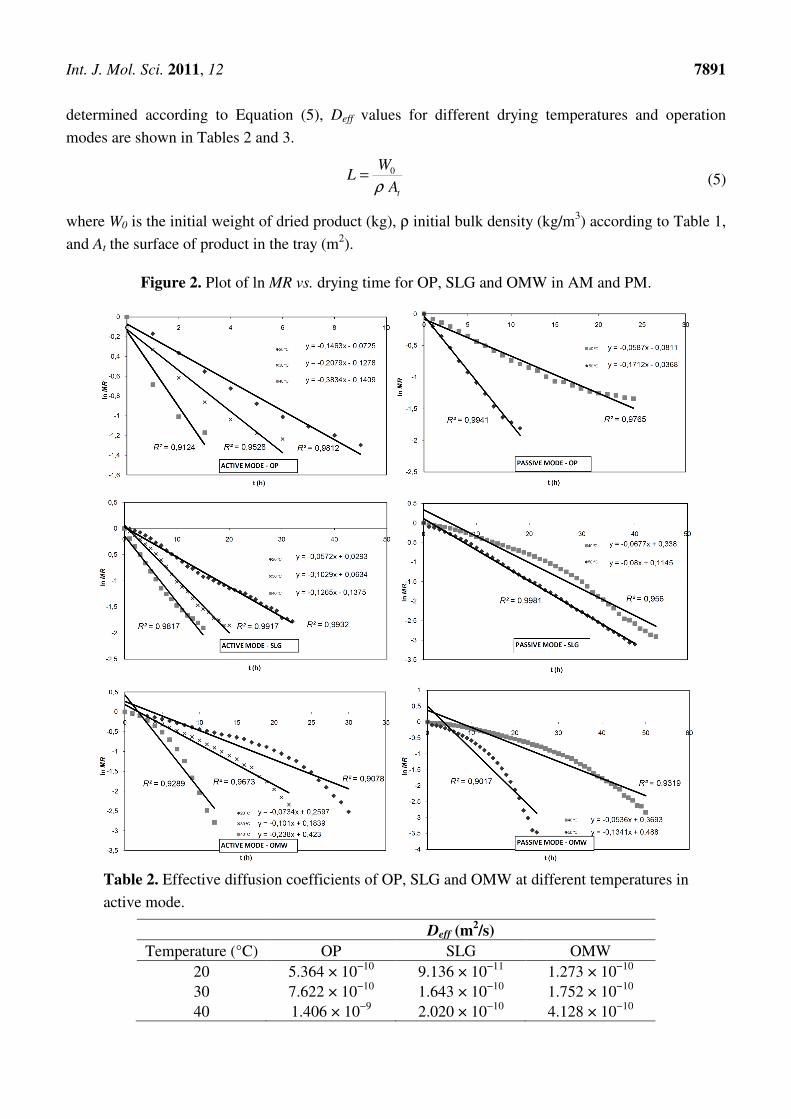
The effective diffusion coefficient is typically determined by plotting experimental data in terms of
ln MR versus drying time, according to the equation type ln MR = cte + Slope·t, where:
2
2
L
DSlope
effπ= (4)
Thus using the data of MR shown in the epigraph 3.1, Figure 2 is plotted where Slope values can be
calculated for each temperature, residues and operation modes. For this adjustment, R2 values higher
than 0.9 were obtained in all cases. Taking into account that the half-thickness of slab can be
Page 7
Int. J. Mol. Sci. 2011, 12 7891
determined according to Equation (5), Deff values for different drying temperatures and operation
modes are shown in Tables 2 and 3.
tA
WL
0
ρ= (5)
where W0 is the initial weight of dried product (kg), ρ initial bulk density (kg/m3) according to Table 1,
and At the surface of product in the tray (m2).
Figure 2. Plot of ln MR vs. drying time for OP, SLG and OMW in AM and PM.
Table 2. Effective diffusion coefficients of OP, SLG and OMW at different temperatures in
active mode.
Deff (m2/s)
Temperature (°C) OP SLG OMW
20 5.364 × 10⁻¹⁰
9.136 × 10⁻¹¹
1.273 × 10⁻¹⁰
30 7.622 × 10⁻¹⁰
1.643 × 10⁻¹⁰
1.752 × 10⁻¹⁰
40 1.406 × 10⁻⁹
2.020 × 10⁻¹⁰
4.128 × 10⁻¹⁰
Page 8
Int. J. Mol. Sci. 2011, 12 7892
Table 3. Effective diffusion coefficients of OP, SLG and OMW at different temperatures in
passive mode.
Deff (m2/s)
Temperature (°C) OP SLG OMW
40 2.119 × 10⁻¹⁰
1.081 × 10⁻¹⁰
9.296 × 10⁻¹¹
50 6.277 × 10⁻¹⁰
1.278 × 10⁻¹⁰
2.326 × 10⁻¹⁰
As shown in Tables 2 and 3, the effective diffusivities at 20–40 °C in active mode for OP, SLG and
OMW varied in the range from 9.136 × 10⁻¹¹
to 1.406 × 10⁻⁹
. Furthermore, at 40–50 °C and in passive
mode effective diffusivities were found in the range from 9.296 × 10⁻¹¹
to 6.277 × 10⁻¹⁰
. As expected,
the values of Deff increased significantly with the increasing temperature. Additionally, the values of
Deff obtained in AM (Table 2) for the SLG are lower than those observed for the OMW, giving rise to
AM to higher drying times in the SLG in spite of having less content of initial moisture than the OMW.
The Deff values obtained are found in the usual range from 10−11
to 10−9
m2/s, as reported in other
agricultural materials [23–27,30,31].
3.3. Calculation of the Activation Energy
The activation energy in a drying process, Ea, is the minimum amount of energy that must be
overcome for this process to occur. The value Ea is closely related to the Deff coefficient and its
dependence with the temperature can be expressed by an Arrhenius model [39]:
−=
RT
EDD a
ff exp0e (6)
where D0 is the pre-exponential factor of the Arrhenius equation (m2/s), Ea is the activation energy of
the moisture diffusion (kJ/mol), R is the universal gas constant (8.314 J/(mol K)), and T is the air
absolute temperature (K).
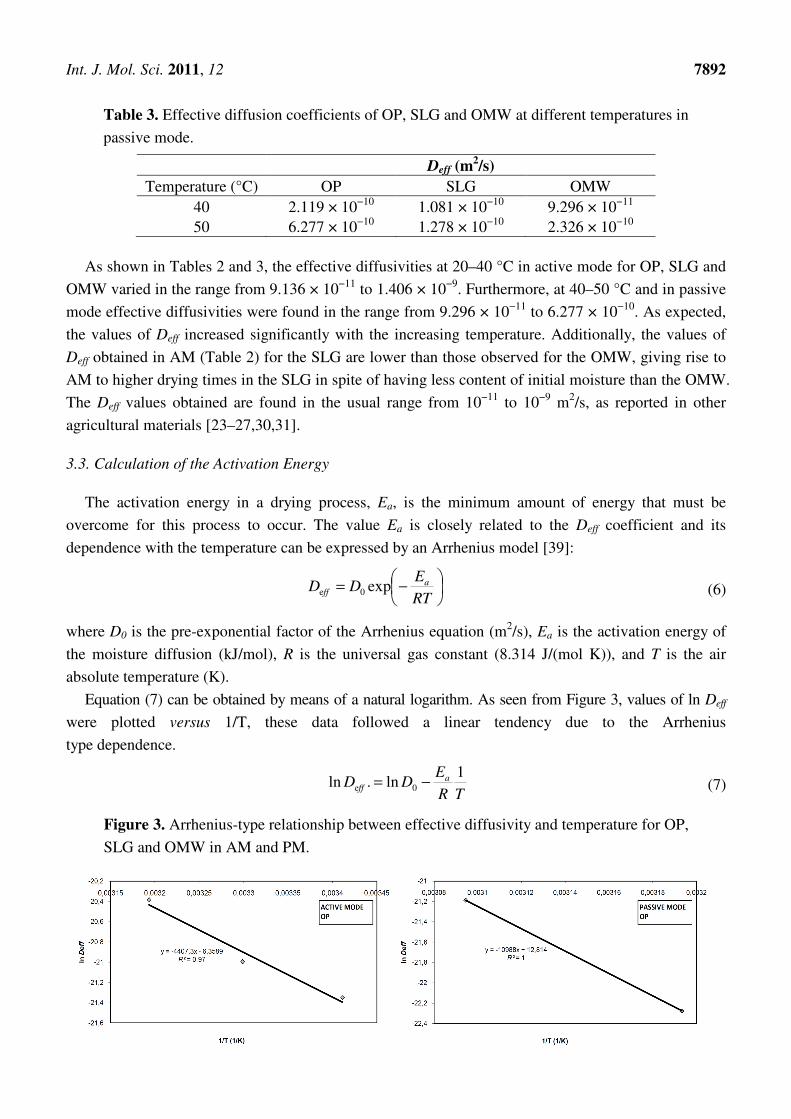
Equation (7) can be obtained by means of a natural logarithm. As seen from Figure 3, values of ln Deff
were plotted versus 1/T, these data followed a linear tendency due to the Arrhenius
type dependence.
TR
EDD a
ff
1ln.ln 0e −= (7)
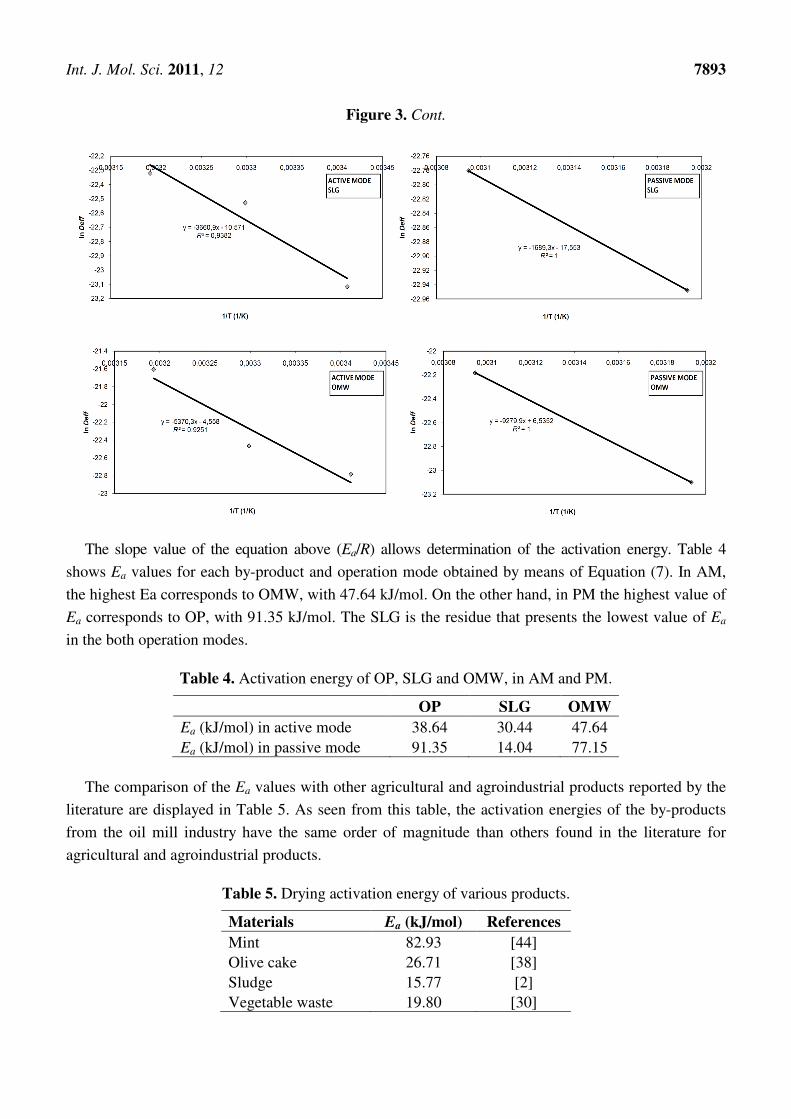
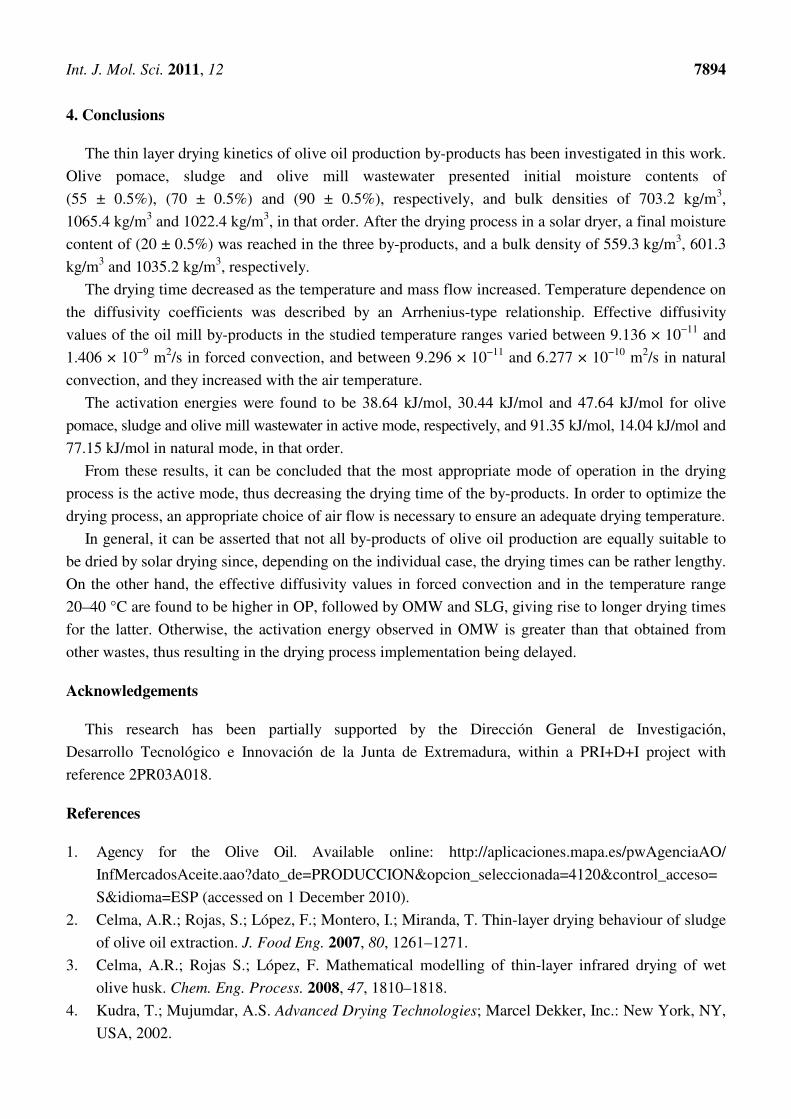
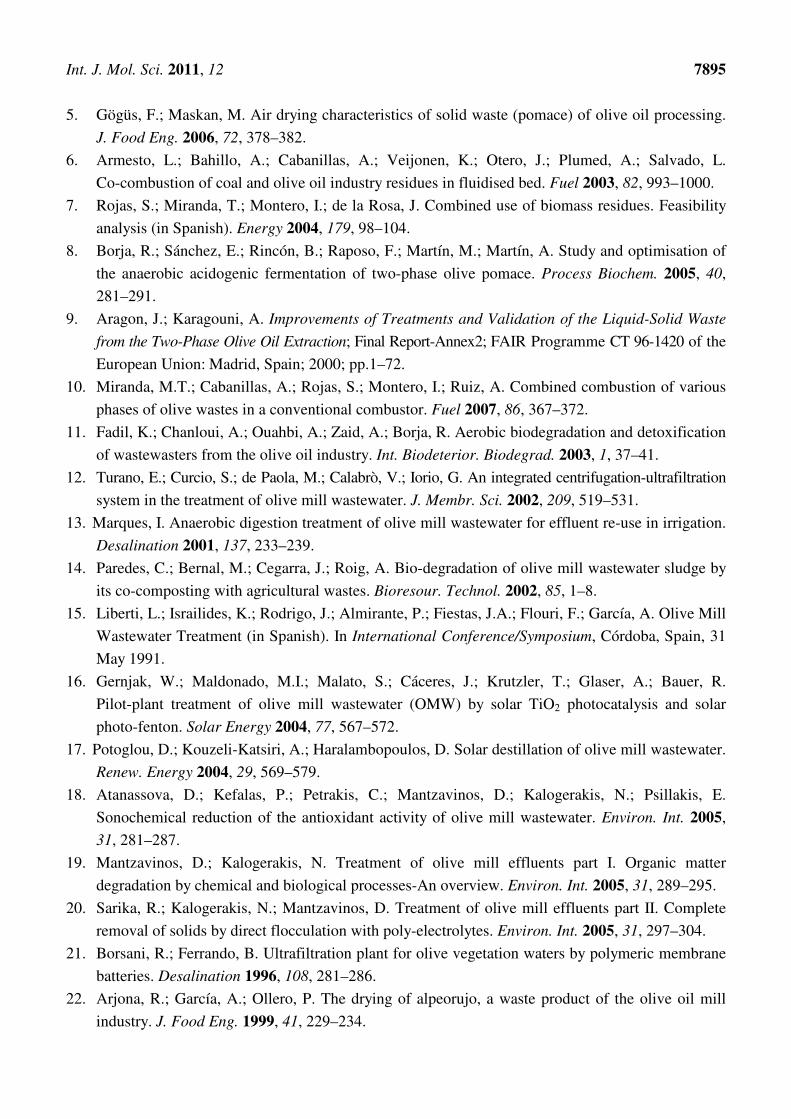
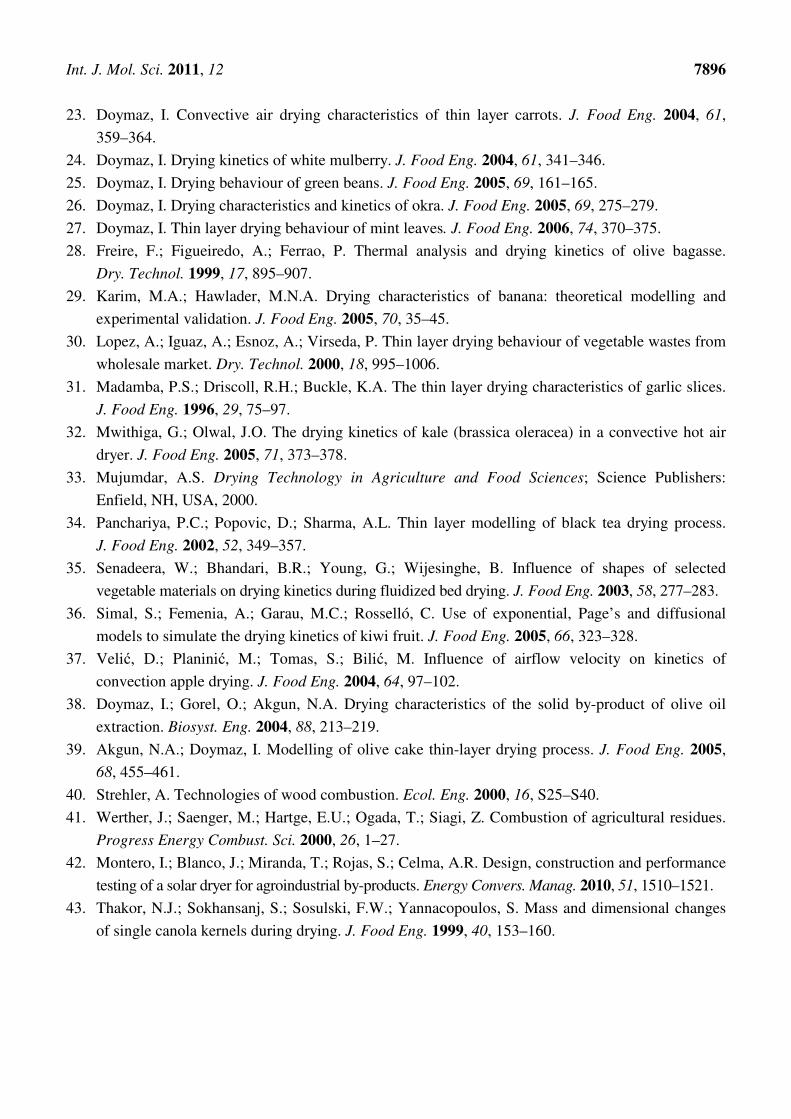
Figure 3. Arrhenius-type relationship between effective diffusivity and temperature for OP,
SLG and OMW in AM and PM.
Page 9
Int. J. Mol. Sci. 2011, 12 7893
Figure 3. Cont.
The slope value of the equation above (Ea/R) allows determination of the activation energy. Table 4
shows Ea values for each by-product and operation mode obtained by means of Equation (7). In AM,
the highest Ea corresponds to OMW, with 47.64 kJ/mol. On the other hand, in PM the highest value of
Ea corresponds to OP, with 91.35 kJ/mol. The SLG is the residue that presents the lowest value of Ea
in the both operation modes.
Table 4. Activation energy of OP, SLG and OMW, in AM and PM.
OP SLG OMW
Ea (kJ/mol) in active mode 38.64 30.44 47.64
Ea (kJ/mol) in passive mode 91.35 14.04 77.15
The comparison of the Ea values with other agricultural and agroindustrial products reported by the
literature are displayed in Table 5. As seen from this table, the activation energies of the by-products
from the oil mill industry have the same order of magnitude than others found in the literature for
agricultural and agroindustrial products.
Table 5. Drying activation energy of various products.
Materials Ea (kJ/mol) References
Mint 82.93 [44]
Olive cake 26.71 [38]
Sludge 15.77 [2]
Vegetable waste 19.80 [30]
Page 10
Int. J. Mol. Sci. 2011, 12 7894
4. Conclusions
The thin layer drying kinetics of olive oil production by-products has been investigated in this work.
Olive pomace, sludge and olive mill wastewater presented initial moisture contents of
(55 ± 0.5%), (70 ± 0.5%) and (90 ± 0.5%), respectively, and bulk densities of 703.2 kg/m3,
1065.4 kg/m3 and 1022.4 kg/m
3, in that order. After the drying process in a solar dryer, a final moisture
content of (20 ± 0.5%) was reached in the three by-products, and a bulk density of 559.3 kg/m3, 601.3
kg/m3 and 1035.2 kg/m
3, respectively.
The drying time decreased as the temperature and mass flow increased. Temperature dependence on
the diffusivity coefficients was described by an Arrhenius-type relationship. Effective diffusivity
values of the oil mill by-products in the studied temperature ranges varied between 9.136 × 10⁻¹¹
and
1.406 × 10⁻⁹
m2/s in forced convection, and between 9.296 × 10
−11 and 6.277 × 10
−10 m
2/s in natural
convection, and they increased with the air temperature.
The activation energies were found to be 38.64 kJ/mol, 30.44 kJ/mol and 47.64 kJ/mol for olive
pomace, sludge and olive mill wastewater in active mode, respectively, and 91.35 kJ/mol, 14.04 kJ/mol and
77.15 kJ/mol in natural mode, in that order.
From these results, it can be concluded that the most appropriate mode of operation in the drying
process is the active mode, thus decreasing the drying time of the by-products. In order to optimize the
drying process, an appropriate choice of air flow is necessary to ensure an adequate drying temperature.
In general, it can be asserted that not all by-products of olive oil production are equally suitable to
be dried by solar drying since, depending on the individual case, the drying times can be rather lengthy.
On the other hand, the effective diffusivity values in forced convection and in the temperature range
20–40 °C are found to be higher in OP, followed by OMW and SLG, giving rise to longer drying times
for the latter. Otherwise, the activation energy observed in OMW is greater than that obtained from
other wastes, thus resulting in the drying process implementation being delayed.
Acknowledgements
This research has been partially supported by the Dirección General de Investigación,
Desarrollo Tecnológico e Innovación de la Junta de Extremadura, within a PRI+D+I project with
reference 2PR03A018.
References
1. Agency for the Olive Oil. Available online: http://aplicaciones.mapa.es/pwAgenciaAO/
InfMercadosAceite.aao?dato_de=PRODUCCION&opcion_seleccionada=4120&control_acceso=
S&idioma=ESP (accessed on 1 December 2010).
2. Celma, A.R.; Rojas, S.; López, F.; Montero, I.; Miranda, T. Thin-layer drying behaviour of sludge
of olive oil extraction. J. Food Eng. 2007, 80, 1261–1271.
3. Celma, A.R.; Rojas S.; López, F. Mathematical modelling of thin-layer infrared drying of wet
olive husk. Chem. Eng. Process. 2008, 47, 1810–1818.
4. Kudra, T.; Mujumdar, A.S. Advanced Drying Technologies; Marcel Dekker, Inc.: New York, NY,
USA, 2002.
Page 11
Int. J. Mol. Sci. 2011, 12 7895
5. Gögüs, F.; Maskan, M. Air drying characteristics of solid waste (pomace) of olive oil processing.
J. Food Eng. 2006, 72, 378–382.
6. Armesto, L.; Bahillo, A.; Cabanillas, A.; Veijonen, K.; Otero, J.; Plumed, A.; Salvado, L.
Co-combustion of coal and olive oil industry residues in fluidised bed. Fuel 2003, 82, 993–1000.
7. Rojas, S.; Miranda, T.; Montero, I.; de la Rosa, J. Combined use of biomass residues. Feasibility
analysis (in Spanish). Energy 2004, 179, 98–104.
8. Borja, R.; Sánchez, E.; Rincón, B.; Raposo, F.; Martín, M.; Martín, A. Study and optimisation of
the anaerobic acidogenic fermentation of two-phase olive pomace. Process Biochem. 2005, 40,
281–291.
9. Aragon, J.; Karagouni, A. Improvements of Treatments and Validation of the Liquid-Solid Waste
from the Two-Phase Olive Oil Extraction; Final Report-Annex2; FAIR Programme CT 96-1420 of the
European Union: Madrid, Spain; 2000; pp.1–72.
10. Miranda, M.T.; Cabanillas, A.; Rojas, S.; Montero, I.; Ruiz, A. Combined combustion of various
phases of olive wastes in a conventional combustor. Fuel 2007, 86, 367–372.
11. Fadil, K.; Chanloui, A.; Ouahbi, A.; Zaid, A.; Borja, R. Aerobic biodegradation and detoxification
of wastewasters from the olive oil industry. Int. Biodeterior. Biodegrad. 2003, 1, 37–41.
12. Turano, E.; Curcio, S.; de Paola, M.; Calabrò, V.; Iorio, G. An integrated centrifugation-ultrafiltration
system in the treatment of olive mill wastewater. J. Membr. Sci. 2002, 209, 519–531.
13. Marques, I. Anaerobic digestion treatment of olive mill wastewater for effluent re-use in irrigation.
Desalination 2001, 137, 233–239.
14. Paredes, C.; Bernal, M.; Cegarra, J.; Roig, A. Bio-degradation of olive mill wastewater sludge by
its co-composting with agricultural wastes. Bioresour. Technol. 2002, 85, 1–8.
15. Liberti, L.; Israilides, K.; Rodrigo, J.; Almirante, P.; Fiestas, J.A.; Flouri, F.; García, A. Olive Mill
Wastewater Treatment (in Spanish). In International Conference/Symposium, Córdoba, Spain, 31
May 1991.
16. Gernjak, W.; Maldonado, M.I.; Malato, S.; Cáceres, J.; Krutzler, T.; Glaser, A.; Bauer, R.
Pilot-plant treatment of olive mill wastewater (OMW) by solar TiO2 photocatalysis and solar
photo-fenton. Solar Energy 2004, 77, 567–572.
17. Potoglou, D.; Kouzeli-Katsiri, A.; Haralambopoulos, D. Solar destillation of olive mill wastewater.
Renew. Energy 2004, 29, 569–579.
18. Atanassova, D.; Kefalas, P.; Petrakis, C.; Mantzavinos, D.; Kalogerakis, N.; Psillakis, E.
Sonochemical reduction of the antioxidant activity of olive mill wastewater. Environ. Int. 2005,
31, 281–287.
19. Mantzavinos, D.; Kalogerakis, N. Treatment of olive mill effluents part I. Organic matter
degradation by chemical and biological processes-An overview. Environ. Int. 2005, 31, 289–295.
20. Sarika, R.; Kalogerakis, N.; Mantzavinos, D. Treatment of olive mill effluents part II. Complete
removal of solids by direct flocculation with poly-electrolytes. Environ. Int. 2005, 31, 297–304.
21. Borsani, R.; Ferrando, B. Ultrafiltration plant for olive vegetation waters by polymeric membrane
batteries. Desalination 1996, 108, 281–286.
22. Arjona, R.; García, A.; Ollero, P. The drying of alpeorujo, a waste product of the olive oil mill
industry. J. Food Eng. 1999, 41, 229–234.
Page 12
Int. J. Mol. Sci. 2011, 12 7896
23. Doymaz, I. Convective air drying characteristics of thin layer carrots. J. Food Eng. 2004, 61,
359–364.
24. Doymaz, I. Drying kinetics of white mulberry. J. Food Eng. 2004, 61, 341–346.
25. Doymaz, I. Drying behaviour of green beans. J. Food Eng. 2005, 69, 161–165.
26. Doymaz, I. Drying characteristics and kinetics of okra. J. Food Eng. 2005, 69, 275–279.
27. Doymaz, I. Thin layer drying behaviour of mint leaves. J. Food Eng. 2006, 74, 370–375.
28. Freire, F.; Figueiredo, A.; Ferrao, P. Thermal analysis and drying kinetics of olive bagasse.
Dry. Technol. 1999, 17, 895–907.
29. Karim, M.A.; Hawlader, M.N.A. Drying characteristics of banana: theoretical modelling and
experimental validation. J. Food Eng. 2005, 70, 35–45.
30. Lopez, A.; Iguaz, A.; Esnoz, A.; Virseda, P. Thin layer drying behaviour of vegetable wastes from
wholesale market. Dry. Technol. 2000, 18, 995–1006.
31. Madamba, P.S.; Driscoll, R.H.; Buckle, K.A. The thin layer drying characteristics of garlic slices.
J. Food Eng. 1996, 29, 75–97.
32. Mwithiga, G.; Olwal, J.O. The drying kinetics of kale (brassica oleracea) in a convective hot air
dryer. J. Food Eng. 2005, 71, 373–378.
33. Mujumdar, A.S. Drying Technology in Agriculture and Food Sciences; Science Publishers:
Enfield, NH, USA, 2000.
34. Panchariya, P.C.; Popovic, D.; Sharma, A.L. Thin layer modelling of black tea drying process.
J. Food Eng. 2002, 52, 349–357.
35. Senadeera, W.; Bhandari, B.R.; Young, G.; Wijesinghe, B. Influence of shapes of selected
vegetable materials on drying kinetics during fluidized bed drying. J. Food Eng. 2003, 58, 277–283.
36. Simal, S.; Femenia, A.; Garau, M.C.; Rosselló, C. Use of exponential, Page’s and diffusional
models to simulate the drying kinetics of kiwi fruit. J. Food Eng. 2005, 66, 323–328.
37. Velić, D.; Planinić, M.; Tomas, S.; Bilić, M. Influence of airflow velocity on kinetics of
convection apple drying. J. Food Eng. 2004, 64, 97–102.
38. Doymaz, I.; Gorel, O.; Akgun, N.A. Drying characteristics of the solid by-product of olive oil
extraction. Biosyst. Eng. 2004, 88, 213–219.
39. Akgun, N.A.; Doymaz, I. Modelling of olive cake thin-layer drying process. J. Food Eng. 2005,
68, 455–461.
40. Strehler, A. Technologies of wood combustion. Ecol. Eng. 2000, 16, S25–S40.
41. Werther, J.; Saenger, M.; Hartge, E.U.; Ogada, T.; Siagi, Z. Combustion of agricultural residues.
Progress Energy Combust. Sci. 2000, 26, 1–27.
42. Montero, I.; Blanco, J.; Miranda, T.; Rojas, S.; Celma, A.R. Design, construction and performance
testing of a solar dryer for agroindustrial by-products. Energy Convers. Manag. 2010, 51, 1510–1521.
43. Thakor, N.J.; Sokhansanj, S.; Sosulski, F.W.; Yannacopoulos, S. Mass and dimensional changes
of single canola kernels during drying. J. Food Eng. 1999, 40, 153–160.
Page 13
Int. J. Mol. Sci. 2011, 12 7897
44. Park, K.J.; Vohnikova, Z.; Brod, F.P.R. Evaluation of drying parameters and desorption isotherms
of garden mint leaves. J. Food Eng. 2002, 51, 193–199.
© 2011 by the authors; licensee MDPI, Basel, Switzerland. This article is an open access article
distributed under the terms and conditions of the Creative Commons Attribution license
(http://creativecommons.org/licenses/by/3.0/).