100
Thinking Software For Life ANNUAL REPORT 2015
Thinking Software For Life
ANNUAL REPORT 2015

Orion Health
2015 Annual Report
02
26 . 05 . 2015
CONTENTS
Key industry terms and definitions 04
Section 1: Orion Health at a Glance 05
Section 2: FY2015 Business Milestones 06
Section 3: Letter from the Chairman and CEO 10
Section 4: Orion Health Strategy and Business Model 15
Section 5: Overview of FY2015 Financial Performance 25
Section 6: Board of Directors 38
Section 7: Global Leaders 40
Section 8: Directors’ Responsibility Statement 42
Section 9: Independent Auditors’ Report 43
Section 10: Financial Statements 45
Section 11: Notes to the Financial Statements 50
Section 12: Corporate Governance 82
Section 13: Shareholder Information 89
Section 14: Directory 99
Orion Health
2015 Annual Report
03
Key industry terms and definitions
ACOsAccountable Care Organisations. Groups of United States Health Providers contracted by the United States federal government to improve care coordination for a patient population, with their reimbursement tied to quality metrics and reductions in the total cost of care for an assigned population.
ARR Annualised Recurring Revenue. This represents Managed Services Revenue and Support Revenue for the month of March, adjusted for any abnormal items, multiplied by 12 to express an annualised figure.
FFS Fee For Service. A funding model prevalent in healthcare where Providers are paid for the services they provide, not for the outcomes they achieve.
Funders Those that provide healthcare funding for a given geographical area or population group. Funders include Governments and Payers.
Governments Encompasses national, federal, state and regional healthcare bodies as well as regional health boards and regulatory bodies.
HCIT The Healthcare information technology industry.
HIEHealth Information Exchange. The term can refer to the technology or an organisation using the technology. The technology enables aggregation and secure exchange of electronic clinical information between a combination of Providers, Payers, Governments and ACOs. Outside the United States, these are commonly referred to as an Electronic Health Record (EHR).
NHS National Health Service. Government funded public health bodies in the United Kingdom.
Payers Health insurance companies.
PHM Population Health Management is the concept of using HCIT to unify health data so that health professionals can deliver more effective, precise healthcare, keeping people healthier and out of the health system.
Providers Public and private parties that provide healthcare services, e.g. hospital networks, GPs and specialists.
SaaS Software as a Service. A method of software delivery.
Orion Health
2015 Annual Report
4
Key industry terms and definitions
26 . 05 . 2015
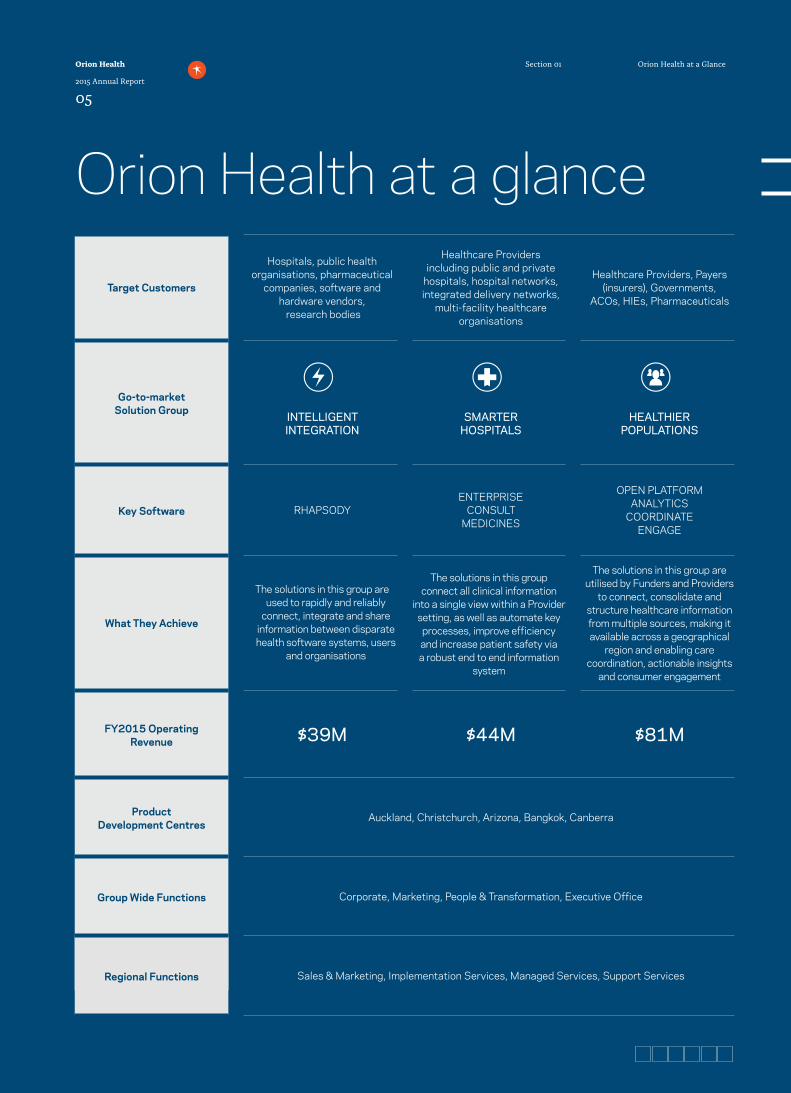
Target Customers
Hospitals, public health organisations, pharmaceutical
companies, software and hardware vendors, research bodies
Healthcare Providers including public and private
hospitals, hospital networks, integrated delivery networks,
multi-facility healthcare organisations
Healthcare Providers, Payers (insurers), Governments,
ACOs, HIEs, Pharmaceuticals
Go-to-market Solution Group INTELLIGENT
INTEGRATIONSMARTER
HOSPITALSHEALTHIER
POPULATIONS
Key Software RHAPSODYENTERPRISE
CONSULT MEDICINES
OPEN PLATFORM ANALYTICS
COORDINATE ENGAGE
What They Achieve
The solutions in this group are used to rapidly and reliably
connect, integrate and share information between disparate health software systems, users
and organisations
The solutions in this group connect all clinical information
into a single view within a Provider setting, as well as automate key processes, improve efficiency and increase patient safety via a robust end to end information
system
The solutions in this group are utilised by Funders and Providers
to connect, consolidate and structure healthcare information from multiple sources, making it available across a geographical
region and enabling care coordination, actionable insights
and consumer engagement
FY2015 Operating Revenue $39M $44M $81M
Product Development Centres
Auckland, Christchurch, Arizona, Bangkok, Canberra
Group Wide Functions Corporate, Marketing, People & Transformation, Executive Office
Regional Functions Sales & Marketing, Implementation Services, Managed Services, Support Services
Orion Health at a glance
Orion Health
2015 Annual Report
05
Orion Health at a GlanceSection 01
MAY 2014
Named NZ Hi-Tech Company of the Year and Exporter of the Year (over $5m)
JUNE 2014
$25.5m of new equity raised via over-subscribed placement to existing eligible shareholders
Orion Health starts work on implementing its Clinical Portal across the Midlands region of New Zealand
Agreement reached with HealtheNet (New South Wales government) for Orion Health to deploy its Healthier Populations solution to connect clinicians across the state to a complete patient record
JULY 2014
Graeme Wilson appointed as Chief Operating Officer
Agreement reached with Blue Shield of California, forming the foundation for Cal INDEX
AUGUST 2014
Dr Lester Levy joins the Board
SEPTEMBER 2014
Andrew Clements steps down as Chairman of the Board after 12 years. Andrew Ferrier is elected as new Chairman
OCTOBER 2014 2014
Launch of Orion Health’s $125m Initial Public Offering
2: FY2015 Business Milestones
SECTION
Orion Health
2015 Annual Report
06
FY2015 Business MilestonesSection 0226 . 05 . 2015
NOVEMBER 2014
Orion Health shares commence trading on the NZX Main Board and the ASX
Orion Health selected to provide Smarter Hospitals solutions for Sheffield Teaching Hospitals NHS Trust in the United Kingdom
Health and Social Care Northern Ireland wins prestigious Health Service Journal award for “Enhancing Care by Sharing Data and Information” for its Electronic Care Record, powered by Orion Health
DECEMBER 2014
Orion Health successfully completes the first phase of implementation of its Open Platform for Cal INDEX and the solution goes ‘live’
Orion Health is named #1 vendor in Clinician Network Management by Chilmark Research
JANUARY 2015
Successful go ‘live’ of Orion Health’s first Smarter Hospitals ENTERPRISE implementation in the Philippines market
Work starts on Orion Health’s largest ever Canadian project, the implementation of our Healthier Populations solutions for a large province in Canada
FEBRUARY 2015
Commercial agreement reached with all five South Island District Health Boards for a single South Island-wide shared patient information care system
Orion Health’s Scottsdale Center of Excellence officially opened by local Mayor, W J ‘Jim’ Lane
MARCH 2015 2015
Major sale of Open Platform to a United States Provider, a large clinically integrated network of physicians and hospitals in Tennessee and surrounding states
Orion Health’s work with Lewisham Healthcare NHS Trust is extended to encompass Greenwich NHS Foundation Trust in a project that will help support the merging of these two organisations in South East London
2: FY2015 Business Milestones
Orion Health
2015 Annual Report
07
FY2015 Business MilestonesSection 02
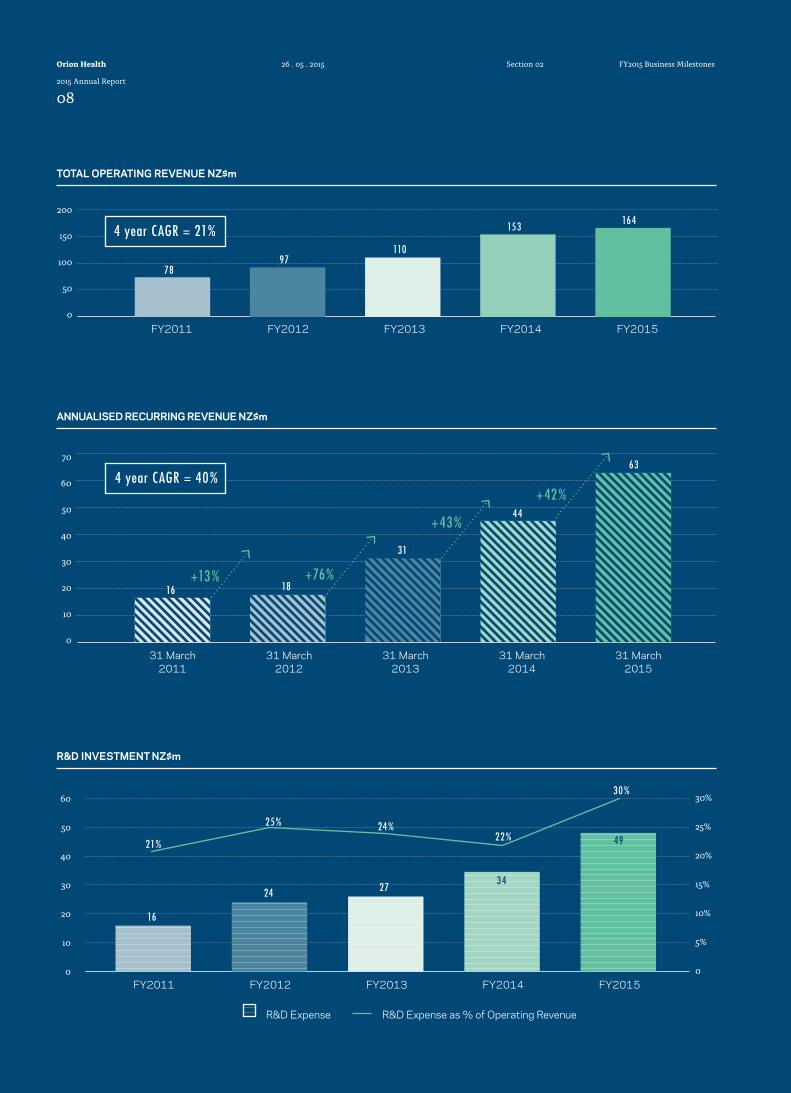
TOTAL OPERATING REVENUE NZ$m
FY2011 FY2012 FY2013 FY2014 FY2015
FY2011 FY2012 FY2013 FY2014 FY2015
200
150
100
50
0
60
50
40
30
20
10
0
30%
25%
20%
15%
10%
5%
0
R&D INVESTMENT NZ$m
R&D Expense as % of Operating RevenueR&D Expense
4 year CAGR = 21%
78
ANNUALISED RECURRING REVENUE NZ$m
70
60
50
40
30
20
10
0
+76%+13%
+43%
+42%
31 March 2011
31 March 2012
31 March 2013
31 March 2014
31 March 2015
4 year CAGR = 40%
16 18
31
44
63
97110
153 164
16
24 27 34
4924%25%
21%22%
30%
Orion Health
2015 Annual Report
08
26 . 05 . 2015 FY2015 Business MilestonesSection 02
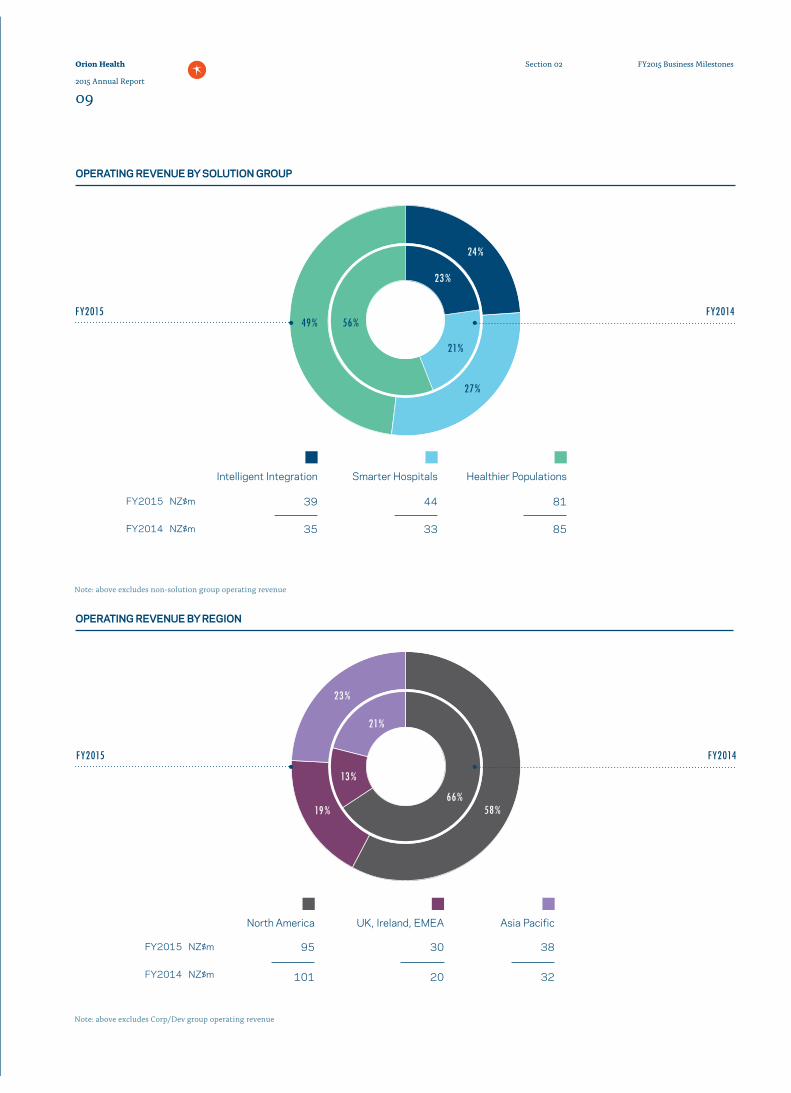
OPERATING REVENUE BY REGION
OPERATING REVENUE BY SOLUTION GROUP
49%
21%
23%
24%
56%
27%
FY2014FY2015
FY2014FY2015
19%
23%
21%
13%
66%58%
Intelligent Integration Smarter Hospitals Healthier Populations
39
35
44
33
81
85
FY2015 NZ$m
FY2014 NZ$m
Asia PacificUK, Ireland, EMEANorth America
383095
101 20 32
FY2015 NZ$m
FY2014 NZ$m
Note: above excludes non-solution group operating revenue
Note: above excludes Corp/Dev group operating revenue
Orion Health
2015 Annual Report
09
FY2015 Business MilestonesSection 02
3: Letter from the Chairman and CEO
SECTIONSECTION
Dear Shareholder
Orion Health and the global healthcare IT industry are undergoing fundamental change, resulting in both huge opportunity and uncertainty. FY2015 has been a challenging one for Orion Health in many respects, but also one where several strategic milestones have been achieved.
During the year we successfully completed a $125m Initial Public Offering (IPO) of Orion Health shares and commenced trading on the New Zealand Stock Exchange and the Australian Stock Exchange. With this significant milestone behind us and with the additional funding, the Board is focused on supporting the executive leadership team to deliver Orion Health’s growth strategy.
We have continued to evolve the structure of our business to support the shift to a subscription revenue model with a global delivery platform, and this is starting to reap benefits. We have grown our Annualised Recurring Revenue base significantly, from $44m at 31 March 2014 to $63m at 31 March 2015, an increase of 42%. An important contributor to this growth was the successful implementation of Orion Health Open Platform for our first large strategic Health Insurance (Payer) customer in the United States, Cal INDEX.
Total FY2015 Operating Revenue was $164m, up 7% from $153m in FY2014, and driven by our United Kingdom and New Zealand businesses. Both of these regions were standout performers, delivering 60% and 23% revenue growth in FY2015 respectively.
All other regions experienced growth in FY2015 except for North America, where revenue growth was impacted by two factors;
Firstly, the US market is in transition to Population Health Management (PHM), under the evolving Obamacare regulatory framework which is driving the market from a fee for service model to value based outcomes. We have witnessed the recent tapering-off of some government incentive programmes and the introduction of others. We also identified the early ascendancy of the Health Insurers, or Payers, as a key target market for Orion Health and we have been successful securing contracts with 3 market-leading organisations. This rapidly changing US environment, did cause some slowing in contracting activity in the latter part of the financial year although recent activity is encouraging. Continued volatility in closing contracts is expected to remain for some time as the market continues to transition to PHM solutions. Market transitions driven by new regulatory change are generally uncertain in timing but will create significant opportunities for Orion Health, as our solutions are well suited to evolving requirements.
Secondly, our business model is in transition from perpetual licences to subscription revenue. These factors contributed in our U.S. Healthier Populations group, to an 81% drop in revenue derived from perpetual licences for the year, only partially offset by a 35% rise in managed services revenue as newly acquired customers completed implementations and moved to a live production state. The transition to subscription revenue in our US PHM business is now largely complete and we look forward to building on our recurring revenue base with new contracting success.
Total FY2015 Loss before Income Tax was $51m, a direct result from our increased investment in new product development as well as building our service delivery capacity. The Loss after Tax for the year was $61m and reflects the removal of $7m of deferred tax assets from our Balance Sheet.
During FY2015 we grew our R&D group from 363 people to 461 people, bringing our total R&D spend to $49m for the year. This provided us with the impetus to increase our development efforts across all of our solution groups. In particular we delivered new generation solutions in our Healthier Populations group in order to meet the expectations of our customers and progress our vision for PHM.
The health information technology market is estimated to be worth US $57 billion by 2017. Globally we are seeing a move towards PHM solutions and we believe Orion Health is the only vendor taking a scalable, whole of platform approach to market. We are very excited about the significant and wide ranging opportunities that are emerging in this space.
Building on our momentum and taking advantage of the opportunity ahead of us requires strong focus and leadership. Orion Health has grown from a company of fewer than 450 people to one of 1,226 in just over four years. With such fast growth comes a need to continually develop leadership at all levels in the business. The Board was delighted to welcome leadership expert Dr. Lester Levy as a Director in August 2014. The Board was also very pleased with the appointments of Graeme Wilson as Chief Operating Officer and Gary White as Global Services Leader during 2014.
Graeme’s appointment has allowed our Chief Executive Officer, Ian McCrae, to increase his focus on product leadership and innovation, whilst Gary’s appointment furthers our ongoing focus to improve our Implementation Services and Managed Services execution capability. Both of these areas are strategic priorities for our business as they directly influence product quality, customer satisfaction and financial performance.
Orion Health remains on a journey. The company is a recognised leader in its field with over 23 years experience across many different health markets. We are well positioned to capitalise on the evolving landscape in Health IT and we are committed to delivering on this promise of growth. On behalf of the Board and management team, we want to assure our shareholders that we have the right people in place and the necessary resources to execute our strategy and deliver shareholder value.
Thank you for your support and we look forward to continuing on the Orion Health journey with our shareholders.
Yours sincerely
Andrew Ferrier Ian McCrae Chairman Chief Executive Officer
Orion Health
2015 Annual Report
010
Letter from the Chairman and CEO
Section 0326 . 05 . 2015
I A N M C C R A E
F O U N D E R A N D C H I E F E X E C U T I V E O F F I C E R
A N D R E W F E R R I E R
C H A I R M A N
Orion Health
2015 Annual Report
011
Letter from the Chairman and CEO
Section 03
HEALTHIER POPULATIONS
The California Integrated Data Exchange (Cal INDEX) represents one of the largest scale health information exchanges of its kind and one of the first to combine clinical data with health insurance claims data. It represents collaboration between two major payer organisations – Blue Shield of California and Anthem Blue Cross – with a stated aim, to improve efficiency and reduce the cost of healthcare across the state of California, beginning with approximately 9 million members.
In order to achieve this, Cal INDEX required a new generation population health management solution, built on the latest technology and with the functionality to rapidly process huge volumes of data in a linearly scalable way. The solution that was up and running in December 2014 was the Orion Health Open Platform, following two years of in-depth collaboration with the customer as well as involvement from over 100 internal resources.
Orion Health Open Platform is the core underlying technology that will integrate, combine and structure all the health information available (including insurance claims data) for the initial 9 million members. The system was launched with three years of existing claims data for all members of Blue Shield California, with the historical Anthem Blue Cross data to follow. This information has
been made available to physicians, nurses and hospitals across the state in order for them to give patients the safest and highest quality care possible.
This implementation confirms Orion Health as one of the leading population health management vendors in the world.
Orion Health will now continue to work closely with Cal INDEX to extend the solution through delivering in-depth and tailored analytics, improved care coordination tools and patient engagement applications. Orion Health will also support Cal INDEX in its efforts to bring additional insurance company and healthcare provider participants onto the system.
While this is a major project for Orion Health and a significant milestone, it should be noted that this solution is being delivered as a software-as-a service (SaaS) model, with the majority of revenues received in FY2016 and beyond.
“Given the quality of the clients we were working with and the sheer complexity of the project itself, I am delighted with what we have delivered. We are aware that many other payers are closely watching Cal INDEX as an example for their own population health requirements in the future, so this project has huge strategic value for us as a company.” Ian McCrae, CEO, Orion Health
Cal INDEX Switches on Next Generation Healthier Populations Solution
The solutions in this group are utilised by Funders and Providers to connect, consolidate and structure healthcare information from multiple sources, making it available across a geographical region and enabling care coordination, actionable insights and consumer engagement.
Orion Health
2015 Annual Report
012
26 . 05 . 2015 CAL Index

Orion Health
2015 Annual Report
013
CAL Index
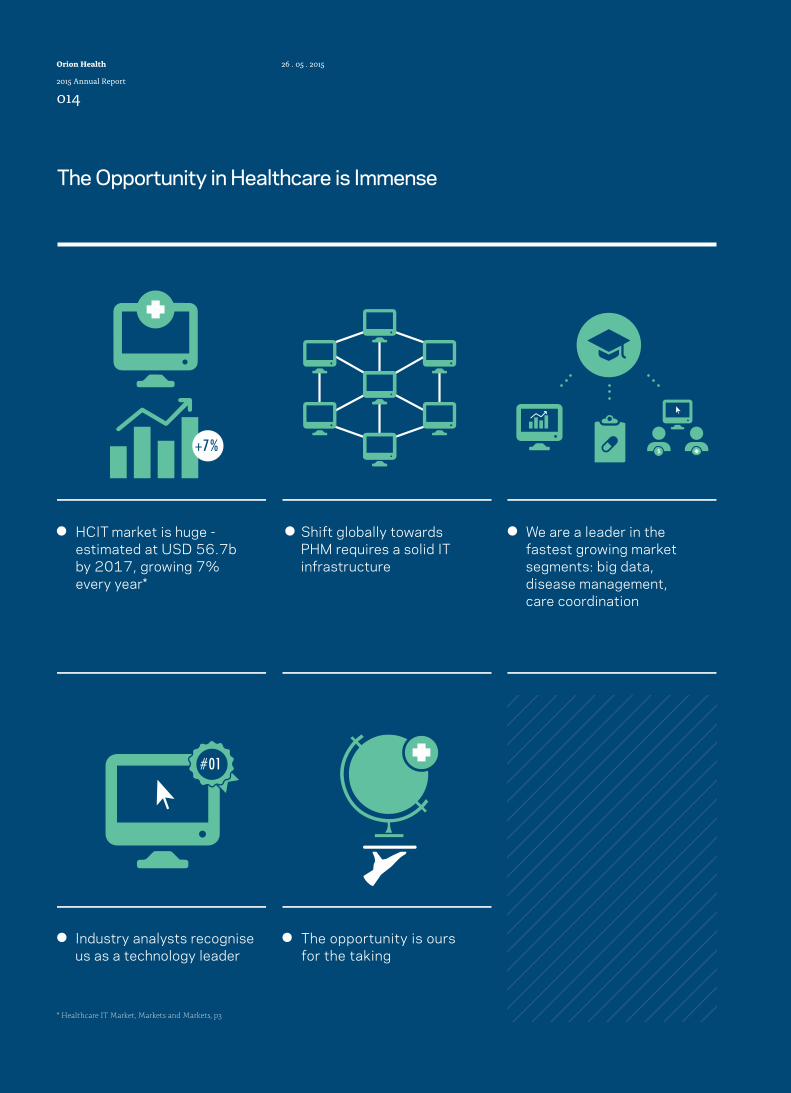
The Opportunity in Healthcare is Immense
HCIT market is huge - estimated at USD 56.7b by 2017, growing 7% every year*
We are a leader in the fastest growing market segments: big data, disease management, care coordination
Shift globally towards PHM requires a solid IT infrastructure
Industry analysts recognise us as a technology leader
The opportunity is ours for the taking
+7%
# 01
* Healthcare IT Market, Markets and Markets, p3
Orion Health
2015 Annual Report
014
26 . 05 . 2015
4:Orion Health Strategy and Business Model
SECTION
Orion Health
2015 Annual Report
015
Orion Health Strategy and Business Model
Section 04

Orion Health
2015 Annual Report
016
Orion Health Strategy and Business Model
Section 0426 . 05 . 2015
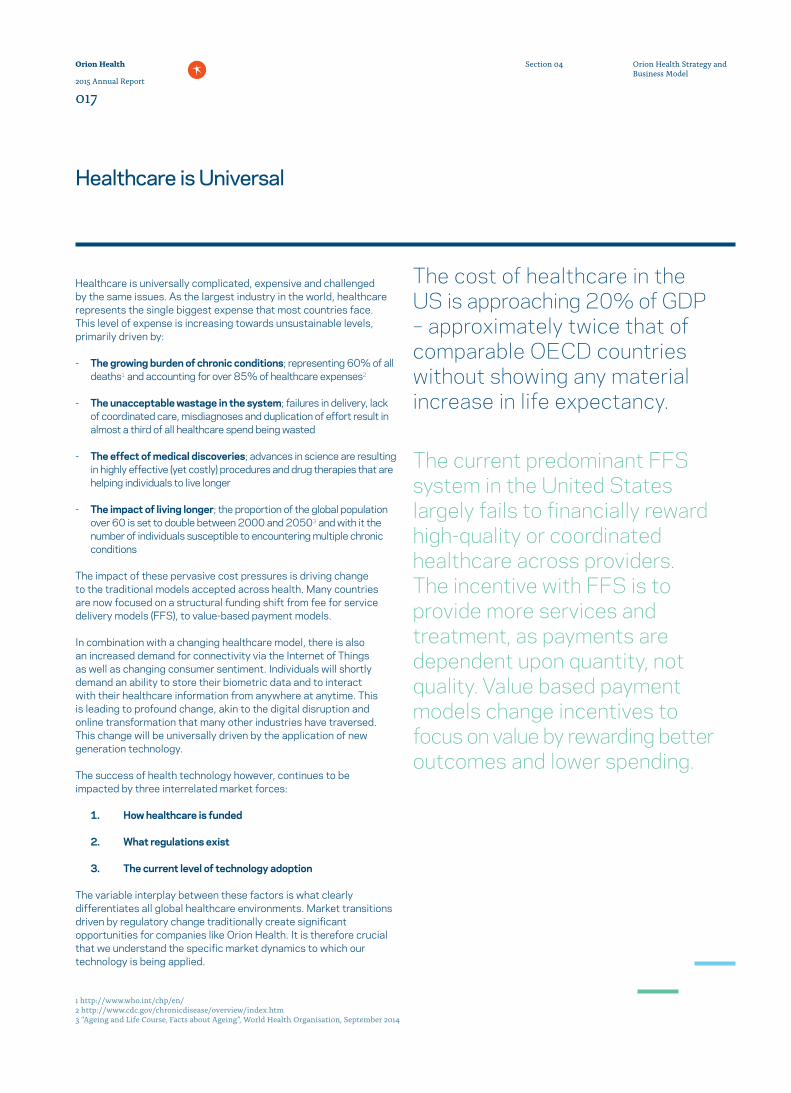
Healthcare is universally complicated, expensive and challenged by the same issues. As the largest industry in the world, healthcare represents the single biggest expense that most countries face. This level of expense is increasing towards unsustainable levels, primarily driven by:
- The growing burden of chronic conditions; representing 60% of all deaths1 and accounting for over 85% of healthcare expenses2
- The unacceptable wastage in the system; failures in delivery, lack of coordinated care, misdiagnoses and duplication of effort result in almost a third of all healthcare spend being wasted
- The effect of medical discoveries; advances in science are resulting in highly effective (yet costly) procedures and drug therapies that are helping individuals to live longer
- The impact of living longer; the proportion of the global population over 60 is set to double between 2000 and 20503 and with it the number of individuals susceptible to encountering multiple chronic conditions
The impact of these pervasive cost pressures is driving change to the traditional models accepted across health. Many countries are now focused on a structural funding shift from fee for service delivery models (FFS), to value-based payment models.
In combination with a changing healthcare model, there is also an increased demand for connectivity via the Internet of Things as well as changing consumer sentiment. Individuals will shortly demand an ability to store their biometric data and to interact with their healthcare information from anywhere at anytime. This is leading to profound change, akin to the digital disruption and online transformation that many other industries have traversed. This change will be universally driven by the application of new generation technology.
The success of health technology however, continues to be impacted by three interrelated market forces:
1. How healthcare is funded
2. What regulations exist
3. The current level of technology adoption
The variable interplay between these factors is what clearly differentiates all global healthcare environments. Market transitions driven by regulatory change traditionally create significant opportunities for companies like Orion Health. It is therefore crucial that we understand the specific market dynamics to which our technology is being applied.
The cost of healthcare in the US is approaching 20% of GDP – approximately twice that of comparable OECD countries without showing any material increase in life expectancy.
The current predominant FFS system in the United States largely fails to financially reward high-quality or coordinated healthcare across providers. The incentive with FFS is to provide more services and treatment, as payments are dependent upon quantity, not quality. Value based payment models change incentives to focus on value by rewarding better outcomes and lower spending.
1 http://www.who.int/chp/en/2 http://www.cdc.gov/chronicdisease/overview/index.htm3 “Ageing and Life Course, Facts about Ageing”, World Health Organisation, September 2014
Healthcare is Universal
Orion Health
2015 Annual Report
017
Orion Health Strategy and Business Model
Section 04
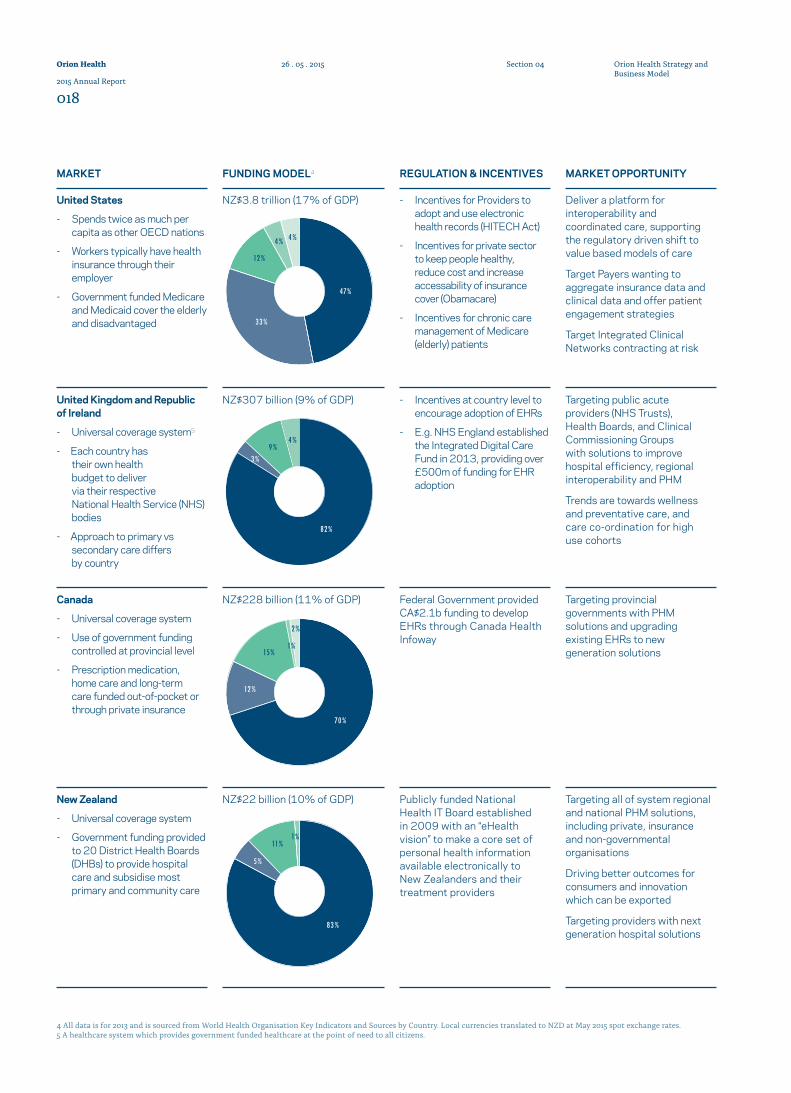
MARKET FUNDING MODEL4 REGULATION & INCENTIVES MARKET OPPORTUNITY
United States
- Spends twice as much per capita as other OECD nations
- Workers typically have health insurance through their employer
- Government funded Medicare and Medicaid cover the elderly and disadvantaged
NZ$3.8 trillion (17% of GDP) - Incentives for Providers to adopt and use electronic health records (HITECH Act)
- Incentives for private sector to keep people healthy, reduce cost and increase accessability of insurance cover (Obamacare)
- Incentives for chronic care management of Medicare (elderly) patients
Deliver a platform for interoperability and coordinated care, supporting the regulatory driven shift to value based models of care
Target Payers wanting to aggregate insurance data and clinical data and offer patient engagement strategies
Target Integrated Clinical Networks contracting at risk
United Kingdom and Republic of Ireland
- Universal coverage system5
- Each country has their own health budget to deliver via their respective National Health Service (NHS) bodies
- Approach to primary vs secondary care differs by country
NZ$307 billion (9% of GDP) - Incentives at country level to encourage adoption of EHRs
- E.g. NHS England established the Integrated Digital Care Fund in 2013, providing over £500m of funding for EHR adoption
Targeting public acute providers (NHS Trusts), Health Boards, and Clinical Commissioning Groups with solutions to improve hospital efficiency, regional interoperability and PHM
Trends are towards wellness and preventative care, and care co-ordination for high use cohorts
Canada
- Universal coverage system
- Use of government funding controlled at provincial level
- Prescription medication, home care and long-term care funded out-of-pocket or through private insurance
NZ$228 billion (11% of GDP) Federal Government provided CA$2.1b funding to develop EHRs through Canada Health Infoway
Targeting provincial governments with PHM solutions and upgrading existing EHRs to new generation solutions
New Zealand
- Universal coverage system
- Government funding provided to 20 District Health Boards (DHBs) to provide hospital care and subsidise most primary and community care
NZ$22 billion (10% of GDP) Publicly funded National Health IT Board established in 2009 with an “eHealth vision” to make a core set of personal health information available electronically to New Zealanders and their treatment providers
Targeting all of system regional and national PHM solutions, including private, insurance and non-governmental organisations
Driving better outcomes for consumers and innovation which can be exported
Targeting providers with next generation hospital solutions
47%
33 %
12%
4% 4%
82 %
3 %9%
4%
70 %
12%
15%1%
2 %
83 %
5%
11%1%
4 All data is for 2013 and is sourced from World Health Organisation Key Indicators and Sources by Country. Local currencies translated to NZD at May 2015 spot exchange rates.5 A healthcare system which provides government funded healthcare at the point of need to all citizens.
Orion Health
2015 Annual Report
018
Orion Health Strategy and Business Model
Section 0426 . 05 . 2015
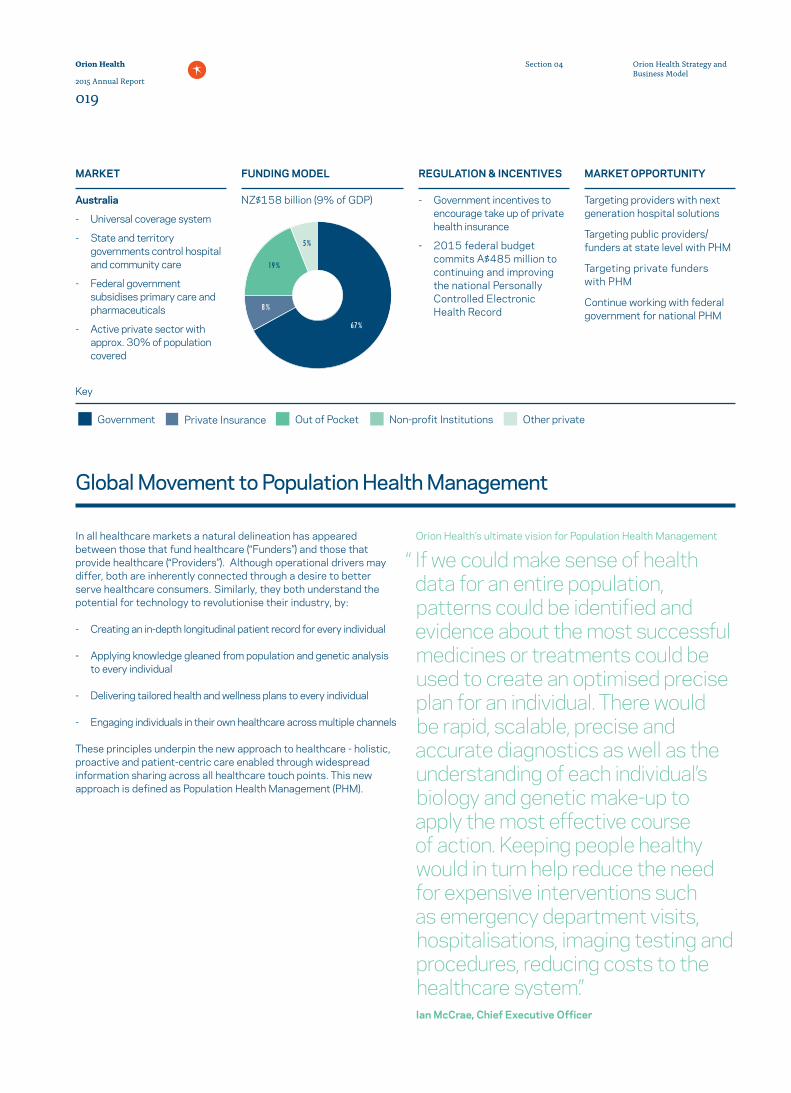
MARKET FUNDING MODEL REGULATION & INCENTIVES MARKET OPPORTUNITY
Australia
- Universal coverage system
- State and territory governments control hospital and community care
- Federal government subsidises primary care and pharmaceuticals
- Active private sector with approx. 30% of population covered
NZ$158 billion (9% of GDP) - Government incentives to encourage take up of private health insurance
- 2015 federal budget commits A$485 million to continuing and improving the national Personally Controlled Electronic Health Record
Targeting providers with next generation hospital solutions
Targeting public providers/funders at state level with PHM
Targeting private funders with PHM
Continue working with federal government for national PHM
67%
8 %
19%
5%
Government Private Insurance Out of Pocket Non-profit Institutions Other private
Key
In all healthcare markets a natural delineation has appeared between those that fund healthcare (“Funders”) and those that provide healthcare (“Providers”). Although operational drivers may differ, both are inherently connected through a desire to better serve healthcare consumers. Similarly, they both understand the potential for technology to revolutionise their industry, by:
- Creating an in-depth longitudinal patient record for every individual
- Applying knowledge gleaned from population and genetic analysis to every individual
- Delivering tailored health and wellness plans to every individual
- Engaging individuals in their own healthcare across multiple channels
These principles underpin the new approach to healthcare - holistic, proactive and patient-centric care enabled through widespread information sharing across all healthcare touch points. This new approach is defined as Population Health Management (PHM).
Orion Health’s ultimate vision for Population Health Management
“ If we could make sense of health data for an entire population, patterns could be identified and evidence about the most successful medicines or treatments could be used to create an optimised precise plan for an individual. There would be rapid, scalable, precise and accurate diagnostics as well as the understanding of each individual’s biology and genetic make-up to apply the most effective course of action. Keeping people healthy would in turn help reduce the need for expensive interventions such as emergency department visits, hospitalisations, imaging testing and procedures, reducing costs to the healthcare system.” Ian McCrae, Chief Executive Officer
Global Movement to Population Health Management
Orion Health
2015 Annual Report
019
Orion Health Strategy and Business Model
Section 04
Whilst many health IT vendors have had to strategically reorganise their business to address the burgeoning PHM market, we simply continue to build as we always have - embracing the latest technologies; innovating through design; open and interoperable; and always keeping scalability top of mind. In the area of patient and clinical engagement our mobility strategy is embracing changing consumer trends and the growing mobile nature of healthcare.
Our integration heritage directed our thinking towards building a platform that could seamlessly aggregate clinical information from multiple sources across organisations, communities and states as well as combine that information with insurance claims and consumer device data. This would then enable us to provide additional tools, applications and functionality aimed at enhancing the delivery of coordinated care, patient engagement and streamlined clinical processing.
Orion Health Open Platform forms the base of our PHM solution and is powered by our big data engine Amadeus – representing the only true big data solution specifically for health. The ability of our Open
Platform to support extremely high volumes and velocity of data and seamlessly stream this data to feed real-time analytics is a key source of strategic advantage.
Our technology allows Funders and Providers to deliver precise healthcare via targeted interventions, whilst concurrently creating the most comprehensive longitudinal patient record possible. Due to its open architecture, it also provides the ability to extend our solution with custom built applications and tools, further enriching the underlying patient longitudinal records. The result is a truly unique market offering built upon sophisticated and future proof technology that will deliver value to all stakeholders in health.
Our goal is to become the provider of the leading health data platform in all of the markets we operate in.
New Generation Product Development
“Orion Health surged to the top of the class this year, earning A-minuses across the board for its expanding portfolio of deployed solutions and growing list of customers… Orion Health has improved its solution set and market standing considerably in the last year… All in all, Orion Health’s product portfolio continues to be one of the leading platforms for health information organisations.” Chilmark Research, December 2014
Orion Health
2015 Annual Report
020
Orion Health Strategy and Business Model
Section 0426 . 05 . 2015
In designing the approach to our geographic markets we have specific engagement strategies for the Funder, Provider and Consumer segments we encounter.
Funder Engagement
We position our PHM platform as the cornerstone technology solution that will revolutionise how healthcare is delivered throughout the community. We have a compelling offering for any organisation / group of organisations that have multiple sources of data across many different settings. We strengthen this proposition with three key differentiators:
- Our ability to deliver real time analysis on population data which enables proactive targeting of patients and the delivery of preventative care
- Our unique open architecture which allows us to supply further value via our own applications and tools as well as interface directly with customer built tools and applications
- Our patient engagement solution that gives Funders the ability to encourage individuals and their Circle of Care to proactively engage in the management of their own wellness
Typically the Funders we engage directly with include all levels of government, large private insurers and large networks of health organisations.
Provider Engagement
We position our in-hospital solutions across both acute and ambulatory settings as a disruptive market offering, differentiated from incumbents due to our modern technology, modular architecture and competitive mid market pricing. This segment is highly competitive and we are active in targeting:
- Organisations looking to replace legacy systems in established markets
- Privately owned, modern facilities in emerging markets
- Organisations who have previously implemented a best of breed approach to technology and suffer from a lack of integration
We elevate our proposition based on our ability to integrate seamlessly with our PHM solutions in order to facilitate care outside the traditional provider setting. Typically the Providers we engage directly with include hospitals, primary and community care providers and multi facility healthcare networks.
Consumer Engagement
The consumer will represent the single most disruptive force in redefining the future model for global healthcare so it is therefore paramount that we have a compelling proposition for this segment. Our belief is that consumer expectations will evolve in phases:
- Demand for visibility of personal health information
- Demand for access and control of personal health information
- Demand for enhanced functionality to help manage health and wellbeing
- Demand for increased mobility of all services relating to healthcare
We currently develop all of our solutions to a mobile first strategy, delivering to consumer expectations, even though our engagement occurs via our Funder and Provider customers. We will continue to advance our own care coordination and personal engagement tools, knowing that we may begin to engage consumers directly in the future. Concurrently we will also continue to encourage and facilitate a PHM application ecosystem built on top of our platform.
“As providers and payers participate in different models of care like ACOs, they’re recognising that collectively managing risk requires this notion of interoperability and data sharing. To truly improve care, organisations will have to change their mindset about the strategic value of data.” – David Watson, President and CEO Cal INDEX
Target Market Segments
Orion Health
2015 Annual Report
021
Orion Health Strategy and Business Model
Section 04
Currently our number one priority is ensuring that we continue to evolve our business structure to align with the shift from perpetual licensing to a full subscription model.
Our definition of a full subscription model is the Software as a Service (SaaS) delivery of our solutions to customers, via a public cloud environment. It has significant benefits for our current and prospective customers:
- It can be deployed rapidly, and securely around the globe
- It is infinitely scalable
- It enables continuous delivery of functionality upgrades
- It reduces up front cost burden
- It reduces management overhead
In many of our mature global markets, we are seeing this approach as the preferred method for software delivery and it is allowing us to decouple our revenue from our cost base. By charging our customers according to their usage and adoption through the entire lifecycle of the solution, we receive fair life-time value from our engagements. Our recurring revenue base is increasing, reducing the volatility of our monthly cash flows and improving our capability to accurately predict future revenues.
Our expectation is that as other markets mature and undergo changes in regulation and/or incentivisation we will see the same delivery preference emerge. This requires us to continue to evolve aspects of how we develop, deploy and support our software.
Expanding Research and Development Capacity
Our ability to delight our customers and surprise our markets with world-class software is a key competitive advantage of Orion Health. We will continue to prioritise innovation and invest in our product and development capacity in order to:
- Expand the functionality of all of our current software
- Increase the cadence with which we release new software to market
- Architect and deploy our solutions in a standardised SaaS model
We continue to organise our R&D efforts into structured lines of business that align our go-to market strategy with our three solution groups:
- Intelligent Integration: the solutions in this group are used to rapidly and reliably connect, integrate and share information between disparate health software systems, users and organisations
- Smarter Hospitals: the solutions in this group connect all clinical information into a single view within a Provider setting, as well as automate key processes, improve efficiency and increase patient safety via a robust end to end information system
- Healthier Populations: the solutions in this group are utilised by Funders and Providers to connect, consolidate and structure healthcare information from multiple sources, making it available across a geographical region and enabling care coordination, actionable insights and consumer engagement
Expanding Service Capacity
We will continue to invest in our infrastructure and service skills to ensure that we effectively deploy and deliver standardised solutions in a public cloud environment. Key to enhancing our service capacity is:
- Further advancing our automated deployment capabilities
- Increasing the speed at which we can connect different healthcare participants to our platform solution and allowing data to flow
- Increasing our cyber security and real time monitoring capabilities
- Locating service teams in major facilities in key locations around the globe
- Creating a wider sales and distribution network through partner enablement
- Providing consultancy service to add value during pre engagement with customers
We were pleased to be able to recognise some early success in relation to a number of these strategic priorities in the second half of FY2015.
Our Evolving Business
Orion Health
2015 Annual Report
022
Orion Health Strategy and Business Model
Section 0426 . 05 . 2015
Strategy in Action
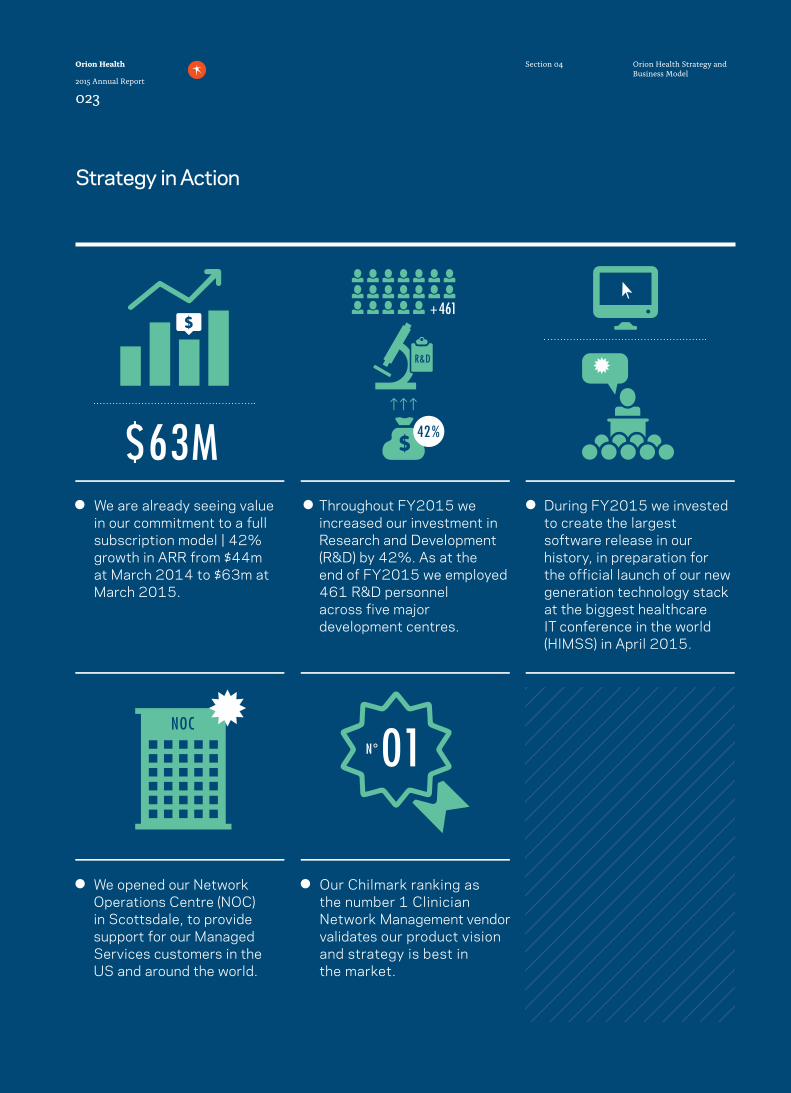
$63MWe are already seeing value in our commitment to a full subscription model | 42% growth in ARR from $44m at March 2014 to $63m at March 2015.
During FY2015 we invested to create the largest software release in our history, in preparation for the official launch of our new generation technology stack at the biggest healthcare IT conference in the world (HIMSS) in April 2015.
Throughout FY2015 we increased our investment in Research and Development (R&D) by 42%. As at the end of FY2015 we employed 461 R&D personnel across five major development centres.
+461
R&D
42%
We opened our Network Operations Centre (NOC) in Scottsdale, to provide support for our Managed Services customers in the US and around the world.
NOC
Our Chilmark ranking as the number 1 Clinician Network Management vendor validates our product vision and strategy is best in the market.
01N°
Orion Health
2015 Annual Report
023
Orion Health Strategy and Business Model
Section 04

Orion Health
2015 Annual Report
024
Orion Health Strategy and Business Model
Section 0426 . 05 . 2015

5:Overview of FY2015 Financial Performance
SECTION
Orion Health
2015 Annual Report
025
Overview of FY2015 Financial PerformanceSection 05
Operating Revenue $164m | 7% growth on FY2014
Annualised Recurring Revenue $63m | 42% growth on FY2014
R&D Expense $49m | 42% increase on FY2014
Cash Balance $95m*
Employee numbers 1,226 | 18% growth on FY2014
#1 ranked Clinician Network Management vendor
28 offices in 15 countries
FY2015 Highlights
* includes cash, cash equivalents and term deposits
Orion Health
2015 Annual Report
026
Overview of FY2015 Financial PerformanceSection 0526 . 05 . 2015
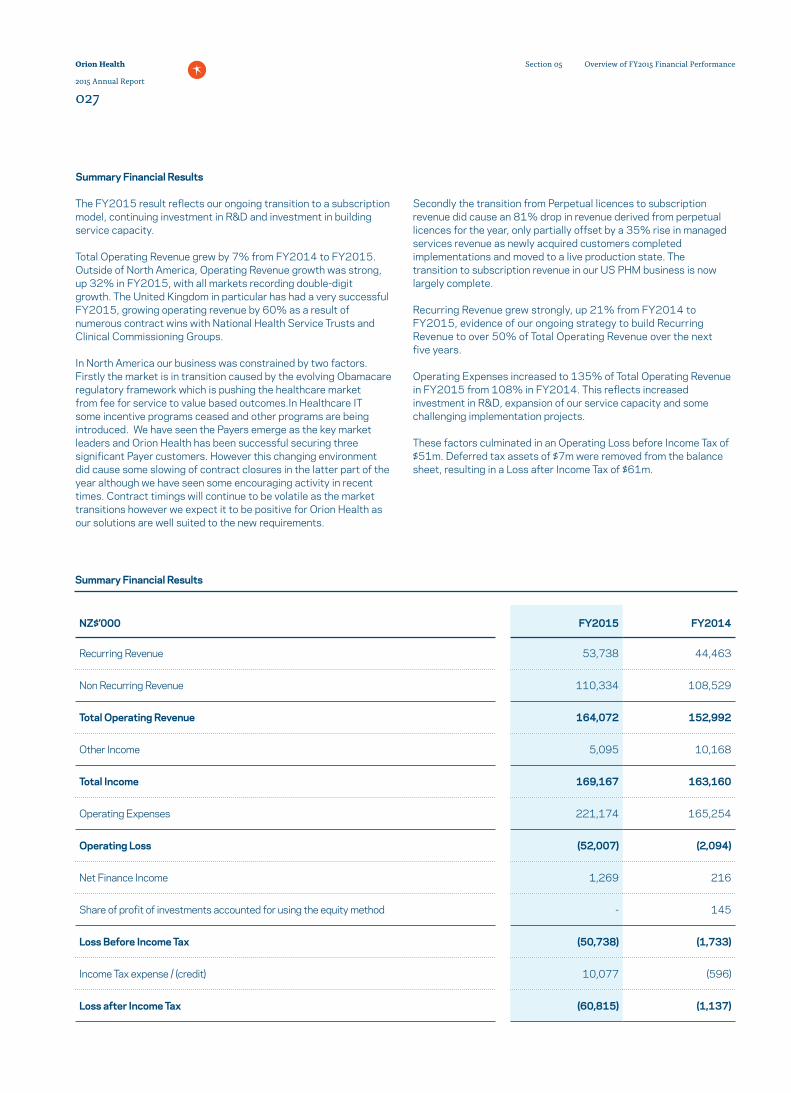
NZ$’000 FY2015 FY2014
Recurring Revenue 53,738 44,463
Non Recurring Revenue 110,334 108,529
Total Operating Revenue 164,072 152,992
Other Income 5,095 10,168
Total Income 169,167 163,160
Operating Expenses 221,174 165,254
Operating Loss (52,007) (2,094)
Net Finance Income 1,269 216
Share of profit of investments accounted for using the equity method - 145
Loss Before Income Tax (50,738) (1,733)
Income Tax expense / (credit) 10,077 (596)
Loss after Income Tax (60,815) (1,137)
Summary Financial Results
The FY2015 result reflects our ongoing transition to a subscription model, continuing investment in R&D and investment in building service capacity.
Total Operating Revenue grew by 7% from FY2014 to FY2015. Outside of North America, Operating Revenue growth was strong, up 32% in FY2015, with all markets recording double-digit growth. The United Kingdom in particular has had a very successful FY2015, growing operating revenue by 60% as a result of numerous contract wins with National Health Service Trusts and Clinical Commissioning Groups.
In North America our business was constrained by two factors. Firstly the market is in transition caused by the evolving Obamacare regulatory framework which is pushing the healthcare market from fee for service to value based outcomes.In Healthcare IT some incentive programs ceased and other programs are being introduced. We have seen the Payers emerge as the key market leaders and Orion Health has been successful securing three significant Payer customers. However this changing environment did cause some slowing of contract closures in the latter part of the year although we have seen some encouraging activity in recent times. Contract timings will continue to be volatile as the market transitions however we expect it to be positive for Orion Health as our solutions are well suited to the new requirements.
Secondly the transition from Perpetual licences to subscription revenue did cause an 81% drop in revenue derived from perpetual licences for the year, only partially offset by a 35% rise in managed services revenue as newly acquired customers completed implementations and moved to a live production state. The transition to subscription revenue in our US PHM business is now largely complete.
Recurring Revenue grew strongly, up 21% from FY2014 to FY2015, evidence of our ongoing strategy to build Recurring Revenue to over 50% of Total Operating Revenue over the next five years.
Operating Expenses increased to 135% of Total Operating Revenue in FY2015 from 108% in FY2014. This reflects increased investment in R&D, expansion of our service capacity and some challenging implementation projects.
These factors culminated in an Operating Loss before Income Tax of $51m. Deferred tax assets of $7m were removed from the balance sheet, resulting in a Loss after Income Tax of $61m.
Summary Financial Results
Orion Health
2015 Annual Report
027
Overview of FY2015 Financial PerformanceSection 05
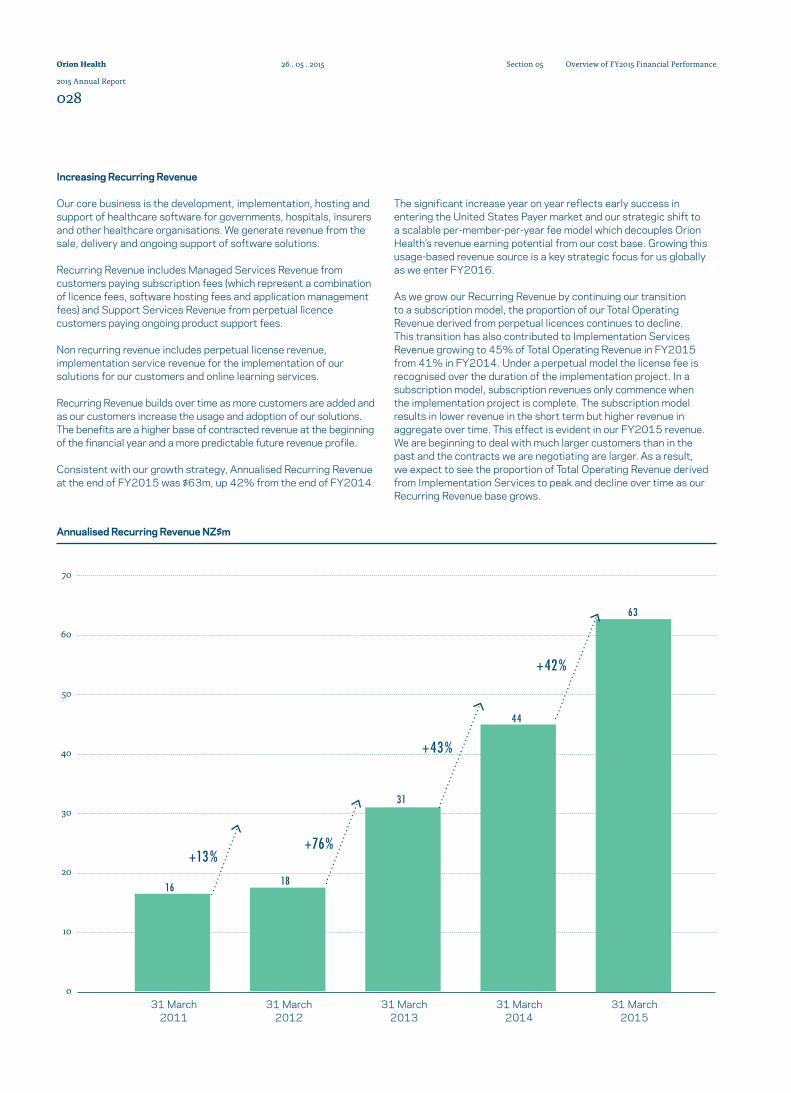
Increasing Recurring Revenue
Our core business is the development, implementation, hosting and support of healthcare software for governments, hospitals, insurers and other healthcare organisations. We generate revenue from the sale, delivery and ongoing support of software solutions.
Recurring Revenue includes Managed Services Revenue from customers paying subscription fees (which represent a combination of licence fees, software hosting fees and application management fees) and Support Services Revenue from perpetual licence customers paying ongoing product support fees.
Non recurring revenue includes perpetual license revenue, implementation service revenue for the implementation of our solutions for our customers and online learning services.
Recurring Revenue builds over time as more customers are added and as our customers increase the usage and adoption of our solutions. The benefits are a higher base of contracted revenue at the beginning of the financial year and a more predictable future revenue profile.
Consistent with our growth strategy, Annualised Recurring Revenue at the end of FY2015 was $63m, up 42% from the end of FY2014.
The significant increase year on year reflects early success in entering the United States Payer market and our strategic shift to a scalable per-member-per-year fee model which decouples Orion Health’s revenue earning potential from our cost base. Growing this usage-based revenue source is a key strategic focus for us globally as we enter FY2016.
As we grow our Recurring Revenue by continuing our transition to a subscription model, the proportion of our Total Operating Revenue derived from perpetual licences continues to decline. This transition has also contributed to Implementation Services Revenue growing to 45% of Total Operating Revenue in FY2015 from 41% in FY2014. Under a perpetual model the license fee is recognised over the duration of the implementation project. In a subscription model, subscription revenues only commence when the implementation project is complete. The subscription model results in lower revenue in the short term but higher revenue in aggregate over time. This effect is evident in our FY2015 revenue. We are beginning to deal with much larger customers than in the past and the contracts we are negotiating are larger. As a result, we expect to see the proportion of Total Operating Revenue derived from Implementation Services to peak and decline over time as our Recurring Revenue base grows.
Annualised Recurring Revenue NZ$m
70
60
50
40
30
20
10
0
+76%+13%
+43%
+42%
31 March 2011
31 March 2012
31 March 2013
31 March 2014
31 March 2015
16 18
31
44
63
Orion Health
2015 Annual Report
028
Overview of FY2015 Financial PerformanceSection 0526 . 05 . 2015
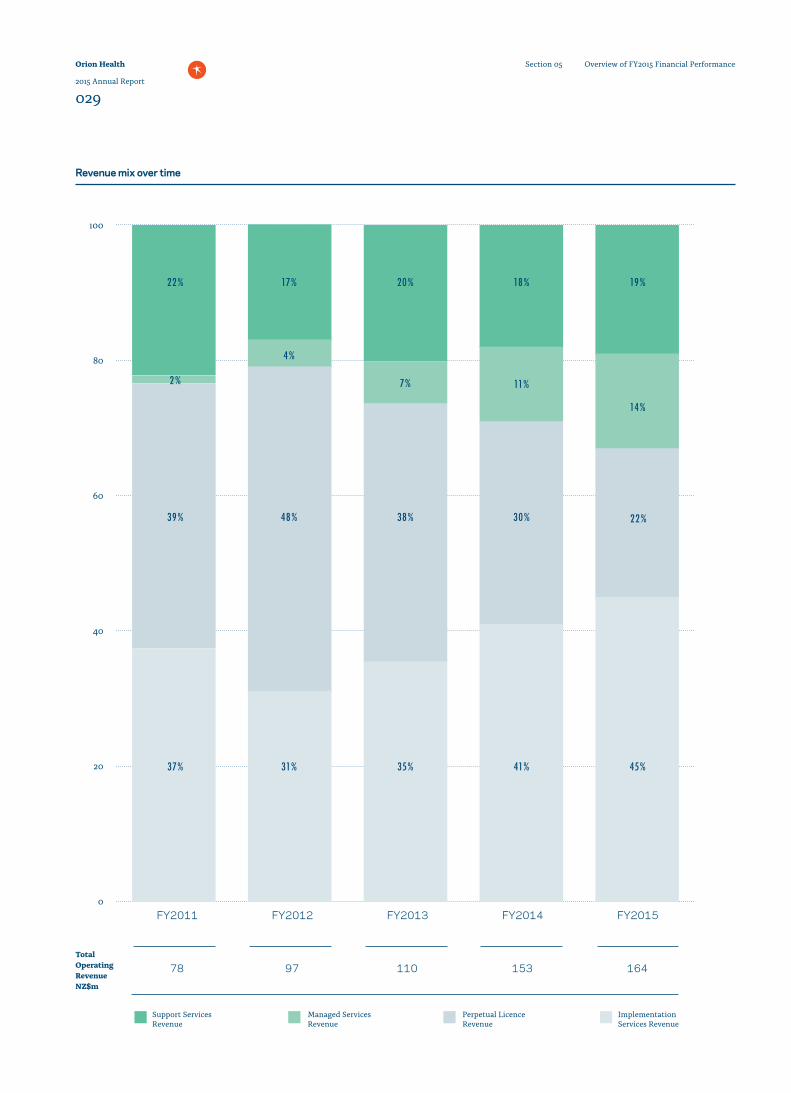
Revenue mix over time
Support Services Revenue
Managed Services Revenue
Perpetual Licence Revenue
Implementation Services Revenue
FY2011 FY2012 FY2013 FY2014 FY2015
78 97 110 153 164
100
80
60
40
20
0
22% 17% 20% 18% 19%
39% 48% 38% 30% 22%
2%
4%
7% 11%
14%
37% 31% 35% 41% 45%
Total
Operating
Revenue
NZ$m
Orion Health
2015 Annual Report
029
Overview of FY2015 Financial PerformanceSection 05
Operating Revenue by Solution Group
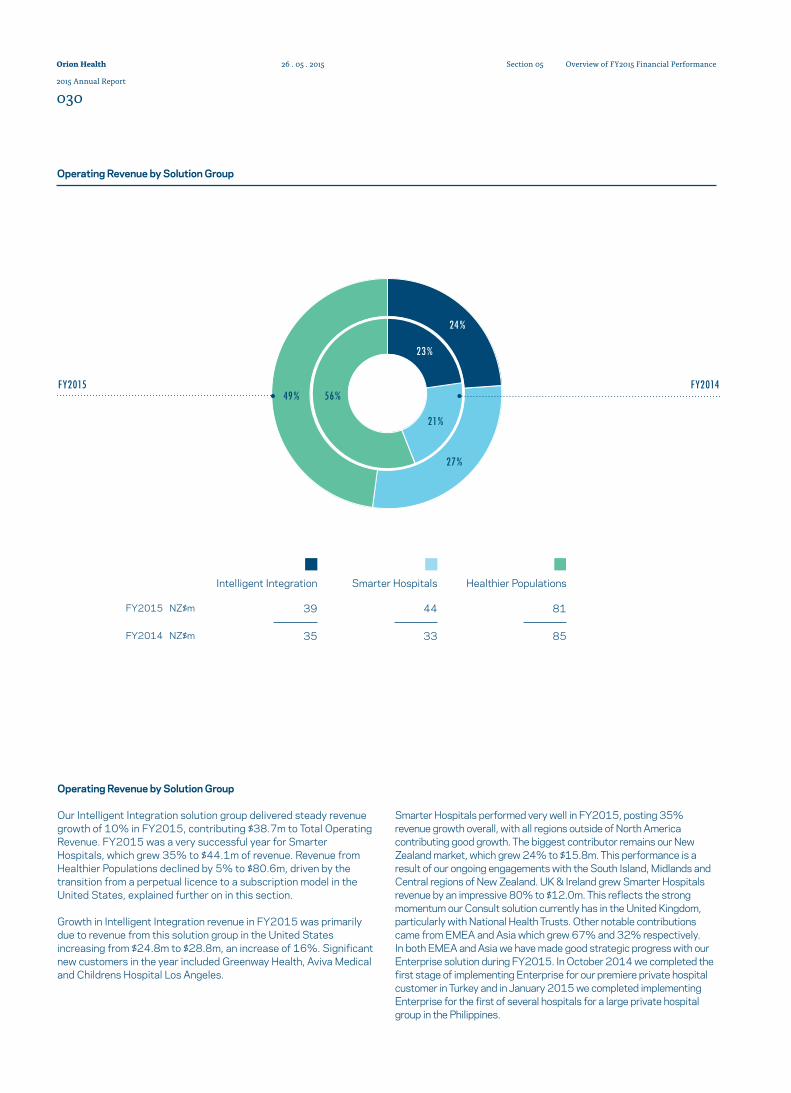
Operating Revenue by Solution Group
Our Intelligent Integration solution group delivered steady revenue growth of 10% in FY2015, contributing $38.7m to Total Operating Revenue. FY2015 was a very successful year for Smarter Hospitals, which grew 35% to $44.1m of revenue. Revenue from Healthier Populations declined by 5% to $80.6m, driven by the transition from a perpetual licence to a subscription model in the United States, explained further on in this section.
Growth in Intelligent Integration revenue in FY2015 was primarily due to revenue from this solution group in the United States increasing from $24.8m to $28.8m, an increase of 16%. Significant new customers in the year included Greenway Health, Aviva Medical and Childrens Hospital Los Angeles.
Smarter Hospitals performed very well in FY2015, posting 35% revenue growth overall, with all regions outside of North America contributing good growth. The biggest contributor remains our New Zealand market, which grew 24% to $15.8m. This performance is a result of our ongoing engagements with the South Island, Midlands and Central regions of New Zealand. UK & Ireland grew Smarter Hospitals revenue by an impressive 80% to $12.0m. This reflects the strong momentum our Consult solution currently has in the United Kingdom, particularly with National Health Trusts. Other notable contributions came from EMEA and Asia which grew 67% and 32% respectively. In both EMEA and Asia we have made good strategic progress with our Enterprise solution during FY2015. In October 2014 we completed the first stage of implementing Enterprise for our premiere private hospital customer in Turkey and in January 2015 we completed implementing Enterprise for the first of several hospitals for a large private hospital group in the Philippines.
49%
21%
23%
24%
56%
27%
FY2014FY2015
Intelligent Integration Smarter Hospitals Healthier Populations
39
35
44
33
81
85
FY2015 NZ$m
FY2014 NZ$m
Orion Health
2015 Annual Report
030
Overview of FY2015 Financial PerformanceSection 0526 . 05 . 2015
64%
73%
27%36%
81%
86%
6%12%
7%
8%
FY2015 FY2014
78%
78%
18%14% 4%
8%
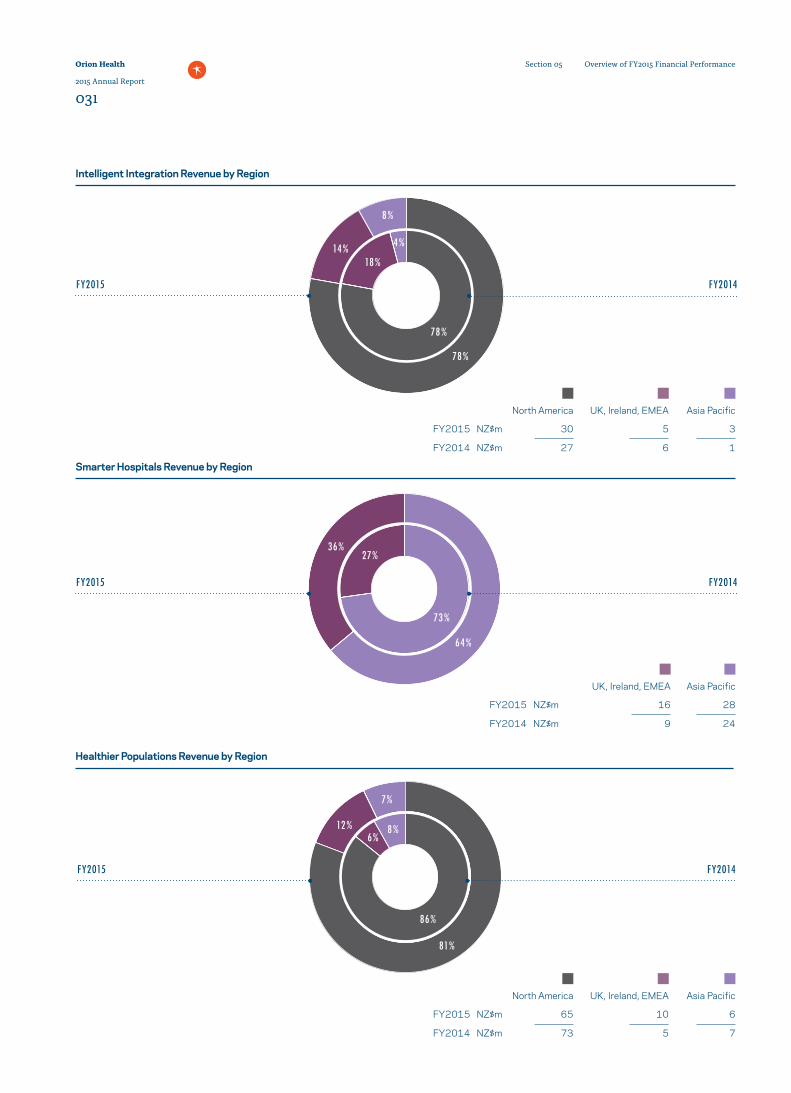
Intelligent Integration Revenue by Region
Smarter Hospitals Revenue by Region
Healthier Populations Revenue by Region
FY2014FY2015
Asia Pacific
3
1
UK, Ireland, EMEA
5
6
North America
30
27
FY2015 NZ$m
FY2014 NZ$m
Asia Pacific
6
7
UK, Ireland, EMEA
10
5
North America
65
73
FY2015 NZ$m
FY2014 NZ$m
Asia Pacific
28
24
UK, Ireland, EMEA
16
9
FY2015 NZ$m
FY2014 NZ$m
FY2014FY2015
Orion Health
2015 Annual Report
031
Overview of FY2015 Financial PerformanceSection 05
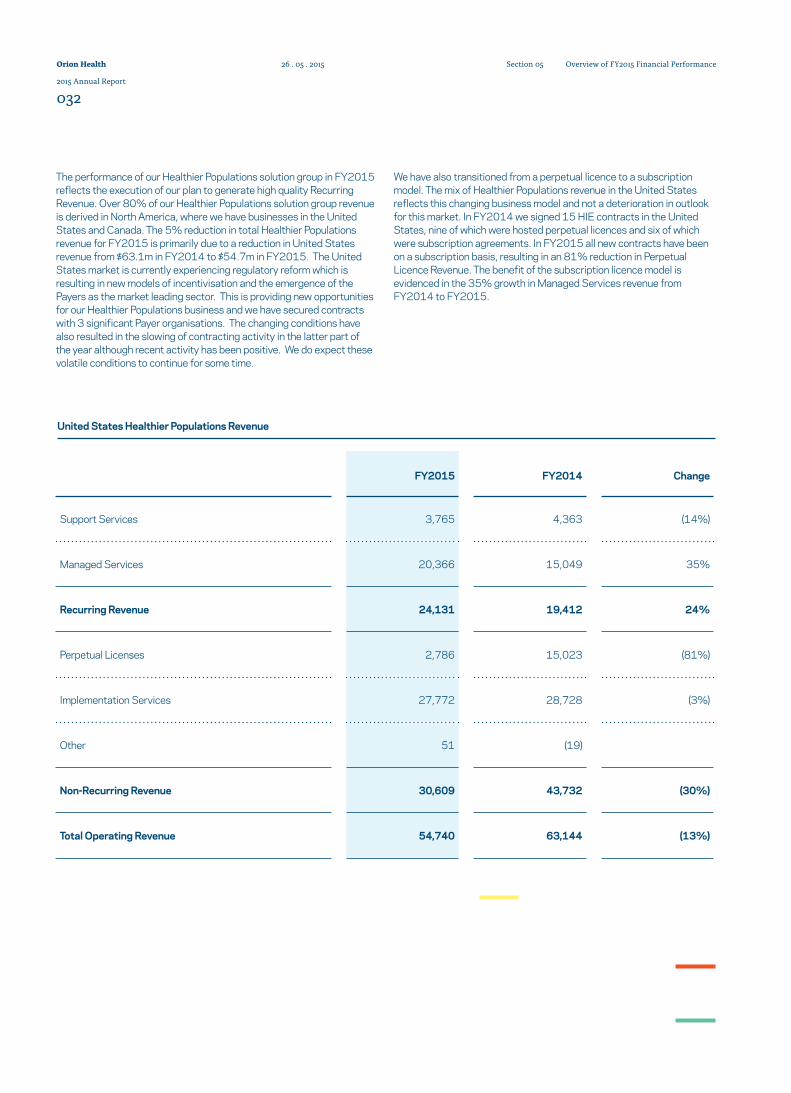
United States Healthier Populations Revenue
FY2015 FY2014 Change
Support Services 3,765 4,363 (14%)
Managed Services 20,366 15,049 35%
Recurring Revenue 24,131 19,412 24%
Perpetual Licenses 2,786 15,023 (81%)
Implementation Services 27,772 28,728 (3%)
Other 51 (19)
Non-Recurring Revenue 30,609 43,732 (30%)
Total Operating Revenue 54,740 63,144 (13%)
The performance of our Healthier Populations solution group in FY2015 reflects the execution of our plan to generate high quality Recurring Revenue. Over 80% of our Healthier Populations solution group revenue is derived in North America, where we have businesses in the United States and Canada. The 5% reduction in total Healthier Populations revenue for FY2015 is primarily due to a reduction in United States revenue from $63.1m in FY2014 to $54.7m in FY2015. The United States market is currently experiencing regulatory reform which is resulting in new models of incentivisation and the emergence of the Payers as the market leading sector. This is providing new opportunities for our Healthier Populations business and we have secured contracts with 3 significant Payer organisations. The changing conditions have also resulted in the slowing of contracting activity in the latter part of the year although recent activity has been positive. We do expect these volatile conditions to continue for some time.
We have also transitioned from a perpetual licence to a subscription model. The mix of Healthier Populations revenue in the United States reflects this changing business model and not a deterioration in outlook for this market. In FY2014 we signed 15 HIE contracts in the United States, nine of which were hosted perpetual licences and six of which were subscription agreements. In FY2015 all new contracts have been on a subscription basis, resulting in an 81% reduction in Perpetual Licence Revenue. The benefit of the subscription licence model is evidenced in the 35% growth in Managed Services revenue from FY2014 to FY2015.
Orion Health
2015 Annual Report
032
Overview of FY2015 Financial PerformanceSection 0526 . 05 . 2015
NZ$’000 FY2015 FY2014 FY2013 FY2012 FY2011
United States 83,582 87,981 53,878 40,172 32,223
Canada 11,443 12,622 11,469 10,154 7,952
New Zealand 17,357 14,158 9,250 8,317 4,505
Australia 14,957 13,301 14,177 24,910 10,563
Asia 5,624 4,551 3,118 1,267 6,352
UK & Ireland 23,590 14,783 14,329 7,506 12,570
EMEA 6,846 5,307 3,327 3,983 3,388
Corporate/Development 673 289 232 319 190
Total Operating Revenue 164,072 152,992 109,780 96,628 77,743
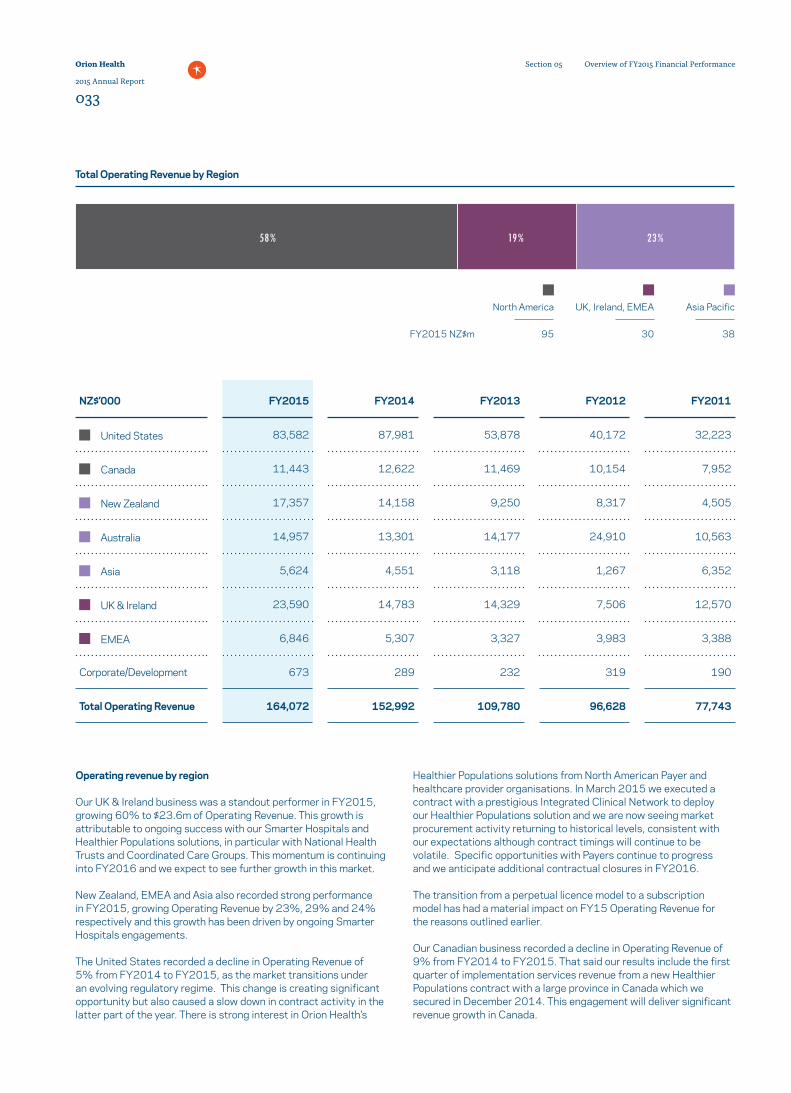
Total Operating Revenue by Region
58% 19% 23%
Asia Pacific
38
UK, Ireland, EMEA
30
North America
95FY2015 NZ$m
Operating revenue by region
Our UK & Ireland business was a standout performer in FY2015, growing 60% to $23.6m of Operating Revenue. This growth is attributable to ongoing success with our Smarter Hospitals and Healthier Populations solutions, in particular with National Health Trusts and Coordinated Care Groups. This momentum is continuing into FY2016 and we expect to see further growth in this market.
New Zealand, EMEA and Asia also recorded strong performance in FY2015, growing Operating Revenue by 23%, 29% and 24% respectively and this growth has been driven by ongoing Smarter Hospitals engagements.
The United States recorded a decline in Operating Revenue of 5% from FY2014 to FY2015, as the market transitions under an evolving regulatory regime. This change is creating significant opportunity but also caused a slow down in contract activity in the latter part of the year. There is strong interest in Orion Health’s
Healthier Populations solutions from North American Payer and healthcare provider organisations. In March 2015 we executed a contract with a prestigious Integrated Clinical Network to deploy our Healthier Populations solution and we are now seeing market procurement activity returning to historical levels, consistent with our expectations although contract timings will continue to be volatile. Specific opportunities with Payers continue to progress and we anticipate additional contractual closures in FY2016.
The transition from a perpetual licence model to a subscription model has had a material impact on FY15 Operating Revenue for the reasons outlined earlier.
Our Canadian business recorded a decline in Operating Revenue of 9% from FY2014 to FY2015. That said our results include the first quarter of implementation services revenue from a new Healthier Populations contract with a large province in Canada which we secured in December 2014. This engagement will deliver significant revenue growth in Canada.
Orion Health
2015 Annual Report
033
Overview of FY2015 Financial PerformanceSection 05

Operating Expenses
Investment in R&D increased to $48.7m in FY2015, 30% of Total Operating Revenue, compared to $34.3m or 22% of Total Operating Revenue in FY2014. R&D headcount has increased by 98 people from 363 at 31 March 2014 to 461 at 31 March 2015. Our decision to materially increase our investment in R&D was made part way through FY2014 and over the course of 18 months we have grown R&D by a total of 184 people. This rapid expansion in R&D has been funded by the Initial Public Offering of Orion Health shares in late 2014 which raised $120m of new capital.
The significant increase in R&D effort has enabled us to accelerate enhancement of our solutions, in particular the next generation product roll-out of Healthier Populations, to meet the requirements of our Payer customers and deliver our vision for Population Health Management.
Sales and Marketing expenses increased 3% in FY2015, declining as a percentage of Operating Revenue from 24% to 23%.
Implementation Services expenses increased 47% in FY2015. Without a corresponding increase in Implementation Services revenue, margins declined from 30% in FY2014 to 13% in FY2015. The main contributor to this unsatisfactory performance is United States Healthier Populations Implementation Services.
Since FY2012, in the United States our strategy has been to aggressively grow market share and we secured a significant number of large scale customers in FY2014. FY2015 has involved completing the implementation of many of these large projects. Our growth in FY2014 required us to scale our implementation services at a speed which has generated challenges, in turn adversely impacting our margins in the short term.
Many of the implementation projects required a significant number of interfaces to connect Providers to our Healthier Populations solutions. A number of these were priced at rates below our targeted Implementation Services Margin levels. Whilst challenging to deliver, increased scale results in more connections to our solutions which in turn leads to greater utility for our customers and hence our solutions become more deeply embedded. Significant effort has been invested in building out our tooling to enable interfaces to become more automated and standardised. Furthermore, substantial effort has also been expended to create standardised solutions to enable faster deployment to further improve our margin performance.
Implementation Services Margin has also been adversely impacted by direct costs related to work subcontracted to third parties in order to meet increasingly complex customer requirements within the timeframes contracted. These third party engagements, which relate to non-Orion Health product components, yielded lower margins than our standard delivery model. The movement toward a standardised solution will reduce our use of third party functionality as we build our own capability.
Managed Services expenses increased 71% in FY2015. This compares to Managed Services revenue growth of 42%. Our Managed Services business is predominantly associated with sales of our Healthier Populations solution group in the United States at present. During FY2015 we have been building service capacity to meet customer demand and changed our deployment architecture to support a standardised, scalable, public cloud SaaS model. Orion Health Open Platform is the first of these next-generation scalable cloud solutions and is being implemented for all new customers. The Managed Services Margin on new Open Platform deployments is at target levels and as we add new customers we expect to see our overall Managed Services Margin increase. This effect is expected to be amplified by the increasing average size of our Managed Services contracts, which reflects the increasing size and sophistication of our target customer base (large Payer and Provider networks).
G&A expenses have increased from $35.6m in FY2014 to $46.4m in FY2015. This includes the impact of foreign exchange gains and losses. Increased G&A expense also relates to new office openings and expansions, $2.2m of costs associated with our Initial Public Offering, increased investment in our Security and People functions, and the establishment of a Transformation team. This Transformation team forms part of our People function (Human Resources, Recruitment, Organisational Development, Payroll and Remuneration) and is focused on improving operational efficiency through internal process and system improvements.
Orion Health
2015 Annual Report
034
Overview of FY2015 Financial PerformanceSection 0526 . 05 . 2015
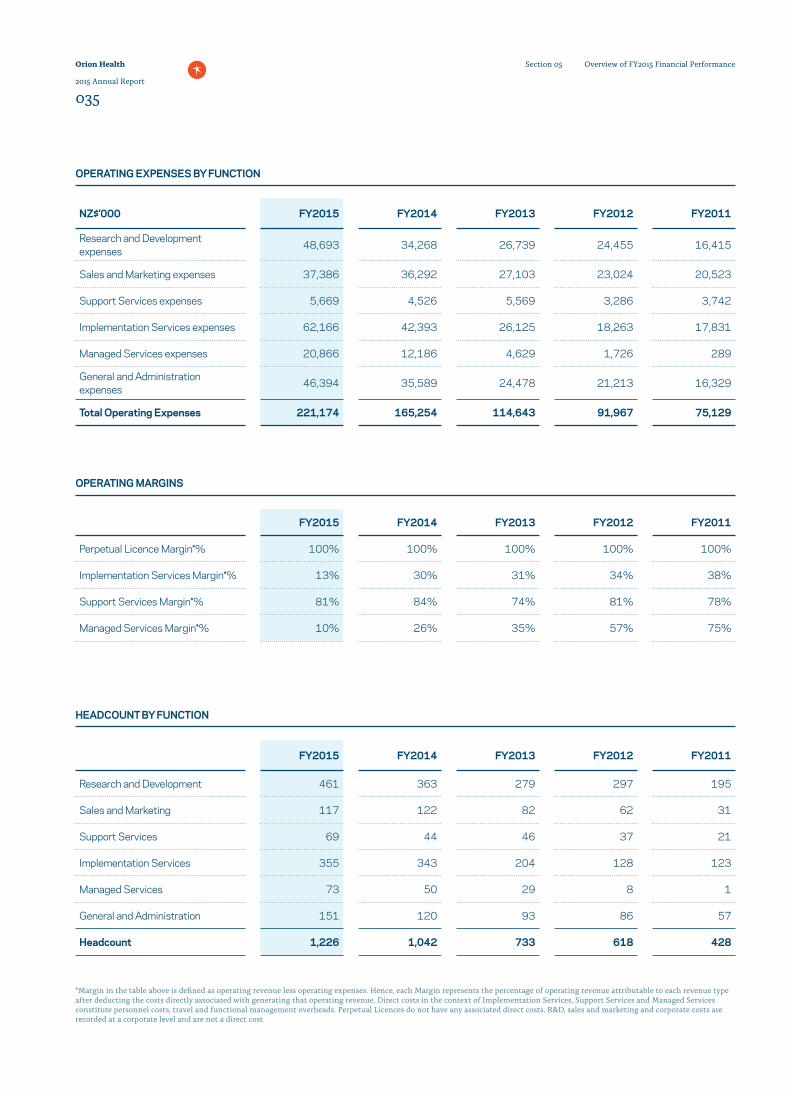
FY2015 FY2014 FY2013 FY2012 FY2011
Research and Development 461 363 279 297 195
Sales and Marketing 117 122 82 62 31
Support Services 69 44 46 37 21
Implementation Services 355 343 204 128 123
Managed Services 73 50 29 8 1
General and Administration 151 120 93 86 57
Headcount 1,226 1,042 733 618 428
FY2015 FY2014 FY2013 FY2012 FY2011
Perpetual Licence Margin*% 100% 100% 100% 100% 100%
Implementation Services Margin*% 13% 30% 31% 34% 38%
Support Services Margin*% 81% 84% 74% 81% 78%
Managed Services Margin*% 10% 26% 35% 57% 75%
NZ$’000 FY2015 FY2014 FY2013 FY2012 FY2011
Research and Development expenses 48,693 34,268 26,739 24,455 16,415
Sales and Marketing expenses 37,386 36,292 27,103 23,024 20,523
Support Services expenses 5,669 4,526 5,569 3,286 3,742
Implementation Services expenses 62,166 42,393 26,125 18,263 17,831
Managed Services expenses 20,866 12,186 4,629 1,726 289
General and Administration expenses 46,394 35,589 24,478 21,213 16,329
Total Operating Expenses 221,174 165,254 114,643 91,967 75,129
*Margin in the table above is defined as operating revenue less operating expenses. Hence, each Margin represents the percentage of operating revenue attributable to each revenue type after deducting the costs directly associated with generating that operating revenue. Direct costs in the context of Implementation Services, Support Services and Managed Services constitute personnel costs, travel and functional management overheads. Perpetual Licences do not have any associated direct costs. R&D, sales and marketing and corporate costs are recorded at a corporate level and are not a direct cost
OPERATING EXPENSES BY FUNCTION
OPERATING MARGINS
HEADCOUNT BY FUNCTION
Orion Health
2015 Annual Report
035
Overview of FY2015 Financial PerformanceSection 05
Koc University School of Medicine is one of the newest medical schools in Turkey, with an inaugural admission of students in 2010. Even though it is still waiting for its first year of graduates, it has become the most preferred medical school in the country, admitting only the top students. Operated under the KOC Foundation (one of the biggest non-governmental charitable organisations in Turkey), the School of Medicine is a research-intensive school that promotes multidisciplinary and cross-platform research that includes collaboration with Engineering, College of Sciences, and Law School. They promote an innovative curriculum, which fosters individualized learning methods based around immersive technologies whilst aiming to train undergraduate students as future academic leaders in medicine.
Koc University Hospital (KUH) and VKV American Hospital - both of which are also owned and managed by the Koc Foundation - deployed the Orion Health ENTERPRISE solution and Orion Health CONSULT solution in 2014. The solution will enable both hospitals to operate with harmonised workflows, resulting in improved care coordination, increased cost savings and efficiencies, and enhanced quality of care.
The Koc Foundation contract was Orion Health’s first ENTERPRISE engagement in Turkey, won after a long, rigorous selection process in 2013. The Koc Foundation was looking for a
platform that will match with the hospitals’ overall state-of-the-art world standards and the quality requirements, with a world-wide proven experience in delivering interoperable, connected solutions for both hospitals, in addition to the time constraint that required the system to be operative.
Orion Health established a business unit based in Turkey and built up a team of experts in order to implement the ENTERPRISE and CONSULT platform. The software localisation challenges were particularly significant, and an initial 9-month software development period was planned to meet local Turkish requirements.
“We are excited to partner with the Koc Hospitals and provide them with the tools they need to successfully establish an accountable care organisation (ACO) model of care while ensuring superior patient care and outcomes and reduced costs. Orion Health, having made exciting investments in the Turkish marketplace, is well positioned for new investment opportunities in Turkey and in the wider region,” said Dr. Beyza Akbasoglu, Orion Health Country Manager in Turkey.
Opened in 2013, the Orion Health Istanbul office has a local team of highly talented and skilled implementation personnel, which is supported by the development teams in Bangkok and Auckland, when necessary.
SMARTER HOSPITALS
KUH - The Journey to Becoming a Smarter Hospital
“Our vision when opening our new university hospital was to become a research and clinical training oriented exemplary leader in the healthcare sector. Orion Health has been a reliable partner during the creation process of our university hospital information and management systems” Dr. Erhan Bulutcu, CEO, VKV American Hospital.
The solutions in this group connect all clinical information into a single view within a Provider setting, as well as automate key processes, improve efficiency and increase patient safety via a robust end to end information system.
Orion Health
2015 Annual Report
036
KUH26 . 05 . 2015

KOC University Hospital
Orion Health
2015 Annual Report
037
KUH

6: Board of DirectorsSECTION
Left to right: Roger France, Andrew Ferrier, Neil Cullimore, Paul Shearer, Ian McCrae & Lester Levy
Orion Health
2015 Annual Report
038
Board of DirectorsSection 0626 . 05 . 2015
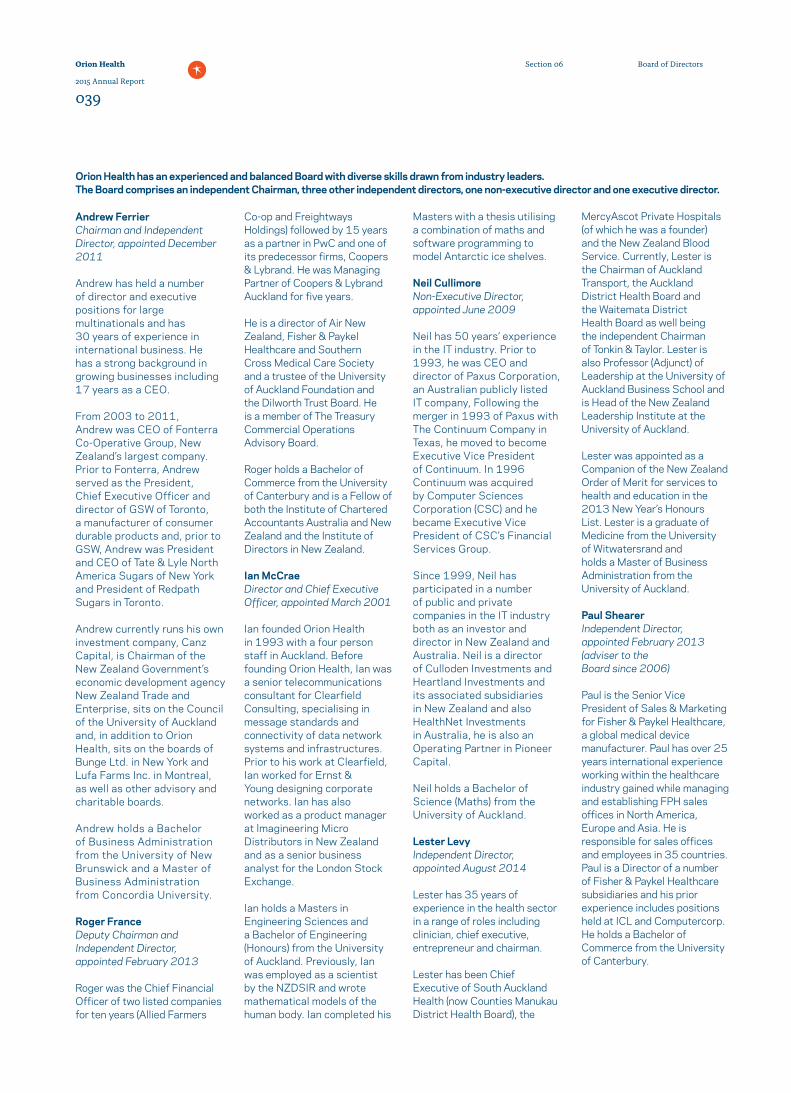
Andrew Ferrier Chairman and Independent Director, appointed December 2011
Andrew has held a number of director and executive positions for large multinationals and has 30 years of experience in international business. He has a strong background in growing businesses including 17 years as a CEO.
From 2003 to 2011, Andrew was CEO of Fonterra Co-Operative Group, New Zealand’s largest company. Prior to Fonterra, Andrew served as the President, Chief Executive Officer and director of GSW of Toronto, a manufacturer of consumer durable products and, prior to GSW, Andrew was President and CEO of Tate & Lyle North America Sugars of New York and President of Redpath Sugars in Toronto.
Andrew currently runs his own investment company, Canz Capital, is Chairman of the New Zealand Government’s economic development agency New Zealand Trade and Enterprise, sits on the Council of the University of Auckland and, in addition to Orion Health, sits on the boards of Bunge Ltd. in New York and Lufa Farms Inc. in Montreal, as well as other advisory and charitable boards.
Andrew holds a Bachelor of Business Administration from the University of New Brunswick and a Master of Business Administration from Concordia University.
Roger France Deputy Chairman and Independent Director, appointed February 2013
Roger was the Chief Financial Officer of two listed companies for ten years (Allied Farmers
Co-op and Freightways Holdings) followed by 15 years as a partner in PwC and one of its predecessor firms, Coopers & Lybrand. He was Managing Partner of Coopers & Lybrand Auckland for five years.
He is a director of Air New Zealand, Fisher & Paykel Healthcare and Southern Cross Medical Care Society and a trustee of the University of Auckland Foundation and the Dilworth Trust Board. He is a member of The Treasury Commercial Operations Advisory Board.
Roger holds a Bachelor of Commerce from the University of Canterbury and is a Fellow of both the Institute of Chartered Accountants Australia and New Zealand and the Institute of Directors in New Zealand.
Ian McCrae Director and Chief Executive Officer, appointed March 2001
Ian founded Orion Health in 1993 with a four person staff in Auckland. Before founding Orion Health, Ian was a senior telecommunications consultant for Clearfield Consulting, specialising in message standards and connectivity of data network systems and infrastructures. Prior to his work at Clearfield, Ian worked for Ernst & Young designing corporate networks. Ian has also worked as a product manager at lmagineering Micro Distributors in New Zealand and as a senior business analyst for the London Stock Exchange.
Ian holds a Masters in Engineering Sciences and a Bachelor of Engineering (Honours) from the University of Auckland. Previously, Ian was employed as a scientist by the NZDSIR and wrote mathematical models of the human body. Ian completed his
Masters with a thesis utilising a combination of maths and software programming to model Antarctic ice shelves.
Neil Cullimore Non-Executive Director, appointed June 2009
Neil has 50 years’ experience in the IT industry. Prior to 1993, he was CEO and director of Paxus Corporation, an Australian publicly listed IT company, Following the merger in 1993 of Paxus with The Continuum Company in Texas, he moved to become Executive Vice President of Continuum. In 1996 Continuum was acquired by Computer Sciences Corporation (CSC) and he became Executive Vice President of CSC’s Financial Services Group.
Since 1999, Neil has participated in a number of public and private companies in the IT industry both as an investor and director in New Zealand and Australia. Neil is a director of Culloden Investments and Heartland Investments and its associated subsidiaries in New Zealand and also HealthNet Investments in Australia, he is also an Operating Partner in Pioneer Capital.
Neil holds a Bachelor of Science (Maths) from the University of Auckland.
Lester Levy Independent Director, appointed August 2014
Lester has 35 years of experience in the health sector in a range of roles including clinician, chief executive, entrepreneur and chairman.
Lester has been Chief Executive of South Auckland Health (now Counties Manukau District Health Board), the
MercyAscot Private Hospitals (of which he was a founder) and the New Zealand Blood Service. Currently, Lester is the Chairman of Auckland Transport, the Auckland District Health Board and the Waitemata District Health Board as well being the independent Chairman of Tonkin & Taylor. Lester is also Professor (Adjunct) of Leadership at the University of Auckland Business School and is Head of the New Zealand Leadership Institute at the University of Auckland.
Lester was appointed as a Companion of the New Zealand Order of Merit for services to health and education in the 2013 New Year’s Honours List. Lester is a graduate of Medicine from the University of Witwatersrand and holds a Master of Business Administration from the University of Auckland.
Paul Shearer Independent Director, appointed February 2013 (adviser to the Board since 2006)
Paul is the Senior Vice President of Sales & Marketing for Fisher & Paykel Healthcare, a global medical device manufacturer. Paul has over 25 years international experience working within the healthcare industry gained while managing and establishing FPH sales offices in North America, Europe and Asia. He is responsible for sales offices and employees in 35 countries. Paul is a Director of a number of Fisher & Paykel Healthcare subsidiaries and his prior experience includes positions held at ICL and Computercorp. He holds a Bachelor of Commerce from the University of Canterbury.
Orion Health has an experienced and balanced Board with diverse skills drawn from industry leaders. The Board comprises an independent Chairman, three other independent directors, one non-executive director and one executive director.
Orion Health
2015 Annual Report
039
Board of DirectorsSection 06
Research and Development leaders
David Bennett United States Executive Vice President, Healthier Populations David joined Orion Health in 2013 as Executive Vice President of Healthier Populations. His focus is to build out the Healthier Populations business including the new North American Development Centre in Scottsdale, Arizona.
David Hepburn New Zealand Senior Vice President, Smarter Hospitals David joined Orion Health in 2012 from executive roles at Dell Inc and Perot Systems Corp and has since held roles leading Quality Management Programs, Product Management and Smarter Hospitals Operations. He is now responsible for our Smarter Hospitals solution group.
David Leach New Zealand Vice President, Intelligent Integration David is responsible for Orion Health’s Intelligent Integration solution group. Having joined Orion Health in 2007, he has previously held leadership roles in Implementation Services and Sales, both in New Zealand and the United States.
Jan Behrens New Zealand Executive Vice President, Engineering Jan joined Orion Health in 2013. As Executive Vice President of Engineering, he is responsible for development methodology and delivery across all product development centres. Previously Jan has worked in leadership roles for House of Travel and PayGlobal, and he has a background in logistics and software R&D.
Sales and Service leaders
Paul Viskovich United States President, North America Paul is responsible for Orion Health’s North American business, which he launched in 2002. He is supported by a regional leadership team across the United States and Canada. Prior to joining Orion Health, Paul held various sales, marketing and management roles in the IT industry.
Wayne Oxenham New Zealand Executive Vice President, Europe, Middle East and Africa Wayne joined Orion Health in 2003 and has since held roles in Implementation Services, Sales, Marketing and Research and Development. He is now responsible for the Europe, Middle East and Africa business.
Gary White United States Executive Vice President, Global Services Gary joined Orion Health in 2014 as Executive Vice President of Global Services following his previous role as Head of Healthcare and Life Sciences Information Software and Services for the APAC and MEA region at Computer Sciences Corporation. Gary has worked across the healthcare sector for 15 years.
Darren Jones Australia Senior Vice President, Asia Pacific Darren joined Orion Health in February 2015, from Intersystems. He brings over 25 years of healthcare information technology experience across a breadth of roles.
Corporate leaders
Graeme Wilson New Zealand Chief Operating Officer and Chief Financial Officer Graeme joined Orion Health in 2014 following his successful management of a technology focused investment firm. He has been widely involved in the IT industry for the past 30 years and has experience with a number of health IT companies.
Greg Balla New Zealand Executive Vice President, PEOPLE and Business Transformation Greg leads a team that is responsible for supporting our global leaders to attract great people, engage and recognise these people for doing their best everyday. Greg’s team also lead major change initiatives aimed at continually lifting the performance of the organisation.
Luke Facer New Zealand Vice President, General Counsel Luke has been with Orion Health since 2010. He has over 10 years of legal experience, including six years in private practice in Auckland and New York.
Annemarie Browne New Zealand Vice President, Marketing Annemarie joined Orion Health in 2014 as Vice President of Marketing. She has over 20 years’ sales and marketing experience in the media industry, most recently as GM Marketing at TVNZ and, prior to that, as GM New Zealand for SEEK.
Helen Bullick New Zealand Vice President Strategy Helen joined Orion Health in 2012 after six years in investment banking working on mergers and acquisitions, equity capital raisings and corporate advisory engagements.
7: Global LeadersSECTION
Orion Health
2015 Annual Report
040
Global LeadersSection 0726 . 05 . 2015
Orion Health
2015 Annual Report
041
Global LeadersSection 07
The Directors of Orion Health Group Limited (formerly Orion Corporation Limited) are responsible for the preparation, in accordance with New Zealand generally accepted accounting practice, of the financial statements which present fairly the financial position of the Orion Health Group Limited consolidated group (the ‘Group’) as at 31 March 2015 and the results of its operations and cash flows for the year ended on that date.
The Directors consider that the financial statements of the Group have been prepared using accounting policies appropriate to the Group’s circumstances, consistently applied and supported by reasonable and prudent judgements and estimates, and that all applicable New Zealand equivalents to International Financial Reporting Standards and International Financial Reporting Standards have been followed.
The Directors have responsibility for ensuring that proper accounting records have been kept which enable, with reasonable accuracy, the determination of the financial position of the Group and enable them to ensure that the financial statements comply with the Financial Markets Conduct Act 2013.
The Directors have responsibility for the maintenance of a system of internal control designed to provide reasonable assurance as to the integrity and reliability of the financial reporting. The Directors consider that adequate steps have been taken to safeguard the assets of the Group and to prevent and detect fraud and other irregularities.
The Directors are pleased to present the financial statements of the Group for the year ended 31 March 2015.
The Board of Directors of Orion Health Group Limited authorised these financial statements for issue on 25 May 2015.
This Annual Report is signed on behalf of the Board by:
Andrew Ferrier Ian McCrae Chairman Director and Chief Executive Officer
8: Directors’ Responsibility Statement
SECTION
Orion Health
2015 Annual Report
042
Directors’ Responsibility StatementSection 0826 . 05 . 2015
To the shareholders of Orion Health Group Limited
Report on the Financial Statements
We have audited the Group financial statements of Orion Health Group Limited (“the Company”) on pages 46 to 81, which comprise the balance sheet as at 31 March 2015, the statement of comprehensive income, the statement of changes in equity and the statement of cash flows for the year then ended and the notes to the financial statements that include a summary of significant accounting policies and other explanatory information for the Group. The Group comprises the Company and the entities it controlled at 31 March 2015 or from time to time during the financial year.
Directors’ Responsibility for the Financial Statements
The Directors are responsible for the preparation and fair presentation of these financial statements in accordance with New Zealand Equivalents to International Financial Reporting Standards and International Financial Reporting Standards and for such internal controls as the Directors determine are necessary to enable the preparation of financial statements that are free from material misstatement, whether due to fraud or error.
Auditors’ Responsibility
Our responsibility is to express an opinion on these financial statements based on our audit. We conducted our audit in accordance with International Standards on Auditing (New Zealand) and International Standards on Auditing. These standards require that we comply with relevant ethical requirements and plan and perform the audit to obtain reasonable assurance about whether the financial statements are free from material misstatement.
An audit involves performing procedures to obtain audit evidence about the amounts and disclosures in the financial statements. The procedures selected depend on the auditors’ judgement, including the assessment of the risks of material misstatement of the financial statements, whether due to fraud or error. In making those risk assessments, the auditors consider the internal controls relevant to the Company’s preparation and fair presentation of the financial statements in order to design audit procedures that are appropriate in the circumstances, but not for the purpose of expressing an opinion on the effectiveness of the Company’s internal control. An audit also includes evaluating the appropriateness of accounting policies used and the reasonableness of accounting estimates, as well as evaluating the overall presentation of the financial statements.
We believe that the audit evidence we have obtained is sufficient and appropriate to provide a basis for our audit opinion.
We are independent of the Group. Our firm carries out other services for the Group in the areas of other assurance and advisory services. The provision of these other services has not impaired our independence.
Opinion
In our opinion, the financial statements on pages 46 to 81 present fairly, in all material respects, the financial position of the Group as at 31 March 2015 and its financial performance and cash flows for the year then ended in accordance with New Zealand Equivalents to International Financial Reporting Standards and International Financial Reporting Standards.
Restriction on Use of our Report
This report is made solely to the Company’s shareholders, as a body, in accordance with the Companies Act 1993. Our audit work has been undertaken so that we might state those matters which we are required to state to them in an auditors’ report and for no other purpose. To the fullest extent permitted by law, we do not accept or assume responsibility to anyone other than the Company and the Company’s shareholders, as a body, for our audit work, for this report or for the opinions we have formed.
Chartered Accountants Auckland
25 May 2015
9: Independent Auditors’ Report
SECTION
Orion Health
2015 Annual Report
043
Independent Auditors’ ReportSection 09

Orion Health
2015 Annual Report
044
26 . 05 . 2015
10:Financial Statements
SECTION
Orion Health
2015 Annual Report
045
Financial StatementsSection 10
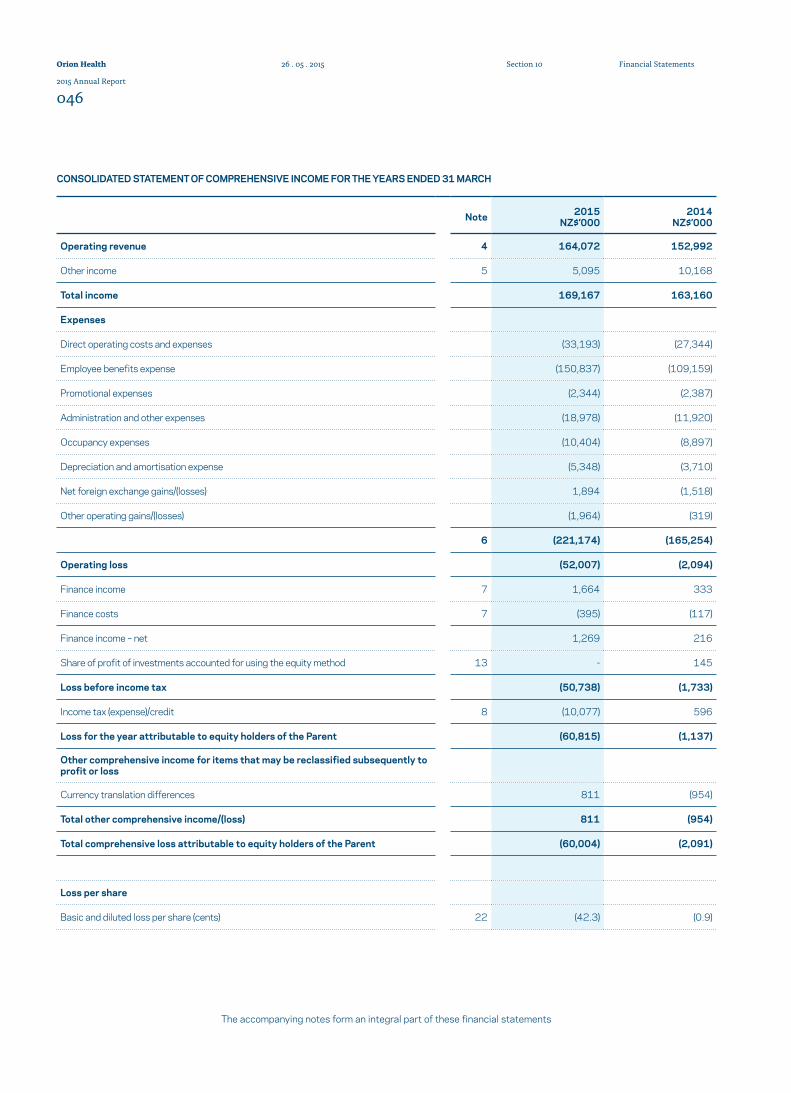
CONSOLIDATED STATEMENT OF COMPREHENSIVE INCOME FOR THE YEARS ENDED 31 MARCH
Note 2015 NZ$’000
2014 NZ$’000
Operating revenue 4 164,072 152,992
Other income 5 5,095 10,168
Total income 169,167 163,160
Expenses
Direct operating costs and expenses (33,193) (27,344)
Employee benefits expense (150,837) (109,159)
Promotional expenses (2,344) (2,387)
Administration and other expenses (18,978) (11,920)
Occupancy expenses (10,404) (8,897)
Depreciation and amortisation expense (5,348) (3,710)
Net foreign exchange gains/(losses) 1,894 (1,518)
Other operating gains/(losses) (1,964) (319)
6 (221,174) (165,254)
Operating loss (52,007) (2,094)
Finance income 7 1,664 333
Finance costs 7 (395) (117)
Finance income – net 1,269 216
Share of profit of investments accounted for using the equity method 13 - 145
Loss before income tax (50,738) (1,733)
Income tax (expense)/credit 8 (10,077) 596
Loss for the year attributable to equity holders of the Parent (60,815) (1,137)
Other comprehensive income for items that may be reclassified subsequently to profit or loss
Currency translation differences 811 (954)
Total other comprehensive income/(loss) 811 (954)
Total comprehensive loss attributable to equity holders of the Parent (60,004) (2,091)
Loss per share
Basic and diluted loss per share (cents) 22 (42.3) (0.9)
The accompanying notes form an integral part of these financial statements
Orion Health
2015 Annual Report
046
Financial StatementsSection 1026 . 05 . 2015
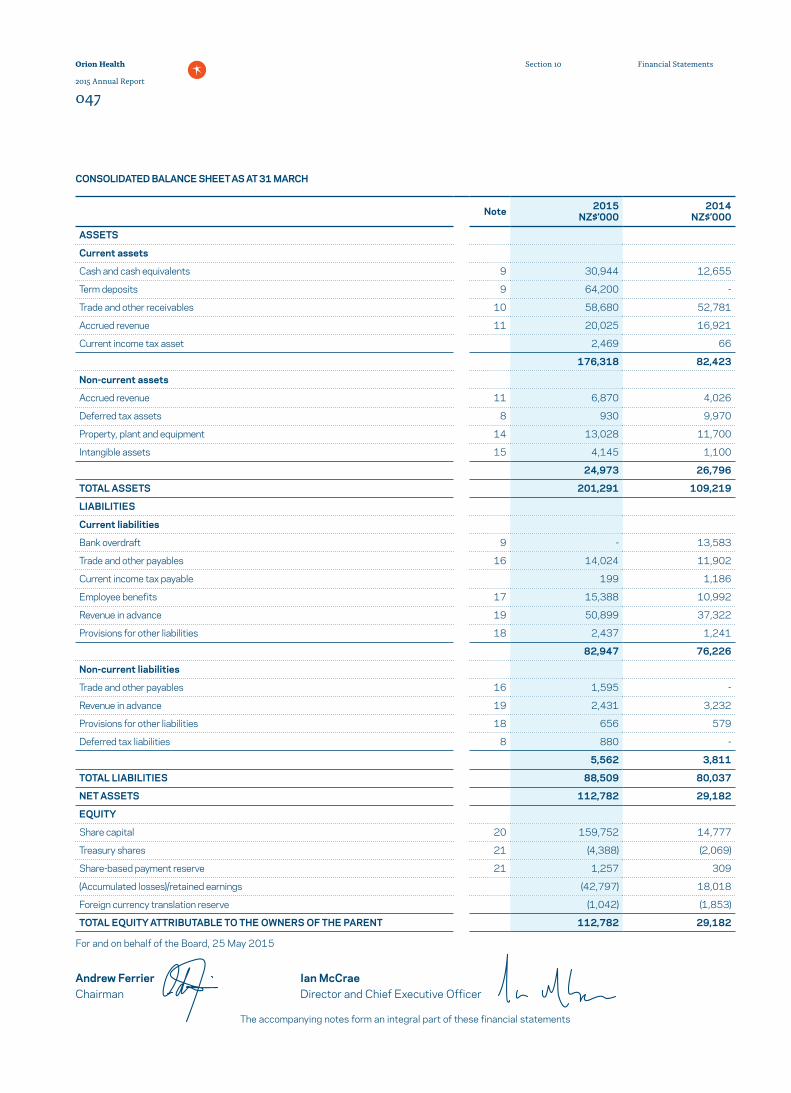
CONSOLIDATED BALANCE SHEET AS AT 31 MARCH
The accompanying notes form an integral part of these financial statements
For and on behalf of the Board, 25 May 2015
Note 2015 NZ$’000
2014 NZ$’000
ASSETS
Current assets
Cash and cash equivalents 9 30,944 12,655
Term deposits 9 64,200 -
Trade and other receivables 10 58,680 52,781
Accrued revenue 11 20,025 16,921
Current income tax asset 2,469 66
176,318 82,423
Non-current assets
Accrued revenue 11 6,870 4,026
Deferred tax assets 8 930 9,970
Property, plant and equipment 14 13,028 11,700
Intangible assets 15 4,145 1,100
24,973 26,796
TOTAL ASSETS 201,291 109,219
LIABILITIES
Current liabilities
Bank overdraft 9 - 13,583
Trade and other payables 16 14,024 11,902
Current income tax payable 199 1,186
Employee benefits 17 15,388 10,992
Revenue in advance 19 50,899 37,322
Provisions for other liabilities 18 2,437 1,241
82,947 76,226
Non-current liabilities
Trade and other payables 16 1,595 -
Revenue in advance 19 2,431 3,232
Provisions for other liabilities 18 656 579
Deferred tax liabilities 8 880 -
5,562 3,811
TOTAL LIABILITIES 88,509 80,037
NET ASSETS 112,782 29,182
EQUITY
Share capital 20 159,752 14,777
Treasury shares 21 (4,388) (2,069)
Share-based payment reserve 21 1,257 309
(Accumulated losses)/retained earnings (42,797) 18,018
Foreign currency translation reserve (1,042) (1,853)
TOTAL EQUITY ATTRIBUTABLE TO THE OWNERS OF THE PARENT 112,782 29,182
Andrew Ferrier Chairman
Ian McCrae Director and Chief Executive Officer
Orion Health
2015 Annual Report
047
Financial StatementsSection 10
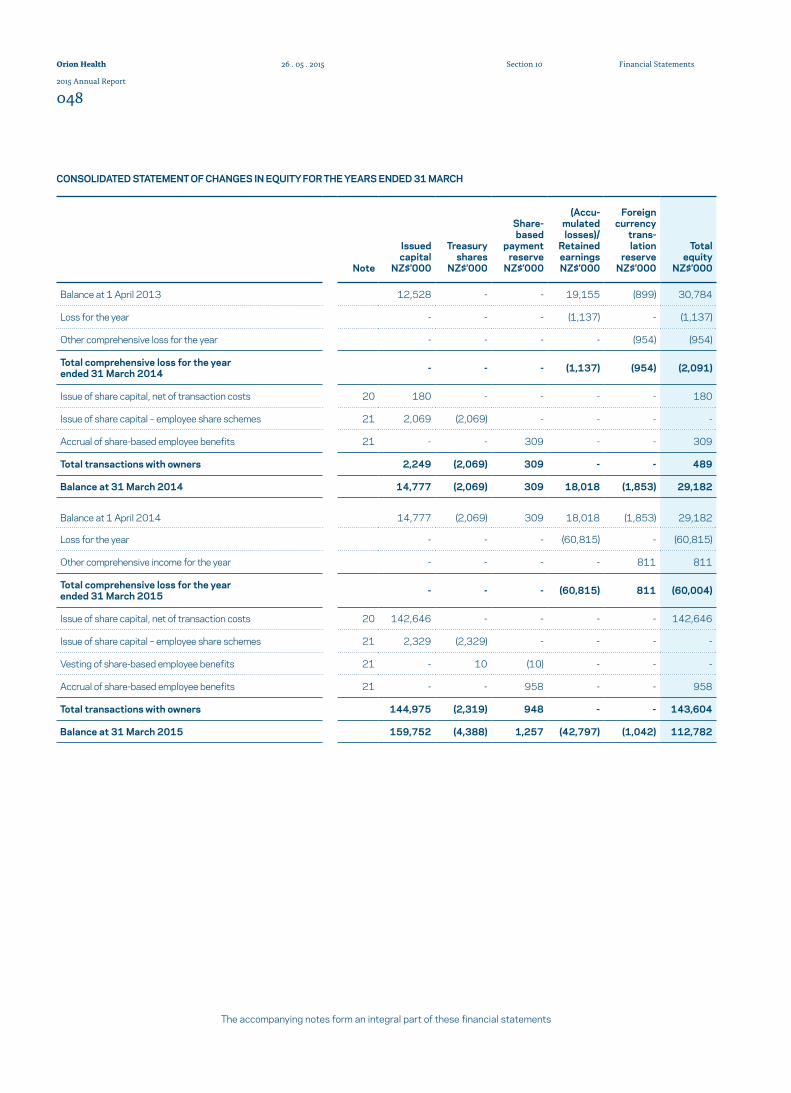
Note
Issued capital
NZ$’000
Treasury shares
NZ$’000
Share-based
payment reserve
NZ$’000
(Accu-mulated losses)/
Retained earnings NZ$’000
Foreign currency
trans-lation
reserve NZ$’000
Total equity
NZ$’000
Balance at 1 April 2013 12,528 - - 19,155 (899) 30,784
Loss for the year - - - (1,137) - (1,137)
Other comprehensive loss for the year - - - - (954) (954)
Total comprehensive loss for the year ended 31 March 2014 - - - (1,137) (954) (2,091)
Issue of share capital, net of transaction costs 20 180 - - - - 180
Issue of share capital – employee share schemes 21 2,069 (2,069) - - - -
Accrual of share-based employee benefits 21 - - 309 - - 309
Total transactions with owners 2,249 (2,069) 309 - - 489
Balance at 31 March 2014 14,777 (2,069) 309 18,018 (1,853) 29,182
Balance at 1 April 2014 14,777 (2,069) 309 18,018 (1,853) 29,182
Loss for the year - - - (60,815) - (60,815)
Other comprehensive income for the year - - - - 811 811
Total comprehensive loss for the year ended 31 March 2015 - - - (60,815) 811 (60,004)
Issue of share capital, net of transaction costs 20 142,646 - - - - 142,646
Issue of share capital – employee share schemes 21 2,329 (2,329) - - - -
Vesting of share-based employee benefits 21 - 10 (10) - - -
Accrual of share-based employee benefits 21 - - 958 - - 958
Total transactions with owners 144,975 (2,319) 948 - - 143,604
Balance at 31 March 2015 159,752 (4,388) 1,257 (42,797) (1,042) 112,782
CONSOLIDATED STATEMENT OF CHANGES IN EQUITY FOR THE YEARS ENDED 31 MARCH
The accompanying notes form an integral part of these financial statements
Orion Health
2015 Annual Report
048
Financial StatementsSection 1026 . 05 . 2015

CONSOLIDATED STATEMENT OF CASH FLOWS FOR THE YEARS ENDED 31 MARCH
Note2015
NZ$’0002014
NZ$’000
CASH FLOW FROM OPERATING ACTIVITES
Cash provided from:
Receipts from customers 174,662 147,025
Interest received 463 333
175,125 147,358
Cash applied to:
Payment to suppliers (73,989) (54,020)
Payment to employees (136,923) (97,534)
Interest paid (292) (117)
Taxation paid (2,463) (4,461)
(213,667) (156,132)
Net cash outflow from operating activities 27 (38,542) (8,774)
CASH FLOW FROM INVESTING ACTIVITIES
Cash provided from:
Disposal of associate 13 - 8,008
Cash applied to:
Term deposits 9 (64,200) -
Property, plant and equipment – additions (4,751) (8,434)
Intangible assets – additions (1,676) (870)
Net cash outflow from investing activities (70,627) (1,296)
CASH FLOW FROM FINANCING ACTIVITIES
Cash provided from:
Issue of shares – gross proceeds 20 146,217 180
Issue of shares – transaction costs 6, 20 (6,064) -
Dividend received 5 - 262
Net cash inflow from financing activities 140,153 442
TOTAL NET CASH INFLOW/(OUTFLOW) 30,984 (9,628)
Cash and cash equivalents as the beginning of period (928) 9,276
Effect of exchange rate on foreign currency balances 888 (576)
Net cash inflow/(outflow) 30,984 (9,628)
Cash and cash equivalents at the end of period 9 30,944 (928)
Composition of cash and cash equivalents
Cash and cash equivalents 30,944 12,655
Bank overdraft - (13,583)
Total cash and cash equivalents 9 30,944 (928)
Term deposits — within investing activities 64,200 -
Total funds available and on deposit 9 95,144 (928)
The accompanying notes form an integral part of these financial statements
Orion Health
2015 Annual Report
049
Financial StatementsSection 10
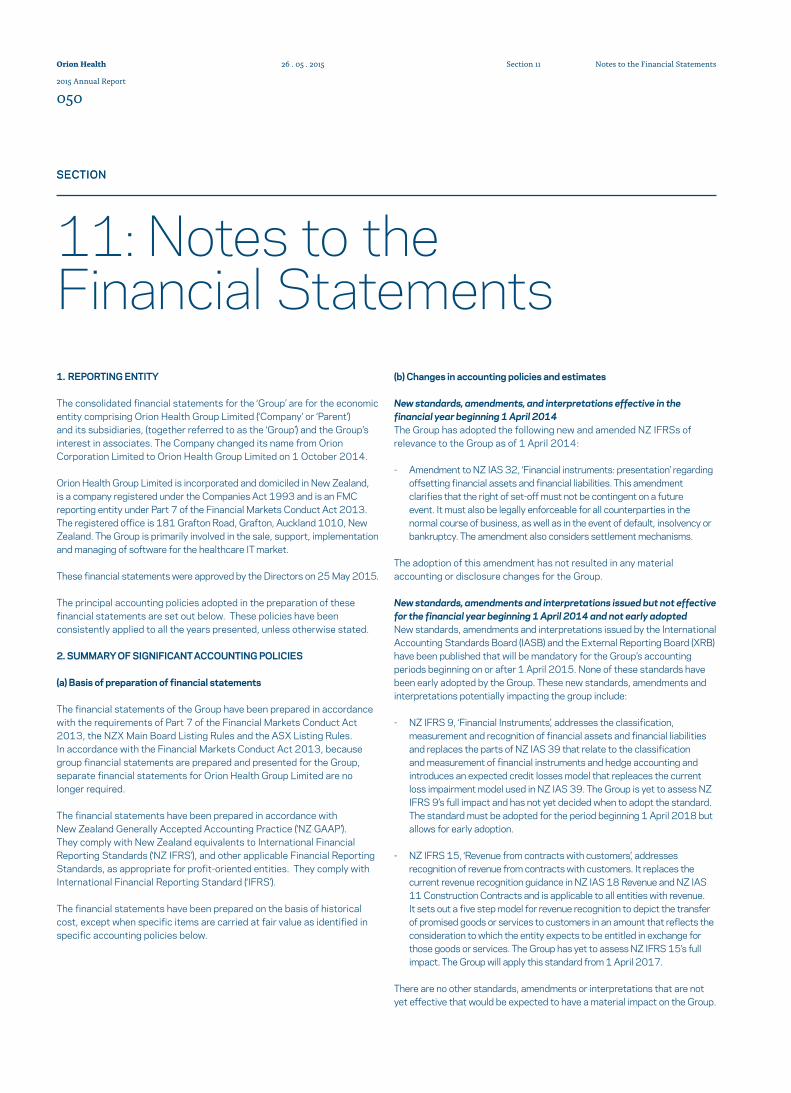
1. REPORTING ENTITY
The consolidated financial statements for the ‘Group’ are for the economic entity comprising Orion Health Group Limited (‘Company’ or ‘Parent’) and its subsidiaries, (together referred to as the ‘Group’) and the Group’s interest in associates. The Company changed its name from Orion Corporation Limited to Orion Health Group Limited on 1 October 2014.
Orion Health Group Limited is incorporated and domiciled in New Zealand, is a company registered under the Companies Act 1993 and is an FMC reporting entity under Part 7 of the Financial Markets Conduct Act 2013. The registered office is 181 Grafton Road, Grafton, Auckland 1010, New Zealand. The Group is primarily involved in the sale, support, implementation and managing of software for the healthcare IT market.
These financial statements were approved by the Directors on 25 May 2015.
The principal accounting policies adopted in the preparation of these financial statements are set out below. These policies have been consistently applied to all the years presented, unless otherwise stated.
2. SUMMARY OF SIGNIFICANT ACCOUNTING POLICIES
(a) Basis of preparation of financial statements
The financial statements of the Group have been prepared in accordance with the requirements of Part 7 of the Financial Markets Conduct Act 2013, the NZX Main Board Listing Rules and the ASX Listing Rules. In accordance with the Financial Markets Conduct Act 2013, because group financial statements are prepared and presented for the Group, separate financial statements for Orion Health Group Limited are no longer required.
The financial statements have been prepared in accordance with New Zealand Generally Accepted Accounting Practice (‘NZ GAAP’). They comply with New Zealand equivalents to International Financial Reporting Standards (‘NZ IFRS’), and other applicable Financial Reporting Standards, as appropriate for profit-oriented entities. They comply with International Financial Reporting Standard (‘IFRS’).
The financial statements have been prepared on the basis of historical cost, except when specific items are carried at fair value as identified in specific accounting policies below.
(b) Changes in accounting policies and estimates
New standards, amendments, and interpretations effective in the financial year beginning 1 April 2014 The Group has adopted the following new and amended NZ IFRSs of relevance to the Group as of 1 April 2014:
- Amendment to NZ IAS 32, ‘Financial instruments: presentation’ regarding offsetting financial assets and financial liabilities. This amendment clarifies that the right of set-off must not be contingent on a future event. It must also be legally enforceable for all counterparties in the normal course of business, as well as in the event of default, insolvency or bankruptcy. The amendment also considers settlement mechanisms.
The adoption of this amendment has not resulted in any material accounting or disclosure changes for the Group.
New standards, amendments and interpretations issued but not effective for the financial year beginning 1 April 2014 and not early adopted New standards, amendments and interpretations issued by the International Accounting Standards Board (IASB) and the External Reporting Board (XRB) have been published that will be mandatory for the Group’s accounting periods beginning on or after 1 April 2015. None of these standards have been early adopted by the Group. These new standards, amendments and interpretations potentially impacting the group include:
- NZ IFRS 9, ‘Financial Instruments’, addresses the classification, measurement and recognition of financial assets and financial liabilities and replaces the parts of NZ IAS 39 that relate to the classification and measurement of financial instruments and hedge accounting and introduces an expected credit losses model that repleaces the current loss impairment model used in NZ IAS 39. The Group is yet to assess NZ IFRS 9’s full impact and has not yet decided when to adopt the standard. The standard must be adopted for the period beginning 1 April 2018 but allows for early adoption.
- NZ IFRS 15, ‘Revenue from contracts with customers’, addresses recognition of revenue from contracts with customers. It replaces the current revenue recognition guidance in NZ IAS 18 Revenue and NZ IAS 11 Construction Contracts and is applicable to all entities with revenue. It sets out a five step model for revenue recognition to depict the transfer of promised goods or services to customers in an amount that reflects the consideration to which the entity expects to be entitled in exchange for those goods or services. The Group has yet to assess NZ IFRS 15’s full impact. The Group will apply this standard from 1 April 2017.
There are no other standards, amendments or interpretations that are not yet effective that would be expected to have a material impact on the Group.
SECTIONSECTION
11: Notes to the Financial Statements
Orion Health
2015 Annual Report
050
Notes to the Financial StatementsSection 1126 . 05 . 2015
(c) Basis of consolidation
Subsidiaries Subsidiaries are all entities over which the Group has control. The Group controls an entity when it is exposed to, or has rights to, variable returns from its involvement with the entity and has the ability to affect those returns through its power over the entity. Subsidiaries are fully consolidated from the date on which control is transferred to the Group. They are deconsolidated from the date that control ceases.
Intra-group balances and transactions and any unrealised income and expenses arising from intra-group transactions are eliminated in preparing the consolidated financial statements.
Business Combinations The acquisition method of accounting is used to account for the acquisition of subsidiaries by the Group. The consideration transferred for an acquisition is measured as the fair value of the assets transferred, equity instruments issued and liabilities incurred or assumed at the date of exchange. Costs directly attributable to the acquisition are expensed in the Statement of Comprehensive Income. Identifiable assets acquired and liabilities and contingent liabilities assumed in a business combination are measured initially at their fair values at the acquisition date, irrespective of the extent of any non-controlling interest. The excess of the cost of acquisition over the fair value of the Group’s share of the identifiable net assets acquired is recorded as goodwill.
If the cost of acquisition is less than the Group’s share of the fair value of the identifiable net assets of the subsidiary acquired, the difference is recognised directly in the Statement of Comprehensive Income.
Investments in associates An associate is an entity over which the Group has significant influence and that is neither a subsidiary nor an interest in a joint venture. Significant influence is the power to participate in the financial and operating policy decisions of the investee but is not control or joint control over those policies. The Group’s investment in its associates is accounted for using the equity method of accounting in the consolidated financial statements.
Under the equity method, investments in the associates are carried on the consolidated Balance Sheet at cost plus the Group’s share of the profit or loss and other comprehensive income of equity accounted investees, from the date that significant influence commences until the date that significant influence ceases.
Dividends receivable from associates reduce the carrying amount of the investment in the consolidated financial statements.
(d) Foreign currency translation
Functional and presentation currency Both the functional and presentation currency of Orion Health Group Limited and its New Zealand subsidiaries are New Zealand dollars ($).
The functional currencies of other subsidiaries are as follows:
Subsidiary Country of Incorporation Functional currency
Orion Health, Inc. United States of America United States dollar (USD)
Orion Health Limited Canada Canadian dollar (CAD)
Orion Health Limited United Kingdom Great Britain pound (GBP)
Orion Health Pty Limited Australia Australian dollar (AUD)
Orion Health S.L.U. Spain Euro (EUR)
Orion Health SAS France Euro (EUR)
Orion Health Pte. Limited Singapore Singapore dollar (SGD)
Orion Health K.K. Japan Japanese yen (JPY)
Orion Health Systems FZ-LLC United Arab Emirates United Arab Emirates dirham (AED)
Orion Health Limited Thailand Thai baht (THB)
Orion Sağlık ve Bilgi Sistemleri Limited Şirketi Turkey United States dollar (USD)
Orion Software Technology Consulting (Shenzhen) Co., Limited China Chinese renminbi (RMB)
Orion Health Philippines, Inc. Philippines Philippine Peso (PHP)
Transactions and balances Foreign currency transactions are translated into the functional currency using the exchange rates prevailing at the dates of the transactions. Foreign exchange gains and losses resulting from the settlement of such transactions and from the translation of monetary assets and liabilities denominated in foreign currencies at reporting date exchange rates are recognised in the Statement of Comprehensive Income.
Non-monetary items that are measured in terms of historical cost in a foreign currency are translated using the exchange rate as at the date of the initial transaction. Non-monetary items measured at fair value in a foreign currency are translated using the exchange rates at the date when the fair value was determined.
Translation of Group Companies’ functional currency to presentation currency The Group translates the results, assets and liabilities of its foreign operations from their functional currencies to New Zealand dollars using the closing exchange rate at reporting date for assets and liabilities and the monthly exchange rates for income and expenses. The difference arising from the translation of the Balance Sheet at the closing rates and the Statement of Comprehensive Income at the monthly rates are recorded within the Foreign Currency Translation Reserve (‘FCTR’) in other comprehensive income.
Orion Health
2015 Annual Report
051
Notes to the Financial StatementsSection 11
(e) Segment reporting
Operating segments are reported in a manner consistent with the internal reporting provided to the Chief Operating Decision Maker (‘CODM’). The CODM, who is responsible for allocating resources and assessing performance of the operating segments, has been identified as the Executive Leadership Team (‘ELT’).
(f) Property, plant and equipment
All items of property, plant and equipment are stated at cost, including costs directly attributable to bringing the asset to its working condition as intended by Management, less accumulated depreciation and accumulated impairment losses.
Any subsequent expenditure that increases the economic benefits derived from an asset is capitalised. Expenditure on repairs and maintenance that does not increase the economic benefits of an asset is expensed in the period it is incurred.
When an item of property, plant and equipment is disposed of, the difference between net disposal proceeds and the carrying amount is recognised as a gain, or loss, in the Statement of Comprehensive Income.
Depreciation of property, plant and equipment is calculated to allocate the difference between the original cost of the assets and their residual values over their estimated useful lives on a straight line basis as follows:
Leasehold improvements term of lease Furniture and fittings 7 years Office equipment 3 – 7 years Computer equipment 3 years
Land and assets under construction are not depreciated.
The assets’ residual values, depreciation methods and useful lives are reviewed, and adjusted if appropriate, at each reporting date.
(g) Intangible assets
Software Software assets acquired separately are initially measured at cost; software assets acquired in a business combination are initially measured at fair value. Following initial recognition, software is carried at cost less any accumulated amortisation and any accumulated impairment losses.
The useful lives of software assets are assessed to be finite. Intangible assets with finite lives are amortised over the useful life and tested for impairment whenever there is an indication that the intangible asset may be impaired. An assessment of indicators of impairment is carried out at each reporting date. The amortisation period and the amortisation method for a software asset with a finite useful life are reviewed at least at each financial year-end. Changes in the expected useful life or the expected pattern of consumption of future economic benefits embodied in the asset are accounted for prospectively by changing the amortisation period or method, as appropriate, which is a change in accounting estimate. The amortisation expense on intangible assets with finite lives is recognised in the Statement of Comprehensive Income. Amortisation is calculated on a straight line basis across a useful life of three years.
Subsequent expenditure is capitalised only when it increases the future economic benefits embodied in the specific asset to which it relates. All other expenditure is recognised in the Statement of Comprehensive Income as incurred.
Research and development costs Research costs and costs associated with maintaining software products are expensed as incurred.
Costs that are directly associated with the development of new or substantially improved software products controlled by the Group are recognised as intangible assets only where the following criteria can all be met:
• it is technically feasible to complete the product so that it will be available for sale;
• management intends to complete the product and sell it;• there is an ability to sell the product;• it can be demonstrated how the product will generate future economic
benefits;• adequate technical, financial and other resources to complete the
development and to sell the product are available; and• the expenditure attributable to the product during its development can be
reliably measured.
At the time of development work being performed there is uncertainty as to meeting one or more of these criteria, particularly with respect to the technical feasibility, the ability to sell the software products or to generate future economic benefits. These uncertainties continue to exist until shortly before products are deployed and configured at customer sites. Development costs incurred have not met all of the above criteria and are therefore expensed as incurred.
Development expenditure directed towards incremental improvements in existing products does not qualify for recognition as an intangible asset. Development costs previously recognised as expenses are not recognised as assets in a subsequent period.
(h) Impairment of non-financial assets
At each reporting date, the Group assesses whether there is any indication that an asset may be impaired. Where an indicator of impairment exists, the Group makes a formal estimate of the recoverable amount. Where the carrying value of an asset exceeds its recoverable amount, the asset is considered impaired and is written down to its recoverable amount.
Recoverable amount is the greater of fair value less costs to sell or the asset’s value in use. For the purposes of assessing impairment, assets are grouped at the lowest levels for which there are separately identifiable cash flows (cash-generating units). Non-financial assets that have been written down are reviewed for possible reversal of the impairment at each reporting date.
Orion Health
2015 Annual Report
052
Notes to the Financial StatementsSection 1126 . 05 . 2015
(i) Revenue recognition
Revenue is recognised to the extent that it is probable that the economic benefits will flow to the Group and the revenue can be reliably measured. Revenue is measured at the fair value of the consideration received or receivable and is recorded net of sales taxes, value added taxes, discounts and after eliminating sales within the Group. When deferred payment terms have a significant impact on the calculation of the fair value of revenue, it is accounted for by discounting future payments. The following specific recognition criteria must also be met before revenue is recognised:
Licences Licence revenue is recognised only where a contractual arrangement is in place. Revenue from ‘off-the-shelf’ software (or non ‘off-the-shelf’ software sold without an implementation services contract) is recognised in the month of billing. For non ‘off-the-shelf’ software sold with an implementation services contract, the revenue is deferred and recognised in proportion to the percentage completed of the associated implementation services contract.
Support services Support and maintenance services are generally billed in advance for a fixed term. Revenue is deferred and recognised on a straight line basis over the term of the contract billing period, as services are provided.
Implementation services Time and materials contracts are generally billed monthly in the month in which the service is provided. Provided a legitimate arrangement is in place, the revenue is recognised in the month of billing, as services are provided.
Fixed price contracts are typically designed on milestone achievement. Normally invoicing is aligned to these milestones. Revenue recognition, however, is aligned to the percentage of work completed.
Where a loss is expected to occur it is recognised immediately and is made for both work in progress completed to date and to provide for future work required to complete the contract.
Managed services Managed service revenue is generally billed quarterly or annually in advance. Revenue is deferred and recognised on a straight line basis over the term of the contract billing period, as services are provided.
Government grants Government grants are recognised at their fair value where there is reasonable assurance that the grants will be received and all attached conditions will be complied with. When a grant relates to a specified expense item, it is recognised as income over the period necessary to match the grant on a systematic basis to the cost that it is intended to compensate. When the grant does not relate to a specified expense item, it is recognised as income on a straight-line basis over the term of the grant agreement.
Dividend income Dividend income from investments is recognised when the shareholder’s right to receive payment has been established.
Interest income Interest income is accrued on a time-proportion basis, by reference to the principal outstanding and at the effective interest rate applicable, which is the rate that exactly discounts estimated future cash receipts through the expected life of the financial asset to that asset’s net carrying amount.
When revenue and receivables are discounted to fair value to reflect deferred payment terms, future cash flows are discounted at the prevailing interest rate for a similar instrument. The discount is unwound and recognised as interest income over the deferral period.
Revenue in advance Revenue invoiced but not able to be recognised is recorded on the Balance Sheet as ‘Revenue in advance’.
Accrued revenue Revenue recognised but not able to be invoiced to customers under the contract is recorded on the Balance Sheet as ‘Accrued Revenue’.
(j) Cash flows
For the purpose of the Statement of Cash Flows, cash and cash equivalents are defined in note 2(o).
(k) Employee benefits
Short term benefits Accruals for wages, salaries, including non-monetary benefits, commissions and annual leave expected to be settled within 12 months of the reporting date are recognised in respect of employees’ services up to the reporting date. They are measured at their nominal values using the remuneration rate expected to apply at the time of settlement, on an undiscounted basis. Expenses for non-accumulating sick leave are recognised when the leave is taken and are measured at the rates paid or payable.
Long service leave The liability for long service leave is recognised and measured as the present value of expected future payments to be made in respect of services provided by employees up to the reporting date using an actuarial method. Consideration is given to expected future salary levels, experience of employee departures, and periods of service. Expected future payments are discounted using market yields at the reporting date on national government bonds with terms to maturity and currencies that match, as closely as possible, the estimated future cash outflows.
Pension obligations The Group has pension obligations in respect of various defined contribution plans. The Group pays contributions to publicly or privately administered pension insurance plans on a mandatory or contractual basis. The Group has no further payment obligations once the contributions have been paid. The contributions are recognised as an employee entitlement expense when they are due.
Short-term and long-term incentive plans The Group operates both short-term and long-term incentive plans. Short-term incentives are measured at the amounts expected to be paid when the liability is settled and are expensed as the related service is provided.
Orion Health
2015 Annual Report
053
Notes to the Financial StatementsSection 11
For long-term incentive plans, the Group operates a number of equity-settled, share-based compensation plans, under which the entity receives services from employees as consideration for equity instruments of the Group. The fair value of the employee services received in exchange for the grant of the instruments is recognised as an expense. The total amount to be expensed is determined by reference to the fair value of the awards granted.
At the end of each reporting period, the Group revises its estimates of the number of awards that are expected to vest based on the non-market vesting conditions and service conditions. It recognises the impact of the revision to original estimates, if any, in the Statement of Comprehensive Income, with a corresponding adjustment to equity.
In addition, in some circumstances employees may provide services in advance of the grant date and therefore the grant date fair value is estimated for the purposes of recognising the expense during the period between service commencement period and grant date.
(l) Income tax
Current tax assets and liabilities are measured at the amount expected to be recovered from or paid to the taxation authorities based on the period’s taxable income. The tax rates and tax laws used to compute the amount are those that are enacted or substantively enacted by the reporting date.
Deferred income tax is provided on all temporary differences at the reporting date between the tax bases of assets and liabilities and their carrying amounts for financial reporting purposes.
Deferred income tax liabilities are recognised for all taxable temporary differences except:
- when the deferred income tax liability arises from an asset or liability in a transaction that is not a business combination and that, at the time of the transaction, affects neither the accounting profit nor taxable profit or loss; or
- when the taxable temporary difference is associated with investments in subsidiaries or associates, and the timing of the reversal of the temporary difference can be controlled and it is probable that the temporary difference will not reverse in the foreseeable future.
Deferred income tax assets are recognised for all deductible temporary differences, carry-forward of unused tax credits and unused tax losses, to the extent that it is probable that taxable profit will be available against which the deductible temporary differences and the carry-forward of unused tax credits and unused tax losses can be utilised, except:
- when the deferred income tax asset relating to the deductible temporary difference arises from the initial recognition of goodwill, or an asset or liability in a transaction that is not a business combination and, at the time of the transaction affects neither the accounting profit nor taxable profit or loss; or
- when the deductible temporary difference is associated with investments in subsidiaries or associates, in which case a deferred tax asset is only recognised to the extent that it is probable that the temporary difference will reverse in the foreseeable future and taxable profit will be available against which the temporary difference can be utilised.
The carrying amount of deferred income tax assets is reviewed at each reporting date and reduced to the extent that it is no longer probable that sufficient taxable profit will be available to allow all or part of the deferred income tax asset to be utilised. Unrecognised deferred income tax assets are reassessed at each reporting date and are recognised to the extent that it has become probable that future taxable profit will allow the deferred tax asset to be recovered.
Deferred income tax assets and liabilities are measured at the tax rates that are expected to apply to the year when the asset is realised or the liability is settled, based on tax rates (and tax laws) that have been enacted or substantively enacted at the reporting date.
Deferred tax assets and deferred tax liabilities are offset only if a legally enforceable right exists to set off current tax assets against current tax liabilities and the deferred tax assets and liabilities relate to the same taxable entity and the same taxation authority.
(m) Other taxes
Revenues, expenses and assets are recognised net of sales tax (and other similar taxes), except;
- When the sales tax incurred on a purchase of goods and services is not recoverable from the taxation authority, in which case the sales tax is recognised as part of the cost of acquisition of the asset or as part of the expense item as applicable; and
- For receivables and payables, which are stated with the amount of sales tax included.
Cash flows are included in the Statement of Cash Flow and the sales tax component of cash flows arising from investing and financing activities, which is recoverable from, or payable to, the taxation authority is classified as part of operating cash flows.
Commitments and contingencies are disclosed net of sales tax.
(n) Financial assets
Classification The Group classifies its financial assets as loans and receivables. Management determines the classification of its financial assets at initial recognition. The Group’s loans and receivables are non-derivative financial assets with fixed or determinable payments that are not quoted in an active market. They are included in current assets, except for those with maturities greater than 12 months after the reporting date. These are classified as non-current assets.
The Group’s loans and receivables comprise trade receivables, related party receivables, cash and cash equivalents, term deposits and accrued revenue in the Balance Sheet. Loans and receivables are carried at amortised cost using the effective interest method.
Orion Health
2015 Annual Report
054
Notes to the Financial StatementsSection 1126 . 05 . 2015
Recognition and measurement The Group’s financial assets, classified as loans and receivables, are initially recognised at fair value plus transaction costs and are subsequently carried at amortised cost using the effective interest method.
Financial assets are derecognised when the rights to receive cash flows from the assets have expired or have been transferred and the Group has transferred substantially all risks and rewards of ownership.
At each reporting date the Group assesses whether there is objective evidence that a financial asset or a group of financial assets is impaired. Evidence of impairment may include indications that the debtors or a group of debtors is experiencing significant financial difficulty, default or delinquency in payments, the probability that they will enter bankruptcy or other financial reorganisation, and where observable data indicate that there is a measurable decrease in the estimated cash flows, such as changes in arrears or economic conditions that correlate with defaults. Impairment testing of receivables is described in note 2(p).
Fair value estimation The fair value of financial assets and financial liabilities must be estimated for recognition and measurement and for disclosure purposes.
The fair value of financial instruments that are not traded in an active market is determined using valuation techniques. The Group uses a variety of methods and assumptions that are based on market conditions existing at each balance date. Techniques, such as estimated discounted cash flows, are used to determine the fair value of financial instruments.
The carrying amount of cash and cash equivalents, term deposits, current accrued revenue balances, receivables, payables and accruals approximate fair value due to the short-term maturity of these instruments. The fair value of financial liabilities and financial assets for disclosure purposes is estimated by discounting the future contractual cash flows at the current market rate that is available to the Group for similar financial instruments.
(o) Cash and cash equivalents
Cash and cash equivalents comprise cash balances, bank balances, call deposits and term deposits with maturities at inception of three months or less. The carrying value of cash and cash equivalents approximates the fair value of the asset.
For the purpose of the Statement of Cash Flows, bank overdrafts that are repayable on demand, call deposits and term deposits with original maturities of three months or less are all considered to form an integral part of the Group’s cash management and are therefore included as a component of cash and cash equivalents. Term deposits with original maturities of greater than three months are classified as Investing Activities.
(p) Trade and other receivables
Trade and other receivables are recognised initially at fair value and subsequently measured at amortised cost, less provision for impairment.
Collectability of trade receivables is reviewed on an on-going basis. A provision for impairment is established when there is objective evidence that the Group will not be able to collect all amounts due according to the original terms of the receivables. The amount of the provision is the difference between the asset’s carrying amount and the present value of estimated future cash flows, discounted at the asset’s original effective interest rate. The carrying amount is a reasonable approximation of fair value. When a receivable is uncollectible it is written off against the
provision. The amount of the provision is recognised in the Statement of Comprehensive Income. Subsequent recoveries of amounts previously written off are credited against the Statement of Comprehensive Income.
Trade and other receivables are included in current assets, except for those with maturities greater than 12 months after the reporting date, which are classified as non-current assets.
(q) Trade and other payables
Trade and other payables are recognised initially at fair value and subsequently measured at amortised cost using the effective interest method. They represent liabilities for goods and services provided to the Group prior to the end of the reporting period that remain unpaid. The amounts are unsecured, non-interest bearing and are classified in current liabilities if payment is due within one year or less.
(r) Provisions
The Group recognises provisions when it has a present, legal or constructive obligation as a result of past events, it is probable that an outflow of resources will be required to settle the obligation, and the amount has been reliably estimated.
Provisions are measured at the present value of the expenditures expected to be required to settle the obligation using a pre-tax rate that reflects current market assessments of the time value of money and the risks specific to the obligation.
(s) Bank overdraft
Bank overdrafts are interest-bearing liabilities and are designated as non-derivative financial instruments. They are recognised initially at fair value plus any directly attributable transaction costs, which for the purposes of these financial statements represents initial cost. Subsequent to initial recognition, interest-bearing liabilities are measured at amortised cost using the effective interest rate method. They are classified as current liabilities unless the Group has an unconditional right to defer settlement of the liability for at least one year after the balance date.
Borrowing costs are expensed as incurred.
(t) Leased assets
Operating leases Leases in which a significant portion of risk and rewards of ownership are retained by the lessor are classified as operating leases. Payments made under operating leases are recognised as an expense in the Statement of Comprehensive Income on a straight-line basis over the lease term. Any lease incentives are recognised as a liability. The aggregate benefit of incentives is recognised as a reduction of rental expense on a straight-line basis, except where another systematic basis is more representative of the time pattern in which economic benefits from the leased asset are consumed.
Orion Health
2015 Annual Report
055
Notes to the Financial StatementsSection 11
(u) Share capital
Ordinary shares are classified as equity. Incremental costs directly attributable to the issue of new shares are shown in equity as a deduction, net of tax, from the proceeds. Where any Group company purchases shares in Orion Health Group Limited (treasury shares), the consideration paid is deducted from equity attributable to the Group’s equity holders until the shares are cancelled or transferred outside the Group.
3. CRITICAL JUDGEMENTS AND ESTIMATES IN APPLYING THE ACCOUNTING POLICIES
The preparation of the financial statements requires Management to make judgements, estimates and assumptions that affect the reported amounts in the financial statements. Management continually evaluates its judgements and estimates in relation to assets, liabilities, contingent liabilities, revenue and expenses. Management bases its judgements and estimates on historical experience and on various other factors it believes to be reasonable under the circumstances, the result of which form the basis of the carrying values for assets and liabilities that are not readily apparent from other sources. Actual results may differ from these estimates under different assumptions and conditions.
Management has identified the following critical balances and transactions for which significant judgements, estimates and assumptions are made. Actual results may differ from these estimates under different assumptions and conditions and may materially affect financial results or the financial position reported in future periods.
Further details of the nature of these assumptions and conditions may be found in the relevant notes to the financial statements.
Revenue recognition As part of deriving operating revenue, revenue in advance and accrued revenue on projects, the percentage completion of implementation services contracts must be estimated by the persons managing the project. This process uses estimations of time required to complete the project and is based on detailed information on hours worked to date, prior experience and project scheduling tools. The Group employs experienced Project Managers who are required to provide regular information to Management on the progress of projects. All estimates are reviewed by Management as part of project review meetings held monthly.
Taxation and deferred tax The Group’s accounting policy for taxation requires Management’s judgement in assessing whether certain deferred tax assets and deferred tax liabilities are recognised on the Balance Sheet.
Deferred tax assets, including those arising from carried forward tax losses, capital losses and temporary differences, are recognised only where it is considered more likely than not that they will be recovered, which is dependent on the generation of sufficient future taxable profits. Assumptions about the generation of future taxable profits depend on Management’s estimates of future performance. These depend on estimates of future sales volumes, operating costs, capital expenditure, dividends and other capital management transactions. Judgement is required to assess, not only whether sufficient future taxable profits will be available against which deferred tax assets can be recovered, but the certainty of timing of recovery and the impact of ownership continuity across that period.
In prior years, the Group has recognised the benefit of tax losses by way of a Deferred Tax Asset. There is inherent uncertainty as to the timing of utilisation of such losses because the Group’s business model continues to evolve and, accordingly, Management have determined that it is appropriate to adopt a more conservative approach and not recognise tax losses as a Deferred Tax Asset at this time. The result is a reduction in Deferred Tax Assets of $5,729,000 by way of a charge to the Statement of Comprehensive Income. The change in assessment has been accounted for as a change in accounting estimate in the current year in accordance with NZ IAS 8 ‘Accounting Policies, Changes in Accounting Estimates and Errors’ and therefore the comparative period has not been restated.
Deferred tax liabilities arising from temporary differences in investments, caused principally by retained earnings held in foreign tax jurisdictions, are recognised unless repatriation of retained earnings can be controlled and is not expected to occur in the foreseeable future.
Judgements are also required about the application of income tax legislation. These judgements and assumptions are subject to risk and uncertainty, hence there is a possibility that changes in circumstances will alter expectations, which may impact the amount of deferred tax assets and deferred tax liabilities recognised on the Balance Sheet and the amount of other tax losses and temporary differences not yet recognised. In such circumstances, some or all of the carrying amounts of recognised deferred tax assets and liabilities may require adjustment, resulting in a corresponding credit or charge to the Statement of Comprehensive Income.
4. SEGMENT INFORMATION
The Group has nine reportable segments, eight of which are the regions of the Group’s business operations in the sale, support and implementation of software in the Healthcare IT market and one is for Corporate and Development. For each reportable segment the ‘ELT’ (Executive Leadership Team, our Chief Operating Decision Maker) reviews internal management reports on at least a monthly basis.
Information regarding the results of each reportable segment, which reconciles to the financial statements and notes to the financial statements, is included below. Performance is measured based on segment operating result, as included in the internal management reports that are reviewed by the ELT. The segment operating result is used to measure performance as management believes that such information is the most relevant in evaluating reportable segment results relative to other entities that also operate within these reportable segments. The assets and liabilities of the Group are reported to and reviewed by the ELT in total and are not allocated by operating segment. Therefore, operating segment assets and liabilities are not disclosed.
Segment revenue is based on customer location, with revenue from the Group’s country of domicile comprising the ‘NZ’ and ‘Corp/Dev’ segments. No single customer accounted for more than 10% of the Group’s third party operating revenue.
The vast majority of the inter-segment transactions are to meet international transfer pricing obligations.
The total segment operating result reported below equates to the Group’s operating result. Consequently the reconciliation of the segment result to the Group’s result before income tax is shown in the Statement of Comprehensive Income.
Orion Health
2015 Annual Report
056
Notes to the Financial StatementsSection 1126 . 05 . 2015
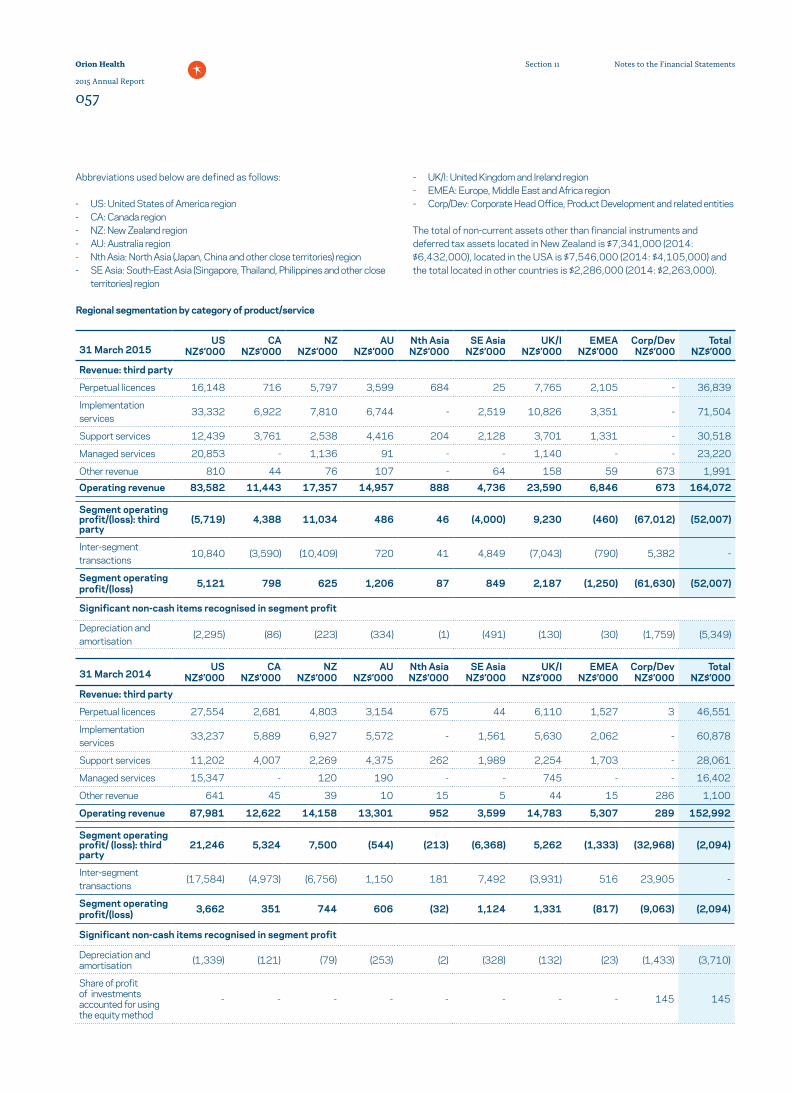
Abbreviations used below are defined as follows:
- US: United States of America region- CA: Canada region- NZ: New Zealand region- AU: Australia region- Nth Asia: North Asia (Japan, China and other close territories) region- SE Asia: South-East Asia (Singapore, Thailand, Philippines and other close
territories) region
- UK/I: United Kingdom and Ireland region- EMEA: Europe, Middle East and Africa region- Corp/Dev: Corporate Head Office, Product Development and related entities
The total of non-current assets other than financial instruments and deferred tax assets located in New Zealand is $7,341,000 (2014: $6,432,000), located in the USA is $7,546,000 (2014: $4,105,000) and the total located in other countries is $2,286,000 (2014: $2,263,000).
Regional segmentation by category of product/service
31 March 2015US
NZ$’000CA
NZ$’000NZ
NZ$’000AU
NZ$’000Nth Asia NZ$’000
SE Asia NZ$’000
UK/I NZ$’000
EMEA NZ$’000
Corp/Dev NZ$’000
Total NZ$’000
Revenue: third party
Perpetual licences 16,148 716 5,797 3,599 684 25 7,765 2,105 - 36,839
Implementation services 33,332 6,922 7,810 6,744 - 2,519 10,826 3,351 - 71,504
Support services 12,439 3,761 2,538 4,416 204 2,128 3,701 1,331 - 30,518
Managed services 20,853 - 1,136 91 - - 1,140 - - 23,220
Other revenue 810 44 76 107 - 64 158 59 673 1,991Operating revenue 83,582 11,443 17,357 14,957 888 4,736 23,590 6,846 673 164,072
Segment operating profit/(loss): third party
(5,719) 4,388 11,034 486 46 (4,000) 9,230 (460) (67,012) (52,007)
Inter-segment transactions 10,840 (3,590) (10,409) 720 41 4,849 (7,043) (790) 5,382 -
Segment operating profit/(loss) 5,121 798 625 1,206 87 849 2,187 (1,250) (61,630) (52,007)
Significant non-cash items recognised in segment profit
Depreciation and amortisation (2,295) (86) (223) (334) (1) (491) (130) (30) (1,759) (5,349)
31 March 2014US
NZ$’000CA
NZ$’000NZ
NZ$’000AU
NZ$’000Nth Asia NZ$’000
SE Asia NZ$’000
UK/I NZ$’000
EMEA NZ$’000
Corp/Dev NZ$’000
Total NZ$’000
Revenue: third party
Perpetual licences 27,554 2,681 4,803 3,154 675 44 6,110 1,527 3 46,551
Implementation services 33,237 5,889 6,927 5,572 - 1,561 5,630 2,062 - 60,878
Support services 11,202 4,007 2,269 4,375 262 1,989 2,254 1,703 - 28,061
Managed services 15,347 - 120 190 - - 745 - - 16,402
Other revenue 641 45 39 10 15 5 44 15 286 1,100
Operating revenue 87,981 12,622 14,158 13,301 952 3,599 14,783 5,307 289 152,992
Segment operating profit/ (loss): third party
21,246 5,324 7,500 (544) (213) (6,368) 5,262 (1,333) (32,968) (2,094)
Inter-segment transactions (17,584) (4,973) (6,756) 1,150 181 7,492 (3,931) 516 23,905 -
Segment operating profit/(loss) 3,662 351 744 606 (32) 1,124 1,331 (817) (9,063) (2,094)
Significant non-cash items recognised in segment profit
Depreciation and amortisation (1,339) (121) (79) (253) (2) (328) (132) (23) (1,433) (3,710)
Share of profit of investments accounted for using the equity method
- - - - - - - - 145 145
Orion Health
2015 Annual Report
057
Notes to the Financial StatementsSection 11
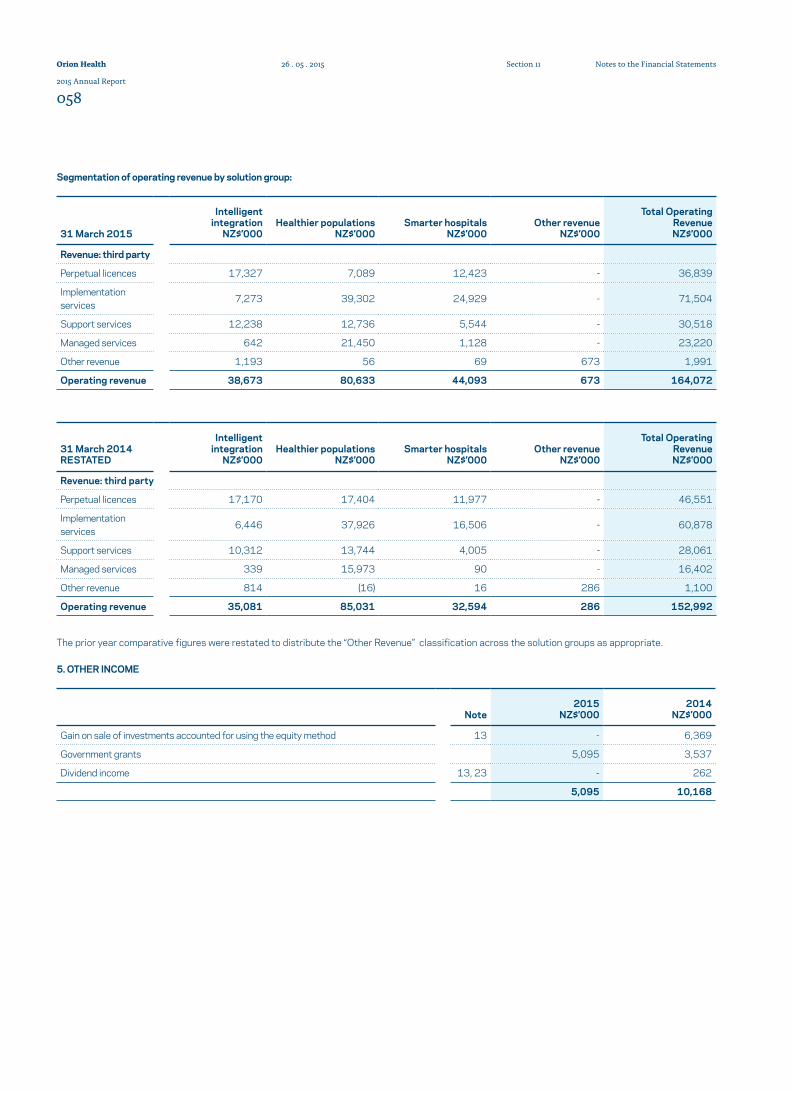
31 March 2015
Intelligent integration
NZ$’000Healthier populations
NZ$’000Smarter hospitals
NZ$’000Other revenue
NZ$’000
Total Operating Revenue NZ$’000
Revenue: third party
Perpetual licences 17,327 7,089 12,423 - 36,839
Implementation services 7,273 39,302 24,929 - 71,504
Support services 12,238 12,736 5,544 - 30,518
Managed services 642 21,450 1,128 - 23,220
Other revenue 1,193 56 69 673 1,991
Operating revenue 38,673 80,633 44,093 673 164,072
31 March 2014 RESTATED
Intelligent integration
NZ$’000Healthier populations
NZ$’000Smarter hospitals
NZ$’000Other revenue
NZ$’000
Total Operating Revenue NZ$’000
Revenue: third party
Perpetual licences 17,170 17,404 11,977 - 46,551
Implementation services 6,446 37,926 16,506 - 60,878
Support services 10,312 13,744 4,005 - 28,061
Managed services 339 15,973 90 - 16,402
Other revenue 814 (16) 16 286 1,100
Operating revenue 35,081 85,031 32,594 286 152,992
Segmentation of operating revenue by solution group:
Note2015
NZ$’0002014
NZ$’000
Gain on sale of investments accounted for using the equity method 13 - 6,369
Government grants 5,095 3,537
Dividend income 13, 23 - 262
5,095 10,168
The prior year comparative figures were restated to distribute the “Other Revenue” classification across the solution groups as appropriate.
5. OTHER INCOME
Orion Health
2015 Annual Report
058
Notes to the Financial StatementsSection 1126 . 05 . 2015
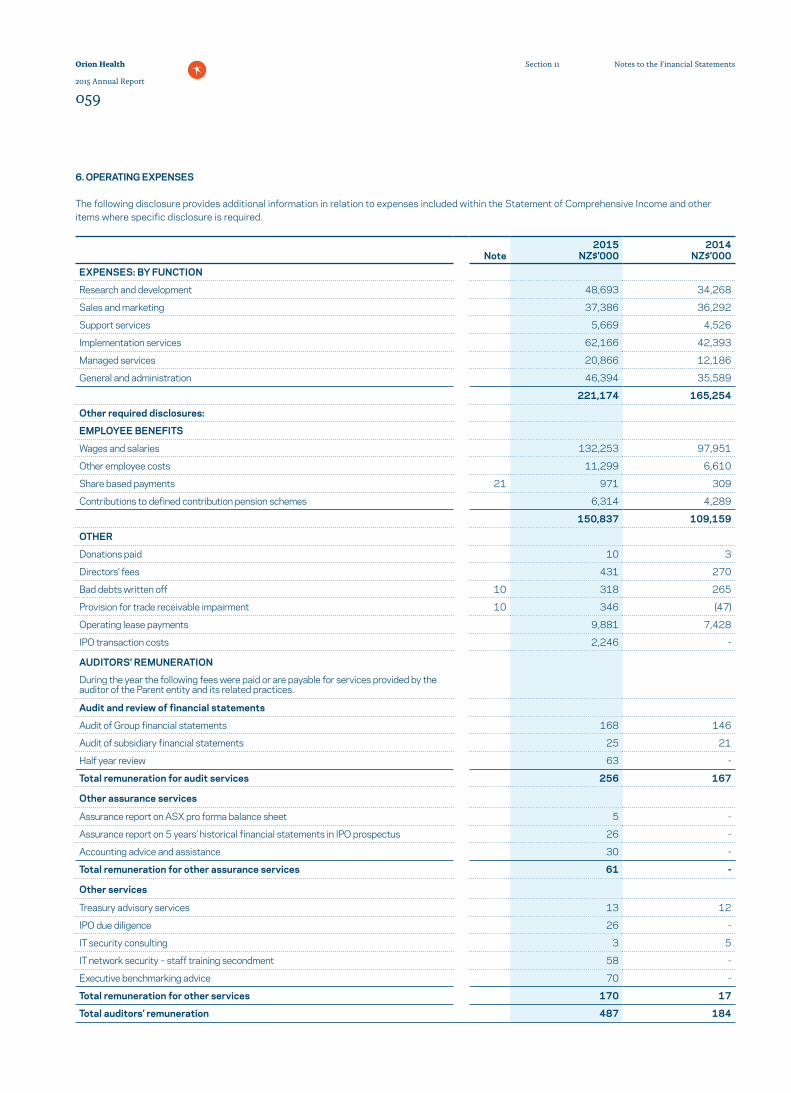
6. OPERATING EXPENSES
The following disclosure provides additional information in relation to expenses included within the Statement of Comprehensive Income and other items where specific disclosure is required.
Note2015
NZ$’0002014
NZ$’000EXPENSES: BY FUNCTION
Research and development 48,693 34,268
Sales and marketing 37,386 36,292
Support services 5,669 4,526
Implementation services 62,166 42,393
Managed services 20,866 12,186
General and administration 46,394 35,589
221,174 165,254
Other required disclosures:
EMPLOYEE BENEFITS
Wages and salaries 132,253 97,951
Other employee costs 11,299 6,610
Share based payments 21 971 309
Contributions to defined contribution pension schemes 6,314 4,289
150,837 109,159
OTHER
Donations paid 10 3
Directors’ fees 431 270
Bad debts written off 10 318 265
Provision for trade receivable impairment 10 346 (47)
Operating lease payments 9,881 7,428
IPO transaction costs 2,246 -
AUDITORS’ REMUNERATION
During the year the following fees were paid or are payable for services provided by the auditor of the Parent entity and its related practices.
Audit and review of financial statements
Audit of Group financial statements 168 146
Audit of subsidiary financial statements 25 21
Half year review 63 -
Total remuneration for audit services 256 167
Other assurance services
Assurance report on ASX pro forma balance sheet 5 -
Assurance report on 5 years’ historical financial statements in IPO prospectus 26 -
Accounting advice and assistance 30 -
Total remuneration for other assurance services 61 -
Other services
Treasury advisory services 13 12
IPO due diligence 26 -
IT security consulting 3 5
IT network security – staff training secondment 58 -
Executive benchmarking advice 70 -
Total remuneration for other services 170 17
Total auditors’ remuneration 487 184
Orion Health
2015 Annual Report
059
Notes to the Financial StatementsSection 11
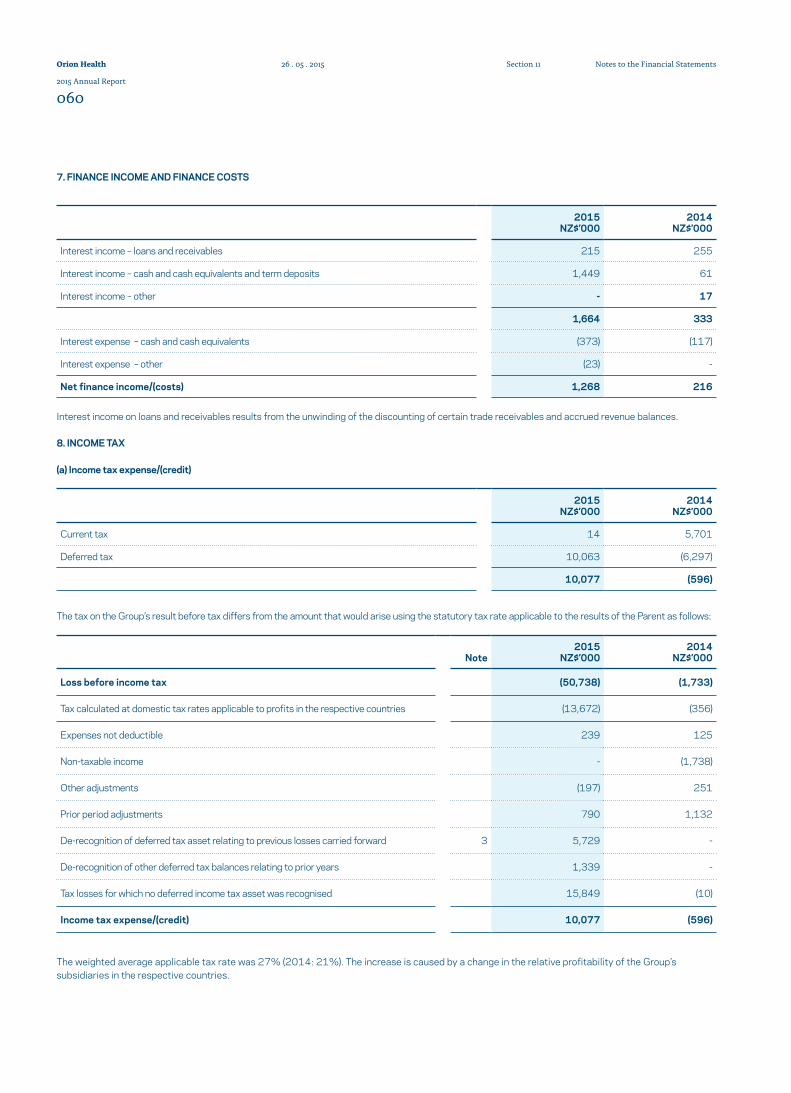
7. FINANCE INCOME AND FINANCE COSTS
Interest income on loans and receivables results from the unwinding of the discounting of certain trade receivables and accrued revenue balances.
8. INCOME TAX
(a) Income tax expense/(credit)
2015 NZ$’000
2014 NZ$’000
Interest income – loans and receivables 215 255
Interest income – cash and cash equivalents and term deposits 1,449 61
Interest income – other - 17
1,664 333
Interest expense – cash and cash equivalents (373) (117)
Interest expense – other (23) -
Net finance income/(costs) 1,268 216
2015 NZ$’000
2014 NZ$’000
Current tax 14 5,701
Deferred tax 10,063 (6,297)
10,077 (596)
The tax on the Group’s result before tax differs from the amount that would arise using the statutory tax rate applicable to the results of the Parent as follows:
Note2015
NZ$’0002014
NZ$’000
Loss before income tax (50,738) (1,733)
Tax calculated at domestic tax rates applicable to profits in the respective countries (13,672) (356)
Expenses not deductible 239 125
Non-taxable income - (1,738)
Other adjustments (197) 251
Prior period adjustments 790 1,132
De-recognition of deferred tax asset relating to previous losses carried forward 3 5,729 -
De-recognition of other deferred tax balances relating to prior years 1,339 -
Tax losses for which no deferred income tax asset was recognised 15,849 (10)
Income tax expense/(credit) 10,077 (596)
The weighted average applicable tax rate was 27% (2014: 21%). The increase is caused by a change in the relative profitability of the Group’s subsidiaries in the respective countries.
Orion Health
2015 Annual Report
060
Notes to the Financial StatementsSection 1126 . 05 . 2015
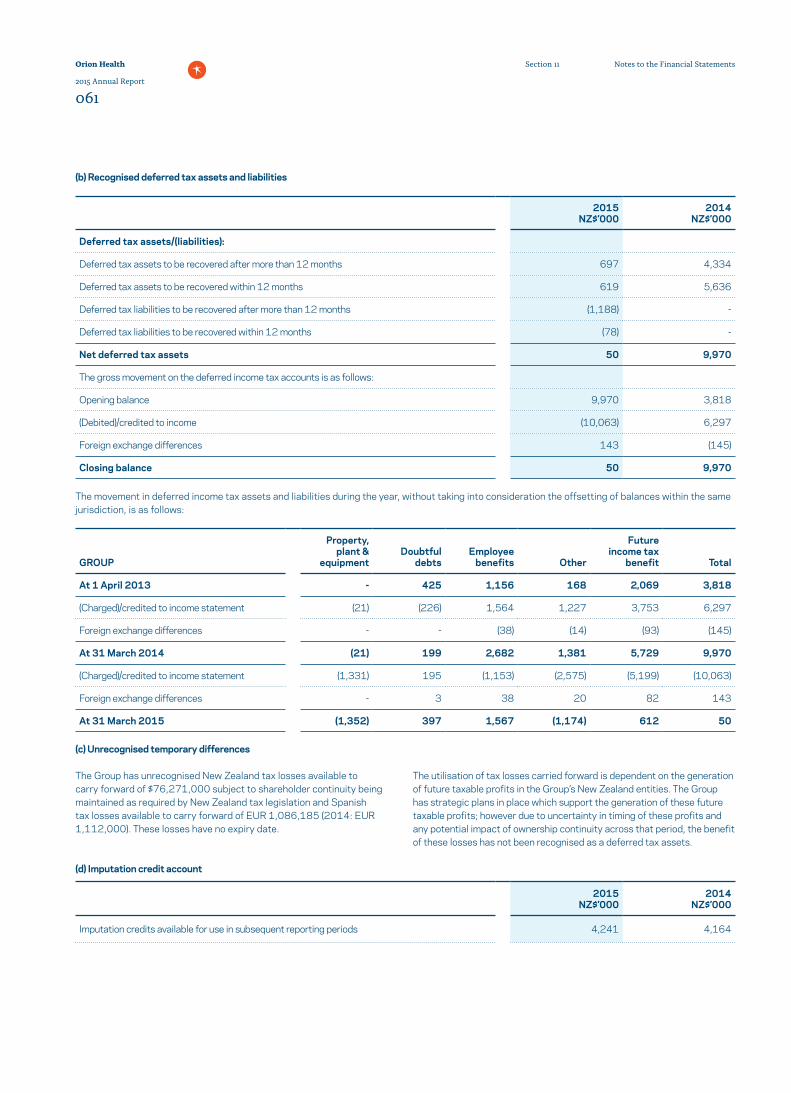
2015 NZ$’000
2014 NZ$’000
Deferred tax assets/(liabilities):
Deferred tax assets to be recovered after more than 12 months 697 4,334
Deferred tax assets to be recovered within 12 months 619 5,636
Deferred tax liabilities to be recovered after more than 12 months (1,188) -
Deferred tax liabilities to be recovered within 12 months (78) -
Net deferred tax assets 50 9,970
The gross movement on the deferred income tax accounts is as follows:
Opening balance 9,970 3,818
(Debited)/credited to income (10,063) 6,297
Foreign exchange differences 143 (145)
Closing balance 50 9,970
The movement in deferred income tax assets and liabilities during the year, without taking into consideration the offsetting of balances within the same jurisdiction, is as follows:
(c) Unrecognised temporary differences
The Group has unrecognised New Zealand tax losses available to carry forward of $76,271,000 subject to shareholder continuity being maintained as required by New Zealand tax legislation and Spanish tax losses available to carry forward of EUR 1,086,185 (2014: EUR 1,112,000). These losses have no expiry date.
The utilisation of tax losses carried forward is dependent on the generation of future taxable profits in the Group’s New Zealand entities. The Group has strategic plans in place which support the generation of these future taxable profits; however due to uncertainty in timing of these profits and any potential impact of ownership continuity across that period, the benefit of these losses has not been recognised as a deferred tax assets.
(d) Imputation credit account
GROUP
Property, plant &
equipmentDoubtful
debtsEmployee
benefits Other
Future income tax
benefit Total
At 1 April 2013 - 425 1,156 168 2,069 3,818
(Charged)/credited to income statement (21) (226) 1,564 1,227 3,753 6,297
Foreign exchange differences - - (38) (14) (93) (145)
At 31 March 2014 (21) 199 2,682 1,381 5,729 9,970
(Charged)/credited to income statement (1,331) 195 (1,153) (2,575) (5,199) (10,063)
Foreign exchange differences - 3 38 20 82 143
At 31 March 2015 (1,352) 397 1,567 (1,174) 612 50
2015 NZ$’000
2014 NZ$’000
Imputation credits available for use in subsequent reporting periods 4,241 4,164
(b) Recognised deferred tax assets and liabilities
Orion Health
2015 Annual Report
061
Notes to the Financial StatementsSection 11

The carrying amounts of the Group’s cash, deposits at call and overdraft facilities approximate their fair value.
10. TRADE AND OTHER RECEIVABLES
2015 NZ$’000
2014 NZ$’000
Trade receivables 55,935 50,692
Less allowance for impairment (1,119) (710)
Net trade receivables 54,816 49,982
Sundry receivables - 574
Prepayments 3,239 2,125
Government Grants receivable 625 100
Trade and other receivables 58,680 52,781
2015 NZ$’000
2014 NZ$’000
1-60 days 13,007 16,420
61-90 days 1,496 667
91-180 days 3,909 2,650
Over 180 days 3,183 1,152
21,595 20,889
Trade receivables are non-interest bearing and are generally on 30-60 day terms. For these receivables, due to the short term nature, their carrying value is assumed to approximate their fair value. The maximum exposure to credit risk is the carrying value of receivables. Collateral is not held as security.
As of 31 March 2015, trade receivables of $33,221,000 (2014: $29,093,000) were fully performing. None of the financial assets that are fully performing have been re-negotiated.
As of 31 March 2015, trade receivables of $21,595,000 (2014: $20,889,000) were past due but not impaired. These relate to a number of independent customers for whom there is no recent history of default.
The aging analysis of trade receivables past due but not impaired is as follows:
Cash, cash equivalents and bank overdrafts include the following for the purposes of the Statement of Cash Flows:
2015 NZ$’000
2014 NZ$’000
Cash at bank and on hand 18,913 12,655
Deposits at call 12,031 -
Bank overdraft - (13,583)
Cash and cash equivalents 30,944 (928)
9. CASH AND CASH EQUIVALENTS AND TERM DEPOSITS
2015 NZ$’000
2014 NZ$’000
Cash at bank and on hand 18,913 12,655
Deposits at call 12,031 -
Cash and cash equivalents 30,944 12,655
Term deposits 64,200 -
Total funds available and on deposit 95,144 12,655
Orion Health
2015 Annual Report
062
Notes to the Financial StatementsSection 1126 . 05 . 2015
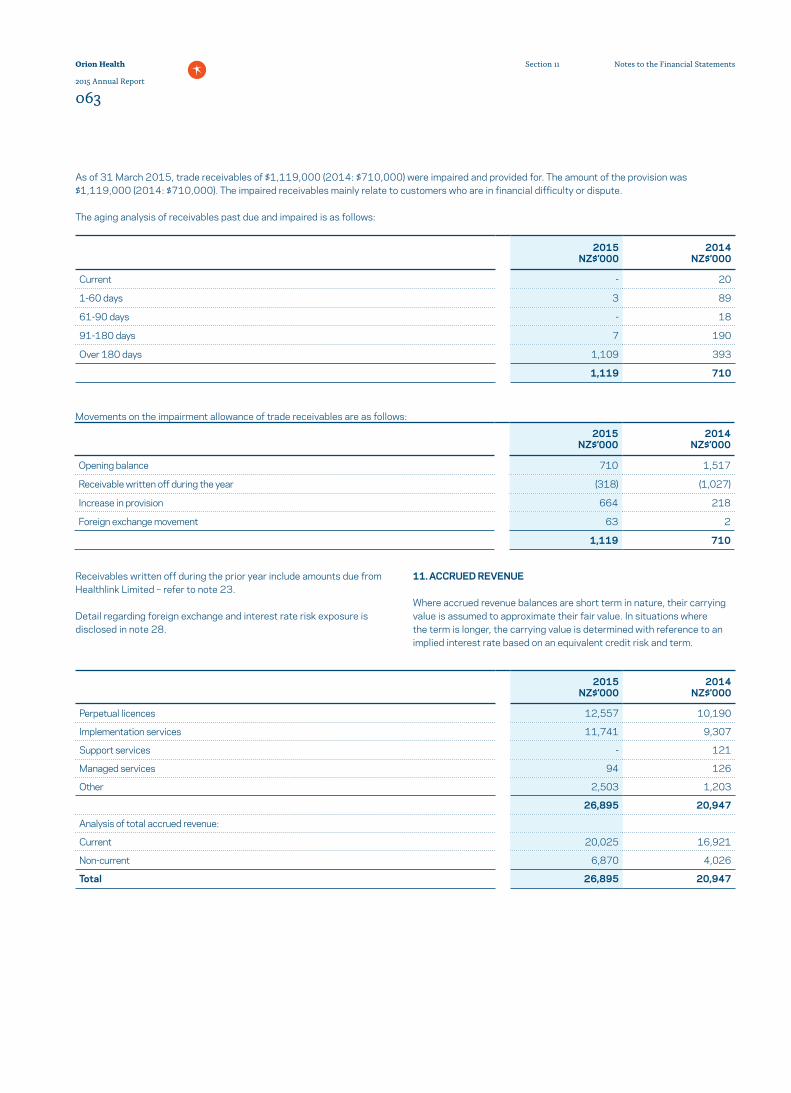
2015 NZ$’000
2014 NZ$’000
Perpetual licences 12,557 10,190
Implementation services 11,741 9,307
Support services - 121
Managed services 94 126
Other 2,503 1,203
26,895 20,947
Analysis of total accrued revenue:
Current 20,025 16,921
Non-current 6,870 4,026
Total 26,895 20,947
2015 NZ$’000
2014 NZ$’000
Opening balance 710 1,517
Receivable written off during the year (318) (1,027)
Increase in provision 664 218
Foreign exchange movement 63 2
1,119 710
2015 NZ$’000
2014 NZ$’000
Current - 20
1-60 days 3 89
61-90 days - 18
91-180 days 7 190
Over 180 days 1,109 393
1,119 710
As of 31 March 2015, trade receivables of $1,119,000 (2014: $710,000) were impaired and provided for. The amount of the provision was $1,119,000 (2014: $710,000). The impaired receivables mainly relate to customers who are in financial difficulty or dispute.
The aging analysis of receivables past due and impaired is as follows:
Movements on the impairment allowance of trade receivables are as follows:
Receivables written off during the prior year include amounts due from Healthlink Limited – refer to note 23.
Detail regarding foreign exchange and interest rate risk exposure is disclosed in note 28.
11. ACCRUED REVENUE
Where accrued revenue balances are short term in nature, their carrying value is assumed to approximate their fair value. In situations where the term is longer, the carrying value is determined with reference to an implied interest rate based on an equivalent credit risk and term.
Orion Health
2015 Annual Report
063
Notes to the Financial StatementsSection 11
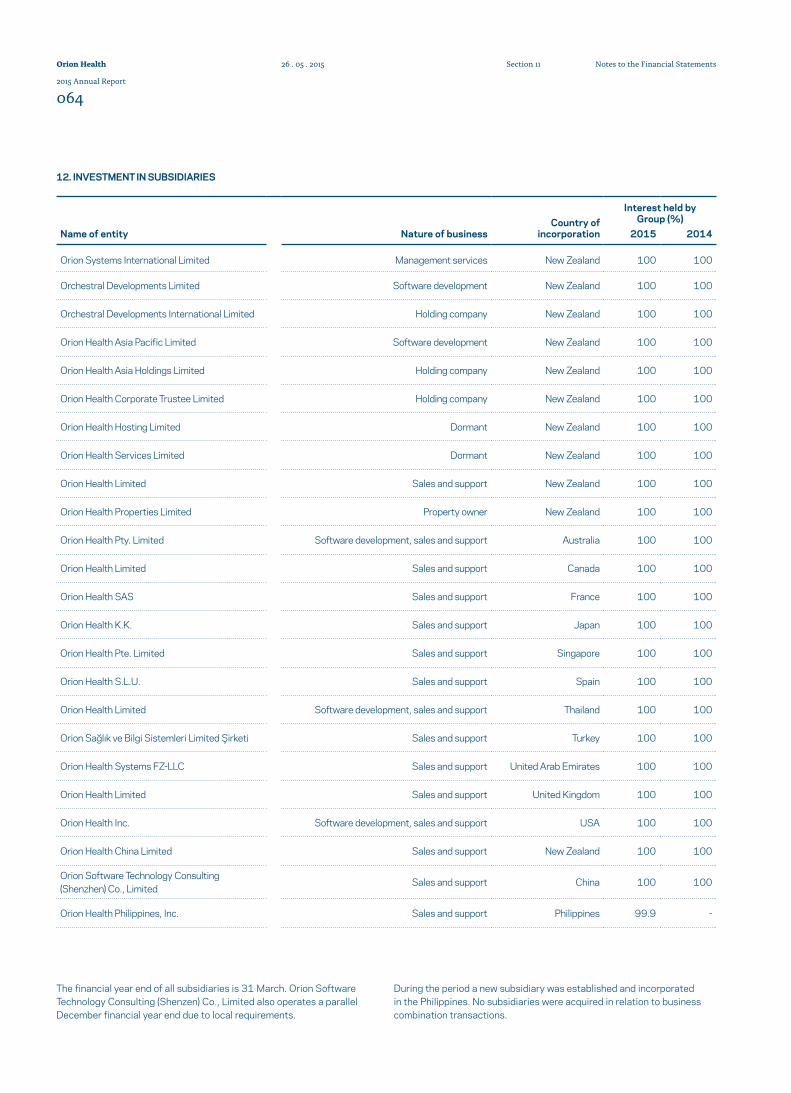
Name of entity Nature of businessCountry of
incorporation
Interest held by Group (%)
2015 2014
Orion Systems International Limited Management services New Zealand 100 100
Orchestral Developments Limited Software development New Zealand 100 100
Orchestral Developments International Limited Holding company New Zealand 100 100
Orion Health Asia Pacific Limited Software development New Zealand 100 100
Orion Health Asia Holdings Limited Holding company New Zealand 100 100
Orion Health Corporate Trustee Limited Holding company New Zealand 100 100
Orion Health Hosting Limited Dormant New Zealand 100 100
Orion Health Services Limited Dormant New Zealand 100 100
Orion Health Limited Sales and support New Zealand 100 100
Orion Health Properties Limited Property owner New Zealand 100 100
Orion Health Pty. Limited Software development, sales and support Australia 100 100
Orion Health Limited Sales and support Canada 100 100
Orion Health SAS Sales and support France 100 100
Orion Health K.K. Sales and support Japan 100 100
Orion Health Pte. Limited Sales and support Singapore 100 100
Orion Health S.L.U. Sales and support Spain 100 100
Orion Health Limited Software development, sales and support Thailand 100 100
Orion Sağlık ve Bilgi Sistemleri Limited Şirketi Sales and support Turkey 100 100
Orion Health Systems FZ-LLC Sales and support United Arab Emirates 100 100
Orion Health Limited Sales and support United Kingdom 100 100
Orion Health Inc. Software development, sales and support USA 100 100
Orion Health China Limited Sales and support New Zealand 100 100
Orion Software Technology Consulting (Shenzhen) Co., Limited Sales and support China 100 100
Orion Health Philippines, Inc. Sales and support Philippines 99.9 -
12. INVESTMENT IN SUBSIDIARIES
The financial year end of all subsidiaries is 31 March. Orion Software Technology Consulting (Shenzen) Co., Limited also operates a parallel December financial year end due to local requirements.
During the period a new subsidiary was established and incorporated in the Philippines. No subsidiaries were acquired in relation to business combination transactions.
Orion Health
2015 Annual Report
064
Notes to the Financial StatementsSection 1126 . 05 . 2015
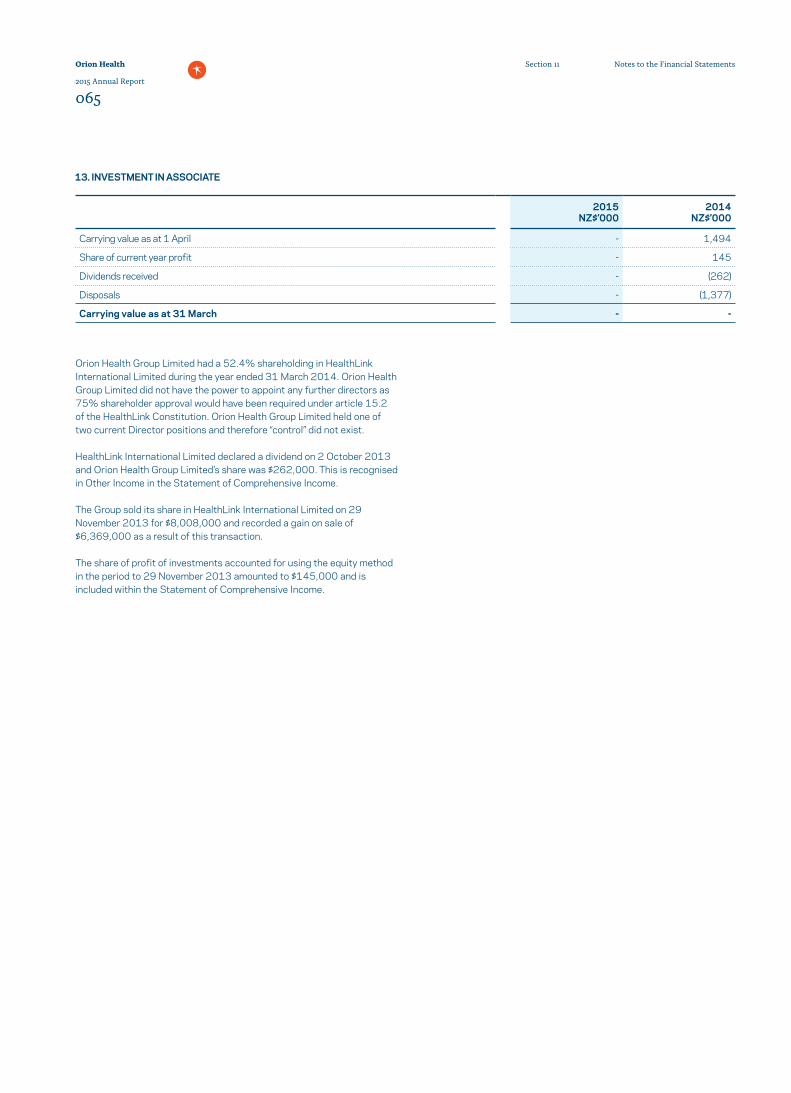
2015 NZ$’000
2014 NZ$’000
Carrying value as at 1 April - 1,494
Share of current year profit - 145
Dividends received - (262)
Disposals - (1,377)
Carrying value as at 31 March - -
Orion Health Group Limited had a 52.4% shareholding in HealthLink International Limited during the year ended 31 March 2014. Orion Health Group Limited did not have the power to appoint any further directors as 75% shareholder approval would have been required under article 15.2 of the HealthLink Constitution. Orion Health Group Limited held one of two current Director positions and therefore “control” did not exist.
HealthLink International Limited declared a dividend on 2 October 2013 and Orion Health Group Limited’s share was $262,000. This is recognised in Other Income in the Statement of Comprehensive Income.
The Group sold its share in HealthLink International Limited on 29 November 2013 for $8,008,000 and recorded a gain on sale of $6,369,000 as a result of this transaction.
The share of profit of investments accounted for using the equity method in the period to 29 November 2013 amounted to $145,000 and is included within the Statement of Comprehensive Income.
13. INVESTMENT IN ASSOCIATE
Orion Health
2015 Annual Report
065
Notes to the Financial StatementsSection 11
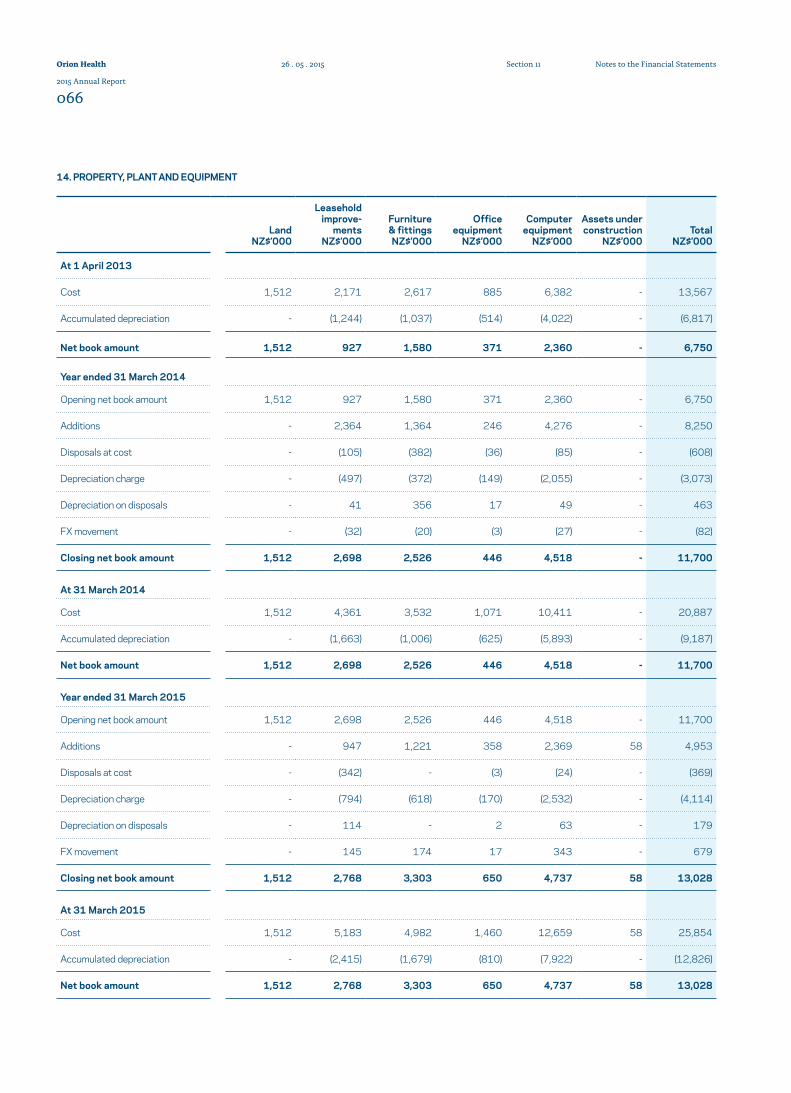
14. PROPERTY, PLANT AND EQUIPMENT
Land NZ$’000
Leasehold improve-
ments NZ$’000
Furniture & fittings NZ$’000
Office equipment
NZ$’000
Computer equipment
NZ$’000
Assets under construction
NZ$’000Total
NZ$’000
At 1 April 2013
Cost 1,512 2,171 2,617 885 6,382 - 13,567
Accumulated depreciation - (1,244) (1,037) (514) (4,022) - (6,817)
Net book amount 1,512 927 1,580 371 2,360 - 6,750
Year ended 31 March 2014
Opening net book amount 1,512 927 1,580 371 2,360 - 6,750
Additions - 2,364 1,364 246 4,276 - 8,250
Disposals at cost - (105) (382) (36) (85) - (608)
Depreciation charge - (497) (372) (149) (2,055) - (3,073)
Depreciation on disposals - 41 356 17 49 - 463
FX movement - (32) (20) (3) (27) - (82)
Closing net book amount 1,512 2,698 2,526 446 4,518 - 11,700
At 31 March 2014
Cost 1,512 4,361 3,532 1,071 10,411 - 20,887
Accumulated depreciation - (1,663) (1,006) (625) (5,893) - (9,187)
Net book amount 1,512 2,698 2,526 446 4,518 - 11,700
Year ended 31 March 2015
Opening net book amount 1,512 2,698 2,526 446 4,518 - 11,700
Additions - 947 1,221 358 2,369 58 4,953
Disposals at cost - (342) - (3) (24) - (369)
Depreciation charge - (794) (618) (170) (2,532) - (4,114)
Depreciation on disposals - 114 - 2 63 - 179
FX movement - 145 174 17 343 - 679
Closing net book amount 1,512 2,768 3,303 650 4,737 58 13,028
At 31 March 2015
Cost 1,512 5,183 4,982 1,460 12,659 58 25,854
Accumulated depreciation - (2,415) (1,679) (810) (7,922) - (12,826)
Net book amount 1,512 2,768 3,303 650 4,737 58 13,028
Orion Health
2015 Annual Report
066
Notes to the Financial StatementsSection 1126 . 05 . 2015
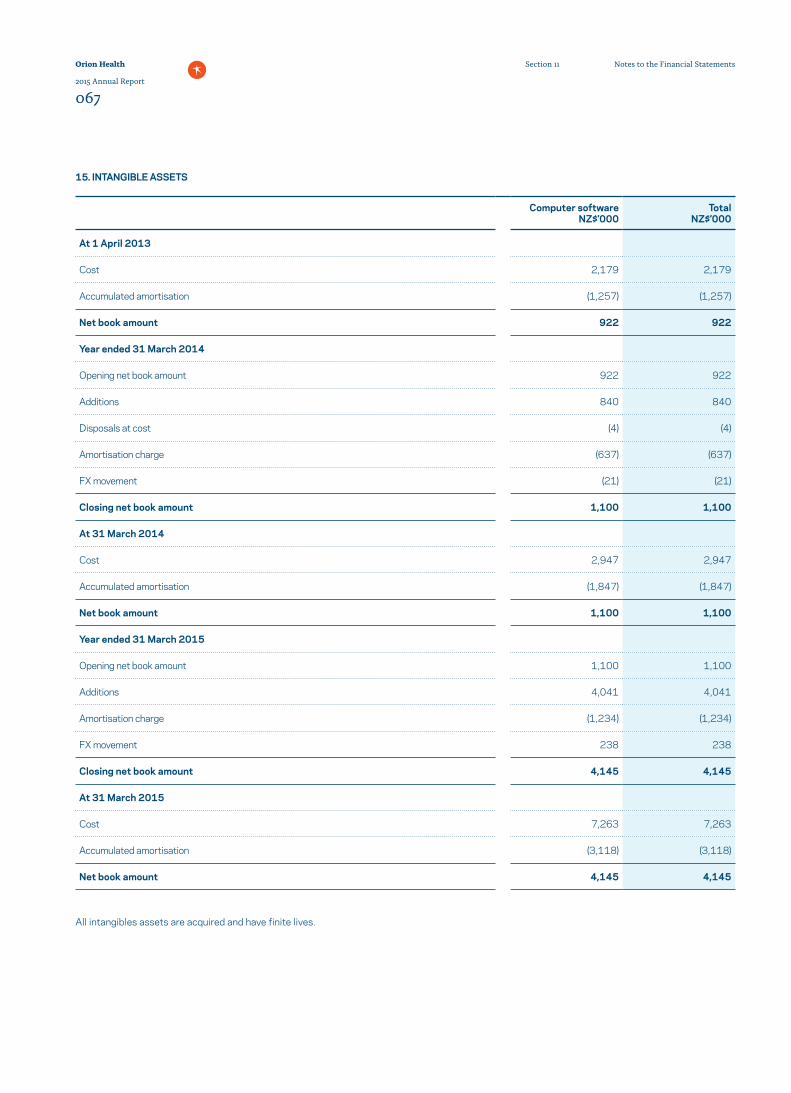
15. INTANGIBLE ASSETS
Computer software NZ$’000
Total NZ$’000
At 1 April 2013
Cost 2,179 2,179
Accumulated amortisation (1,257) (1,257)
Net book amount 922 922
Year ended 31 March 2014
Opening net book amount 922 922
Additions 840 840
Disposals at cost (4) (4)
Amortisation charge (637) (637)
FX movement (21) (21)
Closing net book amount 1,100 1,100
At 31 March 2014
Cost 2,947 2,947
Accumulated amortisation (1,847) (1,847)
Net book amount 1,100 1,100
Year ended 31 March 2015
Opening net book amount 1,100 1,100
Additions 4,041 4,041
Amortisation charge (1,234) (1,234)
FX movement 238 238
Closing net book amount 4,145 4,145
At 31 March 2015
Cost 7,263 7,263
Accumulated amortisation (3,118) (3,118)
Net book amount 4,145 4,145
All intangibles assets are acquired and have finite lives.
Orion Health
2015 Annual Report
067
Notes to the Financial StatementsSection 11
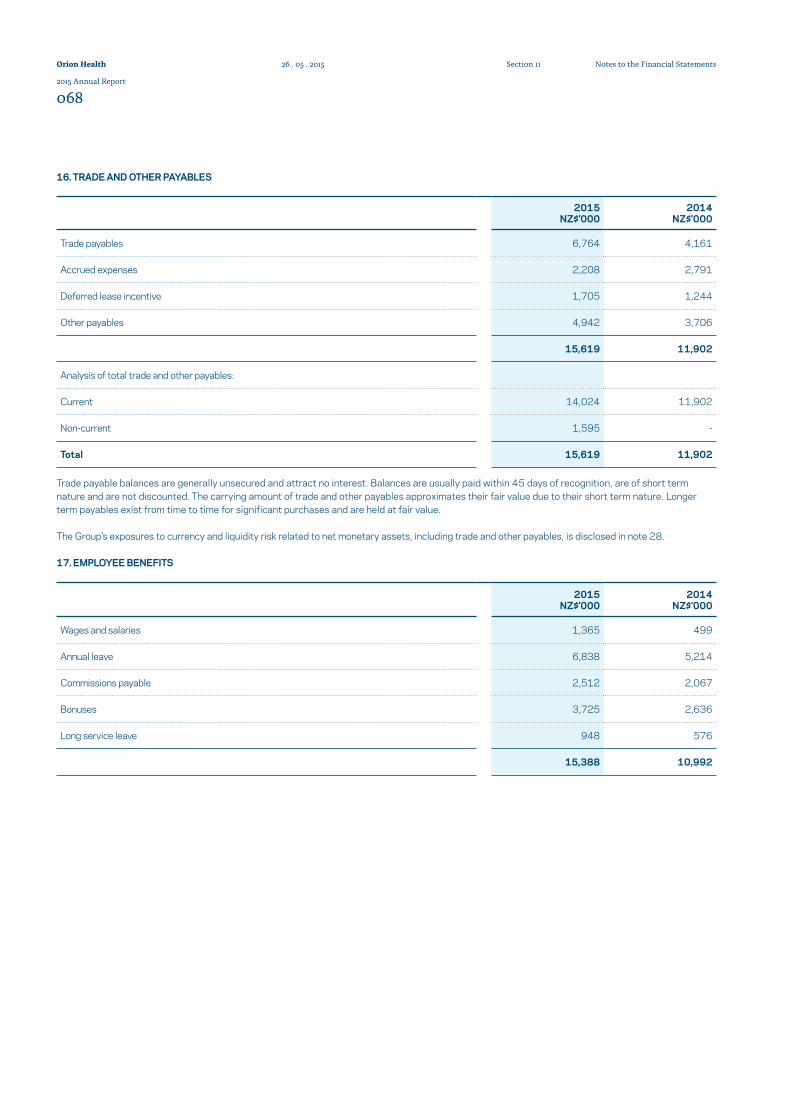
Trade payable balances are generally unsecured and attract no interest. Balances are usually paid within 45 days of recognition, are of short term nature and are not discounted. The carrying amount of trade and other payables approximates their fair value due to their short term nature. Longer term payables exist from time to time for significant purchases and are held at fair value.
The Group’s exposures to currency and liquidity risk related to net monetary assets, including trade and other payables, is disclosed in note 28.
17. EMPLOYEE BENEFITS
2015 NZ$’000
2014 NZ$’000
Trade payables 6,764 4,161
Accrued expenses 2,208 2,791
Deferred lease incentive 1,705 1,244
Other payables 4,942 3,706
15,619 11,902
Analysis of total trade and other payables:
Current 14,024 11,902
Non-current 1,595 -
Total 15,619 11,902
2015 NZ$’000
2014 NZ$’000
Wages and salaries 1,365 499
Annual leave 6,838 5,214
Commissions payable 2,512 2,067
Bonuses 3,725 2,636
Long service leave 948 576
15,388 10,992
16. TRADE AND OTHER PAYABLES
Orion Health
2015 Annual Report
068
Notes to the Financial StatementsSection 1126 . 05 . 2015
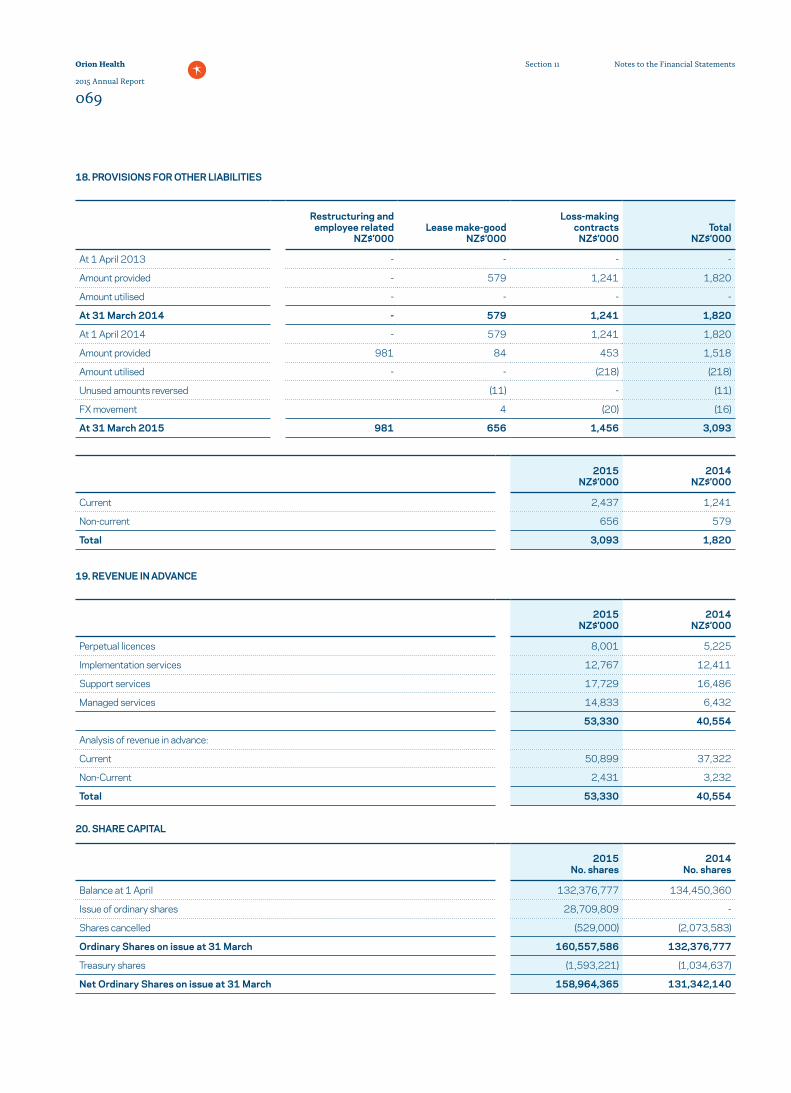
2015 NZ$’000
2014 NZ$’000
Current 2,437 1,241
Non-current 656 579
Total 3,093 1,820
2015 NZ$’000
2014 NZ$’000
Perpetual licences 8,001 5,225
Implementation services 12,767 12,411
Support services 17,729 16,486
Managed services 14,833 6,432
53,330 40,554
Analysis of revenue in advance:
Current 50,899 37,322
Non-Current 2,431 3,232
Total 53,330 40,554
18. PROVISIONS FOR OTHER LIABILITIES
Restructuring and employee related
NZ$’000Lease make-good
NZ$’000
Loss-making contracts
NZ$’000Total
NZ$’000
At 1 April 2013 - - - -
Amount provided - 579 1,241 1,820
Amount utilised - - - -
At 31 March 2014 - 579 1,241 1,820
At 1 April 2014 - 579 1,241 1,820
Amount provided 981 84 453 1,518
Amount utilised - - (218) (218)
Unused amounts reversed (11) - (11)
FX movement 4 (20) (16)
At 31 March 2015 981 656 1,456 3,093
19. REVENUE IN ADVANCE
2015 No. shares
2014 No. shares
Balance at 1 April 132,376,777 134,450,360
Issue of ordinary shares 28,709,809 -
Shares cancelled (529,000) (2,073,583)
Ordinary Shares on issue at 31 March 160,557,586 132,376,777
Treasury shares (1,593,221) (1,034,637)
Net Ordinary Shares on issue at 31 March 158,964,365 131,342,140
20. SHARE CAPITAL
Orion Health
2015 Annual Report
069
Notes to the Financial StatementsSection 11
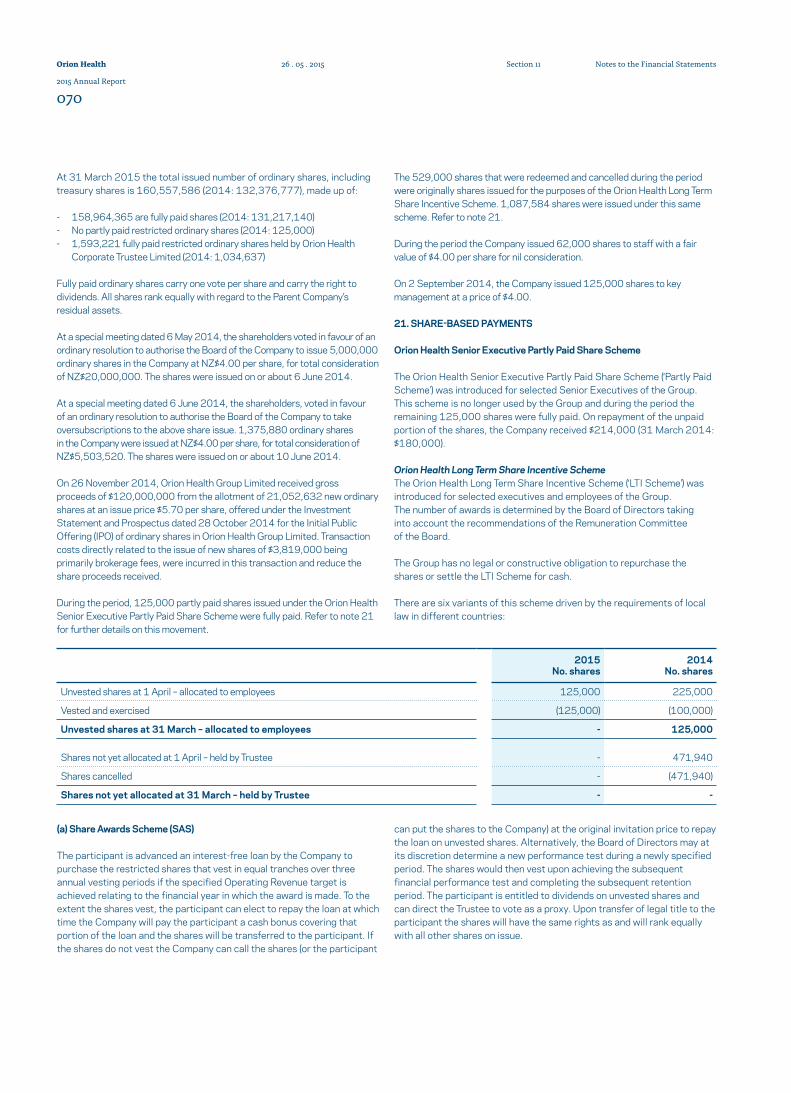
2015 No. shares
2014 No. shares
Unvested shares at 1 April – allocated to employees 125,000 225,000
Vested and exercised (125,000) (100,000)
Unvested shares at 31 March – allocated to employees - 125,000
Shares not yet allocated at 1 April – held by Trustee - 471,940
Shares cancelled - (471,940)
Shares not yet allocated at 31 March – held by Trustee - -
At 31 March 2015 the total issued number of ordinary shares, including treasury shares is 160,557,586 (2014: 132,376,777), made up of:
- 158,964,365 are fully paid shares (2014: 131,217,140)- No partly paid restricted ordinary shares (2014: 125,000)- 1,593,221 fully paid restricted ordinary shares held by Orion Health
Corporate Trustee Limited (2014: 1,034,637)
Fully paid ordinary shares carry one vote per share and carry the right to dividends. All shares rank equally with regard to the Parent Company’s residual assets.
At a special meeting dated 6 May 2014, the shareholders voted in favour of an ordinary resolution to authorise the Board of the Company to issue 5,000,000 ordinary shares in the Company at NZ$4.00 per share, for total consideration of NZ$20,000,000. The shares were issued on or about 6 June 2014.
At a special meeting dated 6 June 2014, the shareholders, voted in favour of an ordinary resolution to authorise the Board of the Company to take oversubscriptions to the above share issue. 1,375,880 ordinary shares in the Company were issued at NZ$4.00 per share, for total consideration of NZ$5,503,520. The shares were issued on or about 10 June 2014.
On 26 November 2014, Orion Health Group Limited received gross proceeds of $120,000,000 from the allotment of 21,052,632 new ordinary shares at an issue price $5.70 per share, offered under the Investment Statement and Prospectus dated 28 October 2014 for the Initial Public Offering (IPO) of ordinary shares in Orion Health Group Limited. Transaction costs directly related to the issue of new shares of $3,819,000 being primarily brokerage fees, were incurred in this transaction and reduce the share proceeds received.
During the period, 125,000 partly paid shares issued under the Orion Health Senior Executive Partly Paid Share Scheme were fully paid. Refer to note 21 for further details on this movement.
The 529,000 shares that were redeemed and cancelled during the period were originally shares issued for the purposes of the Orion Health Long Term Share Incentive Scheme. 1,087,584 shares were issued under this same scheme. Refer to note 21.
During the period the Company issued 62,000 shares to staff with a fair value of $4.00 per share for nil consideration.
On 2 September 2014, the Company issued 125,000 shares to key management at a price of $4.00.
21. SHARE-BASED PAYMENTS
Orion Health Senior Executive Partly Paid Share Scheme
The Orion Health Senior Executive Partly Paid Share Scheme (‘Partly Paid Scheme’) was introduced for selected Senior Executives of the Group. This scheme is no longer used by the Group and during the period the remaining 125,000 shares were fully paid. On repayment of the unpaid portion of the shares, the Company received $214,000 (31 March 2014: $180,000).
Orion Health Long Term Share Incentive Scheme The Orion Health Long Term Share Incentive Scheme (‘LTI Scheme’) was introduced for selected executives and employees of the Group. The number of awards is determined by the Board of Directors taking into account the recommendations of the Remuneration Committee of the Board.
The Group has no legal or constructive obligation to repurchase the shares or settle the LTI Scheme for cash.
There are six variants of this scheme driven by the requirements of local law in different countries:
(a) Share Awards Scheme (SAS)
The participant is advanced an interest-free loan by the Company to purchase the restricted shares that vest in equal tranches over three annual vesting periods if the specified Operating Revenue target is achieved relating to the financial year in which the award is made. To the extent the shares vest, the participant can elect to repay the loan at which time the Company will pay the participant a cash bonus covering that portion of the loan and the shares will be transferred to the participant. If the shares do not vest the Company can call the shares (or the participant
can put the shares to the Company) at the original invitation price to repay the loan on unvested shares. Alternatively, the Board of Directors may at its discretion determine a new performance test during a newly specified period. The shares would then vest upon achieving the subsequent financial performance test and completing the subsequent retention period. The participant is entitled to dividends on unvested shares and can direct the Trustee to vote as a proxy. Upon transfer of legal title to the participant the shares will have the same rights as and will rank equally with all other shares on issue.
Orion Health
2015 Annual Report
070
Notes to the Financial StatementsSection 1126 . 05 . 2015
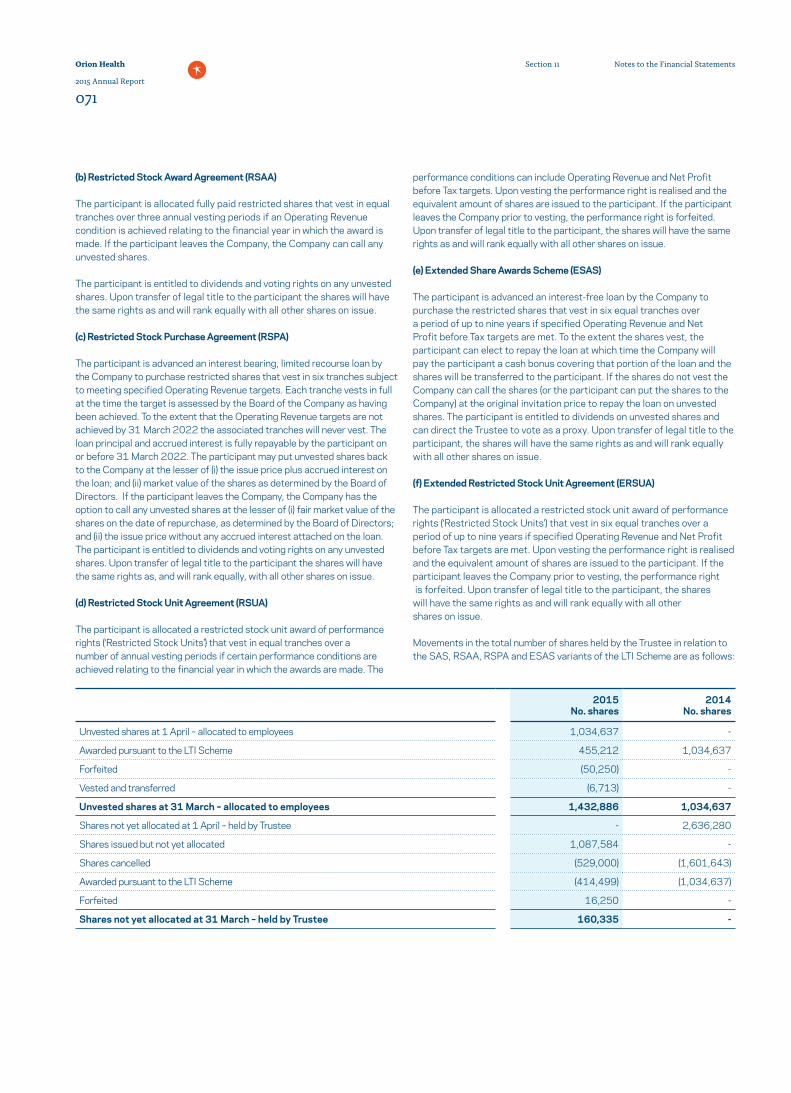
(b) Restricted Stock Award Agreement (RSAA)
The participant is allocated fully paid restricted shares that vest in equal tranches over three annual vesting periods if an Operating Revenue condition is achieved relating to the financial year in which the award is made. If the participant leaves the Company, the Company can call any unvested shares.
The participant is entitled to dividends and voting rights on any unvested shares. Upon transfer of legal title to the participant the shares will have the same rights as and will rank equally with all other shares on issue.
(c) Restricted Stock Purchase Agreement (RSPA)
The participant is advanced an interest bearing, limited recourse loan by the Company to purchase restricted shares that vest in six tranches subject to meeting specified Operating Revenue targets. Each tranche vests in full at the time the target is assessed by the Board of the Company as having been achieved. To the extent that the Operating Revenue targets are not achieved by 31 March 2022 the associated tranches will never vest. The loan principal and accrued interest is fully repayable by the participant on or before 31 March 2022. The participant may put unvested shares back to the Company at the lesser of (i) the issue price plus accrued interest on the loan; and (ii) market value of the shares as determined by the Board of Directors. If the participant leaves the Company, the Company has the option to call any unvested shares at the lesser of (i) fair market value of the shares on the date of repurchase, as determined by the Board of Directors; and (ii) the issue price without any accrued interest attached on the loan. The participant is entitled to dividends and voting rights on any unvested shares. Upon transfer of legal title to the participant the shares will have the same rights as, and will rank equally, with all other shares on issue.
(d) Restricted Stock Unit Agreement (RSUA)
The participant is allocated a restricted stock unit award of performance rights (‘Restricted Stock Units’) that vest in equal tranches over a number of annual vesting periods if certain performance conditions are achieved relating to the financial year in which the awards are made. The
performance conditions can include Operating Revenue and Net Profit before Tax targets. Upon vesting the performance right is realised and the equivalent amount of shares are issued to the participant. If the participant leaves the Company prior to vesting, the performance right is forfeited. Upon transfer of legal title to the participant, the shares will have the same rights as and will rank equally with all other shares on issue.
(e) Extended Share Awards Scheme (ESAS)
The participant is advanced an interest-free loan by the Company to purchase the restricted shares that vest in six equal tranches over a period of up to nine years if specified Operating Revenue and Net Profit before Tax targets are met. To the extent the shares vest, the participant can elect to repay the loan at which time the Company will pay the participant a cash bonus covering that portion of the loan and the shares will be transferred to the participant. If the shares do not vest the Company can call the shares (or the participant can put the shares to the Company) at the original invitation price to repay the loan on unvested shares. The participant is entitled to dividends on unvested shares and can direct the Trustee to vote as a proxy. Upon transfer of legal title to the participant, the shares will have the same rights as and will rank equally with all other shares on issue.
(f) Extended Restricted Stock Unit Agreement (ERSUA)
The participant is allocated a restricted stock unit award of performance rights (‘Restricted Stock Units’) that vest in six equal tranches over a period of up to nine years if specified Operating Revenue and Net Profit before Tax targets are met. Upon vesting the performance right is realised and the equivalent amount of shares are issued to the participant. If the participant leaves the Company prior to vesting, the performance right is forfeited. Upon transfer of legal title to the participant, the shares will have the same rights as and will rank equally with all other shares on issue.
Movements in the total number of shares held by the Trustee in relation to the SAS, RSAA, RSPA and ESAS variants of the LTI Scheme are as follows:
2015 No. shares
2014 No. shares
Unvested shares at 1 April – allocated to employees 1,034,637 -
Awarded pursuant to the LTI Scheme 455,212 1,034,637
Forfeited (50,250) -
Vested and transferred (6,713) -
Unvested shares at 31 March – allocated to employees 1,432,886 1,034,637
Shares not yet allocated at 1 April – held by Trustee - 2,636,280
Shares issued but not yet allocated 1,087,584 -
Shares cancelled (529,000) (1,601,643)
Awarded pursuant to the LTI Scheme (414,499) (1,034,637)
Forfeited 16,250 -
Shares not yet allocated at 31 March – held by Trustee 160,335 -
Orion Health
2015 Annual Report
071
Notes to the Financial StatementsSection 11
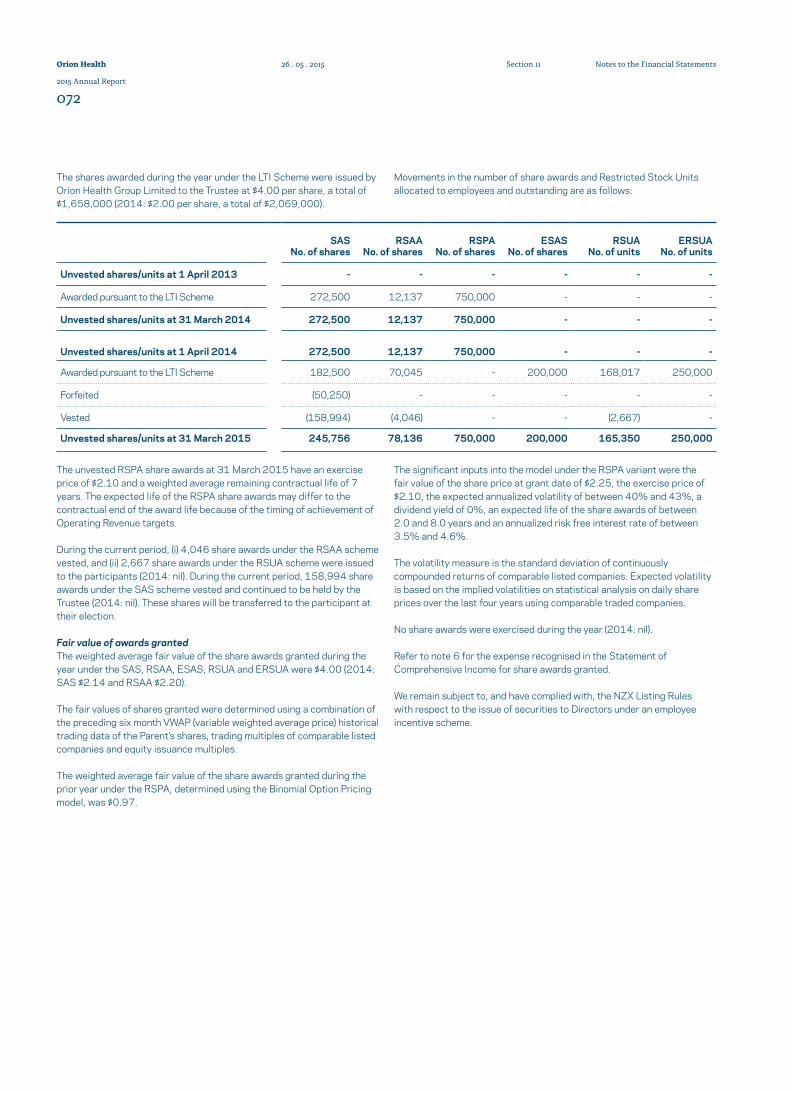
The unvested RSPA share awards at 31 March 2015 have an exercise price of $2.10 and a weighted average remaining contractual life of 7 years. The expected life of the RSPA share awards may differ to the contractual end of the award life because of the timing of achievement of Operating Revenue targets.
During the current period, (i) 4,046 share awards under the RSAA scheme vested, and (ii) 2,667 share awards under the RSUA scheme were issued to the participants (2014: nil). During the current period, 158,994 share awards under the SAS scheme vested and continued to be held by the Trustee (2014: nil). These shares will be transferred to the participant at their election.
Fair value of awards granted The weighted average fair value of the share awards granted during the year under the SAS, RSAA, ESAS, RSUA and ERSUA were $4.00 (2014: SAS $2.14 and RSAA $2.20).
The fair values of shares granted were determined using a combination of the preceding six month VWAP (variable weighted average price) historical trading data of the Parent’s shares, trading multiples of comparable listed companies and equity issuance multiples.
The weighted average fair value of the share awards granted during the prior year under the RSPA, determined using the Binomial Option Pricing model, was $0.97.
The significant inputs into the model under the RSPA variant were the fair value of the share price at grant date of $2.25, the exercise price of $2.10, the expected annualized volatility of between 40% and 43%, a dividend yield of 0%, an expected life of the share awards of between 2.0 and 8.0 years and an annualized risk free interest rate of between 3.5% and 4.6%.
The volatility measure is the standard deviation of continuously compounded returns of comparable listed companies. Expected volatility is based on the implied volatilities on statistical analysis on daily share prices over the last four years using comparable traded companies.
No share awards were exercised during the year (2014: nil).
Refer to note 6 for the expense recognised in the Statement of Comprehensive Income for share awards granted.
We remain subject to, and have complied with, the NZX Listing Rules with respect to the issue of securities to Directors under an employee incentive scheme.
SAS No. of shares
RSAA No. of shares
RSPA No. of shares
ESAS No. of shares
RSUA No. of units
ERSUA No. of units
Unvested shares/units at 1 April 2013 - - - - - -
Awarded pursuant to the LTI Scheme 272,500 12,137 750,000 - - -
Unvested shares/units at 31 March 2014 272,500 12,137 750,000 - - -
Unvested shares/units at 1 April 2014 272,500 12,137 750,000 - - -
Awarded pursuant to the LTI Scheme 182,500 70,045 - 200,000 168,017 250,000
Forfeited (50,250) - - - - -
Vested (158,994) (4,046) - - (2,667) -
Unvested shares/units at 31 March 2015 245,756 78,136 750,000 200,000 165,350 250,000
The shares awarded during the year under the LTI Scheme were issued by Orion Health Group Limited to the Trustee at $4.00 per share, a total of $1,658,000 (2014: $2.00 per share, a total of $2,069,000).
Movements in the number of share awards and Restricted Stock Units allocated to employees and outstanding are as follows:
Orion Health
2015 Annual Report
072
Notes to the Financial StatementsSection 1126 . 05 . 2015
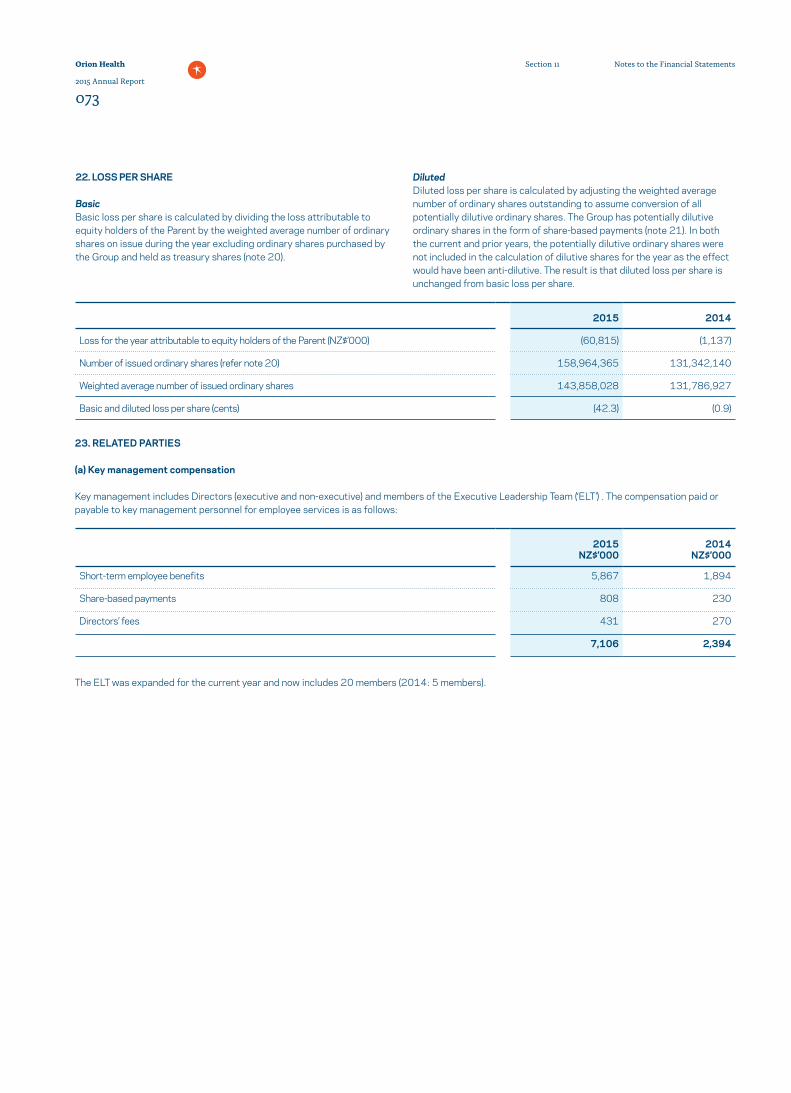
22. LOSS PER SHARE
Basic Basic loss per share is calculated by dividing the loss attributable to equity holders of the Parent by the weighted average number of ordinary shares on issue during the year excluding ordinary shares purchased by the Group and held as treasury shares (note 20).
Diluted Diluted loss per share is calculated by adjusting the weighted average number of ordinary shares outstanding to assume conversion of all potentially dilutive ordinary shares. The Group has potentially dilutive ordinary shares in the form of share-based payments (note 21). In both the current and prior years, the potentially dilutive ordinary shares were not included in the calculation of dilutive shares for the year as the effect would have been anti-dilutive. The result is that diluted loss per share is unchanged from basic loss per share.
2015 2014
Loss for the year attributable to equity holders of the Parent (NZ$’000) (60,815) (1,137)
Number of issued ordinary shares (refer note 20) 158,964,365 131,342,140
Weighted average number of issued ordinary shares 143,858,028 131,786,927
Basic and diluted loss per share (cents) (42.3) (0.9)
2015 NZ$’000
2014 NZ$’000
Short-term employee benefits 5,867 1,894
Share-based payments 808 230
Directors’ fees 431 270
7,106 2,394
23. RELATED PARTIES
(a) Key management compensation
Key management includes Directors (executive and non-executive) and members of the Executive Leadership Team (‘ELT’) . The compensation paid or payable to key management personnel for employee services is as follows:
The ELT was expanded for the current year and now includes 20 members (2014: 5 members).
Orion Health
2015 Annual Report
073
Notes to the Financial StatementsSection 11
(b) Transactions with related parties
McCrae Limited McCrae Limited owned 50% of the shares in Orion Health Group Limited as at 31 March 2015 (2014: 62%). The remaining shares are widely held. McCrae Limited is the Group’s ultimate parent. The Group’s ultimate controlling party is Mr Ian Richard McCrae. There have been no transactions with this company during the year (2014: nil).
Healthlink International Limited Healthlink Limited (a subsidiary of Healthlink International Limited, a former equity accounted associate, refer also to (note 13) provides e-referral services to Group entities as well as purchasing licences from Group entities. These transactions were at arm’s length on normal trade terms as part of a wider transaction involving the sale of Orion Health’s shares in Healthlink International Limited.
Revera Limited Andrew Clements, former Chairman, was previously a Director of Revera Limited (ceased 7 May 2013) which provided hosting services to the Group. These transactions were at arm’s length on normal trade terms.
Pioneer Capital Partners Neil Cullimore, Director, is an Operating Partner at Pioneer Capital which provided professional services to the Group. These transactions were at arm’s length on normal trade terms.
New Zealand Trade and Enterprise Andrew Ferrier, Chairman, is Chairman of New Zealand Trade and Enterprise. The Group has been receiving cost reimbursements from NZTE for cost incurred in expanding into China.
HealthAlliance N.Z. Limited Lester Levy, Director appointed to the Board in August 2014, is Chairman of Waitemata District Health Board and Auckland District Health Board and Deputy Chairman of Health Benefits Limited (resigned December 2014). Combined, these three entities own a majority shareholding in HealthAlliance N.Z. Limited (‘healthAlliance’). healthAlliance is a shared services organisation, providing non-clinical services to the four Northern Region District Health Boards and is a significant customer of the Group. The Group sells software and services to healthAlliance on an arm’s length basis and on normal trade terms. This customer is considered a related party from August 2014 following the appointment of Lester Levy to the Board as a Director.
Auckland District Health Board Lester Levy, Director, is Chairman of Auckland District Health Board (‘Auckland DHB’). The Group sells software and services to Auckland DHB, both directly and through healthAlliance, on an arm’s length basis and on normal trade terms. In September 2014, the Group held its Annual General Meeting at Auckland Hospital and were charged for this service by Auckland DHB. This customer is considered a related party from August 2014 following the appointment of Lester Levy to the Board as a Director.
Waitemata District Health Board Lester Levy, Director, is Chairman of Waitemata District Health Board (‘Waitemata DHB’). The Group sells software and services to Waitemata DHB, both directly and through healthAlliance, on an arm’s length basis and on normal trade terms. This customer is considered a related party from August 2014 following the appointment of Lester Levy to the Board as a Director.
Air New Zealand Limited Roger France, Director, is a Director of Air New Zealand Limited. The Group purchases travel services directly and through an intermediate company on an arm’s length basis and on normal trade terms.
Orion Health
2015 Annual Report
074
Notes to the Financial StatementsSection 1126 . 05 . 2015
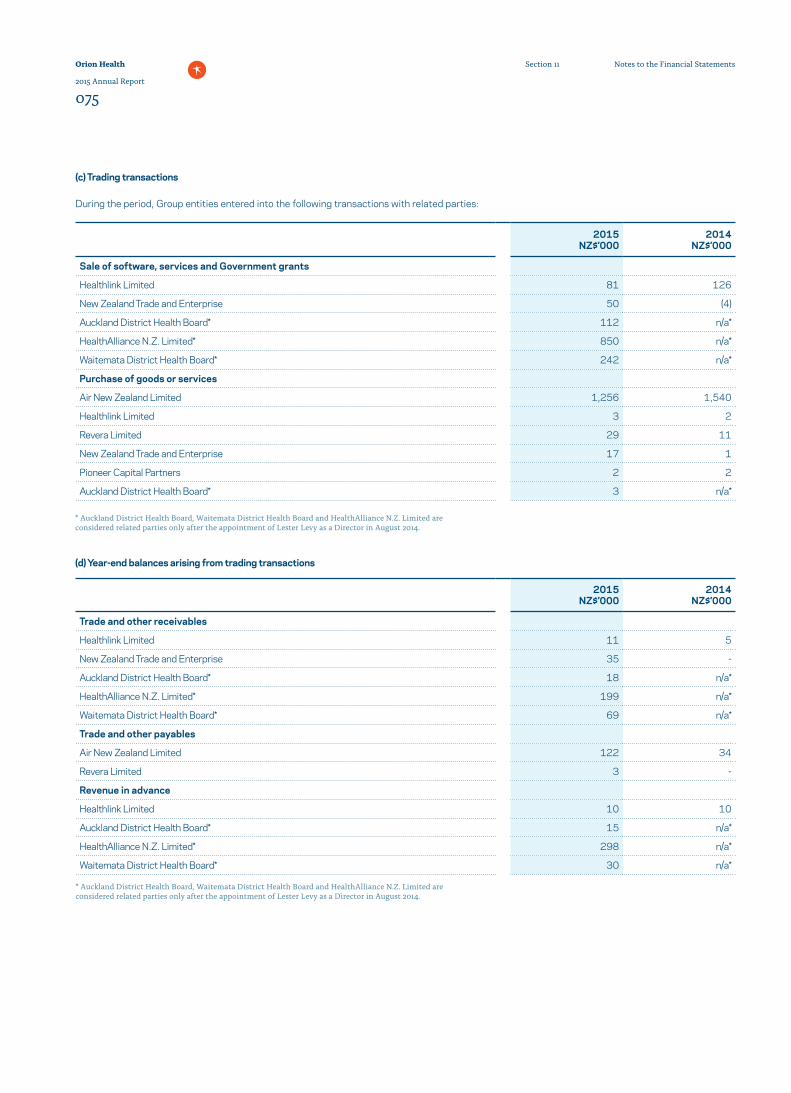
2015 NZ$’000
2014 NZ$’000
Sale of software, services and Government grants
Healthlink Limited 81 126
New Zealand Trade and Enterprise 50 (4)
Auckland District Health Board* 112 n/a*
HealthAlliance N.Z. Limited* 850 n/a*
Waitemata District Health Board* 242 n/a*
Purchase of goods or services
Air New Zealand Limited 1,256 1,540
Healthlink Limited 3 2
Revera Limited 29 11
New Zealand Trade and Enterprise 17 1
Pioneer Capital Partners 2 2
Auckland District Health Board* 3 n/a*
* Auckland District Health Board, Waitemata District Health Board and HealthAlliance N.Z. Limited are considered related parties only after the appointment of Lester Levy as a Director in August 2014.
(d) Year-end balances arising from trading transactions
2015 NZ$’000
2014 NZ$’000
Trade and other receivables
Healthlink Limited 11 5
New Zealand Trade and Enterprise 35 -
Auckland District Health Board* 18 n/a*
HealthAlliance N.Z. Limited* 199 n/a*
Waitemata District Health Board* 69 n/a*
Trade and other payables
Air New Zealand Limited 122 34
Revera Limited 3 -
Revenue in advance
Healthlink Limited 10 10
Auckland District Health Board* 15 n/a*
HealthAlliance N.Z. Limited* 298 n/a*
Waitemata District Health Board* 30 n/a*
* Auckland District Health Board, Waitemata District Health Board and HealthAlliance N.Z. Limited are considered related parties only after the appointment of Lester Levy as a Director in August 2014.
(c) Trading transactions
During the period, Group entities entered into the following transactions with related parties:
Orion Health
2015 Annual Report
075
Notes to the Financial StatementsSection 11
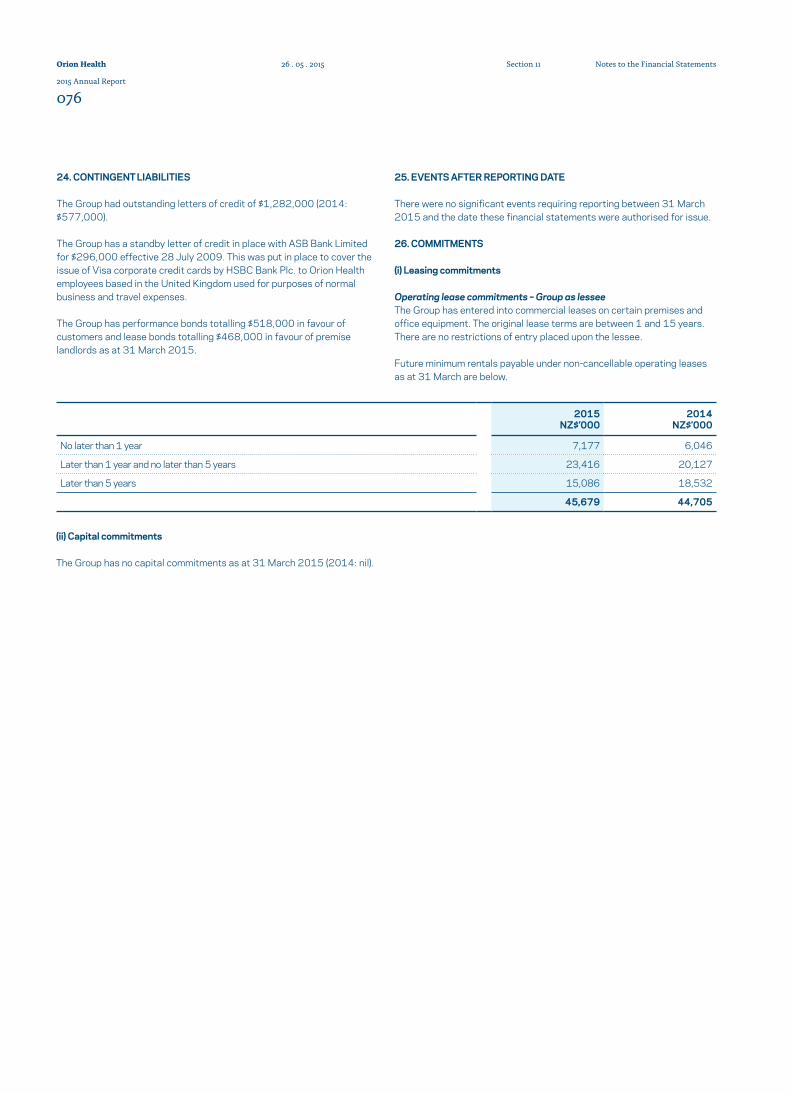
24. CONTINGENT LIABILITIES
The Group had outstanding letters of credit of $1,282,000 (2014: $577,000).
The Group has a standby letter of credit in place with ASB Bank Limited for $296,000 effective 28 July 2009. This was put in place to cover the issue of Visa corporate credit cards by HSBC Bank Plc. to Orion Health employees based in the United Kingdom used for purposes of normal business and travel expenses.
The Group has performance bonds totalling $518,000 in favour of customers and lease bonds totalling $468,000 in favour of premise landlords as at 31 March 2015.
25. EVENTS AFTER REPORTING DATE
There were no significant events requiring reporting between 31 March 2015 and the date these financial statements were authorised for issue.
26. COMMITMENTS
(i) Leasing commitments
Operating lease commitments – Group as lessee The Group has entered into commercial leases on certain premises and office equipment. The original lease terms are between 1 and 15 years.There are no restrictions of entry placed upon the lessee.
Future minimum rentals payable under non-cancellable operating leases as at 31 March are below.
2015 NZ$’000
2014 NZ$’000
No later than 1 year 7,177 6,046
Later than 1 year and no later than 5 years 23,416 20,127
Later than 5 years 15,086 18,532
45,679 44,705
(ii) Capital commitments
The Group has no capital commitments as at 31 March 2015 (2014: nil).
Orion Health
2015 Annual Report
076
Notes to the Financial StatementsSection 1126 . 05 . 2015
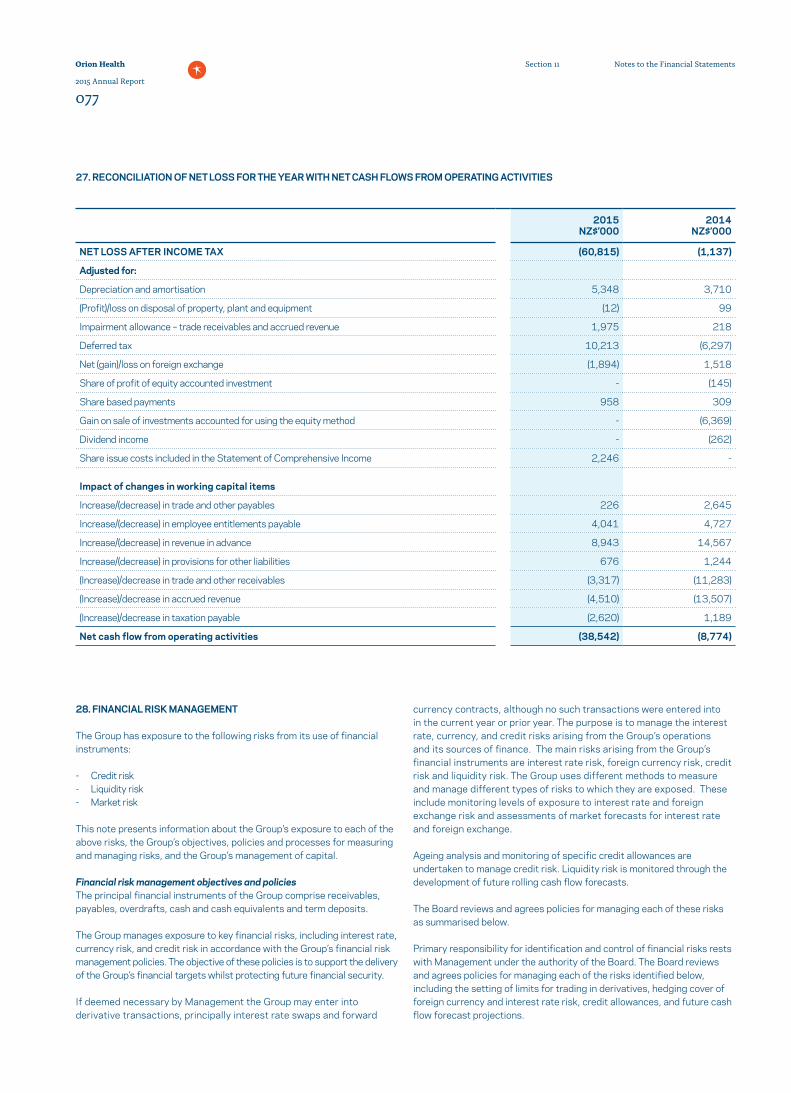
2015 NZ$’000
2014 NZ$’000
NET LOSS AFTER INCOME TAX (60,815) (1,137)
Adjusted for:
Depreciation and amortisation 5,348 3,710
(Profit)/loss on disposal of property, plant and equipment (12) 99
Impairment allowance – trade receivables and accrued revenue 1,975 218
Deferred tax 10,213 (6,297)
Net (gain)/loss on foreign exchange (1,894) 1,518
Share of profit of equity accounted investment - (145)
Share based payments 958 309
Gain on sale of investments accounted for using the equity method - (6,369)
Dividend income - (262)
Share issue costs included in the Statement of Comprehensive Income 2,246 -
Impact of changes in working capital items
Increase/(decrease) in trade and other payables 226 2,645
Increase/(decrease) in employee entitlements payable 4,041 4,727
Increase/(decrease) in revenue in advance 8,943 14,567
Increase/(decrease) in provisions for other liabilities 676 1,244
(Increase)/decrease in trade and other receivables (3,317) (11,283)
(Increase)/decrease in accrued revenue (4,510) (13,507)
(Increase)/decrease in taxation payable (2,620) 1,189
Net cash flow from operating activities (38,542) (8,774)
28. FINANCIAL RISK MANAGEMENT
The Group has exposure to the following risks from its use of financial instruments:
- Credit risk- Liquidity risk- Market risk
This note presents information about the Group’s exposure to each of the above risks, the Group’s objectives, policies and processes for measuring and managing risks, and the Group’s management of capital.
Financial risk management objectives and policies The principal financial instruments of the Group comprise receivables, payables, overdrafts, cash and cash equivalents and term deposits.
The Group manages exposure to key financial risks, including interest rate, currency risk, and credit risk in accordance with the Group’s financial risk management policies. The objective of these policies is to support the delivery of the Group’s financial targets whilst protecting future financial security.
If deemed necessary by Management the Group may enter into derivative transactions, principally interest rate swaps and forward
currency contracts, although no such transactions were entered into in the current year or prior year. The purpose is to manage the interest rate, currency, and credit risks arising from the Group’s operations and its sources of finance. The main risks arising from the Group’s financial instruments are interest rate risk, foreign currency risk, credit risk and liquidity risk. The Group uses different methods to measure and manage different types of risks to which they are exposed. These include monitoring levels of exposure to interest rate and foreign exchange risk and assessments of market forecasts for interest rate and foreign exchange.
Ageing analysis and monitoring of specific credit allowances are undertaken to manage credit risk. Liquidity risk is monitored through the development of future rolling cash flow forecasts.
The Board reviews and agrees policies for managing each of these risks as summarised below.
Primary responsibility for identification and control of financial risks rests with Management under the authority of the Board. The Board reviews and agrees policies for managing each of the risks identified below, including the setting of limits for trading in derivatives, hedging cover of foreign currency and interest rate risk, credit allowances, and future cash flow forecast projections.
27. RECONCILIATION OF NET LOSS FOR THE YEAR WITH NET CASH FLOWS FROM OPERATING ACTIVITIES
Orion Health
2015 Annual Report
077
Notes to the Financial StatementsSection 11
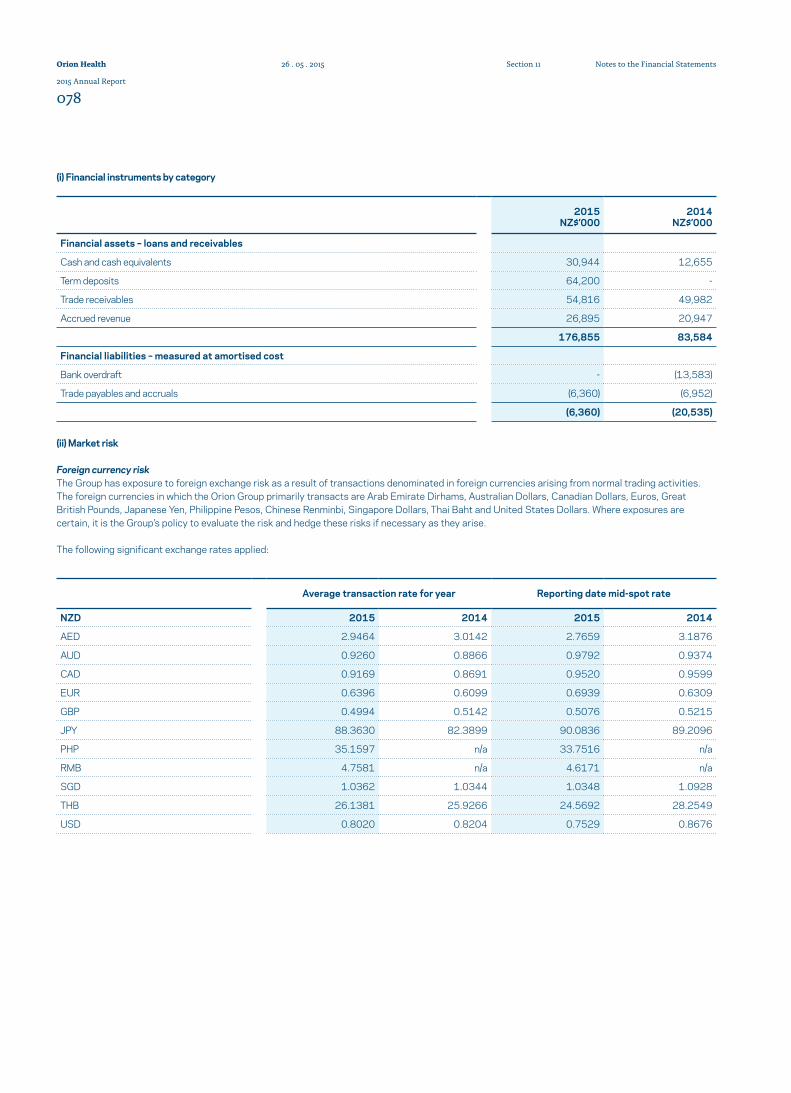
2015 NZ$’000
2014 NZ$’000
Financial assets – loans and receivables
Cash and cash equivalents 30,944 12,655
Term deposits 64,200 -
Trade receivables 54,816 49,982
Accrued revenue 26,895 20,947
176,855 83,584
Financial liabilities – measured at amortised cost
Bank overdraft - (13,583)
Trade payables and accruals (6,360) (6,952)
(6,360) (20,535)
(ii) Market risk
Foreign currency risk The Group has exposure to foreign exchange risk as a result of transactions denominated in foreign currencies arising from normal trading activities. The foreign currencies in which the Orion Group primarily transacts are Arab Emirate Dirhams, Australian Dollars, Canadian Dollars, Euros, Great British Pounds, Japanese Yen, Philippine Pesos, Chinese Renminbi, Singapore Dollars, Thai Baht and United States Dollars. Where exposures are certain, it is the Group’s policy to evaluate the risk and hedge these risks if necessary as they arise.
The following significant exchange rates applied:
Average transaction rate for year Reporting date mid-spot rate
NZD 2015 2014 2015 2014
AED 2.9464 3.0142 2.7659 3.1876
AUD 0.9260 0.8866 0.9792 0.9374
CAD 0.9169 0.8691 0.9520 0.9599
EUR 0.6396 0.6099 0.6939 0.6309
GBP 0.4994 0.5142 0.5076 0.5215
JPY 88.3630 82.3899 90.0836 89.2096
PHP 35.1597 n/a 33.7516 n/a
RMB 4.7581 n/a 4.6171 n/a
SGD 1.0362 1.0344 1.0348 1.0928
THB 26.1381 25.9266 24.5692 28.2549
USD 0.8020 0.8204 0.7529 0.8676
(i) Financial instruments by category
Orion Health
2015 Annual Report
078
Notes to the Financial StatementsSection 1126 . 05 . 2015
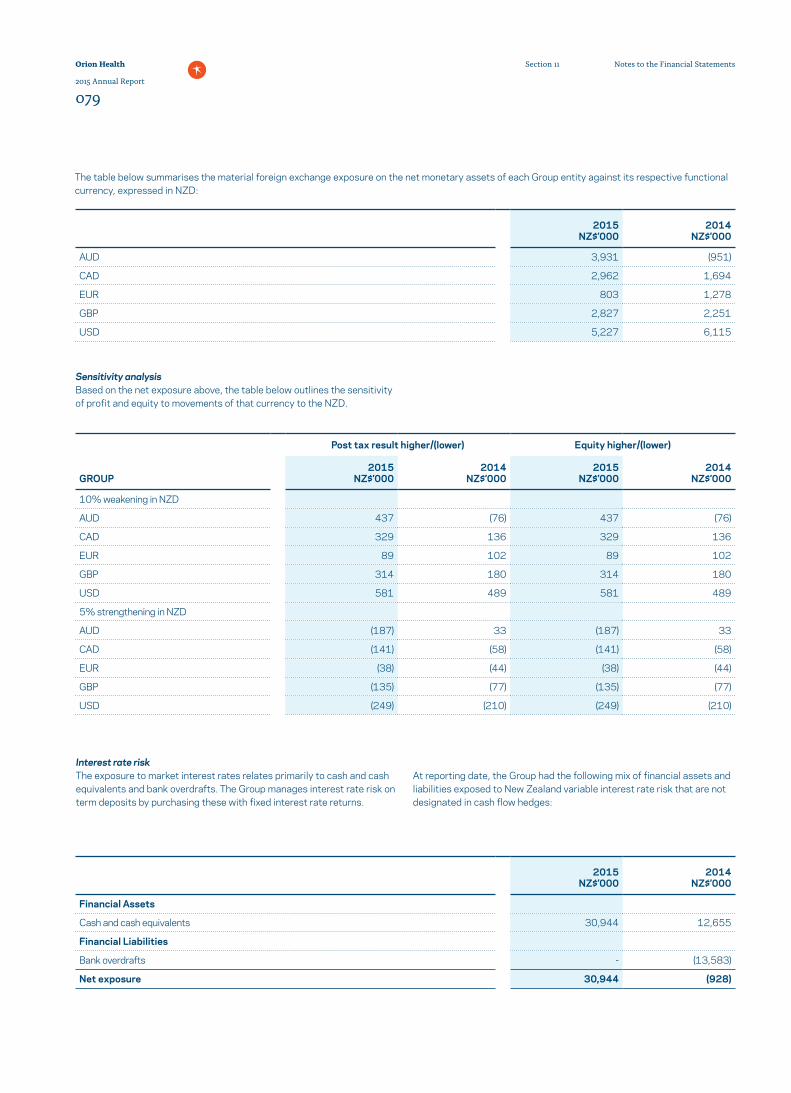
Sensitivity analysis Based on the net exposure above, the table below outlines the sensitivity of profit and equity to movements of that currency to the NZD.
2015 NZ$’000
2014 NZ$’000
AUD 3,931 (951)
CAD 2,962 1,694
EUR 803 1,278
GBP 2,827 2,251
USD 5,227 6,115
Interest rate risk The exposure to market interest rates relates primarily to cash and cash equivalents and bank overdrafts. The Group manages interest rate risk on term deposits by purchasing these with fixed interest rate returns.
At reporting date, the Group had the following mix of financial assets and liabilities exposed to New Zealand variable interest rate risk that are not designated in cash flow hedges:
Post tax result higher/(lower) Equity higher/(lower)
GROUP2015
NZ$’0002014
NZ$’0002015
NZ$’0002014
NZ$’000
10% weakening in NZD
AUD 437 (76) 437 (76)
CAD 329 136 329 136
EUR 89 102 89 102
GBP 314 180 314 180
USD 581 489 581 489
5% strengthening in NZD
AUD (187) 33 (187) 33
CAD (141) (58) (141) (58)
EUR (38) (44) (38) (44)
GBP (135) (77) (135) (77)
USD (249) (210) (249) (210)
2015 NZ$’000
2014 NZ$’000
Financial Assets
Cash and cash equivalents 30,944 12,655
Financial Liabilities
Bank overdrafts - (13,583)
Net exposure 30,944 (928)
The table below summarises the material foreign exchange exposure on the net monetary assets of each Group entity against its respective functional currency, expressed in NZD:
Orion Health
2015 Annual Report
079
Notes to the Financial StatementsSection 11
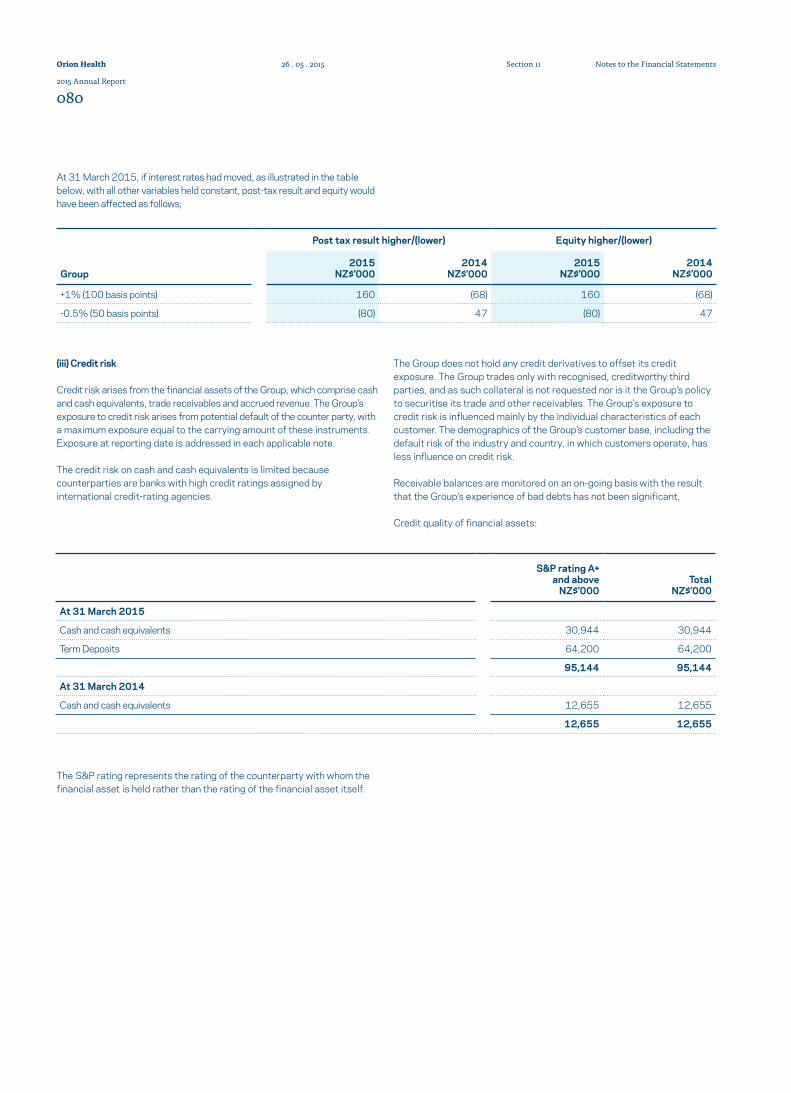
Post tax result higher/(lower) Equity higher/(lower)
Group2015
NZ$’0002014
NZ$’0002015
NZ$’0002014
NZ$’000
+1% (100 basis points) 160 (68) 160 (68)
-0.5% (50 basis points) (80) 47 (80) 47
(iii) Credit risk
Credit risk arises from the financial assets of the Group, which comprise cash and cash equivalents, trade receivables and accrued revenue. The Group’s exposure to credit risk arises from potential default of the counter party, with a maximum exposure equal to the carrying amount of these instruments. Exposure at reporting date is addressed in each applicable note.
The credit risk on cash and cash equivalents is limited because counterparties are banks with high credit ratings assigned by international credit-rating agencies.
The Group does not hold any credit derivatives to offset its credit exposure. The Group trades only with recognised, creditworthy third parties, and as such collateral is not requested nor is it the Group’s policy to securitise its trade and other receivables. The Group’s exposure to credit risk is influenced mainly by the individual characteristics of each customer. The demographics of the Group’s customer base, including the default risk of the industry and country, in which customers operate, has less influence on credit risk.
Receivable balances are monitored on an on-going basis with the result that the Group’s experience of bad debts has not been significant.
Credit quality of financial assets:
S&P rating A+ and above
NZ$’000Total
NZ$’000
At 31 March 2015
Cash and cash equivalents 30,944 30,944
Term Deposits 64,200 64,200
95,144 95,144
At 31 March 2014
Cash and cash equivalents 12,655 12,655
12,655 12,655
At 31 March 2015, if interest rates had moved, as illustrated in the table below, with all other variables held constant, post-tax result and equity would have been affected as follows;
The S&P rating represents the rating of the counterparty with whom the financial asset is held rather than the rating of the financial asset itself.
Orion Health
2015 Annual Report
080
Notes to the Financial StatementsSection 1126 . 05 . 2015
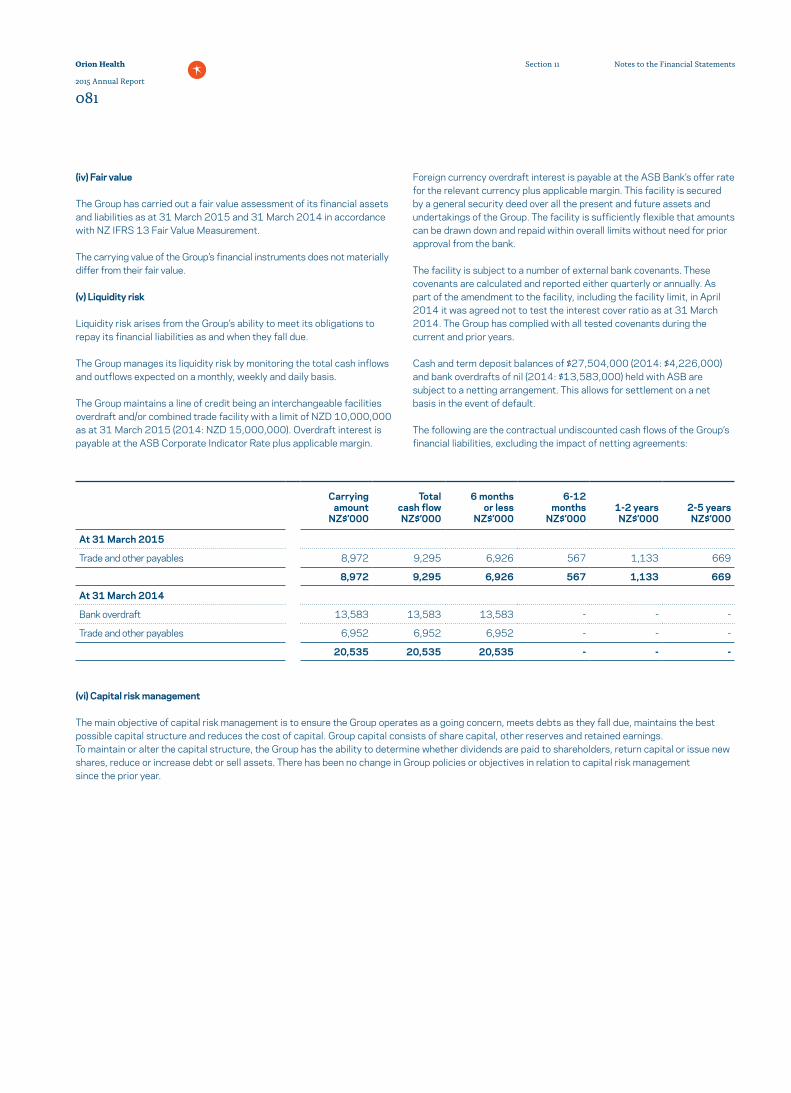
Carrying amount
NZ$’000
Total cash flow NZ$’000
6 months or less
NZ$’000
6-12 months
NZ$’0001-2 years NZ$’000
2-5 years NZ$’000
At 31 March 2015
Trade and other payables 8,972 9,295 6,926 567 1,133 669
8,972 9,295 6,926 567 1,133 669
At 31 March 2014
Bank overdraft 13,583 13,583 13,583 - - -
Trade and other payables 6,952 6,952 6,952 - - -
20,535 20,535 20,535 - - -
(iv) Fair value
The Group has carried out a fair value assessment of its financial assets and liabilities as at 31 March 2015 and 31 March 2014 in accordance with NZ IFRS 13 Fair Value Measurement.
The carrying value of the Group’s financial instruments does not materially differ from their fair value.
(v) Liquidity risk
Liquidity risk arises from the Group’s ability to meet its obligations to repay its financial liabilities as and when they fall due.
The Group manages its liquidity risk by monitoring the total cash inflows and outflows expected on a monthly, weekly and daily basis.
The Group maintains a line of credit being an interchangeable facilities overdraft and/or combined trade facility with a limit of NZD 10,000,000 as at 31 March 2015 (2014: NZD 15,000,000). Overdraft interest is payable at the ASB Corporate Indicator Rate plus applicable margin.
Foreign currency overdraft interest is payable at the ASB Bank’s offer rate for the relevant currency plus applicable margin. This facility is secured by a general security deed over all the present and future assets and undertakings of the Group. The facility is sufficiently flexible that amounts can be drawn down and repaid within overall limits without need for prior approval from the bank.
The facility is subject to a number of external bank covenants. These covenants are calculated and reported either quarterly or annually. As part of the amendment to the facility, including the facility limit, in April 2014 it was agreed not to test the interest cover ratio as at 31 March 2014. The Group has complied with all tested covenants during the current and prior years.
Cash and term deposit balances of $27,504,000 (2014: $4,226,000) and bank overdrafts of nil (2014: $13,583,000) held with ASB are subject to a netting arrangement. This allows for settlement on a net basis in the event of default.
The following are the contractual undiscounted cash flows of the Group’s financial liabilities, excluding the impact of netting agreements:
(vi) Capital risk management
The main objective of capital risk management is to ensure the Group operates as a going concern, meets debts as they fall due, maintains the best possible capital structure and reduces the cost of capital. Group capital consists of share capital, other reserves and retained earnings. To maintain or alter the capital structure, the Group has the ability to determine whether dividends are paid to shareholders, return capital or issue new shares, reduce or increase debt or sell assets. There has been no change in Group policies or objectives in relation to capital risk management since the prior year.
Orion Health
2015 Annual Report
081
Notes to the Financial StatementsSection 11
12: Corporate Governance Statement
SECTIONSECTION
Our Board and Management recognise the importance of good corporate governance and are committed to maintaining the highest standards of corporate behaviour and responsibility. To this end, we have developed a framework of rules and governance policies to ensure Orion Health meets international best practice standards.
In establishing this framework, the Board has observed applicable laws, the NZX Corporate Governance Best Practice Code (NZX Code) and the Corporate Governance Principles and Recommendations (3rd Edition) issued by the ASX Corporate Governance Council (ASX Principles). The ASX Principles set out eight fundamental principles of good corporate governance, which have been used as a framework for the presentation of this section of the Annual Report. In doing so, Orion Health’s compliance with the NZX Code is also addressed. The Board considers this approach maximises the transparency of our corporate governance practices for the benefit of shareholders and other stakeholders. This statement is current as at 31 March 2015, and has been approved by our Board.
We believe that the practices we have adopted follow all of the corporate governance recommendations of the NZX Code and the ASX Principles, unless stated below. We expect to follow all such recommendations in the 2016 financial year.
Further information and each of the individual policies and charters referred to below are available on our website at https://www.orionhealth.com/investors/corporate-governance/.
Lay solid foundations for management and oversight
The Board has adopted a Charter that records its commitment to best corporate governance practices. The Board Charter outlines our board governance processes, such as the election of the Chairman and the composition of the Board. It also outlines the role of the Board within Orion Health’s governance and management functions.
Having regard to its role, the Board directs, and supervises the management of, the business and affairs of Orion Health including, in particular:
- ensuring that our goals are clearly established, and that strategies are in place for achieving them (such strategies being expected to originate, in the first instance, from Management);
- establishing policies for strengthening our performance, including ensuring that Management is proactively seeking to build the business through innovation, initiative, technology, new products and the development of its business capital;
- monitoring the performance of Management;
- appointing the Chief Executive Officer, setting the terms of his or her employment contract and, where necessary, terminating the Chief Executive Officer’s employment with Orion Health;
- deciding on whatever steps are necessary to protect our financial position and the ability to meet debts and other obligations when they fall due, and ensuring that such steps are taken;
- ensuring that our financial statements are true and fair and otherwise conform with law;
- ensuring that we adhere to high standards of ethics and corporate behaviour;
- ensuring that we have appropriate risk management/regulatory compliance policies in place;
- using its best endeavours to familiarise itself with issues of concern to shareholders; and
- regularly evaluating economic, political, social and legal issues and any other external matters that may influence the development of the business or the interests of shareholders and, if appropriate, taking outside expert advice on these matters.
Orion Health
2015 Annual Report
082
Corporate Governance StatementSection 1226 . 05 . 2015
The Board formally schedules to meet face-to-face not less than six times during the financial year, including sessions to consider Orion Health’s strategic direction and business plans, with an additional five meetings scheduled by teleconference. Other meetings of the Board are held during the financial year, as necessary. Executives regularly attend Board meetings and are also available to be contacted by directors between meetings.
The governance and management functions are linked through the Chief Executive Officer. All Board authority conferred on Management is delegated through the Chief Executive Officer so that the authority and accountability of Management is considered to be the authority and accountability of the Chief Executive Officer so far as the Board is concerned. The Board must agree to the levels of sub-delegation immediately below the Chief Executive Officer.
The Group General Counsel of Orion Health, Luke Facer, performs the role of Company Secretary. As Company Secretary, he is accountable directly to the Board, through the Chairman, on matters to do with the proper functioning of the Board.
The Board critically evaluates its own performance, processes and procedures to ensure that they are not unduly complex and are designed to assist the Board in effectively fulfilling its role. This evaluation will be completed during the financial year ended 31 March 2016.
Additionally the Board evaluates, directly or through the Board Committees, the performance of its committees, individual directors and senior executives. Evaluations of senior executives were undertaken in the last reporting period. Evaluations of the Board Committees and individual non-executive directors were not undertaken in the last reporting period but will be completed during the financial year ended 31 March 2016.
The review will be conducted by the Board with the assistance of the People Development, Nominations and Remuneration Committee. The Chairman will interview each director to get individual views on Board dynamics, director performance and feedback to improve good governance and Board performance with the Chairman providing feedback to the full Board.
The review of the Chief Executive Officer’s performance is led by the Chairman in consultation with the Board. The performance of all other senior executives is reviewed by the Chief Executive Officer and reported to, and discussed by, the Board and the People Development, Nominations and Remuneration Committee. Performance reviews take place after the end of the financial year.
Structure the Board to add value
The number of directors is determined by the Board to ensure it is large enough to provide a range of knowledge, views and experience relevant to our business. Our constitution requires a minimum of three directors at all times. Generally, the number of directors will be between five and seven of which the majority will be non-executive.
As at 31 March 2015, the Board comprised six directors, consisting of four independent directors (being Andrew Ferrier, Roger France, Lester Levy and Paul Shearer) and two non-independent directors (being Ian McCrae and Neil Cullimore). The Board considers the independent directors to be independent in accordance with Box 2.1 of the ASX Principles.
The Board considers that a range of skills, experience, knowledge and backgrounds is required to effectively govern our business. To assist in identifying areas of focus and maintaining an appropriate experience mix, the Board developed a skills matrix. It is an important, but not the only, basis of criteria applying to director appointments. The Board considers skills and experience in marketing, finance, people development, public companies, the U.S. health industry and the information technology industry to be particularly relevant, and the Board values gender diversity.
Andrew Ferrier Chairman and Independent Director, appointed December 2011
Roger France Deputy Chairman and Independent Director, appointed February 2013
Ian McCrae Director and Chief Executive Officer, appointed March 2001
Neil Cullimore Non-Executive Director, appointed June 2009
Lester Levy Independent Director, appointed August 2014
Paul Shearer Independent Director, appointed February 2013 (adviser to the Board since 2006)
A biography of each director is set out on page 39 of this Annual Report.
The Board acknowledges and observes the relevant director rotation/retirement rules under the NZX Listing Rules and the ASX Listing Rules. Appropriate checks are undertaken prior to appointing a person and recommending that person for election as a director. These include checks as to the person’s character, experience, education, criminal record, bankruptcy history, fitness and propriety. Now that we are listed on the ASX and NZX Main Board, upon appointment, new directors will receive a letter of appointment and are given unfettered access to Management so as to ensure they are properly inducted into the Company. The Board Charter provides that the Board seeks to ensure that any new directors are appropriately introduced to Management and the business and that all directors are acquainted with relevant industry knowledge and receive copies of appropriate Company documents to enable them to perform their role. In the financial year ended 31 March 2015, the Board met 15 times and there were also separate meetings of the Board committees. The frequency of meetings was in large part due to our listing on the ASX and NZX Main Board and it is not expected that there will be this number of meetings for the financial year ended 31 March 2016. Minutes are taken of all Board and committee meetings.
Orion Health
2015 Annual Report
083
Corporate Governance StatementSection 12
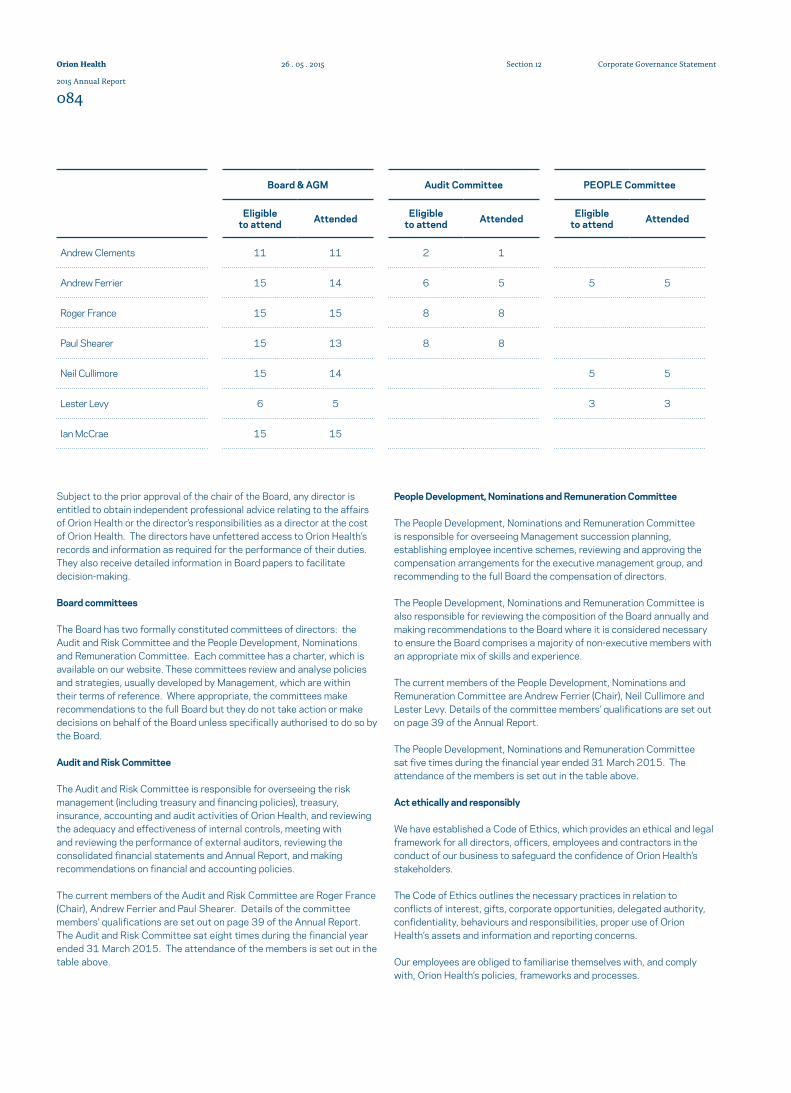
Board & AGM Audit Committee PEOPLE Committee
Eligible to attend Attended Eligible
to attend Attended Eligible to attend Attended
Andrew Clements 11 11 2 1
Andrew Ferrier 15 14 6 5 5 5
Roger France 15 15 8 8
Paul Shearer 15 13 8 8
Neil Cullimore 15 14 5 5
Lester Levy 6 5 3 3
Ian McCrae 15 15
Subject to the prior approval of the chair of the Board, any director is entitled to obtain independent professional advice relating to the affairs of Orion Health or the director’s responsibilities as a director at the cost of Orion Health. The directors have unfettered access to Orion Health’s records and information as required for the performance of their duties. They also receive detailed information in Board papers to facilitate decision-making.
Board committees
The Board has two formally constituted committees of directors: the Audit and Risk Committee and the People Development, Nominations and Remuneration Committee. Each committee has a charter, which is available on our website. These committees review and analyse policies and strategies, usually developed by Management, which are within their terms of reference. Where appropriate, the committees make recommendations to the full Board but they do not take action or make decisions on behalf of the Board unless specifically authorised to do so by the Board.
Audit and Risk Committee
The Audit and Risk Committee is responsible for overseeing the risk management (including treasury and financing policies), treasury, insurance, accounting and audit activities of Orion Health, and reviewing the adequacy and effectiveness of internal controls, meeting with and reviewing the performance of external auditors, reviewing the consolidated financial statements and Annual Report, and making recommendations on financial and accounting policies.
The current members of the Audit and Risk Committee are Roger France (Chair), Andrew Ferrier and Paul Shearer. Details of the committee members’ qualifications are set out on page 39 of the Annual Report. The Audit and Risk Committee sat eight times during the financial year ended 31 March 2015. The attendance of the members is set out in the table above.
People Development, Nominations and Remuneration Committee
The People Development, Nominations and Remuneration Committee is responsible for overseeing Management succession planning, establishing employee incentive schemes, reviewing and approving the compensation arrangements for the executive management group, and recommending to the full Board the compensation of directors.
The People Development, Nominations and Remuneration Committee is also responsible for reviewing the composition of the Board annually and making recommendations to the Board where it is considered necessary to ensure the Board comprises a majority of non-executive members with an appropriate mix of skills and experience.
The current members of the People Development, Nominations and Remuneration Committee are Andrew Ferrier (Chair), Neil Cullimore and Lester Levy. Details of the committee members’ qualifications are set out on page 39 of the Annual Report.
The People Development, Nominations and Remuneration Committee sat five times during the financial year ended 31 March 2015. The attendance of the members is set out in the table above.
Act ethically and responsibly
We have established a Code of Ethics, which provides an ethical and legal framework for all directors, officers, employees and contractors in the conduct of our business to safeguard the confidence of Orion Health’s stakeholders.
The Code of Ethics outlines the necessary practices in relation to conflicts of interest, gifts, corporate opportunities, delegated authority, confidentiality, behaviours and responsibilities, proper use of Orion Health’s assets and information and reporting concerns.
Our employees are obliged to familiarise themselves with, and comply with, Orion Health’s policies, frameworks and processes.
Orion Health
2015 Annual Report
084
Corporate Governance StatementSection 1226 . 05 . 2015

Any employee who becomes aware of a possible breach of this code must report the breach to their manager, a member of the executive leadership team, a member of the Board, or a senior team leader in the People team, as appropriate.
We have adopted a Diversity Policy to outline our commitment to creating a workplace that applies the principles of diversity and equal employment opportunities. This policy involves the identification and elimination of barriers that cause or perpetuate inequality in the workplace. We are committed to embracing diversity as essential to the achievement of our long-term strategy and commercial success.
Diversity at Orion Health refers to characteristics of individuals and includes factors such as gender, age, marital status, religious belief, ethical belief, colour, race, ethnic or national origin, disability, political opinion, employment status, family status or sexual orientation.
The relevance and effectiveness of the policy is reviewed by the Board at least once per year, and includes consideration of the following matters:
- the effectiveness and relevance of the policy;
- Orion Health’s workforce composition and key insights and activities taken to ensure strong alignment to Orion Health’s approach and practical application; and
- provide an evaluation of our performance with respect to the policy, including approaches and measurable objectives, and the progress towards achieving those objectives.
As at 31 March 2015, all six members of the Board were male (no change from the previous financial year) and three members of the executive team were women (no change from the previous financial year). Women made up 28 per cent of all permanent employees across Orion Health as at 31 March 2015.
The Board is satisfied with the initiatives being implemented by Orion Health and its performance with respect to its diversity policy. The Board recognises the need to continue to strive for enhanced female representation in a male dominated industry and is actively seeking to introduce at least one female Board member. Having only listed on the NZX Main Board and the ASX in November 2014, the Board is currently in the process of considering and setting appropriate measurable objectives for achieving greater gender diversity at Orion Health.
Safeguard integrity in financial reporting
The Board is committed to a transparent system for auditing and reporting of our financial performance.
The Audit and Risk Committee is responsible for financial risk management oversight and must have at least three members. At least one member of the Committee must have a financial or accounting background and other members should have a working knowledge of finance and accounting principles and practices. The Audit and Risk Committee is subject to a formal charter available on our website, which sets out the roles and responsibilities of the Audit and Risk Committee.
The Audit and Risk Committee meets at least three times a year, and meetings are scheduled to ensure timely review of the interim and year-end financial statements.
As set out in the charter, the Audit and Risk Committee must maintain direct lines of communication with the auditors, Chief Executive Officer, Chief Financial Officer and Management of Orion Health, as deemed necessary by the Committee. The Chief Executive Officer and Chief Financial Officer are responsible for drawing to the Committee’s immediate attention any material matter that relates to the financial condition of Orion Health, any material breakdown on internal controls, and any material event of fraud or malpractice. In connection with our financial statements for each financial period during the year ended 31 March 2015, our Chief Executive Officer and Chief Financial Officer provided the Board with declarations that, in their opinion:
- the financial records of the Orion Health have been properly maintained;
- the financial statements comply with the appropriate accounting standards and give a true and fair view of the financial position and performance of Orion Health; and
- their opinion was formed on the basis of a sound system of risk management and internal control, which is operating effectively.
Our auditors will attend our annual shareholders’ meeting to assist in answering questions from shareholders.
31 March 2015 (2014)
Male Female
Board 100% (100%) 0% (0%)
Senior Executive Team 85% (85%) 15% (15%)
All Employees 72% (71%) 28% (29%)
Orion Health
2015 Annual Report
085
Corporate Governance StatementSection 12
Make timely and balanced disclosure
We are subject to the disclosure requirements of securities and other laws in New Zealand and Australia and are required to comply with the NZX Main Board and ASX Listing Rules.
We have adopted a Continuous Disclosure Policy under which we must immediately notify the NZX and ASX of material information (unless an exception applies).
The Continuous Disclosure Policy supports our commitment to the continuous disclosure obligations imposed by law and effective communication to the market. This sets out Orion Health’s practices with respect to the prevention of a “false market”, identifying material information, exceptions to disclosure obligations, approval of disclosures, release of information to the NZX and ASX, shareholders, analysts and media, and the publication of releases and disclosures.
The Board has appointed Luke Facer, Group General Counsel and Company Secretary, as a Disclosure Officer. The Board has also appointed a Disclosure Committee, made up of:
- the Chairman of the Board;
- the chair of the Audit and Risk Committee;
- the Chief Executive Officer;
- the Chief Operating Officer; and
- the Disclosure Officer.
The Disclosure Committee is responsible for ensuring we comply with the Continuous Disclosure Policy and the continuous disclosure obligations. In addition to ensuring that Orion Health complies with its ongoing disclosure obligations, at each Board meeting directors formally consider whether there is relevant material information that should be disclosed to the market.
Respect the rights of shareholders
The Board encourages a high level of communication with shareholders and the market generally. We have adopted a Continuous Disclosure Policy as well as a Shareholder Communication Policy, which are designed to promote effective communication with the NZX, ASX, shareholders and other stakeholders.
We recognise that shareholders and other stakeholders are entitled to be informed in a timely and readily accessible manner of all major developments affecting Orion Health.
At each general meeting of Orion Health, shareholders have the opportunity to ask questions of directors. Senior Management and our auditors will also attend general meetings to assist in answering questions from shareholders.
Recognise and manage risk
The Audit and Risk Committee Charter seeks to assist the Audit and Risk Committee, and through it the Board, in discharging their responsibilities to exercise due care, diligence and skill in relation to oversight of:
- the quality and integrity of external financial reporting;
- the independence and performance of the external auditors;
- the effectiveness and appropriateness of the risk management framework; and
- the adequacy of the internal control system for financial reporting integrity.
As stated in the Audit and Risk Committee Charter, the Audit and Risk Committee must meet not less than three times a year, and meetings will be scheduled to ensure timely review of the interim and year-end financial statements.
The Audit and Risk Committee must meet with the external auditors on a regular basis, as appropriate, but no less than annually and for at least part of that meeting, no executive directors or other employees of Orion Health will be present.
Any member of the Audit and Risk Committee, the Company Secretary, the Chief Executive Officer, the Chief Financial O fficer, or the auditors may request a meeting if they consider it necessary.
Having only listed on the NZX Main Board and the ASX in November 2014, Orion Health does not currently have a dedicated internal auditor but as part of the evaluation and continuous improvement of the effectiveness of our risk management and internal control processes, we have commenced recruitment of a dedicated internal auditor to lead the internal function going forward.
The Audit and Risk Committee reviews the risk management framework annually and a review of this took place in the financial year ended 31 March 2015.
The Board considers that a number of risks, across various risk categories, have the potential to impact upon the economic, environmental and social sustainability of the organisation in one way or another. Details of these types of risk and the way in which they are managed are set out in our Prospectus at pages 145 – 154, a copy of which can be found at https://www.orionhealth.com/investors/reports-and-presentations/downloads/orionhealth_prospectus.pdf?d=20141127.
The Audit and Risk Committee is provided with copies of all reports from the external auditors to Management of Orion Health.
Orion Health
2015 Annual Report
086
Corporate Governance StatementSection 1226 . 05 . 2015
Remunerate fairly and responsibly
The People Development, Nominations and Remuneration Committee is responsible for overseeing Management succession planning, establishing employee incentive schemes, reviewing and approving the compensation arrangements for the executive management group, and recommending to the full Board the compensation of directors.
The People Development, Nominations and Remuneration Committee’s objectives in relation to executive directors and other senior executives are to maintain a remuneration policy that:
- supports a performance culture that is based on merit, and differentiates and rewards excellent performance, both in the short and long-term, and recognises our values;
- enables Orion Health to attract and retain executives, and motivate them to achieve results with integrity and fairness;
- balances the mix of fixed compensation and variable compensation to appropriately reflect the value and responsibility of the role performed day to day, and to influence appropriate behaviours and actions; and
- takes into account our long-term performance, in order to create sustainable value for our shareholders.
Our remuneration policy is to pay close to the market median for employees who are fully competent in their roles. This applies to both fixed and variable remuneration components.
Our policy on setting remuneration is based on a market pricing approach. This involves evaluating individual roles and matching them to the appropriate role in the market. We partner with local and global remuneration data providers to obtain the most relevant and extensive market data. The data we benchmark to is continuously updated to ensure we are always aligned to current market remuneration levels. Performance-based remuneration takes individual and corporate performance into account and is linked to clearly specified performance targets. These targets are aligned to Orion Health’s short and long-term performance objectives and are appropriate to the Company’s circumstances, goals and objectives.
For non-executive directors, we review the individuals’ remuneration periodically and benchmark this against market data specific to board directors. The structure of non-executive directors’ remuneration is clearly distinguished from that of executive directors and senior management. Non-executive directors do not receive performance-based remuneration and the level of fixed remuneration that they receive reflects the time commitments and responsibilities of their role.
The members of the Committee (a majority of which are independent) and the attendance at meetings for the financial year ended 31 March 2015 are described on page 84.
We have introduced a policy in relation to our equity-based remuneration scheme that participants are not permitted to enter into transactions (whether through the use of derivatives or otherwise) which limit the economic risk of participating in the scheme.
Orion Health
2015 Annual Report
087
Corporate Governance StatementSection 12

Orion Health
2015 Annual Report
088
Corporate Governance StatementSection 1226 . 05 . 2015
REGULATORY DISCLOSURES
Stock exchange listings
Orion Health’s shares were listed on the NZX Main Board and the ASX on 26 November 2014.
There is no current on-market buy-back of Orion Health’s ordinary shares.
Use of cash and cash equivalents
In accordance with ASX Listing Rule 4.10.19, the Board has determined that Orion Health has used the cash and cash equivalents that it had at 26 November 2014 in a way consistent with its business objectives for the period from the date of admission to 31 March 2015.
Indemnity and insurance
Pursuant to section 162 of the Companies Act 1993 and Orion Health’s constitution, Orion Health has granted certain indemnities to the directors and specified employees of Orion Health or any of its related companies in respect of liability and legal costs incurred by those directors and specified employees in their capacity as directors and/or employees of Orion Health or any of its related companies.
Orion Health has also arranged a policy of Directors’ and Officers’ Liability Insurance, which insures those persons indemnified for certain liabilities and costs.
Entries recorded in the Interests Register
Orion Health maintains an Interests Register in accordance with the Companies Act 1993 and the Financial Markets Conduct Act 2013. The following are particulars of entries made in the Interests Register for the period 1 April 2014 to 31 March 2015.
Directors’ interests:
Directors disclosed interests in the following entities pursuant to section 140 of the Companies Act 1993 during the year ended 31 March 2015:
13: Shareholder Information
SECTIONSECTION
Orion Health
2015 Annual Report
089
Corporate Governance StatementSection 12
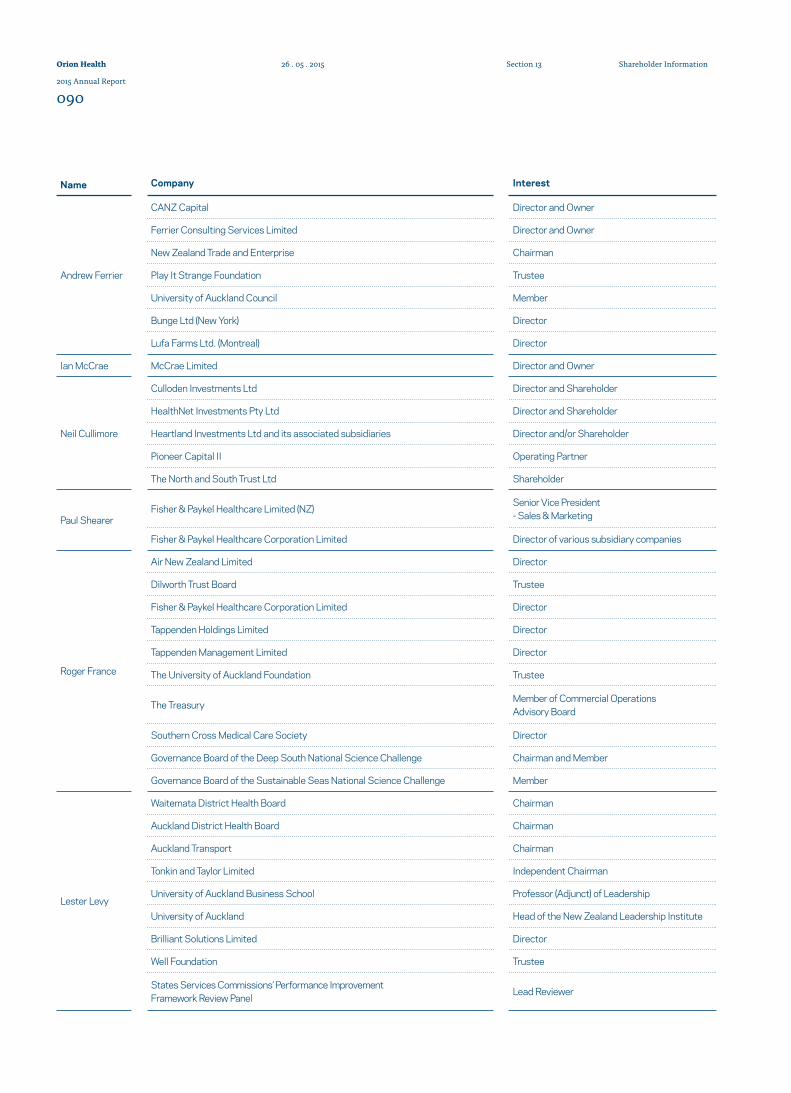
Name Company Interest
Andrew Ferrier
CANZ Capital Director and Owner
Ferrier Consulting Services Limited Director and Owner
New Zealand Trade and Enterprise Chairman
Play It Strange Foundation Trustee
University of Auckland Council Member
Bunge Ltd (New York) Director
Lufa Farms Ltd. (Montreal) Director
Ian McCrae McCrae Limited Director and Owner
Neil Cullimore
Culloden Investments Ltd Director and Shareholder
HealthNet Investments Pty Ltd Director and Shareholder
Heartland Investments Ltd and its associated subsidiaries Director and/or Shareholder
Pioneer Capital II Operating Partner
The North and South Trust Ltd Shareholder
Paul ShearerFisher & Paykel Healthcare Limited (NZ) Senior Vice President
- Sales & Marketing
Fisher & Paykel Healthcare Corporation Limited Director of various subsidiary companies
Roger France
Air New Zealand Limited Director
Dilworth Trust Board Trustee
Fisher & Paykel Healthcare Corporation Limited Director
Tappenden Holdings Limited Director
Tappenden Management Limited Director
The University of Auckland Foundation Trustee
The Treasury Member of Commercial Operations Advisory Board
Southern Cross Medical Care Society Director
Governance Board of the Deep South National Science Challenge Chairman and Member
Governance Board of the Sustainable Seas National Science Challenge Member
Lester Levy
Waitemata District Health Board Chairman
Auckland District Health Board Chairman
Auckland Transport Chairman
Tonkin and Taylor Limited Independent Chairman
University of Auckland Business School Professor (Adjunct) of Leadership
University of Auckland Head of the New Zealand Leadership Institute
Brilliant Solutions Limited Director
Well Foundation Trustee
States Services Commissions’ Performance Improvement Framework Review Panel Lead Reviewer
Orion Health
2015 Annual Report
090
Shareholder InformationSection 1326 . 05 . 2015
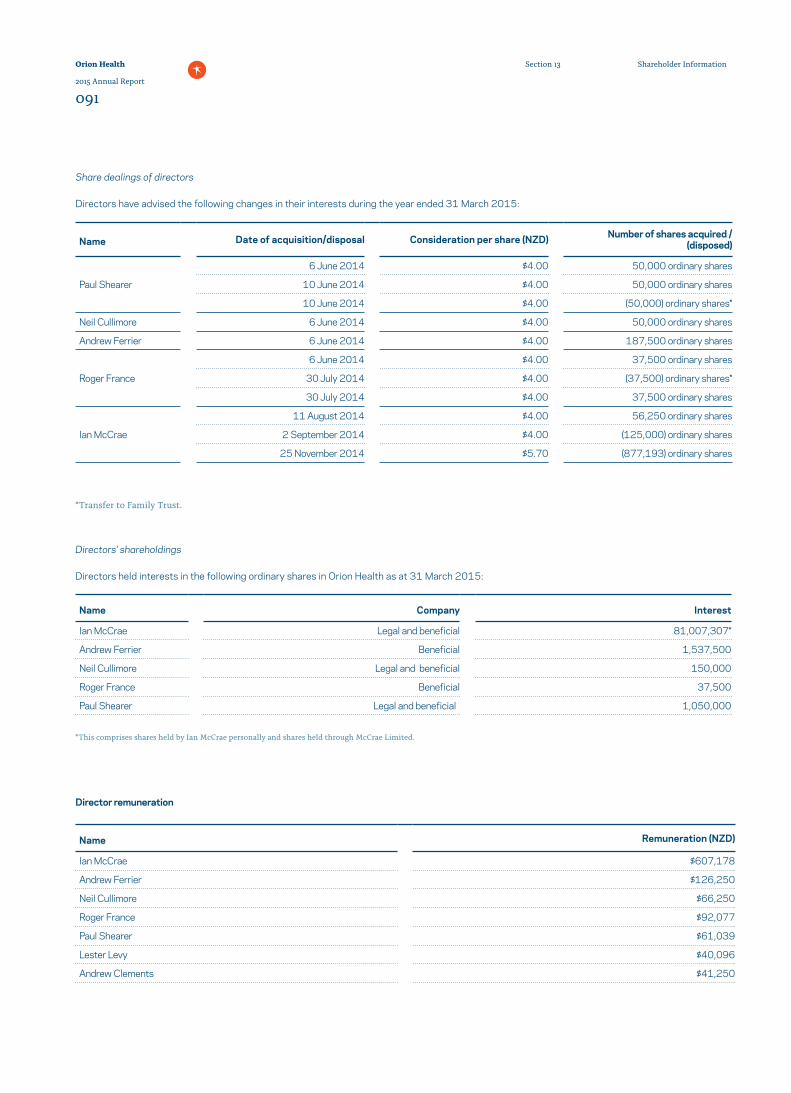
Share dealings of directors
Directors have advised the following changes in their interests during the year ended 31 March 2015:
Name Date of acquisition/disposal Consideration per share (NZD) Number of shares acquired /(disposed)
Paul Shearer
6 June 2014 $4.00 50,000 ordinary shares
10 June 2014 $4.00 50,000 ordinary shares
10 June 2014 $4.00 (50,000) ordinary shares*
Neil Cullimore 6 June 2014 $4.00 50,000 ordinary shares
Andrew Ferrier 6 June 2014 $4.00 187,500 ordinary shares
Roger France
6 June 2014 $4.00 37,500 ordinary shares
30 July 2014 $4.00 (37,500) ordinary shares*
30 July 2014 $4.00 37,500 ordinary shares
Ian McCrae
11 August 2014 $4.00 56,250 ordinary shares
2 September 2014 $4.00 (125,000) ordinary shares
25 November 2014 $5.70 (877,193) ordinary shares
*Transfer to Family Trust.
Directors’ shareholdings
Directors held interests in the following ordinary shares in Orion Health as at 31 March 2015:
*This comprises shares held by Ian McCrae personally and shares held through McCrae Limited.
Name Company Interest
Ian McCrae Legal and beneficial 81,007,307*
Andrew Ferrier Beneficial 1,537,500
Neil Cullimore Legal and beneficial 150,000
Roger France Beneficial 37,500
Paul Shearer Legal and beneficial 1,050,000
Name Remuneration (NZD)
Ian McCrae $607,178
Andrew Ferrier $126,250
Neil Cullimore $66,250
Roger France $92,077
Paul Shearer $61,039
Lester Levy $40,096
Andrew Clements $41,250
Director remuneration
Orion Health
2015 Annual Report
091
Shareholder InformationSection 13
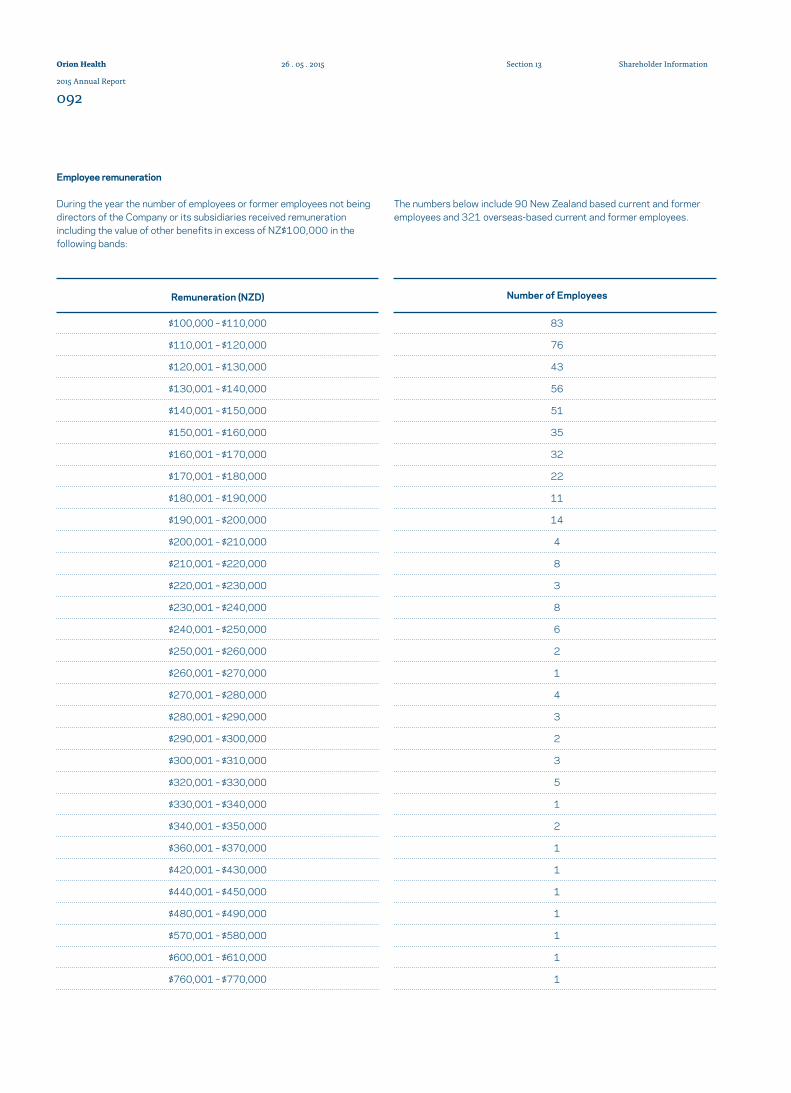
Remuneration (NZD) Number of Employees
$100,000 – $110,000 83
$110,001 – $120,000 76
$120,001 – $130,000 43
$130,001 – $140,000 56
$140,001 – $150,000 51
$150,001 – $160,000 35
$160,001 – $170,000 32
$170,001 – $180,000 22
$180,001 – $190,000 11
$190,001 – $200,000 14
$200,001 – $210,000 4
$210,001 – $220,000 8
$220,001 – $230,000 3
$230,001 – $240,000 8
$240,001 – $250,000 6
$250,001 – $260,000 2
$260,001 – $270,000 1
$270,001 – $280,000 4
$280,001 – $290,000 3
$290,001 – $300,000 2
$300,001 – $310,000 3
$320,001 – $330,000 5
$330,001 – $340,000 1
$340,001 – $350,000 2
$360,001 – $370,000 1
$420,001 – $430,000 1
$440,001 – $450,000 1
$480,001 – $490,000 1
$570,001 – $580,000 1
$600,001 – $610,000 1
$760,001 – $770,000 1
Employee remuneration
During the year the number of employees or former employees not being directors of the Company or its subsidiaries received remuneration including the value of other benefits in excess of NZ$100,000 in the following bands:
The numbers below include 90 New Zealand based current and former employees and 321 overseas-based current and former employees.
Orion Health
2015 Annual Report
092
Shareholder InformationSection 1326 . 05 . 2015
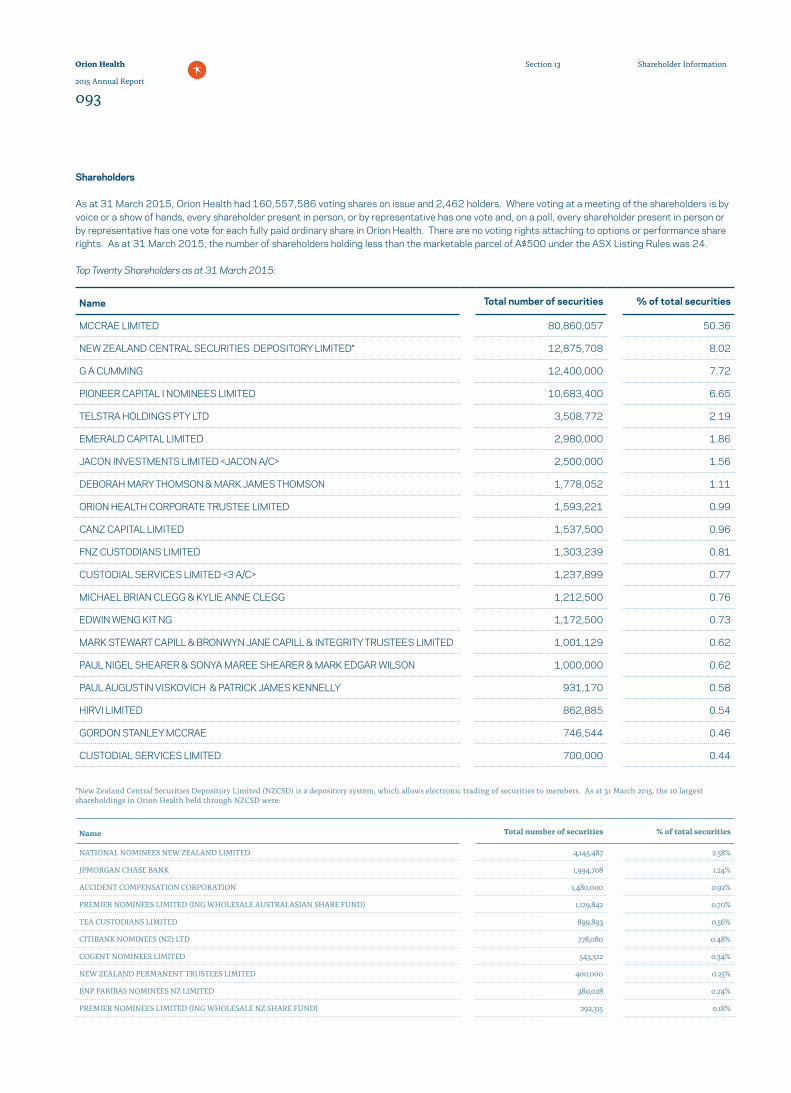
Name Total number of securities % of total securities
MCCRAE LIMITED 80,860,057 50.36
NEW ZEALAND CENTRAL SECURITIES DEPOSITORY LIMITED* 12,875,708 8.02
G A CUMMING 12,400,000 7.72
PIONEER CAPITAL I NOMINEES LIMITED 10,683,400 6.65
TELSTRA HOLDINGS PTY LTD 3,508,772 2.19
EMERALD CAPITAL LIMITED 2,980,000 1.86
JACON INVESTMENTS LIMITED <JACON A/C> 2,500,000 1.56
DEBORAH MARY THOMSON & MARK JAMES THOMSON 1,778,052 1.11
ORION HEALTH CORPORATE TRUSTEE LIMITED 1,593,221 0.99
CANZ CAPITAL LIMITED 1,537,500 0.96
FNZ CUSTODIANS LIMITED 1,303,239 0.81
CUSTODIAL SERVICES LIMITED <3 A/C> 1,237,899 0.77
MICHAEL BRIAN CLEGG & KYLIE ANNE CLEGG 1,212,500 0.76
EDWIN WENG KIT NG 1,172,500 0.73
MARK STEWART CAPILL & BRONWYN JANE CAPILL & INTEGRITY TRUSTEES LIMITED 1,001,129 0.62
PAUL NIGEL SHEARER & SONYA MAREE SHEARER & MARK EDGAR WILSON 1,000,000 0.62
PAUL AUGUSTIN VISKOVICH & PATRICK JAMES KENNELLY 931,170 0.58
HIRVI LIMITED 862,885 0.54
GORDON STANLEY MCCRAE 746,544 0.46
CUSTODIAL SERVICES LIMITED 700,000 0.44
Shareholders
As at 31 March 2015, Orion Health had 160,557,586 voting shares on issue and 2,462 holders. Where voting at a meeting of the shareholders is by voice or a show of hands, every shareholder present in person, or by representative has one vote and, on a poll, every shareholder present in person or by representative has one vote for each fully paid ordinary share in Orion Health. There are no voting rights attaching to options or performance share rights. As at 31 March 2015, the number of shareholders holding less than the marketable parcel of A$500 under the ASX Listing Rules was 24.
Top Twenty Shareholders as at 31 March 2015:
Name Total number of securities % of total securities
NATIONAL NOMINEES NEW ZEALAND LIMITED 4,145,487 2.58%
JPMORGAN CHASE BANK 1,994,708 1.24%
ACCIDENT COMPENSATION CORPORATION 1,480,000 0.92%
PREMIER NOMINEES LIMITED (ING WHOLESALE AUSTRALASIAN SHARE FUND) 1,129,842 0.70%
TEA CUSTODIANS LIMITED 899,893 0.56%
CITIBANK NOMINEES (NZ) LTD 778,080 0.48%
COGENT NOMINEES LIMITED 543,322 0.34%
NEW ZEALAND PERMANENT TRUSTEES LIMITED 400,000 0.25%
BNP PARIBAS NOMINEES NZ LIMITED 380,028 0.24%
PREMIER NOMINEES LIMITED (ING WHOLESALE NZ SHARE FUND) 292,315 0.18%
*New Zealand Central Securities Depository Limited (NZCSD) is a depository system, which allows electronic trading of securities to members. As at 31 March 2015, the 10 largest shareholdings in Orion Health held through NZCSD were:
Orion Health
2015 Annual Report
093
Shareholder InformationSection 13
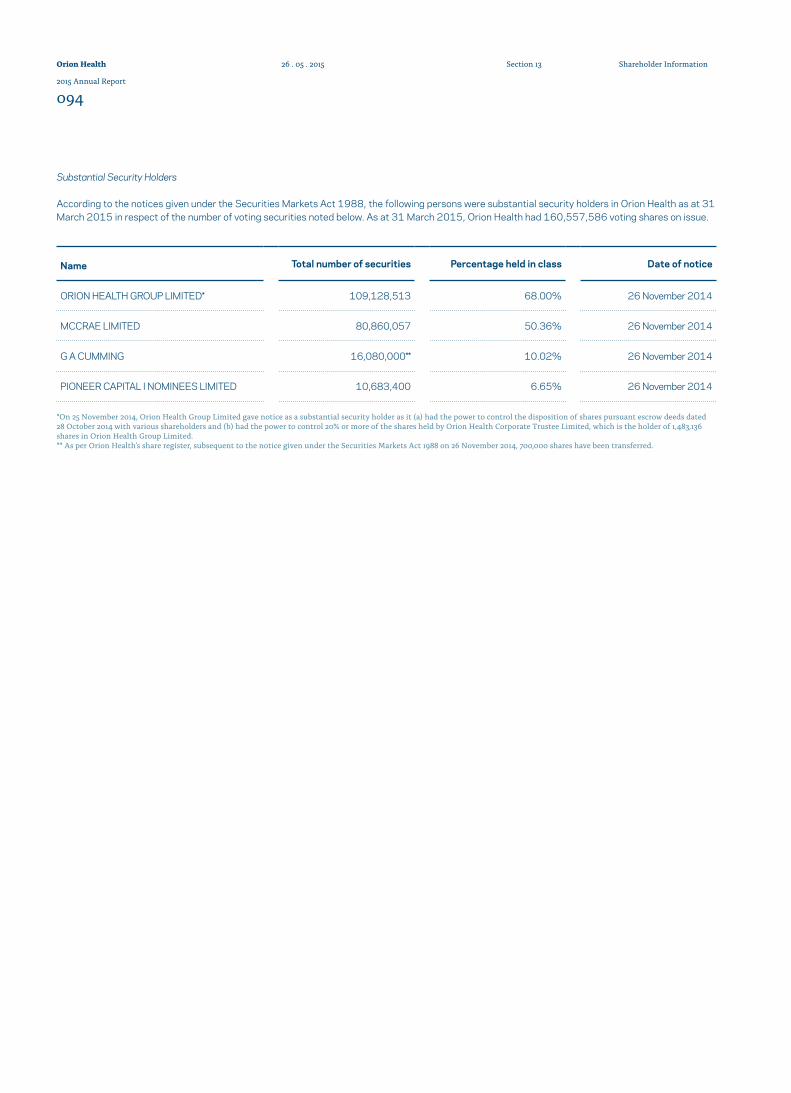
Name Total number of securities Percentage held in class Date of notice
ORION HEALTH GROUP LIMITED* 109,128,513 68.00% 26 November 2014
MCCRAE LIMITED 80,860,057 50.36% 26 November 2014
G A CUMMING 16,080,000** 10.02% 26 November 2014
PIONEER CAPITAL I NOMINEES LIMITED 10,683,400 6.65% 26 November 2014
Substantial Security Holders
According to the notices given under the Securities Markets Act 1988, the following persons were substantial security holders in Orion Health as at 31 March 2015 in respect of the number of voting securities noted below. As at 31 March 2015, Orion Health had 160,557,586 voting shares on issue.
*On 25 November 2014, Orion Health Group Limited gave notice as a substantial security holder as it (a) had the power to control the disposition of shares pursuant escrow deeds dated 28 October 2014 with various shareholders and (b) had the power to control 20% or more of the shares held by Orion Health Corporate Trustee Limited, which is the holder of 1,483,136 shares in Orion Health Group Limited. ** As per Orion Health’s share register, subsequent to the notice given under the Securities Markets Act 1988 on 26 November 2014, 700,000 shares have been transferred.
Orion Health
2015 Annual Report
094
Shareholder InformationSection 1326 . 05 . 2015
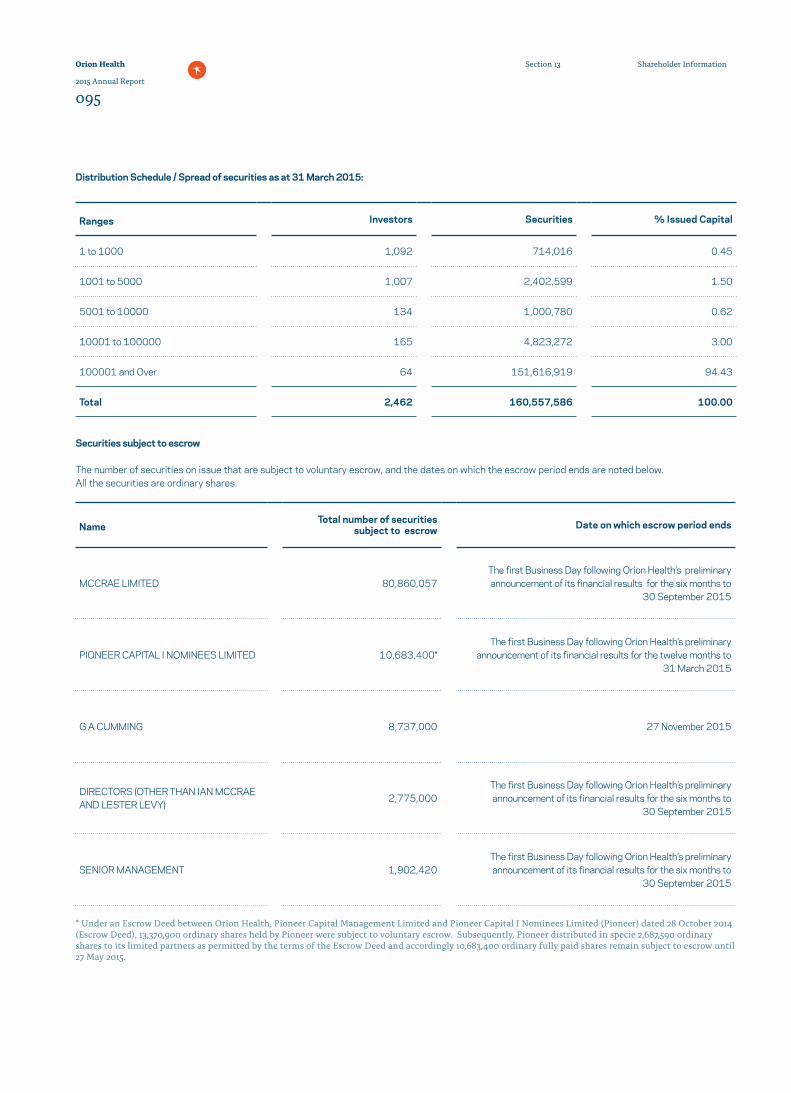
NameTotal number of securities
subject to escrow Date on which escrow period ends
MCCRAE LIMITED 80,860,057 The first Business Day following Orion Health’s preliminary announcement of its financial results for the six months to
30 September 2015
PIONEER CAPITAL I NOMINEES LIMITED 10,683,400*The first Business Day following Orion Health’s preliminary
announcement of its financial results for the twelve months to 31 March 2015
G A CUMMING 8,737,000 27 November 2015
DIRECTORS (OTHER THAN IAN MCCRAE AND LESTER LEVY) 2,775,000
The first Business Day following Orion Health’s preliminary announcement of its financial results for the six months to
30 September 2015
SENIOR MANAGEMENT 1,902,420The first Business Day following Orion Health’s preliminary announcement of its financial results for the six months to
30 September 2015
Ranges Investors Securities % Issued Capital
1 to 1000 1,092 714,016 0.45
1001 to 5000 1,007 2,402,599 1.50
5001 to 10000 134 1,000,780 0.62
10001 to 100000 165 4,823,272 3.00
100001 and Over 64 151,616,919 94.43
Total 2,462 160,557,586 100.00
Securities subject to escrow
The number of securities on issue that are subject to voluntary escrow, and the dates on which the escrow period ends are noted below. All the securities are ordinary shares.
Distribution Schedule / Spread of securities as at 31 March 2015:
* Under an Escrow Deed between Orion Health, Pioneer Capital Management Limited and Pioneer Capital I Nominees Limited (Pioneer) dated 28 October 2014 (Escrow Deed), 13,370,900 ordinary shares held by Pioneer were subject to voluntary escrow. Subsequently, Pioneer distributed in specie 2,687,590 ordinary shares to its limited partners as permitted by the terms of the Escrow Deed and accordingly 10,683,400 ordinary fully paid shares remain subject to escrow until 27 May 2015.
Orion Health
2015 Annual Report
095
Shareholder InformationSection 13

Waivers
Orion Health had no NZX waivers granted or published by NZX within or relied upon in the 12 months ending 31 March 2015.
Options
There were eight individuals holding a total of 415,350 restricted stock units issued by Orion Health under its employee share incentive schemes as at 31 March 2015.
Disciplinary action taken by the NZSX, ASX or the Financial Markets Authority (FMA)
None of the NZSX, the ASX or the FMA has taken any disciplinary action against Orion Health during the financial year ending 31 March 2015.
Credit rating
Orion Health does not currently have an external credit rating status.
Subsidiary company directors
Directors of Orion Health’s subsidiaries do not receive any remuneration or other benefits in respect of their appointments. The remuneration and other benefits of any such directors who are employees of the group totalling $100,000 or more during the year ended 31 March 2015 are included in the relevant bandings for remuneration disclosed on page 92 of this Annual Report.
The following people held office as directors of subsidiary companies at 31 March 2015:
Ian McCrae
Orchestral Developments Limited Orion Systems International Limited Orion Health Properties Limited Orchestral Developments International Limited Orion Health Asia Pacific Limited Orion Health Ltd Orion Health Asia Holding Ltd Orion Health Services Ltd Orion Health China Limited Orion Health K.K. Orion Health Inc. Orion Health SAS Orion Health S.L.U. Orion Health Systems FZ-LLC
Neil Cullimore
Orion Heath Properties Limited Orion Health Corporate Trustee Limited
Lester Levy
Orion Health Corporate Trustee Limited
Rodney Hyde
Orion Health Pty. Limited Orion Health Limited (Canada) Orion Health Software Technology Consulting (Shenzhen) Co., Limited Orion Health Limited (Thailand) Orion Saglik ve Bilgi Sistemleri Limited Sirketi Orion Health Philippines Inc.
Luke Facer
Orion Health Pte. Limited Orion Health Pty. Limited Orion Health Limited (Canada) Orion Health Software Technology Consulting (Shenzhen) Co., Limited Orion Saglik ve Bilgi Sistemleri Limited Sirketi Orion Health Philippines Inc.
Andrew van Dort
Orion Health Pte. Limited
Chris Stephens
Orion Health Pty. Limited
Gary Folker
Orion Health Limited (Canada)
Local directors
Due to the requirement in a number of jurisdictions to have a local director, the following individuals who are not employees of the Orion Health group acted as directors at 31 March 2015:
Yuichi Hirokawa - Orion Health K.K. Tay Chee Wah – Orion Health Pte. Limited Chan Wan Mei – Orion Health Pte. Limited Christine Yu – Orion Health Philippines Inc. Alejandro Yu –Orion Health Philippines Inc. Paulo Villareal – Orion Health Philippines Inc.
Former directors
The following individuals ceased to be directors of Orion Health or its subsidiaries during the period from 1 April 2014 to 31 March 2015:
Woo May Poh – resigned as a director of Orion Health Pte. Limited (Singapore) on 30 June 2014. Andrew Clements – resigned as a director of Orion Health and Orion Health Corporate Trustee Limited on 22 September 2014.Ian McCrae – resigned as a director of Orion Health Pte Limited (Singapore) on 2 October 2014.Koleen Ocampo – resigned as a director of Orion Health Philippines Inc. on 18 March 2015.Luke Facer – ceased to be a director of Orion Health Hosting Limited on 13 October 2015 when the company was de-registered.
Orion Health
2015 Annual Report
096
Shareholder InformationSection 1326 . 05 . 2015
Orion Health
2015 Annual Report
097
Shareholder InformationSection 13

Orion Health
2015 Annual Report
098
Shareholder InformationSection 1326 . 05 . 2015
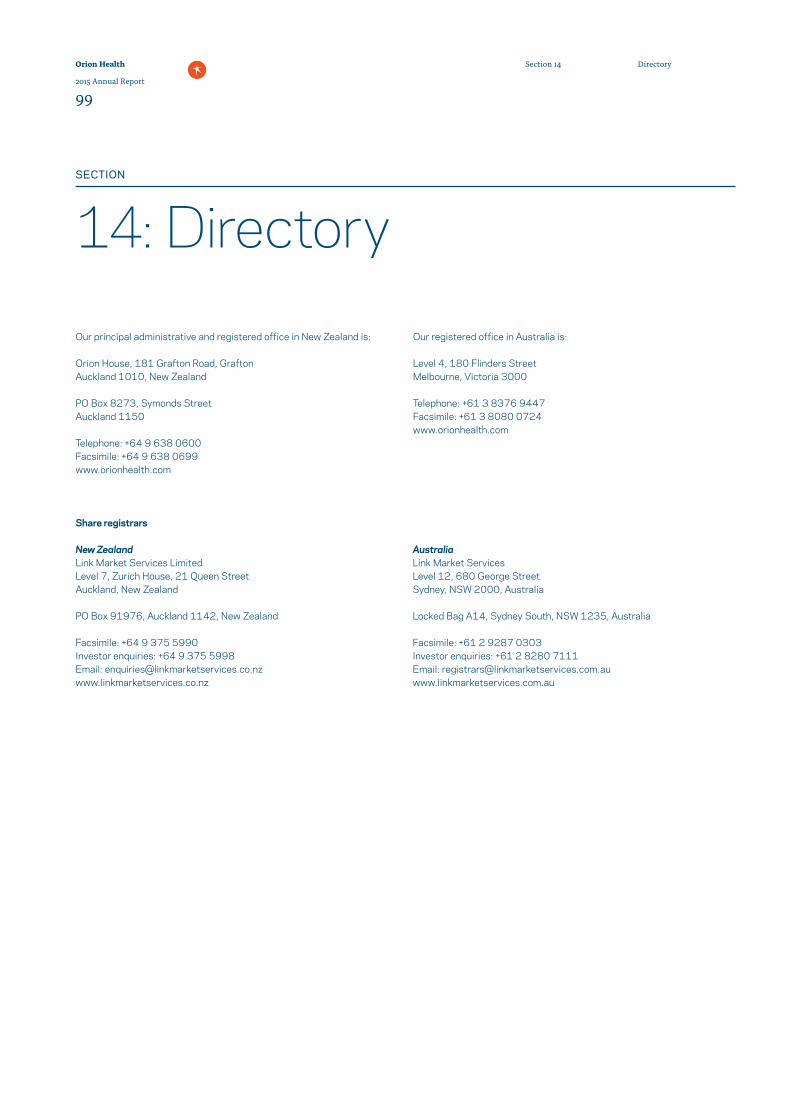
Our principal administrative and registered office in New Zealand is:
Orion House, 181 Grafton Road, Grafton Auckland 1010, New Zealand
PO Box 8273, Symonds Street Auckland 1150
Telephone: +64 9 638 0600 Facsimile: +64 9 638 0699 www.orionhealth.com
Our registered office in Australia is:
Level 4, 180 Flinders Street Melbourne, Victoria 3000
Telephone: +61 3 8376 9447 Facsimile: +61 3 8080 0724 www.orionhealth.com
14: DirectorySECTION
Share registrars
New Zealand Link Market Services Limited Level 7, Zurich House, 21 Queen Street Auckland, New Zealand
PO Box 91976, Auckland 1142, New Zealand
Facsimile: +64 9 375 5990 Investor enquiries: +64 9 375 5998 Email: [email protected] www.linkmarketservices.co.nz
Australia Link Market Services Level 12, 680 George Street Sydney, NSW 2000, Australia
Locked Bag A14, Sydney South, NSW 1235, Australia
Facsimile: +61 2 9287 0303 Investor enquiries: +61 2 8280 7111 Email: [email protected] www.linkmarketservices.com.au
Orion Health
2015 Annual Report
99
DirectorySection 14