Page 1
QUICKSILVER CAUCUS … QUICKSILVER CAUCUS … QUICKSILVER CAUCUS
…QUICKSILVER CAUCUS … QUICKSILVER CAUCUS … QUICKSILVER CAUCUS
QUICKSILVER CAUCUS … QUICKSILVER CAUCUS … QUICKSILVER CAUCUS
…QUICKSILVER CAUCUS … QUICKSILVER CAUCUS … QUICKSILVER CAUCUS
QUICKSILVER CAUCUS … QUICKSILVER CAUCUS … QUICKSILVER CAUCUS
…QUICKSILVER CAUCUS … QUICKSILVER CAUCUS … QUICKSILVER CAUCUS
QUICKSILVER CAUCUS … QUICKSILVER CAUCUS … QUICKSILVER CAUCUS
…QUICKSILVER CAUCUS … QUICKSILVER CAUCUS … QUICKSILVER CAUCUS
QUICKSILVER CAUCUS … QUICKSILVER CAUCUS … QUICKSILVER CAUCUS
…QUICKSILVER CAUCUS … QUICKSILVER CAUCUS … QUICKSILVER CAUCUS
QUICKSILVER CAUCUS … QUICKSILVER CAUCUS … QUICKSILVER CAUCUS
…QUICKSILVER CAUCUS … QUICKSILVER CAUCUS … QUICKSILVER CAUCUS
QUICKSILVER CAUCUS … QUICKSILVER CAUCUS … QUICKSILVER CAUCUS
…QUICKSILVER CAUCUS … QUICKSILVER CAUCUS … QUICKSILVER CAUCUS
QUICKSILVER CAUCUS … QUICKSILVER CAUCUS … QUICKSILVER CAUCUS
…QUICKSILVER CAUCUS … QUICKSILVER CAUCUS … QUICKSILVER CAUCUS
QUICKSILVER CAUCUS … QUICKSILVER CAUCUS … QUICKSILVER CAUCUS
…QUICKSILVER CAUCUS … QUICKSILVER CAUCUS … QUICKSILVER CAUCUS
QUICKSILVER CAUCUS … QUICKSILVER CAUCUS … QUICKSILVER CAUCUS
…QUICKSILVER CAUCUS … QUICKSILVER CAUCUS … QUICKSILVER CAUCUS
QUICKSILVER CAUCUS … QUICKSILVER CAUCUS … QUICKSILVER CAUCUS
…QUICKSILVER CAUCUS … QUICKSILVER CAUCUS … QUICKSILVER CAUCUS
QUICKSILVER CAUCUS … QUICKSILVER CAUCUS … QUICKSILVER CAUCUS
…QUICKSILVER CAUCUS … QUICKSILVER CAUCUS … QUICKSILVER CAUCUS
Third Compendium of States’
Mercury Activities
October 2012
Page 2
The Third Compendium of States’ Mercury Activities (October 2012) updates and expands
upon the 2005 Compendium of States’ Mercury Activities, published by ECOS in October
2005. This Third Compendium is based on a survey of state governments conducted
from June 2011 through January 2012.
Members of the Quicksilver Caucus (QSC) wrote the survey, distributed it to states,
and gathered state responses. Forty-two states responded to the survey. Many people
played key roles in developing this compendium. Special thanks go to the many staff
from state environmental agencies who gathered the information and work daily to
reduce mercury pollution. Special recognition goes to the Compendium Team
Members:
Peggy Harris, Chair (California Environmental Protection Agency and ASTSWMO)
Beth Card, (New England Interstate Water Pollution Control Commission and ACWA)
John Gilkeson (Minnesota Pollution Control Agency and ECOS)
Becky Jayne (Illinois Environmental Protection Agency and NPPR)
Susy King (New England Interstate Water Pollution Control Commission and ACWA)
Mark Smith (Massachusetts Department of Environmental Protection and ECOS)
Joy Taylor Morgan (Michigan Department of Environmental Quality and NACAA)
Ian Wesley (Washington Department of Ecology and ECOS)
Edin Ferreira (ECOS Staff)
Mary Blakeslee (ECOS Alumna and Consultant)
The states and environmental associations donated their team members’ time to
develop and administer the questionnaire, analyze responses, and write the final
report. The ECOS Alumna member volunteered her time to support states’
development and deployment of the questionnaire, and analysis of responses. The
United States Environmental Protection Agency (U.S. EPA) provided funding for
management of the final report’s development, editing, and formatting under
Cooperative Agreement Number U.S. EPA X5-83395401.
The QSC, a coalition of state associations, formed to address and resolve health and
environmental problems resulting from the release of mercury to the environment. The
membership of the QSC includes, the Association of State and Territorial Solid Waste
Management Officials (ASTSWMO), the Environmental Council of the States (ECOS),
the National Association of Clean Air Agencies (NACAA), the Association of Clean
Water Administrators (ACWA), the Association of State Drinking Water
Administrators (ASDWA), and the National Pollution Prevention Roundtable (NPPR) .
The Environmental Council of the States
50 F Street, NW, Suite 350
Washington, DC 20001
Phone: 202-266-4920
www.ecos.org
Page 3
Third Compendium of States’ Mercury Activities
October 2012
Page 4
i
Third Compendium of States’ Mercury Activities — Part I: National Overview
Part 1: National Overview of State Mercury Programs
Executive Summary ...................................................................................... 2
Background: Sources of Mercury ............................................................... 6
Background: Effects of Mercury ................................................................. 7
Background: A Decade of Actions ............................................................. 9
Overview of State Mercury Programs ....................................................... 18
Mercury Reduction Plans and Strategies ................................................. 22
Global Mercury ............................................................................................. 30
Sources of Mercury ....................................................................................... 34
Mercury Research and Monitoring ............................................................ 44
Total Maximum Daily Loadings ................................................................ 56
Managing Mercury in Products ................................................................. 60
Managing Dental Amalgam ........................................................................ 68
Managing Vehicle Switches ........................................................................ 74
Part 2: Information About Individual State Mercury Programs
Introduction ................................................................................................... 82
Alabama.......................................................................................................... 83
Alaska ............................................................................................................. 85
Arizona ........................................................................................................... 87
Arkansas ......................................................................................................... 89
California ........................................................................................................ 91
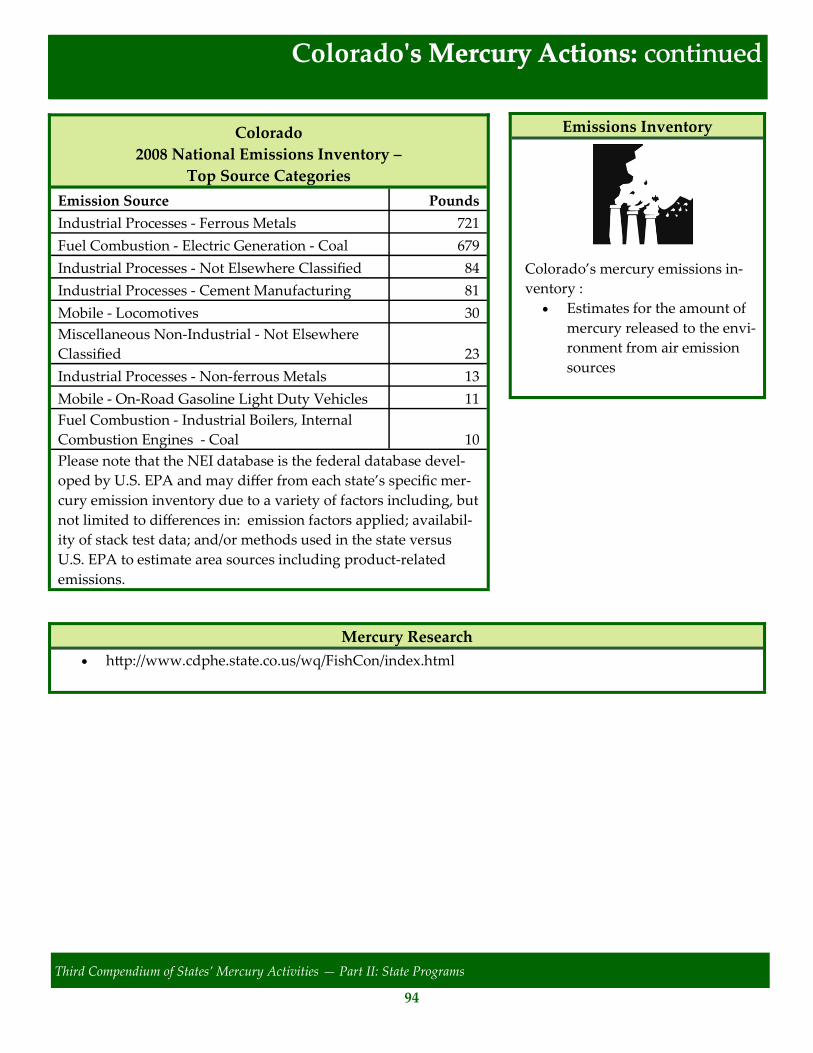
Colorado ......................................................................................................... 93
Connecticut .................................................................................................... 95
Delaware ......................................................................................................... 97
Florida ............................................................................................................. 99
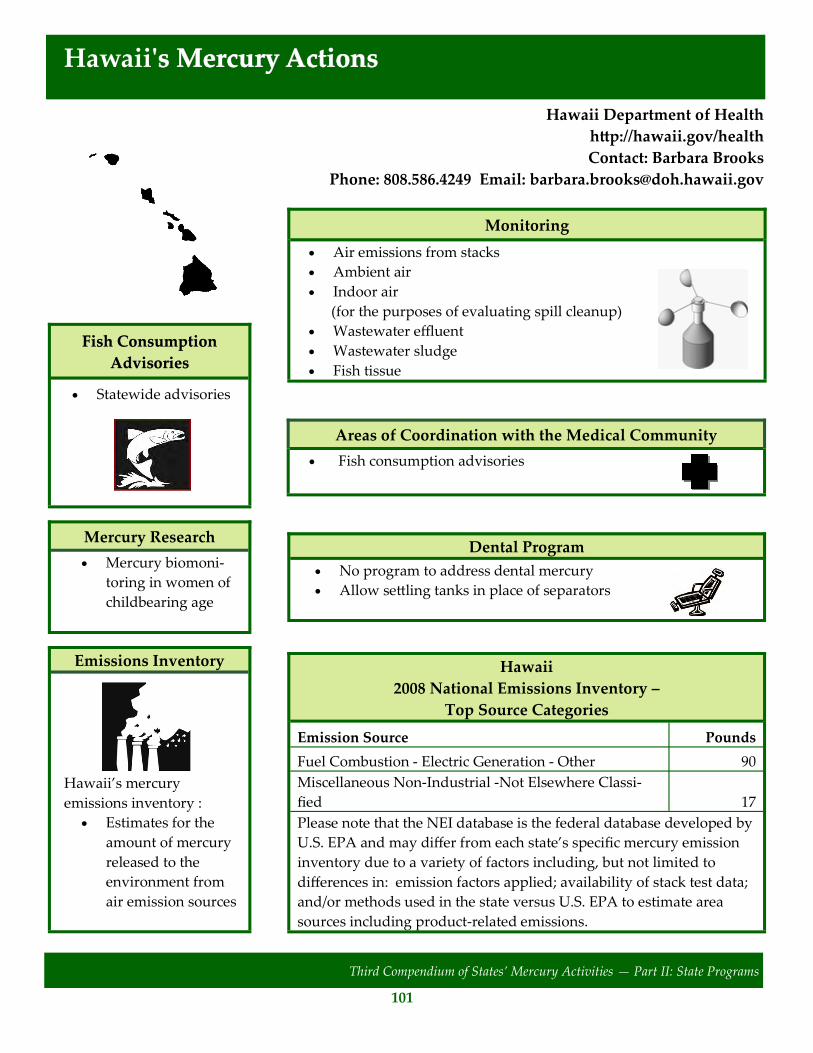
Hawaii ............................................................................................................. 101
Idaho ............................................................................................................... 103
Illinois ............................................................................................................. 107
Indiana ............................................................................................................ 119
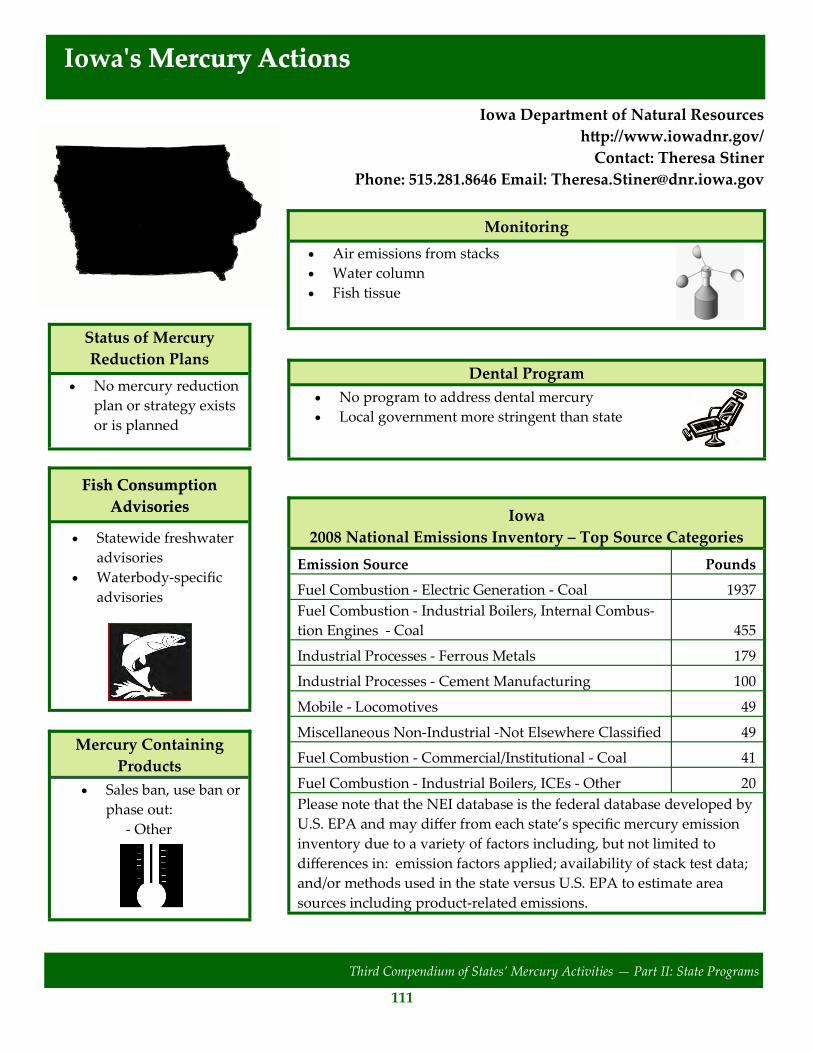
Iowa ................................................................................................................. 111
Kansas ............................................................................................................. 113
Kentucky ........................................................................................................ 115
Louisiana ........................................................................................................ 117
Maine .............................................................................................................. 119
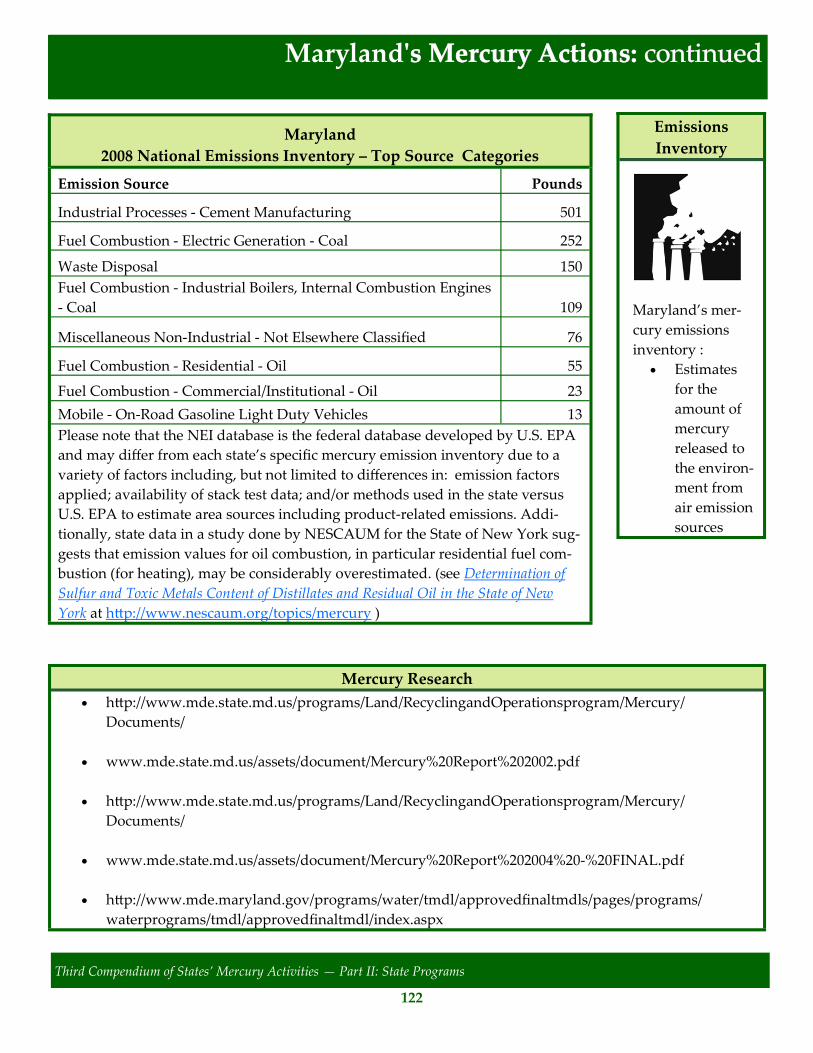
Maryland ........................................................................................................ 121
Massachusetts ................................................................................................ 123
Table of Contents
Page 5
ii
Third Compendium of States’ Mercury Activities — Part I: National Overview
Table of Contents
Part 2: Information About Individual State Mercury Programs (Continued)
Michigan ..................................................................................................... 125
Minnesota .................................................................................................... 127
Missouri ....................................................................................................... 129
Montana ....................................................................................................... 131
Nebraska ...................................................................................................... 133
New Hampshire .......................................................................................... 135
New Jersey ................................................................................................... 137
New Mexico ................................................................................................. 139
New York ..................................................................................................... 141
North Carolina ............................................................................................ 143
North Dakota ............................................................................................... 145
Ohio .............................................................................................................. 147
Oklahoma..................................................................................................... 149
Oregon .......................................................................................................... 151
Rhode Island ................................................................................................ 153
South Carolina ............................................................................................ 155
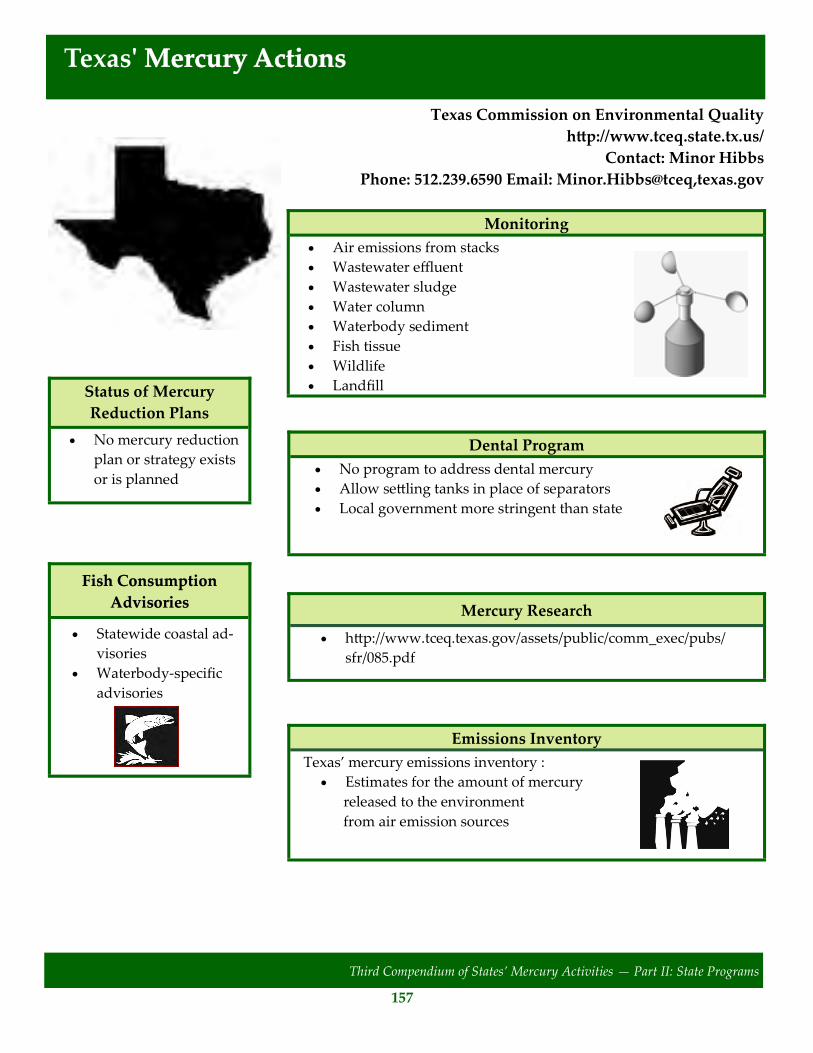
Texas ............................................................................................................. 157
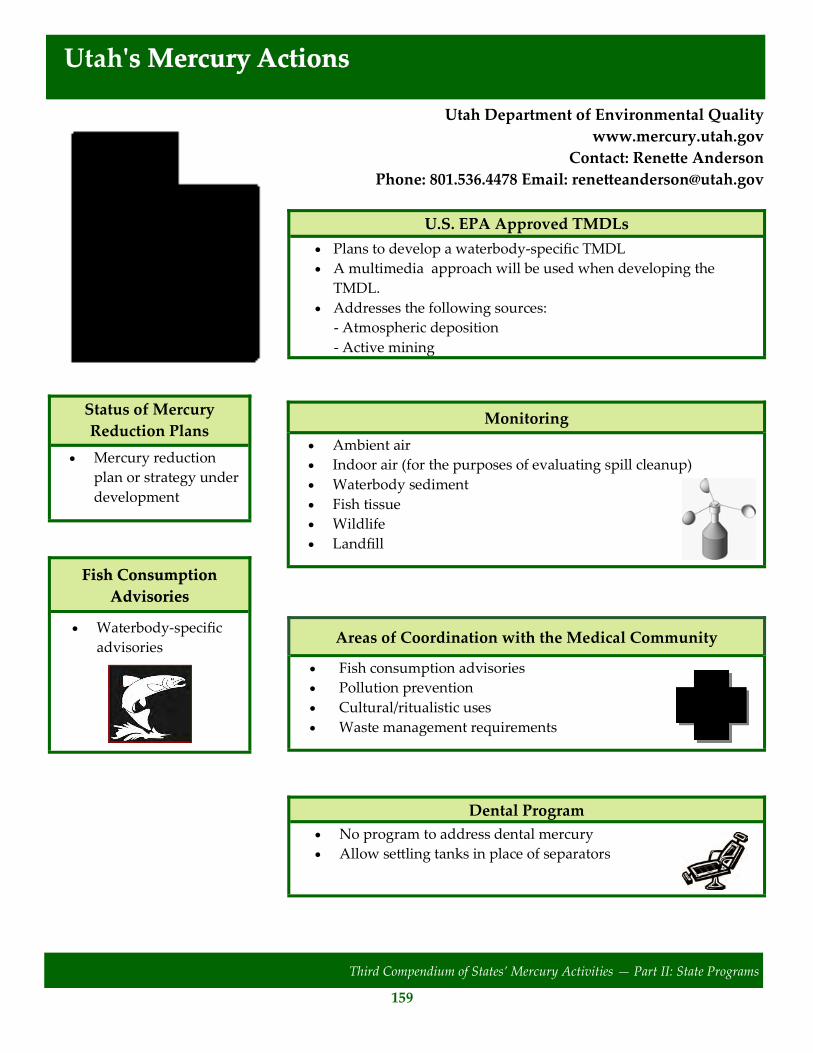
Utah .............................................................................................................. 159
Vermont ....................................................................................................... 161
Washington.................................................................................................. 163
West Virginia ............................................................................................... 165
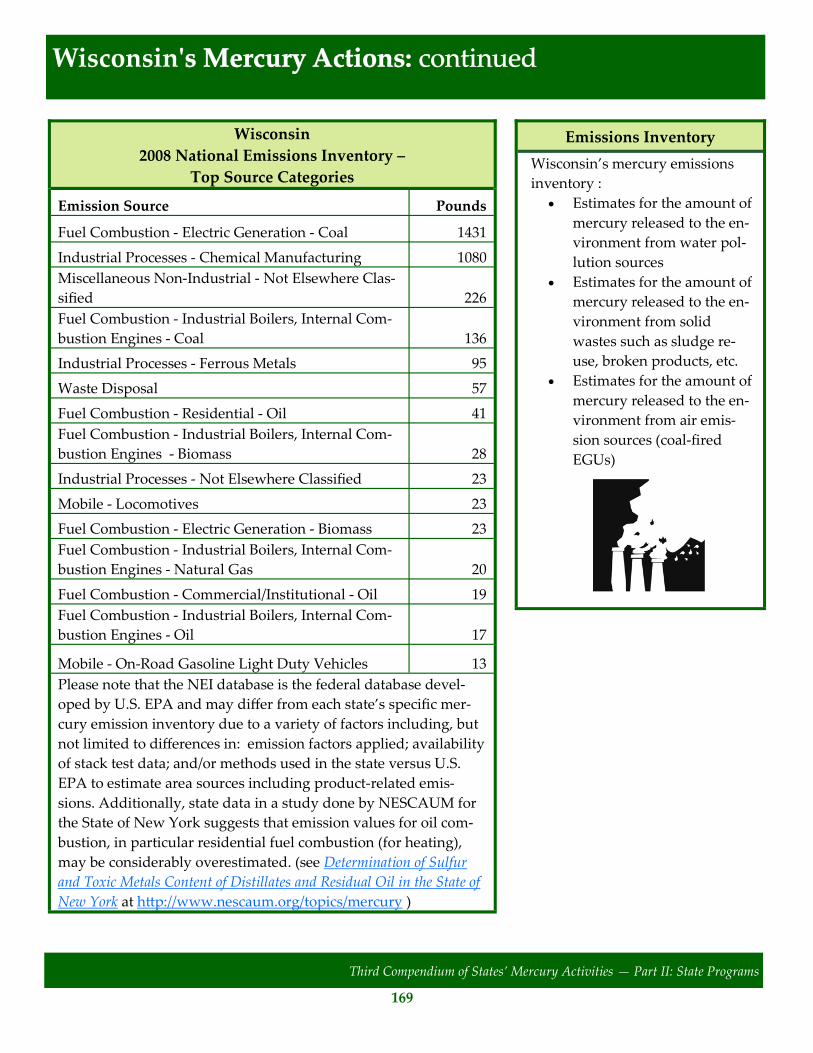
Wisconsin ..................................................................................................... 167
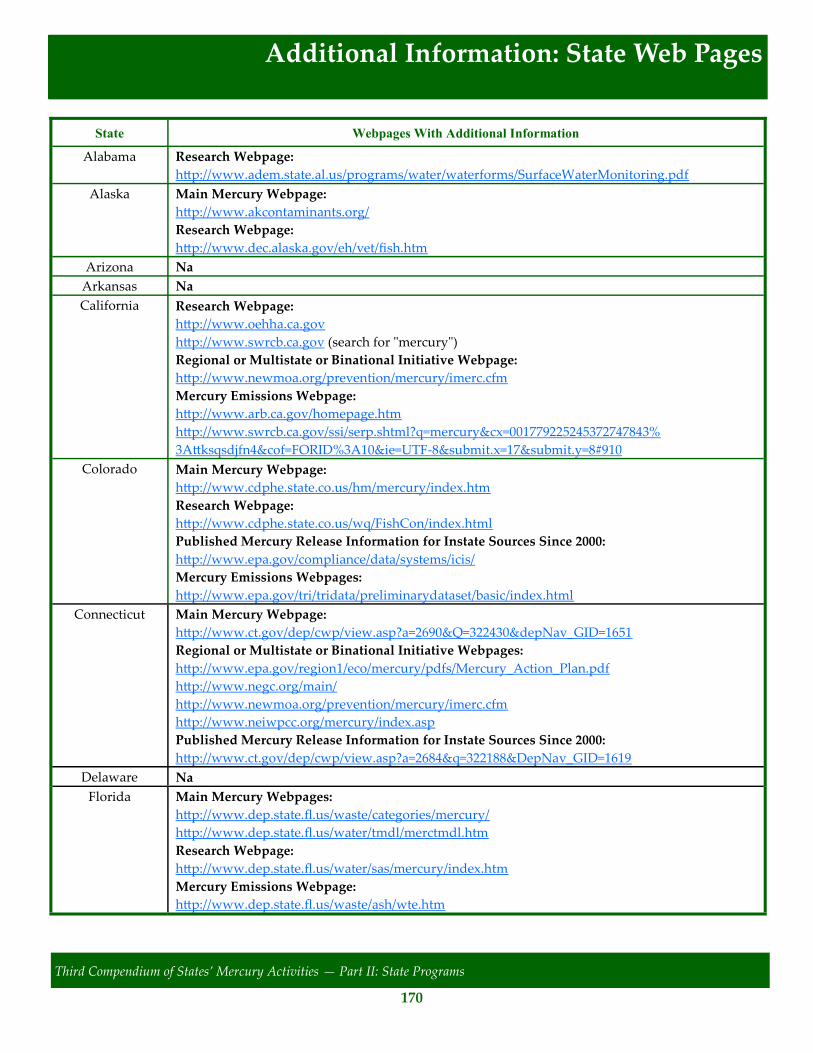
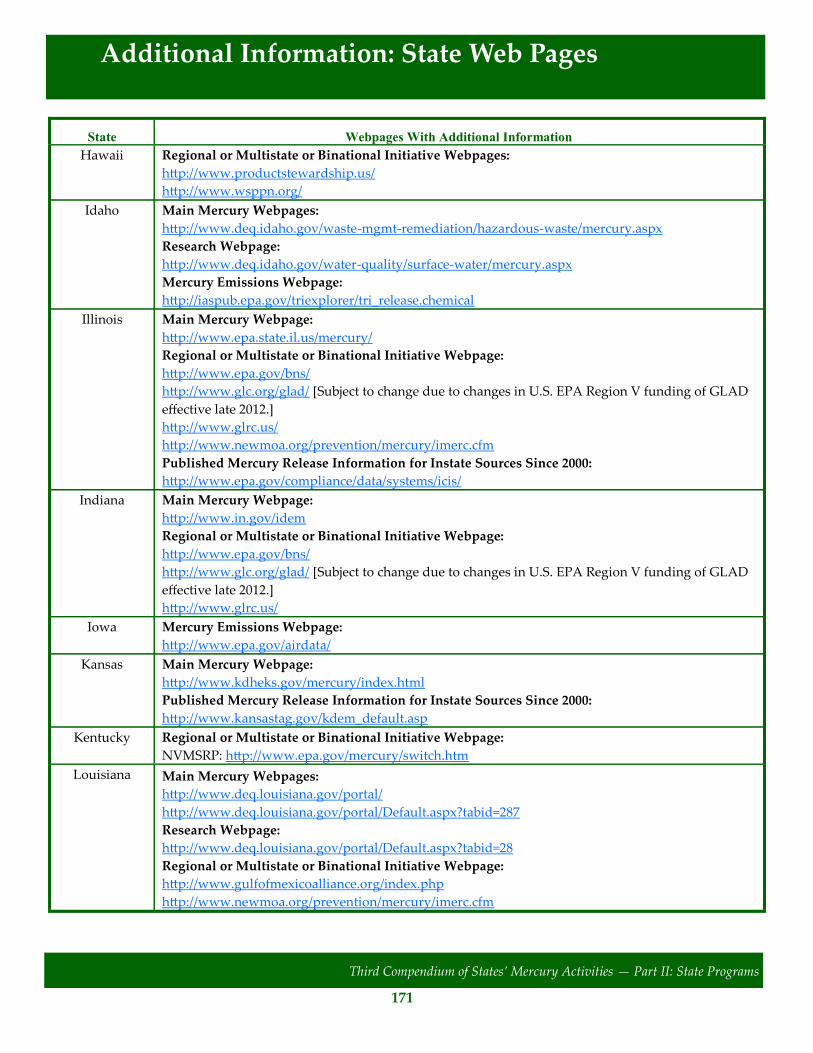
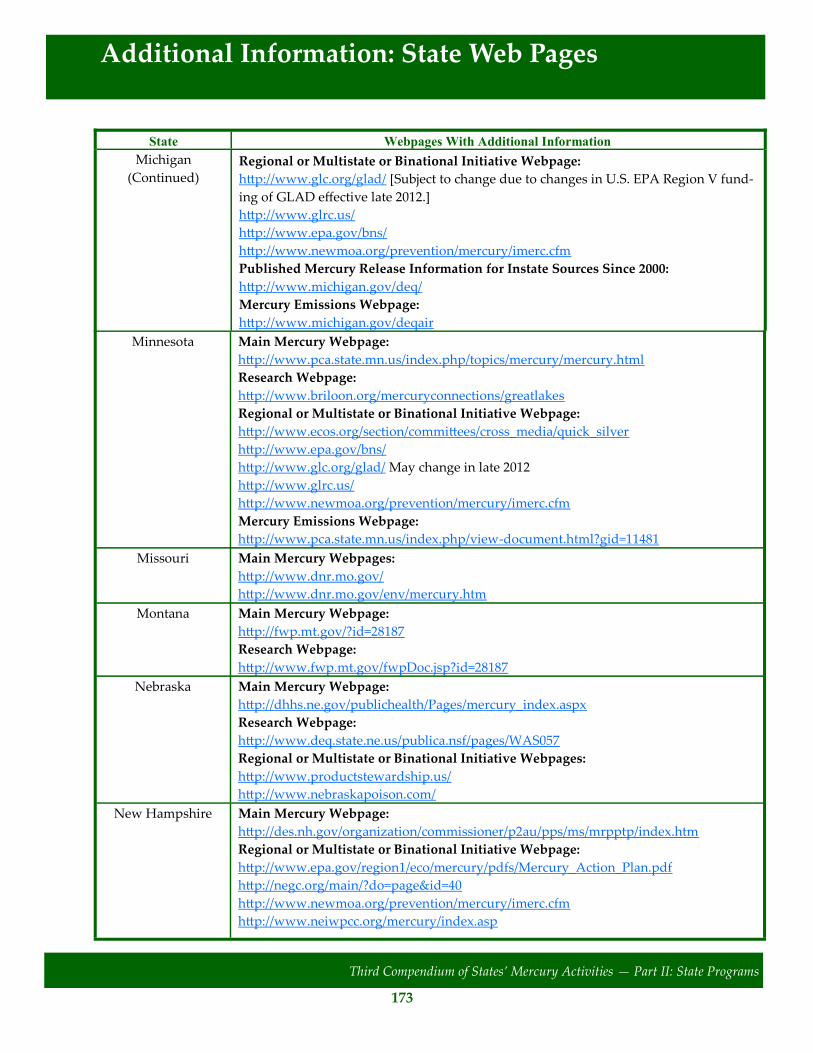
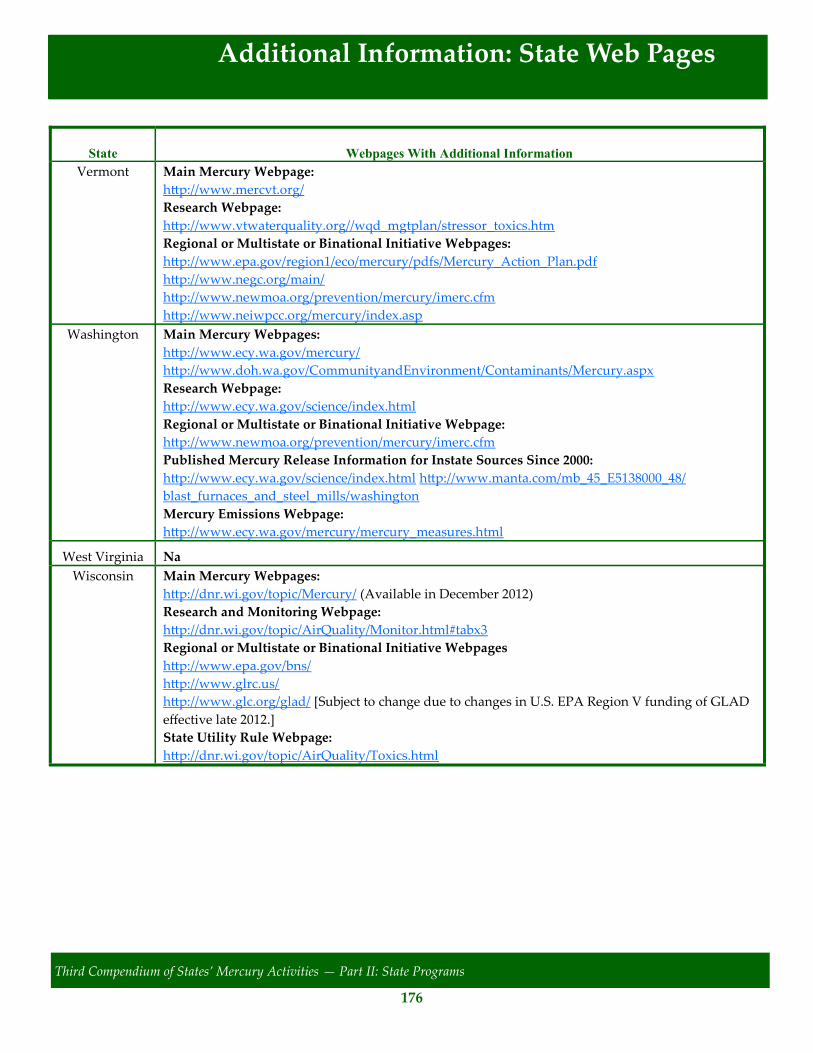
Additional Information: State Web Pages ............................................. 170
Part 3: Appendices
Appendix S-A: Air Emission Sources Identified By States in 2011 Survey ... 179
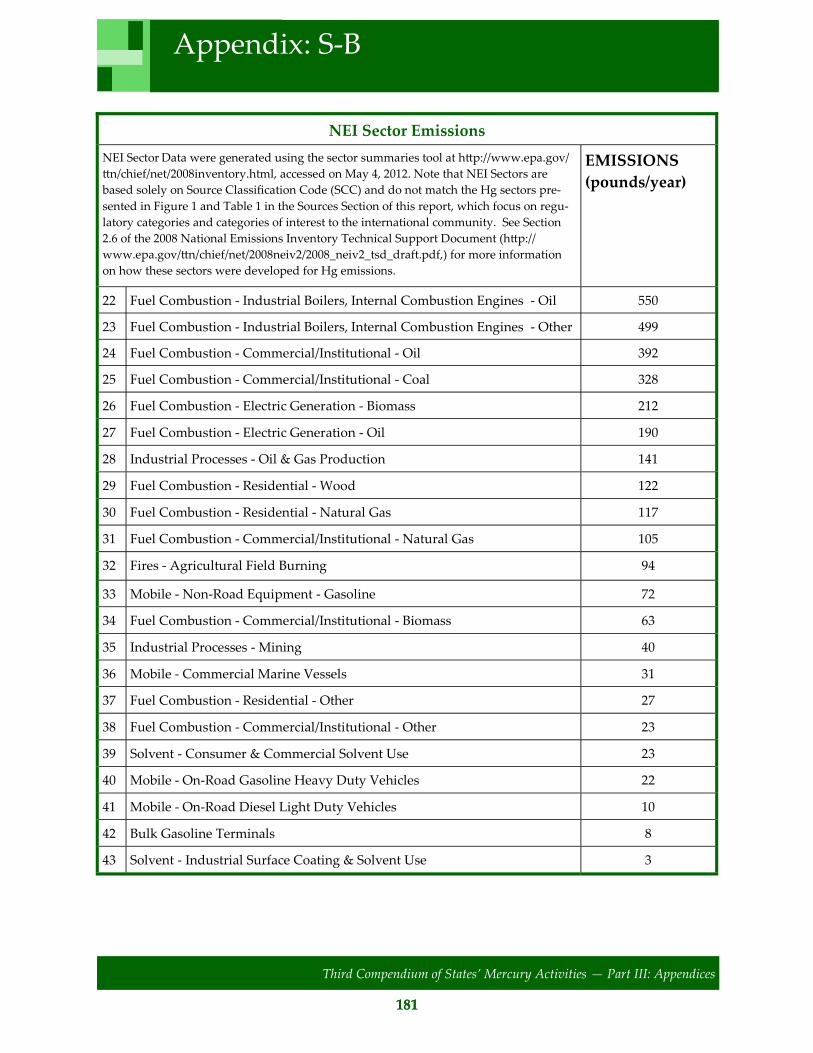
Appendix S-B: NEI Sector Emissions…………………………………………. 180
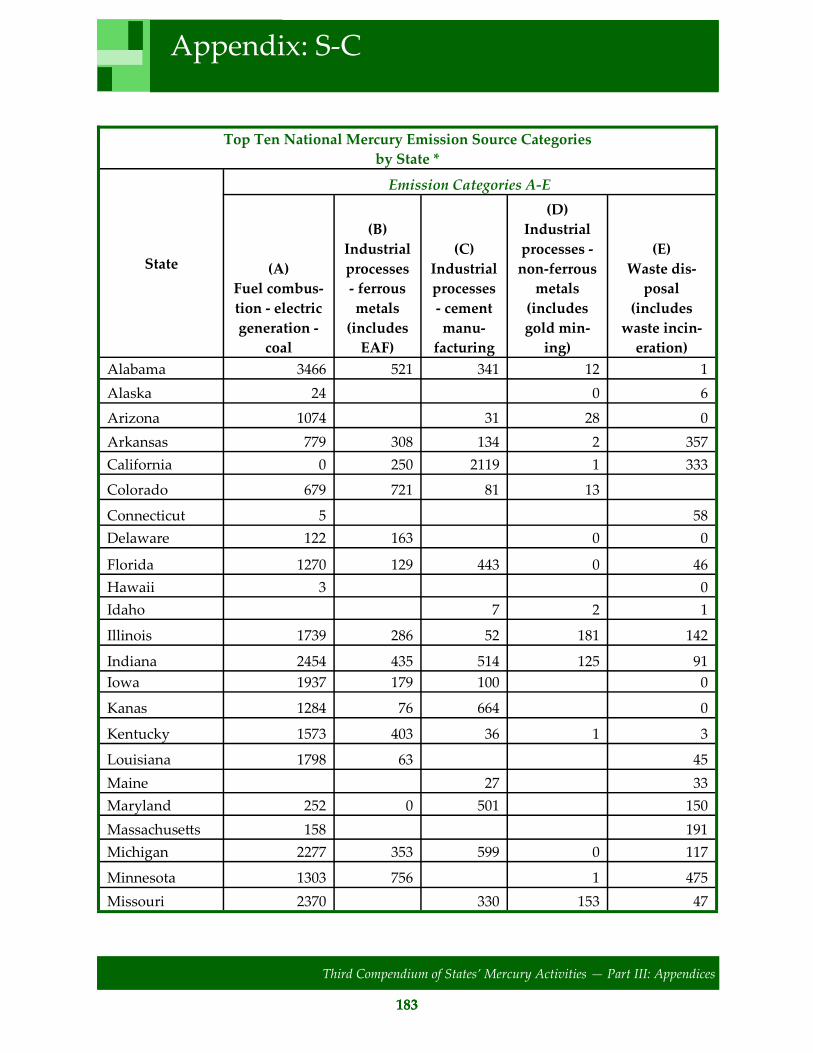
Appendix S-C: NEI State Table…………………………………………….…. 182
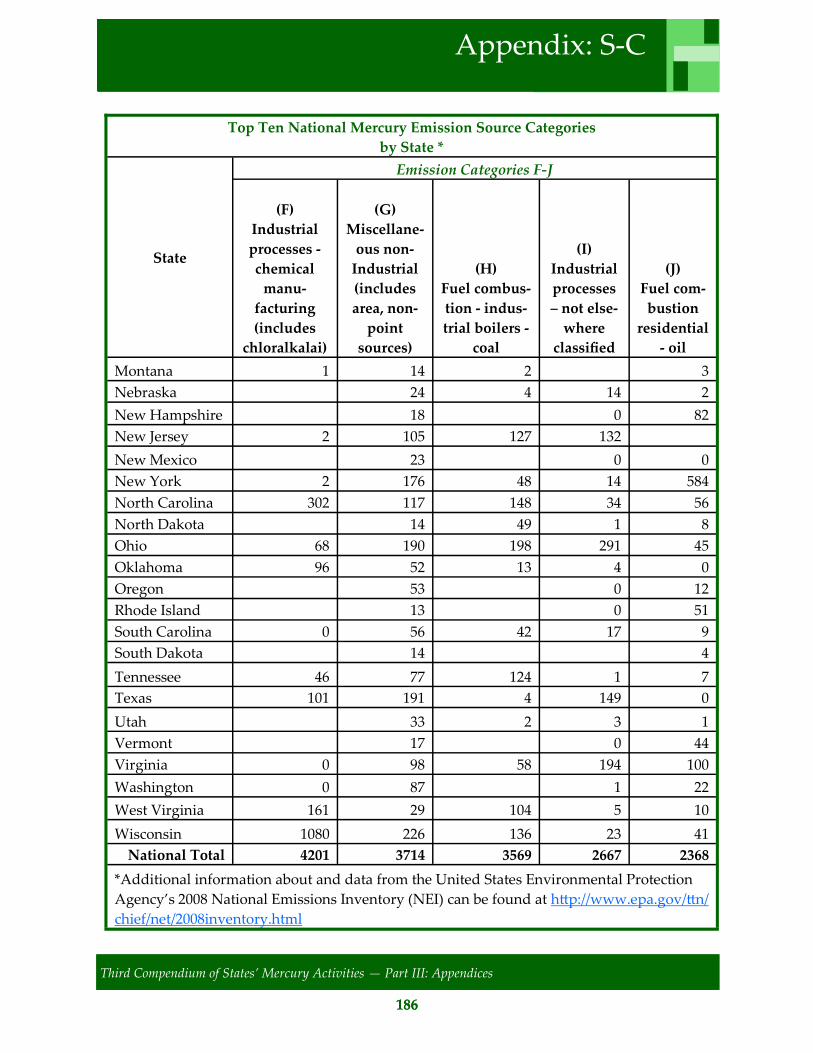
Appendix S-D: TRI Data Summary for Mercury and Mercury Compounds 187
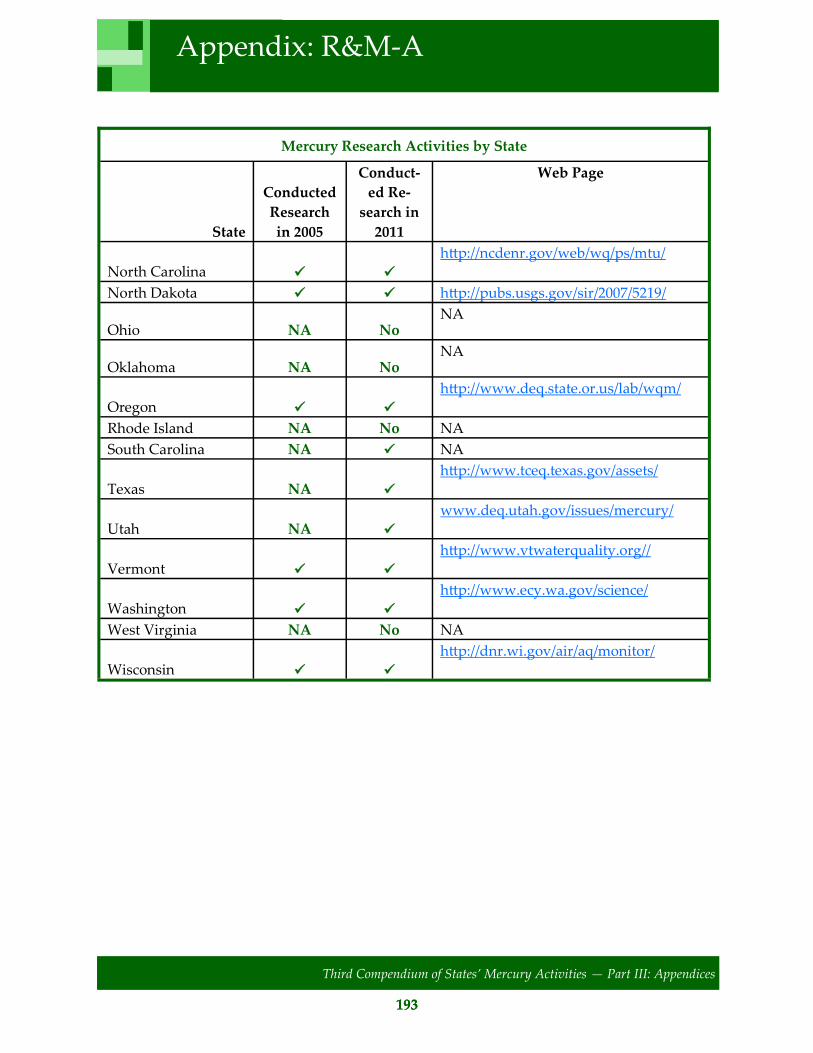
Appendix R & M-A: Mercury Research Activities by State…………………. 191
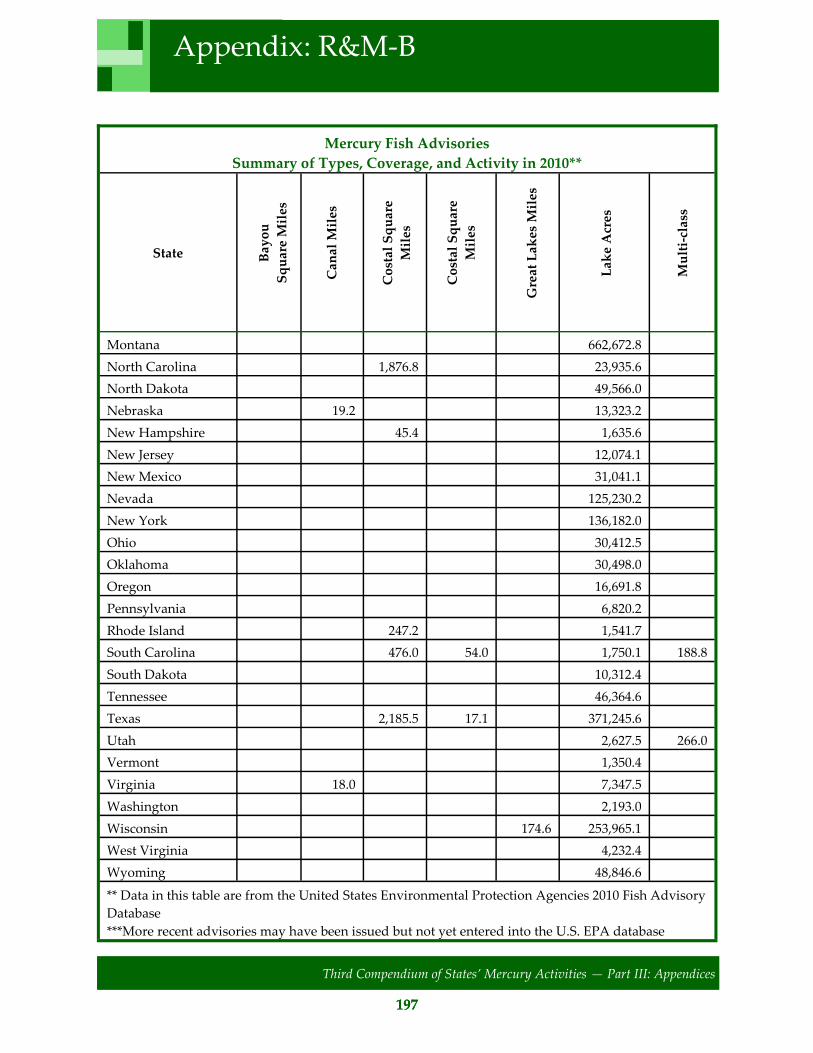
Appendix R &M-B: Mercury Fish Advisories ………………..………………. 195
Appendix P-A: Reduction of Mercury Use in Products……………………. 199
Appendix SD: 2011 Survey Documents…………………………...….………. 200
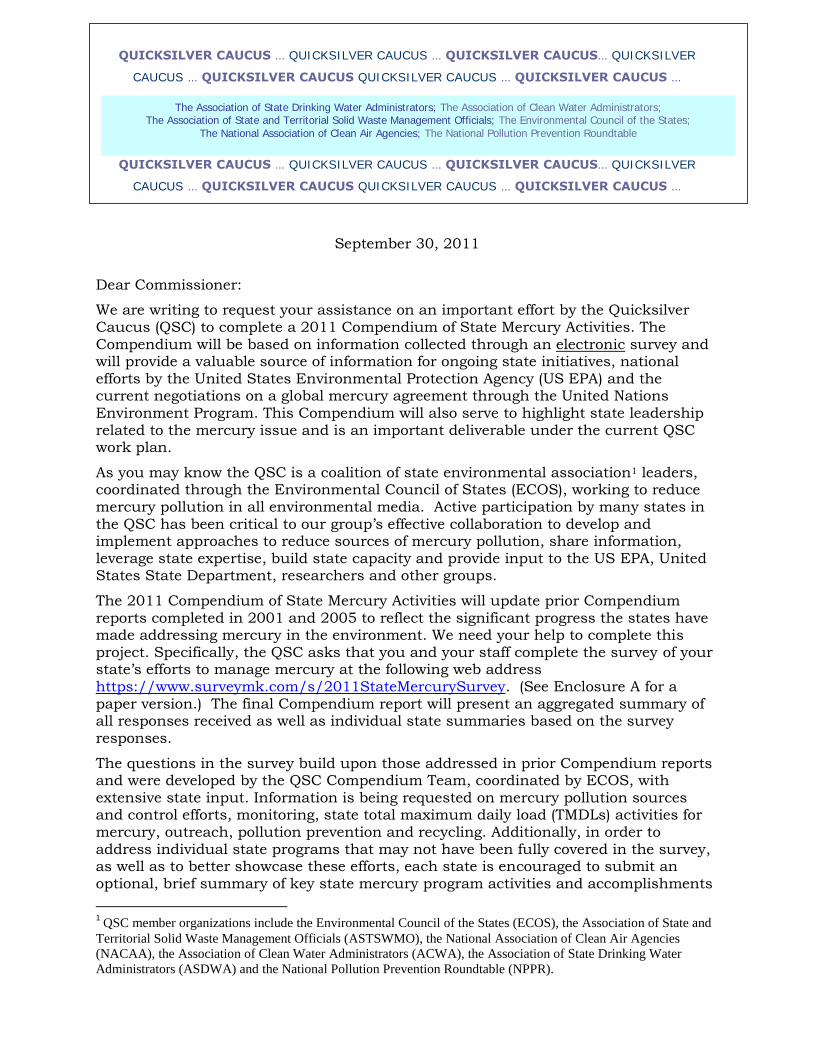
2011 Compendium Survey Letter
2011 Survey Supplemental Instructions
2011 Survey Questionnaire
Summary Results: 2011 Survey
Page 6
Third Compendium of States’ Mercury Activities — Part I: National Overview
1
BLANK PAGE
PART I: National Overview of State
Mercury Programs
Page 7
Third Compendium of States’ Mercury Activities — Part I: National Overview
2
Introduction
The Quicksilver Caucus (QSC) sent surveys to all 50 state environmental agencies for
information about their mercury issues and programs to assess the status of state and
federal efforts to address mercury pollution. The following Compendium summarizes
the information provided by 42 states, plus additional state information from other
sources and state and national data from the United States Environmental Protection
Agency (U.S. EPA). The document describes how state governments have responded
to this critical issue, and provides a resource for organizations developing, implement-
ing, and assessing mercury-reduction efforts. The report also identifies several chal-
lenges to continued progress.
Background
Mercury is a volatile metal that is very toxic to people and wildlife via inhalation and
ingestion. The primary route of concern for exposure in the U.S. is through the inges-
tion of fish. Infants, children, and the developing
fetus are at particular risk because the developing
brain is very sensitive to mercury toxicity. Although
mercury exists naturally, human activities are pri-
marily responsible for the mercury levels that con-
taminate many lakes, rivers, and coastal waters
across the nation. Mercury persists in the environ-
ment and accumulates up the food chain resulting in
elevated levels in larger predatory fish that many
people and wildlife eat. Mercury can be deposited
locally and can be carried long distances in the air
where results in wet (e.g., rain) and dry deposition
that pollutes waterbodies which in some cases can
be far from the original source. Some key sources of
mercury releases of concern to states are shown in
Table 1.
Many Americans are exposed to mercury at levels that may be potentially harmful,
primarily by eating fish containing methylmercury; an organic form resulting from the
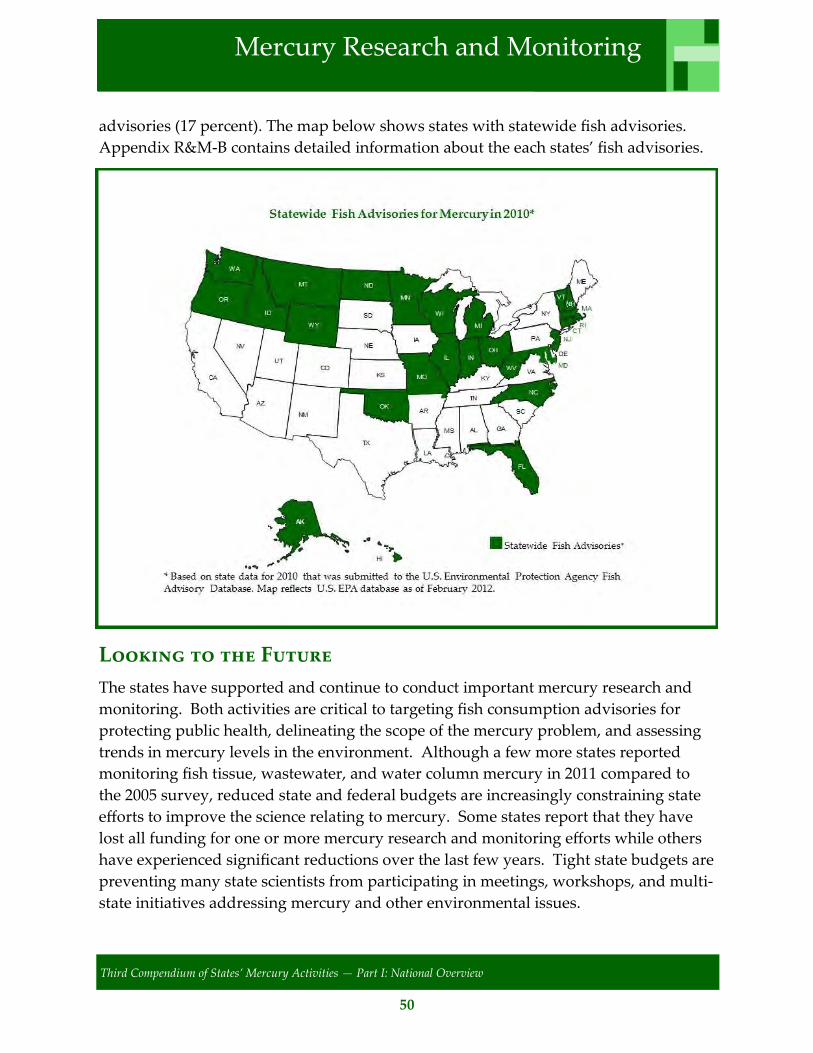
bacterial biotransformation of mercury deposited in water. All 50 states have pub-
lished fish consumption advisories, covering thousands of lakes and ponds and tens of
thousands of river and stream miles, warning consumers to limit their fish consump-
Executive Summary
Table 1
Key Sources of Mercury
of Concern to States
Coal-fired power plants
Electric arc furnaces
Cement plants and other indus-
trial sources
Waste-burning incinerators
Chloralkali and some other
chemical plants
Gold mining
The dental sector
Breakage and disposal of mer-
cury-containing products
Page 8
3
Third Compendium of States’ Mercury Activities — Part I: National Overview
Executive Summary
tion or avoid eating some kinds of fish due to mercury contamination. Minnesota’s and
New Jersey’s statewide assessments, and the Northeast regional assessment, conducted
by New York, Connecticut, Massachusetts, Vermont, Rhode Island, Maine and New
Hampshire, indicate that mercury pollution from anthropogenic sources will need to be
reduced by 90 percent or more to restore many impaired waterbodies in order to meet
the water quality objectives of the Clean Water Act. Mercury air pollution can be trans-
ported long distances before it is deposited on water or land, and as a result additional
reductions in major sources across the U.S. and globally will be needed to restore mer-
cury impaired waterbodies in these states.
State Action
States continue to implement many activities to reduce mercury in the environment de-
spite significant budgetary challenges. While the actions vary from state to state, several
areas of common concern and effort exist.
Half (21) of the 42 states responding to the QSC survey have an overall mercury
reduction plan or strategy now in place, a significant increase from 2005, and sev-
en more plan to develop one.
Most states consider coordination among states and with the federal government
as especially critical to leverage efficiencies, reduce state program costs and en-
hance regulatory certainty and consistency.
Over 90 percent of states are participating in multistate mercury workgroups.
These include the QSC, New England Governors and Eastern Canadian Premiers
Mercury Action Plan, Great Lakes Regional Collaboration, Gulf of Mexico Alli-
ance and the Western North American Mercury Synthesis Workgroup.
The U.S. EPA’s support, including funding for the Environmental Council of the
States (ECOS) and QSC mercury projects over the last several years, has been critical for
multistate and cross media collaborative efforts addressing mercury. However, QSC
leadership is concerned that significant budgetary constraints at the state level and
budget reductions at the federal level may jeopardize multistate initiatives and pro-
gress made to date. ECOS believes that continued U.S. EPA support for the QSC and
further engagement in collaborative initiatives with the states is critical for maintain-
ing momentum in reducing domestic and global mercury pollution.
The budget situation experienced by many states over the past few years has resulted
in cutbacks for mercury pollution prevention, collection and recycling, outreach,
monitoring and enforcement programs. The ability of states to coordinate and share
information has also been affected by recent reductions in federal support to the
Page 9
4
Third Compendium of States’ Mercury Activities — Part I: National Overview
states and to interstate organizations that work on mercury, as well as other issues.
As a result of these state and federal budget limitations, overall program efficien-
cies will likely be reduced as individual states are forced to work in isolation rather
than share resources to address common problems. This fragmentation also increas-
es inconsistencies among states, regulatory uncertainty, and compliance costs for the
regulated community.
Another challenge noted by many states is the need for timely access to long-term na-
tional elemental mercury storage under the 2008 Mercury Export Ban Act (MEBA) to
safely remove excess mercury from commerce. Delays in siting and opening this facili-
ty will necessitate interim storage with higher overall national and state agency costs
attributable to re-packaging, shipping, and operational oversight. Towards this end
QSC sent a letter in May 2012 to the U.S. Department of Energy (DOE), which is re-
sponsible for the MEBA facility, urging its timely completion.
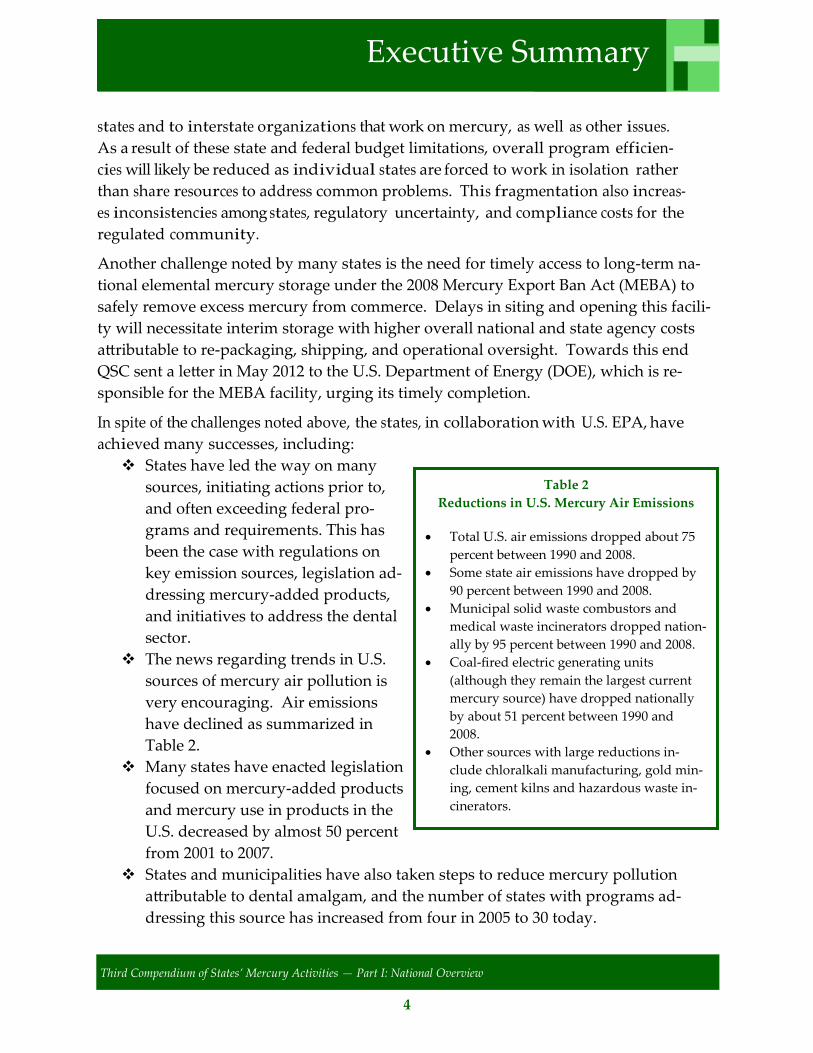
In spite of the challenges noted above, the states, in collaboration with U.S. EPA, have
achieved many successes, including:
States have led the way on many
sources, initiating actions prior to,
and often exceeding federal pro-
grams and requirements. This has
been the case with regulations on
key emission sources, legislation ad-
dressing mercury-added products,
and initiatives to address the dental
sector.
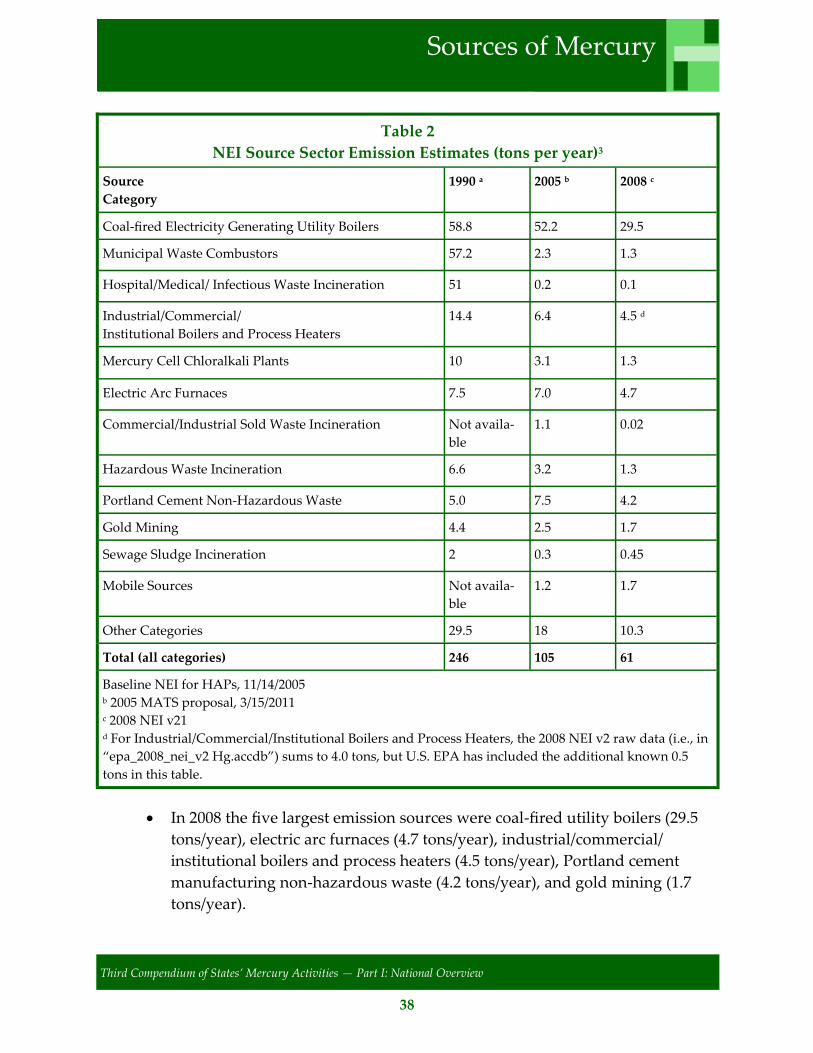
The news regarding trends in U.S.
sources of mercury air pollution is
very encouraging. Air emissions
have declined as summarized in
Table 2.
Many states have enacted legislation
focused on mercury-added products
and mercury use in products in the
U.S. decreased by almost 50 percent
from 2001 to 2007.
States and municipalities have also taken steps to reduce mercury pollution
attributable to dental amalgam, and the number of states with programs ad-
dressing this source has increased from four in 2005 to 30 today.
Executive Summary
Table 2
Reductions in U.S. Mercury Air Emissions
Total U.S. air emissions dropped about 75
percent between 1990 and 2008.
Some state air emissions have dropped by
90 percent between 1990 and 2008.
Municipal solid waste combustors and
medical waste incinerators dropped nation-
ally by 95 percent between 1990 and 2008.
Coal-fired electric generating units
(although they remain the largest current
mercury source) have dropped nationally
by about 51 percent between 1990 and
2008.
Other sources with large reductions in-
clude chloralkali manufacturing, gold min-
ing, cement kilns and hazardous waste in-
cinerators.
Page 10
5
Third Compendium of States’ Mercury Activities — Part I: National Overview
The states have also supported research and monitoring on mercury sources and
levels in fish, other biota, and the environment. These data were critical to defining
the scope of mercury contamination and impacts and establishing fish consumption
advisories to protect children’s health. Mercury monitoring is now allowing regula-
tory agencies and scientists to track progress and trends and has revealed unex-
pected mercury impacts on a variety of wildlife including songbirds. Encouragingly,
declines in mercury levels in some freshwater fish, associated with local and regional
emission reductions, have been documented in research studies in Massachusetts,
Florida, and the Great Lakes Region. However, in all cases, fish mercury levels re-
main too high, pointing to the need for further national and international action.
Maintaining state capacity to continue mercury reduction programs, to leverage suc-
cessful programs nationally and internationally, and to monitor trends is critical to
maintaining momentum and progress.
In conclusion, this report documents significant progress on the mercury issue by the
states and U.S. EPA but also highlights that there is more work to be done to restore
impaired waterbodies across the nation and the globe. State leadership on this issue
has helped to define the scope of the problem and demonstrate what can be success-
fully accomplished. Their leadership has also supported efforts to reduce global
sources of mercury pollution that impact our children.
Executive Summary
Page 11
6
Third Compendium of States’ Mercury Activities — Part I: National Overview
Mercury is a volatile, toxic heavy metal. Although mercury exists naturally in the en-
vironment, human activities are primarily responsible for the high mercury levels that
contaminate lakes, rivers, and coastal waters (U.S. EPA, 1997). Unnaturally high levels
of mercury in the environment pose a significant risk to public health and our wildlife.
Mercury is released through a variety of sources including coal-fired power plants,
chemical plants, product use and disposal, waste-burning incinerators, and the dental
sector. Additionally, despite significant recent decreases, intentional mercury use in
consumer products such as relays and switches (found in vehicles and many other
products), fluorescent lamps, thermostats, thermometers, medical and measuring de-
vices, lab chemicals, vaccines, pharmaceuticals, and dental fillings remains widespread
in the U.S. The mercury in these products can be released into the environment when
the products are disposed of in a landfill, incinerated with other waste, or discarded in
wastewater. Although the manufacture and sale of mercury in products is declining
due to the states’ regulations and programs, large amounts remain in products that
continue to be used in our society.
As a natural trace element in fossil fuels, particularly coal, mercury is also released into
the air when they are burned to generate electricity or heat. Research indicates that
these and other human activities have increased atmospheric concentrations of mercu-
ry by about a factor of three and have caused the rate of mercury deposition to increase
by as much as a factor of 3–10, depending on location, over pre-industrial levels
(United Nations Environment Programme, 2008; Bergan, T., et al., 1999).
As an element, mercury does not break down or decompose to non-mercury-
containing substances in the environment. Instead, mercury continuously cycles be-
tween air, water, and land. After being released into air, mercury can travel short and
long distances and be deposited nearby or across the globe in rain, snow, or dry parti-
cles. Once mercury finds its way into waterbodies, aquatic micro-organisms can con-
vert mercury into methylmercury, a more toxic form of mercury that is readily ab-
sorbed by living organisms. Unlike many other pollutants, methylmercury is not read-
ily excreted by fish and other organisms in the aquatic food chain. Thus mercury bio-
accumulates in organisms and increases in concentration as it works its way up the
food chain. As a result, species at the top of the food chain that are consumed by hu-
mans, such as largemouth and smallmouth bass, pike, swordfish and some tuna, can
have mercury levels up to 1 million times that of the surrounding water (Zillioux et al.,
1993).
Background: Environmental Sources of Mercury
Page 12
7
Third Compendium of States’ Mercury Activities — Part I: National Overview
Human Health
Recent research studies continue to demonstrate that many Americans are being ex-
posed to mercury above recommended safe levels. Based on national monitoring of
mercury in people’s blood, about seven percent of the U.S. population is exposed to
mercury above the level considered safe for the developing brain and neurological sys-
tem of the fetus (http://www.epa.gov/hg/exposure.htm). This percentage can vary
greatly, depending on the specific region or group considered. Mercury exposures
have been found to be greater among those who eat more fish. Human subpopula-
tions likely to eat more fish include some people who have higher incomes, people
who live along the coasts, Native Americans, and Asians and Pacific Islanders.
In a study by the New York City Department of Health and Mental Hygiene, the geo-
metric mean blood mercury concentration was found to be more than three times high-
er than the national estimate derived from 2001-2002 National Health and Nutrition
Examination Survey (NHANES) data, with 25 percent of the 1,800 adults tested
(equating to 1.4 million New York City adults) and close to 50 percent of Asians in the
city exhibiting blood mercury levels above 5 µg/L (McKelvey, 2007). Researchers at
the Minnesota Department of Health tested about 1,500 blood samples from infants
born in the Great Lakes states of Minnesota, Wisconsin, and Michigan. Researchers
also found eight percent had blood mercury levels above the recommended safe level
(McCann, 2011).
Ongoing research highlights mercury’s potent toxicity, with recent reports continuing
to note associations between low levels of mercury exposure and neurological effects.
Two studies also reinforce concerns about mercury’s immunological effects, including
research demonstrating associations between low mercury blood levels and atopic der-
matitis (eczema) in adults (Park and Kim, 2011) and systemic inflammation and endo-
crine disruption in children (Gump et al., 2012).
People can be exposed to mercury in a number of ways. The predominant pathway is
through the consumption of contaminated fish. All 50 states currently have fish con-
sumption advisories in effect warning consumers to limit or avoid eating certain types
of fish, or all fish from certain waterbodies. Thousands of lakes and ponds and tens of
thousands of river and stream miles are subject to such advisories. Mercury contami-
nation degrades recreational and commercial fishing opportunities and the economic
benefits associated with these activities. It also poses risks of adverse effects on brain
development, the immune system, and the cardiovascular system among those con-
suming contaminated fish caught recreationally and commercially.
Background: Effects of Mercury
Page 13
8
Third Compendium of States’ Mercury Activities — Part I: National Overview
State wide and regional assessments, called total maximum daily loads (TMDLs) for
mercury developed individually by Minnesota and New Jersey, and regionally by the
seven Northeast states, have all determined that mercury deposition to the states' wa-
terbodies attributable to manmade sources will need to be reduced by greater than 90
percent to restore impaired lakes, ponds, and rivers in order to meet the water quality
objectives of the Clean Water Act (Minnesota Pollution Control Agency, 2007; New
England Interstate Water Pollution Control Commission, 2007; New Jersey Depart-
ment of Environmental Protection, 2009). Mercury air pollution can be transported
long distances before it is deposited on water or land. Mercury levels in these states'
waterbodies and can only be reduced significantly as a result of additional reductions
in major sources across the U.S. and globally.
Wildlife
Extensive studies of mercury’s environmental impacts have been completed or are un-
derway in many states including those in the Northeast and the Great Lakes regions,
Florida, the Gulf of Mexico states, and the Western region. These studies have consist-
ently documented troublesome mercury levels in a variety of wildlife, including fish-
eating birds like loons and eagles, otters, amphibians, and upland birds. Researchers
recently concluded that the scope and intensity of the impact of mercury on fish and
wildlife in the Great Lakes region is much greater than previously recognized (Evers et
al., 2011). In many areas, mercury concentrations exceeded human and ecological risk
criteria, particularly in inland waters. The study also found that mercury is causing
harm at levels once thought to be safe. In the common loon, for example, exposures
that cause no effect in adults can impair egg fertility, survival of newly hatched chicks,
and overall reproductive success.
Background: Effects of Mercury
Page 14
9
Third Compendium of States’ Mercury Activities — Part I: National Overview
Background: A Decade of Actions
Over the last decade, collaboration among state, federal, and international organiza-
tions on managing mercury in the environment has increased. This collaboration has
led to increased coordination of activities, an overall reduction of mercury emissions in
the U.S., and a greater awareness of mercury uses and impacts throughout the world.
Trends in Mercury Reduction
The news regarding trends in mercury air emissions from U.S. sources is very encour-
aging. Total mercury U.S. emissions reported in the U.S. EPA National Emissions In-
ventory (NEI) showed an overall 75 percent decrease from approximately 246 tons to
61 tons from the early 1990s through 2008 (http://www.epa.gov/ttn/chief/
eiinformation.html):
Individual states have documented emission reductions of up to 91 percent (http://
www.mass.gov/dep/toxics/stypes/08hginv.pdf). Further reductions are underway
due to ongoing state and federal efforts to improve pollution controls and reduce un-
necessary uses of mercury in products and processes. Mercury emission reductions of
greater than 95 percent have been achieved by two of the three largest mercury source
categories in the 1990s – municipal solid waste combustion and medical waste incin-
eration.
The data also indicate that substantial reductions in emissions from coal-fired electric
generating units (EGUs) occurred over the past few years. These data are consistent
with state regulations on this sector, as well as co-benefits of pollution controls in-
stalled to address other regulated pollutants, and voluntary actions. Although coal-
fired EGUs remain the largest current mercury source category, the further deploy-
ment and optimization of pollution control technologies, if implemented, will lead to
significant further reductions in emissions of mercury from this sector.
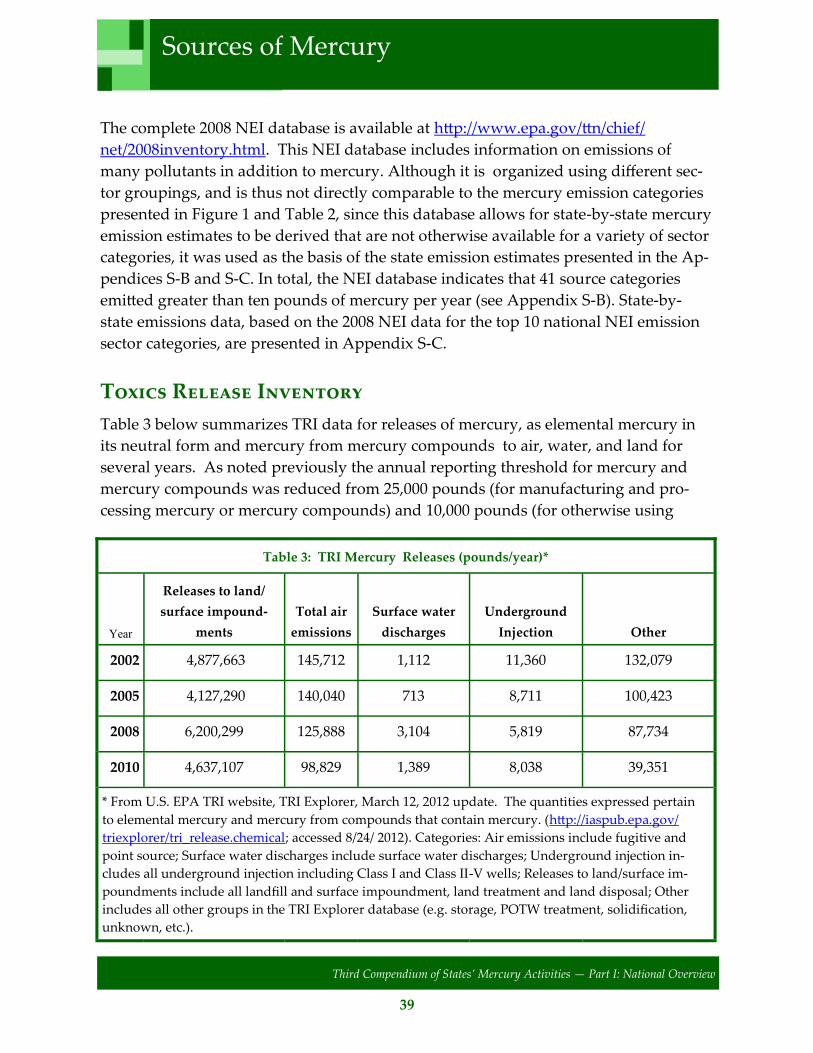
The NEI data together with data from the Toxics Release Inventory (TRI)
(www.epa.gov/tri) indicate that significant reductions in mercury emissions have also
been achieved in other industrial sectors, including the chloralkali industry, gold
mines, cement kilns, and hazardous waste incinerators. On the other hand, mercury
air emissions from steelmaking facilities, as reported to TRI, increased from 2002 to
2010, despite pollution prevention efforts to remove mercury-containing switches from
scrapped vehicles. This is likely due to improved emissions test data for the steel sec-
tor since 2002 (U.S. EPA Office of Toxic Release Inventory Program email communica-
tion, 2012).
Mercury use in products and processes has also decreased significantly. Use of
Page 15
10
Third Compendium of States’ Mercury Activities — Part I: National Overview
mercury in products decreased by 46 percent from 2001 to 2007, the last date data are
available (Wienert, 2009). The number of states with programs addressing dental mer-
cury increased from four in 2005 to 30 in 2011.
Decreasing levels of mercury in fish, associated with reductions in local and regional
mercury emission sources, have been reported in research studies in Massachusetts
(Massachusetts Department of Environmental Protection, 2006), Florida (Axelrad, et
al., 2011), and the Great Lakes region (Monson, et al., 2011). However, in all cases fish
mercury levels remain too high in many of the waterbodies studied. Mercury concen-
trations in some biota, including common loons in Wisconsin; walleye in Ontario, Min-
nesota, and Lake Erie; and northern pike in Minnesota have increased somewhat re-
cently. This increase occurs in spite of declines in mercury levels in the Great Lakes
region over the past four decades, concurrent with decreased emissions from U.S.
sources (Monson, 2009). Taken together these results are encouraging but highlight the
need for further action.
Successful state programs have established state leadership in reducing mercury emis-
sions and uses of mercury. These efforts have put the states and the U.S. ahead in
developing technologies and policies to address this global issue, and strengthen the
U.S. position, creating opportunities for the U.S. government to call for other countries
to reduce sources of mercury pollution that impact the U.S.
State Collaboration on Mercury Issues
In 1996, ECOS called for a permanent halt to mercury sales from the Department of
Defense Mercury Stockpile and for an evaluation of options for the safe retirement of
the stockpile in one of its first mercury policy positions. Since that time ECOS has fo-
cused on several policy areas that address managing and reducing mercury in the en-
vironment (http://www.ecos.org/section/policy/resolution). See table 1 on page 11
To enhance coordination on mercury issues, the QSC was formed in May 2001 by a co-
alition of state environmental association leaders. The QSC works to collaboratively
develop holistic approaches for reducing mercury in the environment. QSC members
who share mercury-related technical and policy information include the Environmen-
tal Council of the States (ECOS), the Association of State and Territorial Solid Waste
Management Officials (ASTSWMO), the Association of Clean Water Administrators
(ACWA), the Association of State Drinking Water Administrators (ASDWA), the Na-
tional Association of Clean Air Agencies (NACAA), and the National Pollution Pre-
vention Roundtable (NPPR).
Background: A Decade of Actions
Page 16
11
Third Compendium of States’ Mercury Activities — Part I: National Overview
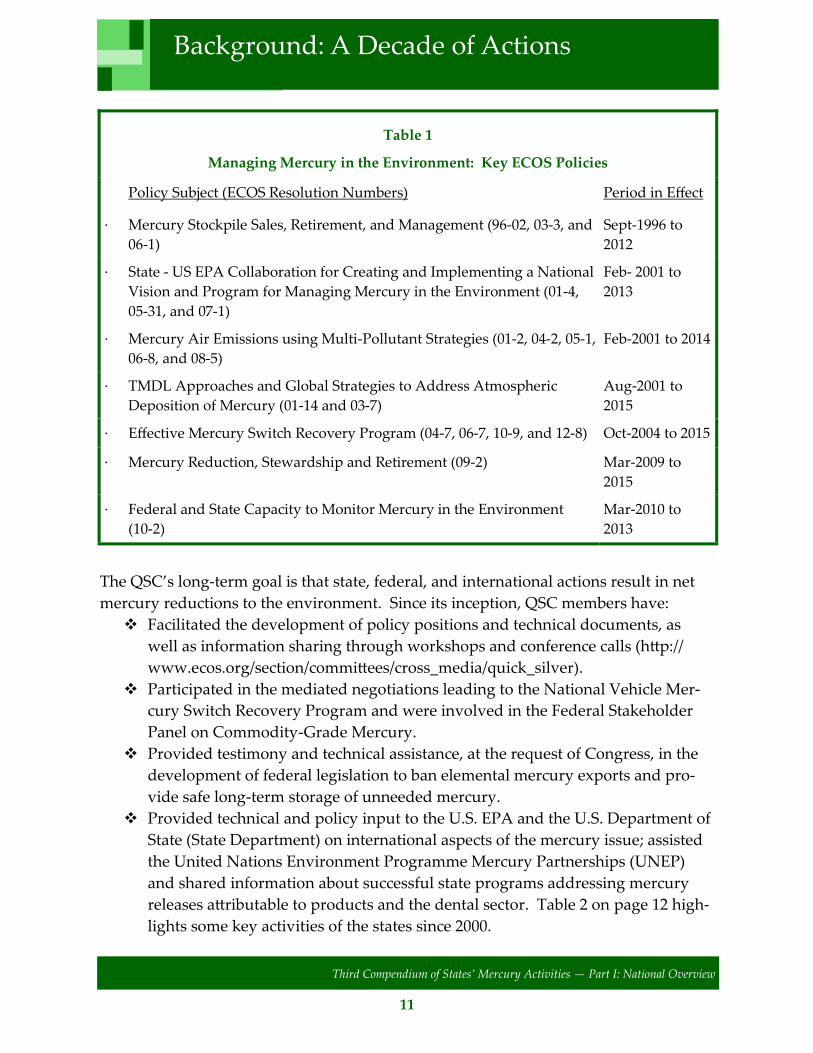
Background: A Decade of Actions
Table 1
Managing Mercury in the Environment: Key ECOS Policies
Policy Subject (ECOS Resolution Numbers) Period in Effect
· Mercury Stockpile Sales, Retirement, and Management (96-02, 03-3, and
06-1)
Sept-1996 to
2012
· State - US EPA Collaboration for Creating and Implementing a National
Vision and Program for Managing Mercury in the Environment (01-4,
05-31, and 07-1)
Feb- 2001 to
2013
· Mercury Air Emissions using Multi-Pollutant Strategies (01-2, 04-2, 05-1,
06-8, and 08-5)
Feb-2001 to 2014
· TMDL Approaches and Global Strategies to Address Atmospheric
Deposition of Mercury (01-14 and 03-7)
Aug-2001 to
2015
· Effective Mercury Switch Recovery Program (04-7, 06-7, 10-9, and 12-8) Oct-2004 to 2015
· Mercury Reduction, Stewardship and Retirement (09-2) Mar-2009 to
2015
· Federal and State Capacity to Monitor Mercury in the Environment
(10-2)
Mar-2010 to
2013
The QSC’s long-term goal is that state, federal, and international actions result in net
mercury reductions to the environment. Since its inception, QSC members have:
Facilitated the development of policy positions and technical documents, as
well as information sharing through workshops and conference calls (http://
www.ecos.org/section/committees/cross_media/quick_silver).
Participated in the mediated negotiations leading to the National Vehicle Mer-
cury Switch Recovery Program and were involved in the Federal Stakeholder
Panel on Commodity-Grade Mercury.
Provided testimony and technical assistance, at the request of Congress, in the
development of federal legislation to ban elemental mercury exports and pro-
vide safe long-term storage of unneeded mercury.
Provided technical and policy input to the U.S. EPA and the U.S. Department of
State (State Department) on international aspects of the mercury issue; assisted
the United Nations Environment Programme Mercury Partnerships (UNEP)
and shared information about successful state programs addressing mercury
releases attributable to products and the dental sector. Table 2 on page 12 high-
lights some key activities of the states since 2000.
Page 17
12
Third Compendium of States’ Mercury Activities — Part I: National Overview
More Than a Decade of State
Leadership and Action
In 2000, the ECOS and the Clean Air Net-
work published the first compendium of
state mercury activities which described
how 26 states were addressing manage-
ment of mercury in the environment. This
first compendium included information
from states on the scope of their mercury
reduction efforts, public outreach and edu-
cation efforts, research and monitoring
efforts, publications and resources, mercu-
ry committees and task forces, and current
statistics on fish consumption advisories.
In 2005, the QSC and the National Wildlife
Federation published the second compen-
dium of state mercury activities and a short
update was completed in 2008. These re-
ports also documented increased efforts by
the states to address mercury issues includ-
ing adoption of state mercury strategies
and expanded efforts in the areas of mercu-
ry-added products, the dental sector, re-
search and monitoring, and fish consump-
tion advisories.
The states have also been actively engaged
in global aspects of the mercury issue.
Mercury’s ability to be transported long distances in the air, combined with its contin-
ued use and release from many sources, has made mercury pollution a global prob-
lem. Accumulating evidence of the global reach and significance of mercury pollution
and risk reached a tipping point in 2002, when the UNEP initiated a global assessment
of mercury pollution, impacts, and sources (UNEP, 2002). State technical and policy
experts provided input to this report, and urged global action to reduce mercury pol-
lution. The UNEP Governing Council concluded in 2003 (based on the Global
Background: A Decade of Actions
Table 2
Key Actions by States to Address Mercury in
the Environment
Sponsored a State Environmental and Pub-
lic Health Policy Seminar (October 2000)
Formed Quicksilver Caucus (May 2001)
Hosted First QSC - U.S. EPA Leadership
Meeting (February 2002)
Sponsored Policy Workshop for State-U.S.
EPA Leaders (October 2003)
Published Compendium of State Mercury
Activities (October 2005)
Endorsed National Vehicle Mercury
Switch Recovery Program (August 2006)
Sponsored Policy Workshop for State-U.S.
EPA Leaders (May 2007)
Supported Ban on Unnecessary Mercury
Exports/Issued Principles for Safe Manage-
ment of Elemental Mercury (June 2007)
Published State Actions for Managing
Mercury in the Environment (April 2008)
Urged U.S. EPA Development of a Mer-
cury in Dental Amalgam Effluent Guide-
line Rule (December 2008)
Supported Stronger Management of Inter-
national Transboundary Mercury
(February 2009)
Recommended that the U.S. Delegation
Push for Strong International Mercury
Treaty Reduction Targets and Product
Bans (January 2011)
Urged Timely Implementation of the Mer-
cury Export Ban Act (May 2012)
Page 18
13
Third Compendium of States’ Mercury Activities — Part I: National Overview
Mercury Assessment Report) that there was “sufficient evidence of significant global
mercury impacts to warrant immediate action”.
Initial work under the UNEP declaration was implemented through several voluntary
partnerships that were established to facilitate information sharing, capacity building,
and short-term progress. These voluntary partnerships addressed mercury supply and
storage, use in products and processes, emissions from coal combustion, and use in
small scale gold mining, among other issues. The states assisted in several of these
partnerships through the QSC State Mercury Resources Network. States also advocat-
ed for clearer terms of reference as well as the management and development of ac-
countability metrics to guide and evaluate progress.
Consistent with the QSC recommendations, work to strengthen these partnerships
through the development and inclusion of overarching frameworks, partnership goals,
and operational guidelines was undertaken during 2008. The partnerships continue to
be the primary vehicle for coordinated global action on mercury. However, in recogni-
tion of the serious nature of the issue and the need for additional measures, the Gov-
erning Council initiated action in 2009 towards a legally binding agreement on mercu-
ry, targeted for completion in 2013. QSC continues to provide technical and policy in-
put to this initiative.
Federal Actions and Collaboration with the States
States indicated that they consider coordination between state and federal government
agencies as a key element in efforts addressing mercury pollution. States have found
that fiscal constraints present a challenge in addressing mercury pollution. Many envi-
ronmental programs throughout the federal government have had their budgets
reduced, including programs that address mercury pollution. U.S. EPA has used
different approaches to maintain a level of involvement on mercury issues, including:
Partnerships with states.
Voluntary agreements to encourage best management practices.
Bilateral, as well as regional and international partnerships.
Collaborations to address mercury releases and uses and the resulting exposure.
Background: A Decade of Actions
Page 19
14
Third Compendium of States’ Mercury Activities — Part I: National Overview
“EPA’s Roadmap for Mercury” was published in 2006. The Roadmap focused on six
key areas, with the overarching goal of reducing health risks associated with mercury
exposure. Table 3 on page 15 shows U.S. EPA rulemaking and voluntary activities
since then. The U.S. Department of Energy (DOE) has also addressed aspects of the
mercury issue. Under the 2008 Mercury Export Ban Act (MEBA), DOE was charged
with establishing a national repository for the safe long-term storage of excess ele-
mental mercury by 2013. In January 2011, DOE issued an Environmental Impact State-
ment regarding the site evaluation and selection process to identify a facility or facili-
ties for the repository. This was completed with consultation and input from the states.
However, in June, 2012, DOE issued a Notice of Intent to prepare a Supplemental En-
vironmental Impact Statement on this issue, delaying the final site selection, which will
likely necessitate interim storage of excess mercury at existing facilities. The states
have urged DOE to expeditiously complete this process and to continue to involve the
states. In 2012, ECOS adopted policy resolution 09-2 to urge the federal government
establish a mercury storage facility under MEBA. The resolution also asked the federal
government to cover any expenses that states may incur in implementing or oversee-
ing the interim transport and storage of excess commodity mercury.
Background: A Decade of Actions
Page 20
15
Third Compendium of States’ Mercury Activities — Part I: National Overview
Table 3
Key U.S. EPA Mercury Activities
2006 to 2012
Final Rules
TSCA Significant New Use Rule for Mercury used in Barometers, Manometers, Hy-
grometers and Psychrometers; 2012
CAA Rule for Hazardous Air Pollutants from Coal-Fired Power Plants (aka Mercury &
Air Toxics Standards for Power Plants); 2012
U.S. EPA Rule to Update Existing Toxics & Air Rules to Reference Revised ASTM
Standards That Allow for Use of Non-Mercury Industrial Thermometers; 2012
CAA Rule for Hazardous Air Pollutants from Industrial, Commercial & Institutional
Boilers & Process Heaters; 2011
CAA Rule for Hazardous Air Pollutants from Sewage Sludge Incinerators, 2011
CAA Rule for Mercury Emissions from Gold Mining; 2011
CAA Rule for Hazardous Air Pollutants from Portland Cement Manufacturing Facili-
ties; 2010
TSCA Significant New Use Rule for Mercury Used in Flow Meters, Natural Gas Ma-
nometers, and Pyrometers; 2010
CAA Rule Amendment for Hospital, Medical & Infectious Waste Incinerators; 2009
CAA Rule for Hazardous Air Pollutants from Electric Arc Furnaces at Steelmaking Fa-
cilities; 2007
TSCA Significant New Use Rule for Mercury Switches in Motor Vehicles; 2007
CAA Rule Amendment for Large Municipal Waste Combustors; 2006
Currently Pending Rules
Final CAA Rule Amendment for Industrial, Commercial & Institutional Boilers & Pro-
cess Heaters
Final CAA Rule Amendment for Hazardous Air Pollutants from Commercial & Indus-
trial Solid Waste Incinerators
Proposed CAA Rule Amendment for Electric Arc Furnaces at Steelmaking Facilities
Final CAA Rule Amendment for Chloralkali Facilities
Proposed CWA Rule to Limit Dental Amalgam Discharges to Wastewater from Dental
Offices
Proposed CWA Rule to Limit Multiple Pollutant Discharges to Wastewater from Power
Plants (Especially Coal-Fired)
Final RCRA Rule for Management of Coal Combustion Residue from Power Plants
Voluntary Initiatives
MOU with American Dental Association and the National Association of Clean Water
Agencies to have dental offices voluntarily install and maintain amalgam separators;
Initiated in 2008
Note: CAA = Clean Air Act ; TSCA = Toxic Substances Control Act; RCRA = Resource Con-
servation and Recovery Act
Background: A Decade of Actions
Page 21
16
Third Compendium of States’ Mercury Activities — Part I: National Overview
Axelrad, D.M., Lange, T., Gabriel, M.C. et al. (2011). South Florida Environmental Report,
chapter 3B: mercury and sulfur monitoring, research and environmental assessment in south
Florida (http://www.dep.state.fl.us/water/sas/mercury/index.htm)
Bergan, T., Gallardo L. and Rohde, H. (1999). Mercury in the global troposphere - a three di-
mensional model study. Atmospheric Environment, 33:1575-1585.
Evers, D. C., J. G. Wiener, C. T. Driscoll, D. A. Gay, N. Basu, B. A. Monson, K. F. Lambert, H.
A. Morrison, J. T. Morgan, K. A. Williams, and A. G. Soehl. (2011). Great Lakes Mercury Con-
nections: The Extent and Effects of Mercury Pollution in the Great Lakes Region. Biodiversity Re-
search Institute Report BRI 2011-18, Gorham, Maine. (See http://www.briloon.org/
mercuryconnections/greatlakes; accessed 8/20/2012)
Gump, B.B., J.A. MacKenzie, A.K. Dumas, C.D. Palmer, Patrick J. Parsons, Zaneer M. Segu,
Yehia S. Mechref, Kestutis G. Bendinskas. (2012). Fish consumption, low-level mercury, lipids,
and inflammatory markers in children. Environmental Research 112:204-211.
Massachusetts Department of Environmental Protection. (2006). Massachusetts Fish Tissue
Mercury Studies: Long-Term Monitoring Results, 1999 – 2004, Office of Research and Stand-
ards, Boston, MA and Wall Experiment Station, Lawrence, MA. (See http://www.mass.gov/
dep/toxics/stypes/hgtrend.pdf; accessed 8/20/2012)
McCann, P. (2011). Mercury Levels in Blood from Newborns in the Lake Superior Basin, Final
Report, Minnesota Department of Health Division of Environmental Health, 625 Robert Street
North P.O. Box 64975 St. Paul, MN. GLNPO ID 2007-942.
McKelvey, W., R Charon Gwynn, N. Jeffery, D. Kass, L.E. Thorpe, R.K. Garg, C. D. Palmer, P.J.
Parsons. (2007). A Biomonitoring Study of Lead, Cadmium, and Mercury in the Blood of
New York City Adults. Environmental Health Perspectives, Vol. 115 (10):1435-1441.
Minnesota Pollution Control Agency. (2007). Minnesota Statewide Mercury Total Maximum
Daily Load Final. (See http://www.pca.state.mn.us/index.php/view-document.html?gid=8507;
accessed 8/20/2012)
Monson, B.A. (2009) Trend Reversal of Mercury Concentrations in Piscivorous Fish from
Minnesota Lakes: 1982-2006. Environ. Sci. Technol. 43:1750-1755.
Monson, B.A., D.F. Staples, S.P. Bhavsar, T. M. Holsen, C. S. Schrank, S. K. Moses, D. J. McGol-
drick, S.M. Backus, K. A. Williams. (2011). Spatiotemporal trends of mercury in walleye and
largemouth bass from the Laurentian Great Lakes Region Ecotoxicology, Vol. 20, Issue 7:1555-
1567
New England Interstate Water Pollution Control Commission. (2007). Northeast Regional
Mercury Total Maximum Daily Load. Boott Mills South 116 John Street, Lowell, MA. (See
http://www.neiwpcc.org/mercury/mercurytmdl.asp , accessed 10/23/2012).
Background: Works Cited
Page 22
17
Third Compendium of States’ Mercury Activities — Part I: National Overview
Background: Works Cited
New Jersey Department of Environmental Protection. (2009). Total Maximum Daily Load for
Mercury Impairments Based on Concentration in Fish Tissue Caused Mainly by Air Deposi-
tion
Park, H. and K. Kim. (2011). Association of blood mercury concentrations with atopic
dermatitis in adults: a population-based study in Korea. Environ Res. 2011;111(4):573–
578.
United Nations Environment Programme. (2008). The Global Atmospheric Mercury
Assessment: Sources, Emissions and Transport. UNEP-Chemicals Branch, Geneva.
(See http://www.chem.unep.ch/mercury/Atmospheric_Emissions/UNEP%
20SUMMARY%20REPORT%20-%20CORRECTED%20May09%20%20final%20for%
20WEB%202008.pdf; accessed 10/21/21012)
United Nations Environment Programme. (2002). Global Mercury Assessment Report. (See
http://www.unep.org/hazardoussubstances/Mercury/MercuryPublications/
ReportsPublications/GlobalMercuryAssessmentReportDecember2002/tabid/3617/Default.aspx;
accessed 10/23/2012).
U.S. EPA Mercury Report to Congress. (1997).
U.S. EPA Office of Air Quality Planning & Standards and Office of Research and De-
velopment. (1997). Mercury Study Report to Congress, Washington, DC. (See http://
www.epa.gov/hg/report.htm; accessed 8/20/2012)
U.S. EPA Office of Toxic Release Inventory Programs, email communication, (2012). TRI
Data for State Mercury Compendium.xlsx file Data were downloaded by U.S. EPA from TRI
on January 27, 2012
Wienert, Adam. Trends in Mercury Use in Products: The Latest Analysis of the Mercury-
Added Products Database. Mercury Science and Policy Conference. Chicago. (November 17,
2009). Available at: http://www.newmoa.org/prevention/mercury/conferences/sciandpolicy/
Page 23
18
Third Compendium of States’ Mercury Activities — Part I: National Overview
Overview of State Mercury Programs
In September 2011, ECOS and the QSC asked states to complete a comprehensive sur-
vey about their efforts to address mercury pollution. This compendium reflects the re-
sponses from the 42 states that completed the 37 question survey and other sources of
information that contain data collected by states (e.g., U.S. EPA databases) or regional
research conducted in collaboration with states (e.g., Regional mercury assessments
coordinated by the Biodiversity Institute). The table below provides a snapshot of
mercury programs in the 42 states participating in the 2011 survey. Summaries of indi-
vidual state efforts based on the survey and other data are provided in Part 2.
Table 1: National Summary of State Mercury Programs
State
Total Number of States 21 29 22 12 42 22 30 16 42
Alabama
Alaska None
Arizona P
Arkansas
California
Colorado
Connecticut
Delaware
Florida P
Hawaii
Mer
cury
Mo
nit
ori
ng
– A
ir D
epo
siti
on
Ov
era
ll M
ercu
ry A
ctio
n P
lan
Inv
ento
ry M
ercu
ry A
ir E
mis
sio
ns
So
urc
es
Mer
cury
Mo
nit
ori
ng
– S
tack
Tes
tin
g
Pa
rtic
ipa
nt
in N
ati
on
al
Veh
icle
M
ercu
ry
Sw
itch
Rec
ov
ery
Pro
gra
m
Mer
cury
Mo
nit
ori
ng
–F
ish
Co
nsu
mp
tio
n A
dv
iso
ry
Pro
gra
ms
to M
an
ag
e M
ercu
ry –
Co
nta
inin
g P
rod
uct
s
Mer
cury
Den
tal
Pro
gra
ms
Sta
te R
equ
irem
ents
fo
r M
ercu
ry
Sw
itch
Rec
ov
ery
Pro
gra
m
Page 24
19
Third Compendium of States’ Mercury Activities — Part I: National Overview
Overview of State Mercury Programs
Table 1: National Summary of State Mercury Programs
State
Idaho
Illinois
Indiana
Iowa
Kansas
Kentucky
Louisiana
Maine
Maryland
Massachusetts
Michigan
Minnesota
Missouri
Montana None
Nebraska
New Hampshire
New Jersey P
New Mexico None
New York
North Carolina
Mer
cury
Mo
nit
ori
ng
– A
ir D
epo
siti
on
Ov
era
ll M
ercu
ry A
ctio
n P
lan
Inv
ento
ry M
ercu
ry A
ir E
mis
sio
ns
So
urc
es
Mer
cury
Mo
nit
ori
ng
– S
tack
Tes
tin
g
Pa
rtic
ipa
nt
in N
ati
on
al
Veh
icle
M
ercu
ry
Sw
itch
Rec
ov
ery
Pro
gra
m
Mer
cury
Mo
nit
ori
ng
–F
ish
Co
nsu
mp
tio
n A
dv
iso
ry
Pro
gra
ms
to M
an
ag
e M
ercu
ry –
Co
nta
inin
g P
rod
uct
s
Mer
cury
Den
tal
Pro
gra
ms
Sta
te R
equ
irem
ents
fo
r M
ercu
ry
Sw
itch
Rec
ov
ery
Pro
gra
m
Page 25
20
Third Compendium of States’ Mercury Activities — Part I: National Overview
Overview of State Mercury Programs
Mer
cury
Mo
nit
ori
ng
– A
ir D
epo
siti
on
Ov
era
ll M
ercu
ry A
ctio
n P
lan
Inv
ento
ry M
ercu
ry A
ir E
mis
sio
ns
So
urc
es
Mer
cury
Mo
nit
ori
ng
– S
tack
Tes
tin
g
Pa
rtic
ipa
nt
in N
ati
on
al
Veh
icle
M
ercu
ry
Sw
itch
Rec
ov
ery
Pro
gra
m
Mer
cury
Mo
nit
ori
ng
–F
ish
Co
nsu
mp
tio
n A
dv
iso
ry
Pro
gra
ms
to M
an
ag
e M
ercu
ry –
Co
nta
inin
g P
rod
uct
s
Mer
cury
Den
tal
Pro
gra
ms
Sta
te R
equ
irem
ents
fo
r M
ercu
ry
Sw
itch
Rec
ov
ery
Pro
gra
m
Table 1: National Summary of State Mercury Programs
State
North Dakota
Ohio None
Oklahoma None
Oregon None
Rhode Island None
South Carolina
Texas
Utah P
Vermont
Washington
West Virginia
Wisconsin
P= Plan under development Blank = No Response
Page 26
21
Third Compendium of States’ Mercury Activities — Part I: National Overview
BLANK PAGE
Page 27
22
Third Compendium of States’ Mercury Activities — Part I: National Overview
State and local officials continue to use diverse approaches to address reducing mercu-
ry in products, mercury emissions and mercury contamination. As state mercury pro-
grams have progressed, these approaches have evolved from piecemeal approaches
(i.e., not part of a coordinated comprehensive program to reduce and eliminate mercu-
ry uses and releases) towards a continually growing trend of developing comprehen-
sive programs. States recognize the need for a broader commitment to phase out per-
sistent toxic chemicals like mercury. Another emerging trend is for coordinated efforts
between media programs, such as air, solid waste, and water. Thirty-nine (95 percent)
of the 42 states responding to the 2011 survey consider coordinated efforts between
media programs to be important to responding to the challenge of inadequate authori-
ty under the Clean Water Act to address impacts attributable to air deposition of mer-
cury from national and international sources.
As the map below illustrates, 21 of the 42 states (50 percent) responding to the 2011
survey have an overall mercury reduction plan or strategy document in place, and sev-
en more states are developing or plan to develop one in the future. In 2005, 16 states
had mercury reduction plans or strategies and six states indicated that they were de-
veloping or planned to develop one in the future. Four of the six states that indicated
in 2005 that they were planning, or had an interest in developing, an action plan now
have mercury reduction plans or strategies in place.
Mercury Reduction Plans and Strategies
Page 28
23
Third Compendium of States’ Mercury Activities — Part I: National Overview
For those 21 states with an action plan or strategy in 2011, the most commonly report-
ed major elements in these documents are:
Mercury recycling
Public outreach and education to reduce exposure
Small business and household mercury waste management
Emission reduction
Medical and dental mercury waste management
Reduction of mercury use in consumer products
Even states without comprehensive mercury strategies are participating in task forces
or workgroups; and/or regional, multistate, or bi-national initiatives, specifically
focused on mercury issues. All 42 of the responding states participate in national col-
laboration efforts. These initiatives and collaborative efforts focus on a range of mer-
cury issues such as: the health effects of mercury; fish consumption advisories; mercu-
ry air emissions; mercury-containing products; mercury’s impact on public health;
government procurement; health care uses; public education; mining; and total maxi-
mum daily loads (TMDLs).
Coordination and Collaboration — Key Elements of
State Plans and Strategies
States indicate that they consider coordination between state and federal governments
(86 percent) and among states (83 percent) as key elements for addressing mercury
pollution. These coordination efforts are especially critical as states address a variety
of challenges including the lack of authority under national and state water pollution
programs to reduce air deposition of mercury. Mercury deposition is not only a state
issue; coordinated regional, national, bi-national, and international efforts are essential
to address this aspect of the mercury problem in order to maximize the effectiveness
of state mercury reduction strategies. Coordination and information exchange at all
levels also allow for the more efficient use of state resources to address mercury is-
sues. Sharing of information and capacity building between states and with U.S. EPA
also helps reduce program costs and harmonize efforts by enhancing regulatory cer-
tainty and consistency for various stakeholders. By building upon state and regional
efforts to date, working together toward a common goal of reducing mercury use and
emissions, and restoring land and water, the states have made much progress.
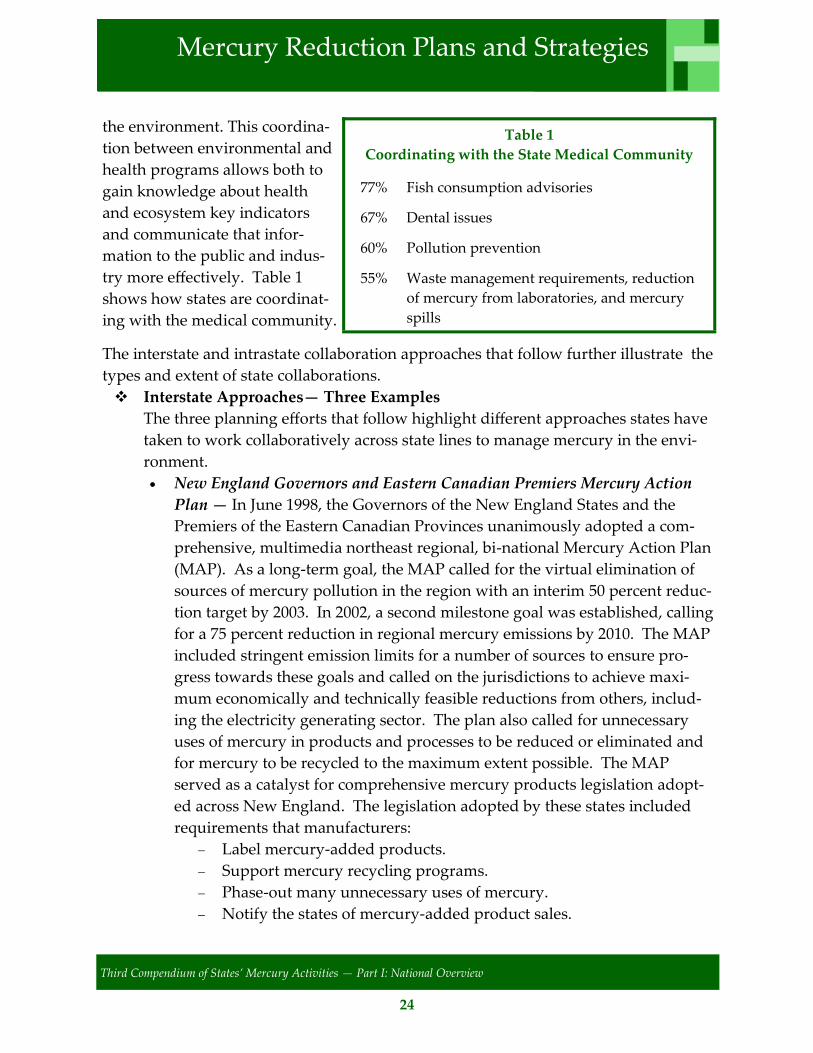
State environmental agencies are collaborating more with the medical community as
their programs evolve towards a more comprehensive approach for addressing mer-
cury in the environment. This coordination between environmental and health pro-
grams evolve towards a more comprehensive approach for addressing mercury in
Mercury Reduction Plans and Strategies
Page 29
24
Third Compendium of States’ Mercury Activities — Part I: National Overview
the environment. This coordina-
tion between environmental and
health programs allows both to
gain knowledge about health
and ecosystem key indicators
and communicate that infor-
mation to the public and indus-
try more effectively. Table 1
shows how states are coordinat-
ing with the medical community.
The interstate and intrastate collaboration approaches that follow further illustrate the
types and extent of state collaborations.
Interstate Approaches— Three Examples
The three planning efforts that follow highlight different approaches states have
taken to work collaboratively across state lines to manage mercury in the envi-
ronment.
New England Governors and Eastern Canadian Premiers Mercury Action
Plan — In June 1998, the Governors of the New England States and the
Premiers of the Eastern Canadian Provinces unanimously adopted a com-
prehensive, multimedia northeast regional, bi-national Mercury Action Plan
(MAP). As a long-term goal, the MAP called for the virtual elimination of
sources of mercury pollution in the region with an interim 50 percent reduc-
tion target by 2003. In 2002, a second milestone goal was established, calling
for a 75 percent reduction in regional mercury emissions by 2010. The MAP
included stringent emission limits for a number of sources to ensure pro-
gress towards these goals and called on the jurisdictions to achieve maxi-
mum economically and technically feasible reductions from others, includ-
ing the electricity generating sector. The plan also called for unnecessary
uses of mercury in products and processes to be reduced or eliminated and
for mercury to be recycled to the maximum extent possible. The MAP
served as a catalyst for comprehensive mercury products legislation adopt-
ed across New England. The legislation adopted by these states included
requirements that manufacturers:
Label mercury-added products.
Support mercury recycling programs.
Phase-out many unnecessary uses of mercury.
Notify the states of mercury-added product sales.
Mercury Reduction Plans and Strategies
Table 1
Coordinating with the State Medical Community
77% Fish consumption advisories
67% Dental issues
60% Pollution prevention
55% Waste management requirements, reduction
of mercury from laboratories, and mercury
spills
Page 30
25
Third Compendium of States’ Mercury Activities — Part I: National Overview
In addition, the MAP addressed mercury in schools, calling for educational
and mercury clean-out activities. It also addressed mercury pollution
attributable to the dental sector, which has resulted in state laws across New
England requiring the use of amalgam wastewater pollution controls
(amalgam separators) by dental offices. These efforts led to estimated
reductions in mercury emissions of 55 percent by 2003 compared to a mid-
1990s baseline across New England and Eastern Canada. By 2010 emissions
were estimated to be down by approximately 75 percent with municipal
waste combustors, medical waste incinerators, and chlor-alkalai plants re-
duced by over 90 percent. Some states report overall mercury emissions re-
ductions in the 89-91 percent range. More details on the MAP and accom-
plishments can be found at http://www.ncbi.nlm.nih.gov/pubmed/15931956;
and http://www.newmoa.org/prevention/mercury/.
Gulf of Mexico Alliance — The Gulf of Mexico Alliance is a partnership initi-
ated in 2004 by the states of Alabama, Florida, Louisiana, Mississippi, and
Texas for the purpose of significantly increasing regional collaboration to en-
hance the ecological and economic health of the Gulf of Mexico. The Alliance
has identified water quality as one of six priority issues that are regionally
significant and can be effectively addressed through increased collaboration
at the local, state, and federal levels. One of the long term goals for water
quality is to reduce the risk of mercury-induced health effects from Gulf sea-
food consumption.
Great Lakes Regional Collaboration — The Great Lakes Regional Collabora-
tion (GLRC) is a wide-ranging cooperative effort to design and implement a
strategy for the restoration, protection, and sustainable use of the Great
Lakes. In 2003, at the request of a Great Lakes congressional delegation and
as a first step in providing the leadership and coordination, the Council of
Great Lakes Governors (CGLG) identified nine priorities for Great Lakes res-
toration and protection.
Following a Presidential Executive Order that created a cabinet-level Great
Lakes Interagency Task Force; city, state, tribal, and federal units of govern-
ment convened to create what has become the GLRC. The GLRC created a
Strategy to Restore and Protect the Great Lakes, which was released in 2005.
This strategy built on eight of the nine CGLC priorities. Mercury is ad-
dressed primarily under the GLRC priority to continue to reduce the intro-
duction of persistent bioaccumulative toxics in the Great Lakes ecosystem.
Under the direction of the GLRC, the eight Great Lakes States and the
Mercury Reduction Plans and Strategies
Page 31
26
Third Compendium of States’ Mercury Activities — Part I: National Overview
Mercury Reduction Plans and Strategies
U.S. EPA staff produced a Mercury Phase-down Strategy in 2008 and a Mercu-
ry Emissions Reduction Strategy in 2010 (http://www.glrc.us). Both strategies
are designed to motivate and achieve reductions that would not be achieved
through existing requirements. This strategy built on eight of the nine
CGLC priorities. Mercury is addressed primarily under the GLRC priority
to continue to reduce the introduction of persistent bioaccumulative toxics in
the Great Lakes ecosystem. Under the direction of the GLRC, the eight
Great Lakes States and the U.S. EPA staff produced a Mercury Phase-down
Strategy in 2008 and a Mercury Emissions Reduction Strategy in 2010 (http://
www.glrc.us). Both strategies are designed to motivate and achieve reduc-
tions that would not be achieved through existing requirements.
Intrastate Approaches — State environmental agencies are collaborating more
with the medical community as their programs evolve toward a more compre-
hensive approach for addressing mercury in the environment. This coordina-
tion between environmental and health programs allows both to gain
knowledge about health and ecosystem key indicators and communicate that
information to the public and industry more effectively.
State Perspectives: Needs and Challenges
Although there is no shortage of challenges to solving our country’s mercury contami-
nation problems, several themes and needs were repeatedly expressed by states com-
pleting this survey.
Access to long-term elemental mercury storage — Currently, only the United
States Department of Defense (DOD) maintains a mercury stockpile. States,
both individually and through ECOS and QSC, have expressed a need for the
federal government to organize a national long-term mercury storage program
for many years. Permanent storage and sequestration opportunities are needed
within the U.S. to remove excess elemental mercury from commerce.
The Mercury Export Ban Act of 2008 (Public Law 110-414) prohibits the export
of elemental mercury from the U.S. beginning in 2013, and provides a process
for U.S. EPA to issue limited exemptions for ‘essential uses.’ For further infor-
mation, see U.S. EPA’s Questions and Answers about the Mercury Export Ban
Act of 2008, based on its interpretation of the Act, at www.epa.gov/mercury/
exportban-ques.htm.
Page 32
27
Third Compendium of States’ Mercury Activities — Part I: National Overview
Mercury Reduction Plans and Strategies
The law requires the Secretary of the United States Department of Energy (U.S.
DOE) to designate one or more facilities for the purpose of long-term manage-
ment and storage of elemental mercury generated within the U.S. In January
2011, U.S. DOE issued an Environmental Impact Statement regarding the site
evaluation and selection process to identify a facility or facilities for the reposi-
tory. This was completed with consultation and input from the states. This Fi-
nal Mercury Storage Environmental Impact Statement (EIS) analyzed the po-
tential environmental, human health, and socioeconomic impacts of elemental
mercury storage at seven candidate locations:
Grand Junction Disposal Site near Grand Junction, Colorado
Hanford Site near Richland, Washington
Hawthorne Army Depot near Hawthorne, Nevada
Idaho National Laboratory near Idaho Falls, Idaho
Kansas City Plant in Kansas City, Missouri
Savannah River Site near Aiken, South Carolina
Waste Control Specialists, LLC, site near Andrews, Texas
The U.S. DOE’s Preferred Alternative for the long-term management and stor-
age of mercury in the current EIS is the Waste Control Specialists, LLC, site
near Andrews, Texas. Due to federal budgetary constraints the money neces-
sary to proceed with the construction of the mercury storage facility has not
been allocated.
The QSC sent a letter to the Secretary of the U.S. DOE in May 2012, urging U.S.
DOE to request sufficient funds to finalize site selection and operational com-
pletion of the national elemental mercury storage facility in its FY 2013 budget,
and in future budgets as necessary, and to move expeditiously to complete the
facility and commence operations.
At this time, it is unclear when U.S. DOE will proceed with the construction of
a national repository for elemental mercury. It is also unclear what mercury
storage options are viable after the effective date of the export ban until such
time as a national repository is operational. Mercury will need to be stored in
Resource Conservation and Recovery Act (RCRA) permitted storage facilities
until such time as one or more national repositories are established. In June
2012, DOE announced its intent to prepare a supplement to the January 2011
Environmental Impact Statement for the Long-Term Management and Storage of
Elemental Mercury to evaluate the potential environmental impacts of identify-
ing a facility or facilities at and in the vicinity of the Waste Isolation Pilot
Page 33
28
Third Compendium of States’ Mercury Activities — Part I: National Overview
Mercury Reduction Plans and Strategies
Plant near Carlsbad, New Mexico. The goal is to issue a Record of Decision in early
2013. In 2012, ECOS adopted policy resolution 09-2 to urge the federal government to
finalize and establish a mercury storage facility under MEBA. The resolution also
asked the federal government to cover any expenses that states may incur in imple-
menting or overseeing the interim transport and storage of excess commodity
mercury.
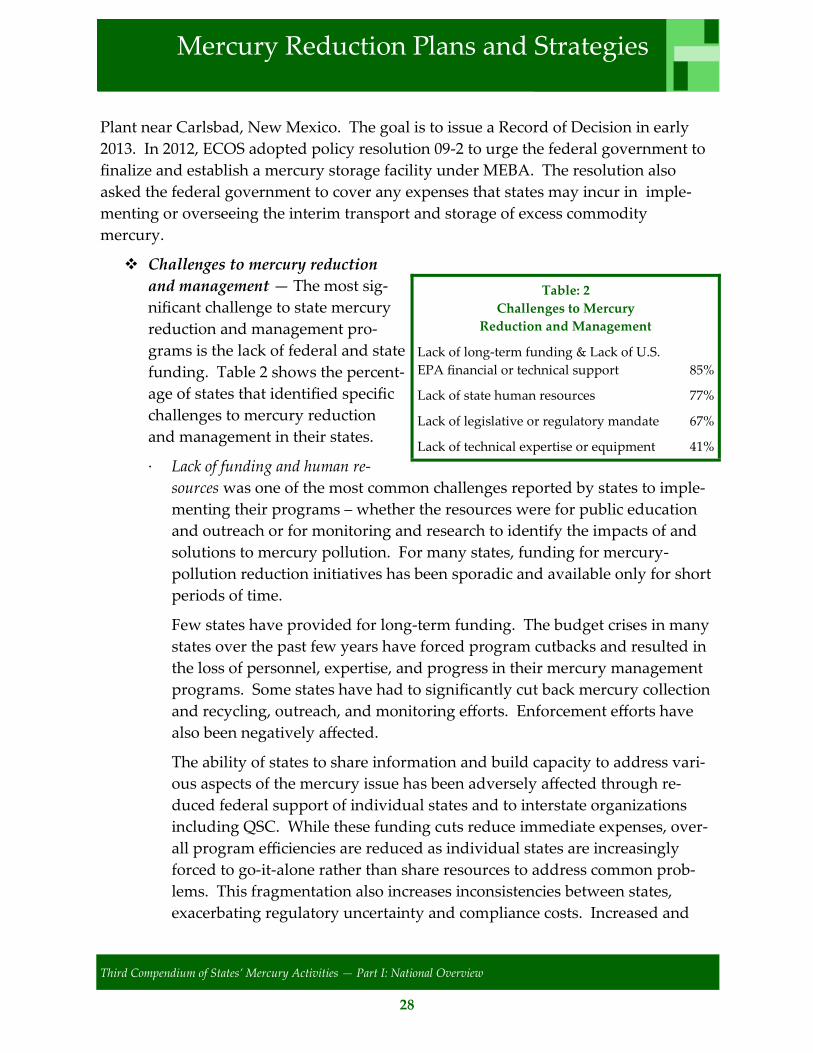
Challenges to mercury reduction
and management — The most sig-
nificant challenge to state mercury
reduction and management pro-
grams is the lack of federal and state
funding. Table 2 shows the percent-
age of states that identified specific
challenges to mercury reduction
and management in their states.
· Lack of funding and human re-
sources was one of the most common challenges reported by states to imple-
menting their programs – whether the resources were for public education
and outreach or for monitoring and research to identify the impacts of and
solutions to mercury pollution. For many states, funding for mercury-
pollution reduction initiatives has been sporadic and available only for short
periods of time.
Few states have provided for long-term funding. The budget crises in many
states over the past few years have forced program cutbacks and resulted in
the loss of personnel, expertise, and progress in their mercury management
programs. Some states have had to significantly cut back mercury collection
and recycling, outreach, and monitoring efforts. Enforcement efforts have
also been negatively affected.
The ability of states to share information and build capacity to address vari-
ous aspects of the mercury issue has been adversely affected through re-
duced federal support of individual states and to interstate organizations
including QSC. While these funding cuts reduce immediate expenses, over-
all program efficiencies are reduced as individual states are increasingly
forced to go-it-alone rather than share resources to address common prob-
lems. This fragmentation also increases inconsistencies between states,
exacerbating regulatory uncertainty and compliance costs. Increased and
Table: 2
Challenges to Mercury
Reduction and Management
Lack of long-term funding & Lack of U.S.
EPA financial or technical support 85%
Lack of state human resources 77%
Lack of legislative or regulatory mandate 67%
Lack of technical expertise or equipment 41%
Page 34
29
Third Compendium of States’ Mercury Activities — Part I: National Overview
sustained funding from state and federal governments remains critical to
efficiently addressing the mercury pollution problem.
· Lack of authority through enabling legislation keeps many state agencies from
initiating efforts to encourage or require mercury pollution reductions. State
legislatures need to authorize and provide guidance and financial support
for efforts to address this and other persistent, bioaccumulative and toxic
(PBT) chemical problems.
Mercury Reduction Plans and Strategies
Page 35
30
Third Compendium of States’ Mercury Activities — Part I: National Overview
Global aspects of the mercury issue are a significant concern to the QSC due to the
fact that much of the mercury pollution impacting the states is from air deposition
attributable to international emission sources and the global recirculation of historical
releases. The QSC role in the global arena began during the 2000 Environmental
Council of the States (ECOS) Mercury Workshop in St. Louis, Missouri — the first
national effort by state environmental leaders to coordinate on actions to address
mercury pollution. Discussion during the symposium highlighted the need for U.S.
leadership on an international scale to reduce sources of mercury impacting the
states. One of the outcomes of that workshop was a request that ECOS draft a resolu-
tion to the President and Congress articulating the need for a global mercury strategy
designed to reduce mercury pollution at the national and international levels. Partici-
pants also noted that the states should seek out opportunities to share their experi-
ences and mercury reduction strategies with each other as well as with other
countries. The QSC has played an increasing role in the global arena since then and
today participates in international mercury policy, reduction, outreach, and capacity
building efforts.
Developing National Policy Positions
The QSC has actively engaged with its federal partners on a number of global mercu-
ry issues and has consistently called for international action to reduce global mercury
pollution since 2001 (see http://www.ecos.org/section/committees/cross_media/
quick_silver). These positions which have been articulated in several resolutions
drafted by the QSC and endorsed by ECOS, are described in Table 1 on page 31 —
and see http://www.ecos.org/section/policy/resolution.
Providing Policy and Technical Expertise
In addition to the policy positions articulated in the resolutions noted above, the QSC
has also provided state technical expertise and perspectives to the following interna-
tional initiatives:
UNEP GMA, which identified mercury as a significant global environmental
and public health problem (United Nations Environment Programme, 2001;
http://www.chem.unep.ch/mercury/Report/GMA-report-TOC.htm
Voluntary Global Mercury Partnerships, established under UNEP with the
support of the U.S. under the Bush and Obama Administrations to better coor-
dinate mercury partnerships and more rapidly advance international efforts
Global Mercury
Page 36
31
Third Compendium of States’ Mercury Activities — Part I: National Overview
Global Mercury
Table 1: Active ECOS Resolutions
Number, Title ,and Key Actions
03-7, approved August 11, 2003, reaffirmed August 29, 2006, revised September 22, 2009, and revised
August 28, 2012. The Need for Actions to Achieve Further Progress on Reducing Water Quality from
Atmospheric Mercury
Calls on the Administration, U.S. EPA and the State Department to support efforts through
the United National Environmental Programme (UNEP) to develop an international agree-
ment to significantly reduce global sources of mercury pollution that impact states;
Requests that U.S. EPA and other federal agencies, in consultation with the States, develop
national and international strategies that will lead to direct actions to reduce mercury pollu-
tion and that are informed by, and consistent with, the mercury reduction initiatives devel-
oped by the States and the QSC; and,
Affirms that ECOS and QSC members are committed to being active partners with U.S. EPA
in developing and implementing a national strategy and international agreement.
07-1, approved March 20, 2007 and revised March 24, 2010. Implementing a National Vision for Mercury
Calls on the President of the United States and the U.S. Congress to continue to pursue sub-
stantial reductions in mercury releases into the environment at the national and international
levels;
Urges the federal government and other interested and affected parties to continue to work
with States to ensure the safety of long term storage plans for mercury in excess of essential
needs; take all appropriate measures to prevent introduction of excess mercury supplies into
the global marketplace; and exercise leadership in appropriate international forums to work
toward substantial global reductions in mercury production, uses, and releases; and,
Applauds U.S. leadership in efforts to address mercury on a global scale and urges the federal
government to continue to work in collaboration with the States towards a binding interna-
tional agreement that will achieve reductions in global sources of mercury pollution necessary
to address mercury deposition in our states, and to identify and develop necessary tools and
resources to enable the federal government and the States to effectively implement any such
agreement.
08-5, approved April 15, 2008 and revised March 29, 2011. Beyond EPA’s Clean Air Mercury Rule
Calls on U.S. EPA and the U.S. State Department to continue to advocate for strong global
efforts to reduce sources of mercury pollution.
09-2, approved March 23, 2009 and revised August 28, 2012, Mercury Reduction, Stewardship, and Retire-
ment
Commends U.S. EPA and the U.S. State Department for supporting international mercury
reduction efforts and for seeking state input into these efforts; and requests that the federal
government continue to involve the states in the development of an international mercury
treaty.
Page 37
32
Third Compendium of States’ Mercury Activities — Part I: National Overview
Global Mercury
to address “low-hanging” mercury reduction and research opportunities in var-
ious sectors (UNEP Global Mercury Partnerships, http://www.chem.unep.ch/
mercury/partnerships/new_partnership.htm).
Current negotiations for an international mercury agreement are being carried
out under the framework of the UNEP Global Mercury Assessment (GMA)
(http://www.unep.org/hazardoussubstances/MercuryNot/
MercuryNegotiations/tabid/3320/language/en-US/Default.aspx).
Building International Capacity
States are also sharing scientific and policy information and assisting in international
capacity building to advance mercury reduction efforts when possible. This has been
accomplished, with U.S. EPA funding and in-kind state support, through the State
Mercury Resource Network,
established by the QSC to identi-
fy state technical, scientific, and
policy experts to assist the Glob-
al Mercury Partnerships, and to
share information in other inter-
national mercury reduction and
outreach forums. Key areas
where the states have assisted
capacity building efforts include:
initiatives to address mercury-
added products, the dental sec-
tor, and mercury emission
sources; state supported mercu-
ry monitoring and research;
mercury TMDL development
and implementation; and the use
of science and policy by the
states to reduce mercury use and
releases. A summary of the
State Mercury Resource Net-
work activities is provided in
Table 2.
Table 2:
State Mercury Resource Network Activities
Mercury in Products Technical Workshop (Taipei, Taiwan in
October 2007) – Presented on the significance of mercu-
ry products as a source of releases. Highlighted success-
ful state mercury reduction strategies addressing mercu-
ry in products, the health care sector, and the dental sec-
tor.
Mercury in Our World Conference on Mercury and Other
Hazardous Chemicals in Southeast Asia (Bangkok,
Thailand in April 2008) – Provided information to stu-
dents, teachers, and administrators about chemical safe-
ty, including mercury, in Southeast Asia schools and
homes.
9th International Conference on Mercury as a Global Pollu-
tant (Guiyang, China in June 2009) – Presented infor-
mation on state-level initiatives that address mercury-
added products, dental sector mercury reduction initia-
tives, and the use of science and policy to reduce mercu-
ry use and releases.
8th and 10th International Conferences on Mercury as a
Global Pollutant (Madison, Wisconsin in 2007 and No-
va Scotia, Canada in 2011) -- Presented on state mercury
reduction accomplishments.
Society of Environmental Toxicology and Chemistry
(Boston, Massachusetts in 2011) -- Presented on mercury
monitoring, research, and policy initiatives by the states
to international group of toxicologists and chemists.
Page 38
33
Third Compendium of States’ Mercury Activities — Part I: National Overview
Through the QSC, the states continue to provide the U.S. State Department and U.S.
EPA with information on state concerns, activities, and successes to help inform U.S.
positions during the ongoing UNEP negotiations towards a global mercury agreement.
See the copy of the most recent letter at http://www.ecos.org/
files/4794_file_Letter_to_DOE_on_Mercury_Storage_Final_8_May_2012.pdf
To date, the QSC has suggested that the final global agreement should reflect:
Successful state mercury programs in order to ensure effective and timely re-
ductions in mercury use and emissions from significant international mercury
pollution sources that impact the states.
Better global mercury emissions and use inventories.
Inclusion of mercury reduction targets, timelines and mechanisms to assess and
verify progress in any agreement.
The QSC continues to be engaged in the global arena to address sources beyond our
borders because international sources contribute to mercury pollution and exposure in
the U.S. and globally, degrading our environment and threatening children’s health
worldwide. QSC outreach and capacity building efforts have helped to raise interna-
tional awareness about mercury reduction opportunities and have enhanced the abili-
ties of many countries to implement near-term mercury pollution prevention and con-
trol actions. In order to ensure long-term progress and to better level the playing field,
the QSC is also providing input on state perspectives, successful state strategies, and
scientific and technical information to help inform the ongoing UNEP negotiations to-
wards a global mercury agreement. The QSC remains committed to further assisting in
this process.
Global Mercury
Page 39
34
Third Compendium of States’ Mercury Activities — Part I: National Overview
This section of the compendium provides a summary of information submitted by the
42 state programs that responded to the QSC survey, and describes the sources of mer-
cury in the environment based on national data.
State Programs
In the compendium survey (conducted in 2011), the majority of the 42 responding
states, 33 (79 percent) indicated that they have inventories of mercury air emission
sources, 13 (31 percent) have inventories of releases from water pollution sources and
seven (17 percent) from products and solid wastes. Six states indicated they also in-
ventory mercury used in products and processes. Sixteen states have published mer-
cury release data for their instate sources since 2000 and 18 states provided web links
to their state inventory data, where additional information may be found on state spe-
cific emission sources and regulations.
Appendix S-A summarizes the data for state responses to the survey about:
Specific mercury air emission point source categories that are present in their
state.
Whether requirements are in place for each category that are more stringent
than those adopted by U.S. EPA.
Statewide monitoring requirements that are in place for various source catego-
ries.
These data show that:
A significant number of states have statewide requirements in place, some of
which preceded and/or are more stringent than U.S. EPA rules promulgated by
2011, including 15 that address coal-fired electric power plants; nine for munici-
pal solid waste combustors; seven each for sewage sludge incinerators, medical
waste incinerators and scrap auto dismantlers; five for electric arc furnaces; and
four for cement kilns.
A relatively small percentage of states indicated that they had statewide re-
quirements in place to monitor or otherwise measure mercury releases from
mercury emission source categories. Instead, it is likely that many states assess
emissions from these sources through individual facility permit requirements
or through the use of emission factors.
Sources of Mercury
Page 40
35
Third Compendium of States’ Mercury Activities — Part I: National Overview
National Data
The two national databases described in Table 1 provide information on releases of
mercury to the environment – the National Emission Inventory (NEI) and the Toxics
Release Inventory (TRI) — and are both maintained by U.S. EPA.
These two national databases provide valuable information about sources of mercury
pollution. However, they differ in important respects:
The NEI addresses only releases to the air. Air emissions are inventoried at the
process level and process-level emis-
sions are apportioned to release param-
eters to support fate and transport
analyses. Estimates are reported by
state, local, and tribal agencies or devel-
oped by U.S. EPA, with both parties
using a variety of different methods to
derive the process-level emissions,
ranging from continuous emissions
monitoring to emission factors. The
NEI covers some sources of air emis-
sions (e.g., municipal incinerators) that
are not covered by TRI reporting.
The TRI provides data on release and
other waste management quantities of
more than 650 chemicals or chemical
categories to air, water, and land, in ad-
dition to other data and information.
Release and other waste management
quantities are usually estimates based
on readily available information and
are self-reported by thousands of facilities.
Over time there have been changes in NEI emission estimation methods, TRI reporting
requirements, and in categorization approaches that need to be taken into account
when conducting year-to-year comparisons of data within either database1. NEI esti-
mation approaches have also changed, with a trend towards use of more robust emis-
sions monitoring data. The NEI and TRI estimates for mercury emissions for a given
year are expected to, and do, differ from one another. Additionally, comparisons
Sources of Mercury
Table 1
U.S. EPA National Databases
National Emission Inventory (NEI)
Presents detailed estimates of air emis-
sions of criteria and hazardous air pol-
lutants from all sources.
Updated every three years based pri-
marily upon emission information pro-
vided by state, local, and tribal environ-
mental agencies, supplemented in some
cases by data developed by the U.S.
EPA.
www.epa.gov/ttn/chief/eiinformation.html.
Toxics Release Inventory (TRI)
Contains detailed information on the
management of chemicals by industries
and other institutions.
Includes data on releases to the air, wa-
ter and land from over 23,000 facilities.
Data is self-reported and collected an-
nually
www.epa.gov/tri
Page 41
36
Third Compendium of States’ Mercury Activities — Part I: National Overview
across and within each database must carefully consider whether changes in estimated
releases may be attributable to differing reporting requirements and/or estimation
methodologies over time. Thus, the percentage changes in emissions over time sum-
marized in the next sections should be viewed as approximations rather than precise
values.
Both elemental mercury and all compounds that contain mercury are included on the
TRI list of toxic chemicals. When facilities determine whether they have manufactured,
processed or otherwise used more than 10 pounds of a mercury compound (or com-
pounds) in a calendar year (i.e., have exceeded any of the reporting thresholds for a
mercury compound or compounds), the entire mass of the compound (or compounds)
manufactured, processed or otherwise used within a calendar year is considered. If
any of the thresholds were exceeded, only the mass of the mercury portion of the com-
pound that is released or otherwise managed as waste is to be reported. Thus, if with-
in a given calendar year a facility subject to the TRI reporting requirements manufac-
tures, processes, or otherwise uses more than 10 pounds of a mercury compound
(or compounds), the facility only reports the mass of the mercury portion of the
compound (or compounds) that is released or otherwise managed as waste, not the
mass of the mercury compound (or mercury compounds).
Sources and Trends – National Perspective
National Emission Inventory — Source sector emission estimates from the NEI
are summarized in Table 2 on the page 38 and the 2005 distribution of emissions
across various source categories is summarized in Figure 1 on page 37. These
data were provided by U.S. EPA and are grouped according to mercury emis-
sion regulatory sectors.
As indicated in Table 2 on page 38, the NEI data indicate that 61 tons of mer-
cury were emitted in 2008, a decrease of 185 tons or 75 percent since 1990.
In the early 1990s, Municipal Solid Waste Combustors (MSWC), Medical
Waste Incinerators (MWI), and coal-fired electricity generating utility boilers
(EGU) were the largest mercury emission sources reported to the NEI, each
accounting for over 50 tons of emissions per year.
By 2005, as a result of state and federal actions, NEI emission estimates for
MSWC and MWI were reduced by over 95 percent while emissions from
coal-fired electric generating units (EGUs) remained at over 50 tons per year,
the largest source category accounting for about 50 percent of the total
inventory.
Sources of Mercury
Page 42
37
Third Compendium of States’ Mercury Activities — Part I: National Overview
Figure 1: 2005 U.S. Anthropogenic Mercury Emissions Figure provided by U.S. EPA, Office of Pollution Prevention & Toxics, March 2012
Hospital/Medical/Infectious
Waste Incinerators
0.2%
Commercial/Industrial Solid
Waste Incinerators
1.0%
Mobile
Sources 1.1%
Mercury Cell Chloralkali
Plant 3.0%
Industrial/
Institutional Boilers & Heaters 6.1%
Miscellaneous Very Small
Sources
17.4%
Portland Cement
Hazardous Waste
7.1%
Electric Arc Furnaces 6.7%
Hazardous Waste
Incinerators 3.1%
Gold Mining
2.4%
Municipal Solid Waste
Combustors
2.2%
Utility Coal Boilers
49.7%
Sources of Mercury
The 2008 NEI data indicate that emissions from the coal-fired EGU sector
decreased to about 29.5 tons. The U.S. EPA attributes this significant de-
crease, in part, to the installation of mercury emission controls to comply
with state requirements; co-benefit reductions in mercury emissions due to
the installation of control devices targeting other pollutants (including sul-
fur dioxide and particulate matter as required by other state and federal reg-
ulations); fuel switching; and voluntary reductions2.
Page 43
38
Third Compendium of States’ Mercury Activities — Part I: National Overview
In 2008 the five largest emission sources were coal-fired utility boilers (29.5
tons/year), electric arc furnaces (4.7 tons/year), industrial/commercial/
institutional boilers and process heaters (4.5 tons/year), Portland cement
manufacturing non-hazardous waste (4.2 tons/year), and gold mining (1.7
tons/year).
Table 2
NEI Source Sector Emission Estimates (tons per year)3
Source
Category
1990 a
2005 b
2008 c
Coal-fired Electricity Generating Utility Boilers 58.8 52.2 29.5
Municipal Waste Combustors 57.2 2.3 1.3
Hospital/Medical/ Infectious Waste Incineration 51 0.2 0.1
Industrial/Commercial/
Institutional Boilers and Process Heaters
14.4 6.4 4.5 d
Mercury Cell Chloralkali Plants 10 3.1 1.3
Electric Arc Furnaces 7.5 7.0 4.7
Commercial/Industrial Sold Waste Incineration Not availa-
ble
1.1 0.02
Hazardous Waste Incineration 6.6 3.2 1.3
Portland Cement Non-Hazardous Waste 5.0 7.5 4.2
Gold Mining 4.4 2.5 1.7
Sewage Sludge Incineration 2 0.3 0.45
Mobile Sources Not availa-
ble
1.2 1.7
Other Categories 29.5 18 10.3
Total (all categories) 246 105 61
Baseline NEI for HAPs, 11/14/2005 b 2005 MATS proposal, 3/15/2011 c 2008 NEI v21 d For Industrial/Commercial/Institutional Boilers and Process Heaters, the 2008 NEI v2 raw data (i.e., in
“epa_2008_nei_v2 Hg.accdb”) sums to 4.0 tons, but U.S. EPA has included the additional known 0.5
tons in this table.
Sources of Mercury
Page 44
39
Third Compendium of States’ Mercury Activities — Part I: National Overview
The complete 2008 NEI database is available at http://www.epa.gov/ttn/chief/
net/2008inventory.html. This NEI database includes information on emissions of
many pollutants in addition to mercury. Although it is organized using different sec-
tor groupings, and is thus not directly comparable to the mercury emission categories
presented in Figure 1 and Table 2, since this database allows for state-by-state mercury
emission estimates to be derived that are not otherwise available for a variety of sector
categories, it was used as the basis of the state emission estimates presented in the Ap-
pendices S-B and S-C. In total, the NEI database indicates that 41 source categories
emitted greater than ten pounds of mercury per year (see Appendix S-B). State-by-
state emissions data, based on the 2008 NEI data for the top 10 national NEI emission
sector categories, are presented in Appendix S-C.
Toxics Release Inventory
Table 3 below summarizes TRI data for releases of mercury, as elemental mercury in
its neutral form and mercury from mercury compounds to air, water, and land for
several years. As noted previously the annual reporting threshold for mercury and
mercury compounds was reduced from 25,000 pounds (for manufacturing and pro-
cessing mercury or mercury compounds) and 10,000 pounds (for otherwise using
Sources of Mercury
Table 3: TRI Mercury Releases (pounds/year)*
Year
Releases to land/
surface impound-
ments
Total air
emissions
Surface water
discharges
Underground
Injection Other
2002 4,877,663 145,712 1,112 11,360 132,079
2005 4,127,290 140,040 713 8,711 100,423
2008 6,200,299 125,888 3,104 5,819 87,734
2010 4,637,107 98,829 1,389 8,038 39,351
* From U.S. EPA TRI website, TRI Explorer, March 12, 2012 update. The quantities expressed pertain
to elemental mercury and mercury from compounds that contain mercury. (http://iaspub.epa.gov/
triexplorer/tri_release.chemical; accessed 8/24/ 2012). Categories: Air emissions include fugitive and
point source; Surface water discharges include surface water discharges; Underground injection in-
cludes all underground injection including Class I and Class II-V wells; Releases to land/surface im-
poundments include all landfill and surface impoundment, land treatment and land disposal; Other
includes all other groups in the TRI Explorer database (e.g. storage, POTW treatment, solidification,
unknown, etc.).
Page 45
40
Third Compendium of States’ Mercury Activities — Part I: National Overview
mercury or mercury compounds) to 10 pounds starting with the year 2000. Therefore
TRI mercury data prior to 2000 should not be compared to later years. In order to
avoid potential data issues associated with the transition to the new reporting limit,
data from 2002 -2010 were compared and used to assess TRI trends. Over the 2002 to
2010 timeframe, total mercury released to:
Land and surface impoundments dominated overall releases, and ranged from
4,127,290 - 6,200,299 pounds per year.
Emissions to air ranged from 98,829 - 145,712 pounds per year.
Releases to water ranged from 713 to 3,104 pounds per year.
Underground injection ranged from 5,819 – 11,360 pounds per year.
Other categories ranged from 39,351 – 132,079 pounds per year.
The data in Table 3 show a significant downward trend in reported releases to air from
2002 to 2010, consistent with the overall decrease in emissions seen in the NEI data-
base. Overall releases attributable to the miscellaneous sources in the “Other” category
also display a significant downward trend. However, no consistent trend with respect
to land disposal, surface water discharge, and underground injection is apparent.
The three tables in Appendix S-D depict TRI data for total mercury in pounds (i.e.,
mercury in its neutral form and mercury from mercury compounds) broken out by a
number of source sectors. Some facilities may fall into multiple sector categories so the
data in these tables may include some double counting and thus the values for each
media do not match the summary TRI data in Table 3.
The TRI data in Appendix S-D show a considerable increase in mercury emissions after
1999 for many sectors. As noted above, this is largely (if not entirely) due to the
change in the reporting threshold from 25,000 pounds for manufacturing or processing
and 10,000 pounds for otherwise using mercury or a mercury compounds to 10 pounds
per year, bringing many new individual sources into TRI reporting after 1999. For
later years, the TRI data in Appendix S-D indicate a general and significant downward
trend in overall air emissions for several source sectors, while some others increased.
The reported air emissions in 2010 compared to 2002 were down 24 percent for EGUs;
85 percent for chloralkali plants; 78 percent for gold mining; 42 percent for cement
kilns; and 91 percent for hazardous waste treatment and disposal.
In contrast, reported air emissions from the EAF and integrated steel facilities were up
by 78 percent in 2010 vs. 2002. Although this may reflect a real increase, it is also possi-
ble that it may be due to improved emissions estimates attributable to increased aware-
ness and data regarding emissions from this sector, which may have occurred over this
period.
Sources of Mercury
Page 46
41
Third Compendium of States’ Mercury Activities — Part I: National Overview
Encouraging Trends in U.S. Mercury Emissions
The news regarding trends in mercury emissions from U.S. sources is very positive.
Mercury emission inventory data from two national datasets indicate substantial over-
all reductions in mercury air emissions in the U.S. since the early 1990s with significant
reduction continuing over the past decade.
Mercury emission reductions of greater than 95 percent have been achieved by two of
the three largest mercury NEI source categories since the early 1990’s – municipal solid
waste combustion and medical waste incinteration. In both cases the technical and
economic feasibility of the sectors’ ability to achieve reductions of this magnitude were
initially questioned, but innovations in pollution controls and successful efforts to re-
duce mercury wastes proved to be successful.
Municipal solid waste combustors not only met, but reduced emissions to be-
low state mercury emission limits through the use of improved pollution con-
trol technologies and efforts to reduce the amount of mercury in solid wastes.
Medical waste incineration emissions were reduced through pollution preven-
tion efforts, improved air pollution controls, and the development and use of
cost-effective alternative technologies to sterilize medical waste across the na-
tion.
The data indicate substantial reductions in emissions from coal-fired electric generat-
ing units also occurred over the past few years, consistent with state regulations on
this sector, co-benefits of pollution controls installed to address other regulated pollu-
tants and voluntary actions. Although coal-fired electric generating units remain the
largest current mercury source category, the further deployment and optimization of
pollution control technologies in response to U.S. EPA’s 2012 Mercury and Air Toxics
Standards for Power Plants and state regulations is expected to lead to significant fur-
ther reductions in emissions of mercury and other pollutants as well.
The NEI and TRI data also indicate that significant reductions in mercury emissions
have been achieved in many other categories as well, including the chloralkali indus-
try, gold mining, cement kilns and hazardous waste incinerators. However, air emis-
sions from electric arc furnaces and integrated steel facilities reported to TRI increased.
Sources of Mercury
Page 47
42
Third Compendium of States’ Mercury Activities — Part I: National Overview
U.S. EPA Office of Toxic Release Inventory Programs, email communication, 2012. TRI
Data for State Mercury Compendium.xlsx file Data were downloaded by U.S. EPA
from TRI on January 27, 2012
Works Cited: Sources of Mercury
Page 48
43
Third Compendium of States’ Mercury Activities — Part I: National Overview
BLANK PAGE
Page 49
44
Third Compendium of States’ Mercury Activities — Part I: National Overview
Introduction
The states have long supported mercury research and monitoring. Some of these
efforts have been designed and implemented by state agency staff. In other cases the
states have provided academic research groups with funding and/or in-kind support.
This support has included field and laboratory staff time to assist in sample collection,
preparation and analyses, as well as data management, and data assessment. Infor-
mation from state fish tissue and emission source monitoring programs was funda-
mental to the identification and understanding of the breadth and scope of the mercu-
ry pollution problem in the U.S. These monitoring and research efforts have also pro-
vided important information
used to guide mercury pollution
reduction policy and regulatory
strategy development and imple-
mentation. Table 1 provides an
overview of key state research
activities. The remainder of this
section summarizes mercury re-
search and monitoring efforts
supported by the states.
Research Activities
Survey responses as well as dis-
cussions with QSC participants
indicate that the states have con-
ducted or supported a wide
range of mercury-related re-
search efforts (see Appendix
R&M-A). The survey responses
indicate that 29 states currently
conduct or have recently com-
pleted research related to mercu-
ry. This is similar to the respons-
es in the 2005 survey where 28
states indicated that they were
pursuing mercury-related re-
search.
Mercury Research and Monitoring
Table 1: Overview of Key State Research Areas
Data collection to follow and assess mercury
concentration trends in environmental media
including sediments, rainfall, and biota.
Mercury levels in indicator, recreational, and
commercial fish species; mammals; birds; and
amphibians to improve fish consumption ad-
visories and to better assess environmental im-
pacts, costs, and pollution trends.
Regional mercury assessments coordinated by
the Biodiversity Institute and academic re-
search institutions in the Northeast, the Great
Lakes Region and, currently underway, in the
Western states.
Mercury fate and transport, in particular relat-
ing to determinates of methylation and bioac-
cumulation rates.
Studies to evaluate and improve emission con-
trol and monitoring technologies including
amalgam separators and continuous emissions
monitoring devices (CEMs).
Studies to better understand the amounts of
mercury present in various consumer prod-
ucts and waste streams and to identify alterna-
tives.
Page 50
45
Third Compendium of States’ Mercury Activities — Part I: National Overview
Of the states that indicated they were conducting mercury research in the 2005 survey,
four indicated that they were no longer doing so and three did not complete the sur-
vey. Eight additional states, including Alaska, Idaho, Kansas, Montana, Nebraska,
South Carolina, Texas, and Utah responded positively in the latest survey. More de-
tailed information on state mercury research can be found at the state webpages.
Transport and Deposition of Mercury in the Air:
An Overview
Once mercury is released into the atmosphere, regardless of the source, it can be trans-
ported on local, regional, and global scales (United Nations Environment Programme,
2001; 2008). The concern over mercury in the atmosphere stems from its eventual dep-
osition at the earth’s surface and subsequent conversion to methylmercury. Mercury
exists in the atmosphere in three states – gaseous elemental mercury, gaseous oxidized
mercury and particulate bound mercury. Significant amounts of oxidized and particu-
late mercury can deposit out of the air close to emission sources, while elemental mer-
cury tends to be transported further (Keeler et al., 2006; Keeler and Dvonch, 2005).
Atmospheric deposition of mercury depends on its form and occurs through wet dep-
osition, dry deposition, or flux events (gas exchange).
Wet deposition of mercury occurs primarily during rainfall or snowfall events
and is comprised largely of oxidized mercury, which is soluble, and particulate
bound mercury, with a small percentage (< 2 percent) of methylmercury. Mer-
cury oxidation can be significantly influenced by other chemicals in the air in-
cluding ozone, hydroxide, and other oxidants (Lindberg et al., 2007).
Dry deposition occurs continually except during periods of precipitation and
can contribute a significant amount of mercury to aquatic, marine, and terrestri-
al ecosystems. Net dry deposition is thought to be primarily attributable to gas-
eous oxidized mercury and particulate bound mercury. Although data on dry
deposition is limited, it has been estimated that dry deposition can be at least as
significant as wet deposition and more so in some situations (Risch et al., 2011;
Lindberg et al., 2007; Lindberg et al., 1992).
Mercury flux occurs when elemental mercury crosses the air/surface interface
on soil, or vegetation, or water, and can occur in both directions – deposition to
the surface material or evasion away from the material.
Mercury Research and Monitoring
Page 51
46
Third Compendium of States’ Mercury Activities — Part I: National Overview
Mercury Monitoring – Air
According to the results from the survey conducted in 2011, 31 percent of the states
conduct ambient mercury monitoring. This is a significant decrease from the 2005
survey results when states reported that 44 percent monitored for ambient mercury;
and 51 percent conducted monitoring to assess atmospheric deposition of mercury.
Results from the survey also indicate that 38 percent of the participating states conduct
indoor air sampling to assess mercury spill impacts.
There are currently two programs that monitor mercury from the air – the Mercury
Deposition Network (MDN) and the Atmospheric Mercury Network (AMNet). In
addition, federal legislation with bipartisan support has been introduced in several
sessions of Congress to establish and authorize appropriations to U.S. EPA to develop
a comprehensive National Mercury Monitoring Network (MercNet). A description of
the existing networks and a summary of the proposed legislation are described in the
paragraphs that follow.
Mercury Deposition Network – There is a significant amount of data available
for wet deposition of mercury. Mercury deposition in the U.S. and Canada has
been monitored since 1996 through the national Mercury Deposition Network
(MDN). The MDN monitors mercury concentrations and total mercury deposi-
tion through integrated, weekly, wet-only sampling. The data have been used
to examine spatial and temporal trends in mercury deposition (e.g. Risch et al.,
2011). The map on page 48 identifies the MDN monitoring stations. Additional
discussion of the MDN data can be found at http://nadp.sws.uiuc.edu/mdn/.
According to the National Air Deposition Program (NADP) coordinator, there
are currently 110 MDN sites. States fund 56 (or 51 percent) of them and operate
20. Sampling at the remaining sites is being implemented by research organiza-
tions, tribal authorities and other groups. Some states have not had the re-
sources to continue their site operations and are identified as “inactive sites” in
the map of MDN monitoring stations.
The MDN sites are primarily located in more rural areas typically not impacted
by large local atmospheric emission sources. Approximately ten sites have been
located in urban areas. Although the MDN network provides important data
on overall mercury deposition levels it is limited in its ability to assess local
depositional impacts from many sources that emit particulate and oxidized
mercury or to investigate trends attributable to point source controls. For exam-
ple, work completed in the Northeast indicates that the areas with the largest
Mercury Research and Monitoring
Page 52
47
Third Compendium of States’ Mercury Activities — Part I: National Overview
modeled deposition reductions attributable to state controls on major emission
sources in the region do not contain ambient monitors. Additionally, MDN da-
ta are weekly composite wet deposition samples and most sites do not collect
event based samples which limits the utility of the data in various modeling ex-
ercises including multi-pathway risk assessments.
Atmospheric Mercury Network (AMNet) – AMNet was formed in 2009 and
includes both wet and dry deposition. Currently there are approximately 25
sites in operation funded through a variety of mechanisms including U.S. EPA
and National Oceanic and Atmospheric Administration grants, state and tribal
support, and funding from private organizations. AMNet data are available on
the NADP website at: http://nadp.isws.illinois.edu/amn/.
Mercury Research and Monitoring
Mercury Deposition Network Monitoring Stations*
* Data current as of December 2011
Page 53
48
Third Compendium of States’ Mercury Activities — Part I: National Overview
National Mercury Monitoring Network – This proposed new network, if cre-
ated, would address key monitoring gaps and provide improved data on mer-
cury fate and transport, bioaccumulation, and trends. Establishing such a net-
work would greatly increase understanding about interactive effects with other
large-scale drivers of environmental change and would help evaluate the effec-
tiveness of environmental regulations and policy. (Additional information:
http://nadp.isws.illinois.edu/mercnet/MercNetFinalReport.pdf).
Individual State Efforts – Several states have conducted atmospheric mercury
monitoring beyond MDN and AMNet related efforts. For example, additional
information can be found at:
http://www.michigan.gov/deq/0,4561,7-135-3310-96539--,00.html
http://dnr.wi.gov/topic/AirQuality/Monitor.html#tabx2
http://www.nescaum.org/topics/mercury, and http://www.dec.ny.gov/
chemical/8519.html.
Mercury Monitoring – Water
Monitoring of mercury in water is conducted for several reasons. Concentrations in
wastewater effluent and sludge are primarily monitored by wastewater treatment fa-
cilities to determine compliance with National Pollution Discharge Elimination System
(NPDES) permits. Water column and waterbody sediment monitoring are conducted
to assess the condition of waterbodies, determine if water quality standards are being
met, and assess progress in remediation
efforts.
Table 2 shows how the survey respondents
reported their monitoring activities in 2005
and 2011. In the survey conducted in 2011,
results show increases in the proportion of
states monitoring everything except sediment.
The survey also asked states about monitor-
ing wastewater sludge, and 69 percent of
states responded that they were monitoring
this component.
Mercury Monitoring – Fish Tissue
Fish tissue monitoring is an important aspect of states’ monitoring programs due to its
use in determining the need for fish consumption advisories and tracking trends
Mercury Research and Monitoring
Table 2
States Reporting in 2005 and 2011 Surveys
Percent
Mercury Monitoring
Activities 2005 2011
22 71 Water column
62 71 Wastewater effluent
62 57 Sediment
Page 54
49
Third Compendium of States’ Mercury Activities — Part I: National Overview
in environmental mercury levels. Results of fish tissue monitoring help protect public
health by identifying waterbodies and species with elevated mercury levels and
allowing for safe fish consumption recommendations to be developed and communi-
cated. In 2005, 93 percent of states
reported monitoring mercury in
fish tissue and in 2011 that num-
ber rose to a full 100 percent. For-
ty states, or 95 percent of the
states responding to the survey,
indicated that they monitor fish
tissue concentrations for the pur-
pose of establishing, revising, and
removing fish consumption advi-
sories. Other primary reasons for
fish tissue monitoring include:
Evaluating long term trends
(81 percent) and evaluating
changes in fish tissue concen-
trations as a result of mercury
reduction programs (62 per-
cent).
Developing TMDLs, assessing
risk to wildlife, evaluating the
impact of contaminated sites,
permitting, and Clean Water
Act Section 303(d) reporting
(14 percent).
In 2005, 46 of the 50 states had
issued fish consumption adviso-
ries, and now in 2011 all 50 states
have fish consumption advisories
due to mercury. Advisories can
be issued for individual water-
bodies or on a statewide basis.
According to the survey, the vast
majority of states (93 percent)
have waterbody-specific fish consumption advisories. A large number of states also
have statewide freshwater advisories (62 percent), while fewer have statewide coastal
Mercury Research and Monitoring
Mercury Bioaccumulation Research
Mercury bioaccumulation in the aquatic food
chain is well documented. Consumption of fish
with elevated concentrations of mercury is the
primary way that people and fish eating wildlife
are potentially exposed to mercury. High levels
of mercury have been found in fish-eating wild-
life such as loons, eagles, and river otters in
many areas. More recently, monitoring and
research have established that terrestrial food
webs can also bio-magnify methylmercury to
levels that may cause toxicity and adversely im-
pact populations of songbirds, bats, and other
genera that consume insects and other inverte-
brates (http://www.briloon.org/oae/the-science-
of-bri/mercury-in-the-environment). Although
bird species inhabiting wetland and estuarine
ecosystems appear to be most at risk, upland
bird species are also being exposed and studies
have found surprisingly high levels of mercury
in a number of insect eating species, including
tree swallows, across ecosystems on the east
coast from Virginia to Maine and in the Great
Lakes Region (http://www.briloon.org/
mercuryconnections/northeast
http://www.briloon.org/mercuryconnections/
greatlakes). Elevated levels of mercury in birds
can impact brain development and at lower lev-
els may impact reproductive success. Mercury
levels in many species of bats have also been
found to exceed those associated with biochemi-
cal changes in the brain.
Page 55
50
Third Compendium of States’ Mercury Activities — Part I: National Overview
advisories (17 percent). The map below shows states with statewide fish advisories.
Appendix R&M-B contains detailed information about the each states’ fish advisories.
Looking to the Future
The states have supported and continue to conduct important mercury research and
monitoring. Both activities are critical to targeting fish consumption advisories for
protecting public health, delineating the scope of the mercury problem, and assessing
trends in mercury levels in the environment. Although a few more states reported
monitoring fish tissue, wastewater, and water column mercury in 2011 compared to
the 2005 survey, reduced state and federal budgets are increasingly constraining state
efforts to improve the science relating to mercury. Some states report that they have
lost all funding for one or more mercury research and monitoring efforts while others
have experienced significant reductions over the last few years. Tight state budgets are
preventing many state scientists from participating in meetings, workshops, and multi-
state initiatives addressing mercury and other environmental issues.
Mercury Research and Monitoring
Page 56
51
Third Compendium of States’ Mercury Activities — Part I: National Overview
Mercury Research and Monitoring: Program Snapshots
Information about several states’ mercury research and monitoring activities is provid-
ed below.
Mercury Research and Monitoring
Florida
The Florida Department of Environmental Protection (FL DEP), the Florida Fish and
Wildlife Conservation Commission, and the South Florida Water Management Dis-
trict (SFWMD) conduct mercury research and monitoring to better understand mer-
cury sources, cycling, and impacts in Florida as well the relationships between sul-
fur and mercury cycling (Axelrad, 2011). Mercury levels have been monitored ex-
tensively in largemouth bass (LMB), American alligator, Florida panther, and the
invasive Burmese python. Mercury levels in LMB in the Water Conservation Areas
of South Florida were among the highest ever reported during early sampling
efforts. However, over the last 20 years, LMB annual median mercury concentra-
tions declined 62 percent, from a peak level of 1.6 parts per million (ppm) in 1991 to
0.6 ppm in 2009. This decline was associated with the installation of improved air
pollution control equipment and reduced mercury emissions at waste incinerators in
the state.
Since about 2000, median mercury levels in LMB have leveled off, with many tested
fish still exceeding U.S. EPA health criterion for fish consumption. However, mercu-
ry levels have been found to vary both geographically and temporally, perhaps due
to changes in biogeochemistry including sulfur inputs and cycling. Data from re-
search in the Everglades indicate that mercury levels in fish can depend on both
mercury and sulfur and ongoing research continues to investigate this interaction
and sources of sulfur and mercury.
Page 57
52
Third Compendium of States’ Mercury Activities — Part I: National Overview
Mercury Research and Monitoring
Massachusetts
The Massachusetts Department of Environmental Protection (MA DEP) has moni-
tored mercury levels in yellow perch and largemouth bass, popular recreational fish-
ing species that are often eaten, since the mid 1990s (http://www.mass.gov/dep/
toxics/stypes/hgres.htm#monitoring). Data collected through this program demon-
strated that the mercury levels in freshwater fish were above safe consumption levels
in many waterbodies across the state, even in remote areas removed from local pol-
lution sources. These findings led to a statewide advisory by the MA Department of
Public Health warning pregnant women and children to avoid consuming native
freshwater fish caught in the state.
Fish monitoring data delineated the widespread scope of the mercury problem, iden-
tified the need for fish consumption advisories, and helped to motivate and inform
MA state and regional policies to reduce mercury pollution. Ongoing monitoring by
MA DEP and the New England Interstate Water Pollution Control Commission has
demonstrated that, over the period mercury emissions were significantly reduced
under the New England Governors and Eastern Canadian Premiers Mercury Action
Plan. Declines also occurred in mercury concentrations in freshwater game fish from
lakes and ponds in MA. While these results are encouraging, mercury levels remain
too high.
Minnesota
Minnesota’s interagency Fish Contaminant Monitoring Program has been monitor-
ing mercury in fish since 1970 (http://www.pca.state.mn.us/index.php/view-
document.html?gid=9247 ). A trend analysis of mercury in northern pike and wall-
eye for a 25 year period, 1982-2006, found a shift from a downward trend between
1982 and the mid-1990s to an upward trend thereafter (Monson, 2009). A more recent
analysis of a much larger dataset for the entire Great Lakes Region (GLR) found a
general downward trend of mercury in walleye and largemouth bass from 1970 to
2008; however, walleye in Ontario showed a similar pattern to the fish in Minnesota
(Evers et al., 2011; Monson et al., 2011). The general downward trend in the GLR
corresponds to the downward trend in the region’s mercury emissions, thereby sup-
porting a conclusion that mercury levels in fish are responding to local changes in
mercury emissions. The confounding factors contributing to the upward trends in
Minnesota and Ontario are thought to be multiple effects of changes in temperature,
carbon dioxide levels, and precipitation dynamics that could be increasing the meth-
ylation, mobilization, and bioaccumulation of methylmercury in aquatic systems.
Page 58
53
Third Compendium of States’ Mercury Activities — Part I: National Overview
Mercury Research and Monitoring
Western North America
The success of the Biodiversity Research Institute (BRI) efforts to assess environmen-
tal mercury deposition and impacts in the northeastern U.S. and eastern Canada
(2001-05) and the Great Lakes region (2008-11) has led to a new initiative for North
America that will include mercury studies in the western regions of the U.S. and
Canada, as well as in parts of Mexico. The Mercury Cycling, Bioaccumulation, and Risk
Across Western North America: A Landscape Scale Synthesis Linking Long-Term Datasets
initiative is a tri-national synthesis of mercury cycling and bioaccumulation research
and data throughout western North America (http://www.briloon.org/
mercuryconnections#wmc).
The project will be conducted in collaboration with the U.S. Geological Survey and
will encompass the largest mercury synthesis undertaken to date by BRI. Geograph-
ically it includes the states of Alaska, Arizona, California, Colorado, Hawaii, Idaho,
Montana, Nevada, New Mexico, Oregon, Utah, Washington, and Wyoming as well
as British Columbia and the Yukon Territory and the western coastal and interior re-
gions of Mexico. BRI is coordinating an interdisciplinary international team of scien-
tists and policy experts to accomplish the project’s goals.
The project will address mercury levels in the environment, sources, and impacts
with a particular focus on the influence of land use, habitat, and climatological fac-
tors on mercury risk. Public land comprises more than 60 percent of the total surface
area in the region, and the results of this project will provide improved understand-
ing and better management of resources at the state and national levels to reduce
mercury impacts. The project will use several decades of collected data to holistical-
ly synthesize the spatiotemporal patterns of mercury in abiotic and biotic resources
across the region and will also examine mercury exposure and effects on fish and
wildlife. The work will also include a formal analysis of factors driving mercury
methylation and accumulation and its resulting risks.
Page 59
54
Third Compendium of States’ Mercury Activities — Part I: National Overview
Evers, D. C., J. G. Wiener, C. T. Driscoll, D. A. Gay, N. Basu, B. A. Monson, K. F. Lam-
bert, H. A. Morrison, J. T. Morgan, K. A. Williams, and A. G. Soehl. 2011. Great Lakes
Mercury Connections: The Extent and Effects of Mercury Pollution in the Great Lakes Re-
gion. Biodiversity Research Institute Report BRI 2011-18, Gorham, Maine. 44 pp.
Available from http://www.briloon.org/mercuryconnections/greatlakes
Monson, B.A., Staples, D.F., Bhavsar, S.P., Holsen, T.M., Schrank, C.S., Moses, S.K.,
McGoldrick, D.J., Backus, S.M., and K.A. Williams. 2011. Spatiotemporal trends of
mercury in walleye and largemouth bass from Laurentian Great Lakes Region. Ecotoxi-
cology 20 (7): 1555-1567.
Monson, B.A. 2009. Trend reversal of mercury concentrations in piscivorous fish from
Minnesota lakes: 1982-2006. Environ. Sci. Technol. 43, 1750-1755.
Axelrad, D.M., Lange, T., Gabriel, M.C. et al. 2011 South Florida Environmental Re-
port, chapter 3B: mercury and sulfur monitoring, research and environmental assess-
ment in south Florida (http://www.dep.state.fl.us/water/sas/mercury/index.htm)
Keeler, G.J., Landis, M.S., Norris, G.A., Christianson, E.M., and Dvonch, J.T. 2006.
Sources of mercury wet deposition in eastern Ohio, USA. Environ. Sci. Technol.
40:5874-5881.
Keeler, G.J. and Dvonch, J.T. 2005. Atmospheric mercury: a decade of observations in
the Great Lakes. In: Pirrone, N. and Mahaffey, K., editors. Dynamics of mercury pol-
lution on regional and global scales: atmospheric processes and human exposures
around the world. Springer. p 611-632.
Lindberg, S.E., Bullock, R., Ebinghaus, R., Engstrom, D., Feng, X., Fitzgerald, W., Pirro-
ne, N., Prestbo, E., and Seigneur, C. 2007. A synthesis of progress and uncertainties in
attributing the sources of mercury in deposition. Ambio. 36(1):19-32.
Lindberg S.E., Meyers T.P., Taylor G.E., Turner R.R., and Schroeder W.H. 1992.
Atmosphere-surface exchange of mercury in a forest: results of
modeling and gradient approaches. J. Geophys. Res. 97:2519-2528.
Risch, R.R., Gay, D.A., Fowler, K.K., Keeler, G.J., Backus, S.M., Blanchard P., Barres,
J.A., Dvonch, J.T. 2011. Spatial patterns and temporal trends in mercury
concentration, precipitation depths, and mercury wet deposition in the North
American Great Lakes region, 2002-2008. Environ Pollu 1-11.
Works Cited: Mercury Research and Monitoring
Page 60
55
Third Compendium of States’ Mercury Activities — Part I: National Overview
United Nations Environment Programme. (2001). Global Mercury Assessment. (See
http://www.chem.unep.ch/mercury/Report/GMA-report-TOC.htm; accessed 8/20/2012)
United Nations Environment Program, Global Mercury Partnership Mercury Air
Transport and Fate Research. (2008). Mercury Fate and Transport in the Global Atmos-
phere: Measurements, Models and Policy Implications. Editors: N. Pirrone and R. Ma-
son. (see http://www.chem.unep.ch/mercury/Sector-Specific-Information/
Full_Report.pdf accessed, Aug. 12, 2012).
Works Cited: Mercury Research and Monitoring
Page 61
56
Third Compendium of States’ Mercury Activities — Part I: National Overview
The Clean Water Act (CWA) requires states to develop a list of waterbodies that are
failing to meet established water quality standards for pollutants. These waterbodies
are known as impaired waters. The CWA also requires states to develop Total Maxi-
mum Daily Loads (TMDLs) for priority waters on this list. TMDLs establish the maxi-
mum load of a particular pollutant that a waterbody can receive and still achieve wa-
ter quality standards, and an allocation of that load among sources. Once developed,
the TMDLs are submitted to U.S. EPA for review and approval. While mercury is a
pollutant primarily released into the air, its effects can be seen in the aquatic environ-
ment in the form of elevated fish tissue concentrations. Many states have listed water-
bodies as impaired for failure to meet mercury water quality standards that allow peo-
ple to eat fish. A number of these states have proceeded to develop TMDLs to set mer-
cury reduction goals that will allow safe fish consumption to be restored.
These TMDLs can vary in the geographic area which they cover. Some TMDLs are de-
veloped to address just one specific waterbody, while others may cover all of the wa-
terbodies in a particular basin or watershed. On a larger scale, TMDLs can be devel-
oped for an entire state or even an entire region. These different types of TMDLs can
be seen in the results of the survey. Twenty of the states answering the survey cur-
rently have at least one U.S. EPA-approved mercury TMDL. Another nine states are
either in the process of developing a mercury TMDL or have plans to develop a mer-
cury TMDL in the future. Table 1 on page 58 shows the status of state mercury TMDL
efforts.
Table 2 on page 59 summarizes the status of state mercury TMDLs. While there are
currently only two U. S. EPA-approved statewide mercury TMDLs, the survey results
demonstrate that there is an increasing trend in the development of statewide mercury
TMDLs, with five of these TMDLs in the planning or development stage. Three of
these five TMDLs are in the southeastern U.S. Given that this area of the country re-
ceives a large quantity of mercury deposition, it is not surprising that these states are
employing large-scale mercury reduction strategies with the development of statewide
TMDLs.
Mercury Total Maximum Daily Loads
Page 62
57
Third Compendium of States’ Mercury Activities — Part I: National Overview
Mercury Total Maximum Daily Loads
Table 1: Status of State Mercury TMDLs
Approved TMDLs TMDLs in Process or Planning
State
Total Number of States 9 3 2 7 2 0 5 1
Alabama √
Alaska √
Arizona √
Arkansas √
California √
Colorado √
Connecticut √
Delaware √
Florida √
Idaho √
Kansas √
Louisiana √ √ √
Maine √
Maryland √
Massachusetts √
Michigan √
Minnesota √
Missouri √
Montana √
New Hampshire √
New Jersey √
New York √
North Carolina √
Oregon √
Rhode Island √
Utah √
Vermont √
Wat
er-
bo
dy
-
Sp
ecifi
c
Wat
er-
shed
/
Bas
in
Sta
tew
ide
Mu
ltis
tate
Wat
er-
bo
dy
-
Sp
ecifi
c
Wat
er-
shed
/
Bas
in
Sta
tew
ide
Mu
ltis
tate
Page 63
58
Third Compendium of States’ Mercury Activities — Part I: National Overview
The Minnesota
Statewide Mercury
TMDL was the
first one to cover a
large geographic
scale. The U.S.
EPA approved it in
March 2007 and it
addresses 511 wa-
terbodies.
The TMDL primarily addresses atmospheric deposition of mercury and calls for a 93
percent reduction in mercury emissions to meet fish tissue goals. A short time later,
seven Northeast states used a very similar approach to develop the Northeast Regional
Mercury TMDL, which was approved by U.S. EPA in December 2007. This TMDL co-
vers more than 10,000 lakes and ponds and 46,000 river miles and identified the need
for a 87 to 98 percent reduction in anthropogenic atmospheric deposition from all
sources inside and outside of the region. The similarity between the reductions identi-
fied by the Minnesota and Northeast TMDLs demonstrates that mercury pollution is a
wide scale problem and underscores the need for significant mercury reductions
nationwide.
As Table 3 shows, atmospheric deposition is overwhelmingly the primary source ad-
dressed by mercury TMDLs. Nineteen of the states that responded they have approved
mercury TMDLs selected atmospheric deposition as the primary source. Other report-
ed sources include wastewater treatment plant discharges, stormwater discharges, leg-
acy sources, and active mining. Table 3 also shows the primary sources of mercury ad-
dressed by states that have approved
mercury TMDLs.
As mercury is a truly multimedia pollu-
tant, many states are taking multimedia
approaches to their reduction strategies.
Seventeen of the states that have ap-
proved mercury TMDLs and five of the
states with TMDLs in the planning or
development stage have either used or
are using multimedia approaches in
their TMDLs. In the case where land-
Table 2: Status of State Mercury TMDL Activities
Waterbody
Specific
Statewide Multistate/ Regional
Watershed
or Basin
Approved TMDL 9 2 7 3
In process of de-
veloping TMDL
or plan to devel-
op TMDL 2 5 1 0
Table 3:
Primary Sources of Mercury Addressed by
Mercury TMDLs
Number of
States
Atmospheric Deposition 19
Legacy Sources 5
Wastewater Treatment Plant
Discharges 8
Stormwater Discharges 5
Active Mining 4
Mercury Total Maximum Daily Loads
Page 64
59
Third Compendium of States’ Mercury Activities — Part I: National Overview
based legacy or mining sources or wastewater treatment plant discharges are the pri-
mary source of mercury to a waterbody, a multimedia approach may not be neces-
sary. However, when atmospheric deposition is the primary source, a multimedia
approach may allow for a more comprehensive and coordinated reduction strategy.
It should be noted that TMDLs are one option for addressing mercury-impaired wa-
ters, but they are not the only option. States may choose to develop a watershed man-
agement plan, which is a strategy for achieving water resource goals that provides
assessment and management information for the watershed of interest. The states
were asked in the survey if they have developed watershed management plans in lieu
of mercury TMDLs. None of the states responding indicated that they had developed
any such plans. Some states may wish to address their needed mercury reductions
without going through the process of a TMDL or a watershed management plan.
These states may focus their mercury-related efforts directly on programs related to
mercury-containing products and waste and controlling sources of mercury to the air
without using the Clean Water Act as a vehicle for developing a reduction plan.
Mercury Total Maximum Daily Loads
Page 65
60
Third Compendium of States’ Mercury Activities — Part I: National Overview
Background
Minnesota was the first state to enact laws addressing the sale, use, labeling, and dis-
posal of household and business mercury-containing products. The laws were enacted
from 1990 through 1993. Vermont adopted legislation in 1998 that incorporated much
of what Minnesota had enacted and included labeling requirements for motor vehicles
and mercury-containing lamps. Also in 1998, the Conference of New England Gover-
nors and Eastern Canadian Premiers released its Mercury Action Plan which includes
recommendations for the proper management of mercury-containing products and de-
creasing the use of such products. A task force to implement the plan was also formed.
In 1998 the Northeast Waste Management Officials’ Association (NEWMOA) started
developing model legislation and held meetings in January and December 1999 to de-
velop and take public comment on their model legislation. Key components of the
NEWMOA model legislation are:
Manufacturer notification of mercury-containing products.
Labeling of mercury-containing products.
Banning the sale and/or phasing out the use of mercury-containing products.
Proper end of life management of mercury-containing products.
Process and criteria for obtaining an exemption from the sales ban and product
phase outs.
States have states adopted similar legislation over the years as shown in Table 1 on
pages 63-64.
Managing Mercury in Existing Products Remains a Challenge for States
When the 2005 Compendium of States’ Mercury activities was released, 18 states
(California, Connecticut, Florida, Illinois, Indiana, Maine, Maryland, Massachusetts,
Michigan, Minnesota, Nebraska, New Hampshire, New Jersey, New York, Oregon,
Rhode Island, Virginia, and Washington) banned the sale of at least one type of
mercury-containing product, with Connecticut and Rhode Island basing their bans on
the amount of mercury in the product. By 2011, as indicated in Table 1 on pages 63-64,
five more states (Iowa, Louisiana, Montana, Ohio, and Wisconsin) enacted laws ban-
ning at least one type of mercury-containing product. Louisiana’s bans are based on
the amount of mercury in the product. Also by 2011, several of the initial 18 states en-
acted additional laws to address more mercury-containing products. In addition, 12
Mercury In Consumer Products
Page 66
61
Third Compendium of States’ Mercury Activities — Part I: National Overview
states had created processes to exempt
products from phase-outs, bans, or
limits. In the 2011 survey, states also
described sources of funding for pro-
grams (Table 2 ) that are collecting and
managing mercury at the end of a
product’s life.
Emerging Challenges for States
Between 2005 and 2011, while states and the federal government were working to cre-
ate approaches to reduce and/or manage mercury in existing products, some manufac-
turers continued to introduce new mercury-containing products even though suitable
alternatives existed in most situations. The products described below are examples of
ones that were introduced since publication of the 2005 Compendium.
Mercury-containing wheel weights and self-adjusting balances mainly for use in
motorcycles, buses, and over the road trucks. Two states, Illinois and Maine,
have banned the use of mercury wheel weights. Washington State also restricts
the use of mercury wheel weights in many applications.
Mercury in nanomaterial – This new material has been demonstrated to behave
differently than the material from which it is derived. Little specific research
has been conducted on mercury use in nanomaterial so the potential health and
environmental impacts are unknown. States indicate that, given mercury’s
many unique properties, research needs to be conducted on mercury nano-
materials (G. V. Ramesh, Muvva D. Prasad, and T. P. Radhakrishnan, 2011).
Others, including new vehicle display screens and some headlamps. These
products when scrapped at the end of their life may lead to mercury releases.
Collection programs for mercury-containing products will require continued invest-
ment to prevent or reduce the amount of mercury disposed in landfills, emitted by in-
cinerators, and discharged into rivers and streams as long as mercury-containing prod-
ucts are available on the market. However, state and local governments are finding it
more difficult to provide funding for their existing mercury-containing product collec-
tion programs and are unable to create new ones to collect mercury in the new prod-
ucts due to decreasing budgets. In addition, the current manufacturer collection
systems are not adequate to capture and safely manage new uses of mercury in many
states.
Mercury In Consumer Products
Table 2
Funding Sources for Collection Programs in States
Local Government – 19
State Government – 29
Federal Government – 10
Manufacturers – 21*
Waste Processors – 6
Programs only cover collection of products each
manufactures
Page 67
62
Third Compendium of States’ Mercury Activities — Part I: National Overview
States recognize the need for industry and consumers to take more responsibility “for
reducing negative impacts to the economy, environment, public health and worker
safety… [t]hese impacts can occur through out the life cycle of a product” (ECOS reso-
lution 12-5 Principles of Extended Producer Responsibility and the Definition of Prod-
uct Stewardship adopted on August 28, 2012. They are looking to manufacturers to
voluntarily, or through legislative action, to include the total cost of their products in
their pricing, including end-of-life management, and to more fully consider end-of-life
management issues in front-end product design.
Addressing Existing and Emerging Challenges
The QSC and Interstate Mercury Education and Reduction Clearinghouse (IMERC) are
leading states’ efforts to manage mercury in products. Each plays a different but com-
plementary role in assisting states. The QSC role has focused on strategies while
IMERC has focused on legislative approaches and implementation of legislation. The
federal government, led by the U.S. EPA, plays a key role in efforts to manage mercury
in consumer products. Lastly, the Great Lakes Regional Collaboration, in their recent-
ly published strategy document, provides an approach for addressing the issues facing
states. The Strategy contains eleven categories of recommendations for reducing mer-
cury in products. (http:///www.glrppr.org/glmst)
Mercury In Consumer Products
Page 68
63
Third Compendium of States’ Mercury Activities — Part I: National Overview
Mercury In Consumer Products
Table 1: Mercury-containing Products
Sales ban, Use ban, or Phase out
State
Number of States 10 4 7 15 14 13 14 17 16 13 12
Alabama
Alaska
Arizona
Arkansas
California
Colorado
Connecticut
Delaware
Florida
Hawaii
Idaho
Illinois
Indiana
Iowa
Kansas
Kentucky
Louisiana
Maine
Maryland
Massachusetts
Lab
elin
g R
equ
irem
ents
Lim
its
on
Mer
cury
Co
nte
nt
in P
rod
uct
s
No
vel
ty I
tem
s/T
oy
s
Co
smet
ics
Mea
suri
ng
Dev
ices
Med
ical
Dev
ices
Oth
er
Sw
itch
es a
nd
Rel
ays
Th
erm
om
eter
s
Th
erm
ost
ats
Exe
mp
tio
n P
roce
ss
Page 69
64
Third Compendium of States’ Mercury Activities — Part I: National Overview
Table 1: Mercury-containing Products
Sales ban, Use ban, or Phase out
State
Michigan
Minnesota
Missouri
Montana
Nebraska
New Hampshire
New Jersey
New Mexico
New York
North Carolina
North Dakota
Ohio
Oklahoma
Oregon
Rhode Island
South Carolina
Texas
Utah
Vermont
Washington
West Virginia
Wisconsin
Mercury In Consumer Products
Lab
elin
g R
equ
irem
ents
Lim
its
on
Mer
cury
Co
nte
nt
in P
rod
uct
s
No
vel
ty I
tem
s/T
oy
s
Co
smet
ics
Mea
suri
ng
Dev
ices
Med
ical
Dev
ices
Oth
er
Sw
itch
es a
nd
Rel
ays
Th
erm
om
eter
s
Th
erm
ost
ats
Exe
mp
tio
n P
roce
ss
Page 70
65
Third Compendium of States’ Mercury Activities — Part I: National Overview
Mercury In Consumer Products
State-Federal Collaboration
The QSC worked with its federal partners to:
Phase out mercury thermometer use for industrial purposes National In-
stitutes of Standards and Technology (NIST)
Phase out use of mercury thermometers in its laboratories, if the use is not
required by a regulation or standard (U.S. EPA)
Improve the collection and recycling of mercury-containing thermostats.
(U.S. EPA)
Key QSC Activities
Mercury-Added Product Labeling: Information for States (March 2006). The paper
examined:
Products covered and exemptions
Label composition, content, and location
Labeling requirements related to internet and catalog sales
Coordination of labeling and notification among states
Compliance assistance and enforcement
Mercury-Added Product White Paper (November 2006). This paper identified several
mercury-added product sectors on which state and federal agencies could focus to
reduce the use of mercury through both voluntary and regulatory mechanisms. It
also characterized and made recommendations for future action on the following
products:
Non-vehicle switches, relays, and flame sensors
Thermometers
Dental amalgam
Thermostats
Lamps
Key QSC, Federal, and IMERC Activities
Page 71
66
Third Compendium of States’ Mercury Activities — Part I: National Overview
Mercury In Consumer Products
Overview of States Participation in IMERC
Founding Members Current Members Notification Labeling
California
Connecticut
Illinois
Louisiana
Maine
Massachusetts
Michigan
Minnesota
New Hampshire
New Jersey
New York
North Carolina
Rhode Island
Vermont
Washington
Interstate Mercury Education and Reduction Clearinghouse Leads States Efforts
In 2001 state environmental officials from eight states established the Interstate Mer-
cury Education and Reduction Clearinghouse (IMERC) to help implement laws and
programs aimed at getting mercury out of consumer products, the waste stream, and
the environment. Seven other states joined since IMERC’s inception. The IMERC pro-
vides technical assistance to the member states concerning: manufacturer applications
for exemptions to the phase-out of mercury-added products; manufacturer applica-
tions for alternative labeling of mercury added products; and manufacturer plans for
collection and proper waste management of mercury-containing materials. The fol-
lowing paragraphs summarize how IMERC works and the Table below summarizes
information about individual states’ participation in IMERC.
Notification – Eight states require anyone that manufactures, sells, distributes, or
imports a mercury-containing product in their state to notify the state. Verified
data are posted online in IMERC’s Mercury-Added Product Database. Cur-
rently IMERC indicates that almost 500 companies have reported a total of ap-
proximately 5,000 mercury-containing products. In November 2011 IMERC
launched an E-file notification system. The system allows for easier reporting,
review, and analysis of notification data.
Labeling –Ten states require proper labeling of mercury-added products sold in
their states. Labels must be legible and identify that the product contains mer-
cury and provide information concerning proper disposal.
Additional information about IMERC is in Appendix P-A
Page 72
67
Third Compendium of States’ Mercury Activities — Part I: National Overview
Quicksilver Caucus. Mercury-Added Product Labeling – Information for States. March
2006. Available at: http://www.ecos.org/files/1917_file_formatted_draft_final.pdf
Quicksilver Caucus. Mercury-Added Product White Paper. November 2006. Available
at: http://www.ecos.org/
files/4494_file_Mercury_Added_Product_White_Paper_formatted_final_with_MS_cha
nges.pdf
Quicksilver Caucus. Mercury-Added Product Work Plan. September 2007. Available
at: http://www.ecos.org/
files/4701_file_2007_Mercury_Added_Product_Work_Plan_final.pdf
G. V. Ramesh, Muvva D. Prasad, and T. P. Radhakrishnan, “Mercury Nanodrops and
Nanocrystals,” Chemistry of Materials, 14 November 2011: pp 5231–5236. Publication
Date (Web): November 14, 2011
ECOS Resolution 12-5, Principles of Extended Producer Responsibility and Definition
of Product Stewardship, adopted on August 28, 2012
Works Cited: Mercury In Consumer Products
Page 73
68
Third Compendium of States’ Mercury Activities — Part I: National Overview
Mercury in dental amalgam can be a significant source of mercury releases into the en-
vironment. Cain, et al estimated that releases of mercury from dental amalgam in the
U.S. were 28.3 metric tonnes in 2005. Dental offices release mercury to the environ-
ment in several ways. Mercury can be released to indoor air when dental amalgam is
prepared for use, dental amalgam is placed in or removed from teeth, and amalgam
separators are emptied or serviced. Disposal, incineration, or land application of amal-
gam-related wastes and sewage treatment sludge can result in both air and water re-
leases. Mercury may impact groundwater if a dental facility uses a septic system for
waste water discharge.
The QSC has tracked states’ ideas on effective approaches for addressing this source
since the initial survey in 2000. When the 2005 Compendium of States’ Mercury Activ-
ities was published four states (Massachusetts, Maine, New Hampshire, and New
York) reported regulating mercury releases from dental facilities. In the 2011 survey,
30 states have mandatory (12 states) or voluntary (18 states) programs to address mer-
cury releases from dental amalgam. Additional results from the 2011 survey also indi-
cate that:
Dental association outreach, mailings and newsletter articles, and workshops
and training are the three most important components of a successful program
(see Table 1 below).
Local authorities in 13 states regulate releases and/or have more stringent regu-
lations than the state (see Table 2 on pages 72-73 for a summary of state re-
sponses to the survey).
Table 1: Components for Successful Dental Programs
Program Component Percent ‘very significant’
or ‘significant’ (all states)
State Dental Association Outreach 48
General Mailings and Articles in Newsletters 45
Workshops/Training 43
Compliance Visits 36
Technical Assistance Visits 24
Cost Assistance for Amalgam Separator Purchase 17
Mercury In Dental Amalgam
Page 74
69
Third Compendium of States’ Mercury Activities — Part I: National Overview
Mercury In Dental Amalgam
State activity increased when QSC began research and information sharing activities in
2007. These activities included:
Dental Mercury Amalgam Waste Management White Paper (April 2008). This pa-
per examined issues related to management of dental mercury waste
(including common features of dental amalgam programs), lessons learned
from existing local and state programs, and recommendations for future action.
The state programs reviewed in the paper began as voluntary memorandums
of understanding (MOU) with state dental associations, or as a result of region-
al initiatives. Many dentists participated in the MOUs. The MOUs enhanced
awareness of the environmental impacts of dental mercury and provided op-
tions for reducing these impacts among dental health care providers. The QSC
found it necessary, even with this enhanced awareness, to proceed with man-
datory programs.
Case Studies of Five Dental Mercury Amalgam Separator Programs (May 2008) that
described the programs in Massachusetts, Maine, Minnesota/Metropolitan
Council Environmental Services, New York, and Washington.
A webinar on dental mercury programs and state and local efforts to reduce
loading of mercury amalgam to water systems via use of amalgam separators
and best management practices (BMPs) for over 60 state and local government
representatives. The information on BMPs described activities dentists can pur-
sue to decrease the amount of mercury released from their dental practice.
These include installation or use of:
Amalgam separators, which capture most mercury particles before dental
water is discharged to the sewer.
Chair-side traps, which capture large mercury particles.
Non-chlorine based cleaners, which can dissolve and release mercury in the
pipes.
A letter to the U. S. EPA requesting that they work with the states to address
dental mercury amalgam (December 2008).
ECOS adopted a revised resolution “Implementing a National Version for Mer-
cury” (Resolution Number 07-1, Approved March 20, 2007) on March 24, 2010.
The resolution urged U.S. EPA to “include dental facilities under the Health
Care Sector for rulemaking in its Effluent Guidelines Program Plan and require
adoption of best management practices that reduce mercury discharges to pro-
tect the environment.” The QSC also sent a letter to its docket for U.S. EPA’s
annual review of an effluent guidelines. The QSC strongly recommended that
U.S. EPA pursue effluent guideline rulemaking for dental facilities and focus on
best management practices, including the use of amalgam separators.
Page 75
70
Third Compendium of States’ Mercury Activities — Part I: National Overview
The American Dental Association (ADA), U.S. EPA, and Congress were also active
during 2007 and 2008 in looking for ways to reduce amalgam mercury in wastewater.
ADA added the use of amalgam separators to its voluntary BMPs for dental
offices (October 2007).
U.S. EPA signed an MOU on December 29, 2008, with the ADA and National
Association of Clean Water Agencies (NACWA) to establish and monitor the
effectiveness of a Voluntary Dental Amalgam Discharge Reduction Program.
The purpose of the MOU was “to promote the use of BMPs adopted by the
ADA,” including the use of amalgam separators (December 2008). While the
QSC was not a signatory to the MOU, at the QSC’s request, U.S. EPA subse-
quently established an effective process to update the states and provide oppor-
tunities for QSC input regarding the MOU. The national MOU has, similar to
state experiences, raised awareness about this source of mercury in the environ-
ment. Never the less the QSC has encouraged U.S. EPA to go from the MOU (a
voluntary program) to a mandatory program (effluent guidelines) based on
state success with similar programs.)
ECOS testimony at the U.S. House of Representatives Oversight and Govern-
ment Reform Committee Domestic Policy Subcommittee hearing to assess U.S.
EPA's efforts to measure and reduce mercury pollution from dentist offices
(May 2010) contained two key recommendations:
U.S. EPA should set and implement voluntary goals via the MOU, speci-
fying that dental offices should install and use amalgam separators with-
in five years.
Dentists should be required to implement BMPs through effluent guide-
lines rulemaking which include installation and use of separators. The
experiences gained from implementing the MOU would inform the suc-
cess of the regulatory program.
U.S. EPA notified ECOS that it would initiate an effluent guideline rulemaking
for dental facilities to reduce mercury discharges (September 2010). QSC has
continued to engage with U.S. EPA on the rulemaking. U.S. EPA expected to
propose a rule in 2011 and take final action in 2012. The proposed rule has not
yet been released.
Mercury In Dental Amalgam
Page 76
71
Third Compendium of States’ Mercury Activities — Part I: National Overview
Table 2:Summary of State Responses to Survey
State
Total Number of
States 12 18 12 11 10 22 13
Alabama
Alaska
Arizona
Arkansas
California
Colorado
Connecticut
Delaware
Florida
Hawaii
Idaho
Illinois
Indiana
Iowa
Kansas
Kentucky
Louisiana
Maine
Maryland
Massachusetts
Michigan
Minnesota* *
Missouri
Montana
Nebraska
New Hampshire
Man
dat
ory
Pro
gra
m t
o
Ad
dre
ss D
enta
l M
ercu
ry
Vo
lun
tary
Pro
gra
m t
o
Ad
dre
ss D
enta
l M
ercu
ry
No
Pro
gra
m t
o A
dd
ress
Den
tal
Mer
cury
Req
uir
e A
mal
gam
Sep
arat
ors
Req
uir
e B
MP
All
ow
Sett
lin
g T
ank
s in
Pla
ce o
f S
epar
ato
r
Lo
cal
Go
ver
nm
ents
Mo
re
Str
ing
ent
than
Sta
te
Mercury In Dental Amalgam
Page 77
72
Third Compendium of States’ Mercury Activities — Part I: National Overview
Table 2:Summary of State Responses to Survey
State
New Jersey
New Mexico
New York
North Carolina
North Dakota
Ohio
Oklahoma
Oregon
Rhode Island
South Carolina
Texas
Utah
Vermont
Washington
West Virginia
Wisconsin
*The State of Minnesota has a voluntary program in association with the Minnesota Dental Associa-
tion. Metropolitan Council Environmental Services, the waste water treatment authority for Minneap-
olis/St. Paul metropolitan area, requires the use of amalgam separators.
Mercury In Dental Amalgam
Man
dat
ory
Pro
gra
m t
o
Ad
dre
ss D
enta
l M
ercu
ry
Vo
lun
tary
Pro
gra
m t
o
Ad
dre
ss D
enta
l M
ercu
ry
No
Pro
gra
m t
o A
dd
ress
Den
tal
Mer
cury
Req
uir
e A
mal
gam
Sep
arat
ors
Req
uir
e B
MP
All
ow
Sett
lin
g T
ank
s in
Pla
ce o
f S
epar
ato
r
Lo
cal
Go
ver
nm
ents
Mo
re
Str
ing
ent
than
Sta
te
Page 78
73
Third Compendium of States’ Mercury Activities — Part I: National Overview
Caine, Alexis, Disch, Sarah, Twaroski, Reindl, John, and Case, C. Randy; Substance
Flow Analysis of Mercury Intentionally Used in Products in the United States; Journal
of Industrial Ecology Volume 11, Number 3, pp. 61-75 July 2007.
Quicksilver Caucus. 2005 Compendium of States’ Mercury Activities. October 2005.
Available at: http://www.ecos.org/section/committees/cross_media/
quick_silver/2005_mercury_compendium
Quicksilver Caucus. Dental Mercury Amalgam Waste Management White Paper.
April 2008. Available at: http://www.ecos.org/
files/3148_image_Corrected_Final_Dental_Amalgam_White_Paper_April_2008.pdf
Quicksilver Caucus. Case Studies of Five Dental Mercury Amalgam Separator Pro-
grams. May 2008. Available at: http://www.ecos.org/
files/3193_file_case_studies_dental_amalgam_paper_052808.pdf
Quicksilver Caucus. Correspondence to United States Environmental Protection
Agency urging development of national strategy for managing dental mercury amal-
gam. December 2008. Available at: http://www.ecos.org/
files/3406_file_QSC_Letter_to_US_EPA_on_Dental_Amalgam_12_16_08.pdf
Environmental Council of the States. Resolution 07-1. Implementing a National Ver-
sion for Mercury. Renewed March 24, 2010. Available at: http://www.ecos.org/
files/4026_file_Resolution_07_1_2010_version.doc
American Dental Association. Best Management Practices for Amalgam Waste. Octo-
ber 2007. Available at: www.ada.org/sections/publicResources/.../
topics_amalgamwaste.pdf
U.S. EPA, American Dental Association, National Association of Clean Water Agen-
cies. Memorandum of Understanding on Reducing Dental Amalgam Discharges. De-
cember 2008. Available at: http://water.epa.gov/scitech/wastetech/guide/dental/
upload/2008_12_31_guide_dental_mou.pdf
U.S. House. 2010. Oversight and Government Committee, Domestic Policy Subcom-
mittee. Testimony of R. Steven Brown, Executive Director of Environmental Council of
the States: Hearing on Assessing EPA’s Efforts to Measure and Reduce Mercury Pollu-
tion from Dentist Offices. 111th Congress, 26 May. Available at: http://www.ecos.org/
files/4095_file_ECOS_Testimony_to_House_OGR_DP_on_Amalgam.pdf U.S. EPA.
Correspondence to Environmental Council of the States. October 2010. Available at:
http://www.ecos.org/files/4498_file_Silva_Letter_to_ECOS_on_Amalgam_EGs.pdf
Mercury In Dental Amalgam:
Citations for 2005 Mercury Release Estimates
Page 79
74
Third Compendium of States’ Mercury Activities — Part I: National Overview
For many years, vehicle manufacturers installed hood and trunk convenience-light
switches, vanity-light switches, and anti-lock braking system (ABS) and airbag sensor
modules that each contained one gram or more of mercury. An estimated 217 million
switches were installed in vehicles sold in the U.S. market until these components
were discontinued at the end of the 2002 model year. Mercury switches are present in
many 2002 and older domestic and imported vehicles that still operate on the nation’s
roads. This mercury becomes a problem when vehicles are retired from use. It is re-
leased during vehicle shredding and the steel recycling/smelting processes.
States Initiate Action to Remove Switches
States have been working with other stakeholders to address vehicle mercury switches
since 1995. The 2005 Compendium summarizes state actions to address mercury
switches through mid-2005. Several states adopted legislation after the publication of
that document. As of late 2005, five states (Arkansas, Maine, New Jersey, Rhode Is-
land, and Texas) had adopt-
ed legislation requiring ve-
hicle manufacturers to im-
plement vehicle switch edu-
cation and collection pro-
grams; all but Texas includ-
ed switch recovery incen-
tive payments in their legis-
lation. In addition, North
Carolina adopted legislation
requiring a manufacturers’
switch collection program
operated within a state sal-
vage yard program funded by a title transfer fee. Around 25 additional states were
addressing switches in some way without legislation mandating a switch removal pro-
gram or an education and collection program.
In late 2005 and early 2006, the QSC conducted three webinars for states on these legis-
lated and non-legislated programs, to educate states on actions that had been taken to
encourage or require removal of mercury switches from vehicles. In early 2006, Wash-
ington signed a Memorandum of Understanding (MOU) with End of Life Vehicle So-
lutions or ELVS (a non-profit corporation formed by vehicle manufactures to collect
and manage mercury switches) to operate an education and collection program in
Vehicle Mercury Switches
Table 1
Overview of State Approaches to Incentives in 2005
Legislated Programs
Paid by Automakers – Arkansas, Maine, New Jersey, and
Rhode Island
Paid by State –North Carolina
No Incentive – Texas
Voluntary Programs
Paid by the State – Washington (January 2006)
Page 80
75
Third Compendium of States’ Mercury Activities — Part I: National Overview
Vehicle Mercury Switches
cooperation with the state auto recyclers association. The Washington Legislature
appropriated funds for switch recovery incentive payments to be paid through the
Washington Department of Ecology.
By August 2006, eight more states (Illinois, Indiana, Iowa, Louisiana, Massachusetts,
South Carolina, Utah, and Vermont) enacted legislation and several additional states
implemented voluntary programs. Among these eight legislated programs, six includ-
ed switch recovery incentive payments paid by automakers or the state, or provided
tax credits. Illinois and Massachusetts laws also included triggers that activated a
switch recovery incentive payment by automakers if certain recovery targets were not
met.
Maryland adopted vehicle mercury switch legislation in 2009 requiring vehicle manu-
facturers to implement education, collection, and switch recovery incentive payments.
This is the only state legislation enacted after the NVMSRP MOU was signed in
August 2006.
Automakers and Federal Leadership to Recover Switches
In 2005, automakers established the non-profit corporation End of Life Vehicle Solu-
tions (ELVS) to manage switch outreach, collection, and recycling activities in legislat-
ed states. In early 2006, the U.S. EPA convened a second stakeholder dialogue for the
purpose of developing and implementing a national voluntary switch removal pro-
gram. The stakeholders announced an agreement in principle in mid-March 2006, and
signed an MOU implementing the program in August 2006. The MOU established
approaches and responsibilities for:
Conducting outreach and education.
Operating a switch collection and recycling program.
Establishing reporting requirements and a national database.
It also established other provisions, including:
Short term and long term switch recovery goals. The short term goal was to col-
lect four million switches in the first three years of the program. The long term
goal was to achieve a national switch recovery rate of 80 to 90 percent
(measured on a yearly basis), recognizing that recovery rates will be ramping up
during the first three years of the program.
A three year Implementation Fund to promote salvage yard and scrap processor
participation and switch recovery. Automakers and the steel industry each
contributed $2 million to this fund. The fund initially paid $1 per switch in
states where no other incentive was being paid.
Page 81
76
Third Compendium of States’ Mercury Activities — Part I: National Overview
Vehicle Mercury Switches
A base program that would operate in all states, with stakeholders taking re-
sponsibility for additional program components such as those required by state
laws.
The MOU anticipated a strong federal Electric Arc Furnace (EAF) Rule that would
drive participation and recovery as the program matured. The MOU is in effect
through the end of 2017 and the parties may agree to continue the program beyond
that date.
Implementing the National Voluntary Program
When the national program was initiated under the MOU, automakers took the lead,
through ELVS, to enroll yards and establish the national switch collection infrastruc-
ture state by state over the first year of the program. The QSC established a state con-
tacts group and began holding monthly conference calls in late 2006. The focus of the
group was to help states implement the program and facilitate communication among
the state agency staff responsible for the program.
During the first year of the national program, the automakers purchased ten years of
state by state vehicle registration data from Polk (a key source of data on vehicles) ,
and the parties to the MOU developed vehicle and
switch retirement models that forecast the number of
switches available for recovery each year on a nation-
al and state by state basis. This model has been used
to estimate national and state by state recovery rates
starting in 2007. The model was adjusted once in ear-
ly 2009 to account for the recession and incorporate
new information on theft and exports. In early 2012,
actual registration data for 2007-2011 was purchased
from Polk and past retirement forecasts are being
compared to actual vehicle retirement data from
Polk. Table 2 delineates the number of switches
available each year and the number recovered
through 2011.
In September 2007, U.S. EPA proposed a federal EAF
Area Source Rule, and issued the final rule on De-
cember 28, 2007. The rule contains two compliance
Table 2
Switch Recovery (millions)
Year Available Recovered
2007 4.6 0.7
2008 4.3 0.9
2009 4.1 0.9
2010 3.8 0.6
2011 3.5 0.7
2012 3.2
2013 3.0
2014 2.7
2015 2.4
2016 2.2
2017 1.9
Total 35.7
Page 82
77
Third Compendium of States’ Mercury Activities — Part I: National Overview
options incorporating switch removal: either a site-specific option or an option for par-
ticipation in a program approved by U.S. EPA. The national program, known as the
National Vehicle Mercury Switch Recovery Program (NVMSRP), and the Maine pro-
gram were identified as U.S. EPA-approved programs in the final rule.
In mid-2008, the Implementation Fund Coordinating Committee voted to increase the
payment per switch from $1 to $4 effective August 1, 2008, to provide increased incen-
tive for salvage yards to participate in the program and recover more switches. Switch
recovery increased significantly in the following months but the Implementation Fund
was depleted in mid-July 2009 and funding has not been renewed.
In January 2009, QSC released the “National Vehicle Mercury Switch Recovery Pro-
gram: Status Report for State and Local Agencies,” a two year analysis of the NVMSRP
with recommendations for changes to the program and the MOU. The report:
Identified state program elements that contributed to successful programs.
Provided an overview of state/local programs and regulations related to EAF
facilities subject to the EAF Area Source Rule promulgated in December 2007.
This report provided detailed program analysis and recommendations from the
state (QSC) representatives on the NVMSRP National Steering Committee to the
full Committee in advance of the in-person program evaluation meetings in
March 2009 and March 2010. The report is available on the ECOS website at
http://www.ecos.org/
files/3461_file_NVMSRP_Status_Report_Jan_09_Revised_Final.pdf.
At NVMSRP Steering Committee meetings held in March 2009, the parties evaluated
the program after two years, and discussed program and MOU modifications to
strengthen the program and increase the switch recovery rate. Following this meeting,
the National Steering Committee did not adopt any MOU or program changes for the
following reasons:
Financial Difficulties Interrupt National Switch Recovery Program – In July
2009, General Motors (GM) declared bankruptcy and stopped making payments
to ELVS. Based on vehicle market share and use of switches, GM provided just
over 50% of ELVS support and this caused significant stress to ELVS and the en-
tire switch collection and recycling infrastructure that ELVS had developed.
Many state environmental agencies wrote to GM and U.S. Treasury Department
officials working on the GM bankruptcy, urging resumption of payments to
Vehicle Mercury Switches
Page 83
78
Third Compendium of States’ Mercury Activities — Part I: National Overview
ELVS in order to maintain the national program. GM, at this time known as
Motors Liquidation Corporation (MLC), resumed payments to ELVS in late
2009, just as ELVS was preparing to limit switch collection and recycling to leg-
islated states.
NVMSRP Supported through Resolution of GM Bankruptcy – During 2010 and
2011, MLC and many of the legislated states negotiated and settled environ-
mental claims related to switch recovery program requirements. In August
2011, MLC made a contribution of New GM stock to the states that had filed
claims, in the value of approximately $2.8 million, reflecting the estimated need
to recover switches through approximately 2022. The states transferred the
stock to ELVS in support of the program for their own states as well as ELVS
operations in general. In early 2011, GM/MLC’s corporate successor in the
bankruptcy process, New GM, committed to a voluntary contribution of $4.5
million to ELVS. This contribution came about in part because many state en-
vironmental agencies also corresponded with New GM in 2009, urging them to
continue their support of ELVS as a vehicle manufacturer, in order to maintain
a viable national switch collection and recycling program.
U.S. EPA Reconsiders EAF Rule – In March 2010, U.S .EPA announced a volun-
tary reconsideration of the EAF Rule. U.S. EPA initially committed to the pub-
lication of a final rule by June 30, 2012, but now expects to publish a proposed
rule in the second half of 2012.
At NVMSRP Steering Committee meetings held in March 2010, the parties evaluated
the program after three years and again discussed program and MOU modifications
to strengthen the program and increase the switch recovery rate. Since U.S. EPA
announced its voluntary reconsideration of the EAF Rule, the parties have not negoti-
ated any program or MOU changes since it is not known what U.S. EPA may propose
or adopt and how a revised rule would affect the responsibilities of the parties or the
status of the NVMSRP as a compliance option.
R.L Polk company provides data about the population of vehicles on the road after
Juky 2006 which may have switchesas of
Vehicle Mercury Switches
Page 84
79
Third Compendium of States’ Mercury Activities — Part I: National Overview
ECOS and QSC Support for a National Program
The NVSMRP MOU and 50 state participants have built the national infrastructure for
vehicle mercury switch collection, recycling and recordkeeping. However, the nation-
al program has not met the switch recovery goals for several reasons. As of December
31, 2011, about 3.9 million vehicle mercury switches had been collected through the
NVMSRP since January 2007. An estimated 19.66 million switches were available for
recovery during this time period, for a four year recovery rate of about 19.8 percent.
As noted in Table 3, ECOS Resolutions in support of a national vehicle mercury switch
recovery program specifically call for monetary and non-monetary incentives or driv-
ers for switch recovery, including regulatory drivers, such as a strong EAF Area
Source Rule that is effective throughout the supply chain.
Table 3: History of ECOS Resolutions
Resolution 04-7: NEED FOR NATIONWIDE MERCURY SWITCH REMOVAL
STRATEGY THAT PROVIDES FLEXIBILITY TO THE STATES (October 6, 2004)
Endorses the development of a national program and identifies the four pro-
gram elements necessary for ECOS support:
Information Dissemination and Education to all dismantlers (and any-
one else in possession of end-of-life vehicles prior to crushing, shred-
ding, or melting).
Collection and Management system for collecting switches from dis-
mantlers and transporting them to mercury retorters—without cost to
dismantlers—and arrangements made with the retorters to accept and
recycle them.
Switch-Removal Strategies with monetary and non-monetary incen-
tives to ensure shared responsibility for the identification, removal,
and proper management of all reasonably accessible mercury switches
from end-of-life vehicles.
Measures of Success to ensure the effectiveness of programs in achiev-
ing the highest possible switch removal
Resolution 06-7: ENDORSEMENT OF NATIONAL MERCURY SWITCH REMOV-
AL PROGRAM MEMORANDUM OF AGREEMENT THAT REDUCES MERCU-
RY IN THE ENVIRONMENT AND PROVIDES FLEXIBILITY TO THE STATES
(August 11, 2006)
Endorses the NVMSRP MOU and identifies how it includes the program ele-
ments necessary for ECOS support
Vehicle Mercury Switches
Page 85
80
Third Compendium of States’ Mercury Activities — Part I: National Overview
Table 3: History of ECOS Resolutions — continued
Resolution 06-7: ENDORSEMENT OF NATIONAL MERCURY SWITCH REMOV-
AL PROGRAM MEMORANDUM OF AGREEMENT THAT REDUCES MERCU-
RY IN THE ENVIRONMENT AND PROVIDES FLEXIBILITY TO THE STATES
(Renewed as Amended September 17, 2007)
In advance of EPA’s EAF Area Source rule, requests that EPA adopt EAF rule
“provisions to monitor and verify effectiveness of the NVMSRP and alterna-
tive switch removal plans through written documentation and audits of pro-
gram participation and switch recovery by suppliers recordkeeping, mercury
emissions testing/monitoring requirements, and other appropriate measures
by the regulated facility.”
Resolutions 06-7 and 12-8: ENDORSEMENT OF NATIONAL MERCURY SWITCH
REMOVAL PROGRAM MEMORANDUM OF AGREEMENT THAT REDUCES
MERCURY IN THE ENVIRONMENT AND PROVIDES FLEXIBILITY TO THE
STATES (Renewed as Revised March 23, 2009 and Revised as Resolution 12-8
August 28, 2012)
Requests that U.S. EPA adopt approaches to improve the effectiveness of the
program and the EAF rule, including but not limited to, enhancements to the
program elements, and EAF Rule provisions that augment the existing rule’s
recordkeeping and reporting, mercury emissions testing, monitoring and ver-
ification requirements, and other measures that ensure reduced mercury
emissions from these facilities.
Requests that U.S. EPA not include the NVMSRP as a primary compliance op-
tion in rulemaking for the integrated steel industry, since it is not achieving
sufficient switch recovery rates.
Resolution Number 10-9: REVIEW AND RECONSIDERATION OF ENDORSE-
MENT OF THE NATIONAL VEHICLE MERCURY SWITCH RECOVERY PRO-
GRAM MEMORANDUM OF UNDERSTANDING (MOU) (August 30, 2010)
Recognizes that NVMSRP no longer includes all program elements identified
in Resolutions 04-7 and 06-7; calls on parties to make program and MOU
changes; calls on U.S. EPA to issue revised EAF Area Source Rule by June 30,
2012, to provide additional program drivers and regulatory framework for
enhanced switch recovery.
Vehicle Mercury Switches
Page 86
Third Compendium of States’ Mercury Activities — Part I: National Overview
81
BLANK PAGE
Page 87
Third Compendium of States’ Mercury Activities — Part II: State Programs
82
This section of the compendium includes specific information about the sources of
mercury and mercury activities in each of the 42 states participating in the 2011 Sur-
vey.
Air Emissions Information -- The 2011 survey of states did not ask states to provide in-
formation on air emission sources within their state since not all state programs main-
tain an inventory. This information is from the United States Environmental Protec-
tion Agency’s (U.S. EPA) 2008 National Emissions Inventory (NEI) database. Please
note that since the NEI database is developed and maintained by U.S. EPA, infor-
mation in it may differ from each state’s specific mercury emission inventory. This is
due to a variety of factors including, but not limited to differences in: emission factors
applied; availability of stack test data; and/or methods used in the state versus U.S.
EPA to estimate area sources including product-related emissions. Additionally, state
data in a study done by the Northeast States for Coordinated Air Use Management
(NESCAUM) for the State of New York suggests that emission values for oil combus-
tion, in particular residential fuel combustion (for heating), may be considerably over-
estimated (see Determination of Sulfur and Toxic Metals Content of Distillates and Residual
Oil in the State of New York at http://www.nescaum.org/topics/mercury.
State Mercury Activity – The information about each of the 42 responding states’ mer-
cury activities is a direct summary of its survey response. It reflects their answers to
the survey questions. The activities shown for each state are those they included infor-
mation about in their responses. Please note that state mercury programs are not fed-
eral mandates, they are created by each state. This means that each state’s program
activities address their specific mercury issues.
Web Address Information – The QSC team that compiled this section tested the links
found on each state’s pages. However, over time these links may change. If a link
doesn’t work, please communicate with that state’s contact person. If you are not able
to reach that person you can find information for each state environmental program on
the Environmental Council of the States web site (www.ecos.org) by clicking on
“States.”
PART II: Information About
Individual State Mercury Programs
Page 88
Third Compendium of States’ Mercury Activities — Part II: State Programs
83
U.S. EPA Approved TMDLs
Plans to develop a statewide TMDL
A multimedia approach will be used to develop the TMDL.
Dental Program
No program to address dental mercury
Areas of Coordination with the Medical Community
Other information:
The department coordinates with the medical commu-
nity (i.e. ADPH) regarding fish consumption adviso-
ries and waste management requirements, particularly
as they apply to remediation projects and site assess-
ments. Also in years past, the department provided
assistance to ADPH as they were developing guidance
for their county health departments to remove mercury
thermometers and other devices from their offices.
Monitoring
Air emissions from stacks
Wastewater effluent
Water column
Fish tissue
Fish Consumption Fish Consumption Fish Consumption
AdvisoriesAdvisoriesAdvisories
Waterbody-specific
advisories
Alabama's Mercury Actions 's Mercury Actions 's Mercury Actions
Alabama Department of Environmental Management
http://www.adem.state.al.us/default.cnt
Contact: Marilyn Elliott
Phone: 334.271.7710 Email: [email protected]
Status of Mercury
Reduction Plans
No mercury reduc-
tion plan or strategy
exists or is planned
Page 89
Third Compendium of States’ Mercury Activities — Part II: State Programs
84
Mercury Research
http//www.adem.state.al.us/programs/waterforms/surfacewatermonitoring.pdf
Alabama's Mercury Actions: 's Mercury Actions: 's Mercury Actions: continuedcontinuedcontinued
Emissions Inventory
Alabama’s mercury
emissions inventory :
Estimates for the
amount of
mercury released
to the
environment from
air emission
sources
Alabama
2008 National Emissions Inventory – Top Source Categories
Emission Source Pounds
Fuel Combustion- Electric Generation - Coal 3466
Industrial Processes - Ferrous Metals 521
Industrial Processes - Cement Manufacturing 341
Industrial Processes - Chemical Manufacturing 340
Industrial Processes - Pulp & Paper 86
Miscellaneous Non-Industrial—Not Elsewhere Classified 73
Fuel Combustion - Industrial Boilers, Internal Combustion
Engines - Biomass 66
Fuel Combustion - Industrial Boilers, Internal Combustion
Engines - Coal 37
Mobile - Locomotives 32
Industrial Processes - Not Elsewhere Classified 29
Industrial Processes - Petroleum Refineries 20
Mobile - On-Road Gasoline Light Duty Vehicles 14
Industrial Processes - Non-ferrous Metals 12
Industrial Processes - Storage and Transfer 12
Please note that the NEI database is the federal database developed by
U.S. EPA and may differ from each state’s specific mercury emission in-
ventory due to a variety of factors including, but not limited to differences
in: emission factors applied; availability of stack test data; and/or meth-
ods used in the state versus U.S. EPA to estimate area sources including
product-related emissions.
Page 90
Third Compendium of States’ Mercury Activities — Part II: State Programs
85
U.S. EPA Approved TMDLs
Yes, waterbody-specific
A multimedia approach was used when developing the
TMDLs.
Addresses the following sources:
- Legacy sources
Dental Program
Voluntary program to address dental mercury
Allow settling tanks in place of separators
Areas of Coordination with the Medical Community
Fish consumption advisories
Monitoring
Air emissions from stacks
Wastewater effluent
Wastewater sludge
Water column
Waterbody sediment
Fish tissue
Wildlife
Landfill
Fish Consumption Fish Consumption Fish Consumption
AdvisoriesAdvisoriesAdvisories
Statewide freshwa-
ter advisories
Waterbody-specific
advisories
Alaska's Mercury Actions's Mercury Actions's Mercury Actions
Alaska Department of Environmental Conservation
http://www.akcontaminants.org/
Contact: Kristin Ryan
Phone: 907.269.7644 Email: [email protected]
Status of Mercury
Reduction Plans
Intend to develop
mercury reduction
plan or strategy in
the future
Page 91
Third Compendium of States’ Mercury Activities — Part II: State Programs
86
Mercury Research
http://www.dec.alaska.gov/eh/vet/fish.htm
Alaska's Mercury Actions: 's Mercury Actions: 's Mercury Actions: continuedcontinuedcontinued
Alaska
2008 National Emissions Inventory – Top Source Categories
Emission Source Pounds
Fuel Combustion - Residential - Oil 39
Fuel Combustion - Electric Generation - Coal 24
Industrial Processes - Petroleum Refineries 13
Please note that the NEI database is the federal database devel-
oped by U.S. EPA and may differ from each state’s specific mercu-
ry emission inventory due to a variety of factors including, but not
limited to differences in: emission factors applied; availability of
stack test data; and/or methods used in the state versus U.S. EPA
to estimate area sources including product-related emissions. Ad-
ditionally, state data in a study done by NESCAUM for the State of
New York suggests that emission values for oil combustion, in par-
ticular residential fuel combustion (for heating), may be considera-
bly overestimated. (see Determination of Sulfur and Toxic Metals
Content of Distillates and Residual Oil in the State of New York at
http://www.nescaum.org/topics/mercury )
Page 92
Third Compendium of States’ Mercury Activities — Part II: State Programs
87
U.S. EPA Approved TMDLs
Yes, waterbody-specific
A multimedia approach was used when developing the TMDLs.
Addresses the following sources:
- Atmospheric deposition
Dental Program
Voluntary program to address dental mercury
Local government more stringent than state
Areas of Coordination with the Medical Community
Fish consumption advisories
Pollution prevention
Dental issues
Waste management requirements
Other information:
The Arizona Department of Environmental Quality coordinates
with the Department of Health Services who may interface with
the medical community.
Monitoring
Air emissions from stacks
Wastewater effluent
Wastewater sludge
Water column
Waterbody sediment
Fish tissue
Fish Consumption Fish Consumption Fish Consumption
AdvisoriesAdvisoriesAdvisories
Waterbody-specific
advisories
Arizona's Mercury Actions 's Mercury Actions 's Mercury Actions
Arizona Department of Environmental Quality
http://www.azdeq.gov/
Contact: Linda Taunt
Phone: 602.771.4416 Email: [email protected]
Status of Mercury
Reduction Plans
Mercury reduction
plan or strategy
under development
Page 93
Third Compendium of States’ Mercury Activities — Part II: State Programs
88
Arizona's Mercury Actions: 's Mercury Actions: 's Mercury Actions: continuedcontinuedcontinued
Emissions Inventory
Arizona’s mercury emissions
inventory :
Estimates for the amount of
mercury released to the envi-
ronment from water pollu-
tion sources
Estimates for the amount of
mercury released to the envi-
ronment from air emission
sources
Arizona
2008 National Emissions Inventory –
Top Source Categories
Emission Source Pounds
Fuel Combustion- Electric Generation - Coal 1074
Miscellaneous Non-Industrial - Not Elsewhere
Classified 65
Mobile - Locomotives 46
Fuel Combustion - Industrial Boilers, Internal
Combustion Engines - Coal 32
Industrial Processes - Cement Manufacturing 31
Industrial Processes - Non-ferrous Metals 28
Fuel Combustion - Industrial Boilers, Internal
Combustion Engines - Oil 21
Mobile - On-Road Gasoline Light Duty Vehicles 14
Please note that the NEI database is the federal database devel-
oped by U.S. EPA and may differ from each state’s specific
mercury emission inventory due to a variety of factors includ-
ing, but not limited to differences in: emission factors applied;
availability of stack test data; and/or methods used in the state
versus U.S. EPA to estimate area sources including product-
related emissions. Additionally, state data in a study done by
NESCAUM for the State of New York suggests that emission
values for oil combustion, in particular residential fuel com-
bustion (for heating), may be considerably overestimated. (see
Determination of Sulfur and Toxic Metals Content of Distillates and
Residual Oil in the State of New York at http://www.nescaum.org/
topics/mercury )
Page 94
Third Compendium of States’ Mercury Activities — Part II: State Programs
89
U.S. EPA Approved TMDLs
Yes, waterbody-specific
A multimedia approach was not used when developing the
TMDLs.
Addresses the following sources:
- Atmospheric deposition
- Legacy sources
- Wastewater treatment plant discharges
Dental Program
Voluntary program to address dental mercury
Allow settling tanks in place of separators
Local government more stringent than state
Areas of Coordination with the Medical Community
Fish consumption advisories
Pollution prevention
Dental issues
Waste management requirements
Monitoring
Wastewater effluent
Wastewater sludge
Water column
Fish tissue
Fish Consumption Fish Consumption Fish Consumption
AdvisoriesAdvisoriesAdvisories
Waterbody-specific
advisories
Arkansas' Mercury Actions ' Mercury Actions ' Mercury Actions
Arkansas Department of Environmental Quality
http://www.adeq.state.ar.us/
Contact: J. Ryan Benefield
Phone: 501.682.0960 Email: [email protected]
Status of Mercury
Reduction Plans
No mercury reduction
plan or strategy exists
or is planned
Page 95
Third Compendium of States’ Mercury Activities — Part II: State Programs
90
Arkansas' Mercury Actions: ' Mercury Actions: ' Mercury Actions: continuedcontinuedcontinued
Emissions Inventory
Arkansas’ mercury emissions
inventory :
Estimates for the amount of
mercury released to the
environment from air
emission sources
Arkansas
2008 National Emissions Inventory –
Top Source Categories
Emission Source Pounds
Fuel Combustion - Electric Generation - Coal 779
Waste Disposal 357
Industrial Processes - Ferrous Metals 308
Fuel Comb - Industrial Boilers, Internal Combus-
tion Engines - Coal 200
Industrial Processes - Cement Manufacturing 134
Miscellaneous Non-Industrial -Not Elsewhere
Classified 43
Fuel Combustion - Industrial Boilers, Internal
Combustion Engines - Biomass 39
Mobile - Locomotives 35
Industrial Processes - Pulp & Paper 21
Please note that the NEI database is the federal database de-
veloped by U.S. EPA and may differ from each state’s spe-
cific mercury emission inventory due to a variety of factors
including, but not limited to differences in: emission factors
applied; availability of stack test data; and/or methods used
in the state versus U.S. EPA to estimate area sources includ-
ing product-related emissions.
Page 96
Third Compendium of States’ Mercury Activities — Part II: State Programs
91
U.S. EPA Approved TMDLs
Yes, waterbody-specific and watershed or basin
A multimedia approach was used when developing the TMDLs.
Addresses the following sources:
- Atmospheric deposition
- Legacy sources
- Wastewater treatment plant discharges
- Active mining
Dental Program
No program to address dental mercury
Allow settling tanks in place of separators
Local government more stringent than state
Areas of Coordination with the Medical Community
Dental issues
Monitoring
Air emissions from stacks
Wastewater effluent
Wastewater sludge
Water column
Waterbody sediment
Fish tissue
Wildlife
Fish Consumption Fish Consumption Fish Consumption
AdvisoriesAdvisoriesAdvisories
Waterbody-specific
advisories
California's Mercury Actions 's Mercury Actions 's Mercury Actions
California Department of Toxic Substances Control
http://www.dtsc.ca.gov/
Contact: Andre Algazi
Phone: 916.324.3114 Email: [email protected]
Status of Mercury
Reduction Plans
Mercury reduction
plan or strategy in
place
Page 97
Third Compendium of States’ Mercury Activities — Part II: State Programs
92
Mercury Research
http://www.oehha.ca.gov
http://www.swrcb.ca.gov, search for "mercury"
California's Mercury Actions: 's Mercury Actions: 's Mercury Actions: continuedcontinuedcontinued
Mercury Containing Products
Limits on mercury
content in products
Sales ban, use ban or
Phase out:
- Cosmetics
- Measuring devices
- Medical devices
- Switches and relays
- Thermometers
- Thermostats
Exemption process
Emissions Inventory
California’s mercury emissions in-
ventory :
Estimates for the amount of
mercury released to the envi-
ronment from water pollution
sources
Estimates for the amount of
mercury released to the envi-
ronment from air emission
sources
California
2008 National Emissions Inventory –
Top Source Categories
Emission Source Pounds
Industrial Processes - Cement Manufacturing 2119
Fuel Combustion - Electric Generation - Other 732
Mobile - On-Road Diesel Heavy Duty Vehicles 701
Mobile - Non-Road Equipment - Diesel 563
Industrial Processes - Not Elsewhere Classified 481
Waste Disposal 333
Industrial Processes - Ferrous Metals 250
Industrial Processes - Oil & Gas Production 141
Fires - Agricultural Field Burning 94
Industrial Processes - Petroleum Refineries 89
Miscellaneous Non-Industrial -Not Elsewhere Clas-
sified 86
Fuel Combustion - Industrial Boilers, Internal Com-
bustion Engines - Oil 80
Mobile - Locomotives 75
Industrial Processes - Storage and Transfer 52
Mobile - Non-Road Equipment - Gasoline 46
Please note that the NEI database is the federal database de-
veloped by U.S. EPA and may differ from each state’s specific
mercury emission inventory due to a variety of factors includ-
ing, but not limited to differences in: emission factors ap-
plied; availability of stack test data; and/or methods used in
the state versus U.S. EPA to estimate area sources including
product-related emissions. Additionally, state data in a study
done by NESCAUM for the State of New York suggests that
emission values for oil combustion, in particular residential
fuel combustion (for heating), may be considerably overesti-
mated. (see Determination of Sulfur and Toxic Metals Content of
Distillates and Residual Oil in the State of New York at http://
www.nescaum.org/topics/mercury )
Page 98
Third Compendium of States’ Mercury Activities — Part II: State Programs
93
U.S. EPA Approved TMDLs
Yes, waterbody-specific
A multimedia approach was not used when developing the
TMDLs.
Addresses the following sources:
- Atmospheric deposition
Dental Program
No program to address dental mercury
Allow settling tanks in place of separators
Local government more stringent than state
Areas of Coordination with the Medical Community
Fish consumption advisories
Pollution prevention
Dental issues
Waste management requirements
Monitoring
Air emissions from stacks
Ambient air
Atmospheric deposition
(other than NADP participation)
Wastewater effluent
Wastewater sludge
Water column
Fish tissue
Fish Consumption Fish Consumption Fish Consumption
AdvisoriesAdvisoriesAdvisories
Waterbody-specific
advisories
Colorado's Mercury Actions 's Mercury Actions 's Mercury Actions
Colorado Department of Public Health and Environment
http://www.cdphe.state.co.us/hm/mercury/index.htm
Contact: Greg Fabisiak
Phone: 303.692.2903 Email: [email protected]
Status of Mercury
Reduction Plans
Mercury reduction
plan or strategy in
place
Page 99
Third Compendium of States’ Mercury Activities — Part II: State Programs
94
Mercury Research
http://www.cdphe.state.co.us/wq/FishCon/index.html
Colorado's Mercury Actions: 's Mercury Actions: 's Mercury Actions: continuedcontinuedcontinued
Emissions Inventory
Colorado’s mercury emissions in-
ventory :
Estimates for the amount of
mercury released to the envi-
ronment from air emission
sources
Colorado
2008 National Emissions Inventory –
Top Source Categories
Emission Source Pounds
Industrial Processes - Ferrous Metals 721
Fuel Combustion - Electric Generation - Coal 679
Industrial Processes - Not Elsewhere Classified 84
Industrial Processes - Cement Manufacturing 81
Mobile - Locomotives 30
Miscellaneous Non-Industrial - Not Elsewhere
Classified 23
Industrial Processes - Non-ferrous Metals 13
Mobile - On-Road Gasoline Light Duty Vehicles 11
Fuel Combustion - Industrial Boilers, Internal
Combustion Engines - Coal 10
Please note that the NEI database is the federal database devel-
oped by U.S. EPA and may differ from each state’s specific mer-
cury emission inventory due to a variety of factors including, but
not limited to differences in: emission factors applied; availabil-
ity of stack test data; and/or methods used in the state versus
U.S. EPA to estimate area sources including product-related
emissions.
Page 100
Third Compendium of States’ Mercury Activities — Part II: State Programs
95
U.S. EPA Approved TMDLs
Yes, multistate
A multimedia approach was used when developing the TMDLs.
Addresses the following sources:
- Atmospheric deposition
- Wastewater treatment plant discharges
Dental Program
Mandatory program to address dental mercury
Require amalgam separators
Require BMPs
Areas of Coordination with the Medical Community
Fish consumption advisories
Pollution prevention
Dental issues
Waste management requirements
Monitoring
Air emissions from stacks
Indoor air
(for the purposes of evaluating spill cleanup)
Wastewater sludge
Fish tissue
Fish Consumption Fish Consumption Fish Consumption
AdvisoriesAdvisoriesAdvisories
Statewide freshwater
advisories
Waterbody-specific
advisories
Connecticut's Mercury Actions 's Mercury Actions 's Mercury Actions
Connecticut Department of Energy and Environmental Protection
http://www.ct.gov/dep/cwp/view.asp?a=2690&Q=322430&depNav_GID=1651
Contact: Robert Hannon
Phone: 860.424.3245 Email: [email protected]
Status of Mercury
Reduction Plans
Mercury reduction
plan or strategy in
place
Page 101
Third Compendium of States’ Mercury Activities — Part II: State Programs
96
Mercury Research
A comprehensive lake study was completed in
1995.
In 2005, a 3 year contract was executed with the
University of Connecticut to conduct a new
statewide lake study (program re-evaluation eve-
ry 10 years).
The Department initiated a routine monitoring
program in 2006. The program monitors 20 differ-
ent "wadeable" streams per year. Fish tissues will
be sampled on site for each of the streams. This
will be a continuous, random monitoring pro-
gram.
Connecticut's Mercury Actions: 's Mercury Actions: 's Mercury Actions: continuedcontinuedcontinued
Mercury Containing Products
Labeling requirements
Limits on mercury content
in products
Sales ban, use ban or
Phase out:
- Cosmetics
- Measuring devices
- Medical devices
- Novelty items/toys
- Switches and relays
- Thermometers
- Thermostats
- Other
Exemption process
Emissions Inventory
Connecticut’s mercury emissions in-
ventory :
Estimates for the amount of
mercury released to the environ-
ment from air emission sources
Connecticut
2008 National Emissions Inventory –
Top Source Categories
Emission Source Pounds
Fuel Combustion - Residential - Oil 232
Waste Disposal 58
Miscellaneous Non-Industrial - Not Else-
where Classified 50
Please note that the NEI database is the federal database
developed by U.S. EPA and may differ from each state’s
specific mercury emission inventory due to a variety of
factors including, but not limited to differences in: emis-
sion factors applied; availability of stack test data; and/or
methods used in the state versus U.S. EPA to estimate
area sources including product-related emissions. Addi-
tionally, state data in a study done by NESCAUM for the
State of New York suggests that emission values for oil
combustion, in particular residential fuel combustion (for
heating), may be considerably overestimated. (see Deter-
mination of Sulfur and Toxic Metals Content of Distillates and
Residual Oil in the State of New York at http://
www.nescaum.org/topics/mercury )
Page 102
Third Compendium of States’ Mercury Activities — Part II: State Programs
97
U.S. EPA Approved TMDLs
Plans to develop a waterbody-specific TMDL
A multimedia approach will be used to develop the TMDLs.
Dental Program
No program to ad-
dress dental mercury
Areas of Coordination with the Medical Community
Fish consumption advisories
Pollution prevention
Dental issues
Waste management requirements
Monitoring
Water column
Waterbody sediment
Fish tissue
Landfill Fish Consumption Fish Consumption Fish Consumption
AdvisoriesAdvisoriesAdvisories
Waterbody-specific
advisories
Delaware's Mercury Actions 's Mercury Actions 's Mercury Actions
Delaware Department of Natural Resources and Environmental Control
http://www.dnrec.delaware.gov/Pages/Portal.aspx
Contact: Robert J. Zimmerman
Phone: 302.739.9000 Email: [email protected]
Mercury Research
Measuring Hg
methylation rates in
the sediments of the
Delaware River
Delaware
2008 National Emissions Inventory – Top Source Categories
Emission Source Pounds
Industrial Processes - Ferrous Metals 163
Fuel Combustion - Electric Generation - Coal 122
Fuel Combustion - Industrial Boilers, Internal Combus-
tion Engines - Coal 74
Fuel Combustion - Industrial Boilers, Internal Combus-
tion Engines - Other 38
Fuel Combustion - Electric Generation - Natural Gas 28
Please note that the NEI database is the federal database developed by
U.S. EPA and may differ from each state’s specific mercury emission
inventory due to a variety of factors including, but not limited to
differences in: emission factors applied; availability of stack test data;
and/or methods used in the state versus U.S. EPA to estimate area
sources including product-related emissions.
Page 103
Third Compendium of States’ Mercury Activities — Part II: State Programs
98
BLANK PAGE
Page 104
Third Compendium of States’ Mercury Activities — Part II: State Programs
99
U.S. EPA Approved TMDLs
Plans to develop a statewide TMDL
A multimedia approach will be used to develop the TMDLs.
Dental Program
Voluntary program to address dental mercury
Allow settling tanks in place of separators
Areas of Coordination with the Medical Community
Fish consumption advisories
Pollution prevention
Dental issues
Cultural/ritualistic uses
Waste management requirements
Monitoring
Wastewater effluent
Wastewater sludge
Water column
Waterbody sediment
Fish tissue
Wildlife
Fish Consumption Fish Consumption Fish Consumption
AdvisoriesAdvisoriesAdvisories
Statewide freshwater
advisories
Statewide coastal ad-
visories
Waterbody-specific
advisories
Florida's Mercury Actions 's Mercury Actions 's Mercury Actions
Florida Department of Environmental Protection
http://www.dep.state.fl.us/waste/categories/mercury/
Contact: Don Axelrad
Phone: 850.245.8072 Email: [email protected]
Status of Mercury
Reduction Plans
Mercury reduction
plan or strategy under
development
Page 105
Third Compendium of States’ Mercury Activities — Part II: State Programs
100
Mercury Research
http://www.dep.state.fl.us/water/sas/mercury/index.htm
Florida's Mercury Actions: 's Mercury Actions: 's Mercury Actions: continuedcontinuedcontinued
Emissions Inventory
Florida’s mercury emissions inven-
tory :
Estimates for the amount of
mercury released to the envi-
ronment from water pollu-
tion sources
Estimates for the amount of
mercury released to the envi-
ronment from air emission
sources
Florida
2008 National Emissions Inventory –
Top Source Categories
Emission Source Pounds
Fuel Combustion- Electric Generation - Coal 1270
Fuel Combustion - Electric Generation - Other 567
Industrial Processes - Cement Manufacturing 443
Miscellaneous Non-Industrial -Not Elsewhere Clas-
sified 214
Industrial Processes - Ferrous Metals 129
Industrial Processes - Not Elsewhere Classified 80
Industrial Processes - Storage and Transfer 71
Fuel Combustion - Industrial Boilers, Internal Com-
bustion Engines - Coal 50
Waste Disposal 46
Mobile - On-Road Gasoline Light Duty Vehicles 46
Fuel Combustion - Electric Generation - Oil 37
Fuel Combustion - Electric Generation - Biomass 27
Fuel Combustion - Industrial Boilers, Internal Com-
bustion Engines - Other 20
Mobile - Locomotives 17
Fuel Combustion - Electric Generation - Natural Gas 12
Please note that the NEI database is the federal database devel-
oped by U.S. EPA and may differ from each state’s specific mer-
cury emission inventory due to a variety of factors including, but
not limited to differences in: emission factors applied; availabil-
ity of stack test data; and/or methods used in the state versus
U.S. EPA to estimate area sources including product-related
emissions. Additionally, state data in a study done by NES-
CAUM for the State of New York suggests that emission values
for oil combustion, in particular residential fuel combustion (for
heating), may be considerably overestimated. (see Determination
of Sulfur and Toxic Metals Content of Distillates and Residual Oil in
the State of New York at http://www.nescaum.org/topics/mercury )
Page 106
Third Compendium of States’ Mercury Activities — Part II: State Programs
101
Dental Program
No program to address dental mercury
Allow settling tanks in place of separators
Areas of Coordination with the Medical Community
Fish consumption advisories
Monitoring
Air emissions from stacks
Ambient air
Indoor air
(for the purposes of evaluating spill cleanup)
Wastewater effluent
Wastewater sludge
Fish tissue
Fish Consumption Fish Consumption Fish Consumption
AdvisoriesAdvisoriesAdvisories
Statewide advisories
Hawaii's Mercury Actions 's Mercury Actions 's Mercury Actions
Hawaii Department of Health
http://hawaii.gov/health
Contact: Barbara Brooks
Phone: 808.586.4249 Email: [email protected]
Mercury Research
Mercury biomoni-
toring in women of
childbearing age
Emissions Inventory
Hawaii’s mercury
emissions inventory :
Estimates for the
amount of mercury
released to the
environment from
air emission sources
Hawaii
2008 National Emissions Inventory –
Top Source Categories
Emission Source Pounds
Fuel Combustion - Electric Generation - Other 90
Miscellaneous Non-Industrial -Not Elsewhere Classi-
fied 17
Please note that the NEI database is the federal database developed by
U.S. EPA and may differ from each state’s specific mercury emission
inventory due to a variety of factors including, but not limited to
differences in: emission factors applied; availability of stack test data;
and/or methods used in the state versus U.S. EPA to estimate area
sources including product-related emissions.
Page 107
Third Compendium of States’ Mercury Activities — Part II: State Programs
102
BLANK PAGE
Page 108
Third Compendium of States’ Mercury Activities — Part II: State Programs
103
U.S. EPA Approved TMDLs
Yes, watershed or basin
A multimedia approach was used when developing the TMDLs.
Addresses the following sources:
- Atmospheric deposition
Fish Consumption Fish Consumption Fish Consumption
AdvisoriesAdvisoriesAdvisories
Statewide freshwater ad-
visories
Waterbody-specific advi-
sories
Idaho's Mercury Actions 's Mercury Actions 's Mercury Actions
Idaho Department of Environmental Quality
http://www.deq.idaho.gov/waste-mgmt-remediation/hazardous-waste/mercury.aspx
Contact: Kari L. Kostka
Phone: 208.373.0199 Email: [email protected]
Status of Mercury
Reduction Plans
No mercury reduction
plan or strategy exists or
is planned
In the state of Idaho, very
little mercury monitoring
and management is driv-
en by governing rules.
Several programs are un-
derway simply to prevent
higher clean-up costs and
often because they are the
right thing to do. Idaho is
accomplishing much with
regard to mercury and
without regulations or
funding mandating ac-
tion.
Emissions Inventory
Idaho’s mercury emissions inventory :
Estimates for the amount of mercury released to the environ-
ment from air emission sources
Idaho
2008 National Emissions Inventory – Top Source Categories
Emission Source Pounds
Industrial Processes - Chemical Manufacturing 613
Miscellaneous Non-Industrial—Not Elsewhere Classi-
fied 48
Fuel Combustion - Industrial Boilers, Internal Combus-
tion Engines - Oil 40
Mobile - Locomotives 19
Industrial Processes - Not Elsewhere Classified 15
Fuel Combustion - Industrial Boilers, Internal Combus-
tion Engines - Coal 14
Please note that the NEI database is the federal database developed by
U.S. EPA and may differ from each state’s specific mercury emission
inventory due to a variety of factors including, but not limited to
differences in: emission factors applied; availability of stack test data;
and/or methods used in the state versus U.S. EPA to estimate area
sources including product-related emissions. Additionally, state data
in a study done by NESCAUM for the State of New York suggests that
emission values for oil combustion, in particular residential fuel com-
bustion (for heating), may be considerably overestimated. (see Deter-
mination of Sulfur and Toxic Metals Content of Distillates and Residual Oil
in the State of New York at http://www.nescaum.org/topics/mercury )
Page 109
Third Compendium of States’ Mercury Activities — Part II: State Programs
104
Dental Program
No program to address dental mercury
Local government more stringent than state
Areas of Coordination with the Medical Community
Fish consumption advisories
Pollution prevention
Dental issues
Waste management requirements
In 2005, the Idaho Department of Environmental Quality (DEQ) launched the Idaho Chemical
Roundup, a statewide program providing schools assistance and training on proper chemical man-
agement and disposal. Through the Idaho Chemical Roundup and along with the Idaho Division of
Building Safety, DEQ is committed to helping schools manage chemical wastes and prevent pollu-
tion. Upon facility inspection by the Division of Building Safely, educational opportunities emerge
allowing staff and students to learn about the importance of best management practices for laborato-
ry chemicals and wastes. EPA mini-grants have also made it possible for schools and/or districts to
submit proposals to undergo Chemical Roundup. Once funding is secured, DEQ provides compli-
ance assistance to ensure proper handling and disposal of hazardous materials.
The Idaho DEQ has classified mercury as the highest priority toxin in need of elimination from
schools. The Idaho DEQ encourages schools to sign-up for the voluntary Mercury-Free Zone Pro-
gram which requires mercury inventorying, clear labeling of mercury, purchasing non-mercury
product substitutes, conducting mercury education with students and faculty, and requires the recy-
cling of existing mercury within the school. By taking the Mercury-Free Zone pledge, schools also
urge students and their families to conduct environmentally sound practices in their everyday lives
to prevent mercury exposure and the release of mercury and other toxins into Idaho’s environment.
Throughout the state, Idaho DEQ technical staff and others are often invited to present to schools,
property managers, and similar audiences on the dangers of hazardous wastes and mercury in
households and schools. Several times each year, these presentations detail what products and mate-
rials need special attention and how to handle them when found. Typically, the focus is geared to-
ward mercury but other hazardous chemicals may be discussed.
Monitoring
Indoor air (for the purposes of evaluating spill cleanup)
Wastewater effluent
Wastewater sludge
Fish tissue
Idaho's Mercury Actions: 's Mercury Actions: 's Mercury Actions: continuedcontinuedcontinued
Page 110
Third Compendium of States’ Mercury Activities — Part II: State Programs
105
Mercury Containing Products
The Idaho Department of Environmental Quality (DEQ) has participated in the voluntary National
Vehicle Mercury Switch Recovery Program (NVMSRP) since 2007. Out of 118 invitations sent to
auto salvage yards, 60 agreed to voluntarily participate in removing mercury switches from sal-
vaged vehicles. To date, 8,173 mercury switches have been recovered removing 17.98 pounds of
mercury from Idaho’s environment.
Several Idaho counties have established permanent household hazardous waste
collection sites. Other cities and counties have sponsored mobile drop-off sites
and drop-off events or even specifically, mercury drop-off events. On such
occasions, The Idaho DEQ provides technical assistance to ensure hazardous
chemicals and materials are handled and disposed of properly .
Idaho's Mercury Actions: 's Mercury Actions: 's Mercury Actions: continuedcontinuedcontinued
Mercury Research
http://www.deq.idaho.gov/water-quality/surface-water/mercury.aspx
The Idaho Fish Consumption Advisory Program (IFCAP), created in 2001 under the Idaho Depart-
ment of Health and Welfare, informs Idahoans about possible contamination of lakes and streams -
contamination that may affect fish and the humans who eat the fish. By testing fish samples for con-
taminants, IFCAP is able to advise the public about safe consumption of fish from Idaho water bod-
ies. When contaminant levels are unsafe, IFCAP may recommend that people limit or avoid eating
certain species of fish caught in certain places and does so by issuing a Fish Consumption Advisory.
Page 111
Third Compendium of States’ Mercury Activities — Part II: State Programs
106
BLANK PAGE
Page 112
Third Compendium of States’ Mercury Activities — Part II: State Programs
107
Dental Program
Voluntary program to address dental mercury
Areas of Coordination with the Medical Community
Dental issues
Fish consumption advisories
Monitoring
Air emissions from stacks
Ambient air
Atmospheric deposition
(other than NADP participation)
Indoor air
(for the purposes of evaluating spill cleanup)
Wastewater effluent
Wastewater sludge
Fish tissue
Landfill
Fish Consumption Fish Consumption Fish Consumption
AdvisoriesAdvisoriesAdvisories
Statewide freshwater
advisories
Waterbody-specific
advisories
Illinois' Mercury Actions ' Mercury Actions ' Mercury Actions
Illinois Environmental Protection Agency
http://www.epa.state.il.us/mercury/
Contact: Becky Jayne
Phone: 217.524.9642 Email: [email protected]
Status of Mercury
Reduction Plans
No mercury reduction
plan or strategy exists
or is planned
Mercury Containing Products
Sales ban, use ban or phase out:
- Cosmetics
- Measuring devices
- Medical devices
- Novelty items/toys
- Switches and relays
- Thermometers
- Thermostats
- Other
Exemption process
Page 113
Third Compendium of States’ Mercury Activities — Part II: State Programs
108
Illinois' Mercury Actions: ' Mercury Actions: ' Mercury Actions: continuedcontinuedcontinued
Illinois
2008 National Emissions Inventory –
Top Source Categories
Emission Source Pounds
Fuel Combustion - Electric Generation - Coal 1739
Industrial Processes - Ferrous Metals 286
Fuel Combustion - Industrial Boilers, Internal Com-
bustion Engines - Coal 245
Fuel Combustion - Electric Generation - Natural Gas 234
Industrial Processes - Non-ferrous Metals 181
Fuel Combustion - Industrial Boilers, Internal Com-
bustion Engines - Natural Gas 154
Waste Disposal 142
Industrial Processes - Chemical Manufacturing 141
Miscellaneous Non-Industrial -Not Elsewhere Clas-
sified 133
Industrial Processes - Not Elsewhere Classified 114
Industrial Processes - Petroleum Refineries 101
Mobile - Locomotives 83
Industrial Processes - Cement Manufacturing 52
Fuel Combustion - Commercial/Institutional - Natu-
ral Gas 49
Mobile - On-Road Gasoline Light Duty Vehicles 24
Please note that the NEI database is the federal database devel-
oped by U.S. EPA and may differ from each state’s specific mer-
cury emission inventory due to a variety of factors including, but
not limited to differences in: emission factors applied; availability
of stack test data; and/or methods used in the state versus U.S.
EPA to estimate area sources including product-related emis-
sions.
Page 114
Third Compendium of States’ Mercury Activities — Part II: State Programs
109
Dental Program
Voluntary program to address dental mercury
Allow settling tanks in place of separators
Areas of Coordination with the Medical Community
Pollution prevention
Dental issues
Waste management requirements
Monitoring
Air emissions from stacks
Wastewater effluent
Wastewater sludge
Waterbody sediment
Fish tissue
Landfill
Fish Consumption Fish Consumption Fish Consumption
AdvisoriesAdvisoriesAdvisories
Statewide freshwater
advisories
Waterbody-specific
advisories
Indiana's Mercury Actions 's Mercury Actions 's Mercury Actions
Indiana Department of Environmental Management
http://www.in.gov/idem
Contact: Brian Wolff
Phone: 317.234.3499 Email: [email protected]
Status of Mercury
Reduction Plans
Mercury reduction
plan or strategy in
place
Mercury Containing Products
Sales ban, use ban or phase out:
- Novelty items/toys
- Thermometers
Page 115
Third Compendium of States’ Mercury Activities — Part II: State Programs
110
Indiana's Mercury Actions: 's Mercury Actions: 's Mercury Actions: continuedcontinuedcontinued
Emissions Inventory
Indiana’s mercury emissions inven-
tory :
Estimates for the amount of
mercury released to the envi-
ronment from air emission
sources
Indiana
2008 National Emissions Inventory –
Top Source Categories
Emission Source Pounds
Fuel Combustion - Electric Generation -
Coal 2454
Industrial Processes - Cement Manufactur-
ing 514
Industrial Processes - Ferrous Metals 435
Industrial Processes - Non-ferrous Metals 125
Fuel Combustion - Industrial Boilers, Inter-
nal Combustion Engines - Coal 121
Miscellaneous Non-Industrial -Not Else-
where Classified 98
Waste Disposal 91
Mobile - Locomotives 42
Fuel Combustion - Industrial Boilers, Inter-
nal Combustion Engines - Oil 31
Fuel Combustion - Industrial Boilers, Inter-
nal Combustion Engines - Natural Gas 23
Fuel Combustion - Commercial/
Institutional - Oil 17
Mobile - On-Road Gasoline Light Duty Ve-
hicles 16
Fuel Combustion - Residential - Oil 12
Please note that the NEI database is the federal database devel-
oped by U.S. EPA and may differ from each state’s specific
mercury emission inventory due to a variety of factors includ-
ing, but not limited to differences in: emission factors applied;
availability of stack test data; and/or methods used in the state
versus U.S. EPA to estimate area sources including product-
related emissions. Additionally, state data in a study done by
NESCAUM for the State of New York suggests that emission
values for oil combustion, in particular residential fuel com-
bustion (for heating), may be considerably overestimated. (see
Determination of Sulfur and Toxic Metals Content of Distillates and
Residual Oil in the State of New York at http://www.nescaum.org/
topics/mercury )
Page 116
Third Compendium of States’ Mercury Activities — Part II: State Programs
111
Dental Program
No program to address dental mercury
Local government more stringent than state
Monitoring
Air emissions from stacks
Water column
Fish tissue
Fish Consumption Fish Consumption Fish Consumption
AdvisoriesAdvisoriesAdvisories
Statewide freshwater
advisories
Waterbody-specific
advisories
Iowa's Mercury Actions 's Mercury Actions 's Mercury Actions
Iowa Department of Natural Resources
http://www.iowadnr.gov/
Contact: Theresa Stiner
Phone: 515.281.8646 Email: [email protected]
Status of Mercury
Reduction Plans
No mercury reduction
plan or strategy exists
or is planned
Mercury Containing
Products
Sales ban, use ban or
phase out:
- Other
Iowa
2008 National Emissions Inventory – Top Source Categories
Emission Source Pounds
Fuel Combustion - Electric Generation - Coal 1937
Fuel Combustion - Industrial Boilers, Internal Combus-
tion Engines - Coal 455
Industrial Processes - Ferrous Metals 179
Industrial Processes - Cement Manufacturing 100
Mobile - Locomotives 49
Miscellaneous Non-Industrial -Not Elsewhere Classified 49
Fuel Combustion - Commercial/Institutional - Coal 41
Fuel Combustion - Industrial Boilers, ICEs - Other 20
Please note that the NEI database is the federal database developed by
U.S. EPA and may differ from each state’s specific mercury emission
inventory due to a variety of factors including, but not limited to
differences in: emission factors applied; availability of stack test data;
and/or methods used in the state versus U.S. EPA to estimate area
sources including product-related emissions.
Page 117
Third Compendium of States’ Mercury Activities — Part II: State Programs
112
BLANK PAGE
Page 118
Third Compendium of States’ Mercury Activities — Part II: State Programs
113
U.S. EPA Approved TMDLs
Yes, waterbody-specific
A multimedia approach was used when developing the TMDLs.
Dental Program
Voluntary program to address dental mercury
Allow settling tanks in place of separators
Local government more stringent than state
Areas of Coordination with the Medical Community
Fish consumption advisories
Pollution prevention
Dental issues
Monitoring
Atmospheric deposition
(other than NADP participation)
Indoor air
(for the purposes of evaluating spill cleanup)
Wastewater effluent
Wastewater sludge
Water column
Waterbody sediment
Fish tissue
Landfill Fish Consumption Fish Consumption Fish Consumption
AdvisoriesAdvisoriesAdvisories
Statewide freshwater
advisories
Waterbody-specific
advisories
Kansas' Mercury Actions ' Mercury Actions ' Mercury Actions
Kansas Department of Health and Environment
http://www.kdheks.gov/mercury/index.html
Contact: Jessica Willard
Phone: 785.296.1611 Email: [email protected]
Status of Mercury
Reduction Plans
No mercury reduction
plan or strategy exists
or is planned
Page 119
Third Compendium of States’ Mercury Activities — Part II: State Programs
114
Mercury Research
http://www.kdheks.gov/befs/fish_tissue_monitoring.htm
Kansas' Mercury Actions: ' Mercury Actions: ' Mercury Actions: continuedcontinuedcontinued
Emissions Inventory
Kansas’ mercury emissions
inventory :
Estimates for the amount of
mercury released to the envi-
ronment from air emission
sources
Kansas
2008 National Emissions Inventory –
Top Source Categories
Emission Source Pounds
Fuel Combustion - Electric Generation - Coal 1284
Industrial Processes - Cement Manufacturing 664
Industrial Processes - Ferrous Metals 76
Mobile - Locomotives 67
Miscellaneous Non-Industrial -Not Elsewhere
Classified 47
Industrial Processes - Petroleum Refineries 46
Please note that the NEI database is the federal database devel-
oped by U.S. EPA and may differ from each state’s specific mer-
cury emission inventory due to a variety of factors including,
but not limited to differences in: emission factors applied; avail-
ability of stack test data; and/or methods used in the state versus
U.S. EPA to estimate area sources including product-related
emissions.
Page 120
Third Compendium of States’ Mercury Activities — Part II: State Programs
115
Dental Program
Voluntary program to address dental mercury
Allow settling tanks in place of separators
Areas of Coordination with the Medical Community
Fish consumption advisories
Monitoring
Wastewater sludge
Water column
Waterbody sediment
Fish tissue
Landfill
Fish Consumption Fish Consumption Fish Consumption
AdvisoriesAdvisoriesAdvisories
Statewide freshwater
advisories
Kentucky's Mercury Actions 's Mercury Actions 's Mercury Actions
Kentucky Department for Environmental Protection
http://dep.ky.gov/Pages/default.aspx
Contact: Larry Taylor
Phone: 502.564.2150 Email: [email protected]
Status of Mercury
Reduction Plans
Intend to develop
mercury reduction
plan or strategy in the
future
Emissions Inventory
Kentucky’s mercury emis-
sions inventory :
Estimates for the
amount of mercury
released to the envi-
ronment from air
emission sources
Kentucky
2008 National Emissions Inventory – Top Source Categories
Emission Source Pounds
Fuel Combustion - Electric Generation - Coal 1573
Industrial Processes - Ferrous Metals 403
Industrial Processes - Storage and Transfer 107
Industrial Processes - Not Elsewhere Classified 91
Miscellaneous Non-Industrial -Not Elsewhere Classified 55
Industrial Processes - Cement Manufacturing 36
Mobile - Locomotives 30
Fuel Combustion - Industrial Boilers, Internal Combus-
tion Engines - Coal 16
Mobile - On-Road Gasoline Light Duty Vehicles 11
Please note that the NEI database is the federal database developed by
U.S. EPA and may differ from each state’s specific mercury emission
inventory due to a variety of factors including, but not limited to
differences in: emission factors applied; availability of stack test data;
and/or methods used in the state versus U.S. EPA to estimate area
sources including product-related emissions.
Page 121
Third Compendium of States’ Mercury Activities — Part II: State Programs
116
BLANK PAGE
Page 122
Third Compendium of States’ Mercury Activities — Part II: State Programs
117
U.S. EPA Approved TMDLs
Yes, waterbody-specific, watershed or basin, and plans to devel-
op a multistate
A multimedia approach was not used when developing the
TMDLs.
Addresses the following sources:
- Wastewater treatment plant discharges
Dental Program
Mandatory program to address dental mercury
Require BMPs
Allow settling tanks in place of separators
Areas of Coordination with the Medical Community
Fish consumption advisories
Pollution prevention
Dental issues
Waste management requirements
Monitoring
Ambient air
Wastewater effluent
Wastewater sludge
Water column
Waterbody sediment
Fish tissue
Fish Consumption Fish Consumption Fish Consumption
AdvisoriesAdvisoriesAdvisories
Waterbody-specific
advisories
Louisiana's Mercury Actions 's Mercury Actions 's Mercury Actions
Louisiana Department of Environmental Quality
http://www.deq.louisiana.gov/portal/
Contact: Chris M. Piehler
Phone: 225.219.3611 Email: [email protected]
Status of Mercury
Reduction Plans
Mercury reduction
plan or strategy in
place
Page 123
Third Compendium of States’ Mercury Activities — Part II: State Programs
118
Mercury Research
http://www.deq.louisiana.gov/portal/Default.aspx?
tabid=287
Louisiana's Mercury Actions: 's Mercury Actions: 's Mercury Actions: continuedcontinuedcontinued
Mercury Containing Products
Labeling requirements
Limits on mercury content in
products
Sales ban, use ban or phase
out:
- Cosmetics
- Measuring devices
- Medical devices
- Novelty items/toys
- Switches and relays
- Thermometers
- Thermostats
- Other
Exemption process
Emissions Inventory
Louisiana’s mercury emissions in-
ventory :
Estimates for the amount of
mercury released to the envi-
ronment from water pollu-
tion sources
Estimates for the amount of
mercury released to the envi-
ronment from solid wastes
such as sludge reuse, broken
products, etc.
Estimates for the amount of
mercury released to the envi-
ronment from air emission
sources
Louisiana
2008 National Emissions Inventory –
Top Source Categories
Emission Source Pounds
Fuel Combustion- Electric Generation - Coal 1798
Industrial Processes - Chemical Manufacturing 1094
Industrial Processes - Petroleum Refineries 566
Fuel Combustion - Industrial Boilers, Internal
Combustion Engines - Biomass 116
Industrial Processes - Pulp & Paper 73
Industrial Processes - Ferrous Metals 63
Miscellaneous Non-Industrial -Not Elsewhere
Classified 57
Fuel Combustion - Industrial Boilers, Internal
Combustion Engines - Other 53
Waste Disposal 45
Fuel Combustion - Industrial Boilers, Internal
Combustion Engines - Natural Gas 37
Industrial Processes - Not Elsewhere Classified 26
Mobile - Locomotives 21
Fuel Combustion - Electric Generation - Natural
Gas 20
Mobile - On-Road Gasoline Light Duty Vehicles 10
Please note that the NEI database is the federal database devel-
oped by U.S. EPA and may differ from each state’s specific mer-
cury emission inventory due to a variety of factors including, but
not limited to differences in: emission factors applied; availability
of stack test data; and/or methods used in the state versus U.S.
EPA to estimate area sources including product-related emis-
sions.
Page 124
Third Compendium of States’ Mercury Activities — Part II: State Programs
119
U.S. EPA Approved TMDLs
Yes, multistate and plans to develop a multistate
A multimedia approach was used when developing the TMDLs.
Addresses the following sources:
- Atmospheric deposition
Dental Program
Mandatory program to address dental mercury
Require amalgam separators
Areas of Coordination with the Medical Community
Fish consumption advisories
Pollution prevention
Dental issues
Waste management requirements
Monitoring
Air emissions from stacks
Atmospheric deposition (other than NADP participation)
Indoor air (for the purposes of evaluating spill cleanup)
Wastewater effluent
Wastewater sludge
Water column
Waterbody sediment
Fish tissue
Wildlife
Fish Consumption Fish Consumption Fish Consumption
AdvisoriesAdvisoriesAdvisories
Statewide freshwater
advisories
Statewide coastal ad-
visories
Waterbody-specific
advisories
Maine's Mercury Actions 's Mercury Actions 's Mercury Actions
Maine Department of Environmental Protection
http://www.maine.gov/dep/
Contact: Julie Churchill
Phone: 207.287.7881 Email: [email protected]
Status of Mercury
Reduction Plans
Mercury reduction
plan or strategy in
place
Page 125
Third Compendium of States’ Mercury Activities — Part II: State Programs
120
Mercury Research
http://www.maine.gov/dep/blwq/docmonitoring/tmdl/2007/hg.htm
Maine's Mercury Actions: 's Mercury Actions: 's Mercury Actions: continuedcontinuedcontinued
Mercury Containing Products
Labeling requirements
Sales ban, use ban or phase
out:
- Measuring devices
- Medical devices
- Switches and relays
- Thermometers
- Thermostats
- Other
Exemption process
Maine
2008 National Emissions Inventory –
Top Source Categories
Emission Source Pounds
Fuel Combustion - Residential - Oil 116
Fuel Combustion - Commercial/Institutional - Oil 49
Fuel Combustion - Electric Generation - Biomass 38
Miscellaneous Non-Industrial - Not Elsewhere
Classified 35
Waste Disposal 33
Fuel Combustion - Industrial Boilers, Internal
Combustion Engines - Biomass 29
Industrial Processes - Cement Manufacturing 27
Fuel Combustion - Industrial Boilers, Internal
Combustion Engines - Coal 16
Fuel Combustion- Electric Generation - Natural
Gas 15
Fuel Combustion - Industrial Boilers, Internal
Combustion Engines - Oil 10
Fuel Combustion - Commercial/Institutional -
Biomass 10
Please note that the NEI database is the federal database de-
veloped by U.S. EPA and may differ from each state’s specific
mercury emission inventory due to a variety of factors includ-
ing, but not limited to differences in: emission factors applied;
availability of stack test data; and/or methods used in the state
versus U.S. EPA to estimate area sources including product-
related emissions. Additionally, state data in a study done by
NESCAUM for the State of New York suggests that emission
values for oil combustion, in particular residential fuel com-
bustion (for heating), may be considerably overestimated. (see
Determination of Sulfur and Toxic Metals Content of Distillates
and Residual Oil in the State of New York at http://
www.nescaum.org/topics/mercury )
Page 126
Third Compendium of States’ Mercury Activities — Part II: State Programs
121
U.S. EPA Approved TMDLs
Yes, waterbody-specific
A multimedia approach was used when developing the TMDLs.
Addresses the following sources:
- Atmospheric deposition
Dental Program
Voluntary program to address dental mercury
Allow settling tanks in place of separators
Areas of Coordination with the Medical Community
Fish consumption advisories
Pollution prevention
Dental issues
Waste management requirements
Monitoring
Air emissions from stacks
Ambient air
Atmospheric deposition (other than NADP participation)
Wastewater effluent
Wastewater sludge
Fish tissue
Landfill Fish Consumption Fish Consumption Fish Consumption
AdvisoriesAdvisoriesAdvisories
Waterbody-specific
advisories
Maryland's Mercury Actions 's Mercury Actions 's Mercury Actions
Maryland Department of the Environment http://www.mde.state.md.us/programs/land/recyclingandoperationsprogram/
mercury/pages/programs/landprograms/recycling/mercury/index.aspx
Contact: Jeffrey Fretwell
Phone: 410.537.3537 Email: [email protected]
Status of Mercury
Reduction Plans
Mercury reduction
plan or strategy in
place
Mercury Containing
Products
Sales ban, use ban or
phase out:
- Thermostats
- Other
Page 127
Third Compendium of States’ Mercury Activities — Part II: State Programs
122
Mercury Research
http://www.mde.state.md.us/programs/Land/RecyclingandOperationsprogram/Mercury/
Documents/
www.mde.state.md.us/assets/document/Mercury%20Report%202002.pdf
http://www.mde.state.md.us/programs/Land/RecyclingandOperationsprogram/Mercury/
Documents/
www.mde.state.md.us/assets/document/Mercury%20Report%202004%20-%20FINAL.pdf
http://www.mde.maryland.gov/programs/water/tmdl/approvedfinaltmdls/pages/programs/
waterprograms/tmdl/approvedfinaltmdl/index.aspx
Maryland's Mercury Actions: 's Mercury Actions: 's Mercury Actions: continuedcontinuedcontinued
Emissions
Inventory
Maryland’s mer-
cury emissions
inventory :
Estimates
for the
amount of
mercury
released to
the environ-
ment from
air emission
sources
Maryland
2008 National Emissions Inventory – Top Source Categories
Emission Source Pounds
Industrial Processes - Cement Manufacturing 501
Fuel Combustion - Electric Generation - Coal 252
Waste Disposal 150
Fuel Combustion - Industrial Boilers, Internal Combustion Engines
- Coal 109
Miscellaneous Non-Industrial - Not Elsewhere Classified 76
Fuel Combustion - Residential - Oil 55
Fuel Combustion - Commercial/Institutional - Oil 23
Mobile - On-Road Gasoline Light Duty Vehicles 13
Please note that the NEI database is the federal database developed by U.S. EPA
and may differ from each state’s specific mercury emission inventory due to a
variety of factors including, but not limited to differences in: emission factors
applied; availability of stack test data; and/or methods used in the state versus
U.S. EPA to estimate area sources including product-related emissions. Addi-
tionally, state data in a study done by NESCAUM for the State of New York sug-
gests that emission values for oil combustion, in particular residential fuel com-
bustion (for heating), may be considerably overestimated. (see Determination of
Sulfur and Toxic Metals Content of Distillates and Residual Oil in the State of New
York at http://www.nescaum.org/topics/mercury )
Page 128
Third Compendium of States’ Mercury Activities — Part II: State Programs
123
U.S. EPA Approved TMDLs
Yes, multistate
A multimedia approach was used when developing the TMDLs.
Addresses the following sources:
- Atmospheric deposition
- Wastewater treatment plant discharges
Dental Program
Mandatory program to address dental mercury
Require amalgam separators
Require BMPs
Local government more stringent than state
Areas of Coordination with the Medical Community
Fish consumption advisories
Pollution prevention
Dental issues
Waste management requirements
Monitoring
Air emissions from stacks
Atmospheric deposition (other than NADP participation)
Indoor air (for the purposes of evaluating spill cleanup)
Wastewater effluent
Wastewater sludge
Water column
Waterbody sediment
Fish tissue
Wildlife Fish Consumption Fish Consumption Fish Consumption
AdvisoriesAdvisoriesAdvisories
Statewide freshwater
advisories
Waterbody-specific
advisories
Massachusetts' Mercury Actions ' Mercury Actions ' Mercury Actions
Massachusetts Department of Environmental Protection
http://www.mass.gov/dep/toxics/stypes/hgres.htm
Contact: C. Mark Smith
Phone: 617.292.5509 Email: [email protected]
Status of Mercury
Reduction Plans
Mercury reduction
plan or strategy in
place
Page 129
Third Compendium of States’ Mercury Activities — Part II: State Programs
124
Mercury Research
http://www.mass.gov/dep/toxics/stypes/hgres.htm#monitoring
Massachusetts' Mercury Actions: ' Mercury Actions: ' Mercury Actions: continuedcontinuedcontinued
Mercury Containing Products
Labeling requirements
Sales ban, use ban or phase out:
- Measuring devices
- Medical devices
- Switches and relays
- Thermostats
- Other
Exemption process
Emissions Inventory
Massachusetts’ mercury emissions
inventory :
Estimates for the amount of
mercury released to the envi-
ronment from water pollu-
tion sources
Estimates for the amount of
mercury released to the envi-
ronment from solid wastes
such as sludge reuse, broken
products, etc.
Estimates for the amount of
mercury released to the envi-
ronment from air emission
sources
Massachusetts
2008 National Emissions Inventory –
Top Source Categories
Emission Source Pounds
Fuel Combustion - Residential - Oil 281
Miscellaneous Non-Industrial - Not Elsewhere
Classified 237
Waste Disposal 191
Fuel Combustion - Electric Generation - Coal 158
Mobile - On-Road Gasoline Light Duty Vehicles 13
Please note that the NEI database is the federal database de-
veloped by U.S. EPA and may differ from each state’s specific
mercury emission inventory due to a variety of factors in-
cluding, but not limited to differences in: emission factors
applied; availability of stack test data; and/or methods used
in the state versus U.S. EPA to estimate area sources includ-
ing product-related emissions. Additionally, state data in a
study done by NESCAUM for the State of New York sug-
gests that emission values for oil combustion, in particular
residential fuel combustion (for heating), may be considera-
bly overestimated. (see Determination of Sulfur and Toxic Met-
als Content of Distillates and Residual Oil in the State of New
York at http://www.nescaum.org/topics/mercury )
Page 130
Third Compendium of States’ Mercury Activities — Part II: State Programs
125
U.S. EPA Approved TMDLs
Plans to develop a statewide TMDL
A multimedia approach will be used when developing the
TMDL.
Addresses the following sources:
- Atmospheric deposition
Dental Program
Mandatory program to address dental mercury
Require amalgam separators
Require BMPs
Allow settling tanks in place of separators
Local government more stringent than state
Areas of Coordination with the Medical Community
Fish consumption advisories
Pollution prevention
Dental issues
Cultural/ritualistic uses
Other information:
The Michigan Department of Community Health works with Poison
Control Centers on elemental mercury spills.
Monitoring
Air emissions from stacks
Indoor air (for the purposes of evaluating spill cleanup)
Wastewater effluent
Wastewater sludge
Water column
Waterbody sediment
Fish tissue
Landfill
Fish Consumption Fish Consumption Fish Consumption
AdvisoriesAdvisoriesAdvisories
Statewide freshwater
advisories
Waterbody-specific
advisories
Michigan's Mercury Actions 's Mercury Actions 's Mercury Actions
Michigan Department of Environmental Quality
www.michigan.gov/deq and click on "environmental spotlight"
Contact: Joy Taylor Morgan
Phone: 517.335.6974 Email: [email protected]
Status of Mercury
Reduction Plans
Mercury reduction
plan or strategy in
place
Page 131
Third Compendium of States’ Mercury Activities — Part II: State Programs
126
Mercury Research
Fish eater biomonitoring and some air monitoring by the University of Michigan
- www.michigan.gov/deq
Michigan's Mercury Actions: 's Mercury Actions: 's Mercury Actions: continuedcontinuedcontinued
Mercury Containing Products
Sales ban, use ban or phase
out:
- Measuring devices
- Medical devices
- Thermometers
- Thermostats
Emissions Inventory
Michigan’s mercury emissions in-
ventory :
Estimates for the amount of
mercury released to the envi-
ronment from water pollu-
tion sources
Estimates for the amount of
mercury released to the envi-
ronment from solid wastes
such as sludge reuse, broken
products, etc.
Estimates for the amount of
mercury released to the envi-
ronment from air emission
sources
Michigan
2008 National Emissions Inventory –
Top Source Categories
Emission Source Pounds
Fuel Combustion - Electric Generation - Coal 2277
Industrial Processes - Cement Manufacturing 599
Industrial Processes - Ferrous Metals 353
Fuel Combustion - Industrial Boilers, Internal Com-
bustion Engines - Coal 325
Fuel Combustion - Industrial Boilers, Internal Com-
bustion Engines - Natural Gas 220
Fuel Combustion - Electric Generation - Other 218
Miscellaneous Non-Industrial - Not Elsewhere Clas-
sified 125
Waste Disposal 117
Fuel Combustion - Commercial/Institutional - Coal 103
Fuel Combustion - Electric Generation - Biomass 41
Fuel Combustion - Industrial Boilers, Internal Com-
bustion Engines - Biomass 34
Fuel Combustion - Residential - Oil 24
Mobile - On-Road Gasoline Light Duty Vehicles 22
Mobile - Locomotives 13
Fuel Combustion - Industrial Boilers, Internal Com-
bustion Engines - Oil 12
Please note that the NEI database is the federal database devel-
oped by U.S. EPA and may differ from each state’s specific mer-
cury emission inventory due to a variety of factors including, but
not limited to differences in: emission factors applied; availability
of stack test data; and/or methods used in the state versus U.S.
EPA to estimate area sources including product-related emis-
sions. Additionally, state data in a study done by NESCAUM for
the State of New York suggests that emission values for oil com-
bustion, in particular residential fuel combustion (for heating),
may be considerably overestimated. (see Determination of Sulfur
and Toxic Metals Content of Distillates and Residual Oil in the State of
New York at http://www.nescaum.org/topics/mercury )
Page 132
Third Compendium of States’ Mercury Activities — Part II: State Programs
127
U.S. EPA Approved TMDLs
Yes, statewide
A multimedia approach was used when developing the TMDL.
Addresses the following sources:
- Atmospheric deposition
- Wastewater treatment plant discharges
- Active mining
Dental Program
Mandatory program to address dental mercury
in Minneapolis/St. Paul area
Voluntary program to address mercury
Local government more stringent than state
Areas of Coordination with the Medical Community
Fish consumption advisories
Pollution prevention
Dental issues
Cultural/ritualistic uses
Waste management requirements
Other information:
Medical collaboration to reduce mercury from laboratories within lab
reagents as well as in the dental community.
Monitoring
Air emissions from stacks
Indoor air (for the purposes of evaluating spill cleanup)
Wastewater effluent
Wastewater sludge
Water column
Fish tissue
Wildlife
Landfill Fish Consumption Fish Consumption Fish Consumption
AdvisoriesAdvisoriesAdvisories
Statewide freshwater
advisories
Waterbody-specific
advisories
Minnesota's Mercury Actions 's Mercury Actions 's Mercury Actions
Minnesota Pollution Control Agency
http://www.pca.state.mn.us/index.php/topics/mercury/mercury.html
Contact: Rebecca Walter
Phone: 651.757.2807 Email: [email protected]
Status of Mercury
Reduction Plans
Mercury reduction
plan or strategy in
place
Page 133
Third Compendium of States’ Mercury Activities — Part II: State Programs
128
Mercury Research
http://www.briloon.org/mercuryconnections/greatlakes
Minnesota's Mercury Actions: 's Mercury Actions: 's Mercury Actions: continuedcontinuedcontinued
Mercury Containing Products
Sales ban, use ban or phase
out:
- Cosmetics
- Measuring devices
- Medical devices
- Novelty items/toys
- Switches and relays
- Thermometers
- Thermostats
- Other
Emissions Inventory
Minnesota’s mercury emissions
inventory :
Estimates for the amount of
mercury released to the envi-
ronment from water pollu-
tion sources
Estimates for the amount of
mercury released to the envi-
ronment from solid wastes
such as sludge reuse, broken
products, etc.
Estimates for the amount of
mercury released to the envi-
ronment from air emission
sources
Minnesota
2008 National Emissions Inventory –
Top Source Categories
Emission Source Pounds
Fuel Combustion- Electric Generation - Coal 1303
Industrial Processes - Ferrous Metals 756
Waste Disposal 475
Fuel Combustion - Industrial Boilers, Internal
Combustion Engines - Coal 140
Industrial Processes - Storage and Transfer 140
Industrial Processes - Not Elsewhere Classified 136
Mobile - Locomotives 34
Miscellaneous Non-Industrial - Not Elsewhere
Classified 33
Fuel Combustion - Residential - Oil 28
Solvent - Consumer & Commercial Solvent Use 23
Fuel Combustion - Industrial Boilers, Internal
Combustion Engines - Oil 15
Fuel Combustion - Industrial Boilers, Internal
Combustion Engines - Biomass 15
Industrial Processes - Mining 14
Fuel Combustion - Electric Generation - Biomass 14
Mobile - On-Road Gasoline Light Duty Vehicles 13
Please note that the NEI database is the federal database devel-
oped by U.S. EPA and may differ from each state’s specific mer-
cury emission inventory due to a variety of factors including,
but not limited to differences in: emission factors applied; avail-
ability of stack test data; and/or methods used in the state ver-
sus U.S. EPA to estimate area sources including product-related
emissions. Additionally, state data in a study done by NES-
CAUM for the State of New York suggests that emission values
for oil combustion, in particular residential fuel combustion (for
heating), may be considerably overestimated. (see Determination
of Sulfur and Toxic Metals Content of Distillates and Residual Oil in
the State of New York at http://www.nescaum.org/topics/
mercury )
Page 134
Third Compendium of States’ Mercury Activities — Part II: State Programs
129
U.S. EPA Approved TMDLs
Plans to develop a statewide TMDL
A multimedia approach will be used when developing the TMDL.
Addresses the following sources:
- Atmospheric deposition
Dental Program
No program to address dental mercury
Allow settling tanks in place of separators
Monitoring
Atmospheric deposition (other than NADP participation)
Indoor air (for the purposes of evaluating spill cleanup)
Fish tissue
Fish Consumption Fish Consumption Fish Consumption
AdvisoriesAdvisoriesAdvisories
Statewide freshwater
advisories
Waterbody-specific
advisories
Missouri's Mercury Actions 's Mercury Actions 's Mercury Actions
Missouri Department of Natural Resources
www.dnr.mo.gov
Contact: Scott Totten
Phone: 573.522.3326 Email: [email protected]
Status of Mercury
Reduction Plans
Intend to develop
mercury reduction
plan or strategy in the
future
Emissions Inventory
Missouri’s mercury emis-
sions inventory :
Estimates for the
amount of mercury
released to the envi-
ronment from air
emission sources
Missouri
2008 National Emissions Inventory – Top Source Categories
Emission Source Pounds
Fuel Combustion - Electric Generation - Coal 2370
Industrial Processes - Cement Manufacturing 330
Industrial Processes - Non-ferrous Metals 153
Industrial Processes - Not Elsewhere Classified 66
Mobile - Locomotives 65
Waste Disposal 47
Industrial Processes - Storage and Transfer 25
Miscellaneous Non-Industrial - Not Elsewhere Classified 20
Mobile - On-Road Gasoline Light Duty Vehicles 15
Please note that the NEI database is the federal database developed by
U.S. EPA and may differ from each state’s specific mercury emission
inventory due to a variety of factors including, but not limited to differ-
ences in: emission factors applied; availability of stack test data; and/or
methods used in the state versus U.S. EPA to estimate area sources in-
cluding product-related emissions.
Page 135
Third Compendium of States’ Mercury Activities — Part II: State Programs
130
Missouri's Mercury Actions: 's Mercury Actions: 's Mercury Actions: continuedcontinuedcontinued
Mercury Containing Products
The Missouri Mercury Collection Program began as a thermometer swap or
exchange program funded by a $15,000 grant from the U.S. Environmental
Protection Agency (EPA). The program quickly grew into a statewide collection
of devices, mercury contaminated debris, and elemental mercury conducted by
the Environmental Emergency Response Section of the Missouri Department of
Natural Resources (DNR).
The first mercury “roundup” was conducted in February 2009 at 86 drop- off locations around the state.
Approximately 226 pounds of elemental mercury were recovered along with hundreds of pounds of devic-
es and debris (thermometers, switches, other medical devices). This roundup peaked public interest and
more devices and debris were offered by the public, so additional events were conducted. For the year, 450
pounds of elemental mercury were collected and shipped for recycling.
Because the roundup events were so successful, DNR continued the program in 2010. The DNR’s five re-
gional offices became the only drop-off sites to help keep costs down. Over a four-month period, events
were held at each regional office. 320 pounds of elemental mercury were collected, as well as 305 pounds of
mercury containing devices and debris.
Another roundup was conducted at our regional offices in the spring of 2011. Approximately 150 pounds
of devices and debris and 75 pounds of elemental mercury were collected.
DNR plans to continue this program through our regional offices again in the spring of 2012. As of June
30th, 2011, this program has helped recover 780 pounds of elemental mercury and 955 pounds of mercury
contaminated debris.
While the mercury roundup has provided a safe and reliable way for citizens, doctors and school officials to
dispose of their mercury containing devices and debris, DNR continues to respond to mercury releases in
private homes, schools, and healthcare facilities.
Page 136
Third Compendium of States’ Mercury Activities — Part II: State Programs
131
U.S. EPA Approved TMDLs
Yes, waterbody-specific
A multimedia approach was used when developing the TMDLs.
Addresses the following sources:
- Legacy sources
Dental Program
Voluntary program to address dental mercury
Allow settling tanks in place of separators
Areas of Coordination with the Medical Community
Fish consumption advisories
Pollution prevention
Dental issues
Waste management requirements
Monitoring
Water column
Waterbody sediment
Fish tissue
Coal-fired Utilities
Fish Consumption Fish Consumption Fish Consumption
AdvisoriesAdvisoriesAdvisories
Statewide freshwater
advisories
Waterbody-specific
advisories
Montana's Mercury Actions 's Mercury Actions 's Mercury Actions
Montana Department of Environmental Quality
http://www.fwp.mt.gov/fwpDoc.jsp?id=28187
Contact: Bonnie Lovelace
Phone: 406.444.1760 Email: [email protected]
Status of Mercury
Reduction Plans
Mercury reduction
plan or strategy in
place
Mercury Containing Products
Labeling requirements
Sales ban, use ban or phase out:
- Thermostats
Page 137
Third Compendium of States’ Mercury Activities — Part II: State Programs
132
Mercury Research
http://www.fwp.mt.gov/fwpDoc.jsp?id=28187
Montana's Mercury Actions: 's Mercury Actions: 's Mercury Actions: continuedcontinuedcontinued
Emissions Inventory
Montana’s mercury emissions in-
ventory :
Estimates for the amount of
mercury released to the envi-
ronment from air emission
sources (coal-fired utilities)
Montana
2008 National Emissions Inventory –
Top Source Categories
Emission Source Pounds
Fuel Combustion - Electric Generation - Coal 237
Mobile - Locomotives 45
Industrial Processes - Petroleum Refineries 43
Industrial Processes - Cement Manufacturing 25
Miscellaneous Non-Industrial - Not Elsewhere
Classified 14
Fuel Combustion - Electric Generation - Other 12
Please note that the NEI database is the federal database de-
veloped by U.S. EPA and may differ from each state’s specific
mercury emission inventory due to a variety of factors in-
cluding, but not limited to differences in: emission factors
applied; availability of stack test data; and/or methods used
in the state versus U.S. EPA to estimate area sources includ-
ing product-related emissions.
Page 138
Third Compendium of States’ Mercury Activities — Part II: State Programs
133
Dental Program
Voluntary program to address dental mercury
Allow settling tanks in place of separators
Areas of Coordination with the Medical Community
Fish consumption advisories
Waste management requirements
Monitoring
Ambient air
Atmospheric deposition (other than NADP participation)
Indoor air (for the purposes of evaluating spill cleanup)
Wastewater effluent
Wastewater sludge
Water column
Fish tissue
Fish Consumption Fish Consumption Fish Consumption
AdvisoriesAdvisoriesAdvisories
Waterbody-specific
advisories
Nebraska's Mercury Actions 's Mercury Actions 's Mercury Actions
Nebraska Department of Environmental Quality
http://www.dhhs.ne.gov/mercury
Contact: Melissa Ellis
Phone: 402.471.6624 Email: [email protected]
Status of Mercury
Reduction Plans
Mercury reduction
plan or strategy in
place
Mercury Containing Products
Sales ban, use ban or phase out:
- Thermometers
Page 139
Third Compendium of States’ Mercury Activities — Part II: State Programs
134
Mercury Research
http://www.deq.state.ne.us/publica.nsf/pages/WAS057
2009 Waste Characterization Study: One element of the study was to determine the amount of mer-
cury containing wastes being disposed of in municipal solid waste landfills.
Nebraska's Mercury Actions: 's Mercury Actions: 's Mercury Actions: continuedcontinuedcontinued
Emissions Inventory
Nebraska’s mercury emissions in-
ventory :
Estimates for the amount of
mercury released to the envi-
ronment from air emission
sources
Nebraska
2008 National Emissions Inventory –
Top Source Categories
Emission Source Pounds
Fuel Combustion - Electric Generation - Coal 1353
Industrial Processes - Ferrous Metals 163
Mobile - Locomotives 139
Industrial Processes - Cement Manufacturing 41
Waste Disposal 40
Miscellaneous Non-Industrial - Not Elsewhere
Classified 24
Industrial Processes - Not Elsewhere Classified 14
Please note that the NEI database is the federal database de-
veloped by U.S. EPA and may differ from each state’s specific
mercury emission inventory due to a variety of factors in-
cluding, but not limited to differences in: emission factors
applied; availability of stack test data; and/or methods used
in the state versus U.S. EPA to estimate area sources includ-
ing product-related emissions.
Page 140
Third Compendium of States’ Mercury Activities — Part II: State Programs
135
U.S. EPA Approved TMDLs
Yes, multistate
A multimedia approach was used when developing the TMDLs.
Addresses the following sources:
- Atmospheric deposition
Dental Program
Mandatory program to address dental mercury
Require amalgam separators
Areas of Coordination with the Medical Community
Fish consumption advisories
Pollution prevention
Dental issues
Waste management requirements
Other information:
Toxics reduction and sustainability issues
Monitoring
Air emissions from stacks
Wastewater sludge
Fish tissue
Fish Consumption Fish Consumption Fish Consumption
AdvisoriesAdvisoriesAdvisories
Statewide freshwater
advisories
Waterbody-specific
advisories
New Hampshire's Mercury Actions 's Mercury Actions 's Mercury Actions
New Hampshire Department of Environmental Services
http://des.nh.gov/
Contact: Stephanie D'Agostino
Phone: 603.271.6398 Email: [email protected]
Status of Mercury
Reduction Plans
Mercury reduction
plan or strategy in
place
Page 141
Third Compendium of States’ Mercury Activities — Part II: State Programs
136
New Hampshire's Mercury Actions: 's Mercury Actions: 's Mercury Actions: continuedcontinuedcontinued
Mercury Containing Products
Notification requirements
Sales ban, use ban or phase out:
- Measuring devices
- Medical devices
- Novelty items/toys
- Switches and relays
- Thermometers
- Thermostats
Exemption process
Emissions Inventory
New Hampshire’s mercury emis-
sions inventory :
Estimates for the amount of
mercury released to the envi-
ronment from air emission
sources
New Hampshire
2008 National Emissions Inventory –
Top Source Categories
Emission Source Pounds
Fuel Combustion - Electric Generation - Coal 235
Fuel Combustion - Residential - Oil 82
Miscellaneous Non-Industrial - Not Elsewhere
Classified 18
Fuel Combustion - Industrial Boilers, Internal
Combustion Engines - Oil 15
Fuel Combustion - Electric Generation - Bio-
mass 10
Please note that the NEI database is the federal database devel-
oped by U.S. EPA and may differ from each state’s specific
mercury emission inventory due to a variety of factors includ-
ing, but not limited to differences in: emission factors applied;
availability of stack test data; and/or methods used in the state
versus U.S. EPA to estimate area sources including product-
related emissions. Additionally, state data in a study done by
NESCAUM for the State of New York suggests that emission
values for oil combustion, in particular residential fuel com-
bustion (for heating), may be considerably overestimated. (see
Determination of Sulfur and Toxic Metals Content of Distillates and
Residual Oil in the State of New York at http://www.nescaum.org/
topics/mercury )
Page 142
Third Compendium of States’ Mercury Activities — Part II: State Programs
137
U.S. EPA Approved TMDLs
Yes, statewide
A multimedia approach was not used when developing the
TMDL.
Addresses the following sources:
- Atmospheric deposition
Dental Program
Mandatory program to address dental mercury
Require amalgam separators
Require BMPs
Areas of Coordination with the Medical Community
Fish consumption advisories
Dental issues
Other information:
Provide data for epidemiological studies
Monitoring
Air emissions from stacks
Ambient air
Atmospheric deposition (other than NADP participation)
Indoor air (for the purposes of evaluating spill cleanup)
Wastewater effluent
Wastewater sludge
Water column
Waterbody sediment
Fish tissue
Wildlife
Landfill Fish Consumption Fish Consumption Fish Consumption
AdvisoriesAdvisoriesAdvisories
Statewide freshwater
advisories
Statewide coastal ad-
visories
Waterbody-specific
advisories
New Jersey's Mercury Actions 's Mercury Actions 's Mercury Actions
New Jersey Department of Environmental Protection
http://www.state.nj.us/dep/dsr/mercury/
Contact: Robin Heston
Phone: 609.984.4643 Email: [email protected]
Status of Mercury
Reduction Plans
Mercury reduction
plan or strategy in
place
Page 143
Third Compendium of States’ Mercury Activities — Part II: State Programs
138
Mercury Research
http://www.state.nj.us/dep/dsr/mercury/
New Jersey's Mercury Actions: 's Mercury Actions: 's Mercury Actions: continuedcontinuedcontinued
Mercury Containing Products
Sales ban, use ban or phase out:
- Thermometers
Emissions Inventory
New Jersey’s mercury emissions
inventory :
Estimates for the amount of
mercury released to the envi-
ronment from water pollu-
tion sources
Estimates for the amount of
mercury released to the envi-
ronment from solid wastes
such as sludge reuse, broken
products, etc.
Estimates for the amount of
mercury released to the envi-
ronment from air emission
sources
New Jersey
2008 National Emissions Inventory –
Top Source Categories
Emission Source Pounds
Waste Disposal 150
Industrial Processes - Not Elsewhere Classified 132
Fuel Combustion - Residential - Oil 127
Miscellaneous Non-Industrial - Not Elsewhere
Classified 105
Industrial Processes - Ferrous Metals 93
Fuel Combustion - Industrial Boilers, Internal Com-
bustion Engines - Natural Gas 69
Fuel Combustion - Electric Generation - Coal 40
Mobile - On-Road Gasoline Light Duty Vehicles 17
Please note that the NEI database is the federal database devel-
oped by U.S. EPA and may differ from each state’s specific mer-
cury emission inventory due to a variety of factors including, but
not limited to differences in: emission factors applied; availabil-
ity of stack test data; and/or methods used in the state versus
U.S. EPA to estimate area sources including product-related
emissions. Additionally, state data in a study done by NES-
CAUM for the State of New York suggests that emission values
for oil combustion, in particular residential fuel combustion (for
heating), may be considerably overestimated. (see Determination
of Sulfur and Toxic Metals Content of Distillates and Residual Oil in
the State of New York at http://www.nescaum.org/topics/mercury )
Page 144
Third Compendium of States’ Mercury Activities — Part II: State Programs
139
Dental Program
No program to address dental mercury
Monitoring
Water column
Fish tissue
Wet deposition (MDN) (4/21/09 through 9/30/12)
Fish Consumption Fish Consumption Fish Consumption
AdvisoriesAdvisoriesAdvisories
Waterbody-specific
advisories
New Mexico's Mercury Actions 's Mercury Actions 's Mercury Actions
New Mexico Environment Department
http://www.nmenv.state.nm.us/
Contact: Richard Goodyear
Phone: 505.476.4305 Email: [email protected]
Status of Mercury
Reduction Plans
No mercury reduction
plan or strategy exists
or is planned
New Mexico
2008 National Emissions Inventory –
Top Source Categories
Emission Source Pounds
Mobile - Locomotives 47
Miscellaneous Non-Industrial - Not Elsewhere Classi-
fied 23
Industrial Processes - Cement Manufacturing 10
Please note that the NEI database is the federal database developed by
U.S. EPA and may differ from each state’s specific mercury emission
inventory due to a variety of factors including, but not limited to
differences in: emission factors applied; availability of stack test data;
and/or methods used in the state versus U.S. EPA to estimate area
sources including product-related emissions.
Page 145
Third Compendium of States’ Mercury Activities — Part II: State Programs
140
BLANK PAGE
Page 146
Third Compendium of States’ Mercury Activities — Part II: State Programs
141
U.S. EPA Approved TMDLs
Yes, multistate
A multimedia approach was used when developing the TMDLs.
Addresses the following sources:
- Atmospheric deposition
Dental Program
Mandatory program to address dental mercury
Require amalgam separators
Require BMPs
Areas of Coordination with the Medical Community
Fish consumption advisories
Pollution prevention
Dental issues
Monitoring
Air emissions from stacks
Ambient air
Atmospheric deposition (other than NADP participation)
Wastewater effluent
Wastewater sludge
Water column
Waterbody sediment
Fish tissue
Wildlife
Landfill
Fish Consumption Fish Consumption Fish Consumption
AdvisoriesAdvisoriesAdvisories
Statewide freshwater
advisories
Waterbody-specific
advisories
New York's Mercury Actions 's Mercury Actions 's Mercury Actions
New York State Department of Environmental Conservation
http://www.dec.ny.gov/chemical/285.html
Contact: Peter M. Pettit
Phone: 518.402.8706 Email: [email protected]
Status of Mercury
Reduction Plans
Mercury reduction
plan or strategy in
place
Page 147
Third Compendium of States’ Mercury Activities — Part II: State Programs
142
Mercury Research
http://www.dec.ny.gov/chemical/285.html
New York's Mercury Actions: 's Mercury Actions: 's Mercury Actions: continuedcontinuedcontinued
Mercury Containing Products
Labeling requirements
Sales ban, use ban or phase
out:
- Measuring devices
- Medical devices
- Novelty items/toys
- Switches and relays
- Thermometers
- Thermostats
Exemption process
Emissions Inventory
New York’s mercury emissions in-
ventory :
Estimates for the amount of
mercury released to the envi-
ronment from air emission
sources
New York
2008 National Emissions Inventory –
Top Source Categories
Emission Source Pounds
Fuel Combustion - Residential - Oil 584
Fuel Combustion - Electric Generation - Coal 343
Waste Disposal 233
Industrial Processes - Cement Manufacturing 184
Miscellaneous Non-Industrial - Not Elsewhere Clas-
sified 176
Industrial Processes - Ferrous Metals 144
Fuel Combustion - Residential - Natural Gas 103
Fuel Combustion - Industrial Boilers, Internal Com-
bustion Engines - Natural Gas 95
Fuel Combustion - Electric Generation - Oil 61
Fuel Combustion - Industrial Boilers, Internal Com-
bustion Engines - Coal 48
Mobile - On-Road Gasoline Light Duty Vehicles 32
Mobile - Locomotives 28
Fuel Combustion - Commercial/Institutional - Natu-
ral Gas 23
Industrial Processes - Not Elsewhere Classified 14
Fuel Combustion - Electric Generation - Natural Gas 12
Please note that the NEI database is the federal database devel-
oped by U.S. EPA and may differ from each state’s specific mer-
cury emission inventory due to a variety of factors including, but
not limited to differences in: emission factors applied; availability
of stack test data; and/or methods used in the state versus U.S.
EPA to estimate area sources including product-related emis-
sions. Additionally, state data in a study done by NESCAUM for
the State of New York suggests that emission values for oil com-
bustion, in particular residential fuel combustion (for heating),
may be considerably overestimated. (see Determination of Sulfur
and Toxic Metals Content of Distillates and Residual Oil in the State of
New York at http://www.nescaum.org/topics/mercury )
Page 148
Third Compendium of States’ Mercury Activities — Part II: State Programs
143
U.S. EPA Approved TMDLs
Plans to develop a statewide TMDL
A multimedia approach will be used when developing the
TMDL.
Dental Program
No program to address dental mercury
Areas of Coordination with the Medical Community
Fish consumption advisories
Pollution prevention
Dental issues
Waste management requirements
Monitoring
Ambient air
Indoor air (for the purposes of evaluating spill cleanup)
Wastewater effluent
Wastewater sludge
Water column
Waterbody sediment
Fish tissue
Landfill Fish Consumption Fish Consumption Fish Consumption
AdvisoriesAdvisoriesAdvisories
Statewide freshwater
advisories
Statewide coastal ad-
visories
Waterbody-specific
advisories
North Carolina's Mercury Actions 's Mercury Actions 's Mercury Actions
North Carolina Department of Environment and Natural Resources
http://ncdenr.gov/web/wq/ps/mtu/tmdl/tmdls/mercury
Contact: Steve Schliesser
Phone: 919.707.8701 Email: [email protected]
Status of Mercury
Reduction Plans
Mercury reduction
plan or strategy in
place
Mercury Research
http://ncdenr.gov/web/wq/ps/mtu/tmdl/tmdls/mercury
Page 149
Third Compendium of States’ Mercury Activities — Part II: State Programs
144
North Carolina's Mercury Actions: 's Mercury Actions: 's Mercury Actions: continuedcontinuedcontinued
Emissions Inventory
North Carolina’s mercury emis-
sions inventory :
Estimates for the amount of
mercury released to the envi-
ronment from water pollu-
tion sources
Estimates for the amount of
mercury released to the envi-
ronment from air emission
sources
North Carolina
2008 National Emissions Inventory –
Top Source Categories
Emission Source Pounds
Fuel Combustion - Electric Generation - Coal 1580
Industrial Processes - Chemical Manufacturing 302
Waste Disposal 170
Fuel Combustion - Industrial Boilers, Internal Com-
bustion Engines - Coal 148
Industrial Processes - Non-ferrous Metals 139
Miscellaneous Non-Industrial - Not Elsewhere
Classified 117
Industrial Processes - Ferrous Metals 61
Fuel Combustion - Residential - Oil 56
Industrial Processes - Not Elsewhere Classified 34
Fuel Combustion - Industrial Boilers, Internal Com-
bustion Engines - Biomass 29
Fuel Combustion - Industrial Boilers, Internal Com-
bustion Engines - Oil 24
Mobile - On-Road Gasoline Light Duty Vehicles 24
Mobile - Locomotives 20
Please note that the NEI database is the federal database devel-
oped by U.S. EPA and may differ from each state’s specific
mercury emission inventory due to a variety of factors includ-
ing, but not limited to differences in: emission factors applied;
availability of stack test data; and/or methods used in the state
versus U.S. EPA to estimate area sources including product-
related emissions. Additionally, state data in a study done by
NESCAUM for the State of New York suggests that emission
values for oil combustion, in particular residential fuel com-
bustion (for heating), may be considerably overestimated. (see
Determination of Sulfur and Toxic Metals Content of Distillates and
Residual Oil in the State of New York at http://
www.nescaum.org/topics/mercury )
Page 150
Third Compendium of States’ Mercury Activities — Part II: State Programs
145
Dental Program
Voluntary program to address mercury
Allow settling tanks in place of separators
Areas of Coordination with the Medical Community
Fish consumption advisories
Waste management requirements
Monitoring
Fish tissue
Landfill
Fish Consumption Fish Consumption Fish Consumption
AdvisoriesAdvisoriesAdvisories
Statewide freshwater
advisories
Waterbody-specific
advisories
North Dakota's Mercury Actions 's Mercury Actions 's Mercury Actions
North Dakota Department of Health
http://www.ndhealth.gov/
Contact: Mike Ell
Phone: 701.328.5214 Email: [email protected]
Status of Mercury
Reduction Plans
No mercury reduction
plan or strategy exists
or is planned
Mercury Research
http://
pubs.usgs.gov/
sir/2007/5219/
North Dakota
2008 National Emissions Inventory –
Top Source Categories
Emission Source Pounds
Fuel Combustion - Electric Generation - Coal 3024
Fuel Combustion - Industrial Boilers, Internal Combus-
tion Engines - Coal 49
Mobile - Locomotives 29
Miscellaneous Non-Industrial - Not Elsewhere Classi-
fied 14
Please note that the NEI database is the federal database developed
by U.S. EPA and may differ from each state’s specific mercury emis-
sion inventory due to a variety of factors including, but not limited to
differences in: emission factors applied; availability of stack test data;
and/or methods used in the state versus U.S. EPA to estimate area
sources including product-related emissions.
Page 151
Third Compendium of States’ Mercury Activities — Part II: State Programs
146
BLANK PAGE
Page 152
Third Compendium of States’ Mercury Activities — Part II: State Programs
147
Dental Program
Voluntary program to address dental mercury
Allow settling tanks in place of separators
Local government more stringent than state
Areas of Coordination with the Medical Community
Pollution prevention
Dental issues
Waste management requirements
Monitoring
Air emissions from stacks
Atmospheric deposition (other than NADP participation)
Wastewater effluent
Wastewater sludge
Water column
Waterbody sediment
Fish tissue
Fish Consumption Fish Consumption Fish Consumption
AdvisoriesAdvisoriesAdvisories
Statewide freshwater
advisories
Waterbody-specific
advisories
Ohio's Mercury Actions 's Mercury Actions 's Mercury Actions
Ohio Environmental Protection Agency
http://epa.ohio.gov/ocapp/p2/mercury_pbt/mercury.aspx
Contact: Bill Narotski
Phone: 614.728.1264 Email: [email protected]
Status of Mercury
Reduction Plans
No mercury reduction
plan or strategy exists or
is planned
Mercury Containing Products
Sales ban, use ban or phase out:
- Measuring devices
- Novelty items/toys
- Switches and relays
- Other
Exemption process
Page 153
Third Compendium of States’ Mercury Activities — Part II: State Programs
148
Ohio
2008 National Emissions Inventory –
Top Source Categories
Emission Source Pounds
Fuel Combustion - Electric Generation - Coal 3218
Industrial Processes - Ferrous Metals 836
Industrial Processes - Not Elsewhere Classified 291
Fuel Combustion - Industrial Boilers, Internal Combustion
Engines - Coal 198
Miscellaneous Non-Industrial - Not Elsewhere Classified 190
Waste Disposal 187
Fuel Combustion - Electric Generation - Natural Gas 89
Mobile - Locomotives 69
Industrial Processes - Chemical Manufacturing 68
Fuel Combustion - Commercial/Institutional - Oil 55
Industrial Processes - Pulp & Paper 48
Industrial Processes - Storage and Transfer 47
Fuel Combustion - Residential - Oil 45
Fuel Combustion - Industrial Boilers, Internal Combustion
Engines - Oil 44
Industrial Processes - Cement Manufacturing 41
Please note that the NEI database is the federal database developed by
U.S. EPA and may differ from each state’s specific mercury emission in-
ventory due to a variety of factors including, but not limited to differ-
ences in: emission factors applied; availability of stack test data; and/or
methods used in the state versus U.S. EPA to estimate area sources in-
cluding product-related emissions. Additionally, state data in a study
done by NESCAUM for the State of New York suggests that emission
values for oil combustion, in particular residential fuel combustion (for
heating), may be considerably overestimated. (see Determination of Sulfur
and Toxic Metals Content of Distillates and Residual Oil in the State of New
York at http://www.nescaum.org/topics/mercury )
Ohio's Mercury Actions: 's Mercury Actions: 's Mercury Actions: continuedcontinuedcontinued
Page 154
Third Compendium of States’ Mercury Activities — Part II: State Programs
149
Dental Program
Voluntary program to
address dental mercu-
ry
Allow settling tanks in
place of separators
Monitoring
Indoor air (for the purposes of evaluating spill cleanup)
Wastewater effluent
Water column
Fish tissue
Fish Consumption Fish Consumption Fish Consumption
AdvisoriesAdvisoriesAdvisories
Statewide freshwater
advisories
Waterbody-specific ad-
visories
Oklahoma's Mercury Actions 's Mercury Actions 's Mercury Actions
Oklahoma Department of Environmental Quality
http://www.deq.state.ok.us/
Contact: Jay Wright
Phone: 405.702.1017 Email: [email protected]
Status of Mercury
Reduction Plans
Mercury reduction plan
or strategy in place
Oklahoma
2008 National Emissions Inventory –
Top Source Categories
Emission Source Pounds
Fuel Combustion - Electric Generation - Coal 1211
Industrial Processes - Ferrous Metals 128
Industrial Processes - Chemical Manufacturing 96
Industrial Processes - Petroleum Refineries 90
Miscellaneous Non-Industrial - Not Elsewhere Classi-
fied 52
Industrial Processes - Cement Manufacturing 36
Mobile - Locomotives 36
Fuel Combustion - Industrial Boilers, Internal Combus-
tion Engines - Coal 13
Mobile - On-Road Gasoline Light Duty Vehicles 11
Fuel Combustion - Industrial Boilers, Internal Combus-
tion Engines - Oil 11
Please note that the NEI database is the federal database developed by
U.S. EPA and may differ from each state’s specific mercury emission
inventory due to a variety of factors including, but not limited to
differences in: emission factors applied; availability of stack test data;
and/or methods used in the state versus U.S. EPA to estimate area
sources including product-related emissions. Additionally, state data
in a study done by NESCAUM for the State of New York suggests that
emission values for oil combustion, in particular residential fuel com-
bustion (for heating), may be considerably overestimated. (see Deter-
mination of Sulfur and Toxic Metals Content of Distillates and Residual Oil
in the State of New York at http://www.nescaum.org/topics/mercury )
Page 155
Third Compendium of States’ Mercury Activities — Part II: State Programs
150
BLANK PAGE
Page 156
Third Compendium of States’ Mercury Activities — Part II: State Programs
151
U.S. EPA Approved TMDLs
Yes, watershed or basin
A multimedia approach was used when developing the TMDLs.
Addresses the following sources:
- Atmospheric deposition
- Legacy sources
- Wastewater treatment plant discharges
- Active mining
Dental Program
Mandatory program to address dental mercury
Require amalgam separators
Require BMPs
Areas of Coordination with the Medical Community
Fish consumption advisories
Pollution prevention
Dental issues
Other information:
The Oregon DEQ collaborate with the Oregon Health Authority on
fish consumption advisories and with the Oregon Dental Association
on dental amalgam issues
Monitoring
Water column
Waterbody sediment
Fish tissue
Fish Consumption Fish Consumption Fish Consumption
AdvisoriesAdvisoriesAdvisories
Waterbody-specific
advisories
Oregon's Mercury Actions 's Mercury Actions 's Mercury Actions
Oregon Department of Environmental Quality
http://www.deq.state.or.us/lq/mercury.htm
Contact: Kevin Masterson
Phone: 503.229.5615 Email: [email protected]
Status of Mercury
Reduction Plans
Mercury reduction
plan or strategy in
place
Page 157
Third Compendium of States’ Mercury Activities — Part II: State Programs
152
Mercury Research
http://www.deq.state.or.us/lab/wqm/wbmercurystudy.htm
Oregon's Mercury Actions: 's Mercury Actions: 's Mercury Actions: continuedcontinuedcontinued
Mercury Containing Products
Sales ban, use ban or phase
out:
- Novelty items/toys
- Thermometers
Oregon
2008 National Emissions Inventory –
Top Source Categories
Emission Source Pounds
Industrial Processes - Cement Manufacturing 1508
Fuel Combustion - Electric Generation - Coal 133
Miscellaneous Non-Industrial - Not Elsewhere
Classified 53
Industrial Processes - Ferrous Metals 48
Fuel Combustion - Electric Generation - Natural
Gas 30
Mobile - Locomotives 20
Fuel Combustion - Industrial Boilers, Internal
Combustion Engines - Biomass 17
Fuel Combustion - Residential - Oil 12
Waste Disposal 11
Please note that the NEI database is the federal database de-
veloped by U.S. EPA and may differ from each state’s specific
mercury emission inventory due to a variety of factors includ-
ing, but not limited to differences in: emission factors applied;
availability of stack test data; and/or methods used in the state
versus U.S. EPA to estimate area sources including product-
related emissions. Additionally, state data in a study done by
NESCAUM for the State of New York suggests that emission
values for oil combustion, in particular residential fuel com-
bustion (for heating), may be considerably overestimated. (see
Determination of Sulfur and Toxic Metals Content of Distillates
and Residual Oil in the State of New York at http://
www.nescaum.org/topics/mercury )
Page 158
Third Compendium of States’ Mercury Activities — Part II: State Programs
153
U.S. EPA Approved TMDLs
Yes, multistate
A multimedia approach was used when developing the TMDLs.
Addresses the following sources:
- Atmospheric deposition
Dental Program
Mandatory program to address dental mercury
Require amalgam separators
Require BMPs
Areas of Coordination with the Medical Community
Fish consumption advisories
Pollution prevention
Dental issues
Monitoring
Wastewater effluent
Wildlife
Fish Consumption Fish Consumption Fish Consumption
AdvisoriesAdvisoriesAdvisories
Statewide freshwater
advisories
Statewide coastal ad-
visories
Waterbody-specific
advisories
Rhode Island's Mercury Actions 's Mercury Actions 's Mercury Actions
Rhode Island Department of Environmental Management
www.dem.ri.gov/topics/mercury.htm
Contact: Beverly Migliore
Phone: 401.222.4700 x7503 Email: [email protected]
Status of Mercury
Reduction Plans
Mercury reduction
plan or strategy in
place
Page 159
Third Compendium of States’ Mercury Activities — Part II: State Programs
154
Rhode Island's Mercury Actions: 's Mercury Actions: 's Mercury Actions: continuedcontinuedcontinued
Mercury Containing Products
Labeling requirements
Limits on mercury content in products
Sales ban, use ban or phase out:
- Cosmetics
- Measuring devices
- Medical devices
- Novelty items/toys
- Switches and relays
- Thermometers
- Thermostats
- Other
Exemption process
Rhode Island
2008 National Emissions Inventory –
Top Source Categories
Emission Source Pounds
Waste Disposal 78
Fuel Combustion - Residential - Oil 51
Miscellaneous Non-Industrial - Not Elsewhere
Classified 13
Please note that the NEI database is the federal database devel-
oped by U.S. EPA and may differ from each state’s specific
mercury emission inventory due to a variety of factors includ-
ing, but not limited to differences in: emission factors applied;
availability of stack test data; and/or methods used in the state
versus U.S. EPA to estimate area sources including product-
related emissions. Additionally, state data in a study done by
NESCAUM for the State of New York suggests that emission
values for oil combustion, in particular residential fuel com-
bustion (for heating), may be considerably overestimated. (see
Determination of Sulfur and Toxic Metals Content of Distillates and
Residual Oil in the State of New York at http://www.nescaum.org/
topics/mercury )
Page 160
Third Compendium of States’ Mercury Activities — Part II: State Programs
155
Dental Program
Voluntary program to address dental mercury
Allow settling tanks in place of separators
Areas of Coordination with the Medical Community
Fish consumption advisories
Pollution prevention
Dental issues
Monitoring
Ambient air
Water column
Waterbody sediment
Fish tissue
Wildlife
Fish Consumption Fish Consumption Fish Consumption
AdvisoriesAdvisoriesAdvisories
Waterbody-specific
advisories
South Carolina's Mercury Actions 's Mercury Actions 's Mercury Actions
South Carolina Department of Health and Environmental Control
http://www.scdhec.gov/environment/admin/Mercury/htm/index.htm
Contact: Michelle Wilson
Phone: 803.896.8955 Email: [email protected]
Status of Mercury
Reduction Plans
Mercury reduction
plan or strategy in
place
Mercury Research
The South Carolina Department of Health and Environmental
Control (DHEC) recently completed a blood mercury study for
some clients of two health districts. DHEC is also conducting a
small pond fish study.
Page 161
Third Compendium of States’ Mercury Activities — Part II: State Programs
156
South Carolina's Mercury Actions: 's Mercury Actions: 's Mercury Actions: continuedcontinuedcontinued
Emissions Inventory
South Carolina’s mercury emis-
sions inventory :
Estimates for the amount of
mercury released to the envi-
ronment from water pollu-
tion sources
Estimates for the amount of
mercury released to the envi-
ronment from air emission
sources
South Carolina
2008 National Emissions Inventory –
Top Source Categories
Emission Source Pounds
Industrial Processes - Ferrous Metals 963
Fuel Combustion - Electric Generation - Coal 631
Industrial Processes - Cement Manufacturing 237
Waste Disposal 82
Fuel Combustion - Industrial Boilers, Internal
Combustion Engines - Biomass 73
Miscellaneous Non-Industrial - Not Elsewhere
Classified 56
Fuel Combustion - Industrial Boilers, Internal
Combustion Engines - Coal 42
Industrial Processes - Pulp & Paper 33
Industrial Processes - Not Elsewhere Classified 17
Fuel Combustion - Electric Generation - Biomass 16
Mobile - Locomotives 16
Mobile - On-Road Gasoline Light Duty Vehicles 11
Please note that the NEI database is the federal database devel-
oped by U.S. EPA and may differ from each state’s specific
mercury emission inventory due to a variety of factors includ-
ing, but not limited to differences in: emission factors applied;
availability of stack test data; and/or methods used in the state
versus U.S. EPA to estimate area sources including product-
related emissions.
Page 162
Third Compendium of States’ Mercury Activities — Part II: State Programs
157
Dental Program
No program to address dental mercury
Allow settling tanks in place of separators
Local government more stringent than state
Monitoring
Air emissions from stacks
Wastewater effluent
Wastewater sludge
Water column
Waterbody sediment
Fish tissue
Wildlife
Landfill
Fish Consumption Fish Consumption Fish Consumption
AdvisoriesAdvisoriesAdvisories
Statewide coastal ad-
visories
Waterbody-specific
advisories
Texas' Mercury Actions ' Mercury Actions ' Mercury Actions
Texas Commission on Environmental Quality
http://www.tceq.state.tx.us/
Contact: Minor Hibbs
Phone: 512.239.6590 Email: Minor.Hibbs@tceq,texas.gov
Status of Mercury
Reduction Plans
No mercury reduction
plan or strategy exists
or is planned
Mercury Research
http://www.tceq.texas.gov/assets/public/comm_exec/pubs/
sfr/085.pdf
Emissions Inventory
Texas’ mercury emissions inventory :
Estimates for the amount of mercury
released to the environment
from air emission sources
Page 163
Third Compendium of States’ Mercury Activities — Part II: State Programs
158
Texas
2008 National Emissions Inventory –
Top Source Categories
Emission Source Pounds
Fuel Combustion - Electric Generation - Coal 7226
Industrial Processes - Non-ferrous Metals 2294
Industrial Processes - Ferrous Metals 1172
Waste Disposal 499
Industrial Processes - Cement Manufacturing 345
Industrial Processes - Petroleum Refineries 271
Fuel Combustion - Industrial Boilers, Internal Com-
bustion Engines - Other 200
Fuel Combustion - Industrial Boilers, Internal Com-
bustion Engines - Natural Gas 192
Miscellaneous Non-Industrial - Not Elsewhere Classi-
fied 191
Industrial Processes - Not Elsewhere Classified 149
Industrial Processes - Chemical Manufacturing 101
Fuel Combustion - Electric Generation - Natural Gas 80
Mobile - On-Road Gasoline Light Duty Vehicles 58
Fuel Combustion - Commercial/Institutional - Other 18
Industrial Processes - Pulp & Paper 17
Please note that the NEI database is the federal database developed
by U.S. EPA and may differ from each state’s specific mercury emis-
sion inventory due to a variety of factors including, but not limited
to differences in: emission factors applied; availability of stack test
data; and/or methods used in the state versus U.S. EPA to estimate
area sources including product-related emissions.
Texas' Mercury Actions: ' Mercury Actions: ' Mercury Actions: continuedcontinuedcontinued
Page 164
Third Compendium of States’ Mercury Activities — Part II: State Programs
159
U.S. EPA Approved TMDLs
Plans to develop a waterbody-specific TMDL
A multimedia approach will be used when developing the
TMDL.
Addresses the following sources:
- Atmospheric deposition
- Active mining
Dental Program
No program to address dental mercury
Allow settling tanks in place of separators
Areas of Coordination with the Medical Community
Fish consumption advisories
Pollution prevention
Cultural/ritualistic uses
Waste management requirements
Monitoring
Ambient air
Indoor air (for the purposes of evaluating spill cleanup)
Waterbody sediment
Fish tissue
Wildlife
Landfill
Fish Consumption Fish Consumption Fish Consumption
AdvisoriesAdvisoriesAdvisories
Waterbody-specific
advisories
Utah's Mercury Actions 's Mercury Actions 's Mercury Actions
Utah Department of Environmental Quality
www.mercury.utah.gov
Contact: Renette Anderson
Phone: 801.536.4478 Email: [email protected]
Status of Mercury
Reduction Plans
Mercury reduction
plan or strategy under
development
Page 165
Third Compendium of States’ Mercury Activities — Part II: State Programs
160
Mercury Research
www.deq.utah.gov/issues/mercury/upcoming-meetings.htm
Utah's Mercury Actions: 's Mercury Actions: 's Mercury Actions: continuedcontinuedcontinued
Utah
2008 National Emissions Inventory –
Top Source Categories
Emission Source Pounds
Fuel Combustion - Electric Generation - Coal 404
Industrial Processes - Ferrous Metals 313
Industrial Processes - Cement Manufacturing 213
Waste Disposal 57
Miscellaneous Non-Industrial - Not Elsewhere
Classified 33
Industrial Processes - Petroleum Refineries 21
Mobile - Locomotives 16
Please note that the NEI database is the federal database de-
veloped by U.S. EPA and may differ from each state’s specific
mercury emission inventory due to a variety of factors includ-
ing, but not limited to differences in: emission factors applied;
availability of stack test data; and/or methods used in the state
versus U.S. EPA to estimate area sources including product-
related emissions.
Page 166
Third Compendium of States’ Mercury Activities — Part II: State Programs
161
U.S. EPA Approved TMDLs
Yes, multistate
A multimedia approach was used when developing the TMDLs.
Addresses the following sources:
- Atmospheric deposition
- Wastewater treatment plant discharges
Dental Program
Mandatory program to address dental mercury
Require amalgam separators
Require BMPs
Areas of Coordination with the Medical Community
Fish consumption advisories
Pollution prevention
Dental issues
Waste management requirements
Monitoring
Ambient air
Atmospheric deposition (other than NADP participation)
Wastewater effluent
Wastewater sludge
Water column
Waterbody sediment
Fish tissue
Wildlife
Landfill Fish Consumption Fish Consumption Fish Consumption
AdvisoriesAdvisoriesAdvisories
Statewide freshwater
advisories
Waterbody-specific
advisories
Vermont's Mercury Actions 's Mercury Actions 's Mercury Actions
Vermont Department of Environmental Conservation
http://www.mercvt.org
Contact: Gary Gulka
Phone: 802.241.3626 Email: [email protected]
Status of Mercury
Reduction Plans
Mercury reduction
plan or strategy in
place
Page 167
Third Compendium of States’ Mercury Activities — Part II: State Programs
162
Mercury Research
http://www.vtwaterquality.org//wqd_mgtplan/stressor_toxics.htm
Vermont's Mercury Actions: 's Mercury Actions: 's Mercury Actions: continuedcontinuedcontinued
Mercury Containing Products
Labeling requirements
Sales ban, use ban or phase out:
- Measuring devices
- Medical devices
- Novelty items/toys
- Switches and relays
- Thermometers
- Thermostats
- Other
Exemption process
Emissions Inventory
Vermont’s mercury emissions in-
ventory :
Estimates for the amount of
mercury released to the envi-
ronment from air emission
sources
Vermont
2008 National Emissions Inventory –
Top Source Categories
Emission Source Pounds
Fuel Combustion - Residential - Oil 44
Miscellaneous Non-Industrial - Not Elsewhere
Classified 17
Please note that the NEI database is the federal database devel-
oped by U.S. EPA and may differ from each state’s specific mer-
cury emission inventory due to a variety of factors including,
but not limited to differences in: emission factors applied; avail-
ability of stack test data; and/or methods used in the state ver-
sus U.S. EPA to estimate area sources including product-related
emissions. Additionally, state data in a study done by NES-
CAUM for the State of New York suggests that emission values
for oil combustion, in particular residential fuel combustion (for
heating), may be considerably overestimated. (see Determination
of Sulfur and Toxic Metals Content of Distillates and Residual Oil in
the State of New York at http://www.nescaum.org/topics/
mercury )
Page 168
Third Compendium of States’ Mercury Activities — Part II: State Programs
163
Dental Program
Mandatory program to address dental mercury
Require amalgam separators
Require BMPs
Local government more stringent than state
Areas of Coordination with the Medical Community
Fish consumption advisories
Pollution prevention
Dental issues
Cultural/ritualistic uses
Waste management requirements
Education and Outreach
Monitoring
Air emissions from stacks
Wastewater effluent
Wastewater sludge
Water column
Waterbody sediment
Fish tissue
Landfill
Fish Consumption Fish Consumption Fish Consumption
AdvisoriesAdvisoriesAdvisories
Statewide freshwater
advisories
Statewide coastal ad-
visories
Washington's Mercury Actions 's Mercury Actions 's Mercury Actions
Washington Department of Ecology
http://www.ecy.wa.gov/mercury/
Contact: Maria Victoria Peeler
Phone: 360.407.6704 Email: [email protected]
Status of Mercury
Reduction Plans
Mercury reduction
plan or strategy in
place
Mercury Containing Products
Labeling requirements
Sales ban, use ban or phase out:
- Measuring devices
- Medical devices
- Novelty items/toys
- Switches and relays
- Thermometers
- Thermostats
- Other
Page 169
Third Compendium of States’ Mercury Activities — Part II: State Programs
164
Mercury Research
http://www.ecy.wa.gov/science/index.html
Washington's Mercury Actions: 's Mercury Actions: 's Mercury Actions: continuedcontinuedcontinued
Emissions Inventory
Washington’s mercury emissions
inventory :
Estimates for the amount
of mercury released to the
environment from water
pollution sources
Estimates for the amount
of mercury released to the
environment from solid
wastes such as sludge re-
use, broken products, etc.
Estimates for the amount
of mercury released to the
environment from air
emission sources
Washington
2008 National Emissions Inventory –
Top Source Categories
Emission Source Pounds
Fuel Combustion - Electric Generation - Coal 313
Industrial Processes - Cement Manufacturing 102
Miscellaneous Non-Industrial - Not Elsewhere Clas-
sified 87
Industrial Processes - Ferrous Metals 69
Fuel Combustion - Industrial Boilers, Internal Com-
bustion Engines - Biomass 39
Mobile - Locomotives 32
Industrial Processes - Pulp & Paper 27
Fuel Combustion - Residential - Oil 22
Mobile - On-Road Gasoline Light Duty Vehicles 13
Fuel Combustion - Industrial Boilers, Internal Com-
bustion Engines - Other 11
Waste Disposal 10
Industrial Processes - Petroleum Refineries 10
Please note that the NEI database is the federal database devel-
oped by U.S. EPA and may differ from each state’s specific mer-
cury emission inventory due to a variety of factors including, but
not limited to differences in: emission factors applied; availability
of stack test data; and/or methods used in the state versus U.S.
EPA to estimate area sources including product-related emis-
sions. Additionally, state data in a study done by NESCAUM for
the State of New York suggests that emission values for oil com-
bustion, in particular residential fuel combustion (for heating),
may be considerably overestimated. (see Determination of Sulfur
and Toxic Metals Content of Distillates and Residual Oil in the State of
New York at http://www.nescaum.org/topics/mercury )
Page 170
Third Compendium of States’ Mercury Activities — Part II: State Programs
165
Dental Program
Voluntary program to address dental mercury
Areas of Coordination with the Medical Community
Fish consumption advisories
Monitoring
Air emissions from stacks
Indoor air (for the purposes of evaluating spill cleanup)
Wastewater effluent
Wastewater sludge
Water column
Fish tissue
Landfill
Fish Consumption Fish Consumption Fish Consumption
AdvisoriesAdvisoriesAdvisories
Statewide freshwater
advisories
Waterbody-specific
advisories
West Virginia's Mercury Actions 's Mercury Actions 's Mercury Actions
West Virginia Department of Environmental Protection
http://www.dep.wv.gov/Pages/default.aspx
Contact: Patrick Campbell
Phone: 304.926.0499 x1046 Email: [email protected]
Status of Mercury
Reduction Plans
No mercury reduction
plan or strategy exists
or is planned
Emissions Inventory
West Virginia’s mercury emissions inventory :
Estimates for the amount of mercury released to the environ-
ment from water pollution sources
Estimates for the amount of mercury released to the environ-
ment from air emission sources
Page 171
Third Compendium of States’ Mercury Activities — Part II: State Programs
166
West Virginia
2008 National Emissions Inventory – Top Source Categories
Emission Source Pounds
Fuel Combustion - Electric Generation - Coal 1871
Industrial Processes - Chemical Manufacturing 161
Industrial Processes - Cement Manufacturing 134
Fuel Combustion - Industrial Boilers, Internal Combus-
tion Engines - Coal 104
Industrial Processes - Ferrous Metals 49
Fuel Combustion - Industrial Boilers, Internal Combus-
tion Engines - Other 35
Miscellaneous Non-Industrial - Not Elsewhere Classi-
fied 29
Industrial Processes - Petroleum Refineries 28
Waste Disposal 26
Mobile - Locomotives 21
Fuel Combustion - Residential - Oil 10
Please note that the NEI database is the federal database developed by
U.S. EPA and may differ from each state’s specific mercury emission
inventory due to a variety of factors including, but not limited to
differences in: emission factors applied; availability of stack test data;
and/or methods used in the state versus U.S. EPA to estimate area
sources including product-related emissions. Additionally, state data
in a study done by NESCAUM for the State of New York suggests that
emission values for oil combustion, in particular residential fuel com-
bustion (for heating), may be considerably overestimated. (see Deter-
mination of Sulfur and Toxic Metals Content of Distillates and Residual Oil
in the State of New York at http://www.nescaum.org/topics/mercury )
West Virginia's Mercury Actions: 's Mercury Actions: 's Mercury Actions: continuedcontinuedcontinued
Page 172
Third Compendium of States’ Mercury Activities — Part II: State Programs
167
Dental Program
Voluntary program to
address mercury
Allow settling tanks in
place of separators
Local government
more restrictive
Areas of Coordination with the Medical Community
Fish consumption advisories
Dental issues
Waste management requirements
Monitoring
Air emissions from stacks
Ambient air
Atmospheric deposition (other than NADP participation)
Wastewater effluent
Waterbody sediment
Fish tissue
Wildlife
Landfill
Fish Consumption Fish Consumption Fish Consumption
AdvisoriesAdvisoriesAdvisories
Statewide freshwater
advisories
Waterbody-specific ad-
visories
Wisconsin's Mercury Actions 's Mercury Actions 's Mercury Actions
Wisconsin Department of Natural Resources
http://dnr.wi.gov/
Contact: Martin Burkholder
Phone: 608.264.8855 Email: [email protected]
Status of Mercury Reduction Plans
No mercury reduction plan or strategy exists or is planned.
Wisconsin continues to devote staff resources to address mer-
cury although it no longer has an active mercury team as
identified in the 2005 Mercury Compendium. The state is not
formally implementing the mercury action plan that was de-
veloped by the mercury team although state statutes, regula-
tions, and policies related to the action plan continue to exist.
Page 173
Third Compendium of States’ Mercury Activities — Part II: State Programs
168
Mercury Research
http://dnr.wi.gov/air/aq/monitor/specialstudies.htm
The Wisconsin Department of Natural Resources monitored ambient air quality at a chlor-alkali fa-
cility in Port Edwards, Wisconsin from December 1, 2008, through March 31, 2011, to determine if
concentrations of mercury would exceed state standards of one ug/m3 averaged over a 30-day peri-
od (NR446) while the facility converted from mercury cell technology to membrane cell technology.
The monitoring began about 6 months prior to the start of the conversion project and ended about
11 months after the conversion was complete. The results showed that at no time during monitor-
ing, and consequently, no time during the conversion process, was the daily average ambient mer-
cury concentration greater than the NR446 standard level. In addition, while monitoring detected
some elevated values, monthly average concentrations approached the global background concen-
tration for mercury observed at rural and remote sites.
Wisconsin's Mercury Actions: 's Mercury Actions: 's Mercury Actions: continuedcontinuedcontinued
Mercury Containing Products
Sales ban, use ban or phase out:
- Cosmetics - Switches and relays
- Measuring devices - Thermometers
- Medical devices - Thermostats
- Novelty items/toys - Other
Exemption process
Wisconsin Act 44 established a ban on the sale of certain mercury containing devices beginning in
November 1, 2010.
The mercury containing devices include fever thermometers unless prescribed by a practitioner, ma-
nometers of the type used in milking machines on dairy farms, thermostats, instruments or measur-
ing devices (unless required under federal law or the only mercury-added component is a button cell
battery).
The measuring devices include: barometer, esophageal dilator, flowmeter, hydrometer, hygrometer/
psychrometer, other manometers, pyrometer, sphygmomameter, mercury switches and relays,
household items, unless the only component is a button cell battery, such as toys or games, jewelry,
clothing or shoes, over-the-counter pharmaceuticals for human use, cosmetics, toiletries, and fra-
grance products.
Page 174
Third Compendium of States’ Mercury Activities — Part II: State Programs
169
Wisconsin
2008 National Emissions Inventory –
Top Source Categories
Emission Source Pounds
Fuel Combustion - Electric Generation - Coal 1431
Industrial Processes - Chemical Manufacturing 1080
Miscellaneous Non-Industrial - Not Elsewhere Clas-
sified 226
Fuel Combustion - Industrial Boilers, Internal Com-
bustion Engines - Coal 136
Industrial Processes - Ferrous Metals 95
Waste Disposal 57
Fuel Combustion - Residential - Oil 41
Fuel Combustion - Industrial Boilers, Internal Com-
bustion Engines - Biomass 28
Industrial Processes - Not Elsewhere Classified 23
Mobile - Locomotives 23
Fuel Combustion - Electric Generation - Biomass 23
Fuel Combustion - Industrial Boilers, Internal Com-
bustion Engines - Natural Gas 20
Fuel Combustion - Commercial/Institutional - Oil 19
Fuel Combustion - Industrial Boilers, Internal Com-
bustion Engines - Oil 17
Mobile - On-Road Gasoline Light Duty Vehicles 13
Please note that the NEI database is the federal database devel-
oped by U.S. EPA and may differ from each state’s specific mer-
cury emission inventory due to a variety of factors including, but
not limited to differences in: emission factors applied; availability
of stack test data; and/or methods used in the state versus U.S.
EPA to estimate area sources including product-related emis-
sions. Additionally, state data in a study done by NESCAUM for
the State of New York suggests that emission values for oil com-
bustion, in particular residential fuel combustion (for heating),
may be considerably overestimated. (see Determination of Sulfur
and Toxic Metals Content of Distillates and Residual Oil in the State of
New York at http://www.nescaum.org/topics/mercury )
Emissions Inventory
Wisconsin’s mercury emissions
inventory :
Estimates for the amount of
mercury released to the en-
vironment from water pol-
lution sources
Estimates for the amount of
mercury released to the en-
vironment from solid
wastes such as sludge re-
use, broken products, etc.
Estimates for the amount of
mercury released to the en-
vironment from air emis-
sion sources (coal-fired
EGUs)
Wisconsin's Mercury Actions: 's Mercury Actions: 's Mercury Actions: continuedcontinuedcontinued
Page 175
Third Compendium of States’ Mercury Activities — Part II: State Programs
170
Additional Information: State Web Pages
State Webpages With Additional Information
Alabama Research Webpage:
http://www.adem.state.al.us/programs/water/waterforms/SurfaceWaterMonitoring.pdf
Alaska Main Mercury Webpage:
http://www.akcontaminants.org/
Research Webpage:
http://www.dec.alaska.gov/eh/vet/fish.htm
Arizona Na
Arkansas Na
California Research Webpage:
http://www.oehha.ca.gov
http://www.swrcb.ca.gov (search for "mercury")
Regional or Multistate or Binational Initiative Webpage:
http://www.newmoa.org/prevention/mercury/imerc.cfm
Mercury Emissions Webpage:
http://www.arb.ca.gov/homepage.htm
http://www.swrcb.ca.gov/ssi/serp.shtml?q=mercury&cx=001779225245372747843%
3Attksqsdjfn4&cof=FORID%3A10&ie=UTF-8&submit.x=17&submit.y=8#910
Colorado Main Mercury Webpage:
http://www.cdphe.state.co.us/hm/mercury/index.htm
Research Webpage:
http://www.cdphe.state.co.us/wq/FishCon/index.html
Published Mercury Release Information for Instate Sources Since 2000:
http://www.epa.gov/compliance/data/systems/icis/
Mercury Emissions Webpages:
http://www.epa.gov/tri/tridata/preliminarydataset/basic/index.html
Connecticut Main Mercury Webpage:
http://www.ct.gov/dep/cwp/view.asp?a=2690&Q=322430&depNav_GID=1651
Regional or Multistate or Binational Initiative Webpages:
http://www.epa.gov/region1/eco/mercury/pdfs/Mercury_Action_Plan.pdf
http://www.negc.org/main/
http://www.newmoa.org/prevention/mercury/imerc.cfm
http://www.neiwpcc.org/mercury/index.asp
Published Mercury Release Information for Instate Sources Since 2000:
http://www.ct.gov/dep/cwp/view.asp?a=2684&q=322188&DepNav_GID=1619
Delaware Na
Florida Main Mercury Webpages:
http://www.dep.state.fl.us/waste/categories/mercury/
http://www.dep.state.fl.us/water/tmdl/merctmdl.htm
Research Webpage:
http://www.dep.state.fl.us/water/sas/mercury/index.htm
Mercury Emissions Webpage:
http://www.dep.state.fl.us/waste/ash/wte.htm
Page 176
Third Compendium of States’ Mercury Activities — Part II: State Programs
171
Additional Information: State Web Pages
State Webpages With Additional Information
Hawaii Regional or Multistate or Binational Initiative Webpages:
http://www.productstewardship.us/
http://www.wsppn.org/
Idaho Main Mercury Webpages:
http://www.deq.idaho.gov/waste-mgmt-remediation/hazardous-waste/mercury.aspx
Research Webpage:
http://www.deq.idaho.gov/water-quality/surface-water/mercury.aspx
Mercury Emissions Webpage:
http://iaspub.epa.gov/triexplorer/tri_release.chemical
Illinois Main Mercury Webpage:
http://www.epa.state.il.us/mercury/
Regional or Multistate or Binational Initiative Webpage:
http://www.epa.gov/bns/
http://www.glc.org/glad/ [Subject to change due to changes in U.S. EPA Region V funding of GLAD
effective late 2012.]
http://www.glrc.us/
http://www.newmoa.org/prevention/mercury/imerc.cfm
Published Mercury Release Information for Instate Sources Since 2000:
http://www.epa.gov/compliance/data/systems/icis/
Indiana Main Mercury Webpage:
http://www.in.gov/idem
Regional or Multistate or Binational Initiative Webpage:
http://www.epa.gov/bns/
http://www.glc.org/glad/ [Subject to change due to changes in U.S. EPA Region V funding of GLAD
effective late 2012.]
http://www.glrc.us/
Iowa Mercury Emissions Webpage:
http://www.epa.gov/airdata/
Kansas Main Mercury Webpage:
http://www.kdheks.gov/mercury/index.html
Published Mercury Release Information for Instate Sources Since 2000:
http://www.kansastag.gov/kdem_default.asp
Kentucky Regional or Multistate or Binational Initiative Webpage:
NVMSRP: http://www.epa.gov/mercury/switch.htm
Louisiana Main Mercury Webpages:
http://www.deq.louisiana.gov/portal/
http://www.deq.louisiana.gov/portal/Default.aspx?tabid=287
Research Webpage:
http://www.deq.louisiana.gov/portal/Default.aspx?tabid=28
Regional or Multistate or Binational Initiative Webpage:
http://www.gulfofmexicoalliance.org/index.php
http://www.newmoa.org/prevention/mercury/imerc.cfm
Page 177
Third Compendium of States’ Mercury Activities — Part II: State Programs
172
Additional Information: State Web Pages
State Webpages With Additional Information
Louisiana
(Continued)
Mercury Emissions Webpages:
http://www.deq.louisiana.gov/portal/Portals/0/surveillance/mercury/
MercuryReport_ECopy.pdf
Maine Regional or Multistate or Binational Initiative Webpage:
http://www.epa.gov/region1/eco/mercury/pdfs/Mercury_Action_Plan.pdf
http://www.negc.org/main/
http://www.newmoa.org/prevention/mercury/imerc.cfm
http://www.neiwpcc.org/mercury/index.asp
Maryland Main Mercury Webpages:
http://www.mde.state.md.us/programs/land/Pages/Programs/landPrograms/index.aspx
http://www.mde.state.md.us/programs/land/recyclingandoperationsprogram/mercury/pages/
programs/landprograms/recycling/mercury/index.aspx
Research Webpages:
http://www.mde.state.md.us/assets/document/Mercury%20Report%202002.pdf
http://www.mde.state.md.us/assets/document/Mercury%20Report%202004%20-%20FINAL.pdf
http://www.mde.maryland.gov/programs/water/tmdl/approvedfinaltmdls/pages/programs/
waterprograms/tmdl/approvedfinaltmdl/index.aspx
Regional or Multistate or Binational Initiative Webpages:
http://www.epa.gov/hg/switch.htm
http://www.ecos.org/section/committees/cross_media/quick_silver
Massachusetts Main Mercury Webpage:
http://www.mass.gov/dep/toxics/stypes/hgres.htm
Research Webpage:
http://www.mass.gov/dep/toxics/stypes/hgres.htm#monitoring
Regional or Multistate or Binational Initiative Webpages:
http://www.newmoa.org/prevention/mercury/imerc.cfm
http://www.epa.gov/region1/eco/mercury/pdfs/Mercury_Action_Plan.pdf
http://negc.org/main/?do=page&id=40
http://www.neiwpcc.org/mercury/index.asp
Mercury Emissions Webpages:
http://www.mass.gov/dep/toxics/stypes/hgexsum.htm
http://www.nescaum.org/documents/inventory-of-anthropogenic-mercury-emissions-in-the-
northeast/
http://www.nescaum.org/
http://www.nescaum.org/documents/select-trace-elemental-composition-of-fuel-oil-used-in-the
-northeastern-us/
Michigan Main Mercury Webpages:
http://www.michigan.gov/deq
http://www.michigan.gov/mercury
Page 178
Third Compendium of States’ Mercury Activities — Part II: State Programs
173
Additional Information: State Web Pages
State Webpages With Additional Information
Michigan
(Continued) Regional or Multistate or Binational Initiative Webpage:
http://www.glc.org/glad/ [Subject to change due to changes in U.S. EPA Region V fund-
ing of GLAD effective late 2012.]
http://www.glrc.us/
http://www.epa.gov/bns/
http://www.newmoa.org/prevention/mercury/imerc.cfm
Published Mercury Release Information for Instate Sources Since 2000:
http://www.michigan.gov/deq/
Mercury Emissions Webpage:
http://www.michigan.gov/deqair
Minnesota Main Mercury Webpage: http://www.pca.state.mn.us/index.php/topics/mercury/mercury.html
Research Webpage: http://www.briloon.org/mercuryconnections/greatlakes
Regional or Multistate or Binational Initiative Webpage: http://www.ecos.org/section/committees/cross_media/quick_silver
http://www.epa.gov/bns/
http://www.glc.org/glad/ May change in late 2012
http://www.glrc.us/
http://www.newmoa.org/prevention/mercury/imerc.cfm
Mercury Emissions Webpage: http://www.pca.state.mn.us/index.php/view-document.html?gid=11481
Missouri Main Mercury Webpages: http://www.dnr.mo.gov/
http://www.dnr.mo.gov/env/mercury.htm
Montana Main Mercury Webpage: http://fwp.mt.gov/?id=28187
Research Webpage: http://www.fwp.mt.gov/fwpDoc.jsp?id=28187
Nebraska Main Mercury Webpage: http://dhhs.ne.gov/publichealth/Pages/mercury_index.aspx
Research Webpage: http://www.deq.state.ne.us/publica.nsf/pages/WAS057
Regional or Multistate or Binational Initiative Webpages: http://www.productstewardship.us/
http://www.nebraskapoison.com/
New Hampshire Main Mercury Webpage: http://des.nh.gov/organization/commissioner/p2au/pps/ms/mrpptp/index.htm
Regional or Multistate or Binational Initiative Webpage: http://www.epa.gov/region1/eco/mercury/pdfs/Mercury_Action_Plan.pdf
http://negc.org/main/?do=page&id=40
http://www.newmoa.org/prevention/mercury/imerc.cfm
http://www.neiwpcc.org/mercury/index.asp
Page 179
Third Compendium of States’ Mercury Activities — Part II: State Programs
174
Additional Information: State Web Pages
State Webpages With Additional Information
New Jersey Main Mercury Webpage:
http://www.state.nj.us/dep/dsr/mercury/
Research Webpage:
http://www.state.nj.us/dep/dsr/mercury/
Regional or Multistate or Binational Initiative Webpages:
http://www.neiwpcc.org/
http://newmoa.org/prevention/mercury/imerc.cfm
http://nadp.sws.uiuc.edu/
Published Mercury Release Information for Instate Sources Since 2000:
http://www.nj.gov/dep/dsr/trends/pdfs/mercury.pdf
Mercury Emissions Webpage:
http://www.state.nj.us/dep/dsr/trends/
New Mexico Na
New York Main Mercury Webpage:
http://www.dec.ny.gov/chemical/285.html
Research Webpage:
http://www.dec.ny.gov/chemical/285.html
Regional or Multistate or Binational Initiative Webpage:
http://www.epa.gov/bns/
http://www.glc.org/glad/ [Subject to change due to changes in U.S. EPA Region V funding of GLAD
effective late 2012.]
http://www.glrc.us/
http://www.newmoa.org/prevention/mercury/imerc.cfm
Published Mercury Release Information for Instate Sources Since 2000:
http://www.briloon.org/mercuryconnections/greatlakes
Mercury Emissions Webpage:
http://www.dec.ny.gov/chemical/8519.html
North
Carolina
Main Mercury Webpages:
http://ncdenr.gov/web/wq/ps/mtu/tmdl/tmdls/
http://ncdenr.gov/web/wq/ps/mtu/tmdl/tmdls/mercury
http://daq.state.nc.us/quick/mercury/
http://daq.state.nc.us/news/leg/hg/
http://daq.state.nc.us/news/pr/2012/mercury_07132012.shtml
http://portal.ncdenr.org/web/wm/hw/programs/mecuryswitch
Research Webpage: http://ncdenr.gov/web/wq/ps/mtu/tmdl/tmdls/mercury
Regional or Multistate or Binational Initiative Webpage:
http://www.newmoa.org/prevention/mercury/imerc.cfm
Mercury Emissions Webpage: http://daq.state.nc.us/news/leg/hg/
North Dakota Research Webpage:
http://pubs.usgs.gov/sir/2007/5219/
Page 180
Third Compendium of States’ Mercury Activities — Part II: State Programs
175
Additional Information: State Web Pages
State Webpages With Additional Information
Ohio Main Mercury Webpage:
http://epa.ohio.gov/ocapp/p2/mercury_pbt/mercury.aspx
Regional or Multistate or Binational Initiative Webpage:
http://www.epa.gov/bns/
http://www.glc.org/glad/ [Subject to change due to changes in U.S. EPA Region V funding of GLAD
effective late 2012.]
http://glrc.us/documents/MercuryPhaseDownStrategy06-19-2008.pdf
Oklahoma Published Mercury Release Information for Instate Sources Since 2000:
http://www.deq.state.ok.us/pubs/CSD/TRI06.pdf
Oregon Main Mercury Webpage:
http://www.deq.state.or.us/lq/mercury.htm
Regional or Multistate or Binational Initiative Webpage: http://yosemite.epa.gov/R10/
HOMEPAGE.NSF/abedd4842d006a6e88256f5f00697f3e/f60e8f81c53471ed88256eef00747a17/$FILE/
R10MercuryStrategy2008.pdf
Rhode Island Main Mercury Webpage:
http://www.dem.ri.gov/topics/mercury.htm
Regional or Multistate or Binational Initiative Webpages:
http://www.epa.gov/region1/eco/mercury/pdfs/Mercury_Action_Plan.pdf
http://www.negc.org/main/
http://www.newmoa.org/prevention/mercury/imerc.cfm
http://www.neiwpcc.org/mercury/index.asp
South Carolina Main Mercury Webpage:
http://www.scdhec.gov/environment/admin/Mercury/htm/index.htm
Regional or Multistate or Binational Initiative Webpage:
http://www.ecos.org/section/committees/cross_media/quick_silver
Published Mercury Release Information for Instate Sources Since 2000:
http://www.scdhec.gov/environment/admin/Mercury/htm/initiative.htm
Mercury Emissions Webpage:
http://www.scdhec.gov/environment/admin/Mercury/htm/initiative.htm
Texas Research Webpage:
http://www.tceq.texas.gov/assets/public/comm_exec/pubs/sfr/085.pdf
Regional or Multistate or Binational Initiative Webpage:
http://gulfofmexicoalliance.org/issues/water_quality.php
Utah Main Mercury Webpages:
http://www.mercury.utah.gov/
http://www.deq.utah.gov/Business_Assistance/Hospitals/index.htm
Research Webpage: www.deq.utah.gov/issues/mercury/upcoming-meetings.htm
Regional or Multistate or Binational Initiative Webpage:
http://www.ecos.org/section/committees/cross_media/quick_silver
Mercury Emissions Webpage:
http://www.airquality.utah.gov/Planning/Emission-
Inventory/2008_State/2008_Statewide_HAPs_FormB.pdf
Page 181
Third Compendium of States’ Mercury Activities — Part II: State Programs
176
Additional Information: State Web Pages
State Webpages With Additional Information
Vermont Main Mercury Webpage:
http://www.mercvt.org/
Research Webpage:
http://www.vtwaterquality.org//wqd_mgtplan/stressor_toxics.htm
Regional or Multistate or Binational Initiative Webpages:
http://www.epa.gov/region1/eco/mercury/pdfs/Mercury_Action_Plan.pdf
http://www.negc.org/main/
http://www.newmoa.org/prevention/mercury/imerc.cfm
http://www.neiwpcc.org/mercury/index.asp
Washington Main Mercury Webpages:
http://www.ecy.wa.gov/mercury/
http://www.doh.wa.gov/CommunityandEnvironment/Contaminants/Mercury.aspx
Research Webpage:
http://www.ecy.wa.gov/science/index.html
Regional or Multistate or Binational Initiative Webpage:
http://www.newmoa.org/prevention/mercury/imerc.cfm
Published Mercury Release Information for Instate Sources Since 2000:
http://www.ecy.wa.gov/science/index.html http://www.manta.com/mb_45_E5138000_48/
blast_furnaces_and_steel_mills/washington
Mercury Emissions Webpage:
http://www.ecy.wa.gov/mercury/mercury_measures.html
West Virginia Na
Wisconsin Main Mercury Webpages:
http://dnr.wi.gov/topic/Mercury/ (Available in December 2012)
Research and Monitoring Webpage:
http://dnr.wi.gov/topic/AirQuality/Monitor.html#tabx3
Regional or Multistate or Binational Initiative Webpages
http://www.epa.gov/bns/
http://www.glrc.us/
http://www.glc.org/glad/ [Subject to change due to changes in U.S. EPA Region V funding of GLAD
effective late 2012.]
State Utility Rule Webpage:
http://dnr.wi.gov/topic/AirQuality/Toxics.html
Page 182
Third Compendium of States’ Mercury Activities — Part II: State Programs
177
BLANK PAGE
Page 183
178
Third Compendium of States’ Mercury Activities — Part I: National Overview
178
Third Compendium of States’ Mercury Activities — Part III: Appendices
This section of the compendium includes the Appendices referenced in Part I —
National Overview. They are:
Appendix S-A: Air Emission Sources Identified By States in 2011 Survey
Appendix S-B: NEI Sector Emissions
Appendix S-C: NEI State Table
Appendix S-D: TRI Data Summary for Mercury and Mercury Compounds
Appendix R & M-A: Mercury Research Activities by State
Appendix R &M-B: Mercury Fish Advisories
Appendix P-A: Reduction of Mercury Use in Products
Appendix SD: Survey Documents
2011 Compendium Survey Letter
2011 Survey Supplemental Instructions
2011 Survey Questionnaire
Summary Results: 2011 Survey
Appendices
Page 184
179
Third Compendium of States’ Mercury Activities — Part I: National Overview
179
Third Compendium of States’ Mercury Activities — Part III: Appendices
Air Emission Sources Identified By States in 2011 Survey (Number of States)
Source Category
Coal-fired electric power plants 35 15 17
Electric arc furnaces 25 5 3
Industrial/commercial boilers 39 6 6
Biomass boilers 33 5 5
Commercial sources (manufacturing/industrial) 34 6 6
Dismantlers, shredders 32 7 4
Foundries 27 5 4
Integrated steel facilities 13 2 3
Sewage sludge incinerators 21 7 9
Chloralkali plants 5 1 1
Hazardous waste incinerators 17 2 4
Municipal solid waste incinerators/Combustors 25 9 11
Medical waste incinerators 20 7 10
Gold mining 9 2 3
Other mining 27 3 4
Crematoria 38 4 4
Oil refining 21 2 2
Primary aluminum production 9 4 2
Secondary aluminum production 22 3 2
Cement kilns 26 4 7
Home heating 34 1 1
Mobile sources 33 2 1
Wastewater treatment plant sludge 38 5 17
Wastewater treatment plant effluent 37 5 21
Broken mercury-containing products/spills 38 3 8
Appendix: S-A
Sta
tew
ide
req
uir
e-
men
ts f
or
mo
nit
or-
ing
/ m
easu
rin
g
rele
ases
So
urc
e p
rese
nt
in
stat
e
Mo
re s
trin
gen
t
stat
ewid
e re
-
qu
irem
ents
fo
r
this
so
urc
e th
an
U.S
. EP
A
Page 185
180
Third Compendium of States’ Mercury Activities — Part I: National Overview
180
Third Compendium of States’ Mercury Activities — Part III: Appendices
NEI Sector Emissions
NEI Sector Data was generated using the sector summaries tool at http://www.epa.gov/
ttn/chief/net/2008inventory.html, accessed on May 4, 2012. Note that NEI Sectors are
based solely on Source Classification Code (SCC) and do not match the Hg sectors pre-
sented in Figure 1 and Table 1 in the Sources Section of this report, which focus on regu-
latory categories and categories of interest to the international community. See Section
2.6 of the 2008 National Emissions Inventory Technical Support Document (http://
www.epa.gov/ttn/chief/net/2008neiv2/2008_neiv2_tsd_draft.pdf,) for more information
on how these sectors developed for Hg emissions.
EMISSIONS
(pounds/year)
1 Fuel Combustion - Electric Generation - Coal 58,493
2 Industrial Processes - Ferrous Metals 11,105
3 Industrial Processes - Cement Manufacturing 9,658
4 Industrial Processes - Non-ferrous Metals 6,658
5 Waste Disposal 4,278
6 Industrial Processes - Chemical Manufacturing (includes chloralkalai) 4,201
7 Miscellaneous Non-Industrial Not elsewhere classified 3,659
8 Fuel Combustion - Industrial Boilers, Internal Combustion Engines - Coal 3,528
9 Industrial Processes – Not elsewhere classified 2,666
10 Fuel Combustion - Residential - Oil 2,368
11 Fuel Combustion - Electric Generation - Other (some MSWC included) 2,118
12 Fuel Combustion - Industrial Boilers, Internal Combustion Engines - Natu-
ral Gas
1,519
13 Mobile - Locomotives 1,485
14 Industrial Processes - Petroleum Refineries 1,407
15 Industrial Processes - Storage and Transfer 1,085
16 Fuel Combustion - Electric Generation - Natural Gas 970
17 Fuel Combustion - Industrial Boilers, Internal Combustion Engines - Bio-
mass
726
18 Mobile - On-Road Diesel Heavy Duty Vehicles 706
19 Mobile - On-Road Gasoline Light Duty Vehicles 611
20 Industrial Processes - Pulp & Paper 601
21 Mobile - Non-Road Equipment - Diesel 569
Appendix: S-B
Page 186
181
Third Compendium of States’ Mercury Activities — Part I: National Overview
181
Third Compendium of States’ Mercury Activities — Part III: Appendices
NEI Sector Emissions
NEI Sector Data were generated using the sector summaries tool at http://www.epa.gov/
ttn/chief/net/2008inventory.html, accessed on May 4, 2012. Note that NEI Sectors are
based solely on Source Classification Code (SCC) and do not match the Hg sectors pre-
sented in Figure 1 and Table 1 in the Sources Section of this report, which focus on regu-
latory categories and categories of interest to the international community. See Section
2.6 of the 2008 National Emissions Inventory Technical Support Document (http://
www.epa.gov/ttn/chief/net/2008neiv2/2008_neiv2_tsd_draft.pdf,) for more information
on how these sectors were developed for Hg emissions.
EMISSIONS
(pounds/year)
22 Fuel Combustion - Industrial Boilers, Internal Combustion Engines - Oil 550
23 Fuel Combustion - Industrial Boilers, Internal Combustion Engines - Other 499
24 Fuel Combustion - Commercial/Institutional - Oil 392
25 Fuel Combustion - Commercial/Institutional - Coal 328
26 Fuel Combustion - Electric Generation - Biomass 212
27 Fuel Combustion - Electric Generation - Oil 190
28 Industrial Processes - Oil & Gas Production 141
29 Fuel Combustion - Residential - Wood 122
30 Fuel Combustion - Residential - Natural Gas 117
31 Fuel Combustion - Commercial/Institutional - Natural Gas 105
32 Fires - Agricultural Field Burning 94
33 Mobile - Non-Road Equipment - Gasoline 72
34 Fuel Combustion - Commercial/Institutional - Biomass 63
35 Industrial Processes - Mining 40
36 Mobile - Commercial Marine Vessels 31
37 Fuel Combustion - Residential - Other 27
38 Fuel Combustion - Commercial/Institutional - Other 23
39 Solvent - Consumer & Commercial Solvent Use 23
40 Mobile - On-Road Gasoline Heavy Duty Vehicles 22
41 Mobile - On-Road Diesel Light Duty Vehicles 10
42 Bulk Gasoline Terminals 8
43 Solvent - Industrial Surface Coating & Solvent Use 3
Appendix: S-B
Page 187
182
Third Compendium of States’ Mercury Activities — Part I: National Overview
182
Third Compendium of States’ Mercury Activities — Part III: Appendices
Appendix: S-C
TOP TEN NATIONAL MERCURY EMISSION SOURCE CATEGORIES
Coal-fired EGUs are the largest in-state emission source in 32 states and ranked in the
top three sources in a total of 42 states participating in the 2011 Compendium Survey.
Industrial process-ferrous metals, which includes Electric Arc Furnaces (EAFs), and
miscellaneous non-industrial sources, which includes a variety of smaller area and
non-point sources, both ranked in the top three sources in 22 states. Cement manufac-
turing ranked in the top three source categories in 19 states. Despite the large reduc-
tions in emissions associated with waste disposal, this category still ranked in the top
three source categories in 11 states. Residential fuel combustion ranked in the top
three source categories in 10 states but as more current data suggests emissions from
this source category may be significantly overestimated.
The table on the following pages summarizes the responses of the 42 participating
states.
Page 188
183
Third Compendium of States’ Mercury Activities — Part I: National Overview
183
Third Compendium of States’ Mercury Activities — Part III: Appendices
Appendix: S-C
Top Ten National Mercury Emission Source Categories
by State *
State
Emission Categories A-E
(A)
Fuel combus-
tion - electric
generation -
coal
(B)
Industrial
processes
- ferrous
metals
(includes
EAF)
(C)
Industrial
processes
- cement
manu-
facturing
(D)
Industrial
processes -
non-ferrous
metals
(includes
gold min-
ing)
(E)
Waste dis-
posal
(includes
waste incin-
eration)
Alabama 3466 521 341 12 1
Alaska 24 0 6
Arizona 1074 31 28 0
Arkansas 779 308 134 2 357
California 0 250 2119 1 333
Colorado 679 721 81 13
Connecticut 5 58
Delaware 122 163 0 0
Florida 1270 129 443 0 46
Hawaii 3 0
Idaho 7 2 1
Illinois 1739 286 52 181 142
Indiana 2454 435 514 125 91
Iowa 1937 179 100 0
Kanas 1284 76 664 0
Kentucky 1573 403 36 1 3
Louisiana 1798 63 45
Maine 27 33
Maryland 252 0 501 150
Massachusetts 158 191
Michigan 2277 353 599 0 117
Minnesota 1303 756 1 475
Missouri 2370 330 153 47
Page 189
184
Third Compendium of States’ Mercury Activities — Part I: National Overview
184
Third Compendium of States’ Mercury Activities — Part III: Appendices
Appendix: S-C
Top Ten National Mercury Emission Source Categories
by State *
State
Emission Categories F-J
(F)
Industrial
processes -
chemical
manu-
facturing
(includes
chloralkalai)
(G)
Miscellane-
ous non-
Industrial
(includes
area, non-
point
sources)
(H)
Fuel combus-
tion - indus-
trial boilers -
coal
(I)
Industrial
processes
– not else-
where
classified
(J)
Fuel com-
bustion res-
idential -
oil
Alabama 340 73 37 29 1
Alaska 9 1 1 39
Arizona 65 32 0 0
Arkansas 0 43 200 0 0
California 38 86 3 481 8
Colorado 23 10 84 0
Connecticut 50 0 232
Delaware 0 3 74 0 0
Florida 4 214 50 80 2
Hawaii 17 0 0
Idaho 613 48 14 15 7
Illinois 141 133 245 114 4
Indiana 5 98 121 7 12
Iowa 1 49 455 3 5
Kanas 0 47 1 0
Kentucky 55 16 91 7
Louisiana 1094 57 4 26 0
Maine 35 16 5 116
Maryland 76 109 1 55
Massachusetts 237 6 0 281
Michigan 125 325 10 24
Minnesota 0 33 140 136 28
Missouri 6 20 8 66 4
Page 190
185
Third Compendium of States’ Mercury Activities — Part I: National Overview
185
Third Compendium of States’ Mercury Activities — Part III: Appendices
Top Ten National Mercury Emission Source Categories
by State *
State
Emission Categories A-E
(A)
Fuel combus-
tion - electric
generation -
coal
(B)
Industrial
processes
- ferrous
metals
(includes
EAF)
(C)
Industrial
processes -
cement
manu-
facturing
(D)
Industrial
processes
- non-
ferrous
metals
(includes
gold min-
ing)
(E)
Waste dis-
posal
(includes
waste incin-
eration)
Montana 237 25 0
Nebraska 1353 163 41 40
New Hampshire 235 0 5
New Jersey 40 93 150
New Mexico 8 10 0
New York 343 144 184 233
North Carolina 1580 61 139 170
North Dakota 3024 7
Ohio 3218 836 41 3 187
Oklahoma 1211 128 36 9
Oregon 133 48 1508 11
Rhode Island 78
South Carolina 631 963 237 4 82
South Dakota 192 9 40
Tennessee 2258 258 204 169 98
Texas 7226 1172 345 2294 499
Utah 404 313 213 6 57
Vermont
Virginia 855 874 9 77
Washington 313 69 102 1 10
West Virginia 1871 49 134 0 26
Wisconsin 1431 95 3 57
National Total 58978 11105 9689 6658 4278
*Additional information about and data from the United States Environmental Protection
Agency’s 2008 National Emissions Inventory (NEI) can be found at http://www.epa.gov/ttn/
chief/net/2008inventory.html
Appendix: S-C
Page 191
186
Third Compendium of States’ Mercury Activities — Part I: National Overview
186
Third Compendium of States’ Mercury Activities — Part III: Appendices
Top Ten National Mercury Emission Source Categories
by State *
State
Emission Categories F-J
(F)
Industrial
processes -
chemical
manu-
facturing
(includes
chloralkalai)
(G)
Miscellane-
ous non-
Industrial
(includes
area, non-
point
sources)
(H)
Fuel combus-
tion - indus-
trial boilers -
coal
(I)
Industrial
processes
– not else-
where
classified
(J)
Fuel com-
bustion
residential
- oil
Montana 1 14 2 3
Nebraska 24 4 14 2
New Hampshire 18 0 82
New Jersey 2 105 127 132
New Mexico 23 0 0
New York 2 176 48 14 584
North Carolina 302 117 148 34 56
North Dakota 14 49 1 8
Ohio 68 190 198 291 45
Oklahoma 96 52 13 4 0
Oregon 53 0 12
Rhode Island 13 0 51
South Carolina 0 56 42 17 9
South Dakota 14 4
Tennessee 46 77 124 1 7
Texas 101 191 4 149 0
Utah 33 2 3 1
Vermont 17 0 44
Virginia 0 98 58 194 100
Washington 0 87 1 22
West Virginia 161 29 104 5 10
Wisconsin 1080 226 136 23 41
National Total 4201 3714 3569 2667 2368
*Additional information about and data from the United States Environmental Protection
Agency’s 2008 National Emissions Inventory (NEI) can be found at http://www.epa.gov/ttn/
chief/net/2008inventory.html
Appendix: S-C
Page 192
187
Third Compendium of States’ Mercury Activities — Part I: National Overview
187
Third Compendium of States’ Mercury Activities — Part III: Appendices
Toxic Release Inventory Data Summary for Elemental Mercury
or Mercury Compounds: Key Sectors
The Tables in this appendix present summary data on mercury from the TRI database
as provided by the U.S. Office of Toxic Substances, email communication, 2012 (U.S.
EPA Office of Toxic Release Inventory Program email communication).
In these Tables the mercury emissions and other waste management quantities report-
ed to U.S. EPA’s TRI jump considerably higher after 1999 for many sectors. This is due
to the change in the reporting threshold from 25,000 pounds (for manufacturing or
processing mercury or mercury compounds) and 10,000 pounds (for otherwise using
mercury or mercury compounds) annually to 10 pounds annually, beginning with the
year 2000. The lowering of the TRI reporting threshold brought into TRI reporting
many facilities that release mercury into the environment, whether as elemental mer-
cury in its neutral form or as a compound that contains mercury compounds, that pri-
or to 2000 did not have to report.
For the year 2000 and thereafter, the TRI data indicate a general and significant down-
ward trend in overall air emissions for several source sectors, while some others in-
creased. The reported air emissions in 2010 compared to 2002 were down: 24% for
EGU; 85% for chloralkali plants; 78% for gold mining; 42% for cement kilns; and 91%
from hazardous waste treatment and disposal. In contrast, reported air emissions from
the EAF and integrated steel facilities were up by 78% in 2010 vs. 2002. Although this
may reflect a real increase it is also possible that it may be due to improved emissions
estimates attributable to increased awareness and data regarding emissions from this
sector, which may have occurred over this period.
On a total mass basis, disposal of mercury to land dwarfs releases to the air and water
for the sectors considered in Tables A-D. The largest source of mercury disposal to
land over the 2002-2010 timeframe was the gold mining sector, which reported 3.5 - 4.6
million pounds of mercury, predominantly in the form of compounds, released to land
per year. In this case, the material disposed of is in the form of solids derived from
rock processed during the gold mining process. These solid mercury compound
wastes are likely to be quite stable.
Please note that some facilities may fall into multiple sector categories so the data in
these tables includes some double counting and thus the values for each media do not
match the summary TRI data in Table 3 in the Sources section of the report.
Appendix: S-D
Citation
U.S. EPA Office of Toxic Release Inventory Programs, email communication, 2012. TRI Data for State
Mercury Compendium.xlsx file Data were downloaded by U.S. EPA from TRI on January 27, 2012
Page 193
188
Third Compendium of States’ Mercury Activities — Part I: National Overview
188
Third Compendium of States’ Mercury Activities — Part III: Appendices
Table D:1: TRI Data Mercury Air Emissions Summary
Key Sectors Air
MACT Category NAICS Code 2002 2005 2008 2010 1999
Coal-fired Electric
Power Plants
221112, limited to coal,
including those co-
fired with oil 88,208 95,614 90,050 66,670 432
Oil-fired Electric Power
Plants
221112, limited to oil,
except those co-fired
with coal 370 414 233 655 0
Industrial/Commercial
Boilers & Commercial
Sources 31-33 43,397 37,042 29,734 29,420 13,670
Chloralkali Plants 325181 9,903 7,221 3,038 1,517 10,642
Hazardous Waste
Treatment and Dispos-
al* 562211 1,155 339 1,382 102 62
Solid Waste Combus-
tors and Incinerators* 562213 0 0 26 18 0
Cement Kilns 327310 12,453 10,687 9,214 7,263 335
Electric Arc Furnaces
andIntegrated Steel
Facilities 331111 4,923 6,291 6,038 8,748 0
Gold Mining 212221 8,842 4,777 4,496 1,916 12,159
Other Mining
212111 - 212113,
212221, 212222,
212231, 212234, 212299 593 494 256 383 70
Foundries 3315 766 460 215 132 0
Oil Refining 324110 1,764 1,753 2,026 1,967 1
Primary Aluminum
Production 331312 619 979 136 132 0
Secondary Aluminum
Production 3313, except 331312 1,464 1,508 1,233 1,222 0
* Regarding facilities in NAICS 5622 (“Waste Treatment and Disposal”), only those facilities categorized by:
either by NAICS 562211; 562212; 562213; or 562219 and that are regulated under the Resource Conservation and
Recovery Act, subtitle C, 42 U.S.C. 6921 et. seq. are subject to TRI reporting.
Appendix: S-D
Page 194
189
Third Compendium of States’ Mercury Activities — Part I: National Overview
189
Third Compendium of States’ Mercury Activities — Part III: Appendices
Table D-2: TRI Mercury Data Water Releases Summary
Key Sectors Water
MACT Category NAICS Code 2002 2005 2008 2010 1999
Coal-fired Electric Power Plants 221112, limited to coal, in-
cluding those co-fired with
oil 322 198 966 760 0
Oil-fired Electric Power Plants
221112, limited to oil, except
those co-fired with coal 18 15 0 0 0
Industrial/Commercial Boilers &
Commercial Sources 31-33 590 435 2,119 606 168
Chloralkali Plants 325181 117 96 101 40 125
Hazardous Waste Treatment
and Disposal* 562211 1 12 1 2 0
Solid Waste Combustors and
Incinerators* 56221 0 0 0 0 0
Cement Kilns 327310 0 1 0 0 0
Electric Arc Furnaces and Inte-
grated Steel Facilities 331111 19 22 27 24 0
Gold Mining 212221 19 1 0 5 4
Other Mining
212111, 212112, 212113,
212221, 212222, 212231,
212234, 212299 8 5 15 3 5
Foundries 3315 0 1 0 0 0
Oil Refining 324110 102 96 159 100 5
Primary Aluminum Production 331312 0 0 0 0 0
Secondary Aluminum Produc-
tion 3313, except 331312 7 2 21 27 0
* Regarding facilities in NAICS 5622 (“Waste Treatment and Disposal”), only those facilities categorized by: either
by NAICS 562211; 562212; 562213; or 562219 and that are regulated under the Resource Conservation and Recov-
ery Act, subtitle C, 42 U.S.C. 6921 et. seq. are subject to TRI reporting.
Appendix: S-D
Page 195
190
Third Compendium of States’ Mercury Activities — Part I: National Overview
190
Third Compendium of States’ Mercury Activities — Part III: Appendices
Table D-3: TRI Mercury Data – Releases/Disposal to Land Summary
Key Sectors Land
MACT Category NAICS Code 2002 2005 2008 2010 1999
Coal-fired Electric Power
Plants
221112, limited
to coal, includ-
ing those co-
fired with oil 39,286 35,716 40,539 54,613 1,725
Oil-fired Electric Power
Plants
221112, limited
to oil, except
those co-fired
with coal 187 236 655 7 0
Industrial/Commercial Boil-
ers & Commercial Sources 31-33 29,288 22,438 13,262 25,461 8,122
Chloralkali Plants 325181 993 256 191 223 998
Hazardous Waste Treat-
ment and Disposal* 562211 41,315 328,454 353,412 61,496 455,856
Solid Waste Combustors
and Incinerators* 562213 0 0 0 0 0
Cement Kilns 327310 1,487 1,363 246 159 0
Electric Arc Furnaces and
Integrated Steel Facilities 331111 384 128 202 792 1,400
Gold Mining 212221 4,573,325 3,574,170 5,452,047 4,228,916 2,539,001
Other Mining
212111, 212112,
212113, 212221,
212222, 212231,
212234, 212299 136,819 94,821 125,292 164,890 58,005
Foundries 3315 115 50 40 3 0
Oil Refining 324110 82 126 252 65 5
Primary Aluminum Produc-
tion 331312 357 374 301 223 0
Secondary Aluminum Pro-
duction
3313, except
331312 3,871 3,556 3,367 3,410 0
* Regarding facilities in NAICS 5622 (“Waste Treatment and Disposal”), only those facilities categorized by: either
by NAICS 562211; 562212; 562213; or 562219 and that are regulated under the Resource Conservation and Recov-
ery Act, subtitle C, 42 U.S.C. 6921 et. seq. are subject to TRI reporting.
Appendix: S-D
Page 196
191
Third Compendium of States’ Mercury Activities — Part I: National Overview
191
Third Compendium of States’ Mercury Activities — Part III: Appendices
Appendix: R&M-A
Mercury Research Activities by State
State
Conducted
Research
in 2005
Conducted
Research
in 2011
Web Page
Total Number of
States 28 29
Alabama NA
http//www.adem.state.al.us/programs/
waterforms/
surfacewatermonitoring.pdf
Alaska NA
http://www.dec.alaska.gov/eh/vet/
fish.htm
Arizona No NA
Arkansas No NA
California
http://www.oehha.ca.gov;
http://www.swrcb.ca.gov, search for
"mercury"
Colorado
http://www.cdphe.state.co.us/wq/
FishCon/index.html
Connecticut NA
Delaware NA
Florida
http://www.ct.gov/dep/cwp/view.asp?
a=2690&Q=322430&depNav_GID=1651
Hawaii NA
Idaho NA
http://www.deq.idaho.gov/water-
quality/surface-water/mercury.aspx
Illinois ü\ü No NA
Indiana NA No NA
Iowa NA No NA
Kansas NA NA
Kentucky NA No NA
Louisiana
http://www.deq.louisiana.gov/portal/
Default.aspx?tabid=28
Maine NA
Page 197
192
Third Compendium of States’ Mercury Activities — Part I: National Overview
192
Third Compendium of States’ Mercury Activities — Part III: Appendices
Mercury Research Activities by State
State
Conducted
Research
in 2005
Conducted
Research
in 2011
Web Page
Maryland
http://www.mde.state.md.us/programs/
Land/RecyclingandOperationsprogram/
Mercury/Documents/
www.mde.state.md.us/assets/document/
Mercury%20Report%202002.pdf
http://www.mde.state.md.us/programs/
Land/RecyclingandOperationsprogram/
Mercury/Documents/
www.mde.state.md.us/assets/document/
Mercury%20Report%202004%20-%
20FINAL.pdf;
http://www.mde.maryland.gov/
programs/water/tmdl/
approvedfinaltmdls/pages/programs/
waterprograms/tmdl/
approvedfinaltmdl/index.aspx
Massachusetts
http://www.mass.gov/dep/toxics/stypes/
Michigan http://www.michigan.gov/deqair
Minnesota
http://www.briloon.org/
Mississippi NA NA
Missouri No NA
Montana NA
http://www.fwp.mt.gov/fwpDoc.jsp?
Nebraska NA
http://www.deq.state.ne.us/publica.nsf/
pages/WAS057
New Hampshire No NA
New Jersey http://www.state.nj.us/dep/dsr/mercury/
New Mexico NA No NA
New York
http://www.dec.ny.gov/
chemical/285.html
Appendix: R&M-A
Page 198
193
Third Compendium of States’ Mercury Activities — Part I: National Overview
193
Third Compendium of States’ Mercury Activities — Part III: Appendices
Mercury Research Activities by State
State
Conducted
Research
in 2005
Conduct-
ed Re-
search in
2011
Web Page
North Carolina
http://ncdenr.gov/web/wq/ps/mtu/
North Dakota http://pubs.usgs.gov/sir/2007/5219/
Ohio NA No NA
Oklahoma NA No NA
Oregon
http://www.deq.state.or.us/lab/wqm/
Rhode Island NA No NA
South Carolina NA NA
Texas NA
http://www.tceq.texas.gov/assets/
Utah NA
www.deq.utah.gov/issues/mercury/
Vermont
http://www.vtwaterquality.org//
Washington
http://www.ecy.wa.gov/science/
West Virginia NA No NA
Wisconsin
http://dnr.wi.gov/air/aq/monitor/
Appendix: R&M-A
Page 199
194
Third Compendium of States’ Mercury Activities — Part I: National Overview
194
Third Compendium of States’ Mercury Activities — Part III: Appendices
BLANK PAGE
Page 200
195
Third Compendium of States’ Mercury Activities — Part I: National Overview
195
Third Compendium of States’ Mercury Activities — Part III: Appendices
Appendix: R&M-B
Mercury Fish Advisories
Summary of Types, Coverage, and Activity in 2010**
State
Alabama 253.6 29,330.2
Alaska
Arkansas 93.1 3,659.6 32.1
Arizona 18,112.7
California 241.0 67,910.7
Colorado 37,740.7
Connecticut 1,377.9
Delaware 14.2 142.3
Florida 390.9 5,161.2 880,236.7 1,113.6
Georgia 255.2 6.7 28,821.5
Hawaii
Iowa 310.6
Idaho 212,754.3
Illinois 9,370.8
Indiana 2.1 34,140.8
Kansas
Kentucky 69,213.9
Louisiana 8,083.6 11.5 1,784.2 79,356.3
Massachusetts 4.5 1,115.9 14,659.1 5.3
Maryland 777.5 14,260.4
Maine 2,064.3
Michigan 2,348.4 129,148.5
Minnesota 1,333,061.0
Missouri 1,687.7
Mississippi 219.9 35,324.0
** Data in this table are from the United States Environmental Protection Agencies 2010 Fish Advisory
Database
***More recent advisories may have been issued but not yet entered into the U.S. EPA database
Co
stal
Sq
uar
e
Mil
es
Bay
ou
Sq
uar
e M
iles
Can
al M
iles
Co
stal
Sq
uar
e
Mil
es
Mu
lti-
clas
s
Gre
at L
akes
Mil
es
Lak
e A
cres
Page 201
196
Third Compendium of States’ Mercury Activities — Part I: National Overview
196
Third Compendium of States’ Mercury Activities — Part III: Appendices
Appendix: R&M-B
Mercury Fish Advisories
Summary of Types, Coverage, and Activity in 2010**
State
Alabama 907.6 No 1993 2010
Alaska 2,904.6 Yes 2001 2009
Arkansas 260.0 No 1994 1999
Arizona No 1995 2009
California 9,243.6 539.7 No 1993 2010
Colorado No 1993 2009
Connecticut Yes 1994 2002
Delaware 31.1 No 1999 2007
Florida 2,934.0 Yes 1993 2009
Georgia 3,042.0 No 1993 2008
Hawaii Yes 2003 2003
Iowa 149.8 Yes 2006 2008
Idaho 536.2 Yes 1994 2010
Illinois 2,659.5 Yes 1993 2010
Indiana 1,395.0 No 1993 2010
Kansas 25.0 No 1994 1994
Kentucky 681.6 No 1994 2008
Louisiana 773.3 No 1993 2009
Massachusetts 189.1 Yes 1993 2009
Maryland 5,324.8 Yes 2001 2009
Maine Yes 1994 1994
Michigan 675.3 Yes 1988 2010
Minnesota 3,511.4 Yes 1993 2010
Missouri 1,080.3 No 1998 2008
Mississippi 263.6 Yes 1995 2001
** Data in this table are from the United States Environmental Protection Agencies 2010 Fish Advisory
Database
***More recent advisories may have been issued but not yet entered into the U.S. EPA database
Sta
te-w
ide
Reg
ion
al
Mil
es
Riv
er M
iles
Wet
lan
d A
cres
Fir
st A
dv
iso
ry
Issu
ed
Mo
st R
ecen
t
Ad
vis
ory
Iss
ued
***
Page 202
197
Third Compendium of States’ Mercury Activities — Part I: National Overview
197
Third Compendium of States’ Mercury Activities — Part III: Appendices
Mercury Fish Advisories
Summary of Types, Coverage, and Activity in 2010**
State
Montana 662,672.8
North Carolina 1,876.8 23,935.6
North Dakota 49,566.0
Nebraska 19.2 13,323.2
New Hampshire 45.4 1,635.6
New Jersey 12,074.1
New Mexico 31,041.1
Nevada 125,230.2
New York 136,182.0
Ohio 30,412.5
Oklahoma 30,498.0
Oregon 16,691.8
Pennsylvania 6,820.2
Rhode Island 247.2 1,541.7
South Carolina 476.0 54.0 1,750.1 188.8
South Dakota 10,312.4
Tennessee 46,364.6
Texas 2,185.5 17.1 371,245.6
Utah 2,627.5 266.0
Vermont 1,350.4
Virginia 18.0 7,347.5
Washington 2,193.0
Wisconsin 174.6 253,965.1
West Virginia 4,232.4
Wyoming 48,846.6
** Data in this table are from the United States Environmental Protection Agencies 2010 Fish Advisory
Database
***More recent advisories may have been issued but not yet entered into the U.S. EPA database
Co
stal
Sq
uar
e
Mil
es
Bay
ou
Sq
uar
e M
iles
Can
al M
iles
Co
stal
Sq
uar
e
Mil
es
Mu
lti-
clas
s
Gre
at L
akes
Mil
es
Lak
e A
cres
Appendix: R&M-B
Page 203
198
Third Compendium of States’ Mercury Activities — Part I: National Overview
198
Third Compendium of States’ Mercury Activities — Part III: Appendices
Mercury Fish Advisories
Summary of Types, Coverage, and Activity in 2010**
State
Montana 150.8 Yes 1993 2007
North Carolina No 2000 2009
North Dakota 10.0 No 1993 2003
Nebraska 204.3 Yes 1994 2010
New Hampshire Yes 1994 2008
New Jersey 390.5 No 1995 2010
New Mexico 83.5 No 1993 2010
Nevada 2,006.2 Yes 1993 2010
New York 222.5 Yes 1993 2010
Ohio 2,896.6 Yes 1993 2010
Oklahoma Yes 1993 2010
Oregon 461.0 Yes 1993 2008
Pennsylvania 455.7 No 1993 2010
Rhode Island 18.6 Yes 1993 2004
South Carolina 1,871.1 27,379.7 No 1993 2009
South Dakota No 2000 2008
Tennessee 466.1 No 1993 2010
Texas 321.0 No 1980 2010
Utah 189.3 No 2005 2009
Vermont Yes 1995 2003
Virginia 1,043.2 No 1974 2009
Washington 21.2 Yes 1997 2007
Wisconsin 3,998.5 Yes 1993 2010
West Virginia 521.8 Yes 2005 2008
Wyoming Yes 2008 2008
** Data in this table are from the United States Environmental Protection Agencies 2010 Fish Advisory
Database
***More recent advisories may have been issued but not yet entered into the U.S. EPA database
Sta
te-w
ide
Reg
ion
al
Mil
es
Riv
er M
iles
Wet
lan
d A
cres
Fir
st A
dv
iso
ry
Issu
ed
Mo
st R
ecen
t
Ad
vis
ory
Iss
ued
***
Appendix: R&M-B
Page 204
199
Third Compendium of States’ Mercury Activities — Part I: National Overview
199
Third Compendium of States’ Mercury Activities — Part III: Appendices
Appendix: P-A
Reduction of Mercury Use in Products
The Interstate Mercury Education and Reduction Clearinghouse (IMERC) notification
data show there has been a significant reduction of mercury used in products since
states first adopted legislation and regulations targeting this source. There was a 46%
reduction in mercury used in products from 2001 to 2007, the most recent data availa-
ble. Several manufacturers of mercury-containing products ceased sales in all states at
least in part as a result of state bans. For example, in 2011, range manufacturers
stopped making gas ranges with mercury flame sensors, and communication radio
manufacturers ceased making radios with mercury switches. Mercury thermometers
and thermostats are close to being phased out nationwide.
States recognize there are some uses of mercury in products that cannot be avoided
and have a formal process for applying for an exemption. Most states require the ap-
plicant to demonstrate that the mercury product or component is more beneficial to
human health and the environment than mercury-free alternatives or that technically
feasible mercury-free alternatives do not exist at a reasonable cost. Typically, manu-
facturers or a trade association representing manufacturers, apply for the exemption.
In addition, there must be a system to collect the mercury-containing product at the
end of its useful life. States that have provisions in their laws for issuing exemptions
are California, Connecticut, Illinois, Louisiana, Maine, Massachusetts, New Hamp-
shire, New York, Rhode Island, Wisconsin, and Vermont. IMERC provides technical
assistance and facilitates the review of exemption applications in these states. Three
states (California, Maine, and Rhode Island) require payment of fees to review the ex-
emption application. Examples of exemptions granted include mercury compounds
used in testing and laboratories, pressure transducers, and semi-conductor test equip-
ment. At this time, there are no technically feasible alternatives for these three product
categories.
Specific exemptions are listed in the laws of 20 states (California, Connecticut, Illinois,
Indiana, Iowa, Louisiana, Maine, Maryland, Massachusetts, Michigan, Minnesota,
New Hampshire, New York, North Carolina, Ohio, Oregon, Rhode Island, Vermont,
Washington, and Wisconsin). The two most common exemptions are for button cell
batteries, and mercury-containing products required by federal law or federal contract.
Some states also have exemptions that are fairly narrow in scope. For instance, Con-
necticut specifically exempts from their laws products that contain mercury containing
lamps for backlighting that are not easily removed by a purchaser.
Page 205
200
Third Compendium of States’ Mercury Activities — Part I: National Overview
200
Third Compendium of States’ Mercury Activities — Part III: Appendices
This appendix includes the following materials:
2011 Compendium Survey Letter
2011 Survey Supplemental Instructions
2011 Survey Questionnaire
Summary Results: 2011 Survey
Appendix: 2011Survey Documents
Page 206
201
Third Compendium of States’ Mercury Activities — Part I: National Overview
201
Third Compendium of States’ Mercury Activities — Part III: Appendices
BLANK PAGE
Page 207
QUICKSILVER CAUCUS … QUICKSILVER CAUCUS … QUICKSILVER CAUCUS… QUICKSILVER
CAUCUS … QUICKSILVER CAUCUS QUICKSILVER CAUCUS … QUICKSILVER CAUCUS …
QUICKSILVER CAUCUS … QUICKSILVER CAUCUS … QUICKSILVER CAUCUS… QUICKSILVER
CAUCUS … QUICKSILVER CAUCUS QUICKSILVER CAUCUS … QUICKSILVER CAUCUS …
September 30, 2011
Dear Commissioner:
We are writing to request your assistance on an important effort by the Quicksilver Caucus (QSC) to complete a 2011 Compendium of State Mercury Activities. The
Compendium will be based on information collected through an electronic survey and will provide a valuable source of information for ongoing state initiatives, national efforts by the United States Environmental Protection Agency (US EPA) and the current negotiations on a global mercury agreement through the United Nations Environment Program. This Compendium will also serve to highlight state leadership related to the mercury issue and is an important deliverable under the current QSC work plan.
As you may know the QSC is a coalition of state environmental association1 leaders, coordinated through the Environmental Council of States (ECOS), working to reduce mercury pollution in all environmental media. Active participation by many states in the QSC has been critical to our group’s effective collaboration to develop and implement approaches to reduce sources of mercury pollution, share information, leverage state expertise, build state capacity and provide input to the US EPA, United States State Department, researchers and other groups.
The 2011 Compendium of State Mercury Activities will update prior Compendium reports completed in 2001 and 2005 to reflect the significant progress the states have made addressing mercury in the environment. We need your help to complete this project. Specifically, the QSC asks that you and your staff complete the survey of your state’s efforts to manage mercury at the following web address https://www.surveymk.com/s/2011StateMercurySurvey. (See Enclosure A for a paper version.) The final Compendium report will present an aggregated summary of all responses received as well as individual state summaries based on the survey responses.
The questions in the survey build upon those addressed in prior Compendium reports and were developed by the QSC Compendium Team, coordinated by ECOS, with extensive state input. Information is being requested on mercury pollution sources and control efforts, monitoring, state total maximum daily load (TMDLs) activities for mercury, outreach, pollution prevention and recycling. Additionally, in order to address individual state programs that may not have been fully covered in the survey, as well as to better showcase these efforts, each state is encouraged to submit an optional, brief summary of key state mercury program activities and accomplishments
1 QSC member organizations include the Environmental Council of the States (ECOS), the Association of State and
Territorial Solid Waste Management Officials (ASTSWMO), the National Association of Clean Air Agencies
(NACAA), the Association of Clean Water Administrators (ACWA), the Association of State Drinking Water
Administrators (ASDWA) and the National Pollution Prevention Roundtable (NPPR).
The Association of State Drinking Water Administrators; The Association of Clean Water Administrators; The Association of State and Territorial Solid Waste Management Officials; The Environmental Council of the States;
The National Association of Clean Air Agencies; The National Pollution Prevention Roundtable
Page 208
for inclusion in the Compendium. (See Enclosure B: Information and Survey Instructions Section V Supplemental.)
We ask that you complete and submit the survey and optional state summary by Monday, October 31, 2011. The survey Instructions for completing and submitting the survey and state summaries are included in Enclosure A. The QSC Compendium Team will also be available to address questions and provide technical assistance regarding the survey through weekly teleconference sessions. Scheduling and access information for these sessions is included in Enclosure A. The QSC anticipates completing the Compendium report in early 2012.
It would also be very helpful if you could confirm your Agency’s intention to participate in this survey by October 11, 2011 as well as either confirming (See Enclosure B for list of current contacts. ) or identifying an individual to serve as the primary contact to work with the QSC Compendium Team. This individual will also be listed as the state
contact in the final Compendium report. Please send this information to Mary Blakeslee ([email protected] ).
Thank you for your time and effort on this! Should you have questions please do not hesitate to contact us. Sincerely,
C. Mark Smith PhD, MS Chair, Quicksilver Caucus
Deputy Director, Office of Research and Standards Massachusetts Department of Environmental Protection [email protected] 617-292-5509
Peggy Harris, PE
Chair, Quicksilver Caucus Compendium Team Chief, Intergovernmental Policy Office of Policy California Department of Toxic Substances Control [email protected] 916- 324-7663
cc: QSC Members
State Compendium Contacts Enclosures
A. Paper Version of 2011 Survey B. Supplemental Information and Survey Instructions C. List of Primary Contacts for 2011 Compendium Survey
Page 209
Page 1
2011 Compendium of State Mercury Activities Survey2011 Compendium of State Mercury Activities Survey2011 Compendium of State Mercury Activities Survey2011 Compendium of State Mercury Activities Survey
BACKGROUND The Quicksilver Caucus (QSC) is a coalition of state environmental association leaders working to reduce mercury pollution in all environmental media. QSC member organizations include the Environmental Council of the States (ECOS), the Association of State and Territorial Solid Waste Management Officials (ASTSWMO), the National Association of Clean Air Agencies (NACAA), the Association of Clean Water Administrators (ACWA), the Association of State Drinking Water Administrators (ASDWA) and the National Pollution Prevention Roundtable (NPPR). Active participation by many states in the QSC has been critical to our group’s effective collaboration to develop and implement approaches to reduce sources of mercury pollution, share information, leverage state expertise, build state capacity, and to provide input to the United States Environmental Protection Agency (US EPA), US State Department, researchers and other groups. In 2000 the QSC conducted its first survey and was able to document the nature and extent of mercury activities in 26 states. In 2005, the QSC conducted its second survey and was able to document the nature and extent of mercury activities in 45 states. The primary purpose of both these efforts was to create a document that shared and highlighted voluntary and regulatory approaches states were taking to address mercury in the environment. PURPOSE OF 2011 SURVEY is to create an updated document that shares and highlights voluntary and regulatory approaches states have taken to address mercury in the environment since 2005. The 2011 Compendium of State Mercury Activities will highlight state leadership and successes on the mercury issue and is an important deliverable under the current QSC work plan. It will also provide an important source of information for ongoing state initiatives, national efforts by US EPA and the current negotiations on a global mercury agreement through the United Nations Environment Program. The document will present an aggregated summary of all responses received as well as individual state summaries based on the survey.
PLEASE NOTE – There can only be ONE electronic submission per state.
Supplemental Information 1. PRE SURVEY ACTION – the person receiving the survey documents should immediately send an email with the
name, email address, and phone number of the State’s Primary Contact to: Mary Blakeslee ([email protected] ).
2. TECHNICAL ASSISTANCE CONFERENCE CALLS– The QSC Compendium Team will be available to answer questions about the survey if needed on Wednesday mornings during October. If states have questions, they should follow the schedule below:
l On Tuesday, October 4, October 11, October 11, October 18, and October 25 – email Mary Blakeslee ([email protected] ) no later than 12:00 Noon (EDT). Please note if Mary does not receive any emails there will be no call on Wednesday.
l On Wednesday, October 5, October 12, October 19, and October 26 – Please join CTeam Conference Call 11:30 AM (EDT) – Number and Code are 8882055513 and 756558#
Introduction to the 2011 Survey of State Mercury Activities
Supplemental Information and Instructions for Completing the 2011 Survey ...
Supplemental Information and Instructions for Completing the 2011 Survey ...
Page 210
Page 2
2011 Compendium of State Mercury Activities Survey2011 Compendium of State Mercury Activities Survey2011 Compendium of State Mercury Activities Survey2011 Compendium of State Mercury Activities Survey
General Instructions and Additional Information Here is some additional information you should know so that you can complete the webbased Quicksilver Caucus Mercury Survey.
GENERAL INSTRUCTIONS
1. PLEASE NOTE There can only be ONE electronic submission per state. 2. REMEMBER
l DO NOT press DONE until entire survey is completed, reviewed, and edited. l Once you press DONE, then you will not be able to access the electronic survey form again. l Please do your best to fill out every question but if it is not possible to answer a question you may leave it
blank.
Key Roles and Responsibilities PRIMARY CONTACT Each state has or will designate an individual to work with the Quicksilver Caucus Compendium Team throughout the completion of the survey and final review of the submitted data. This individual will:
1. Coordinate collection of survey information from participants within his or her state. 2. Communicate with the QSC Compendium Team on questions or issues. 3. Complete and submit A SINGLE electronic survey for the state. 4. Review and correct information on a PDF copy post submission. 5. If questions arise in completing the survey make sure to contact Mary Blakeslee ([email protected] ) by noon
(EDT) on Tuesdays and participate in the conference call with the Compendium Team on Wednesdays at 11:30 (EDT)
PARTICIPANTS All state staff working with the Primary Contact to provide data and information about the state’s mercury activities. These individuals will use a PDF document to submit responses to the questions to the Primary Contact. The Primary Contact will enter the data into the electronic tool and then submit it.
FORMAT for entering website addresses on paper or electronic version enter http://www.mercury activities.gov/other designation/other designation.htm
Primary Contact for 2011 Compendium of State Mercury Activities Survey
Page 211
Page 3
2011 Compendium of State Mercury Activities Survey2011 Compendium of State Mercury Activities Survey2011 Compendium of State Mercury Activities Survey2011 Compendium of State Mercury Activities Survey1. Please provide the contact and organization information for the person serving as
your state's primary contact for the 2011 Compendium of State Mercury Activities Survey.
The questions are seeking information to update the status of State Mercury Strategies or Plans.
2. Please indicate the status of mercury reduction plans or strategies in your state. (Select one.)
3. Does your state participate in a regional or multistate or binational initiative to address mercury pollution?
4. If your state participates in a regional or multistate or binational initiative, please provide a web address (if one exists) that provides information about this initiative.
The questions are seeking information on the effectiveness of regulatory and nonregulatory tools or approaches; the challenges facing states; an assessment of the likelihood states will address emerging issues; and the importance of state/federal coordination in several areas. The questions in this section should be answered by the Primary Contact or someone with Department/Agencywide knowledge of mercury activities.
*
Name
Email address
Phone number
State name
Department or Agency name
Program (Air, Water, Hazardous Waste, Solid Waste, Pollution Prevention, Public Health, Other Specify)
State Strategies or Plans
State Perspectives
Mercury reduction plan or strategy in place
nmlkj
Mercury reduction plan or strategy under development
nmlkj
Intend to develop mercury reduction plan or strategy in the
future
nmlkj
No mercury reduction plan or strategy exists or is planned
nmlkj
Yes
nmlkj No
nmlkj
Page 212
Page 4
2011 Compendium of State Mercury Activities Survey2011 Compendium of State Mercury Activities Survey2011 Compendium of State Mercury Activities Survey2011 Compendium of State Mercury Activities Survey5. Please identify the importance of each approach or activity listed below for the reduction or management of mercury in your state. (Select one item per row.)
6. Please identify the significance of each item listed below as a challenge to mercury reduction or management in your state. (Please select one item per row.)
7. If selected "other" to Q6 "item posing a challenge", specify here.
The questions are seeking information to let other states know about the research activities in your state.
8. Does your state currently conduct or has your state recently completed, any research/studies related to mercury?
Very Important Important Not Important Don't Know Don't Use
State and federal coordination
nmlkj nmlkj nmlkj nmlkj nmlkj
State to state information exchange
nmlkj nmlkj nmlkj nmlkj nmlkj
Coordinated efforts between media programs (such as air and water)
nmlkj nmlkj nmlkj nmlkj nmlkj
Very Significant Significant Not Significant Don't Know
Lack of legislative or regulatory mandate
nmlkj nmlkj nmlkj nmlkj
Lack of state human resources
nmlkj nmlkj nmlkj nmlkj
Lack of technical expertise or equipment
nmlkj nmlkj nmlkj nmlkj
Lack of US EPA financial or technical support to states
nmlkj nmlkj nmlkj nmlkj
Lack of federal and state coordination
nmlkj nmlkj nmlkj nmlkj
Lack of long term funding nmlkj nmlkj nmlkj nmlkj
Other (Please specify in Q7)
nmlkj nmlkj nmlkj nmlkj
Research Activities
Yes
nmlkj No
nmlkj
Page 213
Page 5
2011 Compendium of State Mercury Activities Survey2011 Compendium of State Mercury Activities Survey2011 Compendium of State Mercury Activities Survey2011 Compendium of State Mercury Activities Survey9. If you answered "yes" to Q8 "research activities", provide the address for a website that describes these activities or briefly describe here.
EXAMPLE FORMAT for entering website addresses on paper or electronic version enter is http://www.mercury activities.gov/other designation/other designation.htm
The questions are seeking information to let other states know about selected outreach activities in your state.
10. Does your state have a main webpage related to mercury?
11. If you answered "yes" to Q10 "main webpage", please provide an address for the website(s) here.
12. Does your state collaborate with the medical community on the following: (Select all that apply.)
13. If you selected "other" in Q12 "collaboration with medical community", briefly describe here.
The questions are seeking information to let other states know about the mercury monitoring activities in your state.
Outreach Activities
Main Webpage Address
Additional Webpage Address
Monitoring Activities
Yes
nmlkj No
nmlkj
Fish consumption advisories
gfedc
Pollution prevention
gfedc
Dental issues
gfedc
Cultural/ritualistic uses
gfedc
Waste management requirements
gfedc
None
gfedc
Other (Please specify in Q13)
gfedc
Page 214
Page 6
2011 Compendium of State Mercury Activities Survey2011 Compendium of State Mercury Activities Survey2011 Compendium of State Mercury Activities Survey2011 Compendium of State Mercury Activities Survey14. Does your state conduct mercury monitoring on any of the categories below? (Select all that apply.)
15. If you indicated that your state conducts "fish tissue monitoring" in Q14, identify the purpose(s) of your state's program. (Select all that apply.)
16. If you selected "other" in Q15, please describe here.
17. What types of fish consumption advisories for mercury does your state have? (Please select all that apply.)
The questions are seeking information to let other states know about the TMDL activities in your state and create a summary of state TMDL programs and activities.
18. Does your state have any US EPAapproved TMDLs for mercury? (Select all that apply.)
Total Maximum Daily Load (TMDL) Activities
Air emissions from stacks
gfedc
Ambient air
gfedc
Atmospheric deposition (other than NADP participation)
gfedc
Indoor air (for the purposes of evaluating spill cleanup)
gfedc
Wastewater effluent
gfedc
Wastewater sludge
gfedc
Water column
gfedc
Waterbody sediment
gfedc
Fish tissue
gfedc
Wildlife
gfedc
Landfill
gfedc
None
gfedc
Determine need for establishing, revising, or removing fish
consumption advisories
gfedc
Evaluate long term trends
gfedc
Evaluate changes in fish tissue mercury as a result of
implementing mercury reduction programs
gfedc
Other (Please briefly describe in Q16)
gfedc
Statewide freshwater advisories
gfedc
Statewide coastal advisories
gfedc
Waterbodyspecific advisories
gfedc
No
gfedc
Yes, Waterbodyspecific
gfedc
Yes, Statewide
gfedc
Yes, Multistate
gfedc
Yes, Watershed or basin
gfedc
Page 215
Page 7
2011 Compendium of State Mercury Activities Survey2011 Compendium of State Mercury Activities Survey2011 Compendium of State Mercury Activities Survey2011 Compendium of State Mercury Activities Survey19. Please specify the primary sources of mercury addressed in your state's TMDLs. (Select all that apply.)
20. If your state has not developed a mercury TMDL, are you in the process of or do you have plans to develop one?
21. Has your state pursued a watershed management plan in lieu of a TMDL to address atmospheric deposition of mercury?
22. Does your state take a multimedia approach when developing mercury TMDLs or watershed plans?
The questions are seeking information to let other states know about the dental activities in your state and to create a national summary of state programs and activities.
Dental Activities
Atmospheric deposition
gfedc
Legacy sources
gfedc
Wastewater treatment plant discharges
gfedc
Stormwater discharges
gfedc
Active mining
gfedc
Solid or hazardous waste sites
gfedc
No
gfedc
Yes, Waterbodyspecific
gfedc
Yes, Statewide
gfedc
Yes, Multistate
gfedc
Yes, Watershed or basin
gfedc
Yes
nmlkj No
nmlkj
Yes
nmlkj No
nmlkj
Page 216
Page 8
2011 Compendium of State Mercury Activities Survey2011 Compendium of State Mercury Activities Survey2011 Compendium of State Mercury Activities Survey2011 Compendium of State Mercury Activities Survey23. Please describe whether your state's program for managing dental mercury is mandatory, voluntary, or both.
PRIMARY CONTACTS select mandatory or voluntary or both for each row from the dropdown menu.
STATE PARTICIPANTS using a PDF document, enter M for mandatory, V for voluntary, or B for both in each row.
24. Does your state allow dentists to use collection tanks instead of separators to capture amalgam waste?
25. Provide your best estimate of the percentage of dentists in your state that have installed amalgam separators or collection tanks to collect mercury. (Please select one.)
26. Are there POTWs in your state that have requirements beyond the state's?
State Program Type
Statewide program to address dental mercury
6
State requires or recommends dentists install amalgam separators
6
State requires or recommends use of American Dental Association's (ADA) best management practices
6
State requires or recommends best management practices that are different from ADA
6
State requires or recommends installation of amalgam separators at dental offices on septic systems
6
Yes
nmlkj No
nmlkj
01 to 20%
nmlkj
21 to 40%
nmlkj
41 to 60%
nmlkj
61 to 80%
nmlkj
81 to 100%
nmlkj
Unknown
nmlkj
Yes
nmlkj No
nmlkj
Page 217
Page 9
2011 Compendium of State Mercury Activities Survey2011 Compendium of State Mercury Activities Survey2011 Compendium of State Mercury Activities Survey2011 Compendium of State Mercury Activities Survey27. Please indicate the significance of the following activities in promoting proper management of dental amalgam in your state.
28. Does your state ban any mercury containing products based on the quantity or concentration (e.g., ppm) of mercury in products, rather than just the presence of mercury in the product?
Very Signifcant Significant Not Signficant Don't Know/Don't Use
Cost assistance for purchasing amalgam separators
nmlkj nmlkj nmlkj nmlkj
State dental association outreach
nmlkj nmlkj nmlkj nmlkj
General mailings and articles
nmlkj nmlkj nmlkj nmlkj
Workshops and/or training nmlkj nmlkj nmlkj nmlkj
Technical assistance visits at dental offices
nmlkj nmlkj nmlkj nmlkj
Compliance visits at dental offices
nmlkj nmlkj nmlkj nmlkj
Amalgam separator removal efficiency review
nmlkj nmlkj nmlkj nmlkj
Mercury Containing Products
Yes
nmlkj No
nmlkj
Page 218
Page 10
2011 Compendium of State Mercury Activities Survey2011 Compendium of State Mercury Activities Survey2011 Compendium of State Mercury Activities Survey2011 Compendium of State Mercury Activities Survey29. Please identify your state's requirements for the mercury containing product categories listed below.
PRIMARY CONTACTS select options from the dropdown menu.
STATE PARTICIPANTS using a PDF document, enter:
l MP for Mandatory program l VP for Voluntary program l PSM for Plans to start a mandatory program l PSV for Plans to start a voluntary program l NP for No plan
Labeling Requirements Sales/Distribution Ban Household Disposal Ban
Bearings, rings or seals 6 6 6
Cosmetics 6 6 6
Electrodes 6 6 6
Lighting 6 6 6
Measuring devices 6 6 6
Medical devices 6 6 6
Mercury compounds, formulated products, or reagents
6 6 6
Pharmaceuticals 6 6 6
Switches and relays 6 6 6
Thermometers 6 6 6
Thermostats 6 6 6
Toys/novelty items 6 6 6
Wheel balancers/weights 6 6 6
Vaccines 6 6 6
Page 219
Page 11
2011 Compendium of State Mercury Activities Survey2011 Compendium of State Mercury Activities Survey2011 Compendium of State Mercury Activities Survey2011 Compendium of State Mercury Activities Survey30. Please identify your state's requirements for the mercury containing product categories listed below.
PRIMARY CONTACTS select options from the dropdown menu.
STATE PARTICIPANTS using a PDF document, enter under "Collection Program":
l MP for Mandatory program l VP for Voluntary program l PSM for Plans to start a mandatory program l PSV for Plans to start a voluntary program l NP for No plan
Enter Y for yes, or N for no, or PS for plan to establish an incentive program under "Financial Incentive"
Collection Program Financial Incentive
Bearings, rings or seals 6 6
Cosmetics 6 6
Electrodes 6 6
Lighting 6 6
Measuring devices 6 6
Medical devices 6 6
Mercury compounds, formulated products, or reagents
6 6
Pharmaceuticals 6 6
Switches and relays 6 6
Thermometers 6 6
Thermostats 6 6
Toys/novelty items 6 6
Wheel balancers/weights 6 6
Vaccines 6 6
Page 220
Page 12
2011 Compendium of State Mercury Activities Survey2011 Compendium of State Mercury Activities Survey2011 Compendium of State Mercury Activities Survey2011 Compendium of State Mercury Activities Survey31. If your state has a mercury collection program, please indicate who funds the program. (Select all that apply.)
32. Does your state have a process for granting exemptions from product phaseouts or bans/limits?
33. Do you have an inventory of mercury sources/uses in your state? (Select all that apply.)
34. If available, please enter up to three web addresses that summarize mercury inventory data for your state.
EXAMPLE FORMAT for entering website addresses on paper or electronic version enter is http://www.mercury activities.gov/other designation/other designation.htm
InState Mercury Sources
Web Address 1
Web Address 2
Web Address 3
Local governments
gfedc
State
gfedc
Federal
gfedc
Manufacturer
gfedc
Users
gfedc
Waste processors
gfedc
Yes
nmlkj No
nmlkj
None
gfedc
Yes, estimates for amount of mercury released to the
environment from air emission sources
gfedc
Yes, estimates for amount of mercury released to the
environment from water pollution sources
gfedc
Yes, estimates for amount of mercury released to the
environment from solid wastes such as sludge reuse, broken products, etc.
gfedc
Yes, inventory of amount of mercury used in products and
processes
gfedc
Page 221
Page 13
2011 Compendium of State Mercury Activities Survey2011 Compendium of State Mercury Activities Survey2011 Compendium of State Mercury Activities Survey2011 Compendium of State Mercury Activities Survey35. Please provide information about anthropogenic (manmade) sources of AIR mercury releases to the environment in your state.
PRIMARY CONTACTS select Yes or No for each item from the dropdown menu.
STATE PARTICIPANTS using a PDF document, enter Y for yes and N for no in each box in the row.
Source Present in StateDo you have more stringent statewide requirements for this source than US
EPA?
Do you have statewide reqirements for monitoring/measuring releases?
Coalfired electric power plants
6 6 6
Electric arc furnaces 6 6 6
Industrial/commercial boilers
6 6 6
Biomass boilers 6 6 6
Commercial sources (manufacturing/industrial)
6 6 6
Dismantlers, shredders 6 6 6
Foundries 6 6 6
Integrated steel facilities 6 6 6
Sewage sludge incinerators 6 6 6
Chloralkali plants 6 6 6
Hazardous waste incinerators
6 6 6
Municipal solid waste incinerators/combustors
6 6 6
Medical waste incinerators 6 6 6
Gold mining 6 6 6
Other mining 6 6 6
Crematoria 6 6 6
Oil refining 6 6 6
Primary aluminum production
6 6 6
Secondary aluminum production
6 6 6
Cement kilns 6 6 6
Home heating 6 6 6
Mobile sources 6 6 6
Page 222
Page 14
2011 Compendium of State Mercury Activities Survey2011 Compendium of State Mercury Activities Survey2011 Compendium of State Mercury Activities Survey2011 Compendium of State Mercury Activities Survey36. Please provide information about anthropogenic (manmade) sources of WATER AND SOLID WASTERELATED mercury releases to the environment in your state.
PRIMARY CONTACTS select Yes or No for each item from the dropdown menu.
STATE PARTICIPANTS using a PDF document, enter Y for yes and N for no in each box in the row.
37. Have you published mercury release information for your instate sources since 2000?
38. If you answered "yes" to question 37 "published release data", enter address of website where it can be found.
EXAMPLE FORMAT for entering website addresses on paper or electronic version enter is http://www.mercury activities.gov/other designation/other designation.htm
39. BEFORE YOU CLICK ON "DONE"
Have you answered all the questions you plan to answer before submitting the survey and reviewed and edited your answers? If you haven't, select NO and return to the beginning of the document. If yes, proceed to click DONE.
Source Present in StateDo you have more stringent statewide requirements for this source than US
EPA?
Do you have statewide reqirements for monitoring/measuring releases?
Wastewater treatment plant sludge
6 6 6
Wastewater treatment plant effluent
6 6 6
Broken mercurycontaining products & spills
6 6 6
Optional State Summary and Thank You
Yes
nmlkj No
nmlkj
NO, I need to review and revise my answers
nmlkj Yes, I am ready to click
DONE
nmlkj
Page 223
Page 15
2011 Compendium of State Mercury Activities Survey2011 Compendium of State Mercury Activities Survey2011 Compendium of State Mercury Activities Survey2011 Compendium of State Mercury Activities Survey
OPTIONAL STATE SUMMARY
Please see Enclosure B: Supplemental Informaiton and Survey Instructions sent with the September 30, 2011 transmittal letter for instructions on length, style, and formating requirements.
THANK YOU The Quicksilver Caucus thanks you for taking the time to coordinate and complete this survey. Once we have received all responses, we will send a PDF copy of your submission to annotate corrections and changes.
Online HTML Editor
Page 224
Enclosure B
1 of 3
Quicksilver Caucus 2011 Survey of State Mercury
Supplemental Information and Survey Instructions
Supplemental Information
A. PRE SURVEY ACTION – THE PERSON RECEIVING THE SURVEY DOCUMENTS SHOULD
IMMEDIATELY SEND AN EMAIL with the name, email address, and phone number of the State’s
Primary Contact TO: Mary Blakeslee ([email protected] ).
B. TECHNICAL ASSISTANCE CONFERENCE CALLS – The QSC Compendium Team
will be available to answer questions about the survey if needed on Wednesday mornings
during October. If states have questions, they should follow the schedule below:
1. On Tuesday, October 4, October 11, October 11, October 18, and October 25 – email
Mary Blakeslee ([email protected] ) no later than 12:00 Noon (EDT). Please note if Mary
does not receive any emails there will be no call on Wednesday.
2. On Wednesday, October 5, October 12, October 19, and October 26 – Please join C-Team
Conference Call 11:30 AM (EDT) – Number and Code are 888-205-5513 and 756558#
General Instructions and Additional Information
Here is some additional information you should know so that you can complete the web-based
Quicksilver Caucus Mercury Survey.
A. GENERAL INSTRUCTIONS
1. PLEASE NOTE -- There can only be ONE electronic submission per state.
2. REMEMBER
DO NOT press DONE until entire survey is completed, reviewed, and edited.
Once you press DONE, then you will not be able to access the electronic survey form
again.
Please do your best to fill out every question but if it is not possible to answer a
question you may leave it blank.
Key Roles and Responsibilities
A. PRIMARY CONTACT -- Each state has or will designate an individual to work with the
Quicksilver Caucus Compendium Team throughout the completion of the survey and final
review of the submitted data. This individual will:
Coordinate collection of survey information from participants within his or her state.
Communicate with the QSC Compendium Team on questions or issues.
Complete and submit A SINGLE electronic survey for the state.
Review and correct information on a PDF copy post submission.
Page 225
Enclosure B
2 of 3
If questions arise in completing the survey make sure to contact Mary Blakeslee
([email protected] ) by noon (EDT) on Tuesdays and participate in the conference call
with the Compendium Team on Wednesdays at 11:30 (EDT)
B. PARTICIPANTS -- All state staff working with the Primary Contact to provide data and
information about the state’s mercury activities. These individuals will use a PDF document
to submit responses to the questions to the Primary Contact. The Primary Contact will enter
the data into the electronic tool and then submit it.
C. FORMAT for entering website addresses on paper or electronic version enter is
http://www.mercury activities.gov/other designation/other designation.htm
Instructions For Completing The Electronic Submission
A. THE PRIMARY CONTACT:
1. MUST use the same computer to enter data into the electronic survey document
2. CAN edit their electronic survey document until they have pressed DONE to complete
the survey.
3. MUST NOT press DONE until they have completed, reviewed, and edited the entire
survey.
4. MUST NOT clear cookies until the survey is completed and submitted.
5. MUST enter all contact information before completing the rest of the electronic survey.
6. CAN VIEW a summary of their data upon completion of the survey prior to submitting
it and make corrections.
B. THE PARTICIPANTS will complete and submit a PDF document to their Primary
Contact.
Instructions for Optional State Summaries of Mercury Program Activities and
Accomplishments
Although the final Compendium report will include brief summaries of each state’s responses
to the Survey, in order to address initiatives and results that may not have been fully covered in
the survey responses, each state is encouraged to submit a short summary of their key activities
and accomplishments on the mercury issue. This is an optional submission. Summaries will be
included in an Appendix to the final report, should be no more than 1 – 2 pages in length and
should focus on issues, activities and accomplishments not fully captured in the Survey.
Because of limited resources to edit and reformat submissions, the summary MUST follow the
guidelines provided below regarding length, style, formatting and content. Submissions will be
published as submitted and should be made by October 31, 2011 to Mary Blakeslee
([email protected] ).
A. Length, Style and Formatting Requirements
Length: 1 to 2 pages
Page 226
Enclosure B
3 of 3
Title: (your state) Mercury Program Activities and Accomplishment Highlights; 12
point bold
Program: Microsoft Word
Font: Palatino Linotype
Font size: Body text: 12 point; Section headings: 12 point, bold
Spacing: 1.0
Margins: 1 inch all sides
B. CONTENT – The summary should focus on issues, activities and accomplishments not
fully captured in the Compendium Survey. Please organize the information included using
the following section headings, as appropriate.
1. State Mercury Strategies or Plans
2. Mercury Research and Monitoring
3. Mercury Total Maximum Daily Load Activities
4. Outreach and Education Efforts
5. Dental Sector Activities
6. Mercury Containing Products
7. In State Mercury Sources
8. Other Efforts and Issues
Page 227
1 of 30
2011 Compendium of State Mercury Activities
Survey
1. Please provide the contact and organization information for the person serving as your
state's primary contact for the 2011 Compendium of State Mercury Activities Survey.
Response
Percent
Response
Count
Name
100.0% 42
Email address
100.0% 42
Phone number
100.0% 42
State name
100.0% 42
Department or Agency name
100.0% 42
Program (Air, Water, Hazardous
Waste, Solid Waste, Pollution
Prevention, Public Health, Other-
- Specify)
100.0% 42
answered question 42
skipped question 0
Page 228
2 of 30
2. Please indicate the status of mercury reduction plans or strategies in your state. (Select
one.)
Response
Percent
Response
Count
Mercury reduction plan or
strategy in place51.2% 21
Mercury reduction plan or strategy
under development9.8% 4
Intend to develop mercury
reduction plan or strategy in the
future
7.3% 3
No mercury reduction plan or
strategy exists or is planned31.7% 13
answered question 41
skipped question 1
3. Does your state participate in a regional or multistate or binational initiative to address
mercury pollution?
Response
Percent
Response
Count
Yes 65.9% 27
No 34.1% 14
answered question 41
skipped question 1
Page 229
3 of 30
4. If your state participates in a regional or multistate or binational initiative, please provide
a web address (if one exists) that provides information about this initiative.
Response
Count
27
answered question 27
skipped question 15
5. Please identify the importance of each approach or activity listed below for the reduction
or management of mercury in your state. (Select one item per row.)
Very
ImportantImportant
Not
Important
Don't
Know
Don't
Use
Rating
Average
Response
Count
State and federal coordination41.5%
(17)48.8%
(20)2.4% (1) 2.4% (1) 4.9% (2) 1.80 41
State to state information exchange43.9%
(18)
41.5%
(17)4.9% (2) 4.9% (2) 4.9% (2) 1.85 41
Coordinated efforts between media
programs (such as air and water)65.9%
(27)
29.3%
(12)2.4% (1) 0.0% (0) 2.4% (1) 1.44 41
answered question 42
skipped question 0
Page 230
4 of 30
6. Please identify the significance of each item listed below as a challenge to mercury
reduction or management in your state. (Please select one item per row.)
Very
SignificantSignificant
Not
SignificantDon't Know
Rating
Average
Response
Count
Lack of legislative or regulatory
mandate28.2% (11) 38.5% (15) 33.3% (13) 0.0% (0) 2.05 39
Lack of state human resources 30.8% (12) 46.2% (18) 20.5% (8) 2.6% (1) 1.95 39
Lack of technical expertise or
equipment5.1% (2) 35.9% (14) 56.4% (22) 2.6% (1) 2.56 39
Lack of US EPA financial or
technical support to states28.2% (11) 56.4% (22) 15.4% (6) 0.0% (0) 1.87 39
Lack of federal and state
coordination7.7% (3) 41.0% (16) 48.7% (19) 2.6% (1) 2.46 39
Lack of long term funding 57.5% (23) 27.5% (11) 10.0% (4) 5.0% (2) 1.63 40
Other (Please specify in Q-7) 50.0% (4) 25.0% (2) 0.0% (0) 25.0% (2) 2.00 8
answered question 40
skipped question 2
7. If selected "other" to Q-6 "item posing a challenge", specify here.
Response
Count
5
answered question 5
skipped question 37
Page 231
5 of 30
8. Does your state currently conduct or has your state recently completed, any
research/studies related to mercury?
Response
Percent
Response
Count
Yes 69.0% 29
No 31.0% 13
answered question 42
skipped question 0
9. If you answered "yes" to Q-8 "research activities", provide the address for a website
that describes these activities or briefly describe here.
EXAMPLE FORMAT for entering website addresses on paper or electronic version enter is
http://www.mercury activities.gov/other designation/other designation.htm
Response
Count
29
answered question 29
skipped question 13
10. Does your state have a main webpage related to mercury?
Response
Percent
Response
Count
Yes 65.0% 26
No 35.0% 14
answered question 40
skipped question 2
Page 232
6 of 30
11. If you answered "yes" to Q-10 "main webpage", please provide an address for the
website(s) here.
Response
Percent
Response
Count
Main Webpage Address
96.4% 27
Additional Webpage Address
35.7% 10
answered question 28
skipped question 14
12. Does your state collaborate with the medical community on the following: (Select all
that apply.)
Response
Percent
Response
Count
Fish consumption advisories 76.2% 32
Pollution prevention 59.5% 25
Dental issues 66.7% 28
Cultural/ritualistic uses 11.9% 5
Waste management requirements 54.8% 23
None 11.9% 5
Other (Please specify in Q-13) 16.7% 7
answered question 42
skipped question 0
Page 233
7 of 30
13. If you selected "other" in Q-12 "collaboration with medical community", briefly describe
here.
Response
Count
8
answered question 8
skipped question 34
14. Does your state conduct mercury monitoring on any of the categories below? (Select all
that apply.)
Response
Percent
Response
Count
Air emissions from stacks 54.8% 23
Ambient air 31.0% 13
Atmospheric deposition (other than
NADP participation)31.0% 13
Indoor air (for the purposes of
evaluating spill cleanup)38.1% 16
Wastewater effluent 71.4% 30
Wastewater sludge 69.0% 29
Water column 71.4% 30
Waterbody sediment 57.1% 24
Fish tissue 97.6% 41
Wildlife 33.3% 14
Landfill 45.2% 19
None 0.0% 0
answered question 42
skipped question 0
Page 234
8 of 30
15. If you indicated that your state conducts "fish tissue monitoring" in Q-14, identify the
purpose(s) of your state's program. (Select all that apply.)
Response
Percent
Response
Count
Determine need for establishing,
revising, or removing fish
consumption advisories
95.1% 39
Evaluate long term trends 80.5% 33
Evaluate changes in fish tissue
mercury as a result of
implementing mercury reduction
programs
61.0% 25
Other (Please briefly describe in Q-
16)14.6% 6
answered question 41
skipped question 1
16. If you selected "other" in Q-15, please describe here.
Response
Count
7
answered question 7
skipped question 35
Page 235
9 of 30
17. What types of fish consumption advisories for mercury does your state have? (Please
select all that apply.)
Response
Percent
Response
Count
Statewide freshwater advisories 65.9% 27
Statewide coastal advisories 17.1% 7
Waterbody-specific advisories 95.1% 39
answered question 41
skipped question 1
18. Does your state have any US EPA-approved TMDLs for mercury? (Select all that apply.)
Response
Percent
Response
Count
No 52.4% 22
Yes, Waterbody-specific 21.4% 9
Yes, Statewide 4.8% 2
Yes, Multistate 16.7% 7
Yes, Watershed or basin 9.5% 4
answered question 42
skipped question 0
Page 236
10 of 30
19. Please specify the primary sources of mercury addressed in your state's TMDLs.
(Select all that apply.)
Response
Percent
Response
Count
Atmospheric deposition 82.6% 19
Legacy sources 21.7% 5
Wastewater treatment plant
discharges34.8% 8
Stormwater discharges 21.7% 5
Active mining 17.4% 4
Solid or hazardous waste sites 0.0% 0
answered question 23
skipped question 19
20. If your state has not developed a mercury TMDL, are you in the process of or do you
have plans to develop one?
Response
Percent
Response
Count
No 65.4% 17
Yes, Waterbody-specific 7.7% 2
Yes, Statewide 19.2% 5
Yes, Multistate 7.7% 2
Yes, Watershed or basin 0.0% 0
answered question 26
skipped question 16
Page 237
11 of 30
21. Has your state pursued a watershed management plan in lieu of a TMDL to address
atmospheric deposition of mercury?
Response
Percent
Response
Count
Yes 0.0% 0
No 100.0% 40
answered question 40
skipped question 2
22. Does your state take a multimedia approach when developing mercury TMDLs or
watershed plans?
Response
Percent
Response
Count
Yes 69.4% 25
No 30.6% 11
answered question 36
skipped question 6
Page 238
12 of 30
23. Please describe whether your state's program for managing dental mercury is mandatory,
voluntary, or both.
PRIMARY CONTACTS select mandatory or voluntary or both for each row from the dropdown menu.
STATE PARTICIPANTS using a PDF document, enter M for mandatory, V for voluntary, or B for both in
each row.
State Program Type
Mandatory Voluntary BothResponse
Statewide program to address
dental mercury43.3% (13) 56.7% (17) 0.0% (0)
State requires or recommends
dentists install amalgam separators31.4% (11) 65.7% (23) 2.9% (1)
State requires or recommends use
of American Dental Association's
(ADA) best management practices
19.4% (6) 80.6% (25) 0.0% (0)
State requires or recommends best
management practices that are
different from ADA
33.3% (9) 63.0% (17) 3.7% (1)
State requires or recommends
installation of amalgam separators
at dental offices on septic systems
41.4% (12) 58.6% (17) 0.0% (0)
answered question
skipped question
Page 239
13 of 30
24. Does your state allow dentists to use collection tanks instead of separators to capture
amalgam waste?
Response
Percent
Response
Count
Yes 64.7% 22
No 35.3% 12
answered question 34
skipped question 8
25. Provide your best estimate of the percentage of dentists in your state that have
installed amalgam separators or collection tanks to collect mercury. (Please select one.)
Response
Percent
Response
Count
01 to 20% 17.9% 7
21 to 40% 7.7% 3
41 to 60% 0.0% 0
61 to 80% 5.1% 2
81 to 100% 23.1% 9
Unknown 46.2% 18
answered question 39
skipped question 3
Page 240
14 of 30
26. Are there POTWs in your state that have requirements beyond the state's?
Response
Percent
Response
Count
Yes 34.2% 13
No 65.8% 25
answered question 38
skipped question 4
27. Please indicate the significance of the following activities in promoting proper
management of dental amalgam in your state.
Very
SignifcantSignificant
Not
Signficant
Don't
Know/Don't
Use
Rating
Average
Response
Count
Cost assistance for purchasing
amalgam separators5.1% (2) 12.8% (5) 23.1% (9) 59.0% (23) 3.36 39
State dental association outreach 43.6% (17) 25.6% (10) 7.7% (3) 23.1% (9) 2.10 39
General mailings and articles 7.7% (3) 41.0% (16) 15.4% (6) 35.9% (14) 2.79 39
Workshops and/or training 7.7% (3) 41.0% (16) 17.9% (7) 33.3% (13) 2.77 39
Technical assistance visits at
dental offices5.3% (2) 21.1% (8) 23.7% (9) 50.0% (19) 3.18 38
Compliance visits at dental offices 7.7% (3) 30.8% (12) 20.5% (8) 41.0% (16) 2.95 39
Amalgam separator removal
efficiency review10.3% (4) 15.4% (6) 23.1% (9) 51.3% (20) 3.15 39
answered question 39
skipped question 3
Page 241
15 of 30
28. Does your state ban any mercury containing products based on the quantity or
concentration (e.g., ppm) of mercury in products, rather than just the presence of mercury
in the product?
Response
Percent
Response
Count
Yes 20.0% 7
No 80.0% 28
answered question 35
skipped question 7
Page 242
16 of 30
29. Please identify your state's requirements for the mercury containing product categories listed below.
PRIMARY CONTACTS select options from the dropdown menu.
STATE PARTICIPANTS using a PDF document, enter:
MP for Mandatory program
VP for Voluntary program
PSM for Plans to start a mandatory program
PSV for Plans to start a voluntary program
NP for No plan
Labeling Requirements
Mandatory
program
Voluntary
program
Plans for starting
a mandatory
program
Plans for starting
a voluntary
program
Bearings, rings or seals 16.7% (6) 0.0% (0) 0.0% (0) 0.0% (0)
Cosmetics 5.6% (2) 0.0% (0) 0.0% (0) 0.0% (0)
Electrodes 23.7% (9) 0.0% (0) 0.0% (0) 0.0% (0)
Lighting 31.6% (12) 0.0% (0) 0.0% (0) 0.0% (0)
Measuring devices 26.3% (10) 0.0% (0) 0.0% (0) 0.0% (0)
Medical devices 28.9% (11) 0.0% (0) 0.0% (0) 0.0% (0)
Mercury compounds, formulated
products, or reagents21.1% (8) 0.0% (0) 0.0% (0) 0.0% (0)
Pharmaceuticals 8.1% (3) 0.0% (0) 0.0% (0) 0.0% (0)
Switches and relays 29.7% (11) 0.0% (0) 0.0% (0) 0.0% (0)
Thermometers 28.9% (11) 0.0% (0) 0.0% (0) 0.0% (0)
Thermostats 28.9% (11) 0.0% (0) 0.0% (0) 0.0% (0)
Toys/novelty items 16.7% (6) 0.0% (0) 0.0% (0) 0.0% (0)
Wheel balancers/weights 18.9% (7) 0.0% (0) 0.0% (0) 0.0% (0)
Page 243
17 of 30
Vaccines 5.4% (2) 0.0% (0) 0.0% (0) 0.0% (0)
Sales/Distribution Ban
Mandatory
program
Voluntary
program
Plans for starting
a mandatory
program
Plans for starting
a voluntary
program
Bearings, rings or seals 10.8% (4) 0.0% (0) 0.0% (0) 0.0% (0)
Cosmetics 18.4% (7) 0.0% (0) 0.0% (0) 0.0% (0)
Electrodes 10.8% (4) 0.0% (0) 0.0% (0) 0.0% (0)
Lighting 10.8% (4) 0.0% (0) 0.0% (0) 2.7% (1)
Measuring devices 39.5% (15) 2.6% (1) 0.0% (0) 0.0% (0)
Medical devices 34.2% (13) 0.0% (0) 0.0% (0) 0.0% (0)
Mercury compounds, formulated
products, or reagents13.5% (5) 0.0% (0) 0.0% (0) 0.0% (0)
Pharmaceuticals 7.9% (3) 0.0% (0) 0.0% (0) 0.0% (0)
Switches and relays 35.1% (13) 2.7% (1) 0.0% (0) 0.0% (0)
Thermometers 50.0% (19) 2.6% (1) 0.0% (0) 0.0% (0)
Thermostats 47.4% (18) 2.6% (1) 0.0% (0) 0.0% (0)
Toys/novelty items 31.6% (12) 0.0% (0) 0.0% (0) 0.0% (0)
Wheel balancers/weights 18.9% (7) 0.0% (0) 2.7% (1) 0.0% (0)
Vaccines 10.8% (4) 0.0% (0) 0.0% (0) 0.0% (0)
Household Disposal Ban
Mandatory
program
Voluntary
program
Plans for starting
a mandatory
program
Plans for starting
a voluntary
program
Bearings, rings or seals 15.8% (6) 7.9% (3) 0.0% (0) 0.0% (0)
Cosmetics 0.0% (0) 8.1% (3) 0.0% (0) 0.0% (0)
Electrodes 15.8% (6) 10.5% (4) 0.0% (0) 0.0% (0)
Lighting 21.1% (8) 10.5% (4) 0.0% (0) 2.6% (1)
Page 244
18 of 30
Measuring devices 18.4% (7) 13.2% (5) 0.0% (0) 0.0% (0)
Medical devices 18.4% (7) 13.2% (5) 0.0% (0) 0.0% (0)
Mercury compounds, formulated
products, or reagents7.9% (3) 10.5% (4) 0.0% (0) 0.0% (0)
Pharmaceuticals 5.3% (2) 15.8% (6) 0.0% (0) 0.0% (0)
Switches and relays 18.4% (7) 13.2% (5) 0.0% (0) 2.6% (1)
Thermometers 20.5% (8) 15.4% (6) 0.0% (0) 2.6% (1)
Thermostats 21.1% (8) 13.2% (5) 0.0% (0) 2.6% (1)
Toys/novelty items 15.8% (6) 10.5% (4) 0.0% (0) 0.0% (0)
Wheel balancers/weights 18.4% (7) 10.5% (4) 0.0% (0) 2.6% (1)
Vaccines 0.0% (0) 10.8% (4) 0.0% (0) 0.0% (0)
Page 245
19 of 30
30. Please identify your state's requirements for the mercury containing product categories listed below.
PRIMARY CONTACTS select options from the dropdown menu.
STATE PARTICIPANTS using a PDF document, enter under "Collection Program":
MP for Mandatory program
VP for Voluntary program
PSM for Plans to start a mandatory program
PSV for Plans to start a voluntary program
NP for No plan
Enter Y for yes, or N for no, or PS for plan to establish an incentive program under "Financial Incentive"
Collection Program
Manditory
program
Voluntary
program
Plans to start a
mandatory
program
Plans to start a
voluntary
program
Bearings, rings or seals 10.5% (4) 13.2% (5) 0.0% (0) 0.0% (0)
Cosmetics 0.0% (0) 10.5% (4) 0.0% (0) 0.0% (0)
Electrodes 7.9% (3) 13.2% (5) 0.0% (0) 0.0% (0)
Lighting 15.4% (6) 46.2% (18) 0.0% (0) 0.0% (0)
Measuring devices 13.2% (5) 36.8% (14) 0.0% (0) 0.0% (0)
Medical devices 13.2% (5) 31.6% (12) 0.0% (0) 0.0% (0)
Mercury compounds, formulated
products, or reagents0.0% (0) 23.7% (9) 0.0% (0) 0.0% (0)
Pharmaceuticals 0.0% (0) 39.5% (15) 0.0% (0) 2.6% (1)
Switches and relays 30.0% (12) 42.5% (17) 0.0% (0) 0.0% (0)
Thermometers 13.2% (5) 50.0% (19) 0.0% (0) 0.0% (0)
Thermostats 28.9% (11) 42.1% (16) 2.6% (1) 0.0% (0)
Toys/novelty items 5.3% (2) 23.7% (9) 0.0% (0) 0.0% (0)
Page 246
20 of 30
Wheel balancers/weights 10.5% (4) 23.7% (9) 0.0% (0) 0.0% (0)
Vaccines 0.0% (0) 18.4% (7) 0.0% (0) 2.6% (1)
Financial Incentive
Yes NoPlans to establish financial
Bearings, rings or seals 0.0% (0) 100.0% (38)
Cosmetics 0.0% (0) 100.0% (38)
Electrodes 0.0% (0) 100.0% (38)
Lighting 7.7% (3) 89.7% (35)
Measuring devices 0.0% (0) 100.0% (38)
Medical devices 2.6% (1) 97.4% (37)
Mercury compounds, formulated
products, or reagents2.6% (1) 97.4% (37)
Pharmaceuticals 0.0% (0) 100.0% (38)
Switches and relays 25.0% (10) 75.0% (30)
Thermometers 5.3% (2) 94.7% (36)
Thermostats 10.5% (4) 78.9% (30)
Toys/novelty items 0.0% (0) 100.0% (38)
Wheel balancers/weights 0.0% (0) 100.0% (38)
Vaccines 0.0% (0) 100.0% (37)
Page 247
21 of 30
31. If your state has a mercury collection program, please indicate who funds the program.
(Select all that apply.)
Response
Percent
Response
Count
Local governments 48.6% 18
State 75.7% 28
Federal 27.0% 10
Manufacturer 51.4% 19
Users 21.6% 8
Waste processors 16.2% 6
answered question 37
skipped question 5
32. Does your state have a process for granting exemptions from product phase-outs or
bans/limits?
Response
Percent
Response
Count
Yes 40.5% 15
No 59.5% 22
answered question 37
skipped question 5
Page 248
22 of 30
33. Do you have an inventory of mercury sources/uses in your state? (Select all that apply.)
Response
Percent
Response
Count
None 17.1% 7
Yes, estimates for amount of
mercury released to the
environment from air emission
sources
80.5% 33
Yes, estimates for amount of
mercury released to the
environment from water pollution
sources
31.7% 13
Yes, estimates for amount of
mercury released to the
environment from solid wastes
such as sludge reuse, broken
products, etc.
17.1% 7
Yes, inventory of amount of
mercury used in products and
processes
14.6% 6
answered question 41
skipped question 1
Page 249
23 of 30
34. If available, please enter up to three web addresses that summarize mercury inventory
data for your state.
EXAMPLE FORMAT for entering website addresses on paper or electronic version enter is
http://www.mercury activities.gov/other designation/other designation.htm
Response
Percent
Response
Count
Web Address 1
100.0% 18
Web Address 2
27.8% 5
Web Address 3
11.1% 2
answered question 18
skipped question 24
Page 250
24 of 30
35. Please provide information about anthropogenic (manmade) sources of AIR mercury
releases to the environment in your state.
PRIMARY CONTACTS select Yes or No for each item from the dropdown menu.
STATE PARTICIPANTS using a PDF document, enter Y for yes and N for no in each box in the
row.
Source Present in State
Yes NoResponse
Count
Coal-fired electric power plants 89.7% (35) 10.3% (4) 39
Electric arc furnaces 64.1% (25) 35.9% (14) 39
Industrial/commercial boilers 100.0% (39) 0.0% (0) 39
Biomass boilers 84.6% (33) 15.4% (6) 39
Commercial sources
(manufacturing/industrial)87.2% (34) 12.8% (5) 39
Dismantlers, shredders 84.2% (32) 15.8% (6) 38
Foundries 69.2% (27) 30.8% (12) 39
Integrated steel facilities 30.8% (12) 69.2% (27) 39
Sewage sludge incinerators 53.8% (21) 46.2% (18) 39
Chlor-alkali plants 12.8% (5) 87.2% (34) 39
Hazardous waste incinerators 43.6% (17) 56.4% (22) 39
Municipal solid waste
incinerators/combustors64.1% (25) 35.9% (14) 39
Medical waste incinerators 51.3% (20) 48.7% (19) 39
Gold mining 23.1% (9) 76.9% (30) 39
Other mining 69.2% (27) 30.8% (12) 39
Crematoria 97.4% (38) 2.6% (1) 39
Page 251
25 of 30
Oil refining 53.8% (21) 46.2% (18) 39
Primary aluminum production 23.1% (9) 76.9% (30) 39
Secondary aluminum production 56.4% (22) 43.6% (17) 39
Cement kilns 66.7% (26) 33.3% (13) 39
Home heating 89.5% (34) 10.5% (4) 38
Mobile sources 86.8% (33) 13.2% (5) 38
Do you have more stringent statewide requirements for this source than US EPA?
Yes NoResponse
Count
Coal-fired electric power plants 38.5% (15) 61.5% (24) 39
Electric arc furnaces 14.3% (5) 85.7% (30) 35
Industrial/commercial boilers 15.8% (6) 84.2% (32) 38
Biomass boilers 13.5% (5) 86.5% (32) 37
Commercial sources
(manufacturing/industrial)16.7% (6) 83.3% (30) 36
Dismantlers, shredders 18.9% (7) 81.1% (30) 37
Foundries 14.3% (5) 85.7% (30) 35
Integrated steel facilities 5.9% (2) 94.1% (32) 34
Sewage sludge incinerators 18.9% (7) 81.1% (30) 37
Chlor-alkali plants 3.1% (1) 96.9% (31) 32
Hazardous waste incinerators 5.7% (2) 94.3% (33) 35
Municipal solid waste
incinerators/combustors25.0% (9) 75.0% (27) 36
Medical waste incinerators 19.4% (7) 80.6% (29) 36
Gold mining 6.1% (2) 93.9% (31) 33
Other mining 8.3% (3) 91.7% (33) 36
Crematoria 10.3% (4) 89.7% (35) 39
Page 252
26 of 30
Oil refining 5.7% (2) 94.3% (33) 35
Primary aluminum production 12.1% (4) 87.9% (29) 33
Secondary aluminum production 9.1% (3) 90.9% (30) 33
Cement kilns 11.1% (4) 88.9% (32) 36
Home heating 2.7% (1) 97.3% (36) 37
Mobile sources 5.3% (2) 94.7% (36) 38
Do you have statewide reqirements for monitoring/measuring releases?
Yes NoResponse
Count
Coal-fired electric power plants 43.6% (17) 56.4% (22) 39
Electric arc furnaces 8.6% (3) 91.4% (32) 35
Industrial/commercial boilers 15.4% (6) 84.6% (33) 39
Biomass boilers 12.8% (5) 87.2% (34) 39
Commercial sources
(manufacturing/industrial)15.8% (6) 84.2% (32) 38
Dismantlers, shredders 11.1% (4) 88.9% (32) 36
Foundries 11.4% (4) 88.6% (31) 35
Integrated steel facilities 8.8% (3) 91.2% (31) 34
Sewage sludge incinerators 23.7% (9) 76.3% (29) 38
Chlor-alkali plants 3.1% (1) 96.9% (31) 32
Hazardous waste incinerators 11.4% (4) 88.6% (31) 35
Municipal solid waste
incinerators/combustors30.6% (11) 69.4% (25) 36
Medical waste incinerators 27.0% (10) 73.0% (27) 37
Gold mining 8.8% (3) 91.2% (31) 34
Other mining 11.1% (4) 88.9% (32) 36
Page 253
27 of 30
Crematoria 10.3% (4) 89.7% (35) 39
Oil refining 5.6% (2) 94.4% (34) 36
Primary aluminum production 5.9% (2) 94.1% (32) 34
Secondary aluminum production 5.9% (2) 94.1% (32) 34
Cement kilns 19.4% (7) 80.6% (29) 36
Home heating 2.6% (1) 97.4% (38) 39
Mobile sources 2.6% (1) 97.4% (38) 39
answered question 40
skipped question 2
Page 254
28 of 30
36. Please provide information about anthropogenic (manmade) sources of WATER AND
SOLID WASTE-RELATED mercury releases to the environment in your state.
PRIMARY CONTACTS select Yes or No for each item from the dropdown menu.
STATE PARTICIPANTS using a PDF document, enter Y for yes and N for no in each box in the
row.
Source Present in State
Yes NoResponse
Count
Wastewater treatment plant sludge 97.4% (38) 2.6% (1) 39
Wastewater treatment plant
effluent92.5% (37) 7.5% (3) 40
Broken mercury-containing
products & spills94.9% (37) 5.1% (2) 39
Do you have more stringent statewide requirements for this source than US EPA?
Yes NoResponse
Count
Wastewater treatment plant sludge 13.2% (5) 86.8% (33) 38
Wastewater treatment plant
effluent13.2% (5) 86.8% (33) 38
Broken mercury-containing
products & spills8.3% (3) 91.7% (33) 36
Do you have statewide reqirements for monitoring/measuring releases?
Yes NoResponse
Count
Wastewater treatment plant sludge 44.7% (17) 55.3% (21) 38
Wastewater treatment plant
effluent53.8% (21) 46.2% (18) 39
Broken mercury-containing
products & spills22.2% (8) 77.8% (28) 36
Page 255
29 of 30
answered question 41
skipped question 1
37. Have you published mercury release information for your instate sources since 2000?
Response
Percent
Response
Count
Yes 40.0% 16
No 60.0% 24
answered question 40
skipped question 2
38. If you answered "yes" to question 37 "published release data", enter address of
website where it can be found.
EXAMPLE FORMAT for entering website addresses on paper or electronic version enter is
http://www.mercury activities.gov/other designation/other designation.htm
Response
Count
13
answered question 13
skipped question 29
Page 256
30 of 30
39. BEFORE YOU CLICK ON "DONE"
Have you answered all the questions you plan to answer before submitting the survey and
reviewed and edited your answers? If you haven't, select NO and return to the beginning of
the document. If yes, proceed to click DONE.
Response
Percent
Response
Count
NO, I need to review and revise
my answers 0.0% 0
Yes, I am ready to click
DONE 100.0% 40
answered question 40
skipped question 2