59
THIRD QUARTER 2015 MANAGEMENT DISCUSSION AND ANALYSIS OF RESULTS OF OPERATIONS AND FINANCIAL CONDITION November 5, 2015

THIRD QUARTER 2015
MANAGEMENT DISCUSSION
AND ANALYSIS OF RESULTS
OF OPERATIONS AND
FINANCIAL CONDITION
November 5, 2015

Third Quarter 2015 Management’s Discussion and Analysis of Results of Operations and Financial Condition
TABLE OF CONTENTS
1.1.1.1. HighlightsHighlightsHighlightsHighlights ............................................................................................................................................................................................................................................................................................................................................................................................................................................................................................................................................................................................................................................................................................ 1111
2.2.2.2. Introduction and Key AssumptionsIntroduction and Key AssumptionsIntroduction and Key AssumptionsIntroduction and Key Assumptions ............................................................................................................................................................................................................................................................................................................................................................................................................................................................................................................ 3333
3.3.3.3. OverviewOverviewOverviewOverview ................................................................................................................................................................................................................................................................................................................................................................................................................................................................................................................................................................................................................................................................................................ 5555
4.4.4.4. Results of Operations Results of Operations Results of Operations Results of Operations –––– Third Third Third Third Quarter 2015 versus Third Quarter 2014Quarter 2015 versus Third Quarter 2014Quarter 2015 versus Third Quarter 2014Quarter 2015 versus Third Quarter 2014 ........................................................................................................................................................................................................................................ 8888
5.5.5.5. Results of Operations Results of Operations Results of Operations Results of Operations –––– First Nine Months 2015 versus First Nine Months 2014First Nine Months 2015 versus First Nine Months 2014First Nine Months 2015 versus First Nine Months 2014First Nine Months 2015 versus First Nine Months 2014 ................................................................................................................................................................ 21212121
6.6.6.6. FleetFleetFleetFleet .................................................................................................................................................................................................................................................................................................................................................................................................................................................................................................................................................................................................................................................................................................................... 33333333
7.7.7.7. Financial and Capital ManagementFinancial and Capital ManagementFinancial and Capital ManagementFinancial and Capital Management ................................................................................................................................................................................................................................................................................................................................................................................................................................................................................................ 35353535
7.1.7.1.7.1.7.1. LiquidityLiquidityLiquidityLiquidity.................................................................................................................................................................................................................................................................................................................................................................................................................................................................................................................................................................................................................................................... 35353535
7.2.7.2.7.2.7.2. Financial PositionFinancial PositionFinancial PositionFinancial Position .................................................................................................................................................................................................................................................................................................................................................................................................................................................................................................................................................................................... 35353535
7.3.7.3.7.3.7.3. Adjusted Net DebtAdjusted Net DebtAdjusted Net DebtAdjusted Net Debt ............................................................................................................................................................................................................................................................................................................................................................................................................................................................................................................................................................................ 36363636
7.4.7.4.7.4.7.4. Working CapitalWorking CapitalWorking CapitalWorking Capital ............................................................................................................................................................................................................................................................................................................................................................................................................................................................................................................................................................................................ 37373737
7.5.7.5.7.5.7.5. Consolidated Cash Flow MovementsConsolidated Cash Flow MovementsConsolidated Cash Flow MovementsConsolidated Cash Flow Movements ............................................................................................................................................................................................................................................................................................................................................................................................................................................ 38383838
7.6.7.6.7.6.7.6. Capital Expenditures and Related Financing ArrangementsCapital Expenditures and Related Financing ArrangementsCapital Expenditures and Related Financing ArrangementsCapital Expenditures and Related Financing Arrangements ................................................................................................................................................................................................................................................................................ 39393939
7.7.7.7.7.7.7.7. Pension Funding ObligationsPension Funding ObligationsPension Funding ObligationsPension Funding Obligations .................................................................................................................................................................................................................................................................................................................................................................................................................................................................................................... 41414141
7.8.7.8.7.8.7.8. Contractual ObligationsContractual ObligationsContractual ObligationsContractual Obligations .................................................................................................................................................................................................................................................................................................................................................................................................................................................................................................................................... 41414141
7.9.7.9.7.9.7.9. Share InformationShare InformationShare InformationShare Information ................................................................................................................................................................................................................................................................................................................................................................................................................................................................................................................................................................................ 43434343
8.8.8.8. Quarterly Financial DataQuarterly Financial DataQuarterly Financial DataQuarterly Financial Data ........................................................................................................................................................................................................................................................................................................................................................................................................................................................................................................................................................................ 44444444
9.9.9.9. Financial Instruments and Risk ManagementFinancial Instruments and Risk ManagementFinancial Instruments and Risk ManagementFinancial Instruments and Risk Management ............................................................................................................................................................................................................................................................................................................................................................................................................................ 47474747
10.10.10.10. Critical Accounting EstimatesCritical Accounting EstimatesCritical Accounting EstimatesCritical Accounting Estimates .................................................................................................................................................................................................................................................................................................................................................................................................................................................................................................................................... 49494949
11.11.11.11. Accounting PolicAccounting PolicAccounting PolicAccounting Policiesiesiesies ............................................................................................................................................................................................................................................................................................................................................................................................................................................................................................................................................................................................................ 49494949
12.12.12.12. OffOffOffOff----Balance Sheet ArrangementsBalance Sheet ArrangementsBalance Sheet ArrangementsBalance Sheet Arrangements ............................................................................................................................................................................................................................................................................................................................................................................................................................................................................................................ 50505050
13.13.13.13. Related Party TransactionsRelated Party TransactionsRelated Party TransactionsRelated Party Transactions ........................................................................................................................................................................................................................................................................................................................................................................................................................................................................................................................................................ 50505050
14.14.14.14. Risk FactorsRisk FactorsRisk FactorsRisk Factors .................................................................................................................................................................................................................................................................................................................................................................................................................................................................................................................................................................................................................................................................... 50505050
15.15.15.15. Controls and ProceduresControls and ProceduresControls and ProceduresControls and Procedures ........................................................................................................................................................................................................................................................................................................................................................................................................................................................................................................................................................................ 50505050
16.16.16.16. NonNonNonNon----GAAP Financial MeasuresGAAP Financial MeasuresGAAP Financial MeasuresGAAP Financial Measures ............................................................................................................................................................................................................................................................................................................................................................................................................................................................................................................................ 52525252
17.17.17.17. GlossaryGlossaryGlossaryGlossary............................................................................................................................................................................................................................................................................................................................................................................................................................................................................................................................................................................................................................................................................................ 56565656

Third Quarter 2015 Management’s Discussion and Analysis of Results of Operations and Financial Condition
1
1. HIGHLIGHTS
The financial and operating highlights for Air Canada for the periods indicated are as follows.
(Canadian dollars in millions, except where indicated)(Canadian dollars in millions, except where indicated)(Canadian dollars in millions, except where indicated)(Canadian dollars in millions, except where indicated)
ThirdThirdThirdThird QuarterQuarterQuarterQuarter First First First First NineNineNineNine MonthsMonthsMonthsMonths
2015201520152015 2014201420142014 $ Change$ Change$ Change$ Change 2015201520152015 2014201420142014 $ Change$ Change$ Change$ Change
Financial Performance MetricsFinancial Performance MetricsFinancial Performance MetricsFinancial Performance Metrics
Operating revenues 4,023 3,798 225 10,686 10,168 518
Operating income 815 526 289 1,338 709 629
Non-operating expense (378) (203) (175) (914) (504) (410)
Net income 437 323 114 424 205 219
Adjusted net income (1) 734 457 277 1,106 464 642
Operating margin % 20.3% 13.8% 6.5 pp 12.5% 7.0% 5.5 pp
EBITDAR (2) 1,076 749 327 2,109 1,352 757
EBITDAR margin % (2) 26.7% 19.7% 7.0 pp 19.7% 13.3% 6.4 pp
Unrestricted liquidity (3) 3,399 2,802 597 3,399 2,802 597
Net cash flows from operating activities 476 191 285 1,793 921 872
Free cash flow (4) (90) (192) 102 592 (194) 786
Adjusted net debt (5) 5,423 4,623 800 5,423 4,623 800
Return on invested capital (“ROIC”) % (6) 18.0% 11.4% 6.6 pp 18.0% 11.4% 6.6 pp
Diluted earnings per share $ 1.48 $ 1.10 $ 0.38 $ 1.43 $ 0.69 $ 0.74
Adjusted earnings per share – diluted (1) $ 2.50 $ 1.55 $ 0.95 $ 3.77 $ 1.58 $ 2.19
Operating StatisticsOperating StatisticsOperating StatisticsOperating Statistics (7)(7)(7)(7) % Change% Change% Change% Change % Change% Change% Change% Change
Revenue passenger miles (“RPM”) (millions) 20,462 18,565 10.2 52,244 47,526 9.9
Available seat miles (“ASM”) (millions) 23,535 21,299 10.5 62,002 56,486 9.8
Passenger load factor % 86.9% 87.2% (0.2) pp 84.3% 84.1% 0.1 pp
Passenger revenue per RPM ("Yield") (cents) 17.8 18.5 (3.8) 18.0 18.8 (4.3)
Passenger revenue per ASM ("PRASM") (cents) 15.5 16.1 (4.0) 15.2 15.8 (4.1)
Operating revenue per ASM (cents) 17.1 17.8 (3.9) 17.2 18.0 (4.3)
Operating expense per ASM ("CASM") (cents) 13.6 15.4 (11.3) 15.1 16.7 (10.0)
Adjusted CASM (cents) (8) 10.0 10.1 (0.5) 11.0 11.1 (0.5)
Average number of full-time equivalent (“FTE”) employees (thousands) (9)
25.0
24.6
1.6
24.8
24.5
1.2
Aircraft in operating fleet at period-end 372 362 2.8 372 362 2.8
Average fleet utilization (hours per day) 11.0 10.8 2.4 10.3 10.2 0.9
Seats dispatched (thousands) 14,408 13,518 6.6 39,737 37,403 6.2
Aircraft frequencies (thousands) 154 150 3.1 431 420 2.5
Average stage length (miles) (10) 1,634 1,576 3.7 1,560 1,510 3.3
Fuel cost per litre (cents) 61.4 89.7 (31.5) 64.3 91.8 (29.9)
Fuel litres (millions) 1,290 1,200 7.5 3,443 3,221 6.9
Revenue passengers carried (thousands) (11) 11,723 10,979 6.8 31,439 29,337 7.2
Third Quarter 2015 Management’s Discussion and Analysis of Results of Operations and Financial Condition
2
(1) Adjusted net income (loss) and adjusted earnings (loss) per share – diluted are non-GAAP financial measures. Refer to section 16 “Non-GAAP Financial Measures” of this MD&A for additional information.
(2) EBITDAR (earnings before interest, taxes, depreciation, amortization, impairment and aircraft rent) is a non-GAAP financial measure. Refer to section 16 "Non-GAAP Financial Measures" of this MD&A for additional information.
(3) Unrestricted liquidity refers to the sum of cash, cash equivalents, short-term investments and the amount of available credit under Air Canada’s revolving credit facilities. At September 30, 2015, unrestricted liquidity was comprised of cash and short-term investments of $3,116 million and undrawn lines of credit of $283 million. At September 30, 2014, unrestricted liquidity was comprised of cash and short-term investments of $2,528 million and undrawn lines of credit of $274 million.
(4) Free cash flow (cash flows from operating activities less additions to property, equipment and intangible assets) is a non-GAAP financial measure. Refer to section 7.5 “Consolidated Cash Flow Movements” of this MD&A for additional information.
(5) Adjusted net debt (total debt less cash, cash equivalents and short-term investments plus capitalized operating leases) is an additional GAAP financial measure. Refer to section 7.3 “Adjusted Net Debt” of this MD&A for additional information.
(6) Return on invested capital (“ROIC”) is a non-GAAP financial measure. Refer to section 16 “Non-GAAP Financial Measures” of this MD&A for additional information.
(7) Except for the reference to average number of FTE employees, operating statistics in this table include third party carriers (such as Jazz Aviation LP (“Jazz”) and Sky Regional Airlines Inc. (“Sky Regional”)) operating under capacity purchase agreements with Air Canada.
(8) Adjusted CASM is a non-GAAP financial measure. Refer to section 16 “Non-GAAP Financial Measures” of this MD&A for additional information.
(9) Reflects FTE employees at Air Canada. Excludes FTE employees at third party carriers (such as Jazz and Sky Regional) operating under capacity purchase agreements with Air Canada.
(10) Average stage length is calculated by dividing the total number of available seat miles by the total number of seats dispatched.
(11) Revenue passengers are counted on a flight number basis which is consistent with the IATA definition of revenue passengers carried.

Third Quarter 2015 Management’s Discussion and Analysis of Results of Operations and Financial Condition
3
2. INTRODUCTION AND KEY ASSUMPTIONS
In this Management’s Discussion and Analysis of Results of Operations and Financial Condition (“MD&A”), the “Corporation” refers, as the context may require, to Air Canada and/or one or more of Air Canada’s subsidiaries, including its wholly-owned operating subsidiaries, Touram Limited Partnership, doing business as Air Canada Vacations® (“Air Canada Vacations”) and Air Canada rouge LP, doing business as Air Canada rouge® (“Air Canada rouge”). This MD&A provides the reader with a review and analysis, from the perspective of management, of Air Canada’s financial results for the third quarter of 2015. This MD&A should be read in conjunction with Air Canada’s interim unaudited condensed consolidated financial statements and notes for the third quarter of 2015, Air Canada’s 2014 annual audited consolidated financial statements and notes and Air Canada’s 2014 MD&A dated February 11, 2015 (“Air Canada’s 2014 MD&A”). All financial information has been prepared in accordance with generally accepted accounting principles in Canada (“GAAP”), as set out in the CPA Canada Handbook – Accounting (“CPA Handbook”), which incorporates International Financial Reporting Standards (“IFRS”) as issued by the International Accounting Standards Board (“IASB”), except for any financial information specifically denoted otherwise.
Except as otherwise noted, monetary amounts are stated in Canadian dollars. For an explanation of certain terms used in this MD&A, refer to section 17 “Glossary” of this MD&A. Except as otherwise noted or where the context may otherwise require, this MD&A is current as of November 4, 2015.
Air Canada has capacity purchase agreements with Jazz, Sky Regional, Air Georgian Limited (“Air Georgian”) and Exploits Valley Air Services Ltd. (“EVAS”). As of 2015, Air Canada changed the presentation of the expenses related to capacity purchase agreements on its consolidated statement of operations. This change in presentation was adopted to provide an improved presentation of the economic costs associated with regional carrier operations. Prior period amounts were reclassified to conform to the current period presentation. For additional information, refer to Note 2 of Air Canada’s interim unaudited consolidated financial statements for the third quarter of 2015.
Effective January 1, 2015, Air Canada and Jazz amended the terms of their capacity purchase agreement and extended its term through to December 31, 2025. As a result of the amendments, certain costs that were previously capacity purchase agreement fees are now pass-through costs. Other costs that were pass-through costs are now costs directly incurred by Air Canada.
Forward-looking statements are included in this MD&A. See “Caution Regarding Forward-Looking Information” below for a discussion of risks, uncertainties and assumptions relating to these statements. For a description of risks relating to Air Canada, refer to section 18 “Risk factors” of Air Canada’s 2014 MD&A dated February 11, 2015. Air Canada issued a news release dated November 5, 2015 reporting on its results for the third quarter of 2015. This news release is available on Air Canada’s website at www.aircanada.comwww.aircanada.comwww.aircanada.comwww.aircanada.com and on SEDAR’s website at www.sedar.comwww.sedar.comwww.sedar.comwww.sedar.com. For further information on Air Canada’s public disclosures, including Air Canada’s Annual Information Form, consult SEDAR at www.sedar.comwww.sedar.comwww.sedar.comwww.sedar.com.
CAUTION REGARDING FOCAUTION REGARDING FOCAUTION REGARDING FOCAUTION REGARDING FORWARDRWARDRWARDRWARD----LOOKING INFORMATIONLOOKING INFORMATIONLOOKING INFORMATIONLOOKING INFORMATION
Air Canada’s public communications may include written or oral forward-looking statements within the meaning of applicable securities laws. Such statements are included in this MD&A and may be included in other communications, including filings with regulatory authorities and securities regulators. Forward-looking statements may be based on forecasts of future results and estimates of amounts not yet determinable. These statements may involve, but are not limited to, comments relating to strategies, expectations, planned operations or future actions. Forward-looking statements are identified by the use of terms and phrases such as “anticipate”, “believe”, “could”, “estimate”, “expect”, “intend”, “may”, “plan”, “predict”, “project”, “will”, “would”, and similar terms and phrases, including references to assumptions.
Forward-looking statements, by their nature, are based on assumptions, including those described herein and are subject to important risks and uncertainties. Forward-looking statements cannot be relied upon due to, amongst other things, changing external events and general uncertainties of the business. Actual results may differ materially from results indicated in forward-looking statements due to a number of factors, including without limitation, industry, market, credit, economic and geopolitical conditions, currency exchange, the ability to reduce operating costs and secure financing, energy prices, interest rates, competition, employee and labour relations, pension issues, war, terrorist acts, epidemic
Third Quarter 2015 Management’s Discussion and Analysis of Results of Operations and Financial Condition
4
diseases, environmental factors (including weather systems and other natural phenomena and factors arising from man-made sources), insurance issues and costs, changes in demand due to the seasonal nature of the business, supply issues, changes in laws, regulatory developments or proceedings, pending and future litigation and actions by third parties as well as the factors identified throughout this MD&A and, in particular, those identified in section 18 “Risk Factors” of Air Canada’s 2014 MD&A. The forward-looking statements contained in this MD&A represent Air Canada’s expectations as of November 4, 2015 (or as of the date they are otherwise stated to be made), and are subject to change after such date. However, Air Canada disclaims any intention or obligation to update or revise any forward-looking statements whether as a result of new information, future events or otherwise, except as required under applicable securities regulations.
KEY ASSUMPTIONSKEY ASSUMPTIONSKEY ASSUMPTIONSKEY ASSUMPTIONS
Assumptions were made by Air Canada in preparing and making forward-looking statements. As part of its assumptions, Air Canada assumes relatively low Canadian GDP growth for 2015. Air Canada also expects that the Canadian dollar will trade, on average, at C$1.32 per U.S. dollar in the fourth quarter of 2015 and at C$1.28 for the full year 2015 and that the price of jet fuel will average 60 cents per litre for the fourth quarter of 2015 and 63 cents per litre for the full year 2015.
INTELLECTUAL PROPERTINTELLECTUAL PROPERTINTELLECTUAL PROPERTINTELLECTUAL PROPERTYYYY
Air Canada owns or has rights to trademarks, service marks or trade names used in connection with the operation of its business. In addition, Air Canada’s names, logos and website names and addresses are owned or licensed by Air Canada. Air Canada also owns or has the rights to copyrights that protect the content of its products and/or services. Solely for convenience, the trademarks, service marks, trade names and copyrights referred to in this MD&A may be listed without the ©, ® and ™ symbols, but Air Canada will assert, to the fullest extent under applicable law, its rights or the rights of the applicable licensors to these trademarks, service marks, trade names and copyrights.
This MD&A may include trademarks, service marks or trade names of other parties. Air Canada’s use or display of other parties’ trademarks, service marks, trade names or products is not intended to, and does not imply a relationship with, or endorsement or sponsorship of Air Canada by, the trademark, service mark or trade name owners or licensees.

Third Quarter 2015 Management’s Discussion and Analysis of Results of Operations and Financial Condition
5
3. OVERVIEW
In the third quarter of 2015, Air Canada generated adjusted net income of $734 million, an improvement of $277 million from the third quarter of 2014. Refer to section 16 “Non-GAAP Financial Measures” of this MD&A for additional information. On a GAAP basis, Air Canada reported operating income of $815 million compared to operating income of $526 million in the third quarter of 2014, an improvement of $289 million. Net income of $437 million in the third quarter of 2015 increased $114 million from the same quarter in 2014.
StrategyStrategyStrategyStrategy
Air Canada’s goal is to fully develop as a leading global airline, to be among those with the highest levels of customer experience, employee engagement and value creation for shareholders and other stakeholders. This is being pursued through the following four key strategies, which are further discussed in Air Canada’s 2014 MD&A:
� Continually identifying and implementing cost reduction and revenue generating initiatives;
� Expanding internationally and increasing connecting traffic through international gateways, on a sustainable and profitable basis, and competing effectively in the leisure market to and from Canada;
� Engaging customers by continually enhancing the travel experience and providing a consistently high level of customer experience, with additional emphasis on premium and business passengers and products; and
� Fostering positive culture change through employee engagement programs designed to promote an understanding of how the airline and its employees can work together to deliver on the customer promise and investing in the tools and training required to provide a culture of top customer care.
Pension Update
On May 26, 2015, Air Canada elected to opt out of the Air Canada Pension Plan Funding Regulations, 2014 (the “2014 Regulations”). The 2014 Regulations became effective on January 1, 2014 and under their terms, Air Canada was required to make solvency deficit payments of $200 million per year, on average, over a seven-year period. An agreement with the Government of Canada entered into in connection with these regulations contained several restrictions, including a prohibition on dividends and share repurchases, however, the agreement allowed Air Canada to opt out at any time. Refer to section 7.7 of this MD&A for additional information on Air Canada’s pension funding obligations.
Labour Update
On October 20, 2015, Air Canada announced that a 10-year agreement on collective agreement terms was reached with the Canadian Union of Public Employees (CUPE) which represents flight attendants at Air Canada and Air Canada rouge. The agreement is subject to ratification by CUPE represented flight attendants as well as to certain openers over the 10-year period.
In June 2015, Air Canada concluded a collective agreement with Unifor, the union representing the airline's approximately 4,000 customer service and sales agents. The new agreement is in effect until February 28, 2020.
In April 2015, Air Canada concluded a collective agreement with the International Brotherhood of Teamsters (“IBT”) representing the airline's U.S.-based unionized workforce. The new agreement is in effect until June 30, 2019.
In February 2015, Air Canada concluded a collective agreement with Unite representing Air Canada's U.K.-based unionized workforce. The new agreement is in effect until December 31, 2019.

Third Quarter 2015 Management’s Discussion and Analysis of Results of Operations and Financial Condition
6
ThirdThirdThirdThird Quarter 2015Quarter 2015Quarter 2015Quarter 2015 Financial SummaryFinancial SummaryFinancial SummaryFinancial Summary
The following is an overview of Air Canada’s results of operations and financial position for the third quarter of 2015 compared to the third quarter of 2014.
� Operating revenues of $4,023 million, an increase of $225 million or 6% from the third quarter of 2014.
� An ASM capacity increase of 10.5% from the third quarter of 2014, in line with the 9.5% to 10.5% capacity increase projected in Air Canada’s news release dated August 12, 2015. The capacity increase in the third quarter of 2015 was primarily in international markets and driven by the growth of Air Canada rouge and through the introduction of Boeing 787 aircraft into the mainline fleet. The Boeing 787 Dreamliner is providing new opportunities for profitable growth at Air Canada. In addition to replacing Boeing 767 aircraft on existing routes, these aircraft are also serving new international destinations made viable by the Boeing 787 aircraft’s lower operating costs, mid-size capacity and longer range. As new Boeing 787 aircraft are introduced in the mainline fleet, Boeing 767 aircraft are being transferred to Air Canada rouge to pursue opportunities in international leisure markets made viable by Air Canada rouge’s lower cost structure.
� Passenger revenues of $3,716 million, an increase of $240 million or 6.9% from the third quarter of 2014. PRASM declined 4.0% from the third quarter of 2014 mainly on a 3.8% decline in yield (which is consistent with the anticipated yield impact stemming from the implementation of the airline’s strategic plan). An increase in average stage length of 3.7% had the effect of reducing system yield by 2.1 percentage points. The favourable impact of a weaker Canadian dollar on foreign currency denominated passenger revenues increased passenger revenues by approximately $119 million in the third quarter of 2015.
� Operating expenses of $3,208 million, a decrease of $64 million or 2% from the third quarter of 2014. This decrease was mainly due to the impact of lower base fuel prices (before the impact of foreign exchange but taking into account fuel expense related to regional airline operations) which decreased operating expenses by $477 million in the third quarter of 2015. This decrease was largely offset by the impact of the 10.5% capacity growth and the unfavourable impact of a weaker Canadian dollar on foreign currency denominated operating expenses which increased operating expenses by approximately $215 million in the third quarter of 2015 (comprised of $111 million in aircraft fuel expense and an aggregate of $104 million in non-fuel operating expenses).
� A CASM reduction of 11.3% from the third quarter of 2014. On an adjusted basis, CASM decreased 0.5% from the third quarter of 2014, in line with the 0.5% to 1.5% decrease projected in Air Canada’s news release dated August 12, 2015. Adjusted CASM is a non-GAAP financial measure. Refer to section 16 “Non-GAAP Financial Measures” of this MD&A for additional information.
� An operating margin of 20.3%, an improvement of 6.5 percentage points from the same quarter in 2014.
� EBITDAR of $1,076 million compared to EBITDAR of $749 million in the third quarter of 2014, an increase of $327 million. Air Canada recorded an EBITDAR margin of 26.7% compared to an EBITDAR margin of 19.7% in the third quarter of 2014, an improvement of 700 basis points. In its news release dated August 12, 2015, Air Canada disclosed that, for the third quarter of 2015, it expected to deliver record results, with EBITDAR margin expansion versus the prior year higher than the 350 basis point expansion recorded in the second quarter of 2015. The significantly greater EBITDAR margin expansion in the third quarter of 2015 versus prior year was the result of a strong overall revenue performance and lower costs. EBITDAR is a non-GAAP financial measure. Refer to section 16 “Non-GAAP Financial Measures” of this MD&A for additional information.
� Net income of $437 million or $1.48 per diluted share compared to net income of $323 million or $1.10 per diluted share in the third quarter of 2014, an increase of $114 million or $0.38 per diluted share.
� Adjusted net income of $734 million or $2.50 per diluted share compared to adjusted net income of $457 million or $1.55 per diluted share in the third quarter of 2014, an increase of $277 million or $0.95 per diluted share. Adjusted net income is a non-GAAP financial measure. Refer to section 16 “Non-GAAP Financial Measures” of this MD&A for additional information.

Third Quarter 2015 Management’s Discussion and Analysis of Results of Operations and Financial Condition
7
� Net cash flows from operating activities of $476 million, an improvement of $285 million, largely due to the improvement in operating income. Negative free cash flow of $90 million improved $102 million from the third quarter of 2014, reflecting the impact of higher operating income partly offset by higher capital expenditures when compared to the third quarter of 2014. Air Canada took delivery of two Boeing 787 aircraft in the third quarter of 2015. Free cash flow (net cash flows from operating activities less additions to property, equipment and intangible assets) is a non-GAAP financial measure. Refer to section 7.5 “Consolidated Cash Flow Movements” of this MD&A for additional information.
� Adjusted net debt amounted to $5,423 million at September 30, 2015, an increase of $291 million from December 31, 2014 due to higher long-term debt and finance lease balances (including current portion) partly offset by higher cash balances. An increase of $922 million in long-term debt and finance lease balances (including current portion) was largely due to the unfavourable impact of a weaker Canadian dollar as at September 30, 2015 compared to December 31, 2014 on Air Canada’s foreign currency denominated debt (mainly U.S. dollars) which accounted for an increase of $681 million. The airline’s adjusted net debt to EBITDAR ratio was 2.2 at September 30, 2015 versus a ratio of 3.1 at December 31, 2014. Adjusted net debt (total debt less cash, cash equivalents and short-term investments plus capitalized operating leases) is an additional GAAP financial measure. Refer to section 7.3 “Adjusted Net Debt" of this MD&A for additional information.
� Unrestricted liquidity (cash, short-term investments and undrawn lines of credit) of $3,399 million at September 30, 2015 (September 30, 2014 – $2,802 million). Unrestricted liquidity refers to the sum of cash, cash equivalents, short-term investments and the amount of available credit under Air Canada’s revolving credit facilities. At September 30, 2015, cash and short-term investments amounted to $3,116 million and undrawn lines of credit amounted to $283 million. At September 30, 2014, cash and short-term investments amounted to $2,528 million and undrawn lines of credit amounted to $274 million.
� Return on invested capital (“ROIC”) for the 12 months ended September 30, 2015 of 18.0% versus 11.4% for the 12 months ended September 30, 2014. ROIC is a non-GAAP financial measure. Refer to section 16 “Non-GAAP Financial Measures” of this MD&A for additional information.

Third Quarter 2015 Management’s Discussion and Analysis of Results of Operations and Financial Condition
8
4. RESULTS OF OPERATIONS – THIRD QUARTER 2015 VERSUS THIRD QUARTER 2014
The following table and discussion compares results of Air Canada for the third quarter 2015 versus the third quarter of 2014.
ThirdThirdThirdThird QuarterQuarterQuarterQuarter ChangeChangeChangeChange
((((CanadianCanadianCanadianCanadian dollars in millions, except per share figures)dollars in millions, except per share figures)dollars in millions, except per share figures)dollars in millions, except per share figures) 2015201520152015 2012012012014444 $$$$ %%%%
Operating revenuesOperating revenuesOperating revenuesOperating revenues
Passenger $ 3,716 $ 3,476 $ 240 7
Cargo 119 128 (9) (7)
Other 188 194 (6) (3)
Total revenuesTotal revenuesTotal revenuesTotal revenues 4,0234,0234,0234,023 3,7983,7983,7983,798 225225225225 6 6 6 6
Operating expensesOperating expensesOperating expensesOperating expenses
Aircraft fuel 697 939 (242) (26)
Regional airlines expense
Aircraft fuel 95 137 (42) (31)
Other 489 471 18 4
Wages, salaries and benefits 598 549 49 9
Airport and navigation fees 223 208 15 7
Aircraft maintenance 192 158 34 22
Depreciation, amortization and impairment 165 142 23 16
Sales and distribution costs 157 146 11 8
Ground package costs 63 56 7 13
Aircraft rent 89 74 15 20
Food, beverages and supplies 91 84 7 8
Communications and information technology 52 49 3 6
Other 297 259 38 15
ToToToTotal operating expensestal operating expensestal operating expensestal operating expenses 3,2083,2083,2083,208 3,2723,2723,2723,272 (64(64(64(64)))) (2(2(2(2))))
OpOpOpOperating incomeerating incomeerating incomeerating income 815815815815 526526526526 222289898989
NoNoNoNonnnn----operating income (expense)operating income (expense)operating income (expense)operating income (expense)
Foreign exchange loss (251) (71) (180)
Interest income 12 11 1
Interest expense (106) (81) (25)
Interest capitalized 20 6 14
Net financing expense relating to employee benefits (28) (34) 6
Fuel and other derivatives (20) (31) 11
Other (5) (3) (2)
Total nonTotal nonTotal nonTotal non----operating expenseoperating expenseoperating expenseoperating expense (378)(378)(378)(378) (203)(203)(203)(203) (175)(175)(175)(175)
Income before income taxesIncome before income taxesIncome before income taxesIncome before income taxes 437437437437 323323323323 114114114114
Income taxes - - -
NeNeNeNet incomet incomet incomet income $$$$ 437437437437 $$$$ 323323323323 $$$$ 114114114114
Basic earnings per shareBasic earnings per shareBasic earnings per shareBasic earnings per share $$$$ 1.521.521.521.52 $$$$ 1.131.131.131.13 $$$$ 0.390.390.390.39
Diluted earnings per shareDiluted earnings per shareDiluted earnings per shareDiluted earnings per share $$$$ 1.481.481.481.48 $$$$ 1.101.101.101.10 $$$$ 0.380.380.380.38
EBITDAR EBITDAR EBITDAR EBITDAR ((((1111)))) $$$$ 1,0761,0761,0761,076 $$$$ 749749749749 $$$$ 327327327327
Adjusted net Adjusted net Adjusted net Adjusted net income income income income ((((1111)))) $$$$ 734734734734 $$$$ 457457457457 $$$$ 277277277277
Adjusted Adjusted Adjusted Adjusted earningsearningsearningsearnings per share per share per share per share –––– diluted diluted diluted diluted ((((1111)))) $$$$ 2.502.502.502.50 $$$$ 1.551.551.551.55 $$$$ 0.950.950.950.95
(1) EBITDAR (earnings before interest, taxes, depreciation, amortization, impairment and aircraft rent), adjusted net income (loss) and adjusted earnings (loss) per share – diluted are non-GAAP financial measures. Refer to section 16 "Non-GAAP Financial Measures" of this MD&A for additional information.

Third Quarter 2015 Management’s Discussion and Analysis of Results of Operations and Financial Condition
9
System passenger revenues increased System passenger revenues increased System passenger revenues increased System passenger revenues increased 6.96.96.96.9%%%% from the from the from the from the thirdthirdthirdthird quarterquarterquarterquarter of 201of 201of 201of 2014444
In the third quarter of 2015, on capacity growth of 10.5%, system passenger revenues of $3,716 million increased $240 million or 6.9% from the third quarter of 2014.
In the third quarter of 2015, system business cabin revenues increased $9 million or 1.6% from the third quarter of 2014 on yield growth of 1.6%.
The table below provides passenger revenue by geographic region for the third quarter of 2015 and the third quarter of 2014.
Passenger RevenuePassenger RevenuePassenger RevenuePassenger Revenue ThirdThirdThirdThird Quarter 2015Quarter 2015Quarter 2015Quarter 2015
$ Million$ Million$ Million$ Million ThirdThirdThirdThird QuarterQuarterQuarterQuarter 2012012012014444
$ Million$ Million$ Million$ Million ChangeChangeChangeChange
$ Million$ Million$ Million$ Million
% % % % ChangeChangeChangeChange
Canada 1,253 1,246 7 0.6
U.S. transborder 694 591 103 17.3
Atlantic 1,027 941 86 9.1
Pacific 568 537 31 5.6
Other 174 161 13 8.5
SystemSystemSystemSystem 3,716 3,716 3,716 3,716 3,4763,4763,4763,476 240 240 240 240 6.9 6.9 6.9 6.9
The table below provides year-over-year percentage changes in passenger revenues and operating statistics for the third quarter of 2015 versus the third quarter of 2014.
ThirdThirdThirdThird QQQQuarteruarteruarteruarter 2012012012015555 vvvversusersusersusersus
ThirThirThirThirdddd QQQQuarteruarteruarteruarter 2012012012014444
PassengerPassengerPassengerPassenger RevenueRevenueRevenueRevenue
% Change% Change% Change% Change
CapacityCapacityCapacityCapacity (ASMs)(ASMs)(ASMs)(ASMs)
% Change% Change% Change% Change
TrafficTrafficTrafficTraffic (RPMs)(RPMs)(RPMs)(RPMs)
% Change% Change% Change% Change
PassengerPassengerPassengerPassenger Load FactorLoad FactorLoad FactorLoad Factor pp Changepp Changepp Changepp Change
YieldYieldYieldYield
% Change% Change% Change% Change
PRASMPRASMPRASMPRASM
% Change% Change% Change% Change
Canada 0.6 4.8 3.5 (1.1) (4.8) (6.0)
U.S. transborder 17.3 15.2 15.6 0.3 1.4 1.8
Atlantic 9.1 12.7 12.7 - (3.2) (3.2)
Pacific 5.6 11.8 12.1 0.2 (5.7) (5.5)
Other 8.5 12.2 11.5 (0.5) (3.1) (3.6)
SystemSystemSystemSystem 6.9 6.9 6.9 6.9 10.5 10.5 10.5 10.5 10.2 10.2 10.2 10.2 (0.2)(0.2)(0.2)(0.2) (3.8)(3.8)(3.8)(3.8) (4.0)(4.0)(4.0)(4.0)
The table below provides year-over-year percentage changes in system passenger revenues and operating statistics for the third quarter of 2015 and each of the previous four quarters.
SystemSystemSystemSystem YearYearYearYear----overoveroverover----Year by Quarter (% Change)Year by Quarter (% Change)Year by Quarter (% Change)Year by Quarter (% Change)
Q3’14Q3’14Q3’14Q3’14 Q4’14Q4’14Q4’14Q4’14 Q1’15Q1’15Q1’15Q1’15 Q2’15Q2’15Q2’15Q2’15 Q3’15Q3’15Q3’15Q3’15
Passenger revenues 9.4 7.6 6.9 3.9 6.9
Capacity (ASMs) 9.8 8.5 9.3 9.3 10.5
Traffic (RPMs) 11.0 9.4 10.9 8.7 10.2
Passenger load factor (pp change) 1.0 0.6 1.2 (0.5) (0.2)
Yield (1.3) (1.9) (4.2) (5.0) (3.8)
PRASM (0.2) (1.2) (2.7) (5.5) (4.0)

Third Quarter 2015 Management’s Discussion and Analysis of Results of Operations and Financial Condition
10
In the third quarter of 2015, Air Canada’s system capacity was 10.5% higher than in the third quarter of 2014, with capacity growth reflected in all markets.
Components of the year-over-year change in system passenger revenues included:
• The 10.2% traffic increase which reflected traffic growth in all markets. Consistent with the airline’s objective of increasing global international-to-international connecting traffic through its major Canadian hubs, the traffic growth in the third quarter of 2015 also reflected lower-yielding incremental connecting traffic to international destinations.
• The 3.8% yield decrease which is consistent with the anticipated yield impact stemming from the implementation of the airline’s strategic plan and which reflected:
ο an increase in average stage length of 3.7%, which had the effect of reducing system yield by 2.1 percentage points;
ο a higher proportional growth of lower-yielding international-to-international passenger flows in support of the airline’s international expansion strategy;
ο a higher proportion of seats into long-haul leisure markets led by an increase in lower-cost flights operated by Air Canada rouge; and
ο a reduction in carrier surcharges relating to lower fuel prices, particularly where carrier surcharges are regulated such as Japan, Hong Kong, Korea and Brazil.
A favourable currency impact of $119 million was a partly offsetting factor.
System PRASM decreased 4.0% mainly due to the lower yield.
Domestic passenger revenues Domestic passenger revenues Domestic passenger revenues Domestic passenger revenues inininincreased creased creased creased 0.60.60.60.6%%%% from the from the from the from the thirdthirdthirdthird quarterquarterquarterquarter of 201of 201of 201of 2014444
In the third quarter of 2015, on capacity growth of 4.8%, domestic passenger revenues of $1,253 million increased $7 million or 0.6% from the third quarter of 2014.
The table below provides year-over-year percentage changes in domestic passenger revenues and operating statistics for the third quarter of 2015 and each of the previous four quarters.
CanadaCanadaCanadaCanada YearYearYearYear----overoveroverover----Year by Quarter (% Change)Year by Quarter (% Change)Year by Quarter (% Change)Year by Quarter (% Change)
Q3’14Q3’14Q3’14Q3’14 Q4’14Q4’14Q4’14Q4’14 Q1’15Q1’15Q1’15Q1’15 Q2’15Q2’15Q2’15Q2’15 Q3’15Q3’15Q3’15Q3’15
Passenger revenues 6.5 5.7 3.4 0.4 0.6
Capacity (ASMs) 5.3 6.1 2.1 2.6 4.8
Traffic (RPMs) 6.9 6.6 3.9 3.1 3.5
Passenger load factor (pp change) 1.2 0.4 1.4 0.3 (1.1)
Yield (0.7) (1.8) (1.8) (4.1) (4.8)
PRASM 0.8 (1.3) - (3.7) (6.0)
In the third quarter of 2015, the 4.8% domestic capacity growth reflected capacity increases on all major domestic services with the exception of services to the Maritimes and, to a lesser extent, on regional routes within Ontario and Quebec.

Third Quarter 2015 Management’s Discussion and Analysis of Results of Operations and Financial Condition
11
Components of the year-over-year change in third quarter domestic passenger revenues included:
• The 3.5% traffic increase which reflected traffic growth on all domestic services with the exception of services to the Maritimes where capacity was reduced year-over-year. Despite a capacity reduction on regional routes within Ontario and Quebec, traffic increased on these routes when compared to the same quarter in 2014. The domestic traffic growth in the third quarter of 2015 reflected increases on services within Canada, as well as incremental connecting traffic to U.S. and international destinations. Partly offsetting the traffic growth in the third quarter of 2015 was the impact of lower passenger demand in oil-related markets.
• An increase in baggage fee revenues following an adjustment to the airline’s first checked bag policy which became effective for travel as of November 2, 2014. Baggage fee revenues are not included in Air Canada’s yield and PRASM results.
• The 4.8% yield decrease which reflected:
ο the impact of increased industry capacity and competitive pricing activities;
ο higher proportional growth of lower-yielding international and U.S. transborder passenger flows in support of the airline’s international expansion strategy connecting to Air Canada’s routes in the domestic market;
ο a 2.2% longer average stage length which had the effect of reducing domestic yield by 1.2 percentage points in the third quarter of 2015; and
ο a decline in higher-yielding oil-related market traffic.
A favourable currency impact of $17 million was a partly offsetting factor.
Domestic PRASM decreased 6.0% on the lower yield and a passenger load factor decline of 1.1 percentage points.
U.S. transborder passenger revenues increased U.S. transborder passenger revenues increased U.S. transborder passenger revenues increased U.S. transborder passenger revenues increased 17.317.317.317.3%%%% from the from the from the from the thirdthirdthirdthird quarterquarterquarterquarter of 201of 201of 201of 2014444
In the third quarter of 2015, on a capacity growth of 15.2%, U.S. transborder passenger revenues of $694 million increased $103 million or 17.3% from the third quarter of 2014.
The table below provides year-over-year percentage changes in U.S. transborder passenger revenues and operating statistics for the third quarter of 2015 and each of the previous four quarters.
U.S. transborderU.S. transborderU.S. transborderU.S. transborder YearYearYearYear----overoveroverover----Year by Quarter (% Change)Year by Quarter (% Change)Year by Quarter (% Change)Year by Quarter (% Change)
Q3’14Q3’14Q3’14Q3’14 Q4’14Q4’14Q4’14Q4’14 Q1’15Q1’15Q1’15Q1’15 Q2’15Q2’15Q2’15Q2’15 Q3’15Q3’15Q3’15Q3’15
Passenger revenues 11.2 9.5 12.6 10.9 17.3
Capacity (ASMs) 12.7 14.0 17.3 12.4 15.2
Traffic (RPMs) 16.2 15.5 17.7 12.9 15.6
Passenger load factor (pp change)
2.5 1.1 0.3 0.4 0.3
Yield (3.7) (5.0) (4.3) (1.9) 1.4
PRASM (0.7) (3.7) (4.0) (1.5) 1.8
In the third quarter of 2015, the 15.2% U.S. transborder capacity growth reflected capacity increases on all major U.S. transborder services.

Third Quarter 2015 Management’s Discussion and Analysis of Results of Operations and Financial Condition
12
Components of the year-over-year change in third quarter U.S. transborder passenger revenues included:
• The 15.6% traffic increase which reflected traffic growth on all major U.S. transborder services. This meaningful year-over-year increase in traffic was largely due to strong passenger demand between Canada and the U.S. as well as growth of international-to-international passenger flows from the U.S. in support of Air Canada’s international expansion strategy.
• The 1.4% yield growth which reflected yield increases on most major U.S. transborder services. The yield improvement was mainly due to a strong performance on U.S. short-haul routes, an improved premium cabin mix and a favourable currency impact of $36 million. A 2.9% longer average stage length, which had the effect of reducing U.S. transborder yield by 1.6 percentage points, and an increase in long-haul leisure flying led by lower-cost Air Canada rouge, which is allowing Air Canada to effectively compete on lower-yielding leisure routes, were partly offsetting factors.
U.S. transborder PRASM increased 1.8% mainly on the higher yield.
Atlantic passenger revenues increased Atlantic passenger revenues increased Atlantic passenger revenues increased Atlantic passenger revenues increased 9.19.19.19.1%%%% from the from the from the from the thirdthirdthirdthird quarterquarterquarterquarter of 201of 201of 201of 2014444
In the third quarter of 2015, on capacity growth of 12.7%, Atlantic passenger revenues of $1,027 million increased $86 million or 9.1% from the third quarter of 2014.
The table below provides year-over-year percentage changes in Atlantic passenger revenues and operating statistics for the third quarter of 2015 and each of the previous four quarters.
AtlanticAtlanticAtlanticAtlantic YearYearYearYear----overoveroverover----Year by Quarter (% Change)Year by Quarter (% Change)Year by Quarter (% Change)Year by Quarter (% Change)
Q3’14Q3’14Q3’14Q3’14 Q4’14Q4’14Q4’14Q4’14 Q1’15Q1’15Q1’15Q1’15 Q2’15Q2’15Q2’15Q2’15 Q3’15Q3’15Q3’15Q3’15
Passenger revenues 14.9 13.6 11.0 6.5 9.1
Capacity (ASMs) 20.2 8.7 10.7 11.2 12.7
Traffic (RPMs) 19.2 12.8 17.2 11.0 12.7
Passenger load factor (pp change)
(0.8) 2.9 4.2 (0.2) -
Yield (3.5) 0.8 (5.1) (4.0) (3.2)
PRASM (4.4) 4.7 0.4 (4.2) (3.2)
In the third quarter of 2015, the 12.7% Atlantic capacity growth reflected capacity increases on all major Atlantic services with the exception of services to Germany.
Components of the year-over-year change in third quarter Atlantic passenger revenues included:
• The 12.7% traffic increase which reflected traffic growth on most major Atlantic services. The traffic growth in the third quarter of 2015 reflected incremental traffic between the U.S. and Europe via the airline’s major Canadian hubs, in line with Air Canada’s international growth strategy, as well as incremental traffic resulting from the growth of Air Canada rouge.
• The 3.2% yield decline which reflected increased industry capacity and competitive pricing activities and the impact of having a higher proportion of seats in long-haul (lower-yielding) leisure markets. A favourable currency impact of $29 million was a partly offsetting factor.
Atlantic PRASM decreased 3.2% on the lower yield.

Third Quarter 2015 Management’s Discussion and Analysis of Results of Operations and Financial Condition
13
Pacific passenger revenues Pacific passenger revenues Pacific passenger revenues Pacific passenger revenues inininincreased creased creased creased 5.65.65.65.6%%%% from the from the from the from the thirdthirdthirdthird quarterquarterquarterquarter of 201of 201of 201of 2014444
In the third quarter of 2015, on capacity growth of 11.8%, Pacific passenger revenues of $568 million increased $31 million or 5.6% from the third quarter of 2014.
The table below provides year-over-year percentage changes in Pacific passenger revenues and operating statistics for the third quarter of 2015 and each of the previous four quarters.
PacificPacificPacificPacific YearYearYearYear----overoveroverover----Year by Quarter (% Change)Year by Quarter (% Change)Year by Quarter (% Change)Year by Quarter (% Change)
Q3’14Q3’14Q3’14Q3’14 Q4’14Q4’14Q4’14Q4’14 Q1’15Q1’15Q1’15Q1’15 Q2’15Q2’15Q2’15Q2’15 Q3’15Q3’15Q3’15Q3’15
Passenger revenues 8.3 6.5 (0.5) 1.4 5.6
Capacity (ASMs) 1.6 9.5 7.6 13.6 11.8
Traffic (RPMs) 3.6 7.6 6.5 10.4 12.1
Passenger load factor (pp change)
1.7 (1.4) (0.8) (2.5) 0.2
Yield 4.9 (0.8) (6.5) (8.1) (5.7)
PRASM 7.0 (2.5) (7.4) (10.7) (5.5)
In the third quarter of 2015, the 11.8% Pacific capacity growth reflected capacity increases on all major Pacific services with the exception of services to Australia where capacity remained at 2014 levels.
Components of the year-over-year change in third quarter Pacific passenger revenues included:
• The 12.1% traffic increase which reflected traffic growth on most major Pacific services.
• The 5.7% yield decline which mainly reflected a significant reduction in carrier surcharges relating to lower fuel prices, particularly where carrier surcharges are regulated, such as Japan, Hong Kong and Korea, as well as competitive pressures to and from Canada-Asia and to and from U.S.-Asia, both in terms of added capacity and pricing. The competitive pressures impacted local, U.S. sixth freedom and beyond traffic. A favourable currency impact of $28 million was a partly offsetting factor.
Pacific PRASM decreased 5.5% on the lower yield.
Other passenger revenues Other passenger revenues Other passenger revenues Other passenger revenues inininincreased creased creased creased 8.58.58.58.5%%%% from the from the from the from the thirdthirdthirdthird quarterquarterquarterquarter of 201of 201of 201of 2014444
In the third quarter of 2015, on capacity growth of 12.2%, Other passenger revenues (from routes to and from the Caribbean, Mexico and Central and South America) of $174 million increased $13 million or 8.5% from the third quarter of 2014.
Third Quarter 2015 Management’s Discussion and Analysis of Results of Operations and Financial Condition
14
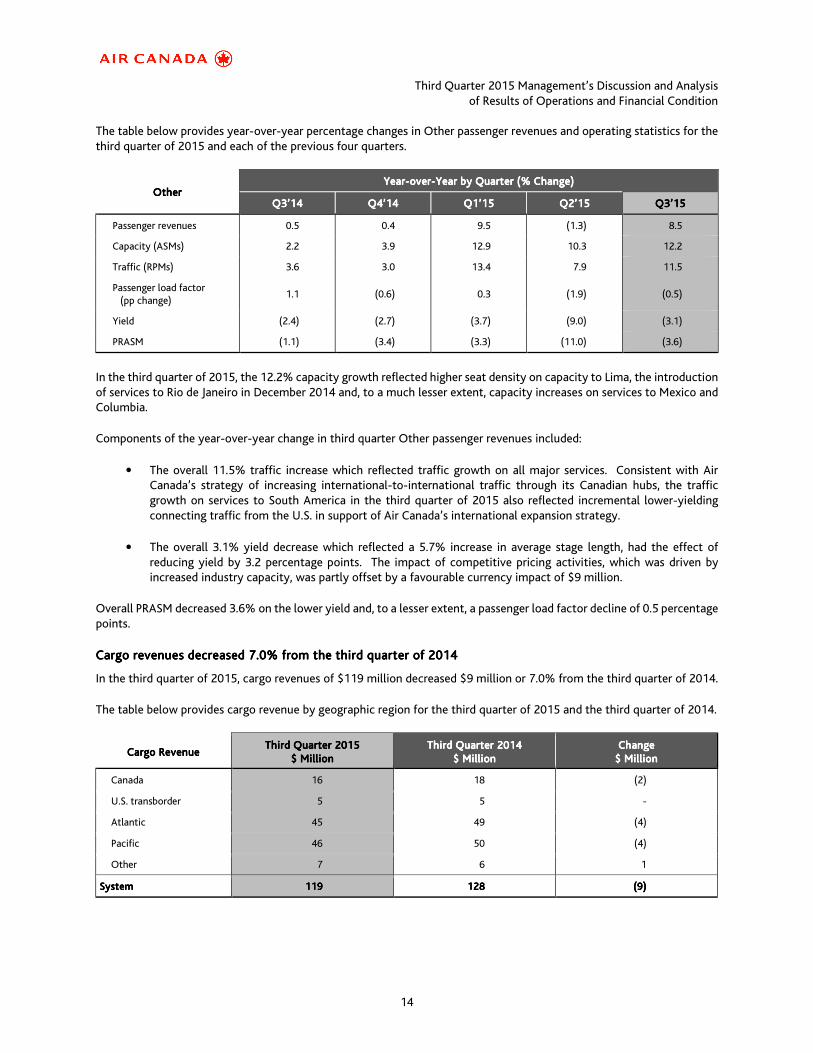
The table below provides year-over-year percentage changes in Other passenger revenues and operating statistics for the third quarter of 2015 and each of the previous four quarters.
OtherOtherOtherOther YeaYeaYeaYearrrr----overoveroverover----Year by Quarter (% Change)Year by Quarter (% Change)Year by Quarter (% Change)Year by Quarter (% Change)
Q3’14Q3’14Q3’14Q3’14 Q4’14Q4’14Q4’14Q4’14 Q1’15Q1’15Q1’15Q1’15 Q2’15Q2’15Q2’15Q2’15 Q3’15Q3’15Q3’15Q3’15
Passenger revenues 0.5 0.4 9.5 (1.3) 8.5
Capacity (ASMs) 2.2 3.9 12.9 10.3 12.2
Traffic (RPMs) 3.6 3.0 13.4 7.9 11.5
Passenger load factor (pp change)
1.1 (0.6) 0.3 (1.9) (0.5)
Yield (2.4) (2.7) (3.7) (9.0) (3.1)
PRASM (1.1) (3.4) (3.3) (11.0) (3.6)
In the third quarter of 2015, the 12.2% capacity growth reflected higher seat density on capacity to Lima, the introduction of services to Rio de Janeiro in December 2014 and, to a much lesser extent, capacity increases on services to Mexico and Columbia.
Components of the year-over-year change in third quarter Other passenger revenues included:
• The overall 11.5% traffic increase which reflected traffic growth on all major services. Consistent with Air Canada’s strategy of increasing international-to-international traffic through its Canadian hubs, the traffic growth on services to South America in the third quarter of 2015 also reflected incremental lower-yielding connecting traffic from the U.S. in support of Air Canada’s international expansion strategy.
• The overall 3.1% yield decrease which reflected a 5.7% increase in average stage length, had the effect of reducing yield by 3.2 percentage points. The impact of competitive pricing activities, which was driven by increased industry capacity, was partly offset by a favourable currency impact of $9 million.
Overall PRASM decreased 3.6% on the lower yield and, to a lesser extent, a passenger load factor decline of 0.5 percentage points.
Cargo revenues deCargo revenues deCargo revenues deCargo revenues decreasedcreasedcreasedcreased 7.07.07.07.0%%%% from the from the from the from the thirdthirdthirdthird quarterquarterquarterquarter of 201of 201of 201of 2014444
In the third quarter of 2015, cargo revenues of $119 million decreased $9 million or 7.0% from the third quarter of 2014.
The table below provides cargo revenue by geographic region for the third quarter of 2015 and the third quarter of 2014.
Cargo RCargo RCargo RCargo Revenueevenueevenueevenue ThirdThirdThirdThird QQQQuarteruarteruarteruarter 2012012012015555
$ Million$ Million$ Million$ Million ThirdThirdThirdThird QQQQuarteruarteruarteruarter 2014201420142014
$ Million$ Million$ Million$ Million ChangeChangeChangeChange
$ Million$ Million$ Million$ Million
Canada 16 18 (2)
U.S. transborder 5 5 -
Atlantic 45 49 (4)
Pacific 46 50 (4)
Other 7 6 1
SystemSystemSystemSystem 119119119119 128128128128 (9(9(9(9))))
Third Quarter 2015 Management’s Discussion and Analysis of Results of Operations and Financial Condition
15
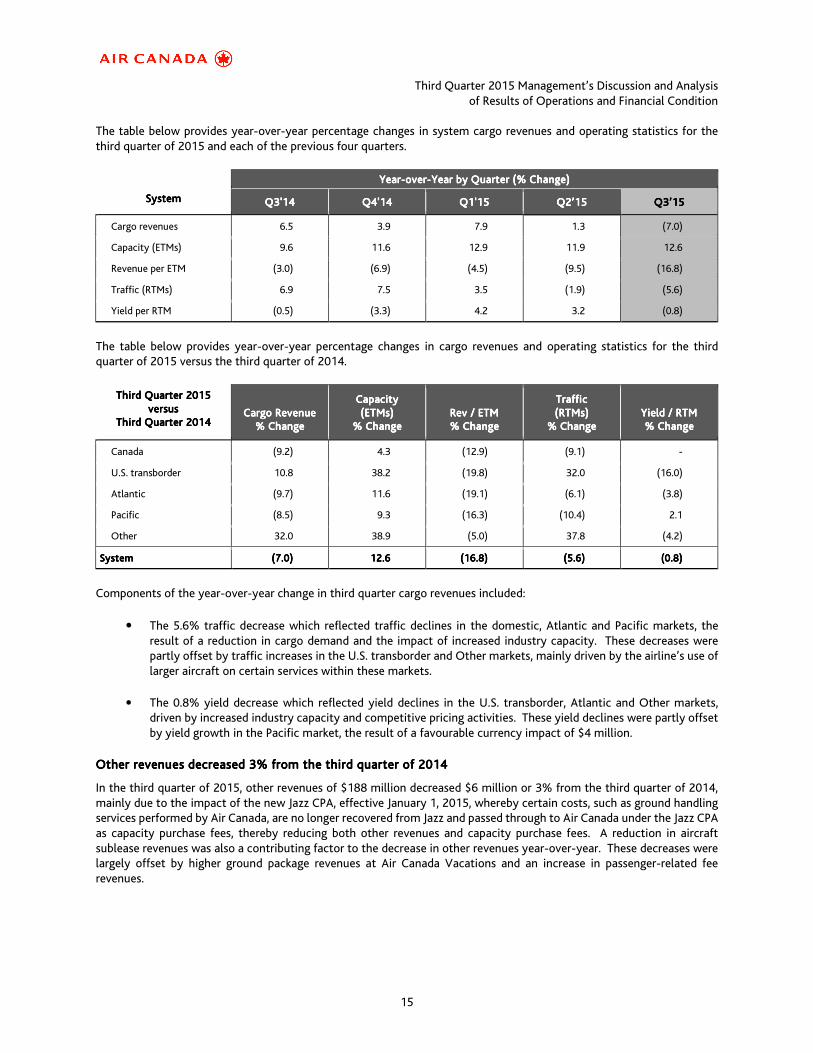
The table below provides year-over-year percentage changes in system cargo revenues and operating statistics for the third quarter of 2015 and each of the previous four quarters.
SystemSystemSystemSystem
YearYearYearYear----overoveroverover----Year by Quarter (% Change)Year by Quarter (% Change)Year by Quarter (% Change)Year by Quarter (% Change)
QQQQ3333'14'14'14'14 QQQQ4444'14'14'14'14 QQQQ1111'1'1'1'15555 Q2’15Q2’15Q2’15Q2’15 Q3’15Q3’15Q3’15Q3’15
Cargo revenues 6.5 3.9 7.9 1.3 (7.0)
Capacity (ETMs) 9.6 11.6 12.9 11.9 12.6
Revenue per ETM (3.0) (6.9) (4.5) (9.5) (16.8)
Traffic (RTMs) 6.9 7.5 3.5 (1.9) (5.6)
Yield per RTM (0.5) (3.3) 4.2 3.2 (0.8)
The table below provides year-over-year percentage changes in cargo revenues and operating statistics for the third quarter of 2015 versus the third quarter of 2014.
ThirdThirdThirdThird QQQQuarteruarteruarteruarter 2015201520152015 vvvversusersusersusersus
ThirdThirdThirdThird QQQQuarteruarteruarteruarter 2014201420142014
Cargo RevenueCargo RevenueCargo RevenueCargo Revenue
% Change% Change% Change% Change
CapacityCapacityCapacityCapacity (ETMs)(ETMs)(ETMs)(ETMs)
% Change% Change% Change% Change
Rev / ETMRev / ETMRev / ETMRev / ETM % Change% Change% Change% Change
TrafficTrafficTrafficTraffic (RTMs)(RTMs)(RTMs)(RTMs)
% Change% Change% Change% Change
Yield / RTMYield / RTMYield / RTMYield / RTM % Change% Change% Change% Change
Canada (9.2) 4.3 (12.9) (9.1) -
U.S. transborder 10.8 38.2 (19.8) 32.0 (16.0)
Atlantic (9.7) 11.6 (19.1) (6.1) (3.8)
Pacific (8.5) 9.3 (16.3) (10.4) 2.1
Other 32.0 38.9 (5.0) 37.8 (4.2)
SystemSystemSystemSystem (7.0(7.0(7.0(7.0)))) 12.6 12.6 12.6 12.6 (16.8)(16.8)(16.8)(16.8) (5.6)(5.6)(5.6)(5.6) (0.8)(0.8)(0.8)(0.8)
Components of the year-over-year change in third quarter cargo revenues included:
• The 5.6% traffic decrease which reflected traffic declines in the domestic, Atlantic and Pacific markets, the result of a reduction in cargo demand and the impact of increased industry capacity. These decreases were partly offset by traffic increases in the U.S. transborder and Other markets, mainly driven by the airline’s use of larger aircraft on certain services within these markets.
• The 0.8% yield decrease which reflected yield declines in the U.S. transborder, Atlantic and Other markets, driven by increased industry capacity and competitive pricing activities. These yield declines were partly offset by yield growth in the Pacific market, the result of a favourable currency impact of $4 million.
Other revenues Other revenues Other revenues Other revenues dedededecreased creased creased creased 3333%%%% from the from the from the from the thirdthirdthirdthird quarterquarterquarterquarter of 201of 201of 201of 2014444
In the third quarter of 2015, other revenues of $188 million decreased $6 million or 3% from the third quarter of 2014, mainly due to the impact of the new Jazz CPA, effective January 1, 2015, whereby certain costs, such as ground handling services performed by Air Canada, are no longer recovered from Jazz and passed through to Air Canada under the Jazz CPA as capacity purchase fees, thereby reducing both other revenues and capacity purchase fees. A reduction in aircraft sublease revenues was also a contributing factor to the decrease in other revenues year-over-year. These decreases were largely offset by higher ground package revenues at Air Canada Vacations and an increase in passenger-related fee revenues.

Third Quarter 2015 Management’s Discussion and Analysis of Results of Operations and Financial Condition
16
CASMCASMCASMCASM decreased decreased decreased decreased 11.311.311.311.3%%%% from the from the from the from the thirdthirdthirdthird quarterquarterquarterquarter of 201of 201of 201of 2014444.... Adjusted CASM Adjusted CASM Adjusted CASM Adjusted CASM dedededecreased creased creased creased 0.0.0.0.5555%%%% from the from the from the from the thirdthirdthirdthird quarterquarterquarterquarter of 201of 201of 201of 2014444
The following table compares Air Canada’s CASM and Adjusted CASM for the third quarter of 2015 to the third quarter 2014.
ThirdThirdThirdThird QQQQuarteruarteruarteruarter ChangeChangeChangeChange
((((centscentscentscents per per per per ASMASMASMASM)))) 2012012012015555 2012012012014444 centscentscentscents %%%%
Aircraft fuel 2.96 4.41 (1.45) (32.9)
Regional airlines expense
Aircraft fuel 0.40 0.64 (0.24) (37.5)
Other 2.08 2.22 (0.14) (6.3)
Wages and salaries 1.97 2.08 (0.11) (5.3)
Benefits 0.57 0.50 0.07 14.0
Airport and navigation fees 0.95 0.97 (0.02) (2.1)
Aircraft maintenance 0.81 0.74 0.07 9.5
Depreciation, amortization and impairment 0.70 0.66 0.04 6.1
Sales and distribution costs 0.67 0.69 (0.02) (2.9)
Ground package costs 0.27 0.26 0.01 3.8
Aircraft rent 0.38 0.35 0.03 8.6
Food, beverages and supplies 0.39 0.40 (0.01) (2.5)
Communications and information technology 0.22 0.23 (0.01) (4.3)
Other 1.26 1.22 0.04 3.3
CASMCASMCASMCASM 13.6313.6313.6313.63 15.3715.3715.3715.37 (1.74(1.74(1.74(1.74)))) ((((11.311.311.311.3))))
Remove:Remove:Remove:Remove:
Aircraft fuel expense (1), ground package costs at Air Canada Vacations, and unusual items (3.63) (5.32) 1.69 31.8
Adjusted CASM Adjusted CASM Adjusted CASM Adjusted CASM (2)(2)(2)(2) 10.0010.0010.0010.00 10.0510.0510.0510.05 (0.05)(0.05)(0.05)(0.05) (0.5)(0.5)(0.5)(0.5)
(1) Includes aircraft fuel expense related to regional airline operations.
(2) Adjusted CASM is a non-GAAP financial measure. Refer to section 16 “Non-GAAP Financial Measures” of this MD&A for additional information.
Operating expenses Operating expenses Operating expenses Operating expenses dedededecreased creased creased creased 2222%%%% from the from the from the from the thirdthirdthirdthird quarterquarterquarterquarter of 201of 201of 201of 2014444
In the third quarter of 2015, on capacity growth of 10.5%, operating expenses of $3,208 million decreased $64 million or 2% from the third quarter of 2014.
The more notable components of the year-over-year change in third quarter operating expenses included:
• The impact of lower base fuel prices (before the impact of foreign exchange) which accounted for a decrease of $477 million to aircraft fuel expense.
Largely offsetting this decline were:
• The impact of the 10.5% capacity growth.
• The unfavourable impact of a weaker Canadian dollar on foreign currency denominated operating expenses (mainly U.S. dollars) which increased operating expenses by approximately $215 million (comprised of $111 million in aircraft fuel expense and an aggregate of $104 million in non-fuel operating expenses). Refer to section 9 “Financial Instruments and Risk Management” of this MD&A for information on Air Canada’s foreign exchange risk management strategy.

Third Quarter 2015 Management’s Discussion and Analysis of Results of Operations and Financial Condition
17
Aircraft fAircraft fAircraft fAircraft fuel expense uel expense uel expense uel expense dedededecreascreascreascreased ed ed ed 26262626%%%% fromfromfromfrom the the the the thirdthirdthirdthird quarterquarterquarterquarter of 201of 201of 201of 2014444
In the third quarter of 2015, aircraft fuel expense of $697 million decreased $242 million or 26% from the third quarter of 2014.
Aircraft fuel expense, including fuel expense related to regional airline operations, amounted to $792 million in the third quarter of 2015, a decrease of $284 million or 26% from the third quarter of 2014. The decrease in aircraft fuel expense in the third quarter of 2015 was due to a significant decline in jet fuel prices year-over-year, which accounted for a decrease of $477 million. These decreases were partly offset by the unfavourable impact of a weaker Canadian dollar versus the U.S. dollar when compared to the third quarter of 2014, which accounted for an increase of $111 million, as well as a higher volume of fuel litres consumed, which accounted for an increase of $82 million.
The table below provides Air Canada’s fuel cost per litre and economic fuel cost per litre (including aircraft fuel expense related to regional airline operations) for the periods indicated.
ThirdThirdThirdThird QQQQuarteruarteruarteruarter ChangeChangeChangeChange
((((Canadian dollars in millions, except where indicated)Canadian dollars in millions, except where indicated)Canadian dollars in millions, except where indicated)Canadian dollars in millions, except where indicated) 2015201520152015 2012012012014444 $$$$ %%%%
Aircraft fuel expenseAircraft fuel expenseAircraft fuel expenseAircraft fuel expense –––– GAAPGAAPGAAPGAAP $$$$ 697697697697 $$$$ 939939939939 $$$$ (242)(242)(242)(242) (26)(26)(26)(26)
Add:Add:Add:Add: Aircraft fuel expense related to regional airline operations
95 137 (42) (31)
Total Aircraft fuel expenseTotal Aircraft fuel expenseTotal Aircraft fuel expenseTotal Aircraft fuel expense $$$$ 792792792792 $$$$ 1,0761,0761,0761,076 $$$$ (284)(284)(284)(284) (26)(26)(26)(26)
Add:Add:Add:Add: Net cash payments on fuel derivatives (1) 14 4 10 250
Economic cost of fuelEconomic cost of fuelEconomic cost of fuelEconomic cost of fuel –––– NonNonNonNon----GAAP GAAP GAAP GAAP (2(2(2(2)))) $$$$ 806806806806 $$$$ 1,0801,0801,0801,080 $$$$ (274)(274)(274)(274) (25)(25)(25)(25)
Fuel consumption (thousands of litres)Fuel consumption (thousands of litres)Fuel consumption (thousands of litres)Fuel consumption (thousands of litres) 1,289,9111,289,9111,289,9111,289,911 1,200,0171,200,0171,200,0171,200,017 89,89489,89489,89489,894 7.57.57.57.5
Fuel cost per litre (cents)Fuel cost per litre (cents)Fuel cost per litre (cents)Fuel cost per litre (cents) –––– GAAPGAAPGAAPGAAP 61.461.461.461.4 89.789.789.789.7 (28.3)(28.3)(28.3)(28.3) (31.5)(31.5)(31.5)(31.5)
Economic fuel cost per litre (cents)Economic fuel cost per litre (cents)Economic fuel cost per litre (cents)Economic fuel cost per litre (cents) –––– NonNonNonNon----GAAP GAAP GAAP GAAP (2(2(2(2)))) 62.562.562.562.5 90.090.090.090.0 (27.5)(27.5)(27.5)(27.5) (30.6)(30.6)(30.6)(30.6)
(1) Includes net cash settlements on maturing fuel derivatives and premium costs associated with those derivatives.
(2) The economic cost of fuel is not a recognized measure for financial statement presentation under GAAP, does not have a standardized meaning, and may not be comparable to similar measures presented by other public companies. Air Canada uses this measure to calculate its cash cost of fuel. It includes the actual net cash settlements from maturing fuel derivative contracts during the period and premium costs associated with those derivatives.
Regional airlineRegional airlineRegional airlineRegional airlines expense s expense s expense s expense dedededecreased creased creased creased 4444%%%% from the from the from the from the thirdthirdthirdthird quarter of 2014 quarter of 2014 quarter of 2014 quarter of 2014
Air Canada has capacity purchase agreements with Jazz, Sky Regional, Air Georgian and EVAS. Under these arrangements, Air Canada markets, tickets and enters into other commercial arrangements relating to these flights and records the revenue it earns under Passenger revenues. As of 2015, expenses incurred related to capacity purchase agreements are presented in a separate line item on Air Canada’s consolidated statement of operations titled Regional airlines expense which reflects the inclusion of all expenses related to the third-party contract carrier arrangements, including capacity purchase fees, pass-through costs and other costs.
Effective January 1, 2015, Air Canada and Jazz amended the terms of their capacity purchase agreement (“Jazz CPA”). Following such amendments and in order to better reflect costs under the Jazz CPA and Air Canada’s other regional capacity purchase agreements, certain costs that were previously capacity purchase fees are now pass-through costs. Other costs that were pass-through costs are now costs directly incurred by Air Canada. As a result, the line categories within regional airlines expense are not directly comparable year-over-year.
In the third quarter of 2015, regional airlines expense of $584 million decreased $24 million or 4% from the third quarter of 2014, mainly due to a decrease in aircraft fuel expense partly offset by higher rates year-over-year, an unfavourable currency impact and an increase in pass-through costs.

Third Quarter 2015 Management’s Discussion and Analysis of Results of Operations and Financial Condition
18
The following table provides a breakdown of Regional airlines expense for the periods indicated:
ThirdThirdThirdThird QQQQuarteruarteruarteruarter ChangeChangeChangeChange
((Canadian ((Canadian ((Canadian ((Canadian dollarsdollarsdollarsdollars in in in in millionsmillionsmillionsmillions)))) 2015201520152015 2014201420142014 $$$$ %%%%
Capacity purchase fees $ 298 $ 312 $ (14) (4)
Aircraft fuel 95 137 (42) (31)
Airport and navigation 74 73 1 1
Sales and distribution costs 32 27 5 19
Other operating expenses 85 59 26 44
Total rTotal rTotal rTotal regional airlines expenseegional airlines expenseegional airlines expenseegional airlines expense $$$$ 584584584584 608608608608 $$$$ (24)(24)(24)(24) (4)(4)(4)(4)
Wages, salaries and benefits expense amounted to Wages, salaries and benefits expense amounted to Wages, salaries and benefits expense amounted to Wages, salaries and benefits expense amounted to $$$$598598598598 million in the million in the million in the million in the thirdthirdthirdthird quarterquarterquarterquarter of 201of 201of 201of 2015555, , , , an inan inan inan increasecreasecreasecrease of of of of $$$$49494949 million or million or million or million or 9999%%%% from the from the from the from the thirdthirdthirdthird quarterquarterquarterquarter of 201of 201of 201of 2014444
In the third quarter of 2015, wages and salaries expense of $463 million increased $21 million or 5% from the third quarter of 2014, mainly due to higher average salaries and an increase in expense accruals related to the annual employee profit sharing programs. In addition, on capacity growth of 10.5%, the average number of full-time equivalent (FTE) employees increased 1.6% year-over-year.
In the third quarter of 2015, employee benefits expense of $135 million increased $28 million or 26% from the third quarter of 2014, mainly due to the impact of lower discount rates which increased the current service cost of defined benefit pension plans.
Airport andAirport andAirport andAirport and navigation fees navigation fees navigation fees navigation fees inininincreased creased creased creased 7777%%%% from the from the from the from the thirdthirdthirdthird quarterquarterquarterquarter of 201of 201of 201of 2014444
In the third quarter of 2015, airport and navigation fees of $223 million increased $15 million or 7% from the third quarter of 2014, mainly due to an increase in aircraft departures of 3.1% and an unfavourable currency impact. These increases were partly offset by the impact of the terms of an agreement with the Greater Toronto Airports Authority which is allowing Air Canada to grow its share of international passengers connecting at Toronto Pearson International Airport on a more cost effective basis.
Aircraft maintenance expense Aircraft maintenance expense Aircraft maintenance expense Aircraft maintenance expense inininincreased creased creased creased 22222222%%%% from the from the from the from the thirdthirdthirdthird quarterquarterquarterquarter of 201of 201of 201of 2014444
In the third quarter of 2015, aircraft maintenance expense of $192 million increased $34 million or 22% from the third quarter of 2014, mainly due to an unfavourable currency impact of $35 million.
Depreciation, amortization and impairment expense increased 1Depreciation, amortization and impairment expense increased 1Depreciation, amortization and impairment expense increased 1Depreciation, amortization and impairment expense increased 16666% from the third quarter of 2014% from the third quarter of 2014% from the third quarter of 2014% from the third quarter of 2014
In the third quarter of 2015, depreciation, amortization and impairment expense of $165 million increased $23 million or 16% from the third quarter of 2014, largely due to the introduction of new Boeing 787 aircraft to Air Canada’s mainline fleet and an increase in expenses related to the airline’s aircraft refurbishment programs.
Sales and distribution costs increased Sales and distribution costs increased Sales and distribution costs increased Sales and distribution costs increased 8888%%%% from the from the from the from the thirdthirdthirdthird quarterquarterquarterquarter of 201of 201of 201of 2014444
In the third quarter of 2015, sales and distribution costs of $157 million increased $11 million or 8% from the third quarter of 2014 on passenger revenue growth of 6.9%. This growth in sales and distribution costs was mainly due to an unfavourable currency impact, a higher volume of ticket sales generated through Global Distribution System (“GDS”) providers, and higher credit card fees, in line with sales and revenue growth. These increases were partly offset by the impact of more favourable distribution rates negotiated in 2015.

Third Quarter 2015 Management’s Discussion and Analysis of Results of Operations and Financial Condition
19
Ground package costs Ground package costs Ground package costs Ground package costs inininincreased creased creased creased 13131313%%%% from the from the from the from the thirdthirdthirdthird quarterquarterquarterquarter of 201of 201of 201of 2014444
In the third quarter of 2015, the cost of ground packages at Air Canada Vacations amounted to $63 million, an increase of $7 million or 13% from the third quarter of 2014, mainly due to an unfavourable currency impact and, to a lesser extent, a higher cost of ground packages (before the impact of foreign exchange).
Aircraft rent increasedAircraft rent increasedAircraft rent increasedAircraft rent increased 20202020%%%% from the from the from the from the thirdthirdthirdthird quarter of 2014quarter of 2014quarter of 2014quarter of 2014
In the third quarter of 2015, aircraft rent expense amounted to $89 million, an increase of $15 million or 20% from the third quarter of 2014, mainly due to an unfavourable currency impact and an increase in the number of leased aircraft in anticipation of the replacement of 20 of the airline’s Embraer 190 aircraft in late 2015 and the first half of 2016. These increases were partly offset by the favourable impact of lower rates on lease renewals.
Other expenses Other expenses Other expenses Other expenses inininincreased creased creased creased 15151515%%%% from the from the from the from the thirdthirdthirdthird quarterquarterquarterquarter of 201of 201of 201of 2014444
In the third quarter of 2015, other expenses of $297 million increased $38 million or 15% from the third quarter of 2014. This increase in other expenses included:
• the 10.5% capacity growth;
• an increase in terminal handling expense, mainly driven by Air Canada’s international expansion strategy;
• an increase in customer inconvenience costs, proportional to the higher passenger volumes;
• an increase in advertising and promotion expense, largely driven by the airline’s international expansion strategy; and
• an unfavourable currency impact.
The following table provides a breakdown of the more significant items included in other expenses:
ThirdThirdThirdThird QQQQuarteruarteruarteruarter ChangeChangeChangeChange
((((((((Canadian Canadian Canadian Canadian dollarsdollarsdollarsdollars in millions)in millions)in millions)in millions) 2012012012015555 2012012012014444 $$$$ %%%%
Terminal handling $ 65 $ 54 $ 11 20
Crew cycle 43 38 5 13
Building rent and maintenance 36 35 1 3
Miscellaneous fees and services 32 31 1 3
Remaining other expenses 121 101 20 20
Total oTotal oTotal oTotal other expensesther expensesther expensesther expenses $$$$ 297297297297 $$$$ 259259259259 $$$$ 38383838 15151515
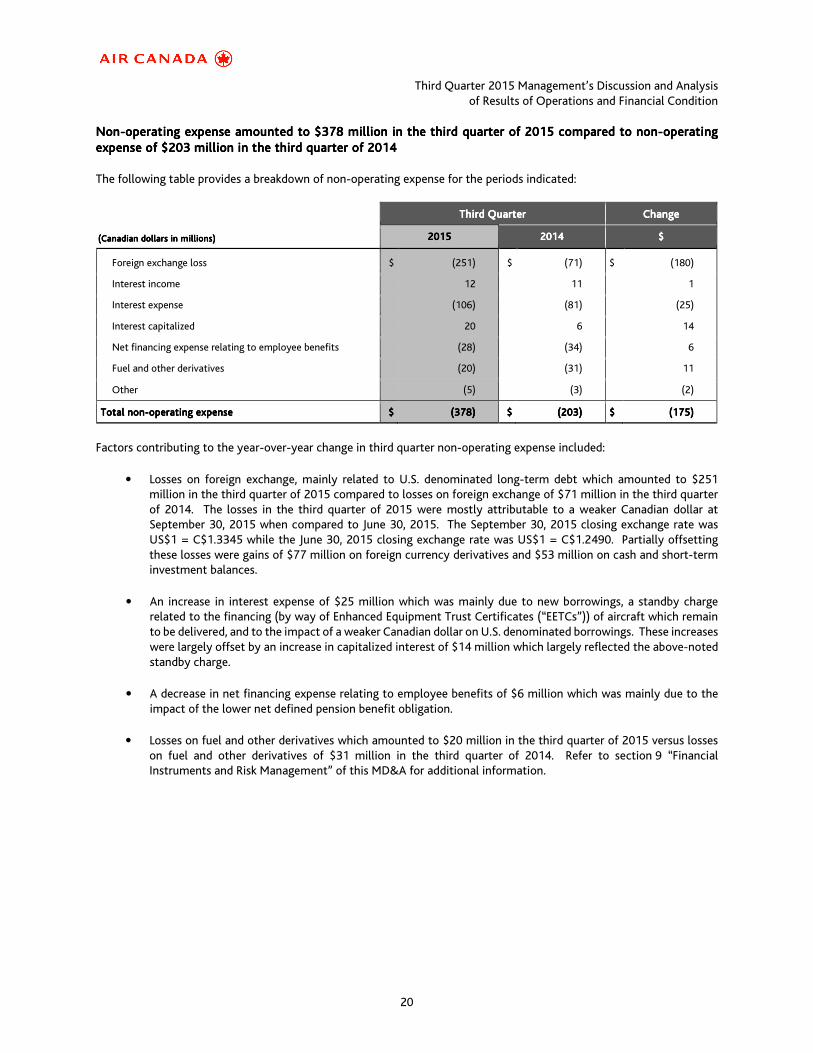
Third Quarter 2015 Management’s Discussion and Analysis of Results of Operations and Financial Condition
20
NonNonNonNon----operating expense amounted operating expense amounted operating expense amounted operating expense amounted to to to to $$$$378378378378 million in the million in the million in the million in the thirdthirdthirdthird quarterquarterquarterquarter of 201of 201of 201of 2015555 compared to noncompared to noncompared to noncompared to non----operating operating operating operating expense of expense of expense of expense of $$$$203203203203 million in the million in the million in the million in the thirdthirdthirdthird quarterquarterquarterquarter of 201of 201of 201of 2014444
The following table provides a breakdown of non-operating expense for the periods indicated:
ThirdThirdThirdThird QQQQuarteruarteruarteruarter ChangeChangeChangeChange
((((CanadianCanadianCanadianCanadian dollars in millions)dollars in millions)dollars in millions)dollars in millions) 2012012012015555 2012012012014444 $$$$
Foreign exchange loss $ (251) $ (71) $ (180)
Interest income 12 11 1
Interest expense (106) (81) (25)
Interest capitalized 20 6 14
Net financing expense relating to employee benefits (28) (34) 6
Fuel and other derivatives (20) (31) 11
Other (5) (3) (2)
Total nTotal nTotal nTotal nonononon----operating expenseoperating expenseoperating expenseoperating expense $$$$ (378)(378)(378)(378) $$$$ (203)(203)(203)(203) $$$$ (175)(175)(175)(175)
Factors contributing to the year-over-year change in third quarter non-operating expense included:
• Losses on foreign exchange, mainly related to U.S. denominated long-term debt which amounted to $251 million in the third quarter of 2015 compared to losses on foreign exchange of $71 million in the third quarter of 2014. The losses in the third quarter of 2015 were mostly attributable to a weaker Canadian dollar at September 30, 2015 when compared to June 30, 2015. The September 30, 2015 closing exchange rate was US$1 = C$1.3345 while the June 30, 2015 closing exchange rate was US$1 = C$1.2490. Partially offsetting these losses were gains of $77 million on foreign currency derivatives and $53 million on cash and short-term investment balances.
• An increase in interest expense of $25 million which was mainly due to new borrowings, a standby charge related to the financing (by way of Enhanced Equipment Trust Certificates (“EETCs”)) of aircraft which remain to be delivered, and to the impact of a weaker Canadian dollar on U.S. denominated borrowings. These increases were largely offset by an increase in capitalized interest of $14 million which largely reflected the above-noted standby charge.
• A decrease in net financing expense relating to employee benefits of $6 million which was mainly due to the impact of the lower net defined pension benefit obligation.
• Losses on fuel and other derivatives which amounted to $20 million in the third quarter of 2015 versus losses on fuel and other derivatives of $31 million in the third quarter of 2014. Refer to section 9 “Financial Instruments and Risk Management” of this MD&A for additional information.
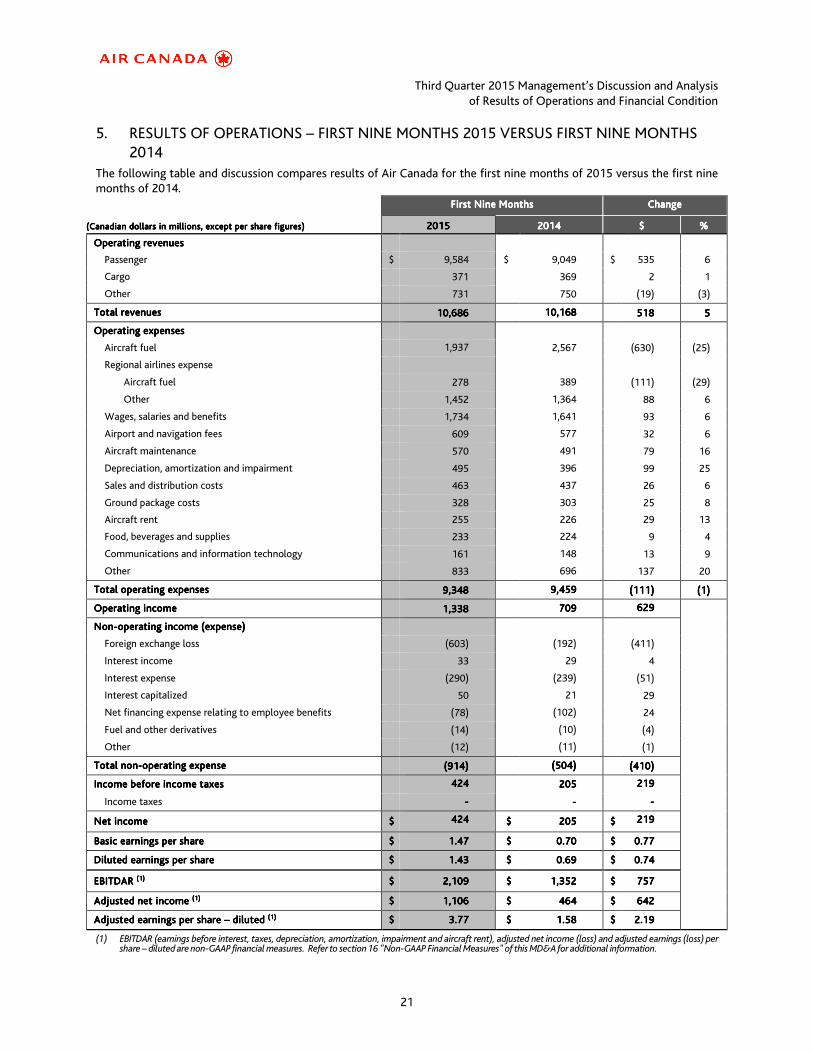
Third Quarter 2015 Management’s Discussion and Analysis of Results of Operations and Financial Condition
21
5. RESULTS OF OPERATIONS – FIRST NINE MONTHS 2015 VERSUS FIRST NINE MONTHS 2014
The following table and discussion compares results of Air Canada for the first nine months of 2015 versus the first nine months of 2014.
First First First First NineNineNineNine MonthsMonthsMonthsMonths ChangeChangeChangeChange
((((CanadianCanadianCanadianCanadian dollars in millions, except per share figures)dollars in millions, except per share figures)dollars in millions, except per share figures)dollars in millions, except per share figures) 2015201520152015 2012012012014444 $$$$ %%%%
Operating revenuesOperating revenuesOperating revenuesOperating revenues
Passenger $ 9,584 $ 9,049 $ 535 6
Cargo 371 369 2 1
Other 731 750 (19) (3)
Total revenuesTotal revenuesTotal revenuesTotal revenues 10,68610,68610,68610,686 10,16810,16810,16810,168 515151518888 5 5 5 5
Operating expensesOperating expensesOperating expensesOperating expenses
Aircraft fuel 1,937 2,567 (630) (25)
Regional airlines expense
Aircraft fuel 278 389 (111) (29)
Other 1,452 1,364 88 6
Wages, salaries and benefits 1,734 1,641 93 6
Airport and navigation fees 609 577 32 6
Aircraft maintenance 570 491 79 16
Depreciation, amortization and impairment 495 396 99 25
Sales and distribution costs 463 437 26 6
Ground package costs 328 303 25 8
Aircraft rent 255 226 29 13
Food, beverages and supplies 233 224 9 4
Communications and information technology 161 148 13 9
Other 833 696 137 20
Total operating expensesTotal operating expensesTotal operating expensesTotal operating expenses 9,9,9,9,348348348348 9,4599,4599,4599,459 (111(111(111(111)))) (1)(1)(1)(1)
OperaOperaOperaOperating incometing incometing incometing income 1,3381,3381,3381,338 709709709709 629629629629
NonNonNonNon----operating income (expense)operating income (expense)operating income (expense)operating income (expense)
Foreign exchange loss (603) (192) (411)
Interest income 33 29 4
Interest expense (290) (239) (51)
Interest capitalized 50 21 29
Net financing expense relating to employee benefits (78) (102) 24
Fuel and other derivatives (14) (10) (4)
Other (12) (11) (1)
Total nonTotal nonTotal nonTotal non----operating expenseoperating expenseoperating expenseoperating expense (914)(914)(914)(914) (504)(504)(504)(504) (410)(410)(410)(410)
IncomeIncomeIncomeIncome before income taxesbefore income taxesbefore income taxesbefore income taxes 424424424424 205205205205 219219219219
Income taxes ---- ---- ----
Net Net Net Net incomeincomeincomeincome $$$$ 424424424424 $$$$ 205205205205 $$$$ 219219219219
Basic earnings per shareBasic earnings per shareBasic earnings per shareBasic earnings per share $$$$ 1.471.471.471.47 $$$$ 0.700.700.700.70 $$$$ 0.770.770.770.77
Diluted earnings per shareDiluted earnings per shareDiluted earnings per shareDiluted earnings per share $$$$ 1.431.431.431.43 $$$$ 0.690.690.690.69 $$$$ 0.740.740.740.74
EBITDAR EBITDAR EBITDAR EBITDAR ((((1111)))) $$$$ 2,1092,1092,1092,109 $$$$ 1,3521,3521,3521,352 $$$$ 757757757757
Adjusted net Adjusted net Adjusted net Adjusted net income income income income ((((1111)))) $$$$ 1,1061,1061,1061,106 $$$$ 464464464464 $$$$ 642642642642
Adjusted Adjusted Adjusted Adjusted earningsearningsearningsearnings per share per share per share per share –––– diluted diluted diluted diluted ((((1111)))) $$$$ 3.773.773.773.77 $$$$ 1.581.581.581.58 $$$$ 2.192.192.192.19
(1) EBITDAR (earnings before interest, taxes, depreciation, amortization, impairment and aircraft rent), adjusted net income (loss) and adjusted earnings (loss) per share – diluted are non-GAAP financial measures. Refer to section 16 "Non-GAAP Financial Measures" of this MD&A for additional information.

Third Quarter 2015 Management’s Discussion and Analysis of Results of Operations and Financial Condition
22
System passenger revenues increased System passenger revenues increased System passenger revenues increased System passenger revenues increased 5.95.95.95.9%%%% from thefrom thefrom thefrom the first first first first ninenineninenine months ofmonths ofmonths ofmonths of 2014201420142014
In the first nine months of 2015, on capacity growth of 9.8%, system passenger revenues of $9,584 million increased $535 million or 5.9% from the first nine months of 2014.
In the first nine months of 2015, system business cabin revenues increased $17 million or 0.9% from the first nine months of 2014 due to a yield improvement of 1.4% partly offset by a traffic decrease of 0.5%.
The table below provides passenger revenue by geographic region for the first nine months of 2015 and the first nine months of 2014.
PassenPassenPassenPassenger Revenueger Revenueger Revenueger Revenue First First First First NineNineNineNine MonthsMonthsMonthsMonths 2015201520152015
$ Million$ Million$ Million$ Million First First First First NineNineNineNine MonthsMonthsMonthsMonths 2014201420142014
$ Million$ Million$ Million$ Million ChangeChangeChangeChange
$ Million$ Million$ Million$ Million
% Change% Change% Change% Change
Canada 3,326 3,282 44 1.3
U.S. transborder 2,053 1,807 246 13.6
Atlantic 2,203 2,029 174 8.6
Pacific 1,368 1,333 35 2.6
Other 634 598 36 6.2
SystemSystemSystemSystem 9,584 9,584 9,584 9,584 9,0499,0499,0499,049 535 535 535 535 5.9 5.9 5.9 5.9
The table below provides year-over-year percentage changes in passenger revenues and operating statistics for the first nine months of 2015 versus the first nine months of 2014.
First First First First NineNineNineNine MonthsMonthsMonthsMonths 2012012012015555 vvvversusersusersusersus
First First First First NineNineNineNine Months Months Months Months 2012012012014444
PassengerPassengerPassengerPassenger RevenueRevenueRevenueRevenue
% Change% Change% Change% Change
CapacityCapacityCapacityCapacity (ASMs)(ASMs)(ASMs)(ASMs)
% Change% Change% Change% Change
TrafficTrafficTrafficTraffic (RPMs)(RPMs)(RPMs)(RPMs)
% Change% Change% Change% Change
PassengerPassengerPassengerPassenger Load FactorLoad FactorLoad FactorLoad Factor pp Changepp Changepp Changepp Change
YieldYieldYieldYield
% Change% Change% Change% Change
PRASMPRASMPRASMPRASM
% Change% Change% Change% Change
Canada 1.3 3.3 3.5 0.1 (3.7) (3.6)
U.S. transborder 13.6 15.0 15.5 0.3 (1.7) (1.3)
Atlantic 8.6 11.8 13.0 0.9 (3.8) (2.8)
Pacific 2.6 11.1 9.8 (1.0) (6.6) (7.6)
Other 6.2 12.0 11.3 (0.5) (5.0) (5.6)
SystemSystemSystemSystem 5.9 5.9 5.9 5.9 9.8 9.8 9.8 9.8 9.9 9.9 9.9 9.9 0.1 0.1 0.1 0.1 (4.3)(4.3)(4.3)(4.3) (4.1)(4.1)(4.1)(4.1)
In the first nine months of 2015, Air Canada’s system capacity was 9.8% higher than in the first nine months of 2014, with capacity growth reflected in all markets.
Components of the year-over-year change in system passenger revenues included:
• The 9.9% traffic increase which reflected traffic growth in all markets. Consistent with the airline’s objective of increasing global international-to-international connecting traffic through its major Canadian hubs, the traffic growth in the first nine months of 2015 also reflected lower-yielding incremental connecting traffic to international destinations.
• The 4.3% yield decrease which reflected:
ο an increase in average stage length of 3.3%, which had the effect of reducing system yield by 1.9 percentage points;

Third Quarter 2015 Management’s Discussion and Analysis of Results of Operations and Financial Condition
23
ο a higher proportional growth of lower-yielding international-to-international passenger flows in support of the airline’s international expansion strategy;
ο a higher proportion of seats into long-haul leisure markets led by an increase in lower-cost flights operated by Air Canada rouge; and
ο a reduction in carrier surcharges relating to lower fuel prices, particularly where carrier surcharges are regulated such as Japan, Hong Kong, Korea and Brazil.
A favourable currency impact of $218 million was a partly offsetting factor.
System PRASM decreased 4.1% on the lower yield.
Domestic passenger revenues increasedDomestic passenger revenues increasedDomestic passenger revenues increasedDomestic passenger revenues increased 1.31.31.31.3%%%% from the first from the first from the first from the first ninenineninenine monthsmonthsmonthsmonths of 2014of 2014of 2014of 2014
In the first nine months of 2015, on capacity growth of 3.3%, domestic passenger revenues of $3,326 million increased $44 million or 1.3% from the first nine months of 2014.
The 3.3% domestic capacity growth reflected capacity increases on all major domestic services with the exception of services to the Maritimes and, to a lesser extent, on regional routes within Ontario and Quebec.
Components of the year-over-year change in domestic passenger revenues in the first nine months included:
• The 3.5% traffic increase which reflected traffic growth on all domestic services with the exception of services to the Maritimes where capacity was reduced year-over-year. Despite a capacity reduction on regional routes within Ontario and Quebec, traffic increased on these routes when compared to the same period in 2014. The first nine months of 2015 also reflected incremental connecting traffic to U.S. and international destinations. Partly offsetting the traffic growth was a traffic decline in oil-related markets.
• An increase in baggage fee revenues following an adjustment to the airline’s first checked bag policy which became effective for travel as of November 2, 2014. Baggage fee revenues are not included in Air Canada’s yield and PRASM results.
• The 3.7% yield decrease which reflected:
ο the impact of increased industry capacity and competitive pricing activities;
ο higher proportional growth of lower-yielding international and U.S. transborder passenger flows in support of the airline’s international expansion strategy connecting to Air Canada’s routes in the domestic market;
ο a 1.2% longer average stage length which had the effect of reducing domestic yield by 0.7 percentage points in the first nine months of 2015; and
ο a decline in higher-yielding oil-related market traffic.
A favourable currency impact of $31 million was a partly offsetting factor.
Domestic PRASM decreased 3.6% on the lower yield.
Third Quarter 2015 Management’s Discussion and Analysis of Results of Operations and Financial Condition
24
U.S. transborder passenger revenues increased U.S. transborder passenger revenues increased U.S. transborder passenger revenues increased U.S. transborder passenger revenues increased 13.613.613.613.6%%%% from the first from the first from the first from the first ninenineninenine monthsmonthsmonthsmonths of 2014of 2014of 2014of 2014
In the first nine months of 2015, on a capacity growth of 15.0%, U.S. transborder passenger revenues of $2,053 million increased $246 million or 13.6% from the first nine months of 2014.
The 15.0% U.S. transborder capacity growth reflected capacity increases on all major U.S. transborder services.
Components of the year-over-year change in U.S. transborder passenger revenues in the first nine months included:
• The 15.5% traffic increase which reflected traffic growth on all major U.S. transborder services. The year-over-year increase in traffic was due to strong passenger demand between Canada and the U.S. as well as growth of international-to-international passenger flows from the U.S. in support of Air Canada’s international expansion strategy.
• The 1.7% yield decline which reflected a 2.9% longer average stage length, which had the effect of reducing U.S. transborder yield by 1.7 percentage points, and an increase in long-haul leisure flying led by lower-cost Air Canada rouge, which is allowing Air Canada to effectively compete on lower-yielding leisure routes. A favourable currency impact of $73 million and a strong performance on U.S. short-haul routes were partly offsetting factors.
U.S. transborder PRASM decreased 1.3% on the lower yield.
Atlantic passenger revenues increased Atlantic passenger revenues increased Atlantic passenger revenues increased Atlantic passenger revenues increased 8.68.68.68.6%%%% from the first from the first from the first from the first ninenineninenine monthsmonthsmonthsmonths of 2014of 2014of 2014of 2014
In the first nine months of 2015, on capacity growth of 11.8%, Atlantic passenger revenues of $2,203 million increased $174 million or 8.6% from the first nine months of 2014.
The 11.8% Atlantic capacity growth reflected capacity increases on all major Atlantic services with the exception of services to Germany.
Components of the year-over-year change in Atlantic passenger revenues in the first nine months included:
• The 13.0% traffic increase which reflected traffic growth on most major Atlantic services. The traffic increase in the first nine months of 2015 included traffic growth between the U.S. and Europe via the airline’s major Canadian hubs, in line with Air Canada’s international growth strategy, as well as incremental traffic resulting from the growth of Air Canada rouge.
• The 3.8% yield decline which reflected the impact of increased industry capacity and competitive pricing activities on all major Atlantic services and the impact of having a higher proportion of seats in long-haul (lower-yielding) leisure markets. A favourable currency impact of $46 million was a partly offsetting factor.
Atlantic PRASM decreased 2.8% on the lower yield as passenger load factor improved 0.9 percentage points.
Pacific passenger revenues Pacific passenger revenues Pacific passenger revenues Pacific passenger revenues inininincreased creased creased creased 2.62.62.62.6%%%% from the first from the first from the first from the first ninenineninenine months months months months of 2014of 2014of 2014of 2014
In the first nine months of 2015, on capacity growth of 11.1%, Pacific passenger revenues of $1,368 million increased $35 million or 2.6% from the first nine months of 2014.
The 11.1% Pacific capacity growth reflected capacity increases on all major Pacific services.

Third Quarter 2015 Management’s Discussion and Analysis of Results of Operations and Financial Condition
25
Components of the year-over-year change in Pacific passenger revenues in the first nine months included:
• The 9.8% traffic increase which reflected traffic growth on all major Pacific services.
• The 6.6% yield decline which reflected a significant reduction in carrier surcharges relating to lower fuel prices, particularly where carrier surcharges are regulated such as Japan, Hong Kong and Korea, and competitive pressures to and from Canada-Asia and to and from U.S.-Asia both in terms of added capacity and pricing. The competitive pressures impacted local, U.S. sixth freedom and beyond traffic. A favourable currency impact of $50 million was a partly offsetting factor.
Pacific PRASM decreased 7.6% due to the lower yield and, to a lesser extent, a passenger load factor decline of 1.0 percentage points.
Other passenger revenues increased Other passenger revenues increased Other passenger revenues increased Other passenger revenues increased 6.26.26.26.2%%%% from the first from the first from the first from the first ninenineninenine months months months months of 2014of 2014of 2014of 2014
In the first nine months of 2015, on capacity growth of 12.0%, Other passenger revenues (from routes to and from the Caribbean, Mexico and Central and South America) of $634 million increased $36 million or 6.2% from the first nine months of 2014.
The 12.0% capacity growth reflected capacity increases on all major services in the Other markets.
Components of the year-over-year change in Other passenger revenues in the first nine months included:
• The overall 11.3% traffic increase which reflected traffic growth on all major services. Consistent with Air Canada’s strategy of increasing international-to-international traffic through its Canadian hubs, the traffic growth on services to South America in the first nine months of 2015 also reflected incremental lower-yielding connecting traffic from the U.S. in support of Air Canada’s international expansion strategy.
• The overall 5.0% yield decrease which reflected a 2.4% longer average stage length, which had the effect of reducing yield by 1.4 percentage points, competitive pricing activities, and a higher proportional growth of lower-yielding international passenger flows to South America. A favourable currency impact of $18 million was a partly offsetting factor.
Overall PRASM decreased 5.6% on the lower yield and, to a much lesser extent, a passenger load factor decline of 0.5 percentage points.
Cargo revenues increased Cargo revenues increased Cargo revenues increased Cargo revenues increased 0.80.80.80.8%%%% from the first from the first from the first from the first ninenineninenine monthsmonthsmonthsmonths of 2014of 2014of 2014of 2014
In the first nine months of 2015, cargo revenues of $371 million increased $2 million or 0.8% from the first nine months of 2014.
The table below provides cargo revenue by geographic region for the first nine months of 2015 and the first nine months of 2014.
Cargo RCargo RCargo RCargo Revenueevenueevenueevenue First First First First NineNineNineNine MonthsMonthsMonthsMonths 2012012012015555
$ Million$ Million$ Million$ Million First First First First NineNineNineNine MonthsMonthsMonthsMonths 2014201420142014
$ Million$ Million$ Million$ Million ChangeChangeChangeChange
$ Million$ Million$ Million$ Million
Canada 50 49 1
U.S. transborder 17 15 2
Atlantic 140 143 (3)
Pacific 139 139 -
Other 25 23 2
SystemSystemSystemSystem 371371371371 369369369369 2222
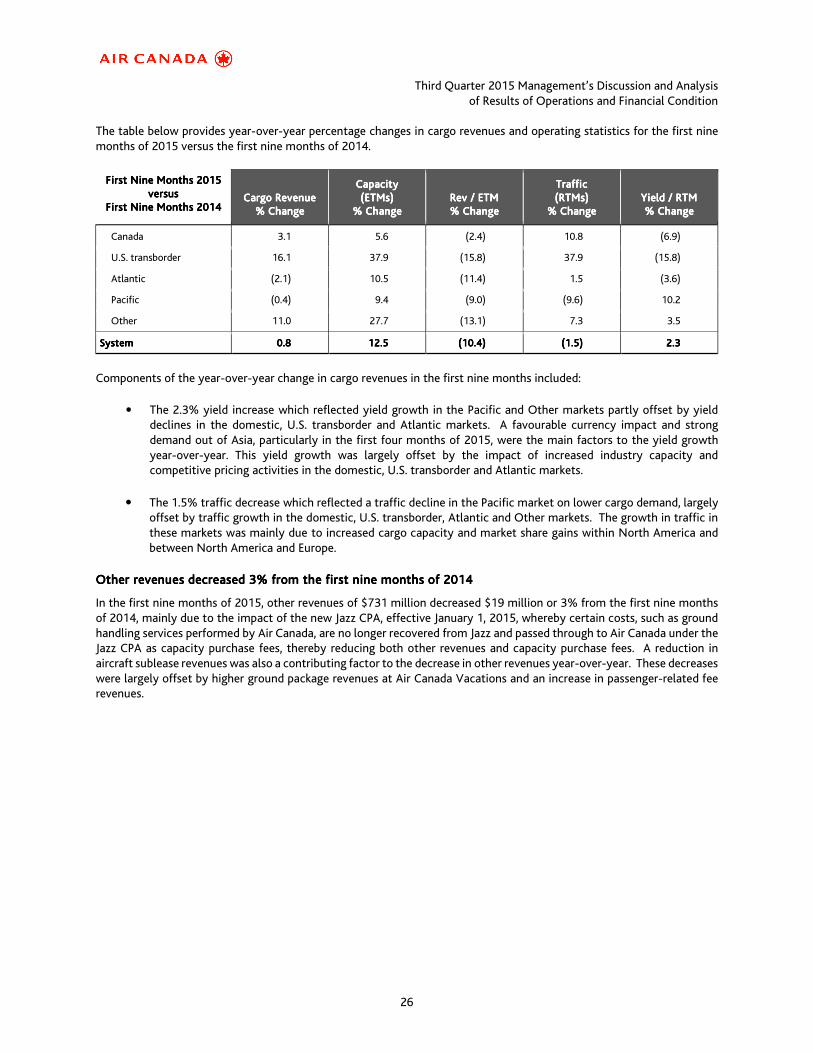
Third Quarter 2015 Management’s Discussion and Analysis of Results of Operations and Financial Condition
26
The table below provides year-over-year percentage changes in cargo revenues and operating statistics for the first nine months of 2015 versus the first nine months of 2014.
First First First First NineNineNineNine MonthsMonthsMonthsMonths 2015201520152015 vvvversusersusersusersus
First First First First NineNineNineNine MonthsMonthsMonthsMonths 2014201420142014
Cargo RevenueCargo RevenueCargo RevenueCargo Revenue
% Change% Change% Change% Change
CapCapCapCapacityacityacityacity (ETMs)(ETMs)(ETMs)(ETMs)
% Change% Change% Change% Change
Rev / ETMRev / ETMRev / ETMRev / ETM % Change% Change% Change% Change
TrafficTrafficTrafficTraffic (RTMs)(RTMs)(RTMs)(RTMs)
% Change% Change% Change% Change
Yield / RTMYield / RTMYield / RTMYield / RTM % Change% Change% Change% Change
Canada 3.1 5.6 (2.4) 10.8 (6.9)
U.S. transborder 16.1 37.9 (15.8) 37.9 (15.8)
Atlantic (2.1) 10.5 (11.4) 1.5 (3.6)
Pacific (0.4) 9.4 (9.0) (9.6) 10.2
Other 11.0 27.7 (13.1) 7.3 3.5
SystemSystemSystemSystem 0.8 0.8 0.8 0.8 12.5 12.5 12.5 12.5 (10.4)(10.4)(10.4)(10.4) (1.5)(1.5)(1.5)(1.5) 2.3 2.3 2.3 2.3
Components of the year-over-year change in cargo revenues in the first nine months included:
• The 2.3% yield increase which reflected yield growth in the Pacific and Other markets partly offset by yield declines in the domestic, U.S. transborder and Atlantic markets. A favourable currency impact and strong demand out of Asia, particularly in the first four months of 2015, were the main factors to the yield growth year-over-year. This yield growth was largely offset by the impact of increased industry capacity and competitive pricing activities in the domestic, U.S. transborder and Atlantic markets.
• The 1.5% traffic decrease which reflected a traffic decline in the Pacific market on lower cargo demand, largely offset by traffic growth in the domestic, U.S. transborder, Atlantic and Other markets. The growth in traffic in these markets was mainly due to increased cargo capacity and market share gains within North America and between North America and Europe.
Other revenues decreased Other revenues decreased Other revenues decreased Other revenues decreased 3333%%%% from the first from the first from the first from the first ninenineninenine monthsmonthsmonthsmonths of 2014of 2014of 2014of 2014
In the first nine months of 2015, other revenues of $731 million decreased $19 million or 3% from the first nine months of 2014, mainly due to the impact of the new Jazz CPA, effective January 1, 2015, whereby certain costs, such as ground handling services performed by Air Canada, are no longer recovered from Jazz and passed through to Air Canada under the Jazz CPA as capacity purchase fees, thereby reducing both other revenues and capacity purchase fees. A reduction in aircraft sublease revenues was also a contributing factor to the decrease in other revenues year-over-year. These decreases were largely offset by higher ground package revenues at Air Canada Vacations and an increase in passenger-related fee revenues.

Third Quarter 2015 Management’s Discussion and Analysis of Results of Operations and Financial Condition
27
CASM decreased CASM decreased CASM decreased CASM decreased 10.010.010.010.0%%%% from the first from the first from the first from the first ninenineninenine months months months months of 2014. Adjusted CASM decreased of 2014. Adjusted CASM decreased of 2014. Adjusted CASM decreased of 2014. Adjusted CASM decreased 0.50.50.50.5%%%% from the first from the first from the first from the first ninenineninenine monthsmonthsmonthsmonths of 2014of 2014of 2014of 2014
The following table compares Air Canada’s CASM and Adjusted CASM for the first nine months of 2015 to the first nine months of 2014.
First First First First NineNineNineNine MonthsMonthsMonthsMonths ChangeChangeChangeChange
(cents (cents (cents (cents perperperper ASM)ASM)ASM)ASM) 2012012012015555 2012012012014444 centscentscentscents %%%%
Aircraft fuel 3.12 4.54 (1.42) (31.3)
Regional airlines expense
Aircraft fuel 0.45 0.69 (0.24) (34.8)
Other 2.34 2.41 (0.07) (2.9)
Wages and salaries 2.14 2.25 (0.11) (4.9)
Benefits 0.66 0.65 0.01 1.5
Airport and navigation fees 0.98 1.02 (0.04) (3.9)
Aircraft maintenance 0.92 0.87 0.05 5.7
Depreciation, amortization and impairment 0.80 0.70 0.10 14.3
Sales and distribution costs 0.75 0.77 (0.02) (2.6)
Ground package costs 0.53 0.54 (0.01) (1.9)
Aircraft rent 0.41 0.40 0.01 2.5
Food, beverages and supplies 0.38 0.40 (0.02) (5.0)
Communications and information technology 0.26 0.26 - -
Other 1.34 1.25 0.09 7.2
CASMCASMCASMCASM 15.0815.0815.0815.08 16.7516.7516.7516.75 (1.6(1.6(1.6(1.67777)))) (10.0(10.0(10.0(10.0))))
Remove:Remove:Remove:Remove:
Aircraft fuel expense (1), ground package costs at Air Canada Vacations, and unusual items (4.09) (5.70) 1.61 28.2
Adjusted CASM Adjusted CASM Adjusted CASM Adjusted CASM (2)(2)(2)(2) 10.9910.9910.9910.99 11.0511.0511.0511.05 (0.0(0.0(0.0(0.06666)))) (0.5(0.5(0.5(0.5))))
(1) Includes aircraft fuel expense related to regional airline operations.
(2) Adjusted CASM is a non-GAAP financial measure. Refer to section 16 “Non-GAAP Financial Measures” of this MD&A for additional information.
Operating expenses decreasedOperating expenses decreasedOperating expenses decreasedOperating expenses decreased 1111%%%% from the first from the first from the first from the first ninenineninenine monthsmonthsmonthsmonths of 2014 of 2014 of 2014 of 2014
In the first nine months of 2015, on capacity growth of 9.8%, operating expenses of $9,348 million decreased $111 million or 1% from the first nine months of 2014.
The more notable components of the year-over-year change in operating expenses in the first nine months included:
• The impact of lower base fuel prices (before the impact of foreign exchange) which accounted for a decrease of $1,203 million to aircraft fuel expense.
Largely offsetting this decline were:
• The impact of the 9.8% capacity growth.
• The unfavourable impact of a weaker Canadian dollar on foreign currency denominated operating expenses (mainly U.S. dollars) which increased operating expenses by approximately $484 million (comprised of $256 million in aircraft fuel expense and an aggregate of $228 million in non-fuel operating expenses).
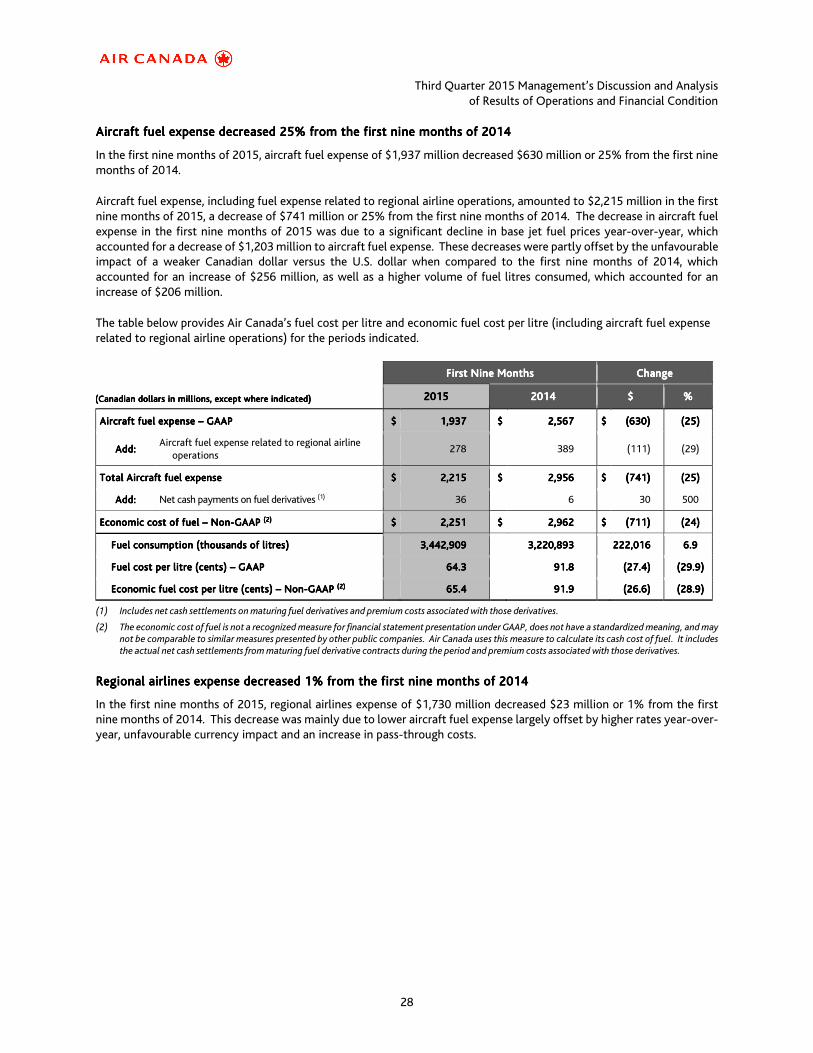
Third Quarter 2015 Management’s Discussion and Analysis of Results of Operations and Financial Condition
28
Aircraft fuel expense decreased Aircraft fuel expense decreased Aircraft fuel expense decreased Aircraft fuel expense decreased 25252525%%%% from the first from the first from the first from the first ninenineninenine monthsmonthsmonthsmonths of 2014 of 2014 of 2014 of 2014
In the first nine months of 2015, aircraft fuel expense of $1,937 million decreased $630 million or 25% from the first nine months of 2014.
Aircraft fuel expense, including fuel expense related to regional airline operations, amounted to $2,215 million in the first nine months of 2015, a decrease of $741 million or 25% from the first nine months of 2014. The decrease in aircraft fuel expense in the first nine months of 2015 was due to a significant decline in base jet fuel prices year-over-year, which accounted for a decrease of $1,203 million to aircraft fuel expense. These decreases were partly offset by the unfavourable impact of a weaker Canadian dollar versus the U.S. dollar when compared to the first nine months of 2014, which accounted for an increase of $256 million, as well as a higher volume of fuel litres consumed, which accounted for an increase of $206 million.
The table below provides Air Canada’s fuel cost per litre and economic fuel cost per litre (including aircraft fuel expense related to regional airline operations) for the periods indicated.
First First First First NineNineNineNine MonthsMonthsMonthsMonths ChangeChangeChangeChange
((Canadian ((Canadian ((Canadian ((Canadian dollarsdollarsdollarsdollars in millions, except where indicated)in millions, except where indicated)in millions, except where indicated)in millions, except where indicated) 2015201520152015 2014201420142014 $$$$ %%%%
Aircraft fuel expenseAircraft fuel expenseAircraft fuel expenseAircraft fuel expense –––– GAAPGAAPGAAPGAAP $$$$ 1,9371,9371,9371,937 $$$$ 2,5672,5672,5672,567 $$$$ (630)(630)(630)(630) (25)(25)(25)(25)
Add:Add:Add:Add: Aircraft fuel expense related to regional airline operations
278 389 (111) (29)
Total Aircraft fuel expenseTotal Aircraft fuel expenseTotal Aircraft fuel expenseTotal Aircraft fuel expense $$$$ 2,2152,2152,2152,215 $$$$ 2,9562,9562,9562,956 $$$$ (741)(741)(741)(741) (25)(25)(25)(25)
Add:Add:Add:Add: Net cash payments on fuel derivatives (1) 36 6 30 500
Economic cost of fuelEconomic cost of fuelEconomic cost of fuelEconomic cost of fuel –––– NonNonNonNon----GAAP GAAP GAAP GAAP (2(2(2(2)))) $$$$ 2,2512,2512,2512,251 $$$$ 2,9622,9622,9622,962 $$$$ (711)(711)(711)(711) (24)(24)(24)(24)
Fuel consumption (thousands of litres)Fuel consumption (thousands of litres)Fuel consumption (thousands of litres)Fuel consumption (thousands of litres) 3,442,9093,442,9093,442,9093,442,909 3,220,8933,220,8933,220,8933,220,893 222,016222,016222,016222,016 6.96.96.96.9
Fuel cost per litre (cents)Fuel cost per litre (cents)Fuel cost per litre (cents)Fuel cost per litre (cents) –––– GAAPGAAPGAAPGAAP 64.364.364.364.3 91.891.891.891.8 (27.4)(27.4)(27.4)(27.4) (29.9)(29.9)(29.9)(29.9)
Economic fuel cost per litre (cents)Economic fuel cost per litre (cents)Economic fuel cost per litre (cents)Economic fuel cost per litre (cents) –––– NonNonNonNon----GAAP GAAP GAAP GAAP (2(2(2(2)))) 65.465.465.465.4 99991.91.91.91.9 (26.6)(26.6)(26.6)(26.6) (28.9)(28.9)(28.9)(28.9)
(1) Includes net cash settlements on maturing fuel derivatives and premium costs associated with those derivatives.
(2) The economic cost of fuel is not a recognized measure for financial statement presentation under GAAP, does not have a standardized meaning, and may not be comparable to similar measures presented by other public companies. Air Canada uses this measure to calculate its cash cost of fuel. It includes the actual net cash settlements from maturing fuel derivative contracts during the period and premium costs associated with those derivatives.
Regional airlines expense Regional airlines expense Regional airlines expense Regional airlines expense dedededecreased creased creased creased 1% 1% 1% 1% from the first from the first from the first from the first ninenineninenine monthsmonthsmonthsmonths of 2014 of 2014 of 2014 of 2014
In the first nine months of 2015, regional airlines expense of $1,730 million decreased $23 million or 1% from the first nine months of 2014. This decrease was mainly due to lower aircraft fuel expense largely offset by higher rates year-over-year, unfavourable currency impact and an increase in pass-through costs.
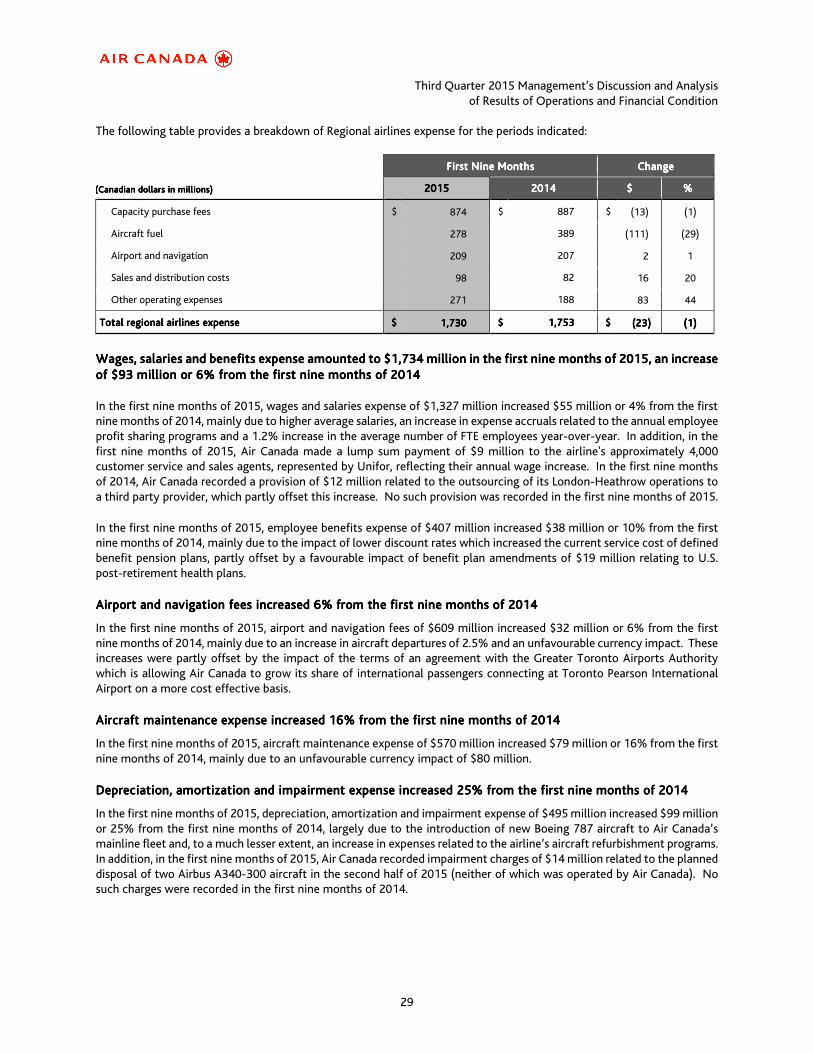
Third Quarter 2015 Management’s Discussion and Analysis of Results of Operations and Financial Condition
29
The following table provides a breakdown of Regional airlines expense for the periods indicated:
First First First First NineNineNineNine MonthsMonthsMonthsMonths ChangeChangeChangeChange
((Canadian ((Canadian ((Canadian ((Canadian dollarsdollarsdollarsdollars in millions)in millions)in millions)in millions) 2015201520152015 2014201420142014 $$$$ %%%%
Capacity purchase fees $ 874 $ 887 $ (13) (1)
Aircraft fuel 278 389 (111) (29)
Airport and navigation 209 207 2 1
Sales and distribution costs 98 82 16 20
Other operating expenses 271 188 83 44
Total reTotal reTotal reTotal regional airlines expensegional airlines expensegional airlines expensegional airlines expense $$$$ 1,730 1,730 1,730 1,730 $$$$ 1,7531,7531,7531,753 $$$$ (23)(23)(23)(23) (1)(1)(1)(1)
Wages, salaries and benefits expense amounted to $Wages, salaries and benefits expense amounted to $Wages, salaries and benefits expense amounted to $Wages, salaries and benefits expense amounted to $1,7341,7341,7341,734 million in the first million in the first million in the first million in the first ninenineninenine monthsmonthsmonthsmonths of 2015, an increase of 2015, an increase of 2015, an increase of 2015, an increase of $of $of $of $93939393 million or million or million or million or 6666%%%% from the first from the first from the first from the first ninenineninenine months months months months of 2014of 2014of 2014of 2014
In the first nine months of 2015, wages and salaries expense of $1,327 million increased $55 million or 4% from the first nine months of 2014, mainly due to higher average salaries, an increase in expense accruals related to the annual employee profit sharing programs and a 1.2% increase in the average number of FTE employees year-over-year. In addition, in the first nine months of 2015, Air Canada made a lump sum payment of $9 million to the airline's approximately 4,000 customer service and sales agents, represented by Unifor, reflecting their annual wage increase. In the first nine months of 2014, Air Canada recorded a provision of $12 million related to the outsourcing of its London-Heathrow operations to a third party provider, which partly offset this increase. No such provision was recorded in the first nine months of 2015.
In the first nine months of 2015, employee benefits expense of $407 million increased $38 million or 10% from the first nine months of 2014, mainly due to the impact of lower discount rates which increased the current service cost of defined benefit pension plans, partly offset by a favourable impact of benefit plan amendments of $19 million relating to U.S. post-retirement health plans.
Airport and navigation fees increased Airport and navigation fees increased Airport and navigation fees increased Airport and navigation fees increased 6666%%%% from the first from the first from the first from the first ninenineninenine monthsmonthsmonthsmonths of 2014of 2014of 2014of 2014
In the first nine months of 2015, airport and navigation fees of $609 million increased $32 million or 6% from the first nine months of 2014, mainly due to an increase in aircraft departures of 2.5% and an unfavourable currency impact. These increases were partly offset by the impact of the terms of an agreement with the Greater Toronto Airports Authority which is allowing Air Canada to grow its share of international passengers connecting at Toronto Pearson International Airport on a more cost effective basis.
Aircraft maintenance expense increased Aircraft maintenance expense increased Aircraft maintenance expense increased Aircraft maintenance expense increased 16161616%%%% from the first from the first from the first from the first ninenineninenine monthsmonthsmonthsmonths of 2014 of 2014 of 2014 of 2014
In the first nine months of 2015, aircraft maintenance expense of $570 million increased $79 million or 16% from the first nine months of 2014, mainly due to an unfavourable currency impact of $80 million.
Depreciation, amortization and impairment expense increased 2Depreciation, amortization and impairment expense increased 2Depreciation, amortization and impairment expense increased 2Depreciation, amortization and impairment expense increased 25555% from the first nine months of 2014% from the first nine months of 2014% from the first nine months of 2014% from the first nine months of 2014
In the first nine months of 2015, depreciation, amortization and impairment expense of $495 million increased $99 million or 25% from the first nine months of 2014, largely due to the introduction of new Boeing 787 aircraft to Air Canada’s mainline fleet and, to a much lesser extent, an increase in expenses related to the airline’s aircraft refurbishment programs. In addition, in the first nine months of 2015, Air Canada recorded impairment charges of $14 million related to the planned disposal of two Airbus A340-300 aircraft in the second half of 2015 (neither of which was operated by Air Canada). No such charges were recorded in the first nine months of 2014.

Third Quarter 2015 Management’s Discussion and Analysis of Results of Operations and Financial Condition
30
Sales and distribution costs increased Sales and distribution costs increased Sales and distribution costs increased Sales and distribution costs increased 6666%%%% from the first from the first from the first from the first ninenineninenine monthsmonthsmonthsmonths of 2014of 2014of 2014of 2014
In the first nine months of 2015, sales and distribution costs of $463 million increased $26 million or 6% from the first nine months of 2014 on passenger revenue growth of 5.9%. This growth in sales and distribution costs was mainly due to an unfavourable currency impact, a higher volume of ticket sales generated through GDS providers and higher credit card fees, in line with sales and revenue growth. These increases were partly offset by the impact of more favourable distribution rates negotiated in 2015.
Ground package costs increased Ground package costs increased Ground package costs increased Ground package costs increased 8888%%%% from the first from the first from the first from the first ninenineninenine monthsmonthsmonthsmonths of 2014of 2014of 2014of 2014
In the first nine months of 2015, the cost of ground packages at Air Canada Vacations amounted to $328 million, an increase of $25 million or 8% from the first nine months of 2014, mainly due to an unfavourable currency impact and, to a lesser extent, a higher cost of ground packages (before the impact of foreign exchange) and the impact of higher passenger volumes.
Aircraft rent increased Aircraft rent increased Aircraft rent increased Aircraft rent increased 13131313% from the first % from the first % from the first % from the first ninenineninenine months months months months of 2014of 2014of 2014of 2014
In the first nine months of 2015, aircraft rent expense amounted to $255 million, an increase of $29 million or 13% from the first nine months of 2014, largely due to a unfavourable currency impact and to a higher number of aircraft leases in anticipation of the replacement of 20 of the airline’s Embraer 190 aircraft in late 2015 and the first half of 2016. These increases were partly offset by the favourable impact of lower rates on lease renewals.
Other expenses increased Other expenses increased Other expenses increased Other expenses increased 20202020%%%% from the first from the first from the first from the first ninenineninenine months months months months of 2014of 2014of 2014of 2014
In the first nine months of 2015, other expenses of $833 million increased $137 million or 20% from the first nine months of 2014. This increase in other expenses included:
• the 9.8% capacity growth;
• an increase in terminal handling expense, mainly driven by Air Canada’s international expansion strategy;
• favourable tax-related provision adjustments of $23 million in the first nine months of 2015 versus favourable tax-related provision adjustments of $41 million in the same period in 2014;
• an increase in advertising and promotion expense, largely driven by the airline’s international expansion strategy;
• an increase in customer inconvenience costs, proportional to the higher passenger volumes;
• the outsourcing of London-Heathrow ground handling operations, in the first half of 2014, to a third party provider (the savings associated with this initiative are included in other expense categories, such as wages and salaries expense, for a net reduction overall); and
• an unfavourable currency impact.

Third Quarter 2015 Management’s Discussion and Analysis of Results of Operations and Financial Condition
31
The following table provides a breakdown of the more significant items included in other expenses:
First First First First NineNineNineNine MonthsMonthsMonthsMonths ChangeChangeChangeChange
(Canadian (Canadian (Canadian (Canadian dollarsdollarsdollarsdollars in millions)in millions)in millions)in millions) 2012012012015555 2012012012014444 $$$$ %%%%
Terminal handling $ 174 $ 143 $ 31 22
Crew cycle 114 105 9 9
Building rent and maintenance 108 107 1 1
Miscellaneous fees and services 98 89 9 10
Remaining other expenses 339 252 87 35
Total oTotal oTotal oTotal other expensesther expensesther expensesther expenses $$$$ 833833833833 $$$$ 696696696696 $$$$ 137137137137 20202020
NonNonNonNon----operating expense operating expense operating expense operating expense amounted to $amounted to $amounted to $amounted to $914914914914 millionmillionmillionmillion iiiin the first ninen the first ninen the first ninen the first nine monthsmonthsmonthsmonths of 201of 201of 201of 2015555 compared to noncompared to noncompared to noncompared to non----operating expense operating expense operating expense operating expense of $of $of $of $504504504504 millionmillionmillionmillion iiiin the first ninen the first ninen the first ninen the first nine monthsmonthsmonthsmonths of 201of 201of 201of 2014444
The following table provides a breakdown of non-operating expense for the periods indicated:
First First First First NineNineNineNine MonthsMonthsMonthsMonths ChangeChangeChangeChange
((Canadian ((Canadian ((Canadian ((Canadian dollarsdollarsdollarsdollars in millions)in millions)in millions)in millions) 2012012012015555 2012012012014444 $$$$
Foreign exchange loss $ (603) $ (192) $ (411)
Interest income 33 29 4
Interest expense (290) (239) (51)
Interest capitalized 50 21 29
Net financing expense relating to employee benefits (78) (102) 24
Fuel and other derivatives (14) (10) (4)
Other (12) (11) (1)
Total nTotal nTotal nTotal nonononon----operating expenseoperating expenseoperating expenseoperating expense $$$$ (914)(914)(914)(914) $$$$ (504)(504)(504)(504) $$$$ (410)(410)(410)(410)
Factors contributing to the year-over-year change in non-operating expense in the first nine months included:
• Losses on foreign exchange, mainly related to U.S. denominated long-term debt which amounted to $603 million in the first nine months of 2015 compared to losses on foreign exchange of $192 million in the first nine months of 2014. The losses in the first nine months of 2015 were mostly attributable to a weaker Canadian dollar at September 30, 2015 when compared to December 31, 2014. The September 30, 2015 closing exchange rate was US$1 = C$1.3345 while the December 31, 2014 closing exchange rate was US$1 = C$1.1601. Partially offsetting these losses were gains of $118 million on foreign currency derivatives and $112 million on cash and short-term investments balances. The losses on foreign exchange in the first nine months of 2015 included a loss of $24 million related to funds held in Venezuela due to the impact of a new foreign exchange mechanism announced in the first quarter of 2015. As at September 30, 2015, the Canadian equivalent of funds held in Venezuela was nominal.
• An increase in interest expense of $51 million which was mainly due to new borrowings, a standby charge related to the financing (by way of EETCs) of aircraft which remain to be delivered, and to the impact of a weaker Canadian dollar on U.S. denominated borrowings. These increases were largely offset by an increase in capitalized interest of $29 million which largely reflected the above-noted standby charge.
Third Quarter 2015 Management’s Discussion and Analysis of Results of Operations and Financial Condition
32
• A decrease in net financing expense relating to employee benefits of $24 million which was mainly due to the impact of the lower net defined benefit obligation for pension.
• Losses on fuel and other derivatives which amounted to $14 million in the first nine months of 2015 versus losses on fuel and other derivatives of $10 million in the first nine months of 2014. Refer to section 9 “Financial Instruments and Risk Management” of this MD&A for additional information.

Third Quarter 2015 Management’s Discussion and Analysis of Results of Operations and Financial Condition
33
6. FLEET
Mainline and Air Canada Mainline and Air Canada Mainline and Air Canada Mainline and Air Canada rougerougerougerouge
The following table provides the number of aircraft in Air Canada’s operating fleet as at September 30, 2015 and December 31, 2014, as well as Air Canada’s planned operating fleet, including aircraft currently operating and expected to be operated by Air Canada rouge, as at December 31, 2015, December 31, 2016 and December 31, 2017.
ActualActualActualActual PlannedPlannedPlannedPlanned
MainlineMainlineMainlineMainline Dec
emb
er 3
1,
20
14
Dec
emb
er 3
1,
20
14
Dec
emb
er 3
1,
20
14
Dec
emb
er 3
1,
20
14
Firs
t Fi
rst
Firs
t Fi
rst
Nin
eN
ine
Nin
eN
ine
Mo
nth
s M
on
ths
Mo
nth
s M
on
ths
20
15
20
15
20
15
20
15
Fl
eet
Ch
ang
esFl
eet
Ch
ang
esFl
eet
Ch
ang
esFl
eet
Ch
ang
es
Sep
tem
ber
Sep
tem
ber
Sep
tem
ber
Sep
tem
ber
30
30
30
30
, 2
01
5,
20
15
, 2
01
5,
20
15
Rem
ain
der
of
Rem
ain
der
of
Rem
ain
der
of
Rem
ain
der
of
20
15
Fle
et
20
15
Fle
et
20
15
Fle
et
20
15
Fle
et
Ch
ang
esC
han
ges
Ch
ang
esC
han
ges
Dec
emb
er 3
1,
Dec
emb
er 3
1,
Dec
emb
er 3
1,
Dec
emb
er 3
1,
20
12
01
20
12
01
55 55
22 220
16
Fle
et C
han
ges
01
6 F
leet
Ch
ang
es0
16
Fle
et C
han
ges
01
6 F
leet
Ch
ang
es
Dec
emb
er 3
1,
20
1D
ecem
ber
31
, 2
01
Dec
emb
er 3
1,
20
1D
ecem
ber
31
, 2
01
66 66
20
17
Fle
et C
han
ges
20
17
Fle
et C
han
ges
20
17
Fle
et C
han
ges
20
17
Fle
et C
han
ges
Dec
emb
er 3
1,
20
17
Dec
emb
er 3
1,
20
17
Dec
emb
er 3
1,
20
17
Dec
emb
er 3
1,
20
17
WideWideWideWide----body Aircraftbody Aircraftbody Aircraftbody Aircraft
Boeing 787-8 6666 2 8888 - 8888 - 8888 - 8888
Boeing 787-9 ---- 2 2222 1 3333 10 13131313 9 22222222
Boeing 777-300ER 17171717 - 17171717 - 17171717 2 19191919 - 19191919
Boeing 777-200LR 6666 - 6666 - 6666 - 6666 - 6666
Boeing 767-300ER 21212121 (4) 17171717 - 17171717 (2) 15151515 (5) 10101010
Airbus A330-300 8888 - 8888 - 8888 - 8888 - 8888
NarrowNarrowNarrowNarrow----body Aircraftbody Aircraftbody Aircraftbody Aircraft
Boeing 737 MAX - - ---- - - - - 2 2222
Airbus A321 10101010 3 11113333 1 14141414 1 11115555 - 15151515
Airbus A320 41414141 1 42424242 - 44442222 - 44442222 - 42424242
Airbus A319 18181818 - 18181818 - 18181818 - 18181818 - 18181818
Embraer 190 45454545 (1) 44444444 (12) 32323232 (7) 25252525 - 25252525
Total MainlineTotal MainlineTotal MainlineTotal Mainline 172172172172 3 175175175175 (10) 111165656565 4 111166669999 6 171717175555
Air Air Air Air CanadaCanadaCanadaCanada rougerougerougerouge
WideWideWideWide----body Aircraftbody Aircraftbody Aircraftbody Aircraft
Boeing 767-300ER 8888 6666 14141414 1 11115555 4 19191919 6 22225555
NarrowNarrowNarrowNarrow----body Aircraftbody Aircraftbody Aircraftbody Aircraft
Airbus A321 ---- ---- ---- 4 4444 1 5555 - 5555
Airbus A319 20202020 ---- 20202020 ---- 20202020 - 20202020 - 20202020
Total Total Total Total Air Canada Air Canada Air Canada Air Canada rougerougerougerouge 28282828 6666 34343434 5 39393939 5555 44444444 6 55550000
TotalTotalTotalTotal wwwwideideideide----body Aircraftbody Aircraftbody Aircraftbody Aircraft 66666666 6666 72727272 2 74747474 14 88888888 10 98989898
Total Total Total Total nnnnarrowarrowarrowarrow----body Aircraftbody Aircraftbody Aircraftbody Aircraft 134134134134 3333 137137137137 (7) 111130303030 (5) 121212125555 2 121212127777
TotalTotalTotalTotal Mainline andMainline andMainline andMainline and Air CanadaAir CanadaAir CanadaAir Canada rougerougerougerouge
200200200200 9999 209209209209 (5) 202020204444 9 222213131313 12 225225225225
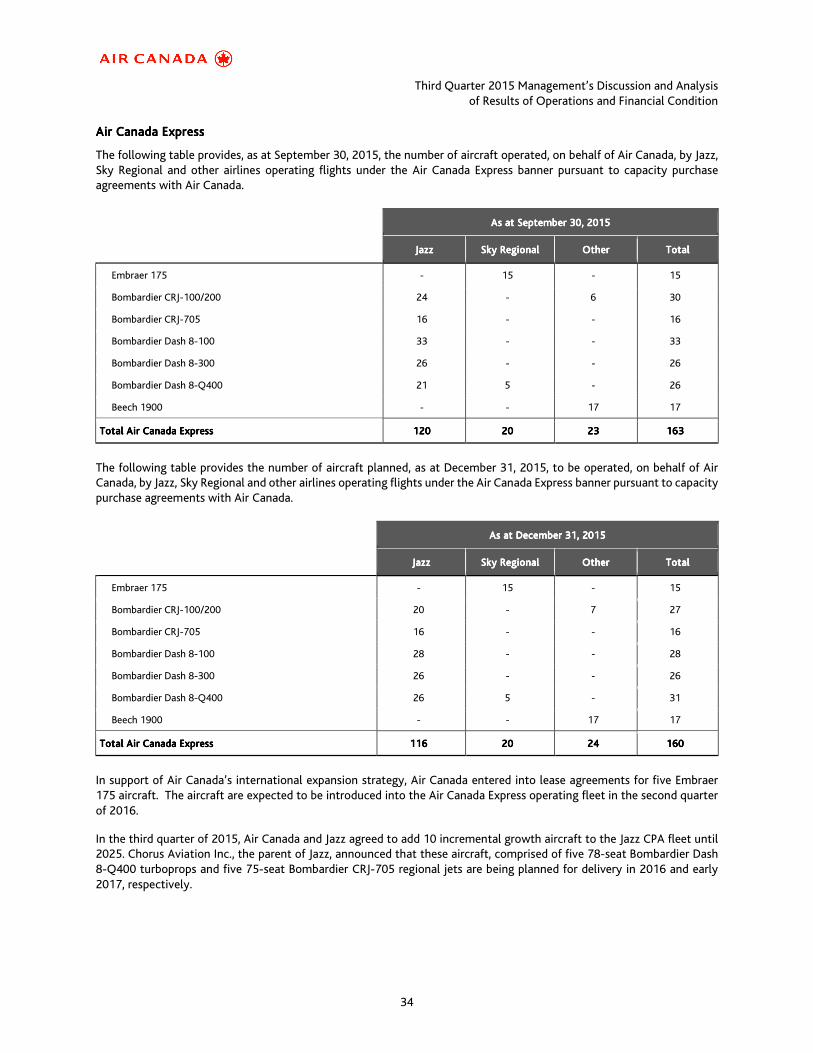
Third Quarter 2015 Management’s Discussion and Analysis of Results of Operations and Financial Condition
34
Air Canada ExpressAir Canada ExpressAir Canada ExpressAir Canada Express
The following table provides, as at September 30, 2015, the number of aircraft operated, on behalf of Air Canada, by Jazz, Sky Regional and other airlines operating flights under the Air Canada Express banner pursuant to capacity purchase agreements with Air Canada.
As at As at As at As at SeptemberSeptemberSeptemberSeptember 30303030, 2015, 2015, 2015, 2015
JazzJazzJazzJazz Sky RegionalSky RegionalSky RegionalSky Regional OtherOtherOtherOther TotalTotalTotalTotal
Embraer 175 - 15 - 15
Bombardier CRJ-100/200 24 - 6 30
Bombardier CRJ-705 16 - - 16
Bombardier Dash 8-100 33 - - 33
Bombardier Dash 8-300 26 - - 26
Bombardier Dash 8-Q400 21 5 - 26
Beech 1900 - - 17 17
Total Air Canada ExpressTotal Air Canada ExpressTotal Air Canada ExpressTotal Air Canada Express 120120120120 20202020 23232323 163163163163
The following table provides the number of aircraft planned, as at December 31, 2015, to be operated, on behalf of Air Canada, by Jazz, Sky Regional and other airlines operating flights under the Air Canada Express banner pursuant to capacity purchase agreements with Air Canada.
As at As at As at As at December 31, 2015December 31, 2015December 31, 2015December 31, 2015
JazzJazzJazzJazz Sky RegionalSky RegionalSky RegionalSky Regional OtherOtherOtherOther TotalTotalTotalTotal
Embraer 175 - 15 - 15
Bombardier CRJ-100/200 20 - 7 27
Bombardier CRJ-705 16 - - 16
Bombardier Dash 8-100 28 - - 28
Bombardier Dash 8-300 26 - - 26
Bombardier Dash 8-Q400 26 5 - 31
Beech 1900 - - 17 17
Total Air Canada ExpressTotal Air Canada ExpressTotal Air Canada ExpressTotal Air Canada Express 111111116666 20202020 22224444 111160606060
In support of Air Canada’s international expansion strategy, Air Canada entered into lease agreements for five Embraer 175 aircraft. The aircraft are expected to be introduced into the Air Canada Express operating fleet in the second quarter of 2016.
In the third quarter of 2015, Air Canada and Jazz agreed to add 10 incremental growth aircraft to the Jazz CPA fleet until 2025. Chorus Aviation Inc., the parent of Jazz, announced that these aircraft, comprised of five 78-seat Bombardier Dash 8-Q400 turboprops and five 75-seat Bombardier CRJ-705 regional jets are being planned for delivery in 2016 and early 2017, respectively.

Third Quarter 2015 Management’s Discussion and Analysis of Results of Operations and Financial Condition
35
7. FINANCIAL AND CAPITAL MANAGEMENT
7.1.7.1.7.1.7.1. LiquidityLiquidityLiquidityLiquidity
Air Canada manages its liquidity needs through a variety of strategies including by seeking to sustain and improve cash from operations, sourcing committed financing for new and existing aircraft, and through other financing activities.
Liquidity needs are primarily related to meeting obligations associated with financial liabilities, capital commitments, ongoing operations, contractual and other obligations (including pension funding obligations), which are further discussed in sections 7.6, 7.7 and 7.8 of this MD&A, as well as covenants in credit card and other agreements, which are further discussed in section 9.8 of Air Canada’s 2014 MD&A. Air Canada monitors and manages liquidity risk by preparing rolling cash flow forecasts, monitoring the condition and value of assets available to be used as well as those assets being used as security in financing arrangements, seeking flexibility in financing arrangements, and establishing programs to monitor and maintain compliance with terms of financing agreements. As part of its liquidity risk management strategy, Air Canada seeks to maintain unrestricted liquidity of at least $1.7 billion. This minimum liquidity level was determined in conjunction with Air Canada’s liquidity risk management strategy. At September 30, 2015, unrestricted liquidity amounted to $3,399 million (comprised of cash and short-term investments of $3,116 million and undrawn lines of credit of $283 million). This compared to unrestricted liquidity of $2,802 million (comprised of cash and short-term investments of $2,528 million and undrawn lines of credit of $274 million) at September 30, 2014.
7.2.7.2.7.2.7.2. Financial PositionFinancial PositionFinancial PositionFinancial Position
The following table provides a condensed consolidated statement of financial position of Air Canada as at September 30, 2015 and as at December 31, 2014.
((((Canadian dollars in millions)Canadian dollars in millions)Canadian dollars in millions)Canadian dollars in millions) SeptemberSeptemberSeptemberSeptember 30303030, , , , 2015201520152015 December 31, 2014December 31, 2014December 31, 2014December 31, 2014 $ Change$ Change$ Change$ Change
AssetsAssetsAssetsAssets
Cash, cash equivalents and short-term investments $ 3,116 $ 2,275 $ 841
Other current assets 1,270 1,203 67
Current assets 4,386 3,478 908
Property and equipment 6,648 5,998 650
Pension 543 - 543
Intangible assets 310 305 5
Goodwill 311 311 -
Deposits and other assets 557 556 1
Total assetsTotal assetsTotal assetsTotal assets $$$$ 12,755 12,755 12,755 12,755 $$$$ 10,648 10,648 10,648 10,648 $$$$ 2,1072,1072,1072,107
LiabilitiesLiabilitiesLiabilitiesLiabilities
Current liabilities $ 3,855 $ 3,537 $ 318
Long-term debt and finance leases 5,576 4,732 844
Pension and other benefit liabilities 2,193 2,403 (210)
Maintenance provisions 923 796 127
Other long-term liabilities 259 313 (54)
Total liabilitiesTotal liabilitiesTotal liabilitiesTotal liabilities 12,80612,80612,80612,806 11,781 11,781 11,781 11,781 1,0251,0251,0251,025
Total equityTotal equityTotal equityTotal equity (51(51(51(51)))) (1,133)(1,133)(1,133)(1,133) 1111,082,082,082,082
Total liabilities and equityTotal liabilities and equityTotal liabilities and equityTotal liabilities and equity $$$$ 12,755 12,755 12,755 12,755 $$$$ 10,648 10,648 10,648 10,648 $$$$ 2,1072,1072,1072,107

Third Quarter 2015 Management’s Discussion and Analysis of Results of Operations and Financial Condition
36
Movements in current assets and current liabilities are described in section 7.4 “Working Capital” of this MD&A. Long-term debt and finance leases are discussed in sections 7.3 “Adjusted Net Debt” and 7.5 “Consolidated Cash Flow Movements” of this MD&A.
At September 30, 2015, property and equipment amounted to $6,648 million, an increase of $650 million from December 31, 2014. The increase in property and equipment was mainly due to additions to property and equipment of $1,134 million in the first nine months of 2015, offset by the impact of depreciation expense of $478 million. The additions to property and equipment included flight equipment purchases of $609 million, which included two Boeing 787-8 and two Boeing 787-9 aircraft delivered in the first nine months of 2015, progress payments on future aircraft deliveries of $272 million, and capitalized maintenance costs of $157 million.
Certain pension plans are now in net asset positions and, as a result, those plans are required to be reported as pension assets on Air Canada’s consolidated statement of financial position. At September 30, 2015, the net pension and other benefit liabilities amounted to $1,650 million (comprised of pension and other benefit liabilities of $2,193 million net of pension assets of $543 million), a decrease of $753 million from December 31, 2014, mainly due to strong investment returns and the impact of higher prescribed pension plan discount rates as at September 30, 2015 versus December 31, 2014. Pension funding payments of $246 million were made in the first nine months of 2015. Refer to section 7.7 “Pension Funding Obligations” of this MD&A for additional information.
7.3.7.3.7.3.7.3. Adjusted Net DebtAdjusted Net DebtAdjusted Net DebtAdjusted Net Debt
The following table reflects Air Canada’s adjusted net debt balances as at September 30, 2015 and as at December 31, 2014.
((((Canadian Canadian Canadian Canadian dollarsdollarsdollarsdollars in millions, except where indicated)in millions, except where indicated)in millions, except where indicated)in millions, except where indicated) SeptemberSeptemberSeptemberSeptember 30303030, 201, 201, 201, 2015555 DecemberDecemberDecemberDecember 31, 20131, 20131, 20131, 2014444 $ $ $ $ ChangeChangeChangeChange
Total long-term debt and finance leases $ 5,576 $ 4,732 $ 844
Current portion of long-term debt and finance leases 562 484 78
Total long-term debt and finance leases, including current portion 6,138 5,216 922
Less cash, cash equivalents and short-term investments (3,116) (2,275) (841)
Net debtNet debtNet debtNet debt $$$$ 3,0223,0223,0223,022 $$$$ 2,941 2,941 2,941 2,941 $$$$ 81818181
Capitalized operating leases (1) 2,401 2,191 210
Adjusted net debtAdjusted net debtAdjusted net debtAdjusted net debt $$$$ 5,4235,4235,4235,423 $$$$ 5,132 5,132 5,132 5,132 $$$$ 291291291291
EBITDAR (trailing 12 months) EBITDAR (trailing 12 months) EBITDAR (trailing 12 months) EBITDAR (trailing 12 months) $$$$ 2,4282,4282,4282,428 $$$$ 1,671 1,671 1,671 1,671 $$$$ 757757757757
Adjusted net debt to Adjusted net debt to Adjusted net debt to Adjusted net debt to EBITDAR ratioEBITDAR ratioEBITDAR ratioEBITDAR ratio 2.22.22.22.2 3.1 3.1 3.1 3.1 (0.9)(0.9)(0.9)(0.9)
(1) Adjusted net debt is an additional GAAP financial measure used by Air Canada and may not be comparable to measures presented by other public companies. Adjusted net debt is a key component of the capital managed by Air Canada and provides management with a measure of its net indebtedness. Air Canada includes capitalized operating leases which is a measure commonly used in the industry to ascribe a value to obligations under operating leases. Common industry practice is to multiply annualized aircraft rent expense by 7. This definition of capitalized operating leases is used by Air Canada and may not be comparable to similar measures presented by other public companies. Aircraft rent was $343 million for the twelve months ended September 30, 2015 and $313 million for the twelve months ended December 31, 2014 (includes aircraft rent expense related to regional airline operations).
At September 30, 2015, total long-term debt and finance leases, including current portion, amounted to $6,138 million, an increase of $922 million from December 31, 2014. This increase was largely due to the unfavourable impact of a weaker Canadian dollar as at September 30, 2015 compared to December 31, 2014 on Air Canada’s foreign currency denominated debt (mainly U.S. dollars) which accounted for an increase of $681 million. In the first nine months of 2015, new borrowings amounted to $591 million and debt repayments amounted to $386 million. Air Canada took delivery of four Boeing 787 aircraft in the first nine months of 2015. Three of the aircraft were included in the enhanced equipment trust certificates financing transaction, as described in section 7.8 “Contractual Obligations” of this MD&A, and the other delivery was financed with Export-Import Bank of the United States (“EXIM”) financing support.
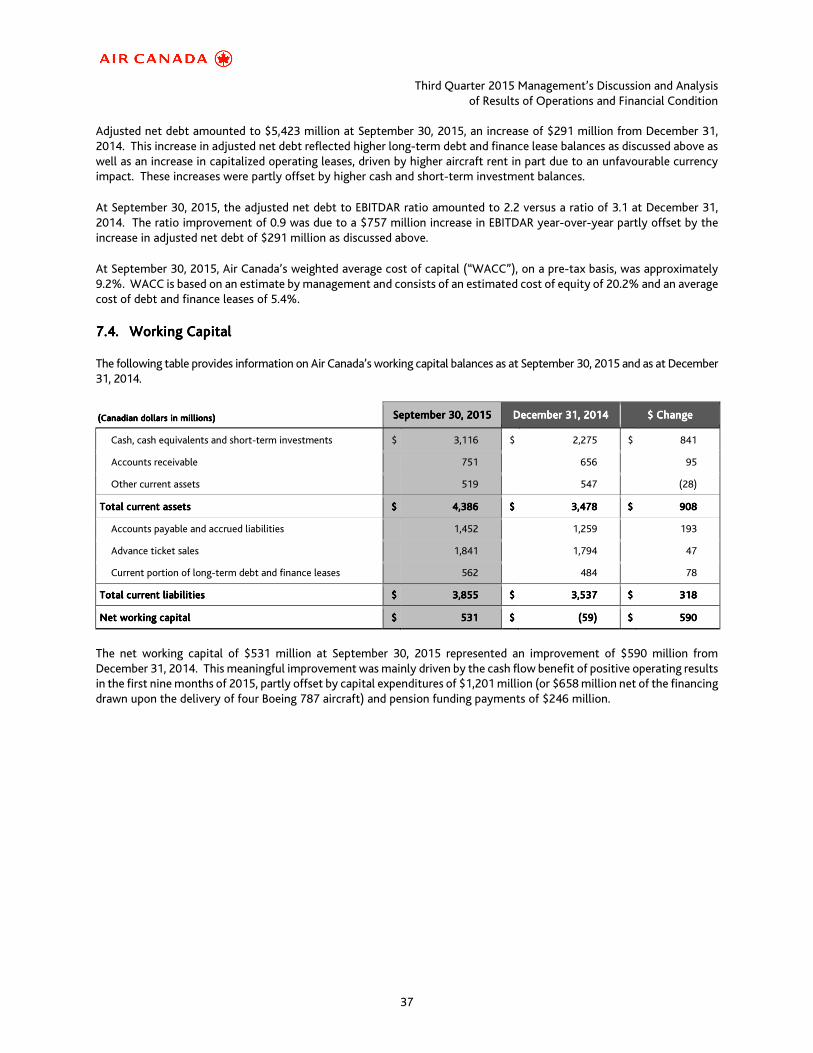
Third Quarter 2015 Management’s Discussion and Analysis of Results of Operations and Financial Condition
37
Adjusted net debt amounted to $5,423 million at September 30, 2015, an increase of $291 million from December 31, 2014. This increase in adjusted net debt reflected higher long-term debt and finance lease balances as discussed above as well as an increase in capitalized operating leases, driven by higher aircraft rent in part due to an unfavourable currency impact. These increases were partly offset by higher cash and short-term investment balances.
At September 30, 2015, the adjusted net debt to EBITDAR ratio amounted to 2.2 versus a ratio of 3.1 at December 31, 2014. The ratio improvement of 0.9 was due to a $757 million increase in EBITDAR year-over-year partly offset by the increase in adjusted net debt of $291 million as discussed above.
At September 30, 2015, Air Canada’s weighted average cost of capital (“WACC”), on a pre-tax basis, was approximately 9.2%. WACC is based on an estimate by management and consists of an estimated cost of equity of 20.2% and an average cost of debt and finance leases of 5.4%.
7.4.7.4.7.4.7.4. Working CapitalWorking CapitalWorking CapitalWorking Capital
The following table provides information on Air Canada’s working capital balances as at September 30, 2015 and as at December 31, 2014.
((((Canadian dollars in millions)Canadian dollars in millions)Canadian dollars in millions)Canadian dollars in millions) SeptemberSeptemberSeptemberSeptember 30303030, 201, 201, 201, 2015555 DecemberDecemberDecemberDecember 31, 20131, 20131, 20131, 2014444 $ $ $ $ ChangeChangeChangeChange
Cash, cash equivalents and short-term investments $ 3,116 $ 2,275 $ 841
Accounts receivable 751 656 95
Other current assets 519 547 (28)
TotalTotalTotalTotal current assetscurrent assetscurrent assetscurrent assets $$$$ 4,3864,3864,3864,386 $$$$ 3,4783,4783,4783,478 $$$$ 908908908908
Accounts payable and accrued liabilities 1,452 1,259 193
Advance ticket sales 1,841 1,794 47
Current portion of long-term debt and finance leases 562 484 78
Total current liabilitiesTotal current liabilitiesTotal current liabilitiesTotal current liabilities $$$$ 3,8553,8553,8553,855 $$$$ 3,5373,5373,5373,537 $$$$ 318318318318
Net working capitalNet working capitalNet working capitalNet working capital $$$$ 531531531531 $$$$ (59)(59)(59)(59) $$$$ 555590909090
The net working capital of $531 million at September 30, 2015 represented an improvement of $590 million from December 31, 2014. This meaningful improvement was mainly driven by the cash flow benefit of positive operating results in the first nine months of 2015, partly offset by capital expenditures of $1,201 million (or $658 million net of the financing drawn upon the delivery of four Boeing 787 aircraft) and pension funding payments of $246 million.

Third Quarter 2015 Management’s Discussion and Analysis of Results of Operations and Financial Condition
38
7.5.7.5.7.5.7.5. Consolidated Cash Flow MovementsConsolidated Cash Flow MovementsConsolidated Cash Flow MovementsConsolidated Cash Flow Movements
The following table provides the cash flow movements for Air Canada for the periods indicated:
ThirdThirdThirdThird QuarterQuarterQuarterQuarter First First First First NineNineNineNine MonthsMonthsMonthsMonths
((((CanadianCanadianCanadianCanadian dollars in millions)dollars in millions)dollars in millions)dollars in millions) 2015201520152015 2014201420142014 $ Change$ Change$ Change$ Change 2015201520152015 2014201420142014 $ Change$ Change$ Change$ Change
Net cash flows from operating activitiesNet cash flows from operating activitiesNet cash flows from operating activitiesNet cash flows from operating activities $$$$ 474747476666 $$$$ 191191191191 $$$$ 282828285555 $$$$ 1,7931,7931,7931,793 $$$$ 921921921921 $$$$ 878787872222
Proceeds from borrowings 302 194 108 591 978 (387)
Reduction of long-term debt and finance lease obligations
(124) (166) 42 (386) (556) 170
Distributions related to aircraft special purpose leasing entities
- - - (9) - (9)
Issue of common shares - 1 (1) 3 1 2
Share purchased for cancellation (41) - (41) (42) - (42)
Financing fees (1) - (1) (23) - (23)
Net cash flows Net cash flows Net cash flows Net cash flows from from from from financingfinancingfinancingfinancing activitiesactivitiesactivitiesactivities 131313136666 29292929 101010107777 134134134134 423423423423 (289(289(289(289))))
Short-term investments (227) 157 (384) (517) (137) (380)
Additions to property, equipment and intangible assets
(566) (383) (183) (1,201) (1,115) (86)
Proceeds from sale of assets 7 65 (58) 17 68 (51)
Other 7 (23) 30 23 (13) 36
NNNNet cash flows used in investing et cash flows used in investing et cash flows used in investing et cash flows used in investing activitiesactivitiesactivitiesactivities (779)(779)(779)(779) (184)(184)(184)(184) (595)(595)(595)(595) (1,678)(1,678)(1,678)(1,678) (1,197)(1,197)(1,197)(1,197) (481)(481)(481)(481)
IncreaseIncreaseIncreaseIncrease (decrease) (decrease) (decrease) (decrease) in cash and cash equivalentsin cash and cash equivalentsin cash and cash equivalentsin cash and cash equivalents (167)(167)(167)(167) 36363636 (203)(203)(203)(203) 249249249249 147147147147 102102102102
Cash and cash equivalents, beginning of period 1,077 861 216 661 750 (89)
Cash and cash equivalents, Cash and cash equivalents, Cash and cash equivalents, Cash and cash equivalents, end of periodend of periodend of periodend of period $$$$ 910910910910 $$$$ 897897897897 $$$$ 13131313 $$$$ 910910910910 $$$$ 897897897897 $$$$ 13131313
The following table provides the consolidated calculation of free cash flow for Air Canada for the periods indicated:
ThirdThirdThirdThird QuarterQuarterQuarterQuarter First First First First NineNineNineNine MonthsMonthsMonthsMonths
((((CanadianCanadianCanadianCanadian dollars in millions)dollars in millions)dollars in millions)dollars in millions) 2012012012015555 2014201420142014 $ Change$ Change$ Change$ Change 2015201520152015 2014201420142014 $ Change$ Change$ Change$ Change
Net cNet cNet cNet cash flows from operating activitiesash flows from operating activitiesash flows from operating activitiesash flows from operating activities $$$$ 476476476476 $$$$ 191191191191 $$$$ 282828285555 $$$$ 1,7931,7931,7931,793 $$$$ 921921921921 $$$$ 872872872872
Additions to property, equipment and intangible assets
(566) (383) (183) (1,201) (1,115) (86)
Free cash flow Free cash flow Free cash flow Free cash flow (1)(1)(1)(1) $$$$ (90(90(90(90)))) $$$$ (192)(192)(192)(192) $$$$ 102102102102 $$$$ 592592592592 $$$$ (194)(194)(194)(194) $$$$ 786786786786
(1) Free cash flow is not a recognized measure for financial presentation under GAAP, does not have a standardized meaning and is not comparable to measures presented by other public companies. Air Canada considers free cash flow to be an indicator of the financial strength and performance of its business because it shows how much cash is generated from the business after investing in capital assets, which is available to meet ongoing financial obligations, including repaying debt, and reinvesting in Air Canada.
Third Quarter 2015 Management’s Discussion and Analysis of Results of Operations and Financial Condition
39
Free cash flowFree cash flowFree cash flowFree cash flow
Net cash flows from operating activities of $476 million for the third quarter of 2015 improved $285 million compared to the third quarter of 2014. This increase in net cash flows from operating activities was largely due to the improvement in operating income. Negative free cash flow of $90 million improved $102 million in the third quarter of 2015 from the same period in 2014, reflecting the impact of higher operating income partly offset by higher capital expenditures when compared to the third quarter of 2014. Air Canada took delivery of two Boeing 787 aircraft in the third quarter of 2015.
In the first nine months, net cash flows from operating activities of $1,793 million improved $872 million from the first nine months of 2014, largely due to the improvement in operating income and, to a lesser extent, the impact of higher cash inflows from working capital. The higher cash inflows from working capital was mainly due to the impact of the timing of certain payments, the impact of lower fuel prices and the growth in advance ticket sales. Similarly, free cash flow improved $786 million in the first nine months of 2015 from the same period in 2014.
Net cash flows used in financing activitiesNet cash flows used in financing activitiesNet cash flows used in financing activitiesNet cash flows used in financing activities
Proceeds from borrowings amounted to $302 million in the third quarter of 2015 and $591 million in the first nine months of 2015. In the third quarter and first nine months of 2015, reduction of long-term debt and finance lease obligations amounted to $124 million and $386 million, respectively. Refer to section 7.3 “Adjusted Net Debt” of this MD&A and section 7.6 “Capital Expenditures and Related Financing Arrangements” below for additional information on Air Canada’s financing activities.
7.6.7.6.7.6.7.6. Capital Expenditures and Related Financing ArrangementsCapital Expenditures and Related Financing ArrangementsCapital Expenditures and Related Financing ArrangementsCapital Expenditures and Related Financing Arrangements
Aircraft and Related FinancingAircraft and Related FinancingAircraft and Related FinancingAircraft and Related Financing
Private Offering of Enhanced Equipment Trust Certificates
In March 2015, in connection with the financing of one Boeing 787-8 delivered in January 2015 and eight new Boeing 787-9 aircraft, two of which were delivered in the third quarter of 2015 and the remaining of which are scheduled for delivery by March 2016, Air Canada announced the closing of a private offering of three tranches of enhanced equipment trust certificates with a combined aggregate face amount of approximately US$1.031 billion. Refer to section 7.8 “Contractual Obligations” of this MD&A for additional information.
Boeing
As at September 30, 2015, Air Canada had outstanding purchase commitments with The Boeing Company (“Boeing”) for 27 Boeing 787 aircraft (31 Boeing 787 aircraft as at December 31, 2014). Three of the four aircraft delivered in the first nine months of 2015 were financed via the enhanced equipment trust certificates financing transaction as described above, and the other delivery was financed through EXIM financing support.
Air Canada also has purchase options for 13 Boeing 787 aircraft (entitling Air Canada to purchase aircraft based on previously determined pricing and delivery positions), and purchase rights for 10 Boeing 787 aircraft (entitling Air Canada to purchase aircraft based on Boeing’s then current pricing).
Subject to certain conditions, Air Canada has various financing or sale and leaseback commitments covering up to 22 of the remaining 27 Boeing 787 firm aircraft orders, which are summarized as follows:
• For six Boeing 787-9 aircraft, which are currently scheduled for delivery from November 2015 to March 2016, Air Canada announced the closing of a private offering of enhanced equipment trust certificates which is described above.
• For 14 of the 787 aircraft, the financing terms are for 80% of the aircraft delivery price and the term to maturity is 12 years with straight-line principal repayments.
• A sale and leaseback transaction with a third party for two Boeing 787 firm aircraft.
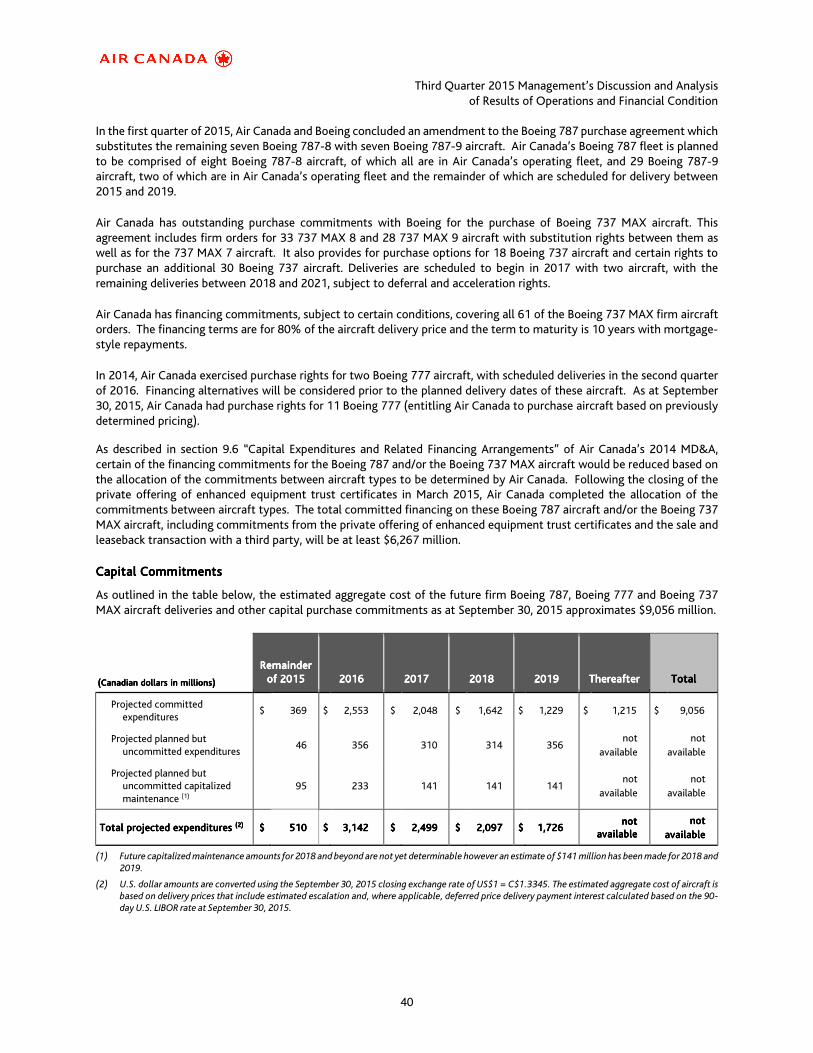
Third Quarter 2015 Management’s Discussion and Analysis of Results of Operations and Financial Condition
40
In the first quarter of 2015, Air Canada and Boeing concluded an amendment to the Boeing 787 purchase agreement which substitutes the remaining seven Boeing 787-8 with seven Boeing 787-9 aircraft. Air Canada’s Boeing 787 fleet is planned to be comprised of eight Boeing 787-8 aircraft, of which all are in Air Canada’s operating fleet, and 29 Boeing 787-9 aircraft, two of which are in Air Canada’s operating fleet and the remainder of which are scheduled for delivery between 2015 and 2019.
Air Canada has outstanding purchase commitments with Boeing for the purchase of Boeing 737 MAX aircraft. This agreement includes firm orders for 33 737 MAX 8 and 28 737 MAX 9 aircraft with substitution rights between them as well as for the 737 MAX 7 aircraft. It also provides for purchase options for 18 Boeing 737 aircraft and certain rights to purchase an additional 30 Boeing 737 aircraft. Deliveries are scheduled to begin in 2017 with two aircraft, with the remaining deliveries between 2018 and 2021, subject to deferral and acceleration rights.
Air Canada has financing commitments, subject to certain conditions, covering all 61 of the Boeing 737 MAX firm aircraft orders. The financing terms are for 80% of the aircraft delivery price and the term to maturity is 10 years with mortgage-style repayments.
In 2014, Air Canada exercised purchase rights for two Boeing 777 aircraft, with scheduled deliveries in the second quarter of 2016. Financing alternatives will be considered prior to the planned delivery dates of these aircraft. As at September 30, 2015, Air Canada had purchase rights for 11 Boeing 777 (entitling Air Canada to purchase aircraft based on previously determined pricing).
As described in section 9.6 “Capital Expenditures and Related Financing Arrangements” of Air Canada’s 2014 MD&A, certain of the financing commitments for the Boeing 787 and/or the Boeing 737 MAX aircraft would be reduced based on the allocation of the commitments between aircraft types to be determined by Air Canada. Following the closing of the private offering of enhanced equipment trust certificates in March 2015, Air Canada completed the allocation of the commitments between aircraft types. The total committed financing on these Boeing 787 aircraft and/or the Boeing 737 MAX aircraft, including commitments from the private offering of enhanced equipment trust certificates and the sale and leaseback transaction with a third party, will be at least $6,267 million.
Capital CommitmentsCapital CommitmentsCapital CommitmentsCapital Commitments
As outlined in the table below, the estimated aggregate cost of the future firm Boeing 787, Boeing 777 and Boeing 737 MAX aircraft deliveries and other capital purchase commitments as at September 30, 2015 approximates $9,056 million.
(Canadian dollars in millions)(Canadian dollars in millions)(Canadian dollars in millions)(Canadian dollars in millions)
Remainder Remainder Remainder Remainder of of of of 2015201520152015
2016201620162016
2017201720172017
2018201820182018
2019201920192019 ThereafterThereafterThereafterThereafter TotalTotalTotalTotal
Projected committed expenditures
$ 369 $ 2,553 $ 2,048 $ 1,642 $ 1,229 $ 1,215 $ 9,056
Projected planned but uncommitted expenditures
46 356 310 314 356 not
available
not
available
Projected planned but uncommitted capitalized maintenance (1)
95 233 141 141 141 not
available
not
available
Total projected expenditures Total projected expenditures Total projected expenditures Total projected expenditures (2)(2)(2)(2) $$$$ 510510510510 $$$$ 3,3,3,3,142142142142 $$$$ 2,2,2,2,499499499499 $$$$ 2,0972,0972,0972,097 $$$$ 1,7261,7261,7261,726 not not not not
availableavailableavailableavailable notnotnotnot
availableavailableavailableavailable
(1) Future capitalized maintenance amounts for 2018 and beyond are not yet determinable however an estimate of $141 million has been made for 2018 and 2019.
(2) U.S. dollar amounts are converted using the September 30, 2015 closing exchange rate of US$1 = C$1.3345. The estimated aggregate cost of aircraft is based on delivery prices that include estimated escalation and, where applicable, deferred price delivery payment interest calculated based on the 90-day U.S. LIBOR rate at September 30, 2015.

Third Quarter 2015 Management’s Discussion and Analysis of Results of Operations and Financial Condition
41
7.7.7.7.7.7.7.7. Pension Funding ObligationsPension Funding ObligationsPension Funding ObligationsPension Funding Obligations
Air Canada maintains several pension plans, including defined benefit and defined contribution pension plans and plans providing other retirement and post-employment benefits to its employees. Based on actuarial valuations completed in the second quarter of 2015, the aggregate solvency surplus in Air Canada’s domestic registered pension plans as at January 1, 2015 was $660 million.
In the second quarter of 2015, Air Canada elected to opt out of the Air Canada Pension Plan Funding Regulations, 2014 (the “2014 Regulations”). As described in section 9.7 “Pension Funding Obligations” of Air Canada’s 2014 MD&A, the 2014 Regulations became effective on January 1, 2014 and under their terms, Air Canada was required to make solvency deficit payments of $200 million per year, on average, over a seven-year period. The agreement with the Government of Canada entered into in connection with these regulations contained several restrictions, including a prohibition on dividends and share repurchases, however, the agreement allowed Air Canada to opt out at any time.
Total employer contributions to defined benefit pension plans for 2015 are expected to be $322 million, which includes solvency deficit payments of approximately $96 million versus the $200 million that would have been required under the 2014 Regulations.
As at September 30, 2015, approximately 75% of Air Canada’s pension liabilities were matched with fixed income products to mitigate a significant portion of the interest rate (discount rate) risk. Air Canada may continue to increase the percentage of pension liabilities being matched with fixed income products, subject to favourable market conditions.
Assuming that Air Canada’s domestic registered pension plans are in a solvency surplus position as at January 1, 2016, Air Canada’s projected pension funding obligations, on a cash basis, for the years 2015 to 2019 are as follows:
(Canadian dollars in millions)(Canadian dollars in millions)(Canadian dollars in millions)(Canadian dollars in millions) 2015201520152015 2016201620162016 2017201720172017 2018201820182018 2019201920192019
Past service domestic registered plans
$ 96 $ 7 $ - $ - $ -
Current service domestic registered plans
145 144 143 141 139
Other pension arrangements (1) 81 84 88 89 89
Total pTotal pTotal pTotal projected rojected rojected rojected ppppension ension ension ension funding obligationsfunding obligationsfunding obligationsfunding obligations
$$$$ 333322222222 $$$$ 222233335555 $$$$ 222231313131 $$$$ 222230303030 $$$$ 222222228888
(1) Includes retirement compensation arrangements, supplemental plans and international plans.
7.8.7.8.7.8.7.8. Contractual ObligationsContractual ObligationsContractual ObligationsContractual Obligations
Private Offering of Enhanced Equipment Trust Certificates
In March 2015, in connection with the financing of one Boeing 787-8 aircraft delivered in January 2015 and eight new Boeing 787-9 aircraft, two of which were delivered in the third quarter of 2015, and the remaining of which are scheduled for delivery by March 2016, Air Canada announced the closing of a private offering of three tranches of enhanced equipment trust certificates with a combined aggregate face amount of approximately US$1.031 billion.
The private offering is comprised of Class A certificates, Class B certificates and Class C certificates.
• The Class A certificates, with a US$667 million face amount, have an interest rate of 3.600% per annum and a final expected distribution date of March 15, 2027.
• The Class B certificates, with a US$182 million face amount, have an interest rate of 3.875% per annum and a final expected distribution date of March 15, 2023.
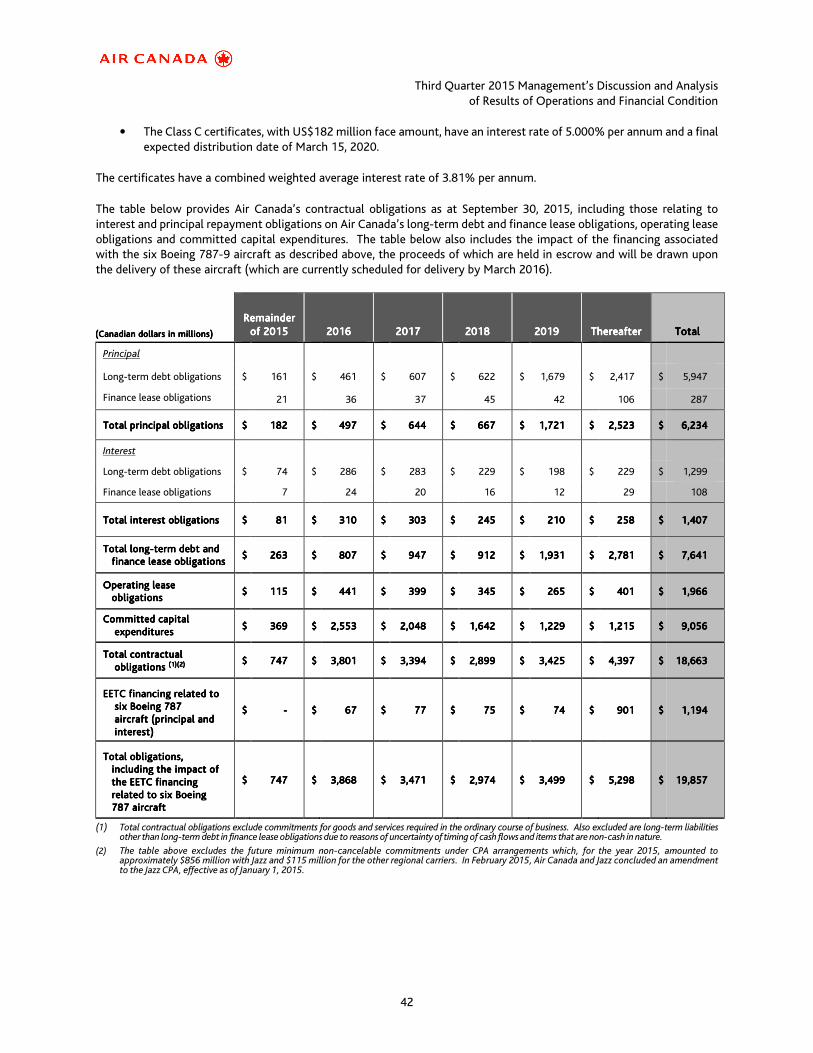
Third Quarter 2015 Management’s Discussion and Analysis of Results of Operations and Financial Condition
42
• The Class C certificates, with US$182 million face amount, have an interest rate of 5.000% per annum and a final expected distribution date of March 15, 2020.
The certificates have a combined weighted average interest rate of 3.81% per annum.
The table below provides Air Canada’s contractual obligations as at September 30, 2015, including those relating to interest and principal repayment obligations on Air Canada’s long-term debt and finance lease obligations, operating lease obligations and committed capital expenditures. The table below also includes the impact of the financing associated with the six Boeing 787-9 aircraft as described above, the proceeds of which are held in escrow and will be drawn upon the delivery of these aircraft (which are currently scheduled for delivery by March 2016).
(Canadian dollars in millions)(Canadian dollars in millions)(Canadian dollars in millions)(Canadian dollars in millions)
Remainder Remainder Remainder Remainder of of of of 2015201520152015
2016201620162016
2017201720172017
2012012012018888 2019201920192019
ThereafterThereafterThereafterThereafter
TotalTotalTotalTotal
Principal
Long-term debt obligations $ 161 $ 461 $ 607 $ 622 $ 1,679 $ 2,417 $ 5,947
Finance lease obligations 21 36 37 45 42 106 287
Total principal obligationsTotal principal obligationsTotal principal obligationsTotal principal obligations $$$$ 182182182182 $$$$ 497497497497 $$$$ 644644644644 $$$$ 667667667667 $$$$ 1,7211,7211,7211,721 $$$$ 2,5232,5232,5232,523 $$$$ 6,2346,2346,2346,234
Interest
Long-term debt obligations $ 74 $ 286 $ 283 $ 229 $ 198 $ 229 $ 1,299
Finance lease obligations 7 24 20 16 12 29 108
Total interest obligationsTotal interest obligationsTotal interest obligationsTotal interest obligations $$$$ 81818181 $$$$ 310310310310 $$$$ 303303303303 $$$$ 245245245245 $$$$ 210210210210 $$$$ 258258258258 $$$$ 1,4071,4071,4071,407
Total longTotal longTotal longTotal long----term debt andterm debt andterm debt andterm debt and finance lease obligationsfinance lease obligationsfinance lease obligationsfinance lease obligations
$$$$ 263263263263 $$$$ 807807807807 $$$$ 947947947947 $$$$ 912912912912 $$$$ 1,9311,9311,9311,931 $$$$ 2,7812,7812,7812,781 $$$$ 7,6417,6417,6417,641
Operating leaseOperating leaseOperating leaseOperating lease obligations obligations obligations obligations
$$$$ 115115115115 $$$$ 441441441441 $$$$ 399399399399 $$$$ 345345345345 $$$$ 265265265265 $$$$ 401401401401 $$$$ 1,9661,9661,9661,966
Committed capital Committed capital Committed capital Committed capital expendituresexpendituresexpendituresexpenditures
$$$$ 369369369369 $$$$ 2,5532,5532,5532,553 $$$$ 2,0482,0482,0482,048 $$$$ 1,6421,6421,6421,642 $$$$ 1,2291,2291,2291,229 $$$$ 1,2151,2151,2151,215 $$$$ 9,0569,0569,0569,056
Total contractual Total contractual Total contractual Total contractual obligations obligations obligations obligations (1)(1)(1)(1)(2)(2)(2)(2)
$$$$ 747747747747 $$$$ 3,8013,8013,8013,801 $$$$ 3,3943,3943,3943,394 $$$$ 2,8992,8992,8992,899 $$$$ 3,4253,4253,4253,425 $$$$ 4,3974,3974,3974,397 $$$$ 18,66318,66318,66318,663
EETC financing related to EETC financing related to EETC financing related to EETC financing related to sixsixsixsix Boeing 787 Boeing 787 Boeing 787 Boeing 787 aircraft (principal and aircraft (principal and aircraft (principal and aircraft (principal and interest)interest)interest)interest)
$$$$ ---- $$$$ 67676767 $$$$ 77777777 $$$$ 75757575 $$$$ 74747474 $$$$ 901901901901 $$$$ 1,1941,1941,1941,194
Total obligations, Total obligations, Total obligations, Total obligations, including the impact of including the impact of including the impact of including the impact of the EETC financing the EETC financing the EETC financing the EETC financing related to related to related to related to sixsixsixsix Boeing Boeing Boeing Boeing 787787787787 aircraftaircraftaircraftaircraft
$$$$ 747747747747 $$$$ 3,8683,8683,8683,868 $$$$ 3,4713,4713,4713,471 $$$$ 2,9742,9742,9742,974 $$$$ 3,4993,4993,4993,499 $$$$ 5,2985,2985,2985,298 $$$$ 19,19,19,19,857857857857
(1) Total contractual obligations exclude commitments for goods and services required in the ordinary course of business. Also excluded are long-term liabilities other than long-term debt in finance lease obligations due to reasons of uncertainty of timing of cash flows and items that are non-cash in nature.
(2) The table above excludes the future minimum non-cancelable commitments under CPA arrangements which, for the year 2015, amounted to approximately $856 million with Jazz and $115 million for the other regional carriers. In February 2015, Air Canada and Jazz concluded an amendment to the Jazz CPA, effective as of January 1, 2015.

Third Quarter 2015 Management’s Discussion and Analysis of Results of Operations and Financial Condition
43
7.9.7.9.7.9.7.9. Share InformationShare InformationShare InformationShare Information
The issued and outstanding shares of Air Canada, along with shares potentially issuable, as of the dates indicated below, are as follows:
SeptemberSeptemberSeptemberSeptember 30, 201530, 201530, 201530, 2015 DecemberDecemberDecemberDecember 31, 201431, 201431, 201431, 2014
Issued and outstanding Issued and outstanding Issued and outstanding Issued and outstanding sharessharessharesshares
Variable voting shares 90,302,896 69,232,535
Voting shares 193,465,645 217,256,759
Total issued and outstanding sharesTotal issued and outstanding sharesTotal issued and outstanding sharesTotal issued and outstanding shares 283,768,541283,768,541283,768,541283,768,541 286,489,294286,489,294286,489,294286,489,294
Class A variable voting and Class BClass A variable voting and Class BClass A variable voting and Class BClass A variable voting and Class B voting shares potentially issuablevoting shares potentially issuablevoting shares potentially issuablevoting shares potentially issuable
Stock options 10,041,440 10,002,975
Total shares potentially issuableTotal shares potentially issuableTotal shares potentially issuableTotal shares potentially issuable 10,041,44010,041,44010,041,44010,041,440 10,002,97510,002,97510,002,97510,002,975
Total outstanding and potentially issuableTotal outstanding and potentially issuableTotal outstanding and potentially issuableTotal outstanding and potentially issuable sssshareshareshareshares 293,809,981293,809,981293,809,981293,809,981 296,492,269296,492,269296,492,269296,492,269
Issuer Bid
In May 2015, Air Canada announced that it had received approval from the Toronto Stock Exchange (“TSX”) to implement a normal course issuer bid to purchase, for cancellation, up to 10,000,000 Class A variable voting shares and/or Class B voting shares (the “Shares”) representing, at that time, 3.49% of the total issued and outstanding shares. The repurchase program, which is authorized for the period from May 29, 2015 to May 28, 2016, being conducted through the facilities of the TSX.
Since commencing the bid, Air Canada purchased and cancelled 3,585,735 Shares for cash at an average cost of $11.59 per Share for aggregate consideration of $42 million.

Third Quarter 2015 Management’s Discussion and Analysis of Results of Operations and Financial Condition
44
8. QUARTERLY FINANCIAL DATA
The following table summarizes quarterly financial results for Air Canada for the last eight quarters. As of 2015, expenses incurred related to capacity purchase agreements are now presented in a separate line item on Air Canada’s consolidated statement of operations titled Regional airlines expense. Prior period amounts have been reclassified to conform to the current period presentation.
2013201320132013 2014201420142014 2015201520152015
(Canadian dollars in millions, except where (Canadian dollars in millions, except where (Canadian dollars in millions, except where (Canadian dollars in millions, except where indicated)indicated)indicated)indicated) Q4Q4Q4Q4 Q1Q1Q1Q1 Q2Q2Q2Q2 Q3Q3Q3Q3 Q4Q4Q4Q4 Q1Q1Q1Q1 Q2Q2Q2Q2 Q3Q3Q3Q3
Passenger 2,560 2,608 2,965 3,476 2,755 2,786 3,082 3,716
Cargo 128 119 122 128 133 129 123 119
Other 206 338 218 194 216 334 209 188
Operating revenuesOperating revenuesOperating revenuesOperating revenues $$$$ 2,8942,8942,8942,894 $$$$ 3,0653,0653,0653,065 $$$$ 3,303,303,303,305555 $$$$ 3,7983,7983,7983,798 $$$$ 3,104 3,104 3,104 3,104 $$$$ 3,2493,2493,2493,249 $$$$ 3,4143,4143,4143,414 $$$$ 4,0234,0234,0234,023
Aircraft fuel 713 793 835 939 680 592 648 697
Regional airlines expense
Aircraft fuel 118 125 127 137 111 86 97 95
Other 433 442 451 471 460 466 497 489
Wages, salaries & benefits (1) 540 557 535 549 590 568 568 598
Benefit plan amendments (82) - - - - - - -
Airport and navigation fees 167 183 186 208 178 185 201 223
Aircraft maintenance 141 162 171 158 187 188 190 192
Depreciation, amortization and impairment (2) 144 126 128 142 130 153 177 165
Sales and distribution costs 114 148 143 146 123 154 152 157
Ground package costs 66 170 77 56 74 181 84 63
Aircraft rent 73 76 76 74 76 82 84 89
Food, beverages and supplies 67 66 74 84 70 62 80 91
Communications and information technology 44 52 47 49 51 57 52 52
Other (3) 221 227 210 259 268 275 261 297
Operating expensesOperating expensesOperating expensesOperating expenses 2,7592,7592,7592,759 3,1273,1273,1273,127 3,060 3,060 3,060 3,060 3,2723,2723,2723,272 2,998 2,998 2,998 2,998 3,0493,0493,0493,049 3,0913,0913,0913,091 3,2083,2083,2083,208
Operating income (loss)Operating income (loss)Operating income (loss)Operating income (loss) 135135135135 (62)(62)(62)(62) 245 245 245 245 526526526526 106 106 106 106 200200200200 323323323323 815815815815
Foreign exchange gain (loss) (55) (161) 40 (71) (115) (408) 56 (251)
Interest income 10 9 9 11 10 9 12 12
Interest expense (73) (77) (81) (81) (83) (90) (94) (106)
Interest capitalized 10 5 10 6 9 9 21 20
Net financing expense relating to employee benefits
(53) (34) (34) (34) (32) (25) (25) (28)
Fuel and other derivatives 22 (15) 36 (31) 9 1 5 (20)
Other (2) (6) (2) (3) (4) (5) (2) (5)
Total nonTotal nonTotal nonTotal non----operatinoperatinoperatinoperating income g income g income g income (expense)(expense)(expense)(expense) ((((141)))) ((((279)))) (22)(22)(22)(22) (203)(203)(203)(203) (206)(206)(206)(206) (509)(509)(509)(509) (27)(27)(27)(27) (378)(378)(378)(378)
Income taxes - - - - - - - -
Net income (loss)Net income (loss)Net income (loss)Net income (loss) $$$$ (6)(6)(6)(6) $$$$ ((((341341341341)))) $$$$ 223223223223 $$$$ 323323323323 $$$$ (100)(100)(100)(100) $$$$ (309)(309)(309)(309) $$$$ 296296296296 $$$$ 437437437437
Diluted earnings per shareDiluted earnings per shareDiluted earnings per shareDiluted earnings per share $$$$ (0.(0.(0.(0.02020202)))) $$$$ (1.(1.(1.(1.20202020)))) $$$$ 0.750.750.750.75 $$$$ 1.101.101.101.10 $$$$ (0.35)(0.35)(0.35)(0.35) $$$$ (1.08)(1.08)(1.08)(1.08) $$$$ 1.001.001.001.00 $$$$ 1.481.481.481.48
EBITDAR, excluding EBITDAR, excluding EBITDAR, excluding EBITDAR, excluding benefit benefit benefit benefit planplanplanplan amendments amendments amendments amendments ((((4444))))
$$$$ 277277277277 $$$$ 147147147147 $$$$ 456456456456 $$$$ 749749749749 $$$$ 319319319319 $$$$ 442442442442 $$$$ 591591591591 $$$$ 1,0761,0761,0761,076
EBITDAR EBITDAR EBITDAR EBITDAR (4(4(4(4)))) $$$$ 359359359359 $$$$ 147147147147 $$$$ 456456456456 $$$$ 749749749749 $$$$ 319319319319 $$$$ 442442442442 $$$$ 591591591591 $$$$ 1,0761,0761,0761,076
Adjusted net income (Adjusted net income (Adjusted net income (Adjusted net income (loss)loss)loss)loss) (5(5(5(5)))) $$$$ 3333 $$$$ ((((132132132132)))) $$$$ 139139139139 $$$$ 457457457457 $$$$ 67676767 $$$$ 122122122122 $$$$ 250250250250 $$$$ 734734734734
Adjusted Adjusted Adjusted Adjusted earningsearningsearningsearnings per per per per shareshareshareshare –––– diluted diluted diluted diluted (5(5(5(5)))) $$$$ 0.0.0.0.01010101 $$$$ (0.(0.(0.(0.46464646)))) $$$$ 0.470.470.470.47 $$$$ 1.551.551.551.55 $$$$ 0.230.230.230.23 $$$$ 0.410.410.410.41 $$$$ 0.850.850.850.85 $$$$ 2.52.52.52.50000

Third Quarter 2015 Management’s Discussion and Analysis of Results of Operations and Financial Condition
45
(1) In the fourth quarter of 2014, one-time payments totaling $30 million were made to ACPA members under a collective agreement concluded in October 2014.
(2) In the second quarter of 2015, Air Canada recorded impairment charges of $14 million related to the planned disposal of two Airbus A340-300 aircraft in the second half of 2015 (neither of which was operated by Air Canada).
(3) In the second quarter of 2015, Air Canada recorded favourable tax-related provision adjustments of $23 million. In the second quarter of 2014, Air Canada recorded favourable tax-related provision adjustments of $41 million.
(4) EBITDAR (earnings before interest, taxes, depreciation, amortization, impairment and aircraft rent) is a non-GAAP financial measure. Refer to section 16 "Non-GAAP Financial Measures" of this MD&A for additional information.
(5) Adjusted net income (loss) and adjusted earnings (loss) per share – diluted are non-GAAP financial measures. Refer to section 16 “Non-GAAP Financial Measures” of this MD&A for additional information.
The following table provides a breakdown of the most significant items included in other expenses for the last eight quarters:
2013201320132013 2014201420142014 2015201520152015
(Canadian dollars in millions)(Canadian dollars in millions)(Canadian dollars in millions)(Canadian dollars in millions) Q4Q4Q4Q4 Q1Q1Q1Q1 Q2Q2Q2Q2 Q3Q3Q3Q3 Q4Q4Q4Q4 Q1Q1Q1Q1 Q2Q2Q2Q2 Q3Q3Q3Q3
Terminal handling 39 42 47 54 47 50 59 65
Crew cycle 31 32 35 38 36 35 36 43
Building rent and maintenance 33 36 36 35 31 36 36 36
Miscellaneous fees and services 27 25 33 31 30 31 35 32
Remaining other expenses 91 92 59 101 124 123 95 121
Total other expensesTotal other expensesTotal other expensesTotal other expenses $ 221$ 221$ 221$ 221 $ 227$ 227$ 227$ 227 $ 210$ 210$ 210$ 210 $ 259$ 259$ 259$ 259 $ 268$ 268$ 268$ 268 $ 275$ 275$ 275$ 275 $ 261$ 261$ 261$ 261 297297297297
The following table provides a breakdown of the most significant items included in regional airlines expense for the last eight quarters:
2013201320132013 2014201420142014 2015201520152015
(Canadian dollars in millions)(Canadian dollars in millions)(Canadian dollars in millions)(Canadian dollars in millions) Q4Q4Q4Q4 Q1Q1Q1Q1 Q2Q2Q2Q2 Q3Q3Q3Q3 Q4Q4Q4Q4 Q1Q1Q1Q1 Q2Q2Q2Q2 Q3Q3Q3Q3
Capacity purchase fees 280 281 294 312 295 274 302 298
Aircraft fuel 118 125 127 137 111 86 97 95
Airport and navigation fees 65 64 70 73 69 65 70 74
Sales and distribution costs 24 27 28 27 30 33 33 32
Depreciation, amortization and impairment
5 4 4 4 4 4 4 4
Aircraft rent 2 3 3 3 3 3 3 3
Other operating expenses 57 63 52 52 59 87 85 78
Total regional airlines expenseTotal regional airlines expenseTotal regional airlines expenseTotal regional airlines expense $ 551$ 551$ 551$ 551 $ 567$ 567$ 567$ 567 $ 578$ 578$ 578$ 578 $ 608$ 608$ 608$ 608 $ 571$ 571$ 571$ 571 $ 552$ 552$ 552$ 552 $$$$ 594594594594 584584584584

Third Quarter 2015 Management’s Discussion and Analysis of Results of Operations and Financial Condition
46
The following table provides major quarterly operating statistics for Air Canada for the last eight quarters.
2013201320132013 2014201420142014 2015201520152015
Q4Q4Q4Q4 Q1Q1Q1Q1 Q2Q2Q2Q2 Q3Q3Q3Q3 Q4Q4Q4Q4 Q1Q1Q1Q1 Q2Q2Q2Q2 Q3Q3Q3Q3
Revenue passenger miles (millions) 12,882 13,466 15,495 18,565 14,090 14,937 16,845 20,462
Available seat miles (millions) 16,033 16,774 18,413 21,299 17,403 18,335 20,132 23,535
Passenger load factor (%) 80.3 80.3 84.2 87.2 81.0 81.5 83.7 86.9
Passenger PRASM (cents) 15.7 15.3 15.9 16.1 15.6 14.9 15.0 15.5
CASM 17.2 18.6 16.6 15.4 17.2 16.6 15.4 13.6
CASM, excluding benefit plan amendments (cents)
17.7 18.6 16.6 15.4 17.2 16.6 15.4 13.6
Adjusted CASM (cents) (1) 12.1 12.2 11.2 10.1 12.1 11.9 11.3 10.0
Economic fuel price per litre (cents) (2) 88.4 94.7 91.6 90.0 80.7 66.3 66.9 61.4
(1) Adjusted CASM is a non-GAAP financial measure. Refer to section 16 “Non-GAAP Financial Measures” of this MD&A for additional information.
(2) Includes aircraft fuel expense related to regional airline operations. Includes fuel handling expenses. Economic fuel price per litre is a non-GAAP financial measure. Refer to section 4 “Results of Operations” of this MD&A for additional information.
Third Quarter 2015 Management’s Discussion and Analysis of Results of Operations and Financial Condition
47
9. FINANCIAL INSTRUMENTS AND RISK MANAGEMENT
Summary of Summary of Summary of Summary of Fuel and Other DerivativesFuel and Other DerivativesFuel and Other DerivativesFuel and Other Derivatives
The following is a summary of fuel and other derivatives included in non-operating income (expense) on Air Canada’s consolidated statement of operations for the periods indicated:
ThirdThirdThirdThird QuarterQuarterQuarterQuarter First First First First NineNineNineNine MonthsMonthsMonthsMonths
(Canadian dollars in millions)(Canadian dollars in millions)(Canadian dollars in millions)(Canadian dollars in millions) 2012012012015555 2014201420142014 2015201520152015 2014201420142014
Fuel derivatives $ (7) $ (24) $ (11) $ (18)
Share forward contracts (14) (7) (5) 7
Interest rate swaps 1 - 2 1
Total fTotal fTotal fTotal fuel and other derivativesuel and other derivativesuel and other derivativesuel and other derivatives $$$$ (20)(20)(20)(20) $$$$ (31)(31)(31)(31) $$$$ (14)(14)(14)(14) $$$$ (10)(10)(10)(10)
RiskRiskRiskRisk ManagementManagementManagementManagement
Under its risk management policy, Air Canada manages its interest rate risk, foreign exchange risk, share-based compensation risk and market risk through the use of various derivative financial instruments. Air Canada uses derivative financial instruments only for risk management purposes, not for generating trading profit. As such, any change in cash flows associated with derivative instruments is designed to be offset by changes in cash flows related to the risk being hedged.
Air Canada engages in derivative hedging in an effort to mitigate various risks. The derivative fair values represent the amount of the consideration that could be exchanged in an arm’s length transaction between willing parties who are under no compulsion to act. Fair value of these derivatives is determined using active markets, where available. When no such market is available, valuation techniques are applied such as discounted cash flow analysis. Where practical, the valuation technique incorporates all factors that would be considered in setting a price, including Air Canada’s own credit risk and the credit risk of the counterparty.
Fuel Price Risk ManagementFuel Price Risk ManagementFuel Price Risk ManagementFuel Price Risk Management
Fuel price risk is the risk that future cash flows will fluctuate because of changes in base jet fuel prices. In order to manage its exposure to jet fuel prices and to help mitigate volatility in operating cash flows, Air Canada enters into crude oil-based derivative contracts with financial intermediaries. Air Canada’s policy permits hedging of up to 75% of the projected jet fuel purchases for the next 12 months, 50% for the next 13 to 24 months and 25% for the next 25 to 36 months. These are maximum (but not mandated) limits. There is no minimum monthly hedging requirement. There are regular reviews to adjust the strategy in light of market conditions.
In the third quarter of 2015:
• Air Canada recorded a loss of $7 million in fuel and other derivatives related to fuel derivatives (a loss of $11 million in the first nine months of 2015; losses of $24 million and $18 million in the third quarter of 2014 and in the first nine months of 2014, respectively). These derivatives were not designated as hedges for accounting purposes.
• Air Canada purchased crude-oil call options covering a portion of 2015 and 2016 fuel exposures. The cash premium related to these contracts was $10 million ($27 million in the first nine months of 2015; $11 million and $31 million in the third quarter of 2014 and in the first nine months of 2014, respectively, for 2014 and 2015 exposures).

Third Quarter 2015 Management’s Discussion and Analysis of Results of Operations and Financial Condition
48
• Fuel derivative contracts cash settled with a net fair value of nil ($1 million in favour of Air Canada in the first nine months of 2015; $6 million and $24 million in favour of Air Canada in the third quarter of 2014 and in the first nine months of 2014, respectively).
Air Canada applies fuel hedge accounting for certain designated fuel derivatives prospectively from April 1, 2015. In the third quarter of 2015, the fair value decrease of $9 million ($10 million in the first nine months of 2015) for derivatives under hedge accounting was deferred as a cost of the hedge in other comprehensive income and will be reclassified to aircraft fuel expense when the underlying hedged jet fuel is used.
A summary of amounts related to fuel derivatives designated as hedging instruments at September 30, 2015 is presented below.
CarryingCarryingCarryingCarrying amount of the hedging instrumentamount of the hedging instrumentamount of the hedging instrumentamount of the hedging instrument
Nominal amount Nominal amount Nominal amount Nominal amount of the hedging of the hedging of the hedging of the hedging instrument (in instrument (in instrument (in instrument (in
barrels)barrels)barrels)barrels)
AssetsAssetsAssetsAssets LiabilitiesLiabilitiesLiabilitiesLiabilities Consolidated Consolidated Consolidated Consolidated
statement of financial statement of financial statement of financial statement of financial position classificationposition classificationposition classificationposition classification
Changes in fair Changes in fair Changes in fair Changes in fair value used for value used for value used for value used for
calculating calculating calculating calculating hedge hedge hedge hedge
ineffectivenessineffectivenessineffectivenessineffectiveness
Cash flow hedgeCash flow hedgeCash flow hedgeCash flow hedge
Fuel price risk – option contracts 5,274,000 $ 10 $ -
Prepaid expenses and other current assets $ -
As of September 30, 2015, and based on the derivate structures in place as of that date, approximately 40% of Air Canada’s anticipated purchases of jet fuel for the remainder of 2015 is hedged at an average West Texas Intermediate (“WTI”) equivalent capped price of US$65 per barrel for WTI prices up to US$67 per barrel and an average equivalent capped price of US$67 per barrel for WTI prices above US$70 per barrel. Air Canada’s contracts to hedge anticipated jet fuel purchases over the remainder of 2015 are comprised of call options with notional volumes of 2,580,000 barrels. Air Canada has also hedged approximately 9% of its 2016 anticipated jet fuel purchases with call options with notional volumes of 2,694,000 barrels at an average WTI equivalent capped price of US$53 per barrel. The fair value of the fuel derivatives portfolio at September 30, 2015 was $10 million in favour of Air Canada (as at December 31, 2014 – $4 million in favour of Air Canada) and is recorded within prepaid expenses and other current assets on Air Canada’s consolidated statement of financial condition.
Foreign Exchange RiskForeign Exchange RiskForeign Exchange RiskForeign Exchange Risk ManagementManagementManagementManagement
Air Canada’s financial results are reported in Canadian dollars, while a large portion of its expenses, debt obligations and capital commitments are in foreign currencies, primarily in U.S. dollars. Foreign exchange risk is the risk that fluctuations in foreign exchange rates may have on operating results and cash flows.
In order to manage exposure to the U.S dollar and other foreign exchange exposures, Air Canada holds U.S. dollar cash reserves and enters into currency derivative contracts. These derivatives and U.S. dollar cash reserves serve to mitigate the cash flow exposure from adverse currency movements. The result of these hedging activities is recorded as a Foreign exchange gain or loss in non-operating expense on Air Canada’s consolidated statement of operations (not within operating income).
Air Canada’s risk management objective is to reduce cash flow risk related to foreign denominated cash flows.
The level of foreign exchange derivatives entered into and their related maturity dates are dependent upon a number of factors, which include the amount of foreign revenue conversion available, U.S. dollar net cash flows, as well as the amount attributed to aircraft and debt payments. For the net U.S. dollar shortfall, the Corporation has targeted 70% coverage on a rolling 18-month basis. Based on the notional amount of currency derivatives outstanding at September 30, 2015, as further described below, approximately 49% of net U.S. cash outflows is hedged for the remainder of 2015 and 64% for the following 15 months, resulting in a derivative coverage of 62% over the next 18 months. U.S. dollar cash and investment reserves combined with the derivative coverage results in a coverage of 69%.
Third Quarter 2015 Management’s Discussion and Analysis of Results of Operations and Financial Condition
49
As at September 30, 2015, Air Canada had outstanding foreign currency options and swap agreements, settling in 2015 and 2016, to purchase at maturity $2,912 million (US$2,184 million) of U.S. dollars at a weighted average rate of $1.2359 per US$1.00 (as at December 31, 2014 – $2,658 million (US$2,292 million) with settlements in 2015 and 2016 at a weighted average rate of $1.0884 per US$1.00). Air Canada also has protection in place to sell a portion of its excess Euros, Sterling and Yen (EUR $8 million, GBP $6 million, JPY $356 million) which settle in 2015 at weighted average rates of $1.1850, $1.5667, and $0.0084 per US$1.00, respectively, and to sell a portion of its excess Yuan (CNY $233 million) which settles in 2016 at a weighted average price of $0.1548 per US$1.00 (as at December 31, 2014 - EUR $35 million, GBP $27 million with settlement in 2015 at weighted average rates of $1.2806 and $1.6217, respectively, per US$1.00).
The hedging structures put in place have various option pricing features, such as knock-out terms and profit cap limitations, and based on the assumed volatility used in the fair value calculation, the net fair value of these foreign currency contracts as at September 30, 2015 was $61 million in favour of Air Canada (as at December 31, 2014 – $30 million in favour of Air Canada). These derivative instruments have not been designated as hedges for accounting purposes and are recorded at fair value. In the third quarter of 2015, a gain of $77 million was recorded in foreign exchange gain (loss) related to these derivatives (a gain of $118 million in the first nine months of 2015; gains of $126 million and $33 million, respectively, in the third quarter of 2014 and in the first nine months of 2014). In the third quarter of 2015, foreign exchange derivative contracts cash settled with a net fair value of $27 million in favour of Air Canada ($87 million in favour of Air Canada in the first nine months of 2015, $3 million in favour of the counterparties and $29 million in favour of Air Canada, respectively, in the third quarter of 2014 and in the first nine months of 2014).
Air Canada also holds U.S. cash and investment reserves as an economic hedge against changes in the value of the U.S. dollar. U.S. dollar cash and short-term investment balances as at September 30, 2015 amounted to $750 million or US$563 million ($717 million or US$620 million as at December 31, 2014). In the third quarter of 2015, an unrealized loss of $53 million was recorded in Foreign exchange gain (loss) reflecting the change in Canadian equivalent market value of the U.S. dollar cash and short-term investment balances held ($112 million in favour of Air Canada in the first nine months of 2015; unrealized gain of $42 million and $34 million, respectively, in the third quarter of 2014 and in the first nine months of 2014).
Update on Foreign Exchange Sensitivity
Information on Air Canada’s sensitivity of results to various economic assumptions is disclosed in section 17 “Sensitivity of Results” of Air Canada’s 2014 MD&A. Given the decrease in the price of jet fuel, Air Canada’s net exposure to the U.S. dollar has also declined. As a result, the annual pre-tax income impact of a one cent change in the Canadian dollar versus the U.S. dollar has decreased from $45 million to approximately $34 million.
10. CRITICAL ACCOUNTING ESTIMATES
Information on Air Canada’s critical accounting estimates is disclosed in section 13 “Critical Accounting Estimates” of Air Canada’s 2014 MD&A. There have been no material changes to Air Canada’s critical accounting estimates from what was disclosed at that time.
11. ACCOUNTING POLICIES
Air Canada’s accounting policies are as disclosed in Air Canada’s audited consolidated financial statements and notes for 2014. There have been no material changes to Air Canada’s accounting policies from what was disclosed at that time with the exception that Air Canada has early adopted the new accounting standard IFRS 9 – Financial Instruments with a date of initial application of January 1, 2015. The adoption of this standard has no impact on Air Canada’s consolidated financial statements on date of adoption or for comparative periods. Air Canada began to apply hedge accounting for certain designated fuel derivatives prospectively from April 1, 2015. Crude oil prices, while not contractually specified in Air Canada’s jet fuel purchase contracts, are economically related to jet fuel prices. Air Canada enters into option contracts on crude oil and designates the contracts in cash flow hedges of the crude oil component of its future jet fuel purchases. Air Canada has established a hedge ratio of 1:1 for its hedging relationships. Under hedge accounting, the effective gain or loss on fuel hedging derivatives is recorded in other comprehensive income and reclassified to aircraft fuel expense when the underlying jet fuel being hedged is used. Premiums paid for option contracts and the time value of the option

Third Quarter 2015 Management’s Discussion and Analysis of Results of Operations and Financial Condition
50
contracts are deferred as a cost of the hedge in other comprehensive income and reclassified to aircraft fuel expense when the underlying hedged jet fuel is used. Any ineffective gain or loss on fuel hedging derivatives is recorded in non-operating expense in fuel and other derivatives on Air Canada’s consolidated statement of operations.
Accounting Standards and Amendments Issued but Not Yet AdoptedAccounting Standards and Amendments Issued but Not Yet AdoptedAccounting Standards and Amendments Issued but Not Yet AdoptedAccounting Standards and Amendments Issued but Not Yet Adopted
IFRS 15 – Revenue from Contracts with Customers
IFRS 15 replaces IAS 18 Revenue and related interpretations. The core principle of the new standard is to recognize revenue to depict the transfer of goods or services to customers in amounts that reflect the consideration to which the Corporation expects to be entitled in exchange for those goods or services. In July, 2015, the International Accounting Standards Board confirmed a deferral of the effective date by one year to January 1, 2018, with earlier application permitted. Air Canada continues to evaluate the impact that the adoption of this standard may have on its consolidated financial statements.
12. OFF-BALANCE SHEET ARRANGEMENTS
Information on Air Canada’s off-balance sheet arrangements is disclosed in section 15 “Off-Balance Sheet Arrangements” of Air Canada’s 2014 MD&A. There have been no material changes to Air Canada’s off-balance sheet arrangements from what was disclosed at that time.
13. RELATED PARTY TRANSACTIONS
At September 30, 2015, Air Canada had no transactions with related parties as defined in the CPA Handbook, except those pertaining to transactions with key management personnel in the ordinary course of their employment or directorship agreements.
14. RISK FACTORS
For a detailed description of risk factors associated with Air Canada and its business, refer to section 18 “Risk Factors” of Air Canada’s 2014 MD&A. Air Canada is not aware of any significant changes to its risk factors from those disclosed at that time.
15. CONTROLS AND PROCEDURES
Disclosure Controls and Procedures and Internal Controls over Financial Disclosure Controls and Procedures and Internal Controls over Financial Disclosure Controls and Procedures and Internal Controls over Financial Disclosure Controls and Procedures and Internal Controls over Financial ReportingReportingReportingReporting
Disclosure controls and procedures within the Corporation have been designed to provide reasonable assurance that all relevant information is identified to its President and Chief Executive Officer (“CEO”), its Executive Vice President and Chief Financial Officer (“CFO”) and its Disclosure Policy Committee to ensure appropriate and timely decisions are made regarding public disclosure.
Internal controls over financial reporting have been designed by management, under the supervision of, and with the participation of the Corporation's CEO and CFO, to provide reasonable assurance regarding the reliability of the Corporation’s financial reporting and its preparation of financial statements for external purposes in accordance with GAAP.
In the Corporation’s 2014 filings, the Corporation’s CEO and CFO certified, as required by National Instrument 52-109, the appropriateness of the financial disclosure, the design and effectiveness of the Corporation’s disclosure controls and procedures and the design and effectiveness of internal controls over financial reporting.
In the Corporation’s third quarter 2015 filings, the Corporation’s CEO and CFO certified, as required by National Instrument 52-109, the appropriateness of the financial disclosure, the design of the Corporation’s disclosure controls and procedures and the design of internal controls over financial reporting.
Third Quarter 2015 Management’s Discussion and Analysis of Results of Operations and Financial Condition
51
The Corporation’s Audit, Finance and Risk Committee reviewed this MD&A and the interim unaudited condensed consolidated financial statements and notes, and the Corporation’s Board of Directors approved these documents prior to their release.
Changes in Changes in Changes in Changes in Internal Controls over Financial ReportingInternal Controls over Financial ReportingInternal Controls over Financial ReportingInternal Controls over Financial Reporting
There have been no changes to the Corporation’s internal controls over financial reporting during the quarter ended September 30, 2015 that have materially affected, or are reasonably likely to materially affect, its internal controls over financial reporting.

Third Quarter 2015 Management’s Discussion and Analysis of Results of Operations and Financial Condition
52
16. NON-GAAP FINANCIAL MEASURES
EBITDAREBITDAREBITDAREBITDAR
EBITDAR (earnings before interest, taxes, depreciation, amortization and impairment, and aircraft rent) is a non-GAAP financial measure commonly used in the airline industry to view operating results before depreciation, amortization and impairment, and aircraft rent as these costs can vary significantly among airlines due to differences in the way airlines finance their aircraft and other assets. EBITDAR is not a recognized measure for financial statement presentation under GAAP, does not have a standardized meaning, and may not be comparable to similar measures presented by other public companies.
EBITDAR is reconciled to operating income as follows:
ThirdThirdThirdThird QuarterQuarterQuarterQuarter First First First First NineNineNineNine MonthsMonthsMonthsMonths
(Canadian dollars in millions)(Canadian dollars in millions)(Canadian dollars in millions)(Canadian dollars in millions) 2015201520152015 2014201420142014 $ Change$ Change$ Change$ Change 2015201520152015 2014201420142014 $ Change$ Change$ Change$ Change
OOOOperating incomeperating incomeperating incomeperating income –––– GAAPGAAPGAAPGAAP $$$$ 815815815815 $$$$ 526526526526 $$$$ 289289289289 $$$$ 1,3381,3381,3381,338 $$$$ 709709709709 $$$$ 629629629629
Add backAdd backAdd backAdd back ((((as reflected on as reflected on as reflected on as reflected on AirAirAirAir Canada’sCanada’sCanada’sCanada’s consolconsolconsolconsolidated statementidated statementidated statementidated statement of operations)of operations)of operations)of operations)::::
Depreciation, amortization and impairment
165 142 23 495 396 99
Aircraft rent 89 74 15 255 226 29
Add backAdd backAdd backAdd back ((((included inincluded inincluded inincluded in RegionalRegionalRegionalRegional airlines expenseairlines expenseairlines expenseairlines expense))))::::
Depreciation, amortization and impairment
4 4 - 12 12 -
Aircraft rent 3 3 - 9 9 -
EBITDAREBITDAREBITDAREBITDAR $$$$ 1,0761,0761,0761,076 $$$$ 749749749749 $$$$ 327327327327 $$$$ 2,1092,1092,1092,109 $$$$ 1,3521,3521,3521,352 $$$$ 757757757757
Adjusted CASMAdjusted CASMAdjusted CASMAdjusted CASM
Air Canada uses adjusted CASM to assess the operating and cost performance of its ongoing airline business without the effects of aircraft fuel expense, the cost of ground packages at Air Canada Vacations, and unusual items as these items may distort the analysis of certain business trends and render comparative analysis to other airlines less meaningful.
Adjusted CASM is not a recognized measure for financial statement presentation under GAAP, does not have a standardized meaning and may not be comparable to similar measures presented by other public companies.
Aircraft fuel expense is excluded from operating expense results as it fluctuates widely depending on many factors, including international market conditions, geopolitical events, jet fuel refining costs and Canada/U.S. currency exchange rates. Air Canada also incurs expenses related to ground packages at Air Canada Vacations which some airlines, without comparable tour operator businesses, may not incur. In addition, these costs do not generate ASMs and therefore excluding these costs from operating expense results provides for a more meaningful comparison across periods when such costs may vary.
Therefore, excluding aircraft fuel expense, the cost of ground packages at Air Canada Vacations, and unusual items from operating expenses generally allows for more meaningful analysis of Air Canada’s operating expense performance and a more meaningful comparison to those of other airlines.

Third Quarter 2015 Management’s Discussion and Analysis of Results of Operations and Financial Condition
53
Adjusted CASM is reconciled to GAAP operating expense as follows:
ThirdThirdThirdThird QuarterQuarterQuarterQuarter First First First First NineNineNineNine MonthsMonthsMonthsMonths
(Canadian dollars in millions, except where (Canadian dollars in millions, except where (Canadian dollars in millions, except where (Canadian dollars in millions, except where indicated)indicated)indicated)indicated) 2015201520152015 2014201420142014 $ Change$ Change$ Change$ Change 2015201520152015 2014201420142014 $ Change$ Change$ Change$ Change
OOOOperating expenseperating expenseperating expenseperating expense –––– GAAPGAAPGAAPGAAP $$$$ 3,2083,2083,2083,208 $$$$ 3,3,3,3,272272272272 $$$$ (64(64(64(64)))) $$$$ 9,3489,3489,3489,348 $$$$ 9,4599,4599,4599,459 $$$$ (111(111(111(111))))
Adjusted forAdjusted forAdjusted forAdjusted for::::
Aircraft fuel expense (as reflected on Air Canada’s consolidated statement of operations)
(697) (939) 242 (1,937) (2,567) 630
Aircraft fuel expense (included in Regional airlines expense)
(95) (137) 42 (278) (389) 111
Tax-related provision adjustments - - - 23 41 (18)
Impairment charges - - - (14) - (14)
Ground package costs at Air Canada Vacations
(63) (56) (7) (328) (303) (25)
Operating expense, Operating expense, Operating expense, Operating expense, adjusted foradjusted foradjusted foradjusted for the the the the aboveaboveaboveabove----noted itemsnoted itemsnoted itemsnoted items
$$$$ 2,3532,3532,3532,353 $$$$ 2,1402,1402,1402,140 $$$$ 213213213213 $$$$ 6,8146,8146,8146,814 $$$$ 6,2416,2416,2416,241 $$$$ 573573573573
ASMs (millions)ASMs (millions)ASMs (millions)ASMs (millions) 23,53523,53523,53523,535 21,29921,29921,29921,299 10.5%10.5%10.5%10.5% 62,00262,00262,00262,002 56,48656,48656,48656,486 9.8%9.8%9.8%9.8%
Adjusted CASM (cents)Adjusted CASM (cents)Adjusted CASM (cents)Adjusted CASM (cents) ¢¢¢¢ 10.0010.0010.0010.00 ¢¢¢¢ 10.0510.0510.0510.05 (0.5)(0.5)(0.5)(0.5)%%%% ¢¢¢¢ 10.9910.9910.9910.99 ¢¢¢¢ 11.0511.0511.0511.05 (0.5(0.5(0.5(0.5)%)%)%)%

Third Quarter 2015 Management’s Discussion and Analysis of Results of Operations and Financial Condition
54
Adjusted Adjusted Adjusted Adjusted Net Net Net Net IncomeIncomeIncomeIncome and Adjusted and Adjusted and Adjusted and Adjusted EarningsEarningsEarningsEarnings pppper Shareer Shareer Shareer Share –––– DDDDilutedilutedilutediluted
Air Canada uses adjusted net income and adjusted earnings per share – diluted to assess the overall financial performance of its business without the effects of foreign exchange, net financing income (expense) relating to employee benefits, mark-to-market adjustments on fuel and other derivatives and unusual items as these items may distort the analysis of certain business trends and render comparative analysis to other airlines less meaningful. Air Canada also uses adjusted net income as a measure to determine return on invested capital which is further described below. These measures are not recognized measures for financial statement presentation under GAAP, do not have a standardized meaning and may not be comparable to similar measures presented by other public companies.
ThirdThirdThirdThird QuarterQuarterQuarterQuarter First First First First NineNineNineNine MonthsMonthsMonthsMonths
(Canadian (Canadian (Canadian (Canadian dollars in millions, except per dollars in millions, except per dollars in millions, except per dollars in millions, except per share values)share values)share values)share values)
2015201520152015 2014201420142014 $ Change$ Change$ Change$ Change 2015201520152015 2014201420142014 $ Change$ Change$ Change$ Change
Net Net Net Net incomeincomeincomeincome attributable to attributable to attributable to attributable to sssshareholdershareholdershareholdershareholders of Air Canadaof Air Canadaof Air Canadaof Air Canada
$$$$ 435435435435 $$$$ 321321321321 $$$$ 114114114114 $$$$ 420420420420 $$$$ 201201201201 $$$$ 219219219219
Adjusted forAdjusted forAdjusted forAdjusted for::::
Tax-related provision adjustments - - - (23) (41) 18
Impairment charges - - - 14 - 14
Foreign exchange loss 251 71 180 603 192 411
Net financing expense relating to employee benefits
28 34 (6) 78 102 (24)
Loss on fuel and other derivatives 20 31 (11) 14 10 4
Adjusted Adjusted Adjusted Adjusted net incomenet incomenet incomenet income $$$$ 734734734734 $$$$ 457457457457 $$$$ 277277277277 $$$$ 1,1,1,1,106106106106 $$$$ 464464464464 $$$$ 642642642642
Weighted average number of outstanding shares used in computing diluted income per share (in millions)
294 294 - 293 293 -
Adjusted Adjusted Adjusted Adjusted earningsearningsearningsearnings per share per share per share per share –––– diluteddiluteddiluteddiluted $$$$ 2.52.52.52.50000 $$$$ 1.551.551.551.55 $$$$ 0.950.950.950.95 $$$$ 3.773.773.773.77 $$$$ 1.581.581.581.58 $$$$ 2.192.192.192.19
The following reflects the share amounts used in the computation of basic and diluted earnings per share on an adjusted earnings per share basis:
ThirdThirdThirdThird QuarterQuarterQuarterQuarter First First First First NineNineNineNine MonthsMonthsMonthsMonths
(in millions)(in millions)(in millions)(in millions) 2015201520152015 2014201420142014 2015201520152015 2014201420142014
Weighted average number of shares outstanding Weighted average number of shares outstanding Weighted average number of shares outstanding Weighted average number of shares outstanding –––– basic basic basic basic 287287287287 286286286286 286286286286 286286286286
Effect of dilution 7 8 7 7
Weighted average number of shares outstanding Weighted average number of shares outstanding Weighted average number of shares outstanding Weighted average number of shares outstanding –––– diluteddiluteddiluteddiluted 294294294294 294294294294 293293293293 293293293293

Third Quarter 2015 Management’s Discussion and Analysis of Results of Operations and Financial Condition
55
Return on Invested CapitalReturn on Invested CapitalReturn on Invested CapitalReturn on Invested Capital
Air Canada uses return on invested capital (“ROIC”) to assess the efficiency with which it allocates its capital to generate returns. Return is based on adjusted net income (loss), excluding interest expense and implicit interest on operating leases. Invested capital includes (i) average year-over-year total assets, net of average year-over-year non-interest-bearing operating liabilities, and (ii) the value of capitalized operating leases (calculated by multiplying annualized aircraft rent by 7). This measure is not a recognized measure for financial statement presentation under GAAP, does not have a standardized meaning and may not be comparable to similar measures presented by other public companies.
(Canadian dollars in millions, except where indicated)(Canadian dollars in millions, except where indicated)(Canadian dollars in millions, except where indicated)(Canadian dollars in millions, except where indicated) SeptemberSeptemberSeptemberSeptember 30303030, 2015, 2015, 2015, 2015 SeptemberSeptemberSeptemberSeptember 30303030, 2014, 2014, 2014, 2014 $ Change$ Change$ Change$ Change
Net Net Net Net income income income income for the period attributable to for the period attributable to for the period attributable to for the period attributable to shareholders of Air Canada (trailing 12 months)shareholders of Air Canada (trailing 12 months)shareholders of Air Canada (trailing 12 months)shareholders of Air Canada (trailing 12 months) $$$$ 319319319319 $$$$ 194194194194 $$$$ 125125125125
Remove:Remove:Remove:Remove:
One-time payments – ACPA 30 - 30
Benefit plan amendments - (82) 82
Tax-related provision adjustments (23) (41) 18
Impairment charges 14 6 8
Foreign exchange (gain) loss 718 247 471
Net financing expense relating to employee benefits 110 155 (45)
(Gain) loss on financial instruments recorded at fair value 5 (12) 17
Adjusted net income (trailing 12 months)Adjusted net income (trailing 12 months)Adjusted net income (trailing 12 months)Adjusted net income (trailing 12 months) $$$$ 1,1731,1731,1731,173 $$$$ 467467467467 $$$$ 706706706706
Adjusted for:Adjusted for:Adjusted for:Adjusted for:
Interest expense (1) 373 312 61
Implicit interest on operating leases (2) 168 152 16
AdjustedAdjustedAdjustedAdjusted income before interest (trailing 12 months)income before interest (trailing 12 months)income before interest (trailing 12 months)income before interest (trailing 12 months) $$$$ 1,7141,7141,7141,714 $$$$ 931931931931 $$$$ 783783783783
Invested capital:Invested capital:Invested capital:Invested capital:
Working capital excluding current portion of long-term debt and finance leases
840 566 274
Long-term assets, excluding pension assets 7,353 6,447 906
Maintenance provisions (840) (694) (146)
Other operating long-term liabilities (239) (304) 65
Capitalized operating leases (3) 2,401 2,170 231
Invested capitalInvested capitalInvested capitalInvested capital $$$$ 9,9,9,9,515515515515 $$$$ 8,1858,1858,1858,185 $$$$ 1,3301,3301,3301,330
Return on invested capital (%)Return on invested capital (%)Return on invested capital (%)Return on invested capital (%) 18.0%18.0%18.0%18.0% 11.4%11.4%11.4%11.4% 6.6 6.6 6.6 6.6 pppppppp
(1) Interest expense excludes the non-recurring interest expense charge on the repayment of the senior secured notes recognized in 2013.
(2) Interest implicit on operating leases is equal to 7.0% of 7 times the trailing 12 months of aircraft rent. 7.0% is a proxy and does not necessarily represent the actual implicit interest on operating leases for any given period.
(3) Capitalized operating leases are calculated by multiplying the trailing 12 months of aircraft rent by 7. Aircraft rent totaled $343 million for the twelve months ended September 30, 2015 and $310 million for the twelve months ended September 30, 2014 (includes aircraft rent related to regional operations).

Third Quarter 2015 Management’s Discussion and Analysis of Results of Operations and Financial Condition
56
17. GLOSSARY
2014 Regulations2014 Regulations2014 Regulations2014 Regulations – Refers to the Air Canada Pension Plan Funding Regulations, 2014
ACPAACPAACPAACPA – Refers to the Air Canada Pilots Association.
Adjusted CASM Adjusted CASM Adjusted CASM Adjusted CASM – Refers to operating expense per ASM adjusted to remove the effects of aircraft fuel expense, ground packages costs, and unusual items. Refer to section 16 “Non-GAAP Financial Measures” of this MD&A for additional information.
Adjusted net Adjusted net Adjusted net Adjusted net income (loss)income (loss)income (loss)income (loss) – Refers to the consolidated net income (loss) of Air Canada attributable to the shareholders of Air Canada adjusted to remove the effects of (to the extent included in consolidated net income (loss)) foreign exchange gains or losses, net financing income (expense) relating to employee benefits, mark-to-market adjustments on fuel and other derivatives and unusual items. Refer to section 16 “Non-GAAP Financial Measures” of this MD&A for additional information.
Air Canada’s 2014Air Canada’s 2014Air Canada’s 2014Air Canada’s 2014 MD&AMD&AMD&AMD&A – Refers to Air Canada’s 2014 Management’s Discussion and Analysis of Results of Operations and Financial Condition dated February 11, 2015.
Air GeorgianAir GeorgianAir GeorgianAir Georgian – Refers to Air Georgian Limited.
Atlantic passenger and cargo revenuesAtlantic passenger and cargo revenuesAtlantic passenger and cargo revenuesAtlantic passenger and cargo revenues – Refer to revenues from flights that cross the Atlantic Ocean with origins and destinations principally in Europe.
Available seat mAvailable seat mAvailable seat mAvailable seat miles or ASMsiles or ASMsiles or ASMsiles or ASMs – Refers to a measure of passenger capacity calculated by multiplying the total number of seats available for passengers by the miles flown.
Average sAverage sAverage sAverage sttttage length age length age length age length – Refers to the average mile per departure seat and is calculated by dividing total ASMs by total seats dispatched.
BoeingBoeingBoeingBoeing – Refers to The Boeing Company.
CASMCASMCASMCASM – Refers to operating expense per ASM.
CUPECUPECUPECUPE – Refers to the Canadian Union of Public Employees.
DomesticDomesticDomesticDomestic passenger and cargo revenuespassenger and cargo revenuespassenger and cargo revenuespassenger and cargo revenues – Refer to revenues from flights within Canada.
EBITDAR EBITDAR EBITDAR EBITDAR – Refers to earnings before interest, taxes, depreciation, amortization, impairment and aircraft rent. EBITDAR is a non-GAAP financial measure. Refer to section 16 “Non-GAAP Financial Measures” of this MD&A for additional information.
EETCEETCEETCEETCssss – Refers to Enhanced Equipment Trust Certificates issued in connection with the financing of aircraft.
Effective ton mEffective ton mEffective ton mEffective ton miles or ETMsiles or ETMsiles or ETMsiles or ETMs – Refers to the mathematical product of tonnage capacity times distance hauled.
EVASEVASEVASEVAS – Refers to Exploits Valley Air Services Ltd.
GDSGDSGDSGDS – Refers to Global Distribution System which is generally a network that enables automated transactions between third parties and booking agents in order to provide travel-related services to customers.
IBT IBT IBT IBT – Refers to the International Brotherhood of Teamsters.
Jazz Jazz Jazz Jazz – Refers to Jazz Aviation LP.

Third Quarter 2015 Management’s Discussion and Analysis of Results of Operations and Financial Condition
57
Jazz CPAJazz CPAJazz CPAJazz CPA – Refers to the capacity purchase agreement between Air Canada and Jazz.
Other passenger and cargo revenuesOther passenger and cargo revenuesOther passenger and cargo revenuesOther passenger and cargo revenues – Refer to revenues from flights with origins and destinations principally in Central and South America and the Caribbean and Mexico.
Pacific passenger and cargo revenuesPacific passenger and cargo revenuesPacific passenger and cargo revenuesPacific passenger and cargo revenues – Refer to revenues from flights that cross the Pacific Ocean with origins and destinations principally in Asia and Australia.
Passenger load fPassenger load fPassenger load fPassenger load factoractoractoractor – Refers to a measure of passenger capacity utilization derived by expressing Revenue Passenger Miles as a percentage of Available Seat Miles.
Passenger revenue per available seat mPassenger revenue per available seat mPassenger revenue per available seat mPassenger revenue per available seat mile or ile or ile or ile or PRASMPRASMPRASMPRASM – Refers to average passenger revenue per ASM (baggage fee revenues, which are included in passenger revenues, are removed for the purposes of calculating PRASM).
Percentage point (pp)Percentage point (pp)Percentage point (pp)Percentage point (pp) – Refers to a measure for the arithmetic difference of two percentages.
Return on invested capital or ROICReturn on invested capital or ROICReturn on invested capital or ROICReturn on invested capital or ROIC – Refers to return on invested capital and is a measure used to assess the efficiency with which a company allocates its capital to generate returns. Refer to section 16 “Non-GAAP Financial Measures” of this MD&A for additional information.
Revenue pRevenue pRevenue pRevenue passenger assenger assenger assenger ccccarriedarriedarriedarried – Refers to IATA’s definition of passenger carried whereby passengers are counted on a flight no. basis rather than by journey/itinerary or by leg.
Revenue passRevenue passRevenue passRevenue passenger menger menger menger miles or RPMsiles or RPMsiles or RPMsiles or RPMs – Refers to a measure of passenger traffic calculated by multiplying the total number of revenue passengers carried by the miles they are carried.
Revenue ton mRevenue ton mRevenue ton mRevenue ton miles or RTMsiles or RTMsiles or RTMsiles or RTMs – Refers to the mathematical product of weight in tons of a shipment being transported by the number of miles that it is transported.
Seats dispatched Seats dispatched Seats dispatched Seats dispatched – Refers to the number of seats on non-stop flights. A non-stop flight refers to a single take-off and landing.
Sky Sky Sky Sky RegionalRegionalRegionalRegional – Refers to Sky Regional Airlines Inc.
UniforUniforUniforUnifor – Refers to the trade union in Canada, launched in 2013, as a merger of the Canadian Auto Workers and Communications, Energy and Paperworkers unions.
UUUUnitenitenitenite – Refers to the union which represents Air Canada's U.K.-based unionized workforce.
Weighted Weighted Weighted Weighted aaaaverage verage verage verage ccccost of ost of ost of ost of ccccapital or WACC apital or WACC apital or WACC apital or WACC – Refers to management’s estimate of its cost of capital, in which each category of capital is proportionately weighted.
YieldYieldYieldYield – Refers to average passenger revenue per RPM (baggage fee revenues, which are included in passenger revenues, are removed for the purposes of calculating yield).


