24
Third Quarter 2016 Earnings Call Jeff Woodbury Vice President, Investor Relations & Secretary October 28, 2016
| Date post: | 21-Mar-2018 |
| Category: |
Documents |
| Upload: | duongkhuong |
| View: | 223 times |
| Download: | 5 times |

Third Quarter 2016 Earnings CallJeff Woodbury
Vice President, Investor Relations & Secretary
October 28, 2016

2
• Forward-Looking Statements. Statements of future events or conditions in this presentation or the subsequent discussion period are forward-looking statements. Actual future results, including financial and operating performance; demand growth and mix; ExxonMobil’s volume/production growth and mix; the amount and mix of capital expenditures; reported reserves; resource additions and recoveries; finding and development costs; project plans, timing, costs, and capacities; drilling programs; product sales and mix; dividend and share purchase levels; cash and debt balances; asset valuations; corporate and financing expenses; and the impact of technology could differ materially due to a number of factors. These include changes in oil or gas prices or other market conditions affecting the oil, gas, and petrochemical industries; the occurrence and duration of economic recessions; reservoir performance; the outcome and timeliness of exploration and development projects; war and other political or security disturbances; changes in law or government regulation, including sanctions as well as tax and environmental regulations; the outcome of commercial negotiations; the impact of fiscal and commercial terms; opportunities for investments or divestments that may arise; the actions of competitors and customers; unexpected technological developments; unforeseen technical difficulties; and other factors discussed here and under the heading "Factors Affecting Future Results" in the Investors section of our Web site at exxonmobil.com. The closing of announced acquisition transactions is subject to satisfaction of conditions to closing provided under the applicable agreement. Forward-looking statements are based on management’s knowledge and reasonable expectations on the date hereof, and we assume no duty to update these statements as of any future date.
• Frequently Used Terms. References to resources, the resource base, barrels of oil, volumes of gas, liquids, condensate, and similar terms include quantities that are not yet classified as proved reserves under SEC definitions but that we believe will likely be developed and moved into the proved reserves category in the future. Shareholder distributions referred to in this presentation mean cash dividends plus any shares purchased to reduce shares outstanding (excluding anti-dilutive purchases). For definitions and more information regarding resources, reserves, cash flow from operations and asset sales, free cash flow, operating costs, and other terms used in this presentation, see the "Frequently Used Terms" posted on the Investors section of our Web site and the additional information in this presentation and the earnings release 8-K filed today. The Financial and Operating Review on our Web site also shows ExxonMobil's net interest in specific projects.
• The term ‘project’ as used in this presentation can refer to a variety of different activities and does not necessarily have the same meaning as in any government payment transparency reports.
Cautionary Statement
3
Headlines
■ Integrated portfolio continues to generate cash flow through the cycle
■ Solid performance in Downstream and Chemical segments
■ Remaining focused on business fundamentals
■ Delivering on operating and investment commitments
Third quarter earnings of $2.7 billion

4
Modest global growth during the third quarter
Brent
0
25
50
75
100
125
$ per Barrel■ Improvement in the U.S.
■ Weaker growth in China
■ Europe and Japan remained soft
■ Crude oil prices largely flat
■ Natural gas prices strengthened
■ Global refining margins decreased
■ Chemical commodity product margins strong
Business Environment

5
3Q16 Financial Results
Earnings 2.7
Earnings Per Share – Diluted (dollars) 0.63
Shareholder Distributions 3.1
CAPEX 4.2
Cash Flow from Operations and Asset Sales1 6.3
Cash 5.1
Debt 46.2
Billions of dollars unless specified otherwise
1 Includes Proceeds Associated with Asset Sales of $1B

6
3Q16 Sources and Uses of Cash
Cash balances increased $735M in the quarter
Beginning Cash 4.4
Earnings 2.7
Depreciation 4.6
Working Capital / Other (2.0)
Proceeds Associated with Asset Sales 1.0
Shareholder Distributions (3.1)
PP&E Adds / Investments and Advances1 (4.2)
Debt / Other Financing 1.7
Ending Cash 5.1
Billions of dollars
6.3
1 Includes PP&E Adds of ($3.4B) and net advances of ($0.8B).

7
Total Earnings – 3Q16 vs. 3Q15
Earnings decreased $1.6B on lower Upstream and Downstream results
3Q15 U/S D/S Chem C&F 3Q16
4,240 (738)
(804)
(56) 8 2,650
Millions of Dollars

8
Total Earnings – 3Q16 vs. 2Q16
Earnings increased $950M on stronger Upstream and Downstream results and lower corporate charges
2Q16 U/S D/S Chem C&F 3Q16
Millions of Dollars
1,700326
404 (46)266 2,650

9
Earnings – 3Q16 vs. 3Q15
Earnings decreased $738M due to lower realizations
Upstream
3Q15 Realization Vol/Mix Other 3Q16
1,358 (880)
8060 620
Millions of Dollars
10
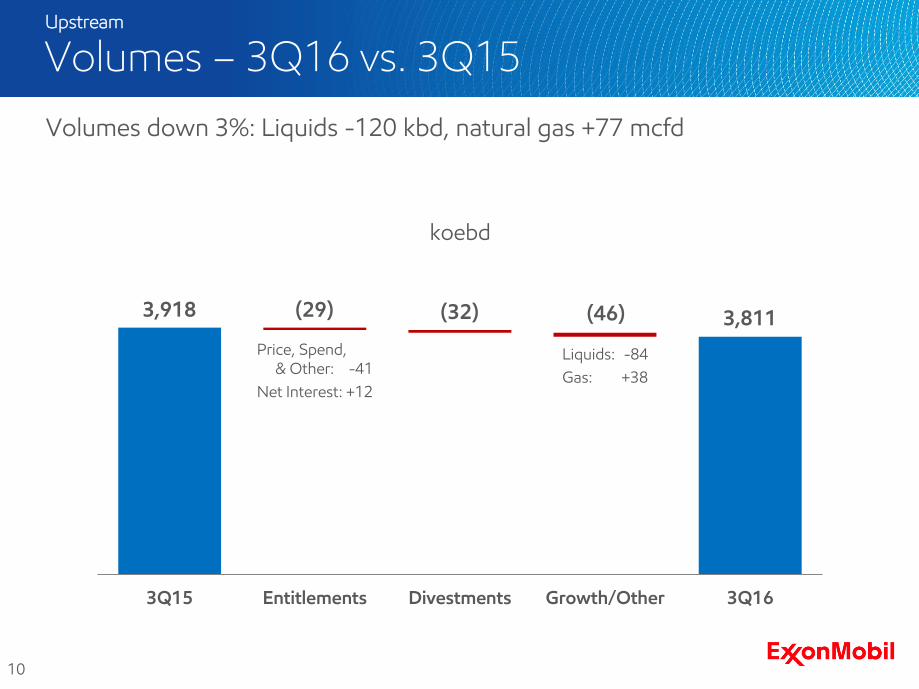
Volumes – 3Q16 vs. 3Q15Upstream
koebd
Volumes down 3%: Liquids -120 kbd, natural gas +77 mcfd
3Q15 Entitlements Divestments Growth/Other 3Q16
3,918 (29) (32) (46) 3,811
Price, Spend, & Other: -41
Net Interest: +12
Liquids: -84
Gas: +38

11
Earnings – 3Q16 vs. 2Q16
Earnings increased $326M on higher realizations and lower operating expenses
Upstream
Millions of Dollars
2Q16 Realization Vol/Mix Other 3Q16
294
240 (40)120 620

12
Volumes – 3Q16 vs. 2Q16Upstream
Volumes down 4%: Liquids -119 kbd, natural gas -161 mcfd
koebd
2Q16 Entitlements Divestments Growth/Other 3Q16
3,957 (68) 0 (78) 3,811
Price, Spend, & Other: -67
Net Interest: -1
Liquids: -80
Gas: +2

13
Earnings – 3Q16 vs. 3Q15
Earnings decreased $804M due to weaker refining margins partly offset by lower maintenance activity and asset management gains
Downstream
Millions of Dollars
3Q15 Margin Vol/Mix Other 3Q16
2,033 (1,550)
170
580 1,229

14
Earnings – 3Q16 vs. 2Q16
Earnings increased $404M as lower maintenance activity and asset management gains offset weaker margins
Downstream
Millions of Dollars
2Q16 Margin Vol/Mix Other 3Q16
825 (330)240
490 1,229

15
Earnings – 3Q16 vs. 3Q15
Earnings decreased $56M on higher maintenance expenses
Chemical
Millions of Dollars
3Q15 Margin Vol/Mix Other 3Q16
1,227 (10) 20 (70) 1,171

16
Earnings – 3Q16 vs. 2Q16
Earnings decreased $46M as stronger margins partly offset increased maintenance activity
Chemical
Millions of Dollars
2Q16 Margin Vol/Mix Other 3Q16
1,217 40 (40) (50) 1,171

17
0
150
2013 2014 2015
Capex and Total Operating Costs1
$B
Cumulative Drilling Savings
$B
'05 - '08 '09 - '12 '13 - '15 YTD '16
0
5
■ 2016 YTD Capex and Operating Costs $12B lower
■ Reducing total life-cycle costs
■ Effective market response
■ Collaboration with service sector
■ Design and execution synergies, innovations
■ Leveraging technology
Continued focus on fundamentals
Disciplined Investment and Cost Management
$5B Cumulative savings
Capex
2005 2016 YTD
Opex
Fast Drill Process and Flat Time Reduction
1 See Backup for reconciliation of Total Operating Costs

18
■ Proved reserves impacted by low price environment
• 67 Percent reserves replacement in 2015; net reserves reduction likely in 2016
• Potential to re-book in future
• No impact on operations or production outlook
■ Impairment analysis performed when indicated by events and circumstances
• 2015 Assessment of long-lived assets
• 2016 Assessment planned
Reporting in accordance with the rules and standards of the SEC and FASB
Reporting Basis
Proved Reserves: Asset Impairment:
SEC Rule 4-10 (a) of Regulation S-X
U.S. GAAP, successful efforts
Annual disclosure Periodic assessment1
Historical pricing basis,12-month, 1st day avg.
Estimated long-term price outlook
1 Performed as events and circumstances indicate

19
■ Successful Guyana Liza-3 appraisal
■ New deepwater discovery offshore Nigeria
■ Advancing global seismic acquisition programs
■ Progressing 2016 and 2017 start-ups
• Kashagan and Gorgon Train 2 production
• Hebron UPM offloaded at Bull Arm
Hebron Utilities and Process Module (UPM) Offloading
Enhancing the development portfolio, advancing major projects
Exploration and Projects Update

20
$B
Shareholder Distributions
0
5
10
15
20
25
Sources of Cash Uses of Cash
PP&E Adds / Investments
and Advances
2
$1.4B
$6.7B
$2.2B
$14.7B
Debt & Other Financing
Cash Flow From
Operations
Asset Sales
Cash Build
Shareholder Distributions
■ Maintaining financial flexibility
■ $4B of Free Cash Flow1
■ Dividends per share up 2.7 percent vs. 3Q15
YTD 2016 Sources and Uses of Cash
Funding shareholder distributions and selective investment program
1 Calculated as Cash Flow from Operations and Asset Sales $16.9B less PP&E Adds / Investments and Advances ($12.9B) 2 Includes PP&E Adds of ($12.3B) and net investments and advances of ($0.6B)
$12.9B
$9.3B

21
Driving long-term value creation
Summary
Billions of dollars unless specified otherwise
YTD16
Earnings 6.2
Cash Flow from Operations and Asset Sales
1 16.9
Upstream Production (MOEBD) 4.0
CAPEX 14.5
Shareholder Distributions 9.3
Highlights
■ Resilient, integrated business
■ Value-based choices
■ Capital and cost discipline
■ Reliable, growing dividend
1 Includes Proceeds Associated with Asset Sales of $2.2B

Questions

23
Backup
24
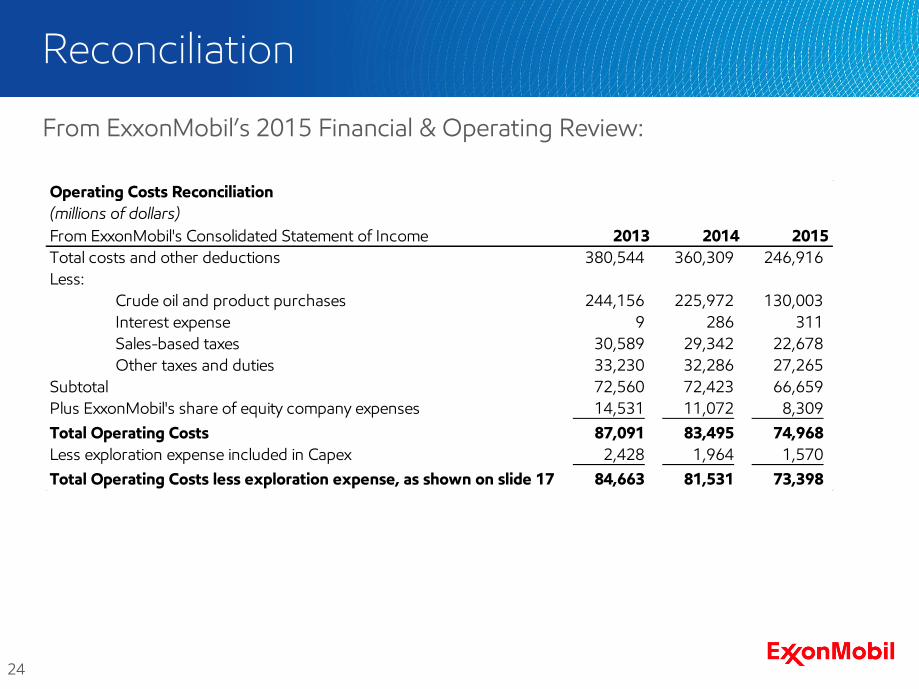
From ExxonMobil’s 2015 Financial & Operating Review:
Reconciliation
(millions of dollars)
2013 2014 2015
380,544 360,309 246,916
Less:
Crude oil and product purchases 244,156 225,972 130,003
Interest expense 9 286 311
Sales-based taxes 30,589 29,342 22,678
Other taxes and duties 33,230 32,286 27,265
Subtotal 72,560 72,423 66,659
Plus ExxonMobil's share of equity company expenses 14,531 11,072 8,309
Total Operating Costs 87,091 83,495 74,968
Less exploration expense included in Capex 2,428 1,964 1,570
Total Operating Costs less exploration expense, as shown on slide 17 84,663 81,531 73,398
Total costs and other deductions
Operating Costs Reconciliation
From ExxonMobil's Consolidated Statement of Income


