Third Quarter 2018 Highlights • Achieved the Company’s production guidance for the third quarter, producing 9,514 barrels of oil equivalent per day (“boe/d”) compared to 9,313 boe/d in the comparative quarter of 2017, despite curtailment of approximately 800 boe/d due to unscheduled third party processing plant outages; • Drilled four (2.60 net) wells, two (1.30 net) of which were brought on production on the last few days of the quarter; • Field condensate production increased nine and 37 percent in the three and nine months ended September 30, 2018 compared to the same periods in 2017; • Field condensate and natural gas liquids (“NGLs”) accounted for 72 percent of crude oil and natural gas revenues and 37 percent of production; • Realized a natural gas price, before risk management contracts and including marketing income, of $3.06 per thousand cubic feet (“mcf”) compared to an average AECO price of $1.19 per mcf as a result of selling approximately 60 percent of our natural gas in Chicago, Illinois, via full-path transportation arrangements and generating marketing income from excess firm Alliance transportation; • Marketing income generated from excess firm Alliance transportation service added $1.48 per barrel of oil equivalent (“boe”) to cash netback; • Operating, transportation and general and administrative costs combined are $3.2 million or 21 percent lower than in the second quarter of 2018, and $3.0 million or 20 percent less than in the third quarter of 2017; • Operating netback before risk management nearly doubled to $23.01 per boe, up from $11.52 per boe in the comparative quarter. Operating netback including risk management increased 36 percent over the comparative quarter to $18.80 per boe; • Cash netbacks per boe increased by 50 percent over the comparative quarter resulting in adjusted funds flow of $11.6 million, a 53 percent increase over the third quarter of 2017; • Delphi has WTI crude oil hedges for 2,950 barrels per day (“bbls/d”) (approximately 85% of its liquids production) at C$85.73 per barrel for 2019 and 500 bbls/d at C$90.05 per barrel for 2020; and • Subsequent to the quarter, Delphi reconfirmed the $105 million borrowing base on its senior credit facility and issued an additional $15 million of ten percent senior secured notes through a private placement. Delphi has significant financial liquidity having only $55 million currently drawn on the senior credit facility. 1
Transcript
Third Quarter 2018 Highlights
• Achieved the Company’s production guidance for the third quarter, producing 9,514 barrels of oil equivalent per day (“boe/d”) compared to 9,313 boe/d in the comparative quarter of 2017, despite curtailment of approximately 800 boe/d due to unscheduled third party processing plant outages;
• Drilled four (2.60 net) wells, two (1.30 net) of which were brought on production on the last few days of the quarter; • Field condensate production increased nine and 37 percent in the three and nine months ended September 30,
2018 compared to the same periods in 2017;
• Field condensate and natural gas liquids (“NGLs”) accounted for 72 percent of crude oil and natural gas revenues and 37 percent of production;
• Realized a natural gas price, before risk management contracts and including marketing income, of $3.06 per thousand cubic feet (“mcf”) compared to an average AECO price of $1.19 per mcf as a result of selling approximately 60 percent of our natural gas in Chicago, Illinois, via full-path transportation arrangements and generating marketing income from excess firm Alliance transportation;
• Marketing income generated from excess firm Alliance transportation service added $1.48 per barrel of oil equivalent (“boe”) to cash netback;
• Operating, transportation and general and administrative costs combined are $3.2 million or 21 percent lower than in the second quarter of 2018, and $3.0 million or 20 percent less than in the third quarter of 2017;
• Operating netback before risk management nearly doubled to $23.01 per boe, up from $11.52 per boe in the comparative quarter. Operating netback including risk management increased 36 percent over the comparative quarter to $18.80 per boe;
• Cash netbacks per boe increased by 50 percent over the comparative quarter resulting in adjusted funds flow of $11.6 million, a 53 percent increase over the third quarter of 2017;
• Delphi has WTI crude oil hedges for 2,950 barrels per day (“bbls/d”) (approximately 85% of its liquids production) at C$85.73 per barrel for 2019 and 500 bbls/d at C$90.05 per barrel for 2020; and
• Subsequent to the quarter, Delphi reconfirmed the $105 million borrowing base on its senior credit facility and issued an additional $15 million of ten percent senior secured notes through a private placement. Delphi has significant financial liquidity having only $55 million currently drawn on the senior credit facility.
1
FINANCIAL AND OPERATIONAL HIGHLIGHTS Three Months Ended September 30 Nine Months Ended September 30 2018 2017 % Change 2018 2017 % Change Financial ($ thousands, except per share)
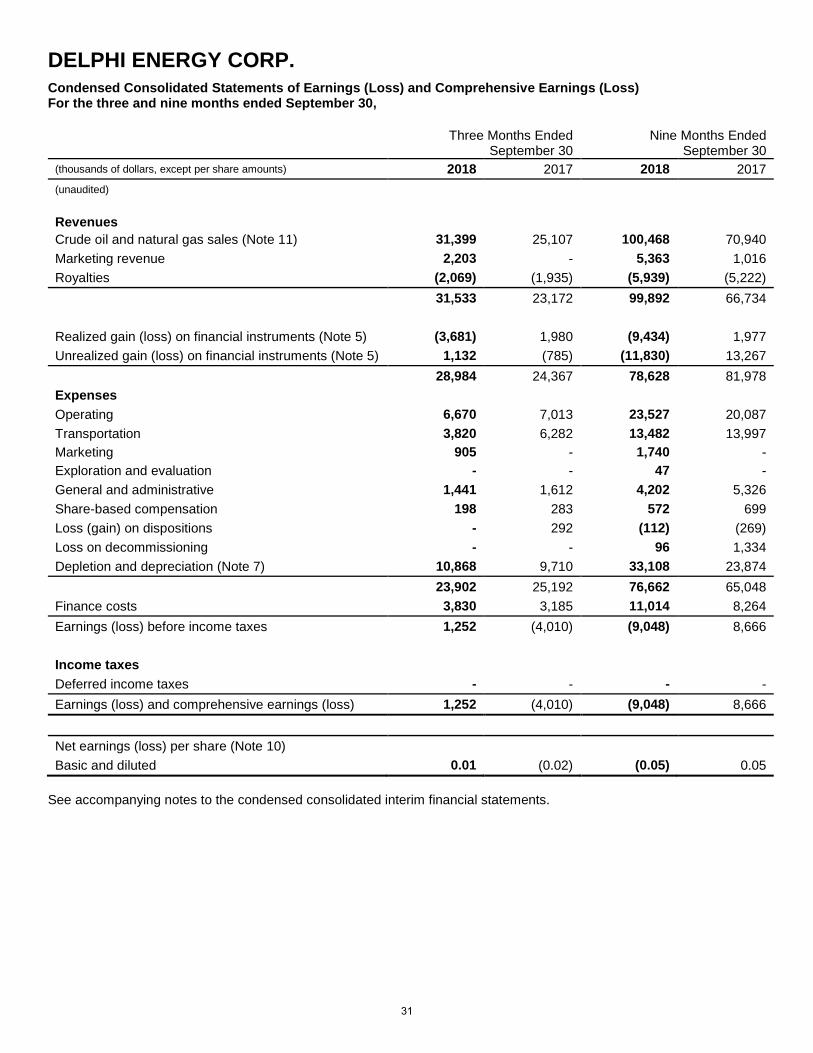
Crude oil and natural gas revenues 31,399 25,107 25 100,468 70,940 42 Net earnings (loss) 1,252 (4,010) (131) (9,048) 8,666 204)
Per share – basic and diluted(1) 0.06 (0.04) 53 0.20 0.13 54 Net debt(1) 163,422 105,909 54 163,422 105,909 54 Capital expenditures, net of dispositions 19,317 22,529 (14) 63,892 75,135 (15) Weighted average shares (000s)
FINANCIAL HIGHLIGHTS FOR THE QUARTER ENDED SEPTEMBER 30, 2018
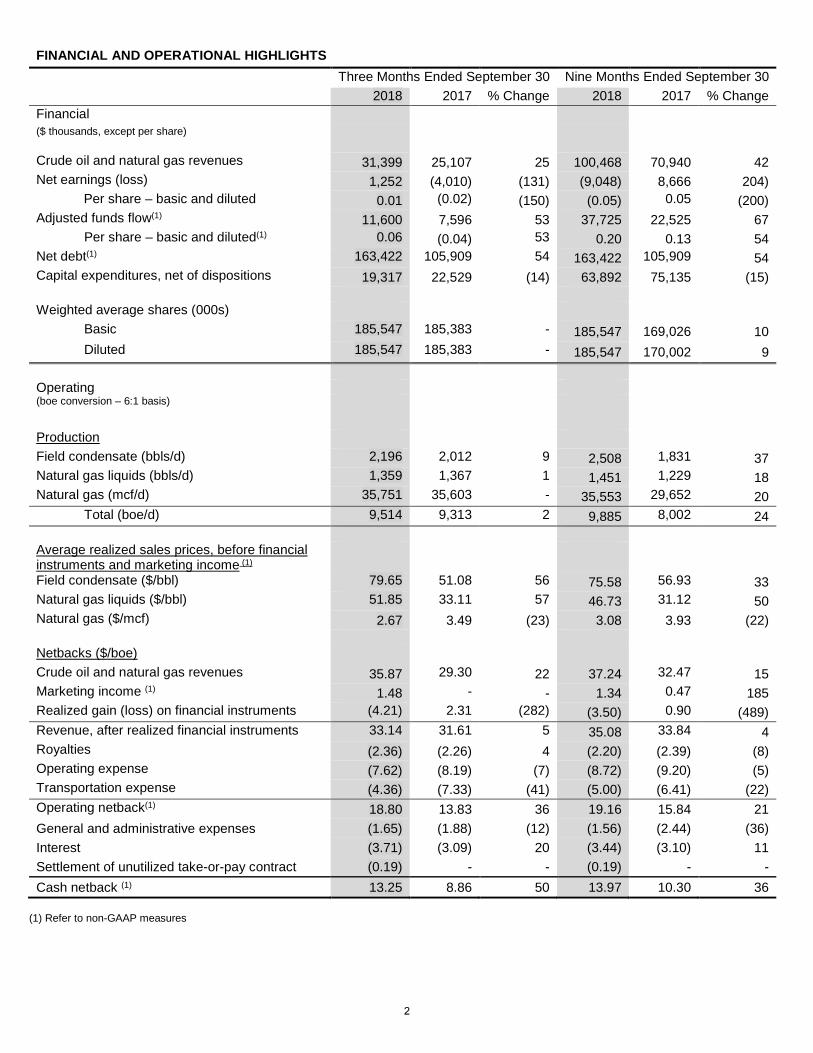
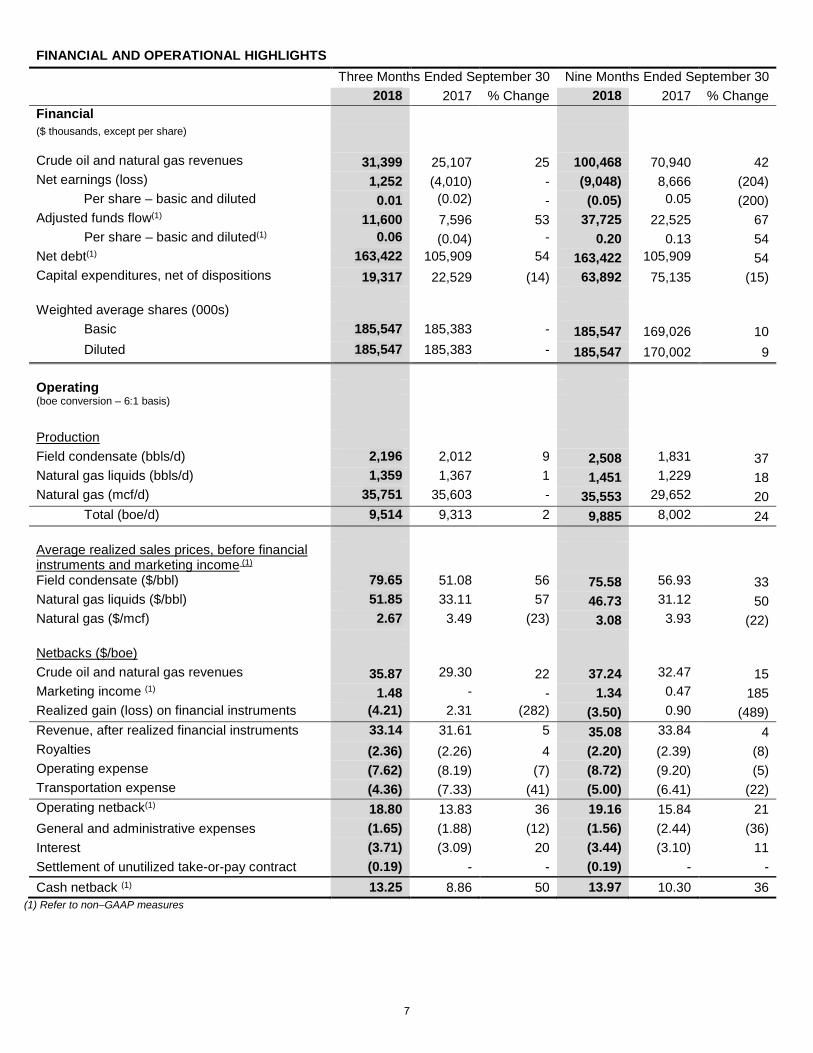
Delphi’s continued success in the development of its liquids-rich Montney play, cost reduction initiatives and the Company’s ability to generate marketing income through its excess firm transportation on the Alliance pipeline system have contributed to significant growth in the Company’s adjusted funds flow of 53 percent and 67 percent for the three and nine months ended September 30, 2018 over the respective comparative periods in 2017. Delphi’s operating netback before risk management in the third quarter was $23.01 per boe while the corresponding cash netback was $17.46 per boe, compared to $11.52 per boe and $6.55 per boe in the comparative period in 2017.
Delphi was active in the field drilling four (2.60 net) wells, two (1.30 net) of which were brought on production in the last few days of September. Although these wells had little impact on quarterly production of 9,514 boe/d, they will contribute to expected strong production results in the fourth quarter. Production volumes in the third quarter were negatively impacted by approximately 800 boe/d due to unscheduled third party processing plant outages.
Field condensate production was 2,196 bbls/d, accounting for 23 percent of production on a boe basis and 51 percent of crude oil and natural gas revenues. Total field condensate and natural gas liquids production accounted for 37 percent of production on a boe basis while contributing 72 percent of crude oil and natural gas revenues. In comparison, in the third quarter of 2017, total field condensate and natural gas liquids production accounted for 36 percent of production on a boe basis while contributing 54 percent of crude oil and natural gas revenues.
Operating, transportation and general and administrative costs combined are $3.2 million or 21 percent lower than in the the second quarter of 2018, and $3.0 million or 20 percent less than in the third quarter of 2017. Lower operating and transportation costs are partially due to the commissioning of the amine facility and the corresponding shift of volumes onto the NGTL system.
Delphi shipped approximately 60 percent of its natural gas into the Chicago market and the remainder was sold in Alberta through the NGTL pipeline system. Delphi’s realized natural gas price, before risk management and including marketing income, was $3.06 per mcf, more than double the average AECO benchmark price of $1.19 per mcf. While the shift of volumes from the Chicago market to the AECO market in the third quarter had the impact of reducing the average realized price of our natural gas, it was more than offset by savings in operating and transportation costs and increased marketing income generated from the additional excess Alliance firm transportation. The proportion of natural gas sold in the Chicago market is expected to return to 90 percent once the Alliance lateral pipeline to the Bigstone West gas plant is reactivated which is expected to occur in 2019.
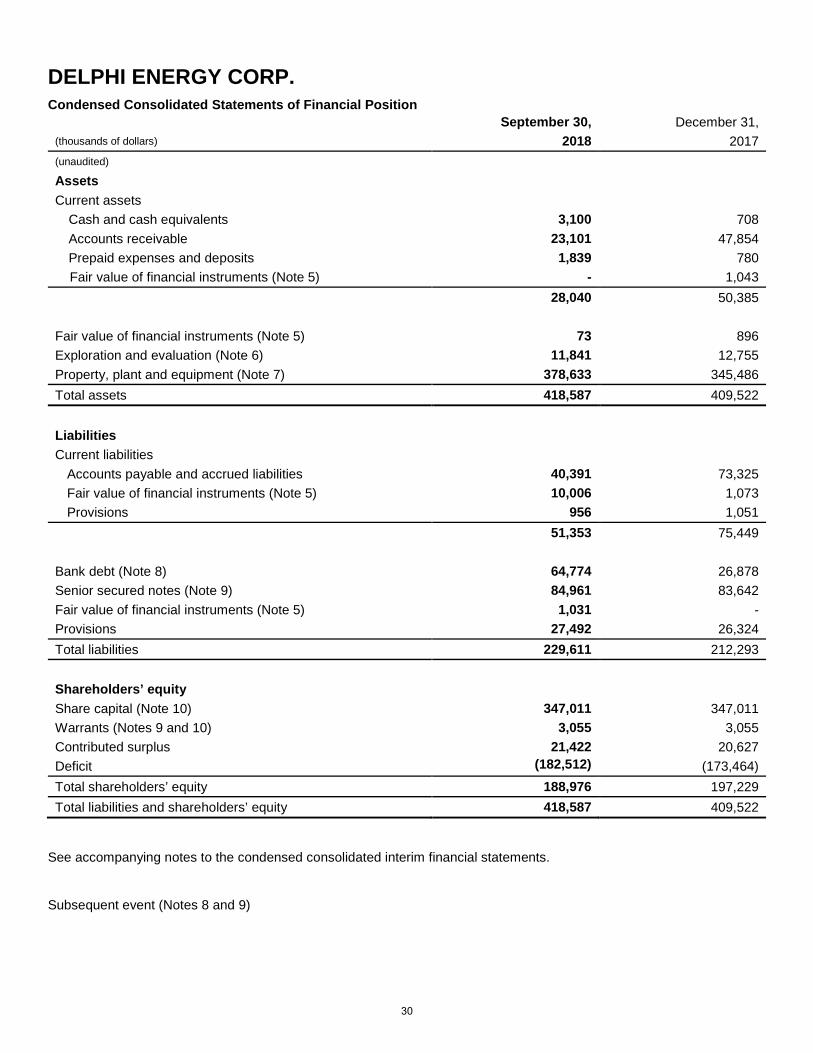
Net debt which includes bank debt, working capital deficiency, senior secured notes, and the unused take-or-pay contract liability at the end of the quarter was $163.4 million. Delphi has significant financial liquidity having only $55 million currently drawn on its $105 million senior credit facility.
NATURAL GAS MARKETING DELIVERING PREMIUM PRICING
Delphi has a total of 57 mmcf/d of firm and priority interruptible service on the Alliance pipeline system and 24 mmcf/d of firm service on the NGTL pipeline system. All of Delphi’s natural gas hedges are focused on the more robust Chicago delivery point. Delphi continues to generate marketing income from the excess service it holds on Alliance through a combination of temporary assignment to other shippers at a premium over cost or through the purchase of natural gas in Alberta or British Columbia for sale in Chicago.
COMMODITY RISK MANAGEMENT PROGRAM STABILIZING REALIZED PRICES
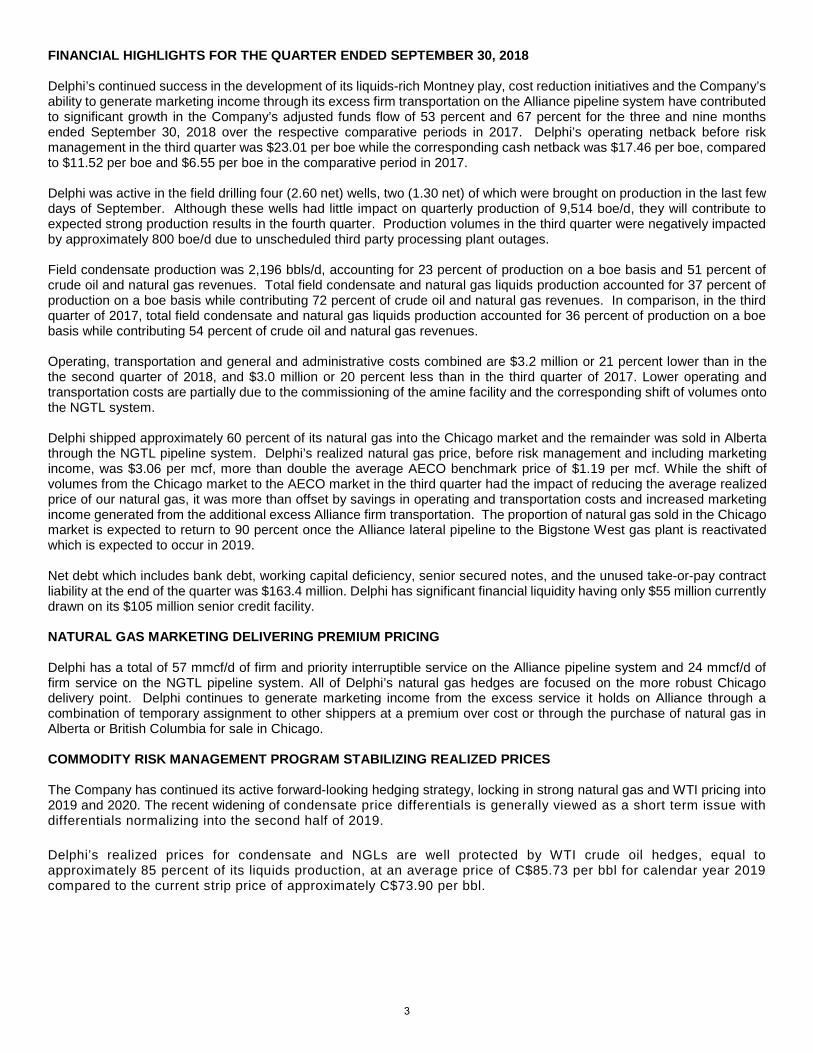
The Company has continued its active forward-looking hedging strategy, locking in strong natural gas and WTI pricing into 2019 and 2020. The recent widening of condensate price differentials is generally viewed as a short term issue with differentials normalizing into the second half of 2019.
Delphi’s realized prices for condensate and NGLs are well protected by WTI crude oil hedges, equal to approximately 85 percent of its liquids production, at an average price of C$85.73 per bbl for calendar year 2019 compared to the current strip price of approximately C$73.90 per bbl.
3
Commodity Hedges Q4 2018 2019 2020 Natural gas (mmcf/d) 17.4 15.0 3.7 Average hedge price (C$/mcf)(2) $3.64 $3.47 $3.45 % of natural gas production hedged(3) 46 39 10 Crude oil (bbl/d) 2,100 2,950 500 Average hedge price (C$/bbl) $72.41 $85.73 $90.05 % of condensate and NGL production hedged(3) 60 84 14 Propane (bbl/d) - 400 100 Average hedge price (C$/bbl) - $42.82 $41.40 % of propane production hedged(3) - 62 15
(1) Assumes an FX of 1.327 CAD per USD for the fourth quarter of 2018 and 1.28 CAD per USD for 2019 and 2020. (2) Includes the impact of NYMEX HH natural gas – Chicago basis hedges. (3) Based on 38 mmcf/d of natural gas production, 3,500 bbl/d of condensate and NGL production and 650 bbl/d of propane production.
WEST BIGSTONE OPERATIONS CONTINUE TO DELIVER SUPERIOR WELL RESULTS
The delineation success at West Bigstone combined with the anticipated benefits of multi-well pad development are the fundamental drivers behind Delphi’s decision to accelerate 2019 capital spending into the fourth quarter of 2018. While pad development extends the cycle time from spud to first production, the modest impact of the delay is significantly outweighed by the estimated well cost savings and productivity gains expected.
Delphi has finished drilling the first horizontal Montney well on its inaugural four-well pad at 02/15-10-60-24W5 (“02/15-10”) in West Bigstone. Because of operational efficiencies gained through pad development, particularly through the completion of the wells, the Company has installed a hybrid completion liner at 02/15-10 allowing for 80 discrete fracs in the horizontal. Multi-well pad operations allow for a frac program of this scale as it would otherwise be cost prohibitive on a single well pad. The 80 stage completion will be almost 25 percent more stages than Delphi has pumped to date in a single well. The 16-10-60-24W5 (“16-10”) well that came on production in May of 2018, and was a key success leading to pad development at West Bigstone, was completed with 65 stages. Through further frac design innovations and efficiencies inherent in pad operations, the planned 80 stage frac is expected to cost approximately 20 percent less than the 65 stage completion at 16-10. Over the first five months on production, 16-10 has produced 0.6 bcf of raw natural gas and 76,000 bbls of 49 degree API field condensate. The immediate offset to 16-10 at 00/15-10-60-24W5 (“00/15-10”) that tested at similar field condensate rates to the 16-10, has recently been brought on production through the Company’s 100 percent owned Negus processing facility.
OUTLOOK
Delphi projects that over a three-year period (2019 to 2021) in a scenario where capital spending equates to adjusted funds flow, production would increase by approximately 30 percent and net debt to trailing adjusted funds flow will be reduced to below 2.0 times. In this scenario, Delphi would expect to outspend adjusted funds flow in 2019 and underspend in 2020 and 2021, while drilling 37 wells. With a significant inventory of drilling locations on 128 undeveloped sections of land, Delphi has the potential to considerably increase production and adjusted funds flow from the Bigstone property. It is expected that the Company’s adjusted funds flow growth will continue to outpace overall production growth, as a result of the increasing percentage of condensate and focus on cash cost reductions.
Condensate differentials, which historically have had low volatility, expanded along with differentials for Canadian heavy and light crude oils commencing in September. This was due to a number of factors including a longer than expected shutdown of the Strathcona refinery in Edmonton and seasonal refinery turnarounds in the U.S. Midwest resulting in the filling of storage in Edmonton and the apportionment of crude export pipelines, as well as feeder pipelines bringing crude and condensate to Edmonton. Apportionment of feeder pipelines bringing condensate to Edmonton will continue until storage levels are reduced to normal levels which is expected to take a number of months. While we anticipate that Delphi will be able to sell all its condensate production throughout the period of apportionment, the Company will be impacted by the higher condensate differentials, particularly as the apportioned volumes will be sold on the spot market where we expect higher differentials than for monthly sales. The fundamentals for condensate remain strong, with more than half of demand continuing to be met by higher cost condensate being imported by pipelines and rail. It is still the most under-supplied and highest value commodity Delphi and the industry produces.
Given the Company’s reconfirmed borrowing base of its $105 million senior secured credit facility with only $55 million drawn and its significant in-the-money hedge position on both WTI and Chicago natural gas prices, Delphi remains well positioned to execute its planned capital program on its liquids-rich Montney asset at Bigstone while maintaining financial flexibility.
4
Delphi’s guidance for production in the fourth quarter of 2018 remains unchanged with the transition to pad drilling. Net debt to adjusted funds flow is projected to increase during the drilling and completion of the four-well pad at West Bigstone but by the second quarter of 2019, as production volumes from the pad materialize, leverage metrics are expected to be reduced below current levels. Delphi intends to release its 2019 drilling plans and guidance in the first quarter of 2019.
5
MANAGEMENT’S DISCUSSION AND ANALYSIS (All tabular amounts are stated in thousands of dollars, except per unit amounts)
Delphi Energy Corp. (“Delphi” or the “Company”) is an oil and gas company based in Calgary, Alberta, focused on the exploration, development, and production of crude oil, natural gas and natural gas liquids from properties located in Western Canada. Delphi’s operations are concentrated in the Deep Basin of Northwest Alberta. The Company’s common shares, senior secured notes, and warrants are listed on the Toronto Stock Exchange (“TSX”) under the symbol “DEE”, “DEE.NT”, and “DEE.WT”, respectively. Additional information about Delphi is available on the Canadian Securities Administrators’ System for Electronic Distribution and Retrieval (SEDAR) at www.sedar.com and at the Company’s website at www.delphienergy.ca.
Management’s discussion and analysis (“MD&A”) has been prepared by management and reviewed and approved by the Board of Directors of Delphi Energy Corp. The discussion and analysis has been prepared as of November 12, 2018. The discussion and analysis is a review of the financial position and results of operations of the Company. Its focus is primarily a comparison of the financial performance for the three and nine months ended September 30, 2018 and 2017 and should be read in conjunction with the unaudited condensed consolidated interim financial statements and accompanying notes for the three and nine months ended September 30, 2018 and 2017 and the audited consolidated financial statements and accompanying notes for the year ended December 31, 2017 and the related MD&A. The unaudited condensed consolidated interim financial statements have been prepared in accordance with International Accounting Standard (“IAS”) 34, Interim Financial Reporting. The reporting currency is the Canadian dollar.
THIRD QUARTER 2018 ACCOMPLISHMENTS
• Produced 9,514 barrels of oil equivalent per day (“boe/d”) in the third quarter of 2018 compared to 9,313 boe/d in the comparative quarter of 2017. Approximately 800 boe/d was curtailed during the quarter due to unscheduled third party processing plant outages;
• Drilled four (2.60 net) wells, two (1.30 net) of which were brought on production on the last few days of the quarter;
• Field condensate production increased nine and 37 percent in the three and nine months ended September 30, 2018 compared to the same periods in 2017;
• Achieved natural gas liquids and field condensate yield of 99 barrels per million cubic feet (“bbls/mmcf”). Field and plant condensate yields are 73 bbls/mmcf, or 74 percent of the 99 bbls/mmcf;
• Field condensate and natural gas liquids accounted for 72 percent of crude oil and natural gas revenues and 37 percent of production;
• Realized a natural gas price, before risk management contracts and including marketing income, of $3.06 per thousand cubic feet (“mcf”) compared to an average AECO price of $1.19 per mcf as a result of selling approximately 60 percent of our natural gas in Chicago, Illinois, via full-path transportation arrangements and generating marketing income from excess firm Alliance transportation;
• Added $1.48 per barrel of oil equivalent (“boe”) to cash netback from marketing income generated from excess firm Alliance transportation service;
• Operating, transportation and general and administrative costs combined are $3.2 million lower than in the second quarter of 2018 and $3.0 million less than in the third quarter of 2017;
• Operating netback before risk management nearly doubled to $23.01 per boe, up from the $11.52 per boe in the comparative quarter. Operating netback including risk management increased 36 percent over the comparative quarter to $18.80 per boe;
• Cash netbacks per boe increased by 50 percent over the comparative quarter resulting in adjusted funds flow of $11.6 million, a 53 percent increase over the third quarter of 2017.
FINANCIAL AND OPERATIONAL HIGHLIGHTS Three Months Ended September 30 Nine Months Ended September 30 2018 2017 % Change 2018 2017 % Change Financial ($ thousands, except per share)
Crude oil and natural gas revenues 31,399 25,107 25 100,468 70,940 42 Net earnings (loss) 1,252 (4,010) - (9,048) 8,666 (204)
Per share – basic and diluted(1) 0.06 (0.04) - 0.20 0.13 54 Net debt(1) 163,422 105,909 54 163,422 105,909 54 Capital expenditures, net of dispositions 19,317 22,529 (14) 63,892 75,135 (15) Weighted average shares (000s)
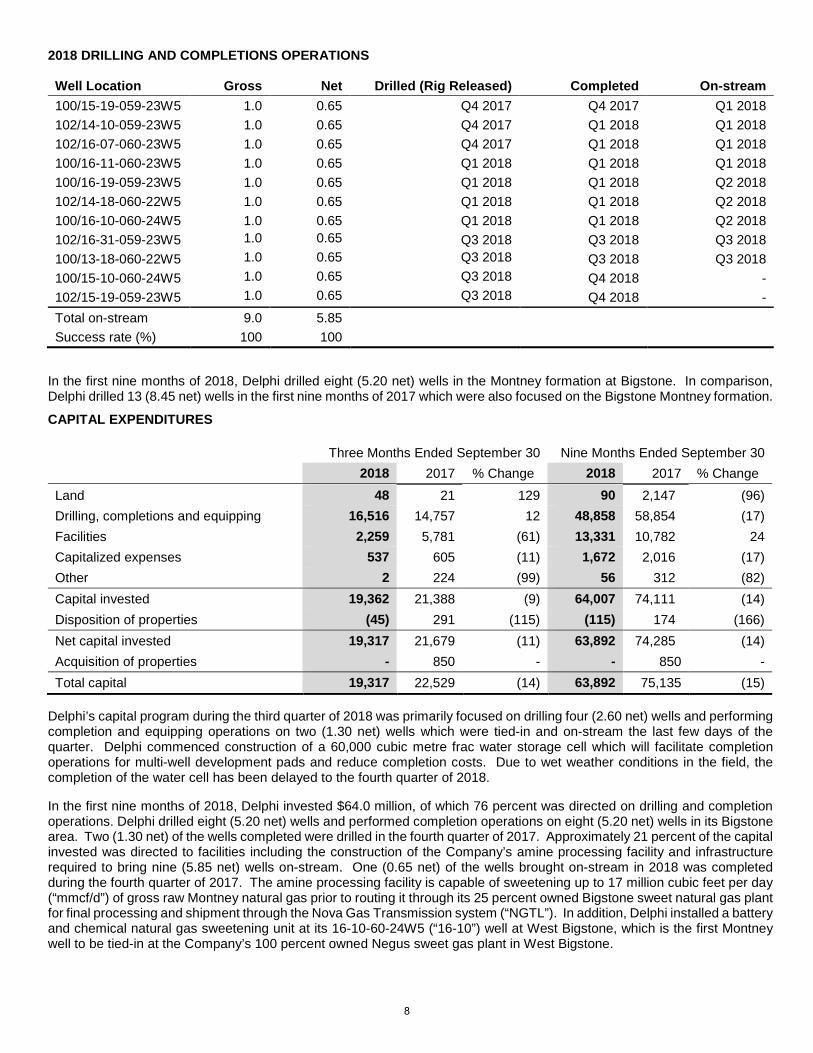
In the first nine months of 2018, Delphi drilled eight (5.20 net) wells in the Montney formation at Bigstone. In comparison, Delphi drilled 13 (8.45 net) wells in the first nine months of 2017 which were also focused on the Bigstone Montney formation.
CAPITAL EXPENDITURES Three Months Ended September 30 Nine Months Ended September 30 2018 2017 % Change 2018 2017 % Change Land 48 21 129 90 2,147 (96) Drilling, completions and equipping 16,516 14,757 12 48,858 58,854 (17) Facilities 2,259 5,781 (61) 13,331 10,782 24 Capitalized expenses 537 605 (11) 1,672 2,016 (17) Other 2 224 (99) 56 312 (82) Capital invested 19,362 21,388 (9) 64,007 74,111 (14) Disposition of properties (45) 291 (115) (115) 174 (166) Net capital invested 19,317 21,679 (11) 63,892 74,285 (14) Acquisition of properties - 850 - - 850 - Total capital 19,317 22,529 (14) 63,892 75,135 (15)
Delphi’s capital program during the third quarter of 2018 was primarily focused on drilling four (2.60 net) wells and performing completion and equipping operations on two (1.30 net) wells which were tied-in and on-stream the last few days of the quarter. Delphi commenced construction of a 60,000 cubic metre frac water storage cell which will facilitate completion operations for multi-well development pads and reduce completion costs. Due to wet weather conditions in the field, the completion of the water cell has been delayed to the fourth quarter of 2018.
In the first nine months of 2018, Delphi invested $64.0 million, of which 76 percent was directed on drilling and completion operations. Delphi drilled eight (5.20 net) wells and performed completion operations on eight (5.20 net) wells in its Bigstone area. Two (1.30 net) of the wells completed were drilled in the fourth quarter of 2017. Approximately 21 percent of the capital invested was directed to facilities including the construction of the Company’s amine processing facility and infrastructure required to bring nine (5.85 net) wells on-stream. One (0.65 net) of the wells brought on-stream in 2018 was completed during the fourth quarter of 2017. The amine processing facility is capable of sweetening up to 17 million cubic feet per day (“mmcf/d”) of gross raw Montney natural gas prior to routing it through its 25 percent owned Bigstone sweet natural gas plant for final processing and shipment through the Nova Gas Transmission system (“NGTL”). In addition, Delphi installed a battery and chemical natural gas sweetening unit at its 16-10-60-24W5 (“16-10”) well at West Bigstone, which is the first Montney well to be tied-in at the Company’s 100 percent owned Negus sweet gas plant in West Bigstone.
8
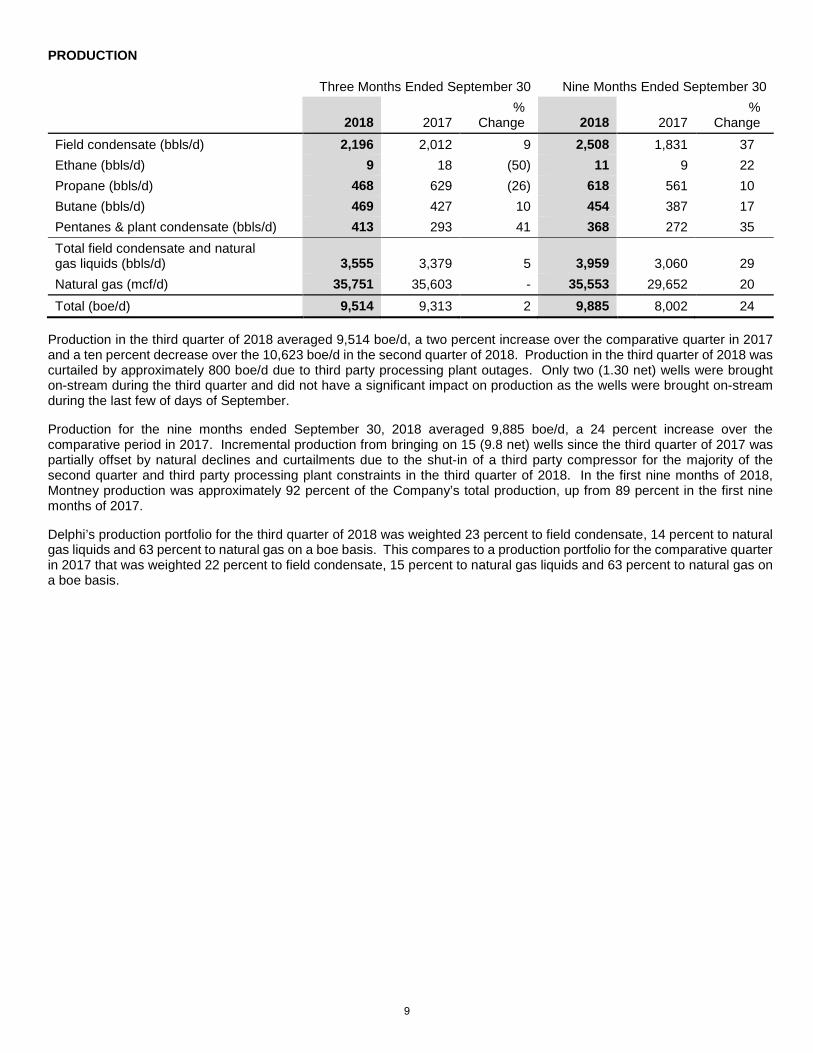
PRODUCTION
Three Months Ended September 30 Nine Months Ended September 30
Production in the third quarter of 2018 averaged 9,514 boe/d, a two percent increase over the comparative quarter in 2017 and a ten percent decrease over the 10,623 boe/d in the second quarter of 2018. Production in the third quarter of 2018 was curtailed by approximately 800 boe/d due to third party processing plant outages. Only two (1.30 net) wells were brought on-stream during the third quarter and did not have a significant impact on production as the wells were brought on-stream during the last few of days of September.
Production for the nine months ended September 30, 2018 averaged 9,885 boe/d, a 24 percent increase over the comparative period in 2017. Incremental production from bringing on 15 (9.8 net) wells since the third quarter of 2017 was partially offset by natural declines and curtailments due to the shut-in of a third party compressor for the majority of the second quarter and third party processing plant constraints in the third quarter of 2018. In the first nine months of 2018, Montney production was approximately 92 percent of the Company’s total production, up from 89 percent in the first nine months of 2017.
Delphi’s production portfolio for the third quarter of 2018 was weighted 23 percent to field condensate, 14 percent to natural gas liquids and 63 percent to natural gas on a boe basis. This compares to a production portfolio for the comparative quarter in 2017 that was weighted 22 percent to field condensate, 15 percent to natural gas liquids and 63 percent to natural gas on a boe basis.
9
BUSINESS ENVIRONMENT
Benchmark Prices and Economic Parameters (1)
Three Months Ended September 30
Nine Months Ended September 30
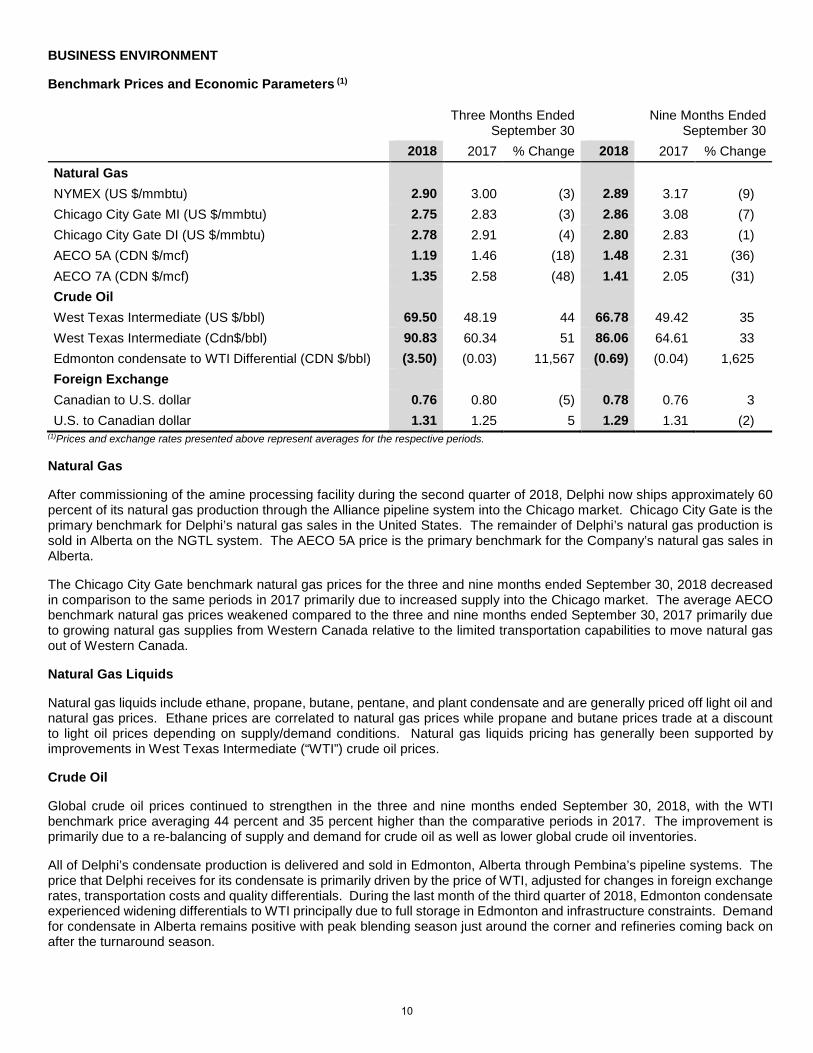
2018 2017 % Change 2018 2017 % Change Natural Gas NYMEX (US $/mmbtu) 2.90 3.00 (3) 2.89 3.17 (9) Chicago City Gate MI (US $/mmbtu) 2.75 2.83 (3) 2.86 3.08 (7) Chicago City Gate DI (US $/mmbtu) 2.78 2.91 (4) 2.80 2.83 (1) AECO 5A (CDN $/mcf) 1.19 1.46 (18) 1.48 2.31 (36) AECO 7A (CDN $/mcf) 1.35 2.58 (48) 1.41 2.05 (31) Crude Oil West Texas Intermediate (US $/bbl) 69.50 48.19 44 66.78 49.42 35 West Texas Intermediate (Cdn$/bbl) 90.83 60.34 51 86.06 64.61 33 Edmonton condensate to WTI Differential (CDN $/bbl) (3.50) (0.03) 11,567 (0.69) (0.04) 1,625 Foreign Exchange Canadian to U.S. dollar 0.76 0.80 (5) 0.78 0.76 3 U.S. to Canadian dollar 1.31 1.25 5 1.29 1.31 (2)
(1)Prices and exchange rates presented above represent averages for the respective periods.
Natural Gas
After commissioning of the amine processing facility during the second quarter of 2018, Delphi now ships approximately 60 percent of its natural gas production through the Alliance pipeline system into the Chicago market. Chicago City Gate is the primary benchmark for Delphi’s natural gas sales in the United States. The remainder of Delphi’s natural gas production is sold in Alberta on the NGTL system. The AECO 5A price is the primary benchmark for the Company’s natural gas sales in Alberta.
The Chicago City Gate benchmark natural gas prices for the three and nine months ended September 30, 2018 decreased in comparison to the same periods in 2017 primarily due to increased supply into the Chicago market. The average AECO benchmark natural gas prices weakened compared to the three and nine months ended September 30, 2017 primarily due to growing natural gas supplies from Western Canada relative to the limited transportation capabilities to move natural gas out of Western Canada.
Natural Gas Liquids
Natural gas liquids include ethane, propane, butane, pentane, and plant condensate and are generally priced off light oil and natural gas prices. Ethane prices are correlated to natural gas prices while propane and butane prices trade at a discount to light oil prices depending on supply/demand conditions. Natural gas liquids pricing has generally been supported by improvements in West Texas Intermediate (“WTI”) crude oil prices.
Crude Oil
Global crude oil prices continued to strengthen in the three and nine months ended September 30, 2018, with the WTI benchmark price averaging 44 percent and 35 percent higher than the comparative periods in 2017. The improvement is primarily due to a re-balancing of supply and demand for crude oil as well as lower global crude oil inventories.
All of Delphi’s condensate production is delivered and sold in Edmonton, Alberta through Pembina’s pipeline systems. The price that Delphi receives for its condensate is primarily driven by the price of WTI, adjusted for changes in foreign exchange rates, transportation costs and quality differentials. During the last month of the third quarter of 2018, Edmonton condensate experienced widening differentials to WTI principally due to full storage in Edmonton and infrastructure constraints. Demand for condensate in Alberta remains positive with peak blending season just around the corner and refineries coming back on after the turnaround season.
10
Canadian/United States Exchange Rate
The value of the Canadian dollar against its U.S. counterpart averaged U.S. $0.76 and U.S. $0.78 for the three and nine months ended September 30, 2018. As a producer of natural gas sold in the United States, an increase in the Canadian dollar has a negative effect on the price received for production.
REALIZED SALES PRICES
Three Months Ended September 30
Nine Months Ended September 30
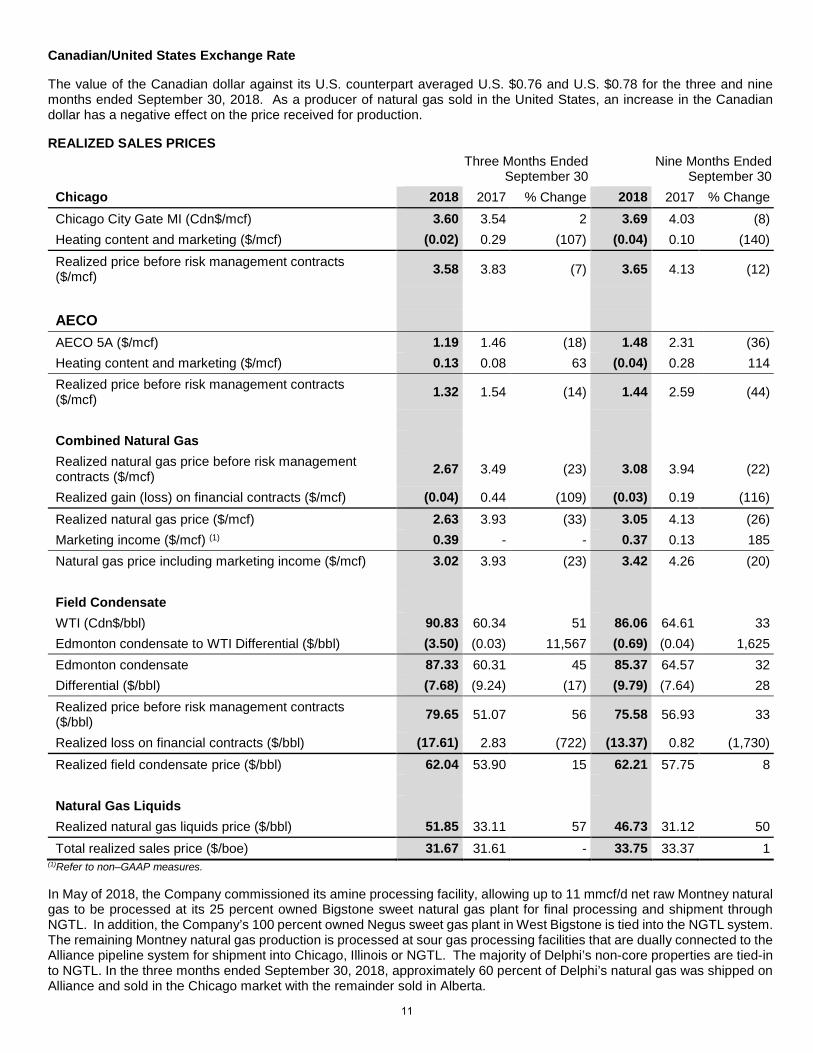
Chicago 2018 2017 % Change 2018 2017 % Change Chicago City Gate MI (Cdn$/mcf) 3.60 3.54 2 3.69 4.03 (8) Heating content and marketing ($/mcf) (0.02) 0.29 (107) (0.04) 0.10 (140) Realized price before risk management contracts ($/mcf) 3.58 3.83 (7) 3.65 4.13 (12)
Combined Natural Gas Realized natural gas price before risk management contracts ($/mcf) 2.67 3.49 (23) 3.08 3.94 (22)
Realized gain (loss) on financial contracts ($/mcf) (0.04) 0.44 (109) (0.03) 0.19 (116) Realized natural gas price ($/mcf) 2.63 3.93 (33) 3.05 4.13 (26) Marketing income ($/mcf) (1) 0.39 - - 0.37 0.13 185 Natural gas price including marketing income ($/mcf) 3.02 3.93 (23) 3.42 4.26 (20) Field Condensate WTI (Cdn$/bbl) 90.83 60.34 51 86.06 64.61 33 Edmonton condensate to WTI Differential ($/bbl) (3.50) (0.03) 11,567 (0.69) (0.04) 1,625 Edmonton condensate 87.33 60.31 45 85.37 64.57 32 Differential ($/bbl) (7.68) (9.24) (17) (9.79) (7.64) 28 Realized price before risk management contracts ($/bbl) 79.65 51.07 56 75.58 56.93 33
Realized loss on financial contracts ($/bbl) (17.61) 2.83 (722) (13.37) 0.82 (1,730) Realized field condensate price ($/bbl) 62.04 53.90 15 62.21 57.75 8 Natural Gas Liquids Realized natural gas liquids price ($/bbl) 51.85 33.11 57 46.73 31.12 50 Total realized sales price ($/boe) 31.67 31.61 - 33.75 33.37 1
(1)Refer to non–GAAP measures.
In May of 2018, the Company commissioned its amine processing facility, allowing up to 11 mmcf/d net raw Montney natural gas to be processed at its 25 percent owned Bigstone sweet natural gas plant for final processing and shipment through NGTL. In addition, the Company’s 100 percent owned Negus sweet gas plant in West Bigstone is tied into the NGTL system. The remaining Montney natural gas production is processed at sour gas processing facilities that are dually connected to the Alliance pipeline system for shipment into Chicago, Illinois or NGTL. The majority of Delphi’s non-core properties are tied-in to NGTL. In the three months ended September 30, 2018, approximately 60 percent of Delphi’s natural gas was shipped on Alliance and sold in the Chicago market with the remainder sold in Alberta.
11
Delphi generally receives a higher price for its natural gas per mcf due to its high heat content. Differentials for marketing are caused by differences between the daily and monthly benchmark price indices. Approximately 70 percent of the natural gas volumes that were shipped on the Alliance pipeline system were sold with reference to the monthly index and the remainder of the volumes were sold with reference to the daily index. The majority of natural gas volumes shipped on NGTL are sold with reference to AECO 5A index and the remainder with reference to AECO 7A.
For the three months and nine months ended September 30, 2018, Delphi’s realized natural gas price before risk management contracts decreased 23 percent and 22 percent in comparison to the same periods in 2017 primarily due to a decrease in benchmark pricing and an increase of natural gas sales volumes sold in Alberta which sustained lower relative prices. Including risk management contracts and marketing income, Delphi’s natural gas price was $3.02 per mcf and $3.42 per mcf for the three and nine months ended September 30, 2018.
Realized field condensate prices before risk management contracts were 56 percent and 33 percent higher in the three and nine months ended September 30, 2018, compared to the same periods in 2017 primarily due to an improvement in benchmark prices. The impact of improved benchmark prices was partially offset by a widening differential between WTI and Edmonton condensate pricing.
Delphi’s realized natural gas liquids price for the three and nine months ended September 30, 2018 increased 57 percent and 50 percent compared to the same period in 2017 as a result of improved benchmark prices for all natural gas liquids.
RISK MANAGEMENT ACTIVITIES
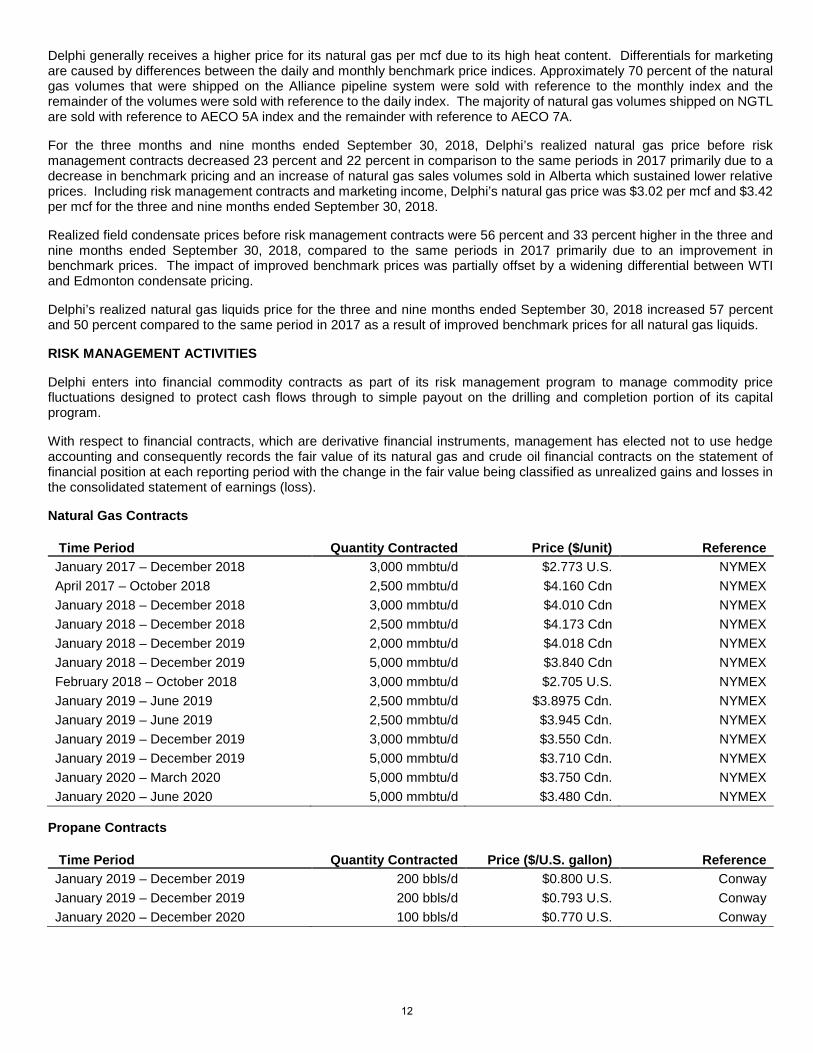
Delphi enters into financial commodity contracts as part of its risk management program to manage commodity price fluctuations designed to protect cash flows through to simple payout on the drilling and completion portion of its capital program.
With respect to financial contracts, which are derivative financial instruments, management has elected not to use hedge accounting and consequently records the fair value of its natural gas and crude oil financial contracts on the statement of financial position at each reporting period with the change in the fair value being classified as unrealized gains and losses in the consolidated statement of earnings (loss).
Natural Gas Contracts
Time Period Quantity Contracted Price ($/unit) Reference January 2017 – December 2018 3,000 mmbtu/d $2.773 U.S. NYMEX April 2017 – October 2018 2,500 mmbtu/d $4.160 Cdn NYMEX January 2018 – December 2018 3,000 mmbtu/d $4.010 Cdn NYMEX January 2018 – December 2018 2,500 mmbtu/d $4.173 Cdn NYMEX January 2018 – December 2019 2,000 mmbtu/d $4.018 Cdn NYMEX January 2018 – December 2019 5,000 mmbtu/d $3.840 Cdn NYMEX February 2018 – October 2018 3,000 mmbtu/d $2.705 U.S. NYMEX January 2019 – June 2019 2,500 mmbtu/d $3.8975 Cdn. NYMEX January 2019 – June 2019 2,500 mmbtu/d $3.945 Cdn. NYMEX January 2019 – December 2019 3,000 mmbtu/d $3.550 Cdn. NYMEX January 2019 – December 2019 5,000 mmbtu/d $3.710 Cdn. NYMEX January 2020 – March 2020 5,000 mmbtu/d $3.750 Cdn. NYMEX January 2020 – June 2020 5,000 mmbtu/d $3.480 Cdn. NYMEX
Propane Contracts
Time Period Quantity Contracted Price ($/U.S. gallon) Reference January 2019 – December 2019 200 bbls/d $0.800 U.S. Conway January 2019 – December 2019 200 bbls/d $0.793 U.S. Conway January 2020 – December 2020 100 bbls/d $0.770 U.S. Conway
12
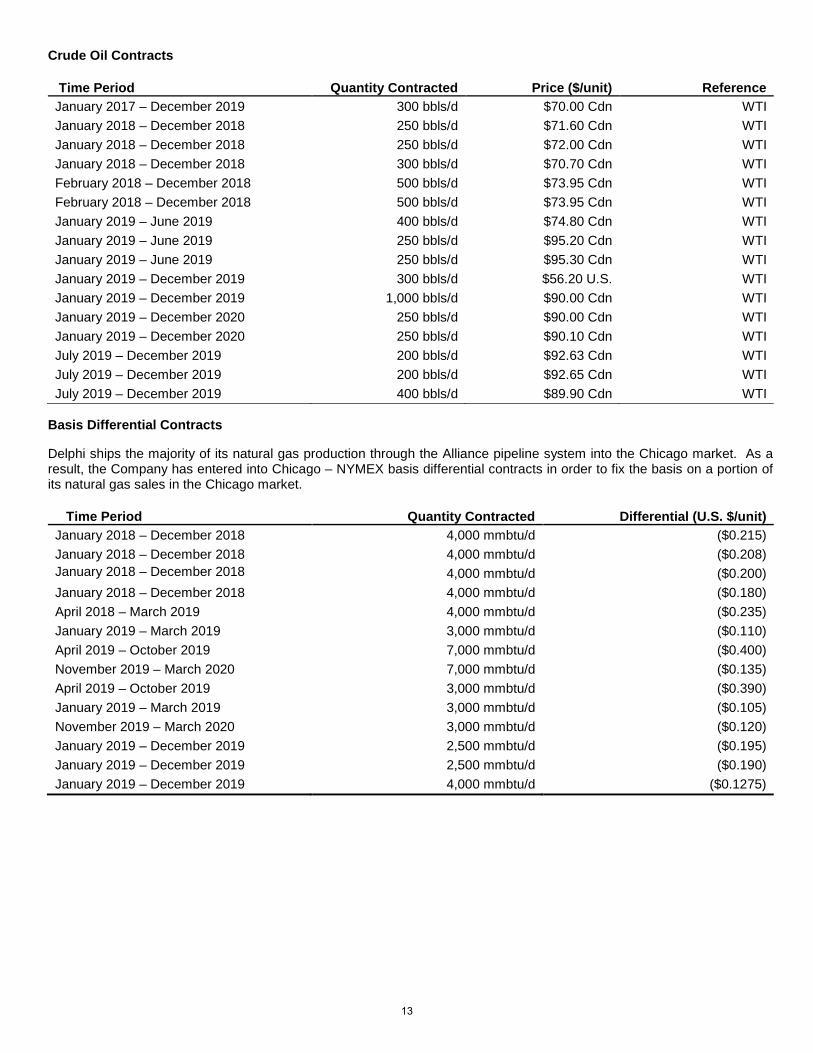
Crude Oil Contracts
Time Period Quantity Contracted Price ($/unit) Reference January 2017 – December 2019 300 bbls/d $70.00 Cdn WTI January 2018 – December 2018 250 bbls/d $71.60 Cdn WTI January 2018 – December 2018 250 bbls/d $72.00 Cdn WTI January 2018 – December 2018 300 bbls/d $70.70 Cdn WTI February 2018 – December 2018 500 bbls/d $73.95 Cdn WTI February 2018 – December 2018 500 bbls/d $73.95 Cdn WTI January 2019 – June 2019 400 bbls/d $74.80 Cdn WTI January 2019 – June 2019 250 bbls/d $95.20 Cdn WTI January 2019 – June 2019 250 bbls/d $95.30 Cdn WTI January 2019 – December 2019 300 bbls/d $56.20 U.S. WTI January 2019 – December 2019 1,000 bbls/d $90.00 Cdn WTI January 2019 – December 2020 250 bbls/d $90.00 Cdn WTI January 2019 – December 2020 250 bbls/d $90.10 Cdn WTI July 2019 – December 2019 200 bbls/d $92.63 Cdn WTI July 2019 – December 2019 200 bbls/d $92.65 Cdn WTI July 2019 – December 2019 400 bbls/d $89.90 Cdn WTI
Basis Differential Contracts
Delphi ships the majority of its natural gas production through the Alliance pipeline system into the Chicago market. As a result, the Company has entered into Chicago – NYMEX basis differential contracts in order to fix the basis on a portion of its natural gas sales in the Chicago market.
Time Period Quantity Contracted Differential (U.S. $/unit) January 2018 – December 2018 4,000 mmbtu/d ($0.215) January 2018 – December 2018 4,000 mmbtu/d ($0.208) January 2018 – December 2018 4,000 mmbtu/d ($0.200) January 2018 – December 2018 4,000 mmbtu/d ($0.180) April 2018 – March 2019 4,000 mmbtu/d ($0.235) January 2019 – March 2019 3,000 mmbtu/d ($0.110) April 2019 – October 2019 7,000 mmbtu/d ($0.400) November 2019 – March 2020 7,000 mmbtu/d ($0.135) April 2019 – October 2019 3,000 mmbtu/d ($0.390) January 2019 – March 2019 3,000 mmbtu/d ($0.105) November 2019 – March 2020 3,000 mmbtu/d ($0.120) January 2019 – December 2019 2,500 mmbtu/d ($0.195) January 2019 – December 2019 2,500 mmbtu/d ($0.190) January 2019 – December 2019 4,000 mmbtu/d ($0.1275)
13
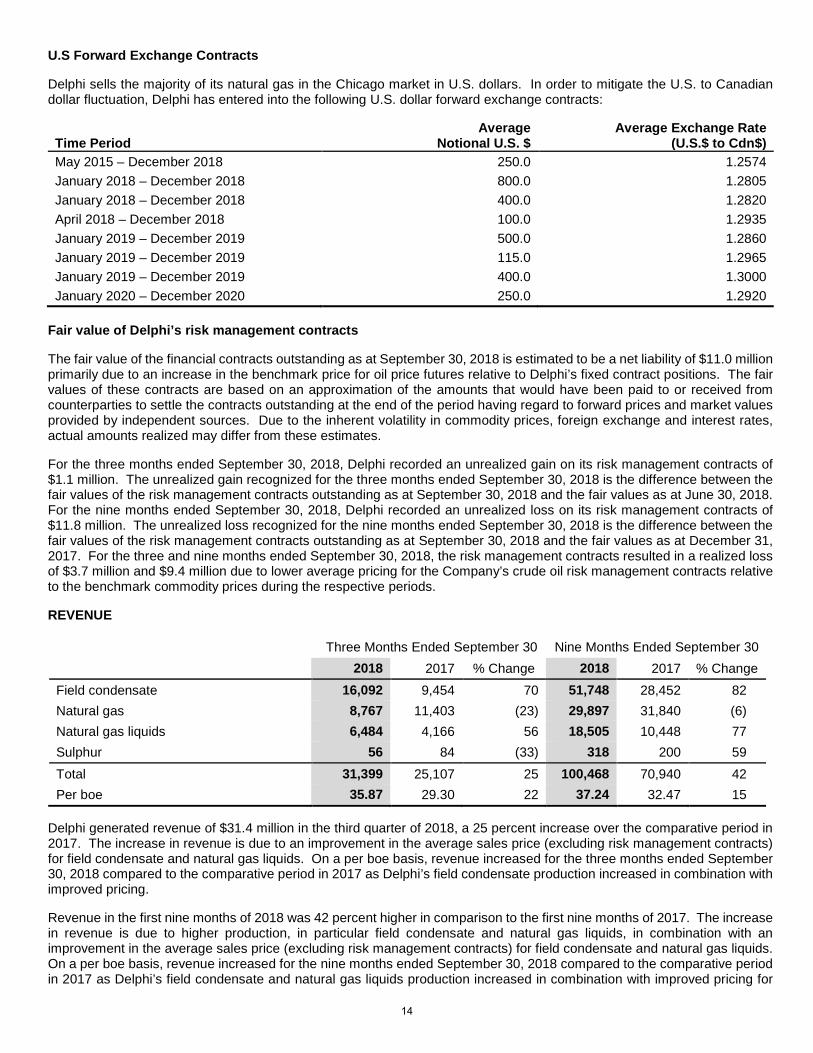
U.S Forward Exchange Contracts
Delphi sells the majority of its natural gas in the Chicago market in U.S. dollars. In order to mitigate the U.S. to Canadian dollar fluctuation, Delphi has entered into the following U.S. dollar forward exchange contracts:
Time Period
Average Notional U.S. $
Average Exchange Rate (U.S.$ to Cdn$)
May 2015 – December 2018 250.0 1.2574 January 2018 – December 2018 800.0 1.2805 January 2018 – December 2018 400.0 1.2820 April 2018 – December 2018 100.0 1.2935 January 2019 – December 2019 500.0 1.2860 January 2019 – December 2019 115.0 1.2965 January 2019 – December 2019 400.0 1.3000 January 2020 – December 2020 250.0 1.2920
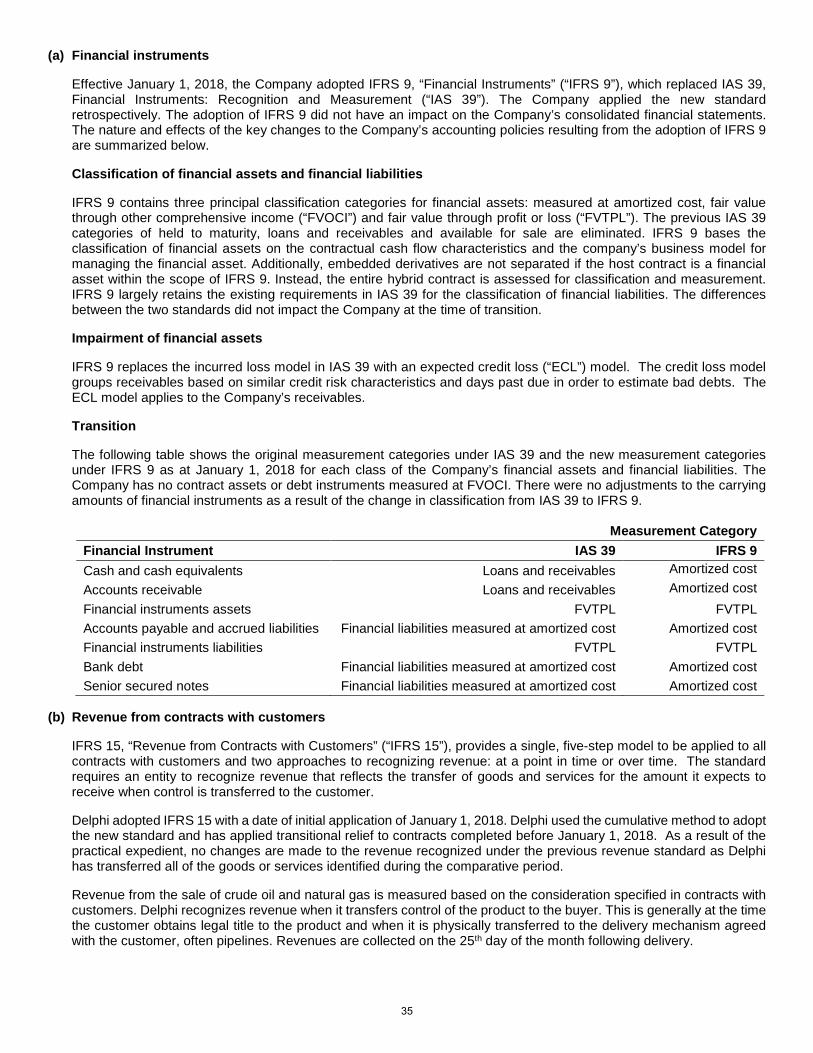
Fair value of Delphi’s risk management contracts
The fair value of the financial contracts outstanding as at September 30, 2018 is estimated to be a net liability of $11.0 million primarily due to an increase in the benchmark price for oil price futures relative to Delphi’s fixed contract positions. The fair values of these contracts are based on an approximation of the amounts that would have been paid to or received from counterparties to settle the contracts outstanding at the end of the period having regard to forward prices and market values provided by independent sources. Due to the inherent volatility in commodity prices, foreign exchange and interest rates, actual amounts realized may differ from these estimates.
For the three months ended September 30, 2018, Delphi recorded an unrealized gain on its risk management contracts of $1.1 million. The unrealized gain recognized for the three months ended September 30, 2018 is the difference between the fair values of the risk management contracts outstanding as at September 30, 2018 and the fair values as at June 30, 2018. For the nine months ended September 30, 2018, Delphi recorded an unrealized loss on its risk management contracts of $11.8 million. The unrealized loss recognized for the nine months ended September 30, 2018 is the difference between the fair values of the risk management contracts outstanding as at September 30, 2018 and the fair values as at December 31, 2017. For the three and nine months ended September 30, 2018, the risk management contracts resulted in a realized loss of $3.7 million and $9.4 million due to lower average pricing for the Company’s crude oil risk management contracts relative to the benchmark commodity prices during the respective periods.
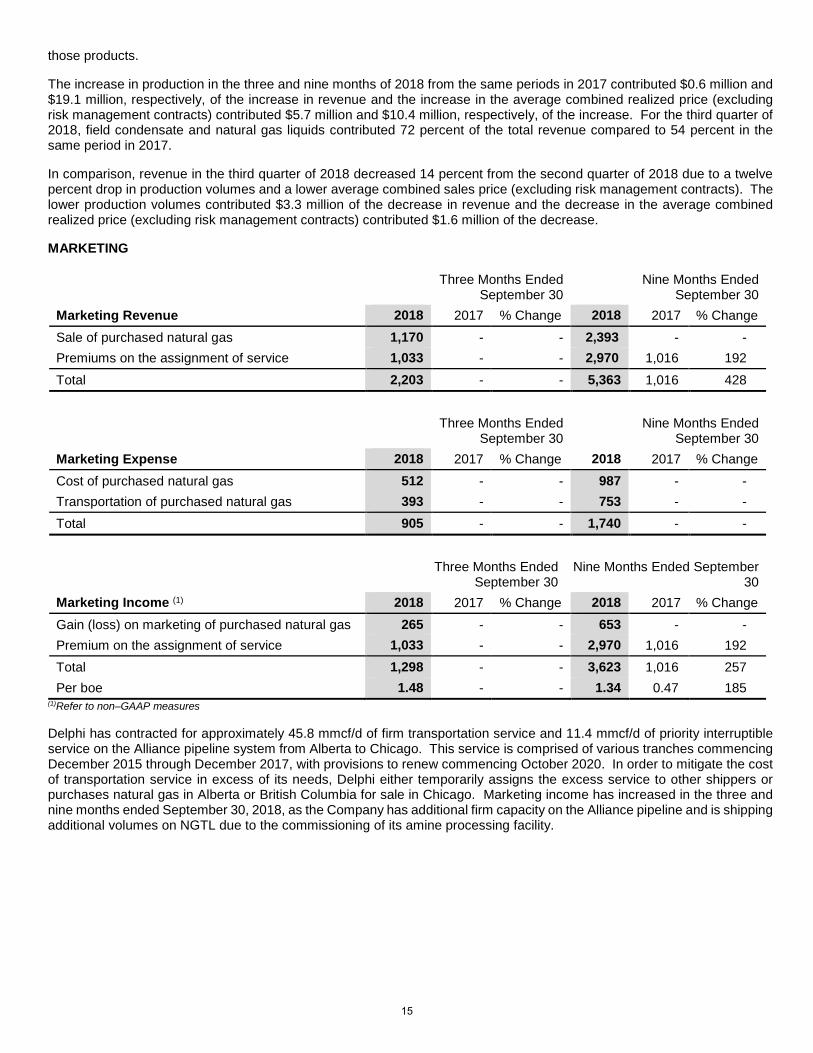
REVENUE
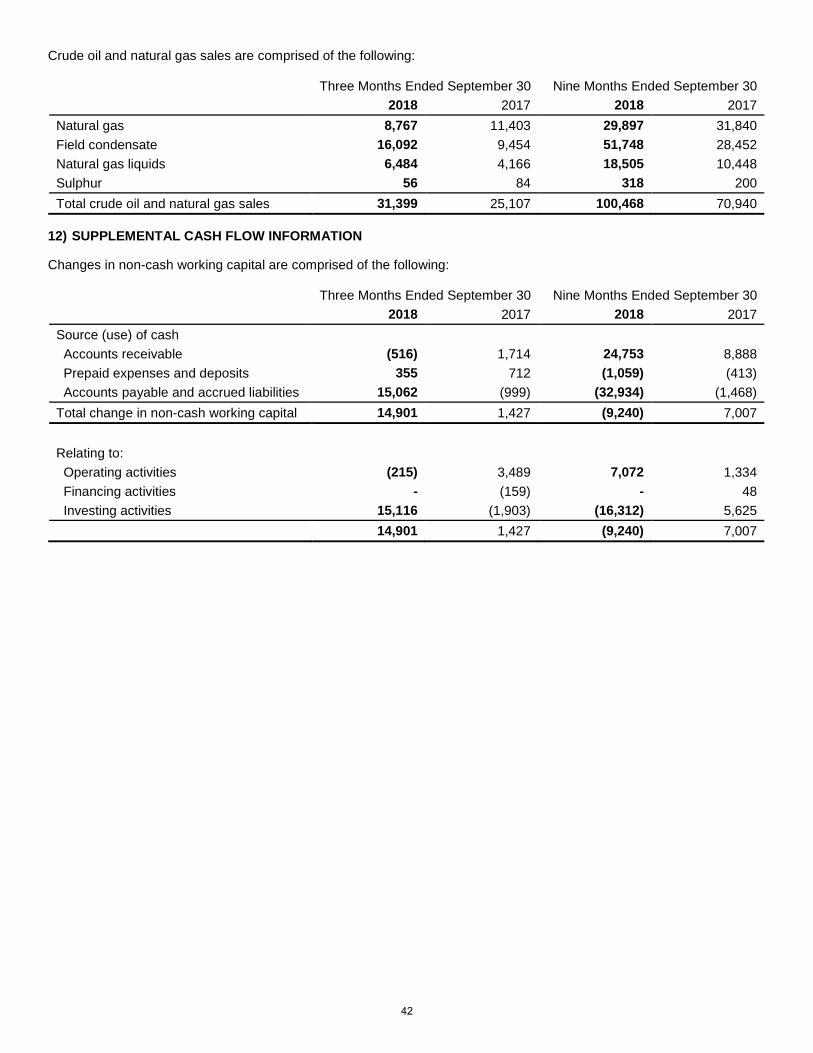
Three Months Ended September 30 Nine Months Ended September 30 2018 2017 % Change 2018 2017 % Change Field condensate 16,092 9,454 70 51,748 28,452 82 Natural gas 8,767 11,403 (23) 29,897 31,840 (6) Natural gas liquids 6,484 4,166 56 18,505 10,448 77 Sulphur 56 84 (33) 318 200 59 Total 31,399 25,107 25 100,468 70,940 42 Per boe 35.87 29.30 22 37.24 32.47 15
Delphi generated revenue of $31.4 million in the third quarter of 2018, a 25 percent increase over the comparative period in 2017. The increase in revenue is due to an improvement in the average sales price (excluding risk management contracts) for field condensate and natural gas liquids. On a per boe basis, revenue increased for the three months ended September 30, 2018 compared to the comparative period in 2017 as Delphi’s field condensate production increased in combination with improved pricing.
Revenue in the first nine months of 2018 was 42 percent higher in comparison to the first nine months of 2017. The increase in revenue is due to higher production, in particular field condensate and natural gas liquids, in combination with an improvement in the average sales price (excluding risk management contracts) for field condensate and natural gas liquids. On a per boe basis, revenue increased for the nine months ended September 30, 2018 compared to the comparative period in 2017 as Delphi’s field condensate and natural gas liquids production increased in combination with improved pricing for
14
those products.
The increase in production in the three and nine months of 2018 from the same periods in 2017 contributed $0.6 million and $19.1 million, respectively, of the increase in revenue and the increase in the average combined realized price (excluding risk management contracts) contributed $5.7 million and $10.4 million, respectively, of the increase. For the third quarter of 2018, field condensate and natural gas liquids contributed 72 percent of the total revenue compared to 54 percent in the same period in 2017.
In comparison, revenue in the third quarter of 2018 decreased 14 percent from the second quarter of 2018 due to a twelve percent drop in production volumes and a lower average combined sales price (excluding risk management contracts). The lower production volumes contributed $3.3 million of the decrease in revenue and the decrease in the average combined realized price (excluding risk management contracts) contributed $1.6 million of the decrease.
MARKETING
Three Months Ended September 30
Nine Months Ended September 30
Marketing Revenue 2018 2017 % Change 2018 2017 % Change Sale of purchased natural gas 1,170 - - 2,393 - - Premiums on the assignment of service 1,033 - - 2,970 1,016 192 Total 2,203 - - 5,363 1,016 428
Three Months Ended September 30
Nine Months Ended September 30
Marketing Expense 2018 2017 % Change 2018 2017 % Change Cost of purchased natural gas 512 - - 987 - - Transportation of purchased natural gas 393 - - 753 - - Total 905 - - 1,740 - -
Three Months Ended September 30
Nine Months Ended September 30
Marketing Income (1) 2018 2017 % Change 2018 2017 % Change Gain (loss) on marketing of purchased natural gas 265 - - 653 - - Premium on the assignment of service 1,033 - - 2,970 1,016 192 Total 1,298 - - 3,623 1,016 257 Per boe 1.48 - - 1.34 0.47 185
(1)Refer to non–GAAP measures
Delphi has contracted for approximately 45.8 mmcf/d of firm transportation service and 11.4 mmcf/d of priority interruptible service on the Alliance pipeline system from Alberta to Chicago. This service is comprised of various tranches commencing December 2015 through December 2017, with provisions to renew commencing October 2020. In order to mitigate the cost of transportation service in excess of its needs, Delphi either temporarily assigns the excess service to other shippers or purchases natural gas in Alberta or British Columbia for sale in Chicago. Marketing income has increased in the three and nine months ended September 30, 2018, as the Company has additional firm capacity on the Alliance pipeline and is shipping additional volumes on NGTL due to the commissioning of its amine processing facility.
15
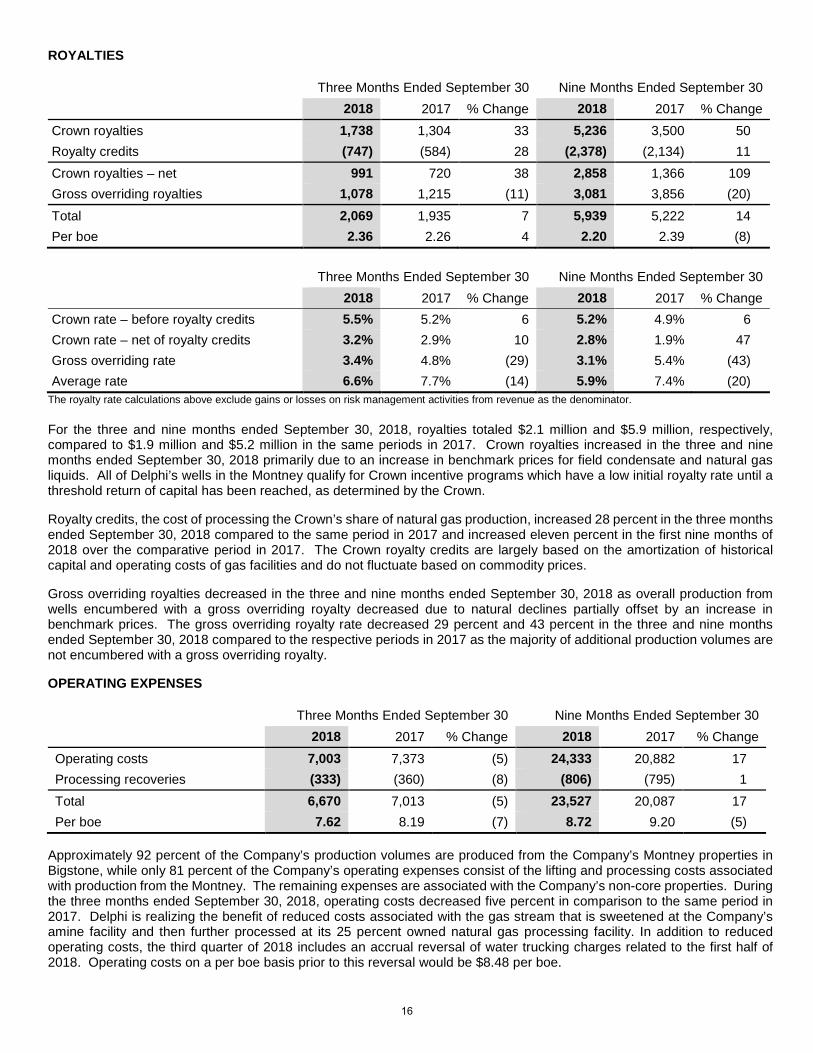
ROYALTIES
Three Months Ended September 30 Nine Months Ended September 30 2018 2017 % Change 2018 2017 % Change Crown royalties 1,738 1,304 33 5,236 3,500 50 Royalty credits (747) (584) 28 (2,378) (2,134) 11 Crown royalties – net 991 720 38 2,858 1,366 109 Gross overriding royalties 1,078 1,215 (11) 3,081 3,856 (20) Total 2,069 1,935 7 5,939 5,222 14 Per boe 2.36 2.26 4 2.20 2.39 (8) Three Months Ended September 30 Nine Months Ended September 30 2018 2017 % Change 2018 2017 % Change Crown rate – before royalty credits 5.5% 5.2% 6 5.2% 4.9% 6 Crown rate – net of royalty credits 3.2% 2.9% 10 2.8% 1.9% 47 Gross overriding rate 3.4% 4.8% (29) 3.1% 5.4% (43) Average rate 6.6% 7.7% (14) 5.9% 7.4% (20)
The royalty rate calculations above exclude gains or losses on risk management activities from revenue as the denominator.
For the three and nine months ended September 30, 2018, royalties totaled $2.1 million and $5.9 million, respectively, compared to $1.9 million and $5.2 million in the same periods in 2017. Crown royalties increased in the three and nine months ended September 30, 2018 primarily due to an increase in benchmark prices for field condensate and natural gas liquids. All of Delphi’s wells in the Montney qualify for Crown incentive programs which have a low initial royalty rate until a threshold return of capital has been reached, as determined by the Crown.
Royalty credits, the cost of processing the Crown’s share of natural gas production, increased 28 percent in the three months ended September 30, 2018 compared to the same period in 2017 and increased eleven percent in the first nine months of 2018 over the comparative period in 2017. The Crown royalty credits are largely based on the amortization of historical capital and operating costs of gas facilities and do not fluctuate based on commodity prices.
Gross overriding royalties decreased in the three and nine months ended September 30, 2018 as overall production from wells encumbered with a gross overriding royalty decreased due to natural declines partially offset by an increase in benchmark prices. The gross overriding royalty rate decreased 29 percent and 43 percent in the three and nine months ended September 30, 2018 compared to the respective periods in 2017 as the majority of additional production volumes are not encumbered with a gross overriding royalty.
OPERATING EXPENSES
Three Months Ended September 30 Nine Months Ended September 30 2018 2017 % Change 2018 2017 % Change Operating costs 7,003 7,373 (5) 24,333 20,882 17 Processing recoveries (333) (360) (8) (806) (795) 1 Total 6,670 7,013 (5) 23,527 20,087 17 Per boe 7.62 8.19 (7) 8.72 9.20 (5)
Approximately 92 percent of the Company’s production volumes are produced from the Company’s Montney properties in Bigstone, while only 81 percent of the Company’s operating expenses consist of the lifting and processing costs associated with production from the Montney. The remaining expenses are associated with the Company’s non-core properties. During the three months ended September 30, 2018, operating costs decreased five percent in comparison to the same period in 2017. Delphi is realizing the benefit of reduced costs associated with the gas stream that is sweetened at the Company’s amine facility and then further processed at its 25 percent owned natural gas processing facility. In addition to reduced operating costs, the third quarter of 2018 includes an accrual reversal of water trucking charges related to the first half of 2018. Operating costs on a per boe basis prior to this reversal would be $8.48 per boe.
16
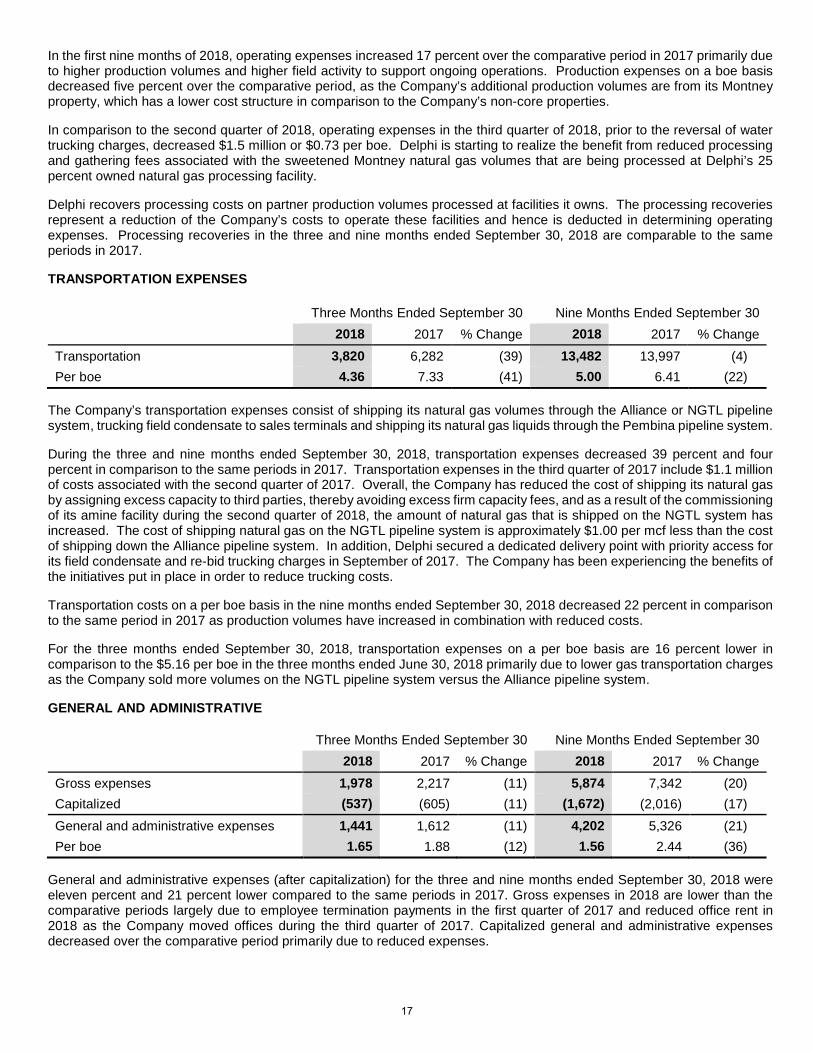
In the first nine months of 2018, operating expenses increased 17 percent over the comparative period in 2017 primarily due to higher production volumes and higher field activity to support ongoing operations. Production expenses on a boe basis decreased five percent over the comparative period, as the Company’s additional production volumes are from its Montney property, which has a lower cost structure in comparison to the Company’s non-core properties.
In comparison to the second quarter of 2018, operating expenses in the third quarter of 2018, prior to the reversal of water trucking charges, decreased $1.5 million or $0.73 per boe. Delphi is starting to realize the benefit from reduced processing and gathering fees associated with the sweetened Montney natural gas volumes that are being processed at Delphi’s 25 percent owned natural gas processing facility.
Delphi recovers processing costs on partner production volumes processed at facilities it owns. The processing recoveries represent a reduction of the Company’s costs to operate these facilities and hence is deducted in determining operating expenses. Processing recoveries in the three and nine months ended September 30, 2018 are comparable to the same periods in 2017.
TRANSPORTATION EXPENSES Three Months Ended September 30 Nine Months Ended September 30 2018 2017 % Change 2018 2017 % Change Transportation 3,820 6,282 (39) 13,482 13,997 (4) Per boe 4.36 7.33 (41) 5.00 6.41 (22)
The Company’s transportation expenses consist of shipping its natural gas volumes through the Alliance or NGTL pipeline system, trucking field condensate to sales terminals and shipping its natural gas liquids through the Pembina pipeline system.
During the three and nine months ended September 30, 2018, transportation expenses decreased 39 percent and four percent in comparison to the same periods in 2017. Transportation expenses in the third quarter of 2017 include $1.1 million of costs associated with the second quarter of 2017. Overall, the Company has reduced the cost of shipping its natural gas by assigning excess capacity to third parties, thereby avoiding excess firm capacity fees, and as a result of the commissioning of its amine facility during the second quarter of 2018, the amount of natural gas that is shipped on the NGTL system has increased. The cost of shipping natural gas on the NGTL pipeline system is approximately $1.00 per mcf less than the cost of shipping down the Alliance pipeline system. In addition, Delphi secured a dedicated delivery point with priority access for its field condensate and re-bid trucking charges in September of 2017. The Company has been experiencing the benefits of the initiatives put in place in order to reduce trucking costs.
Transportation costs on a per boe basis in the nine months ended September 30, 2018 decreased 22 percent in comparison to the same period in 2017 as production volumes have increased in combination with reduced costs.
For the three months ended September 30, 2018, transportation expenses on a per boe basis are 16 percent lower in comparison to the $5.16 per boe in the three months ended June 30, 2018 primarily due to lower gas transportation charges as the Company sold more volumes on the NGTL pipeline system versus the Alliance pipeline system.
GENERAL AND ADMINISTRATIVE
Three Months Ended September 30 Nine Months Ended September 30 2018 2017 % Change 2018 2017 % Change Gross expenses 1,978 2,217 (11) 5,874 7,342 (20) Capitalized (537) (605) (11) (1,672) (2,016) (17) General and administrative expenses 1,441 1,612 (11) 4,202 5,326 (21) Per boe 1.65 1.88 (12) 1.56 2.44 (36)
General and administrative expenses (after capitalization) for the three and nine months ended September 30, 2018 were eleven percent and 21 percent lower compared to the same periods in 2017. Gross expenses in 2018 are lower than the comparative periods largely due to employee termination payments in the first quarter of 2017 and reduced office rent in 2018 as the Company moved offices during the third quarter of 2017. Capitalized general and administrative expenses decreased over the comparative period primarily due to reduced expenses.
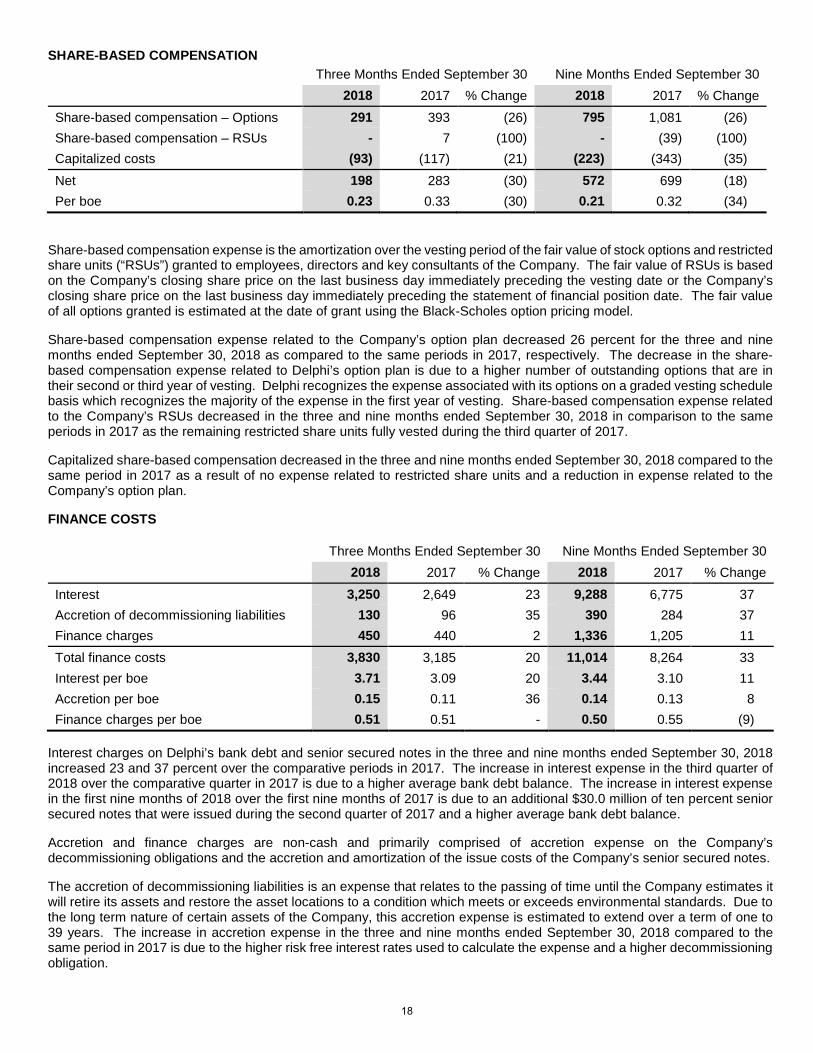
Share-based compensation expense is the amortization over the vesting period of the fair value of stock options and restricted share units (“RSUs”) granted to employees, directors and key consultants of the Company. The fair value of RSUs is based on the Company’s closing share price on the last business day immediately preceding the vesting date or the Company’s closing share price on the last business day immediately preceding the statement of financial position date. The fair value of all options granted is estimated at the date of grant using the Black-Scholes option pricing model.
Share-based compensation expense related to the Company’s option plan decreased 26 percent for the three and nine months ended September 30, 2018 as compared to the same periods in 2017, respectively. The decrease in the share-based compensation expense related to Delphi’s option plan is due to a higher number of outstanding options that are in their second or third year of vesting. Delphi recognizes the expense associated with its options on a graded vesting schedule basis which recognizes the majority of the expense in the first year of vesting. Share-based compensation expense related to the Company’s RSUs decreased in the three and nine months ended September 30, 2018 in comparison to the same periods in 2017 as the remaining restricted share units fully vested during the third quarter of 2017.
Capitalized share-based compensation decreased in the three and nine months ended September 30, 2018 compared to the same period in 2017 as a result of no expense related to restricted share units and a reduction in expense related to the Company’s option plan.
FINANCE COSTS
Three Months Ended September 30 Nine Months Ended September 30 2018 2017 % Change 2018 2017 % Change Interest 3,250 2,649 23 9,288 6,775 37 Accretion of decommissioning liabilities 130 96 35 390 284 37 Finance charges 450 440 2 1,336 1,205 11 Total finance costs 3,830 3,185 20 11,014 8,264 33 Interest per boe 3.71 3.09 20 3.44 3.10 11 Accretion per boe 0.15 0.11 36 0.14 0.13 8 Finance charges per boe 0.51 0.51 - 0.50 0.55 (9)
Interest charges on Delphi’s bank debt and senior secured notes in the three and nine months ended September 30, 2018 increased 23 and 37 percent over the comparative periods in 2017. The increase in interest expense in the third quarter of 2018 over the comparative quarter in 2017 is due to a higher average bank debt balance. The increase in interest expense in the first nine months of 2018 over the first nine months of 2017 is due to an additional $30.0 million of ten percent senior secured notes that were issued during the second quarter of 2017 and a higher average bank debt balance.
Accretion and finance charges are non-cash and primarily comprised of accretion expense on the Company’s decommissioning obligations and the accretion and amortization of the issue costs of the Company’s senior secured notes.
The accretion of decommissioning liabilities is an expense that relates to the passing of time until the Company estimates it will retire its assets and restore the asset locations to a condition which meets or exceeds environmental standards. Due to the long term nature of certain assets of the Company, this accretion expense is estimated to extend over a term of one to 39 years. The increase in accretion expense in the three and nine months ended September 30, 2018 compared to the same period in 2017 is due to the higher risk free interest rates used to calculate the expense and a higher decommissioning obligation.
18
Finance charges include the amortization of transaction costs related to the issue of senior secured notes and the accretion of the debt to its face value. The increase in finance charges in the three and nine months ended September 30, 2018 over the comparative period in 2017 is due to a higher balance of outstanding debt subject to amortization and accretion.
DEPLETION AND DEPRECIATION
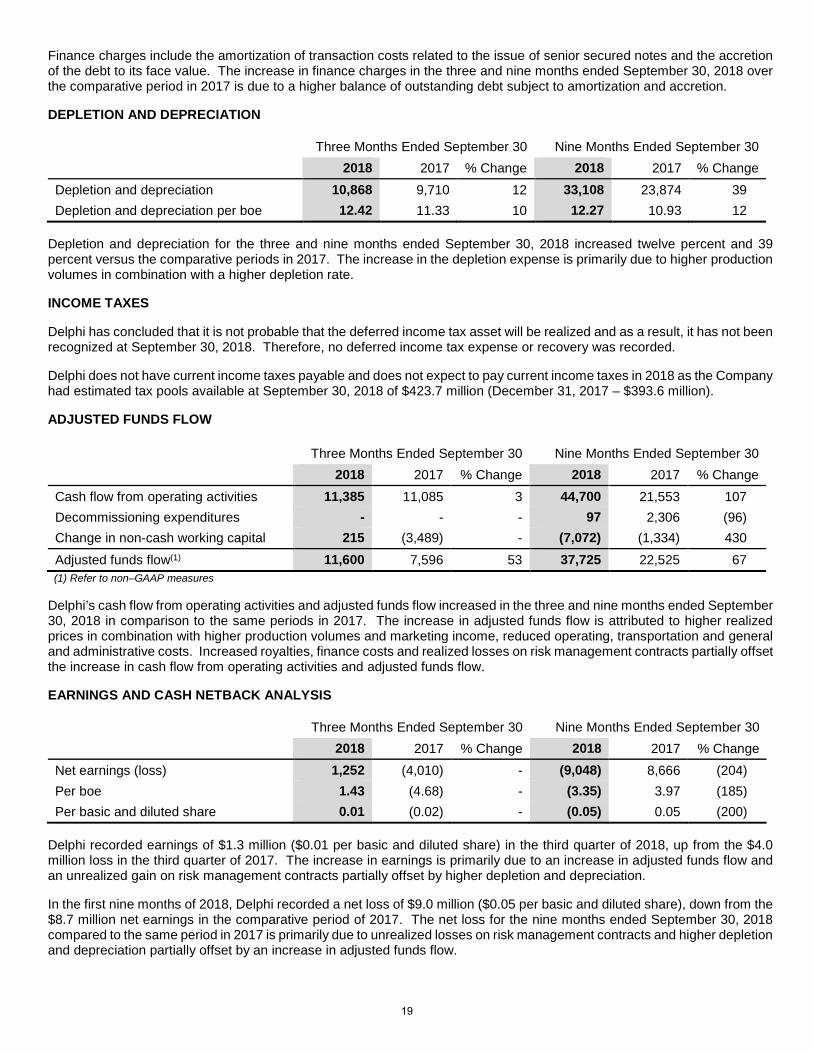
Three Months Ended September 30 Nine Months Ended September 30 2018 2017 % Change 2018 2017 % Change Depletion and depreciation 10,868 9,710 12 33,108 23,874 39 Depletion and depreciation per boe 12.42 11.33 10 12.27 10.93 12
Depletion and depreciation for the three and nine months ended September 30, 2018 increased twelve percent and 39 percent versus the comparative periods in 2017. The increase in the depletion expense is primarily due to higher production volumes in combination with a higher depletion rate.
INCOME TAXES
Delphi has concluded that it is not probable that the deferred income tax asset will be realized and as a result, it has not been recognized at September 30, 2018. Therefore, no deferred income tax expense or recovery was recorded.
Delphi does not have current income taxes payable and does not expect to pay current income taxes in 2018 as the Company had estimated tax pools available at September 30, 2018 of $423.7 million (December 31, 2017 – $393.6 million).
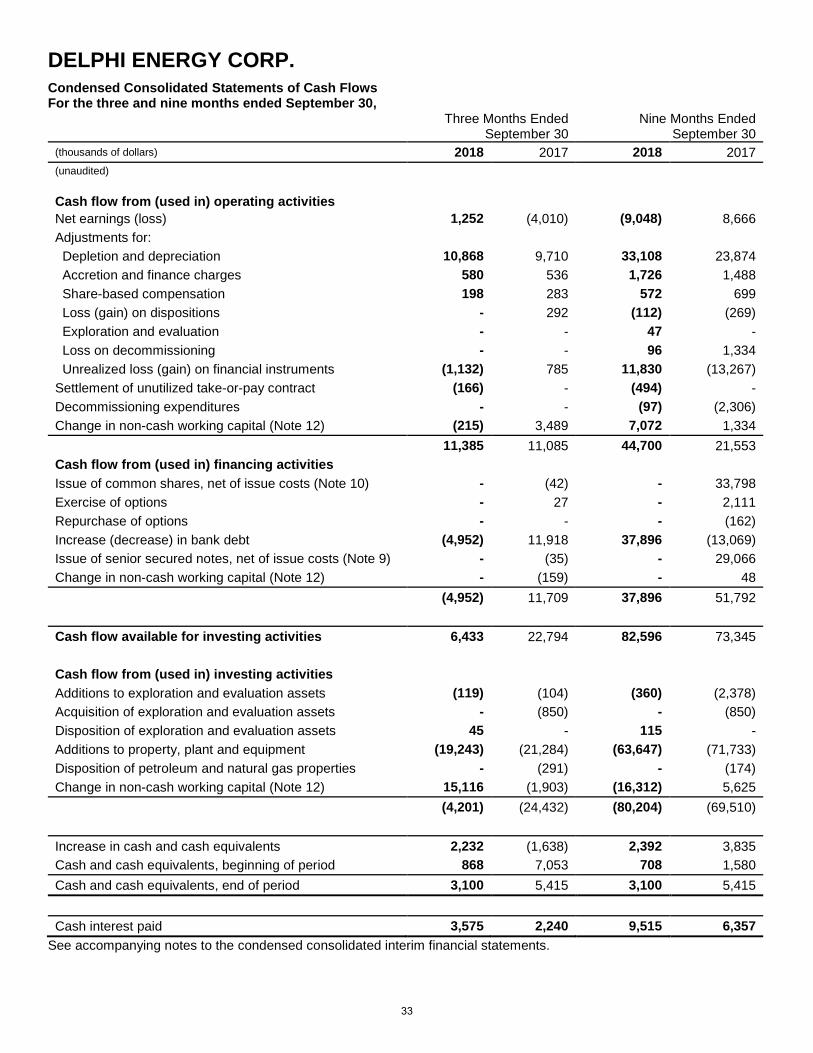
ADJUSTED FUNDS FLOW Three Months Ended September 30 Nine Months Ended September 30 2018 2017 % Change 2018 2017 % Change Cash flow from operating activities 11,385 11,085 3 44,700 21,553 107 Decommissioning expenditures - - - 97 2,306 (96) Change in non-cash working capital 215 (3,489) - (7,072) (1,334) 430 Adjusted funds flow(1) 11,600 7,596 53 37,725 22,525 67 (1) Refer to non–GAAP measures
Delphi’s cash flow from operating activities and adjusted funds flow increased in the three and nine months ended September 30, 2018 in comparison to the same periods in 2017. The increase in adjusted funds flow is attributed to higher realized prices in combination with higher production volumes and marketing income, reduced operating, transportation and general and administrative costs. Increased royalties, finance costs and realized losses on risk management contracts partially offset the increase in cash flow from operating activities and adjusted funds flow.
EARNINGS AND CASH NETBACK ANALYSIS
Three Months Ended September 30 Nine Months Ended September 30 2018 2017 % Change 2018 2017 % Change Net earnings (loss) 1,252 (4,010) - (9,048) 8,666 (204) Per boe 1.43 (4.68) - (3.35) 3.97 (185) Per basic and diluted share 0.01 (0.02) - (0.05) 0.05 (200)
Delphi recorded earnings of $1.3 million ($0.01 per basic and diluted share) in the third quarter of 2018, up from the $4.0 million loss in the third quarter of 2017. The increase in earnings is primarily due to an increase in adjusted funds flow and an unrealized gain on risk management contracts partially offset by higher depletion and depreciation.
In the first nine months of 2018, Delphi recorded a net loss of $9.0 million ($0.05 per basic and diluted share), down from the $8.7 million net earnings in the comparative period of 2017. The net loss for the nine months ended September 30, 2018 compared to the same period in 2017 is primarily due to unrealized losses on risk management contracts and higher depletion and depreciation partially offset by an increase in adjusted funds flow.
19
Three Months Ended September 30 Nine Months Ended September 30
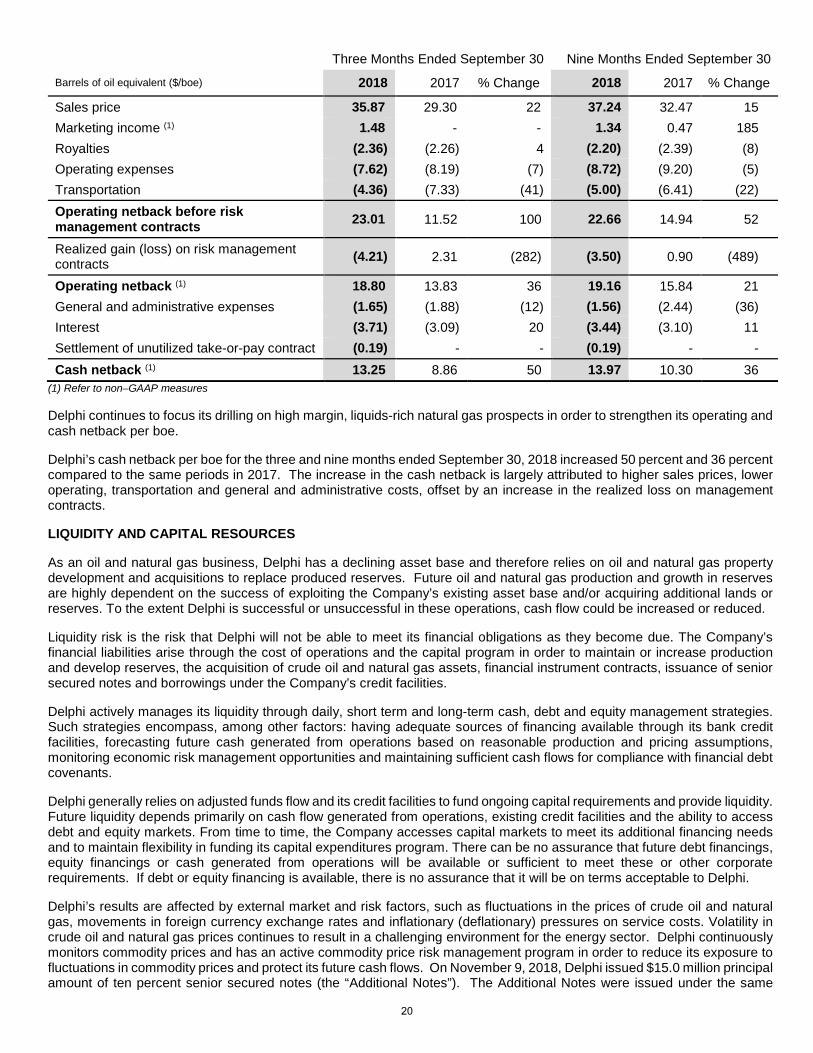
Delphi continues to focus its drilling on high margin, liquids-rich natural gas prospects in order to strengthen its operating and cash netback per boe.
Delphi’s cash netback per boe for the three and nine months ended September 30, 2018 increased 50 percent and 36 percent compared to the same periods in 2017. The increase in the cash netback is largely attributed to higher sales prices, lower operating, transportation and general and administrative costs, offset by an increase in the realized loss on management contracts.
LIQUIDITY AND CAPITAL RESOURCES
As an oil and natural gas business, Delphi has a declining asset base and therefore relies on oil and natural gas property development and acquisitions to replace produced reserves. Future oil and natural gas production and growth in reserves are highly dependent on the success of exploiting the Company’s existing asset base and/or acquiring additional lands or reserves. To the extent Delphi is successful or unsuccessful in these operations, cash flow could be increased or reduced.
Liquidity risk is the risk that Delphi will not be able to meet its financial obligations as they become due. The Company’s financial liabilities arise through the cost of operations and the capital program in order to maintain or increase production and develop reserves, the acquisition of crude oil and natural gas assets, financial instrument contracts, issuance of senior secured notes and borrowings under the Company’s credit facilities.
Delphi actively manages its liquidity through daily, short term and long-term cash, debt and equity management strategies. Such strategies encompass, among other factors: having adequate sources of financing available through its bank credit facilities, forecasting future cash generated from operations based on reasonable production and pricing assumptions, monitoring economic risk management opportunities and maintaining sufficient cash flows for compliance with financial debt covenants.
Delphi generally relies on adjusted funds flow and its credit facilities to fund ongoing capital requirements and provide liquidity. Future liquidity depends primarily on cash flow generated from operations, existing credit facilities and the ability to access debt and equity markets. From time to time, the Company accesses capital markets to meet its additional financing needs and to maintain flexibility in funding its capital expenditures program. There can be no assurance that future debt financings, equity financings or cash generated from operations will be available or sufficient to meet these or other corporate requirements. If debt or equity financing is available, there is no assurance that it will be on terms acceptable to Delphi.
Delphi’s results are affected by external market and risk factors, such as fluctuations in the prices of crude oil and natural gas, movements in foreign currency exchange rates and inflationary (deflationary) pressures on service costs. Volatility in crude oil and natural gas prices continues to result in a challenging environment for the energy sector. Delphi continuously monitors commodity prices and has an active commodity price risk management program in order to reduce its exposure to fluctuations in commodity prices and protect its future cash flows. On November 9, 2018, Delphi issued $15.0 million principal amount of ten percent senior secured notes (the “Additional Notes”). The Additional Notes were issued under the same
20
indenture as the existing senior secured notes and collectively are treated as a single class of debt securities with identical terms. The Additional Notes are fungible with the existing senior secured notes for trading purposes. Proceeds were used to temporarily repay a portion of Delphi’s outstanding indebtedness, providing Delphi with financial flexibility on its senior credit facility in order to fund a portion of its 2018 and 2019 capital program.
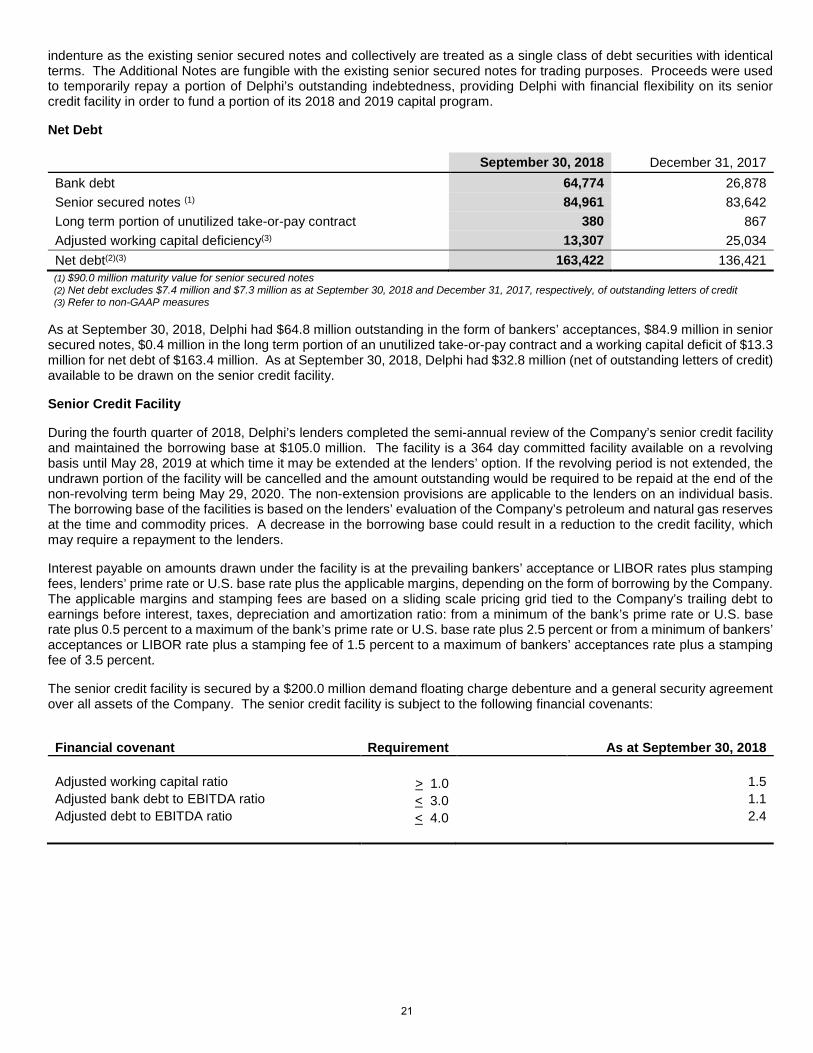
Net Debt September 30, 2018 December 31, 2017 Bank debt 64,774 26,878 Senior secured notes (1) 84,961 83,642 Long term portion of unutilized take-or-pay contract 380 867 Adjusted working capital deficiency(3) 13,307 25,034 Net debt(2)(3) 163,422 136,421 (1) $90.0 million maturity value for senior secured notes (2) Net debt excludes $7.4 million and $7.3 million as at September 30, 2018 and December 31, 2017, respectively, of outstanding letters of credit (3) Refer to non-GAAP measures
As at September 30, 2018, Delphi had $64.8 million outstanding in the form of bankers’ acceptances, $84.9 million in senior secured notes, $0.4 million in the long term portion of an unutilized take-or-pay contract and a working capital deficit of $13.3 million for net debt of $163.4 million. As at September 30, 2018, Delphi had $32.8 million (net of outstanding letters of credit) available to be drawn on the senior credit facility.
Senior Credit Facility
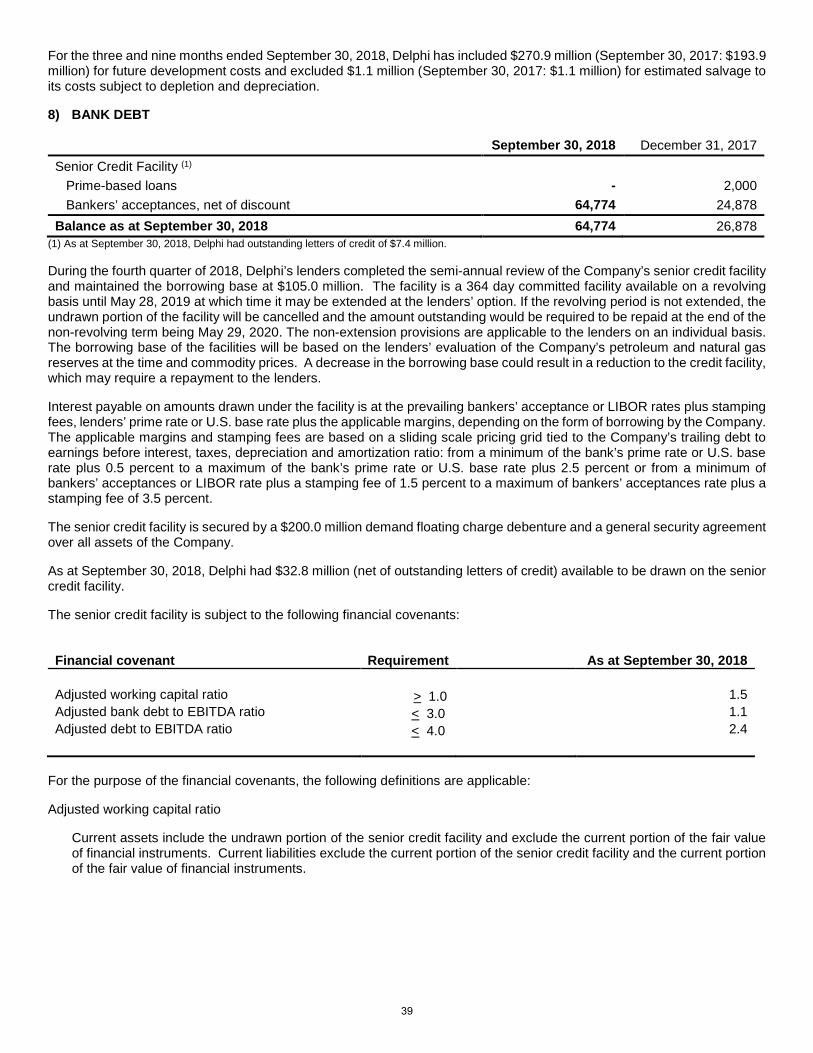
During the fourth quarter of 2018, Delphi’s lenders completed the semi-annual review of the Company’s senior credit facility and maintained the borrowing base at $105.0 million. The facility is a 364 day committed facility available on a revolving basis until May 28, 2019 at which time it may be extended at the lenders’ option. If the revolving period is not extended, the undrawn portion of the facility will be cancelled and the amount outstanding would be required to be repaid at the end of the non-revolving term being May 29, 2020. The non-extension provisions are applicable to the lenders on an individual basis. The borrowing base of the facilities is based on the lenders’ evaluation of the Company’s petroleum and natural gas reserves at the time and commodity prices. A decrease in the borrowing base could result in a reduction to the credit facility, which may require a repayment to the lenders.
Interest payable on amounts drawn under the facility is at the prevailing bankers’ acceptance or LIBOR rates plus stamping fees, lenders’ prime rate or U.S. base rate plus the applicable margins, depending on the form of borrowing by the Company. The applicable margins and stamping fees are based on a sliding scale pricing grid tied to the Company’s trailing debt to earnings before interest, taxes, depreciation and amortization ratio: from a minimum of the bank’s prime rate or U.S. base rate plus 0.5 percent to a maximum of the bank’s prime rate or U.S. base rate plus 2.5 percent or from a minimum of bankers’ acceptances or LIBOR rate plus a stamping fee of 1.5 percent to a maximum of bankers’ acceptances rate plus a stamping fee of 3.5 percent.
The senior credit facility is secured by a $200.0 million demand floating charge debenture and a general security agreement over all assets of the Company. The senior credit facility is subject to the following financial covenants:
Financial covenant
Requirement
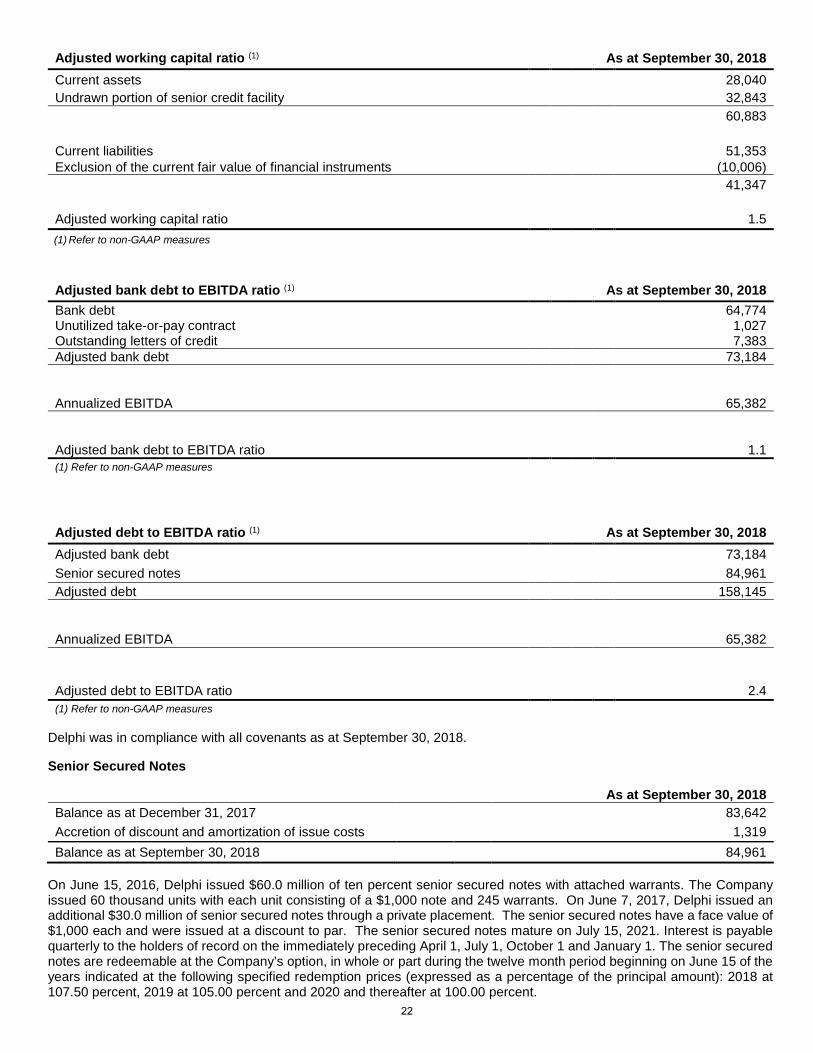
As at September 30, 2018
Adjusted working capital ratio > 1.0 1.5 Adjusted bank debt to EBITDA ratio < 3.0 1.1 Adjusted debt to EBITDA ratio < 4.0 2.4
21
Delphi was in compliance with all covenants as at September 30, 2018.
Senior Secured Notes
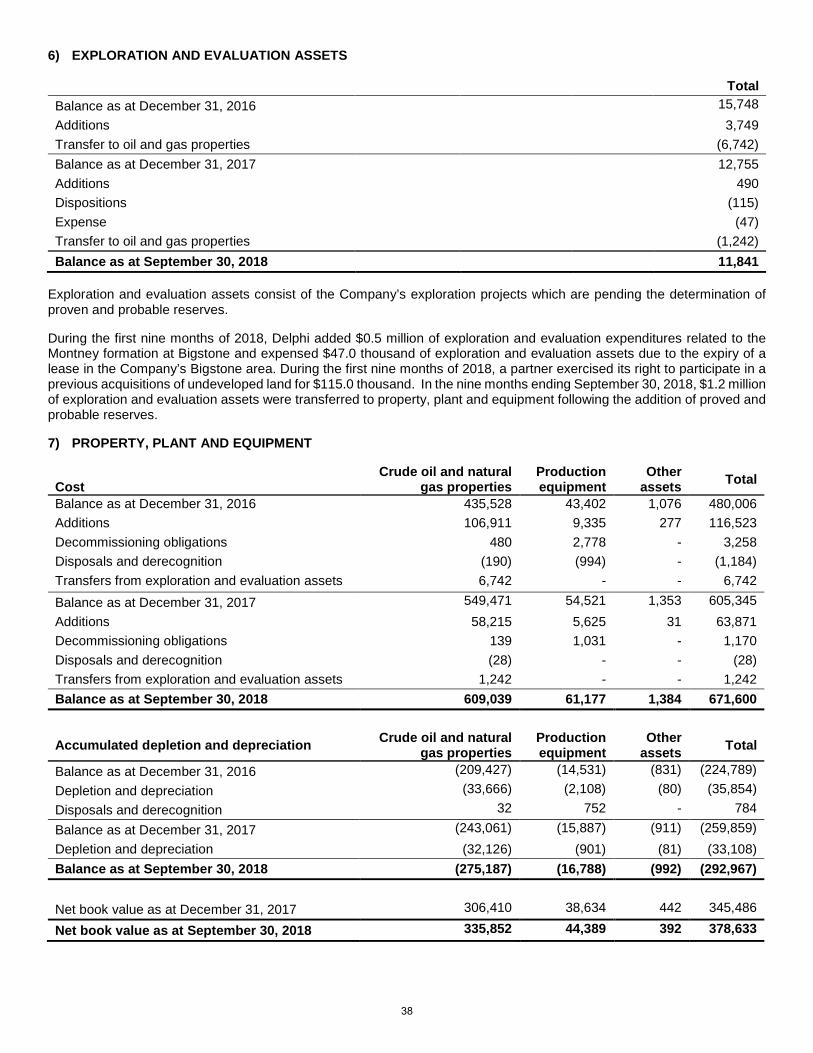
As at September 30, 2018 Balance as at December 31, 2017 83,642 Accretion of discount and amortization of issue costs 1,319 Balance as at September 30, 2018 84,961
On June 15, 2016, Delphi issued $60.0 million of ten percent senior secured notes with attached warrants. The Company issued 60 thousand units with each unit consisting of a $1,000 note and 245 warrants. On June 7, 2017, Delphi issued an additional $30.0 million of senior secured notes through a private placement. The senior secured notes have a face value of $1,000 each and were issued at a discount to par. The senior secured notes mature on July 15, 2021. Interest is payable quarterly to the holders of record on the immediately preceding April 1, July 1, October 1 and January 1. The senior secured notes are redeemable at the Company’s option, in whole or part during the twelve month period beginning on June 15 of the years indicated at the following specified redemption prices (expressed as a percentage of the principal amount): 2018 at 107.50 percent, 2019 at 105.00 percent and 2020 and thereafter at 100.00 percent.
Adjusted working capital ratio (1) As at September 30, 2018 Current assets 28,040 Undrawn portion of senior credit facility 32,843 60,883 Current liabilities 51,353 Exclusion of the current fair value of financial instruments (10,006) 41,347 Adjusted working capital ratio 1.5 (1) Refer to non-GAAP measures
Adjusted bank debt to EBITDA ratio (1) As at September 30, 2018 Bank debt 64,774 Unutilized take-or-pay contract 1,027 Outstanding letters of credit 7,383 Adjusted bank debt 73,184
Annualized EBITDA 65,382 Adjusted bank debt to EBITDA ratio 1.1 (1) Refer to non-GAAP measures
Adjusted debt to EBITDA ratio (1) As at September 30, 2018 Adjusted bank debt 73,184 Senior secured notes 84,961 Adjusted debt 158,145
Annualized EBITDA 65,382 Adjusted debt to EBITDA ratio 2.4 (1) Refer to non-GAAP measures
22
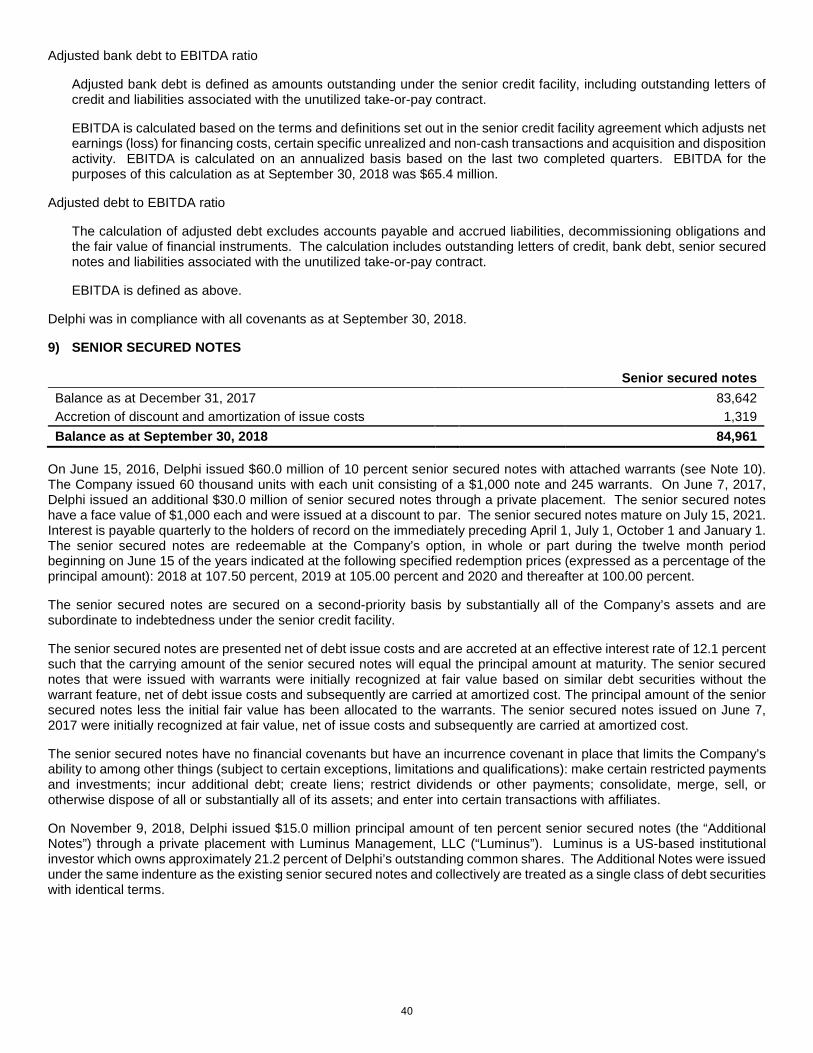
The senior secured notes are secured on a second-priority basis by substantially all of the Company’s assets and are subordinate to indebtedness under the senior credit facility.
The senior secured notes are presented net of debt issue costs and will be accreted at an effective interest rate of 12.1 percent such that the carrying amount of the senior secured notes will equal the principal amount at maturity. The senior secured notes that were issued with warrants were initially recognized at fair value based on similar debt securities without the warrant feature, net of debt issue costs and subsequently are carried at amortized cost. The principal amount of the senior secured notes less the initial fair value has been allocated to the warrants. The senior secured notes issued on June 7, 2017 were initially recognized at fair value, net of issue costs and subsequently are carried at amortized cost.
The senior secured notes have no financial covenants but have an incurrence covenant in place that limits the Company’s ability to among other things (subject to certain exceptions, limitations and qualifications): make certain restricted payments and investments; incur additional debt; create liens; restrict dividends or other payments; consolidate, merge, sell, or otherwise dispose of all or substantially all of its assets; and enter into certain transactions with affiliates.
On November 9, 2018, Delphi issued an additional $15.0 million principal amount of ten percent senior secured notes through a private placement. The Additional Notes were issued under the same indenture as the existing senior secured notes and collectively are treated as a single class of debt securities with identical terms.
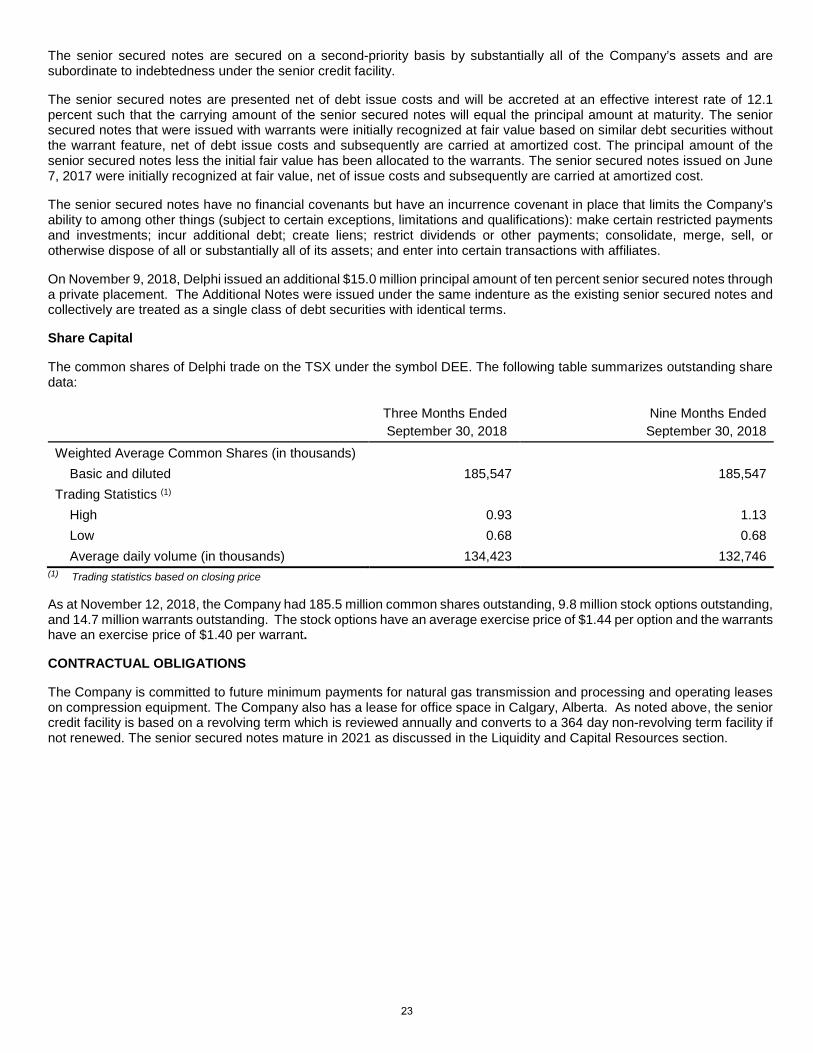
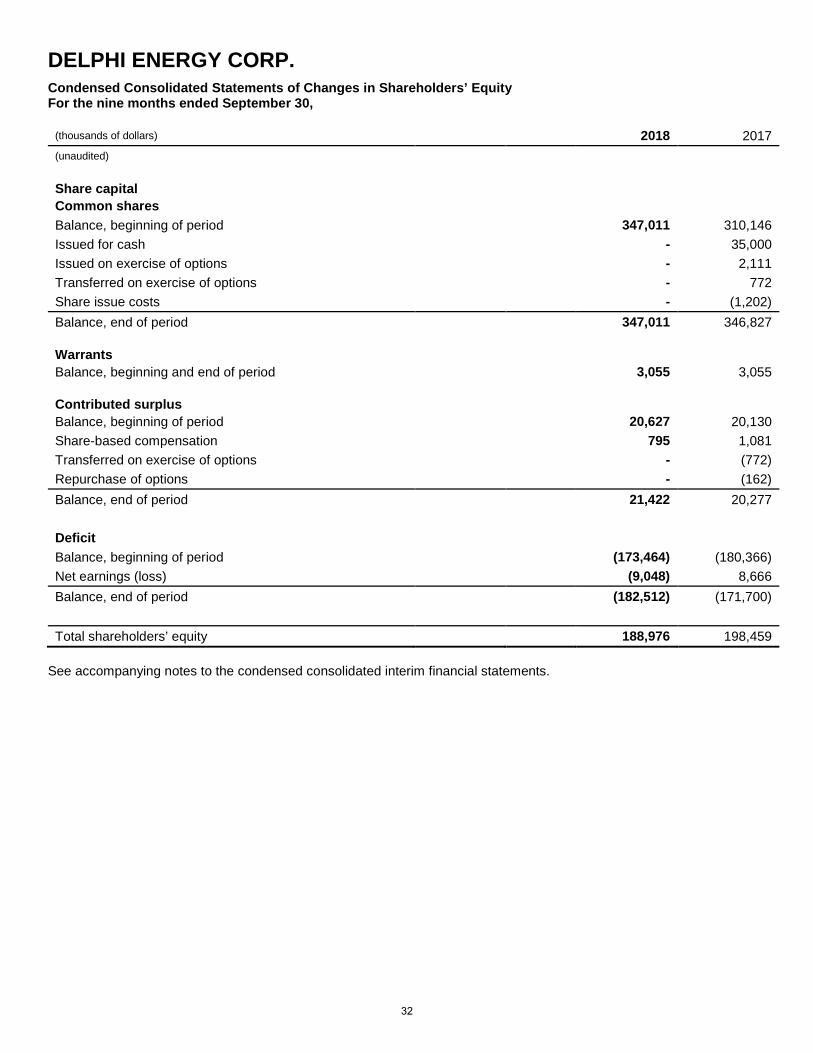
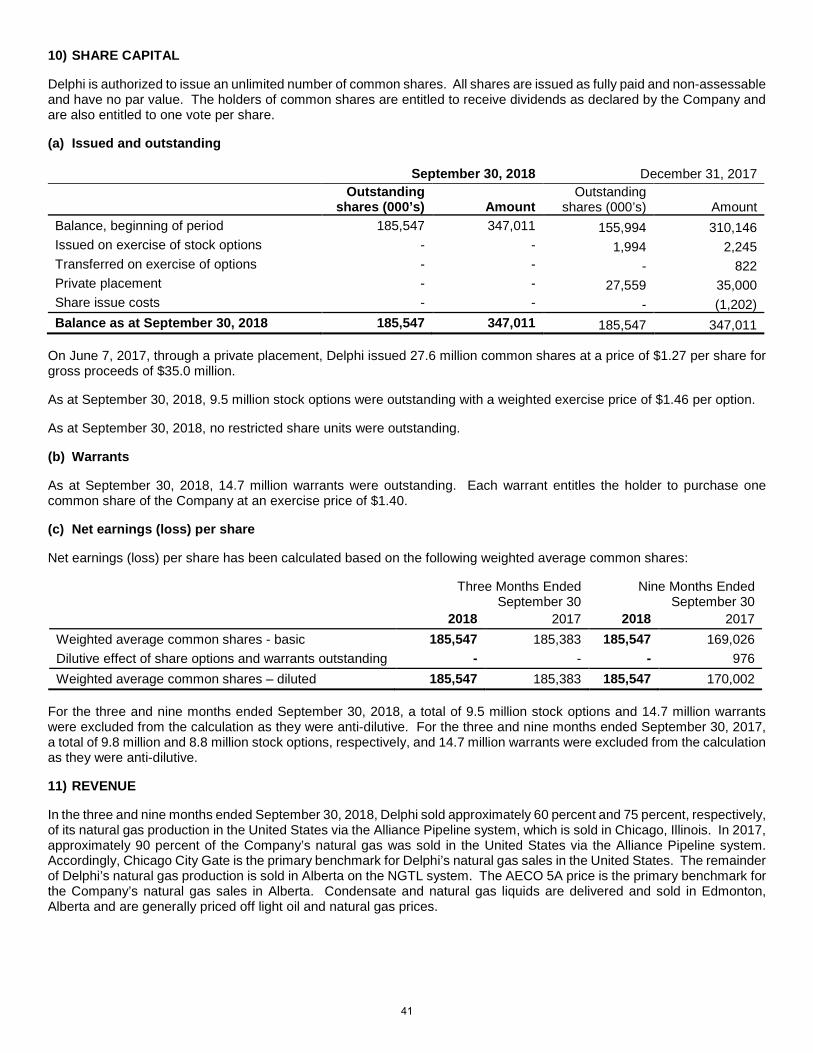
Share Capital
The common shares of Delphi trade on the TSX under the symbol DEE. The following table summarizes outstanding share data:
Three Months Ended September 30, 2018
Nine Months Ended September 30, 2018
Weighted Average Common Shares (in thousands) Basic and diluted 185,547 185,547 Trading Statistics (1) High 0.93 1.13 Low 0.68 0.68 Average daily volume (in thousands) 134,423 132,746
(1) Trading statistics based on closing price
As at November 12, 2018, the Company had 185.5 million common shares outstanding, 9.8 million stock options outstanding, and 14.7 million warrants outstanding. The stock options have an average exercise price of $1.44 per option and the warrants have an exercise price of $1.40 per warrant.
CONTRACTUAL OBLIGATIONS
The Company is committed to future minimum payments for natural gas transmission and processing and operating leases on compression equipment. The Company also has a lease for office space in Calgary, Alberta. As noted above, the senior credit facility is based on a revolving term which is reviewed annually and converts to a 364 day non-revolving term facility if not renewed. The senior secured notes mature in 2021 as discussed in the Liquidity and Capital Resources section.
23
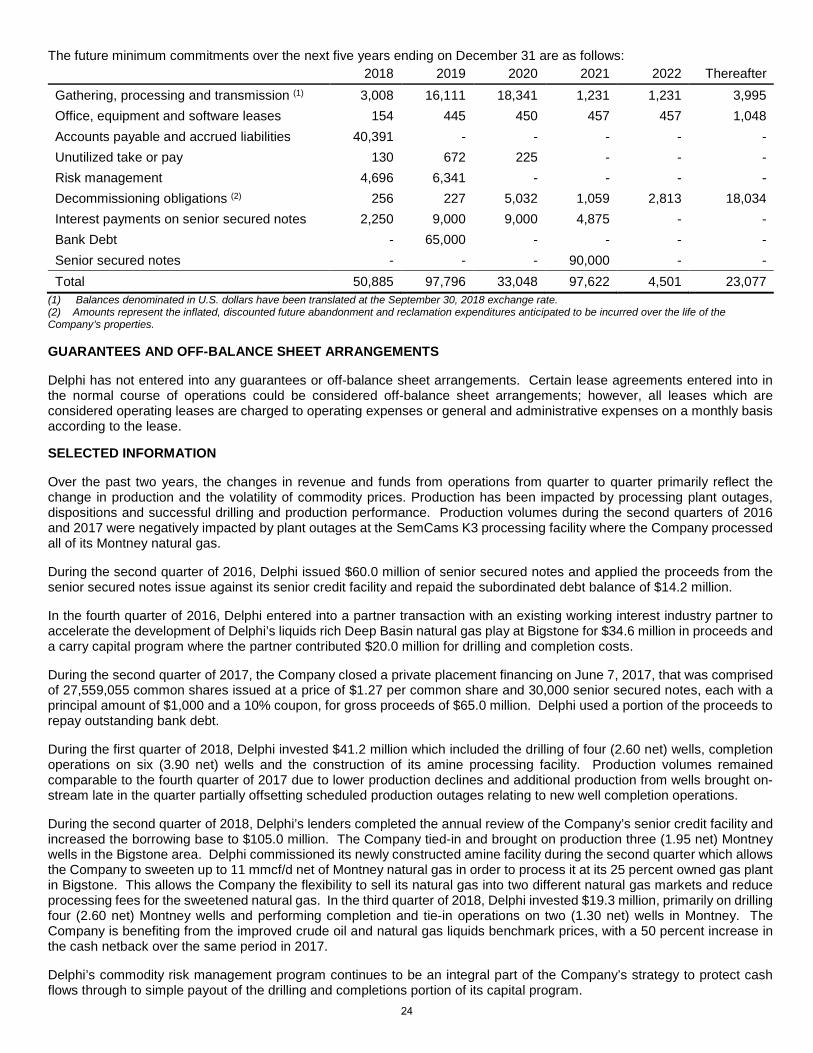
The future minimum commitments over the next five years ending on December 31 are as follows: 2018 2019 2020 2021 2022 Thereafter
(1) Balances denominated in U.S. dollars have been translated at the September 30, 2018 exchange rate. (2) Amounts represent the inflated, discounted future abandonment and reclamation expenditures anticipated to be incurred over the life of the Company’s properties.
GUARANTEES AND OFF-BALANCE SHEET ARRANGEMENTS
Delphi has not entered into any guarantees or off-balance sheet arrangements. Certain lease agreements entered into in the normal course of operations could be considered off-balance sheet arrangements; however, all leases which are considered operating leases are charged to operating expenses or general and administrative expenses on a monthly basis according to the lease.
SELECTED INFORMATION
Over the past two years, the changes in revenue and funds from operations from quarter to quarter primarily reflect the change in production and the volatility of commodity prices. Production has been impacted by processing plant outages, dispositions and successful drilling and production performance. Production volumes during the second quarters of 2016 and 2017 were negatively impacted by plant outages at the SemCams K3 processing facility where the Company processed all of its Montney natural gas.
During the second quarter of 2016, Delphi issued $60.0 million of senior secured notes and applied the proceeds from the senior secured notes issue against its senior credit facility and repaid the subordinated debt balance of $14.2 million.
In the fourth quarter of 2016, Delphi entered into a partner transaction with an existing working interest industry partner to accelerate the development of Delphi’s liquids rich Deep Basin natural gas play at Bigstone for $34.6 million in proceeds and a carry capital program where the partner contributed $20.0 million for drilling and completion costs.
During the second quarter of 2017, the Company closed a private placement financing on June 7, 2017, that was comprised of 27,559,055 common shares issued at a price of $1.27 per common share and 30,000 senior secured notes, each with a principal amount of $1,000 and a 10% coupon, for gross proceeds of $65.0 million. Delphi used a portion of the proceeds to repay outstanding bank debt.
During the first quarter of 2018, Delphi invested $41.2 million which included the drilling of four (2.60 net) wells, completion operations on six (3.90 net) wells and the construction of its amine processing facility. Production volumes remained comparable to the fourth quarter of 2017 due to lower production declines and additional production from wells brought on-stream late in the quarter partially offsetting scheduled production outages relating to new well completion operations.
During the second quarter of 2018, Delphi’s lenders completed the annual review of the Company’s senior credit facility and increased the borrowing base to $105.0 million. The Company tied-in and brought on production three (1.95 net) Montney wells in the Bigstone area. Delphi commissioned its newly constructed amine facility during the second quarter which allows the Company to sweeten up to 11 mmcf/d net of Montney natural gas in order to process it at its 25 percent owned gas plant in Bigstone. This allows the Company the flexibility to sell its natural gas into two different natural gas markets and reduce processing fees for the sweetened natural gas. In the third quarter of 2018, Delphi invested $19.3 million, primarily on drilling four (2.60 net) Montney wells and performing completion and tie-in operations on two (1.30 net) wells in Montney. The Company is benefiting from the improved crude oil and natural gas liquids benchmark prices, with a 50 percent increase in the cash netback over the same period in 2017.
Delphi’s commodity risk management program continues to be an integral part of the Company’s strategy to protect cash flows through to simple payout of the drilling and completions portion of its capital program.
24
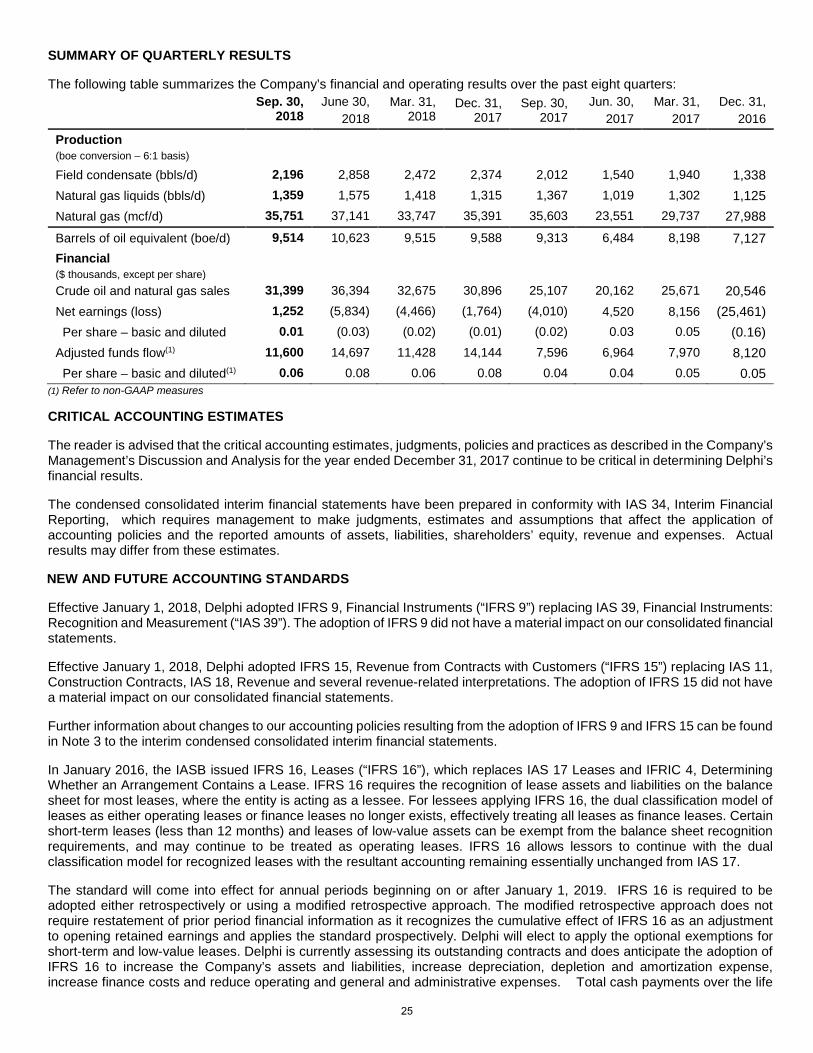
SUMMARY OF QUARTERLY RESULTS
The following table summarizes the Company’s financial and operating results over the past eight quarters: Sep. 30,
Crude oil and natural gas sales 31,399 36,394 32,675 30,896 25,107 20,162 25,671 20,546 Net earnings (loss) 1,252 (5,834) (4,466) (1,764) (4,010) 4,520 8,156 (25,461) Per share – basic and diluted 0.01 (0.03) (0.02) (0.01) (0.02) 0.03 0.05 (0.16) Adjusted funds flow(1) 11,600 14,697 11,428 14,144 7,596 6,964 7,970 8,120 Per share – basic and diluted(1) 0.06 0.08 0.06 0.08 0.04 0.04 0.05 0.05
(1) Refer to non-GAAP measures CRITICAL ACCOUNTING ESTIMATES
The reader is advised that the critical accounting estimates, judgments, policies and practices as described in the Company’s Management’s Discussion and Analysis for the year ended December 31, 2017 continue to be critical in determining Delphi’s financial results.
The condensed consolidated interim financial statements have been prepared in conformity with IAS 34, Interim Financial Reporting, which requires management to make judgments, estimates and assumptions that affect the application of accounting policies and the reported amounts of assets, liabilities, shareholders’ equity, revenue and expenses. Actual results may differ from these estimates.
NEW AND FUTURE ACCOUNTING STANDARDS
Effective January 1, 2018, Delphi adopted IFRS 9, Financial Instruments (“IFRS 9”) replacing IAS 39, Financial Instruments: Recognition and Measurement (“IAS 39”). The adoption of IFRS 9 did not have a material impact on our consolidated financial statements.
Effective January 1, 2018, Delphi adopted IFRS 15, Revenue from Contracts with Customers (“IFRS 15”) replacing IAS 11, Construction Contracts, IAS 18, Revenue and several revenue-related interpretations. The adoption of IFRS 15 did not have a material impact on our consolidated financial statements.
Further information about changes to our accounting policies resulting from the adoption of IFRS 9 and IFRS 15 can be found in Note 3 to the interim condensed consolidated interim financial statements.
In January 2016, the IASB issued IFRS 16, Leases (“IFRS 16”), which replaces IAS 17 Leases and IFRIC 4, Determining Whether an Arrangement Contains a Lease. IFRS 16 requires the recognition of lease assets and liabilities on the balance sheet for most leases, where the entity is acting as a lessee. For lessees applying IFRS 16, the dual classification model of leases as either operating leases or finance leases no longer exists, effectively treating all leases as finance leases. Certain short-term leases (less than 12 months) and leases of low-value assets can be exempt from the balance sheet recognition requirements, and may continue to be treated as operating leases. IFRS 16 allows lessors to continue with the dual classification model for recognized leases with the resultant accounting remaining essentially unchanged from IAS 17.
The standard will come into effect for annual periods beginning on or after January 1, 2019. IFRS 16 is required to be adopted either retrospectively or using a modified retrospective approach. The modified retrospective approach does not require restatement of prior period financial information as it recognizes the cumulative effect of IFRS 16 as an adjustment to opening retained earnings and applies the standard prospectively. Delphi will elect to apply the optional exemptions for short-term and low-value leases. Delphi is currently assessing its outstanding contracts and does anticipate the adoption of IFRS 16 to increase the Company’s assets and liabilities, increase depreciation, depletion and amortization expense, increase finance costs and reduce operating and general and administrative expenses. Total cash payments over the life
25
of the lease will remain the same. Cash payments associated with operating leases are currently presented within cash flows from operating activities. Under IFRS 16, the cash flows will be allocated between financing activities for the repayment of the principal liability and operating activities for the financing expense portion. The overall impact to cash flow will remain unchanged.
CORPORATE GOVERNANCE
The shareholders’ interests are a critical factor in the operations and management of Delphi. The Company is committed to maintaining the highest level of investor confidence in the Company through the application of its corporate policies and procedures. Delphi’s board of directors consists of seven independent directors and one officer of the Company who meet regularly to discuss matters of strategy and execution of the business plan. See Delphi’s Management Information Circular and Annual Information Form for a listing of committees that oversee specific aspects of the Company’s operating and financial strategy.
Disclosure Controls and Procedures and Internal Controls over Financial Reporting
Disclosure controls and procedures, as defined in NI 52-109, are designed to ensure that information required to be disclosed by the Company is accumulated and communicated to the Company’s management, including its President and Chief Executive Officer and Chief Financial Officer, as appropriate, to allow timely decisions regarding required disclosure. The President and Chief Executive Officer and Chief Financial Officer have designed, or caused to be designed under their supervision, internal controls over financial reporting, as defined in NI 52-109, to provide reasonable assurance regarding the reliability of the Company's financial reporting and the preparation of financial statements for external purposes in accordance with generally accepted accounting principles applicable to the Company. The Company’s internal controls over financial reporting is based on the framework issued by the Committee of Sponsoring Organizations of the Treadway Commission (2013 Framework). The Company is required to disclose any change in the Company's internal control over financial reporting that occurred during the period beginning on July 1, 2018 and ending on September 30, 2018 that has materially affected, or is reasonably likely to materially affect, the Company's internal control over financial reporting. No material changes in the Company's internal control over financial reporting were identified during such period that has materially affected, or are reasonably likely to materially affect, the Company's internal control over financial reporting.
It should be noted that a control system, including the Company's disclosure and internal controls and procedures, no matter how well conceived, can provide only reasonable, but not absolute, assurance that the objectives of the control system will be met and it should not be expected that the disclosure and internal controls and procedures will prevent all errors or fraud.
2018 OUTLOOK
Condensate differentials, which historically have had low volatility, expanded along with differentials for Canadian heavy and light crude oils commencing in September. This was due to a number of factors including a longer than expected shutdown of the Strathcona refinery in Edmonton and seasonal refinery turnarounds in the U.S. Midwest resulting in the filling of storage in Edmonton and the apportionment of crude export pipelines, as well as feeder pipelines bringing crude and condensate to Edmonton. Apportionment of feeder pipelines bringing condensate to Edmonton will continue until storage levels are reduced to normal levels which is expected to take a number of months. While we anticipate that Delphi will be able to sell all its condensate production throughout the period of apportionment, the Company will be impacted by the higher condensate differentials, particularly as the apportioned volumes will be sold on the spot market where we expect higher differentials than for monthly sales. Despite the current situation related to logistics, the market for condensate in Western Canada remains very strong with more than half of demand continuing to be met by higher cost condensate being imported by pipelines and rail.
Capital Program Delphi intends to drill four (2.60 net) wells and complete three (1.95 net) wells in the fourth quarter of 2018 spending approximately 85 to 90 percent of the planned expenditures on the new wells, with the remaining capital focused on infrastructure and production optimization projects. Production As per guidance, production in the third quarter was lower than the second quarter, as no new wells were tied-in during the quarter other than two (1.6 net) wells in the last few days of the quarter. Fourth quarter production will increase with the full benefit of these two wells and the partial benefit of three (1.95 net) additional wells to come on production throughout the fourth quarter.
26
Royalties
The Company pays royalties to provincial governments, individuals and companies that own surface and/or mineral rights and companies that have been granted an overriding royalty. These payments take the form of Crown, freehold and overriding royalties. Royalties are not affected by gains or losses realized through the Company’s risk management program.
Delphi pays a gross overriding royalty (“GORR”) of between ten and twelve percent on 20 of its Montney wells drilled between April 2013 and January 2016. Production from these wells accounted for about 23 percent of total corporate production in the third quarter of 2018, compared to about 40 percent at the start of 2017. As production from these wells continues to decrease due to natural declines and new wells are brought on-stream, the proportion of wells and production subject to the GORR will continue to reduce the overall corporate royalty rate.
For 2018, Delphi expects its royalty rate, after the deduction for royalty credits and inclusion of GORRs, to average between six and seven percent of gross revenue, excluding realized and unrealized gains or losses on commodity risk management contracts.
Operating Expenses
In early May, Delphi commenced routing sweetened raw gas from its newly commissioned amine processing facility to the Bigstone sweet natural gas plant for final processing. At full capacity of the amine facility, Delphi can ship up to 17 (11 net) mmcf/d of raw gas to the Bigstone plant, equivalent to 10.1 mmcf/d of net sales gas. An average of 7.8 mmcf/d of net sales gas was processed through the amine facility in the third quarter compared to 4.7 mmcf/d in the second quarter. The reduction of operating costs on that production stream is estimated to be approximately $0.80 per mcf, which is equivalent to about $0.70 per boe of total corporate production.
Delphi expects operating costs in the fourth quarter of 2018 to be between $8.70 and $9.10 per boe.
Transportation Expenses
The contracted rates for pipeline transportation of natural gas and natural gas liquids are fixed and the rate for trucking field condensate is expected to remain unchanged in the fourth quarter of 2018.
With greater utilization of the amine sweeting facility, the proportion of natural gas on the Alliance pipeline decreased to approximately 60 percent in the third quarter compared to 75 percent in the second quarter and ninety percent in the first quarter. With a greater proportion of natural gas sales on the less expensive NGTL system, the natural gas transportation costs are reduced. The average natural gas transportation costs per mcf is expected to remain at the current level until the Alliance lateral from the Bigstone gas plant is reactivated, which is expected in late 2019, at which time the proportion of total gas sales on the Alliance system will return to approximately 90 percent of total natural gas sales volumes.
While realized natural gas prices from sales on the NGTL system are lower, the overall impact on netbacks from the amine facility is positive due to lower operating and transportation costs on this production stream and increased marketing income from additional excess firm Alliance capacity upon which Delphi is generating marketing income.
General and Administrative and Finance Costs
Delphi expects general and administrative expense to remain flat in the fourth quarter of 2018 and into 2019.
Interest costs will increase in the fourth quarter principally due to the issuance of $15 million of additional 10 percent senior secured notes on November 9, 2018.
NON GAAP MEASURES
Management uses certain measures that are not recognized under IFRS to help evaluate the performance of the Company. The following are terms and definitions contained within this MD&A that are not recognized measures under IFRS:
For the purpose of reporting production information, reserves and calculating unit prices and costs, natural gas volumes have been converted to a barrel of oil equivalent (“boe”) using six thousand cubic feet equal to one barrel. A boe conversion ratio of 6:1 is based upon an energy equivalency conversion method primarily applicable at the burner tip and does not represent a value equivalency at the wellhead. This conversion conforms to the Canadian Securities Administrators’ National Instrument 51-101 when boes are disclosed. Boes may be misleading, particularly if used in isolation.
Adjusted bank debt to EBITDA ratio – Adjusted bank debt is defined as amounts outstanding under the senior credit facility, including outstanding letters of credit. EBITDA is calculated based on the terms and definitions set out in the senior credit facility agreement which adjusts net income (loss) for financing costs, certain specific unrealized and non-cash transactions
27
and acquisition and disposition activity. EBITDA is calculated on an annualized basis based on the last two completed quarters. This ratio is used to calculate the Company’s compliance with its adjusted bank debt to EBITDA ratio covenant.
Adjusted debt to EBITDA ratio - The calculation of adjusted debt excludes accounts payable and accrued liabilities, decommissioning obligations and the fair value of financial instruments. The calculation includes outstanding letters of credit, the senior credit facility and senior secured notes. EBITDA is calculated as defined above. This ratio is used to calculate the Company’s compliance with its adjusted debt to EBITDA ratio covenant.
Adjusted funds flow - cash flow from operating activities before decommissioning expenditures and changes in non-cash working capital from operating activities. Management uses adjusted funds flow to analyze performance and considers it a key measure as it demonstrates the Company’s ability to generate the cash necessary to fund future capital investments, abandonment obligations and to repay debt. Delphi’s determination of adjusted funds flow may not be comparable to that reported by other companies nor should it be viewed as an alternative to cash flow from operating activities, net earnings (loss) or other measures of financial performance calculated in accordance with IFRS.
Adjusted funds flow per share – adjusted funds flow divided by the number of common shares outstanding calculated using weighted average shares outstanding consistent with the calculation of earnings (loss) per share.
Adjusted working capital – current assets and current liabilities exclude the current portion of the fair value of the financial instruments. This definition is consistent with the definition used in calculating the Company’s compliance with its working capital ratio covenant and is used by the Company in determining its net debt.
Adjusted working capital ratio – current assets include the undrawn portion of the senior credit facility, less outstanding letters of credit, and exclude the current portion of the fair value of financial instruments. Current liabilities exclude the current portion of long term debt and the current portion of the fair value of financial instruments. This ratio is used to calculate the Company’s compliance with its working capital ratio covenant.
Marketing income - the margin earned on the sale of purchased third party natural gas volumes and premiums received on the assignment of capacity on the Alliance pipeline system to a third party. Management considers marketing income important measures of the Company’s ability to mitigate the cost of excess committed capacity.
Net debt – the sum of bank debt, senior secured notes and the long term portion of unutilized take-or-pay contract plus (minus) the adjusted working capital deficit (surplus). Net debt is used by management to monitor the remaining availability under its credit facilities.
Management considers netbacks as an important measure of the cash generating capability of the produced volumes. Netbacks are generally discussed and presented on a per boe basis.
Operating netbacks – crude oil and natural gas sales plus realized gains (losses) on financial instruments and marketing income less royalties, operating and transportation costs. Management considers operating netbacks per boe an important measure of profitability relative to current commodity prices and costs of production.
Cash netbacks - operating netbacks less interest on bank debt and senior secured notes, general and administrative costs, cash costs related to the Company’s restricted share units and the settlement of the unutilized take-or-pay contract. Management considers cash netbacks per boe an important measure as it demonstrates the cash realized on each unit of production to be reinvested in future capital investment or repay debt.
FORWARD-LOOKING STATEMENTS
This management discussion and analysis contains forward-looking statements and forward-looking information within the meaning of applicable Canadian securities laws. These statements relate to future events or the Company’s future performance and are based upon the Company’s internal assumptions and expectations. All statements other than statements of present or historical fact are forward-looking statements. Forward-looking statements are often, but not always, identified by the use of any of the words “expect”, “anticipate”, “continue”, “estimate”, “may”, “will”, “should”, “believe”, "intends”, “forecast”, “plans”, “guidance”, “budget” and similar expressions.
More particularly and without limitation, this management discussion and analysis contains forward-looking statements and information relating to petroleum and natural gas production estimates and weighting, projected crude oil and natural gas prices, future exchange rates, expectations as to royalty rates, expectations as to transportation and operating costs, expectations as to general and administrative costs and interest expense, expectations as to capital expenditures and net debt, planned capital spending, future liquidity and Delphi’s ability to fund ongoing capital requirements through operating cash flows and its credit facilities, estimated tax pools and expectations regarding current income taxes payable by Delphi in 2018, supply and demand fundamentals for oil and gas commodities, timing and success of development and exploitation
28
activities, cash availability for the financing of capital expenditures, access to third-party infrastructure, treatment under governmental regulatory regimes and tax laws and future environmental regulations.
Furthermore, statements relating to “reserves” are deemed to be forward-looking statements as they involve the implied assessment, based on certain estimates and assumptions that the reserves described can be profitable in the future.
The forward-looking statements and information contained in this management discussion and analysis are based on certain key expectations and assumptions made by Delphi. The following are certain material assumptions on which the forward-looking statements and information contained in this management discussion and analysis are based: the stability of the global and national economic environment, the stability of and commercial acceptability of tax, royalty and regulatory regimes applicable to Delphi, exploitation and development activities being consistent with management’s expectations, production levels of Delphi being consistent with management’s expectations, the absence of significant project delays, the stability of oil and gas prices, the absence of significant fluctuations in foreign exchange rates and interest rates, the stability of costs of oil and gas development and production in Western Canada, including operating costs, the timing and size of development plans and capital expenditures, availability of third party infrastructure for transportation, processing or marketing of oil and natural gas volumes, prices and availability of oilfield services and equipment being consistent with management’s expectations, the availability of, and competition for, among other things, pipeline capacity, skilled personnel and drilling and related services and equipment, results of development and exploitation activities that are consistent with management’s expectations, the availability of capital, weather affecting Delphi’s ability to develop and produce as expected, contracted parties providing goods and services on the agreed timeframes, Delphi’s ability to manage environmental risks and hazards and the cost of complying with environmental regulations, the accuracy of operating cost estimates, the accurate estimation of oil and gas reserves, future exploitation, development and production results and Delphi’s ability to market oil and natural gas successfully to current and new customers. Additionally, estimates as to expected average annual production rates assume that no unexpected outages occur in the infrastructure that the Company relies on to produce its wells, that existing wells continue to meet production expectations and any future wells scheduled to come on in the coming year meet timing and production expectations.
Commodity prices used in the determination of forecast revenues are based upon general economic conditions, commodity supply and demand forecasts and publicly available price forecasts.
Financial outlook information contained in this management discussion and analysis about prospective results of operations, financial position or cash flows is based on assumptions about future events, including economic conditions and proposed courses of action, based on management’s assessment of the relevant information currently available. This financial outlook is included to provide readers with an understanding of the Company’s operations for 2018 and readers are cautioned that such financial outlook information contained in this management discussion and analysis should not be used for purposes other than for which it is disclosed.
Although the Company believes that the expectations reflected in such forward-looking statements and information are reasonable, it can give no assurance that such expectations will prove to be correct and such forward-looking statements should not be unduly relied upon. Since forward-looking statements and information address future events and conditions, by their very nature they involve inherent known and unknown risks and uncertainties. Delphi’s actual results, performance or achievements could differ materially from those expressed in, or implied by, these forward-looking statements and, accordingly, no assurance can be given that any of the events anticipated by the forward-looking statements will transpire or occur, or if any of them do so, what benefits Delphi will derive therefrom. Should one or more of these risks or uncertainties materialize, or should assumptions underlying forward-looking statements prove incorrect, actual results may vary materially from those currently anticipated due to a number of factors and risks. These include, but are not limited to, the risks associated with the oil and gas industry in general such as operational risks in development, exploration and production, delays or changes in plans with respect to exploration or development projects or capital expenditures, the uncertainty of estimates and projections relating to production rates, costs and expenses, commodity price and exchange rate fluctuations, marketing and transportation risks, environmental risks, competition from others for scarce resources, the inability to access sufficient capital from internal and external sources, adverse changes in governmental regulation of the oil and gas industry and adverse changes in tax, royalty and environmental legislation. Additional information on these and other factors that could affect the Company’s operations or financial results are included in the Company’s most recent Annual Information Form and other reports on file with the applicable securities regulatory authorities and may be accessed through the SEDAR website (www.sedar.com).
Readers are cautioned that the foregoing list of factors is not exhaustive. Furthermore, the forward-looking statements contained in this MD&A are made as of the date of this MD&A for the purpose of providing the readers with the Company’s expectations for the coming year. The forward-looking statements and information may not be appropriate for other purposes. Delphi undertakes no obligation to update publicly or revise any forward-looking statements or information, whether as a result of new information, future events or otherwise, unless so required by applicable securities laws. The forward-looking statements contained in this management discussion and analysis are expressly qualified in their entirety by this cautionary statement.
DELPHI ENERGY CORP. Condensed Consolidated Statements of Financial Position September 30, December 31, (thousands of dollars) 2018 2017 (unaudited) Assets Current assets Cash and cash equivalents 3,100 708 Accounts receivable 23,101 47,854 Prepaid expenses and deposits 1,839 780 Fair value of financial instruments (Note 5) - 1,043 28,040 50,385 Fair value of financial instruments (Note 5) 73 896 Exploration and evaluation (Note 6) 11,841 12,755 Property, plant and equipment (Note 7) 378,633 345,486 Total assets 418,587 409,522 Liabilities Current liabilities
Accounts payable and accrued liabilities 40,391 73,325 Fair value of financial instruments (Note 5) 10,006 1,073 Provisions 956 1,051
51,353 75,449 Bank debt (Note 8) 64,774 26,878 Senior secured notes (Note 9) 84,961 83,642 Fair value of financial instruments (Note 5) 1,031 - Provisions 27,492 26,324 Total liabilities 229,611 212,293 Shareholders’ equity Share capital (Note 10) 347,011 347,011 Warrants (Notes 9 and 10) 3,055 3,055 Contributed surplus 21,422 20,627 Deficit (182,512) (173,464) Total shareholders’ equity 188,976 197,229 Total liabilities and shareholders’ equity 418,587 409,522
See accompanying notes to the condensed consolidated interim financial statements. Subsequent event (Notes 8 and 9)
30
DELPHI ENERGY CORP. Condensed Consolidated Statements of Earnings (Loss) and Comprehensive Earnings (Loss) For the three and nine months ended September 30,
Three Months Ended September 30
Nine Months Ended September 30
(thousands of dollars, except per share amounts) 2018 2017 2018 2017 (unaudited) Revenues
Crude oil and natural gas sales (Note 11) 31,399 25,107 100,468 70,940 Marketing revenue 2,203 - 5,363 1,016 Royalties (2,069) (1,935) (5,939) (5,222) 31,533 23,172 99,892 66,734 Realized gain (loss) on financial instruments (Note 5) (3,681) 1,980 (9,434) 1,977 Unrealized gain (loss) on financial instruments (Note 5) 1,132 (785) (11,830) 13,267 28,984 24,367 78,628 81,978 Expenses Operating 6,670 7,013 23,527 20,087 Transportation 3,820 6,282 13,482 13,997 Marketing 905 - 1,740 - Exploration and evaluation - - 47 - General and administrative 1,441 1,612 4,202 5,326 Share-based compensation 198 283 572 699 Loss (gain) on dispositions - 292 (112) (269) Loss on decommissioning - - 96 1,334 Depletion and depreciation (Note 7) 10,868 9,710 33,108 23,874 23,902 25,192 76,662 65,048 Finance costs 3,830 3,185 11,014 8,264 Earnings (loss) before income taxes 1,252 (4,010) (9,048) 8,666 Income taxes Deferred income taxes - - - - Earnings (loss) and comprehensive earnings (loss) 1,252 (4,010) (9,048) 8,666 Net earnings (loss) per share (Note 10) Basic and diluted 0.01 (0.02) (0.05) 0.05
See accompanying notes to the condensed consolidated interim financial statements.
31
DELPHI ENERGY CORP. Condensed Consolidated Statements of Changes in Shareholders’ Equity For the nine months ended September 30,
(thousands of dollars) 2018 2017 (unaudited) Share capital
Common shares Balance, beginning of period 347,011 310,146 Issued for cash - 35,000 Issued on exercise of options - 2,111 Transferred on exercise of options - 772 Share issue costs - (1,202) Balance, end of period 347,011 346,827 Warrants
Balance, beginning and end of period 3,055 3,055 Contributed surplus
Balance, beginning of period 20,627 20,130 Share-based compensation 795 1,081 Transferred on exercise of options - (772) Repurchase of options - (162) Balance, end of period 21,422 20,277 Deficit Balance, beginning of period (173,464) (180,366) Net earnings (loss) (9,048) 8,666 Balance, end of period (182,512) (171,700) Total shareholders’ equity 188,976 198,459
See accompanying notes to the condensed consolidated interim financial statements.
32
DELPHI ENERGY CORP. Condensed Consolidated Statements of Cash Flows For the three and nine months ended September 30,
Three Months Ended September 30
Nine Months Ended September 30
(thousands of dollars) 2018 2017 2018 2017 (unaudited) Cash flow from (used in) operating activities
Net earnings (loss) 1,252 (4,010) (9,048) 8,666 Adjustments for: Depletion and depreciation 10,868 9,710 33,108 23,874 Accretion and finance charges 580 536 1,726 1,488 Share-based compensation 198 283 572 699 Loss (gain) on dispositions - 292 (112) (269) Exploration and evaluation - - 47 - Loss on decommissioning - - 96 1,334 Unrealized loss (gain) on financial instruments (1,132) 785 11,830 (13,267) Settlement of unutilized take-or-pay contract (166) - (494) - Decommissioning expenditures - - (97) (2,306) Change in non-cash working capital (Note 12) (215) 3,489 7,072 1,334 11,385 11,085 44,700 21,553 Cash flow from (used in) financing activities Issue of common shares, net of issue costs (Note 10) - (42) - 33,798 Exercise of options - 27 - 2,111 Repurchase of options - - - (162) Increase (decrease) in bank debt (4,952) 11,918 37,896 (13,069) Issue of senior secured notes, net of issue costs (Note 9) - (35) - 29,066 Change in non-cash working capital (Note 12) - (159) - 48 (4,952) 11,709 37,896 51,792 Cash flow available for investing activities 6,433 22,794 82,596 73,345 Cash flow from (used in) investing activities Additions to exploration and evaluation assets (119) (104) (360) (2,378) Acquisition of exploration and evaluation assets - (850) - (850) Disposition of exploration and evaluation assets 45 - 115 - Additions to property, plant and equipment (19,243) (21,284) (63,647) (71,733) Disposition of petroleum and natural gas properties - (291) - (174) Change in non-cash working capital (Note 12) 15,116 (1,903) (16,312) 5,625 (4,201) (24,432) (80,204) (69,510) Increase in cash and cash equivalents 2,232 (1,638) 2,392 3,835 Cash and cash equivalents, beginning of period 868 7,053 708 1,580 Cash and cash equivalents, end of period 3,100 5,415 3,100 5,415 Cash interest paid 3,575 2,240 9,515 6,357
See accompanying notes to the condensed consolidated interim financial statements.
33
DELPHI ENERGY CORP. Notes to the Condensed Consolidated Interim Financial Statements As at and for the three and nine months ended September 30, 2018 and 2017 (thousands of dollars, except per share amounts) (unaudited)
1) STRUCTURE OF DELPHI
Delphi Energy Corp. (“Delphi” or the “Company”) is a publicly-traded company engaged in the exploration for, development and production of crude oil and natural gas from properties and assets located in Western Canada in which it holds an interest. The Company’s operations are primarily concentrated in the Deep Basin of North West Alberta. The Company’s core area in the Deep Basin is located at Bigstone, producing approximately 98 percent of the Company’s production. The head office of the Company is located at Suite 2300, 333 – 7th Avenue S.W., Calgary, Alberta, T2P 2Z1.
The condensed consolidated interim financial statements as at and for the three and nine months ended September 30, 2018 comprise the accounts of the Company, its wholly-owned subsidiary and a partnership.
2) BASIS OF PRESENTATION
(a) Statement of compliance and authorization
These condensed consolidated interim financial statements are unaudited and prepared in accordance with International Accounting Standard 34, “Interim Financial Reporting” as issued by the International Accounting Standards Board, and do not include all of the information and disclosures normally provided in annual financial statements and should be read in conjunction with the Company’s consolidated financial statements for the year ended December 31, 2017.
Certain prior period amounts have been reclassified to conform with the current presentation.
These condensed consolidated interim financial statements were approved and authorized for issuance by the Board of Directors on November 12, 2018.
(b) Basis of measurement and functional currency
The condensed consolidated interim financial statements have been prepared on a going concern basis, using historical costs, except for derivative financial instruments which are measured at fair value. The financial statements are presented in Canadian dollars, the Company’s functional currency, and are rounded to the nearest thousand (unless stated otherwise).
(c) Use of estimates and judgments
The preparation of the condensed consolidated interim financial statements in conformity with International Financial Reporting Standards (“IFRS”) requires management to make judgments, estimates and assumptions that affect the application of accounting policies and the reported amounts in the condensed consolidated interim financial statements and accompanying notes. By their nature, these estimates are subject to measurement uncertainty and the effect on the financial statements of changes in such estimates in future periods could be material. Actual results may differ from these estimates. Estimates and judgments are continuously evaluated and are based on management’s experience and other factors, including expectations of future events that are believed to be reasonable under the circumstances. Revisions to accounting estimates are recognized in the period in which the estimates are revised and in any future periods affected.
In preparing these condensed consolidated interim financial statements, the critical judgments that management has made in the process of applying Delphi’s accounting policies and that have the most significant effect on the amounts recognized were the same as those applied to the consolidated financial statements as at and for the year ended December 31, 2017.
3) SIGNIFICANT ACCOUNTING POLICIES
The accounting policies applied by the Company in these condensed consolidated interim financial statements are the same as those applied by the Company in its consolidated financial statements as at and for the year ended December 31, 2017 with the exception of the following:
34
(a) Financial instruments
Effective January 1, 2018, the Company adopted IFRS 9, “Financial Instruments” (“IFRS 9”), which replaced IAS 39, Financial Instruments: Recognition and Measurement (“IAS 39”). The Company applied the new standard retrospectively. The adoption of IFRS 9 did not have an impact on the Company’s consolidated financial statements. The nature and effects of the key changes to the Company’s accounting policies resulting from the adoption of IFRS 9 are summarized below.
Classification of financial assets and financial liabilities
IFRS 9 contains three principal classification categories for financial assets: measured at amortized cost, fair value through other comprehensive income (“FVOCI”) and fair value through profit or loss (“FVTPL”). The previous IAS 39 categories of held to maturity, loans and receivables and available for sale are eliminated. IFRS 9 bases the classification of financial assets on the contractual cash flow characteristics and the company’s business model for managing the financial asset. Additionally, embedded derivatives are not separated if the host contract is a financial asset within the scope of IFRS 9. Instead, the entire hybrid contract is assessed for classification and measurement. IFRS 9 largely retains the existing requirements in IAS 39 for the classification of financial liabilities. The differences between the two standards did not impact the Company at the time of transition.
Impairment of financial assets
IFRS 9 replaces the incurred loss model in IAS 39 with an expected credit loss (“ECL”) model. The credit loss model groups receivables based on similar credit risk characteristics and days past due in order to estimate bad debts. The ECL model applies to the Company’s receivables.
Transition
The following table shows the original measurement categories under IAS 39 and the new measurement categories under IFRS 9 as at January 1, 2018 for each class of the Company’s financial assets and financial liabilities. The Company has no contract assets or debt instruments measured at FVOCI. There were no adjustments to the carrying amounts of financial instruments as a result of the change in classification from IAS 39 to IFRS 9.
Measurement Category Financial Instrument IAS 39 IFRS 9 Cash and cash equivalents Loans and receivables Amortized cost Accounts receivable Loans and receivables Amortized cost Financial instruments assets FVTPL FVTPL Accounts payable and accrued liabilities Financial liabilities measured at amortized cost Amortized cost Financial instruments liabilities FVTPL FVTPL Bank debt Financial liabilities measured at amortized cost Amortized cost Senior secured notes Financial liabilities measured at amortized cost Amortized cost
(b) Revenue from contracts with customers
IFRS 15, “Revenue from Contracts with Customers” (“IFRS 15”), provides a single, five-step model to be applied to all contracts with customers and two approaches to recognizing revenue: at a point in time or over time. The standard requires an entity to recognize revenue that reflects the transfer of goods and services for the amount it expects to receive when control is transferred to the customer.
Delphi adopted IFRS 15 with a date of initial application of January 1, 2018. Delphi used the cumulative method to adopt the new standard and has applied transitional relief to contracts completed before January 1, 2018. As a result of the practical expedient, no changes are made to the revenue recognized under the previous revenue standard as Delphi has transferred all of the goods or services identified during the comparative period.
Revenue from the sale of crude oil and natural gas is measured based on the consideration specified in contracts with customers. Delphi recognizes revenue when it transfers control of the product to the buyer. This is generally at the time the customer obtains legal title to the product and when it is physically transferred to the delivery mechanism agreed with the customer, often pipelines. Revenues are collected on the 25th day of the month following delivery.
35
Delphi evaluates its arrangements with third parties and partners to determine if the Company acts as the principal or as an agent. In making this evaluation, management considers if the Company obtains control of the product delivered, which is indicated by Delphi having the primary responsibility for the delivery of the product, having the ability to establish prices or having inventory risk. If Delphi acts in the capacity of an agent rather than as a principal in a transaction, then the revenue is recognized on a net-basis, only reflecting the fee, if any, realized by the Company from the transaction.
Fees charged to other entities for use of facilities owned by the Company are evaluated by management to determine if these originate from contracts with customers or from incidental or collaborative arrangements. Fees charged to other entities that are from contracts with customers are recognized in revenue when the related services are provided.
FUTURE ACCOUNTING POLICIES
In January 2016, the IASB issued IFRS 16, “Leases” (“IFRS 16”), which replaces IAS 17 Leases and IFRIC 4, “Determining Whether an Arrangement Contains a Lease”. IFRS 16 requires the recognition of lease assets and liabilities on the balance sheet for most leases, where the entity is acting as a lessee. For lessees applying IFRS 16, the dual classification model of leases as either operating leases or finance leases no longer exists, effectively treating all leases as finance leases. Certain short-term leases (less than 12 months) and leases of low-value assets can be exempt from the balance sheet recognition requirements, and may continue to be treated as operating leases. IFRS 16 allows lessors to continue with the dual classification model for recognized leases with the resultant accounting remaining essentially unchanged from IAS 17.
The standard will come into effect for annual periods beginning on or after January 1, 2019. IFRS 16 is required to be adopted either retrospectively or using a modified retrospective approach. The modified retrospective approach does not require restatement of prior period financial information as it recognizes the cumulative effect of IFRS 16 as an adjustment to opening retained earnings and applies the standard prospectively. Delphi will elect to apply the optional exemptions for short-term and low-value leases. Delphi is currently assessing its outstanding contracts and does anticipate the adoption of IFRS 16 to increase the Company’s assets and liabilities, increase depreciation, depletion and amortization expense, increase finance costs and reduce operating and general and administrative expenses. Total cash payments over the life of the lease will remain the same. Cash payments associated with operating leases are currently presented within cash flows from operating activities. Under IFRS 16, the cash flows will be allocated between financing activities for the repayment of the principal liability and operating activities for the financing expense portion. The overall impact to cash flow will remain unchanged.
4) DETERMINATION OF FAIR VALUES
A number of the Company’s accounting policies and disclosures require the determination of fair value for both financial and non-financial assets and liabilities. IFRS establishes a fair value hierarchy that prioritizes the inputs to valuation techniques used to measure fair value. The three levels of the fair value hierarchy are described as follows:
Level 1 – Quoted prices are available in active markets for identical assets or liabilities as of the reporting date. Active markets are those in which transactions occur in sufficient frequency and volume to provide pricing information on an ongoing basis.
Level 2 – Valuations are based on inputs, including quoted forward prices for commodities, time value and volatility factors which can be substantially observed or corroborated in the marketplace.
Level 3 – Valuations in this level are those with inputs for the asset or liability that are not based on observable market data.
Fair values have been determined for measurement and/or disclosure purposes based on the following methods:
(a) Cash and cash equivalents, accounts receivable and accounts payable and accrued liabilities:
The fair value of cash and cash equivalents, accounts receivable and accounts payable and accrued liabilities approximate their carrying value due to their short term to maturity.
(b) Bank debt and senior secured notes:
The fair value disclosure of the Company’s senior credit facility approximates its carrying value as it bears interest at floating rates and the applicable margin is indicative of the Company’s current credit premium. In the case of the senior secured notes, the fair value is measured at level 1 of the fair value hierarchy for disclosure purposes. The senior secured notes have a fair value of $90.0 million based on September 20, 2018 trading values, the last day the senior secured notes traded in September 2018.
36
(c) Derivatives:
Delphi’s interest rate, foreign exchange and commodity contracts are measured at level 2 of the fair value hierarchy. The fair value of commodity contracts is determined by discounting the remaining contracted petroleum and natural gas volumes multiplied by the difference between the contracted price and published forward price curves as at the consolidated financial position date.
5) FINANCIAL RISK MANAGEMENT
The Company is exposed to market, credit and liquidity risks from its use of financial instruments. There have not been any changes to the Company’s exposure to each of the above risks and the Company’s policies and processes for measuring and managing these risks since December 31, 2017.
The following table summarizes the carrying value of the Company’s risk management contracts held, by contract type, as at September 30, 2018:
September 30, 2018 December 31, 2017 Natural gas (598) 537 Crude oil (10,329) (71) Foreign exchange (37) 389 Interest rate - 11 Net risk management contract asset (liability) (10,964) 866
For the three and nine months ended September 30, 2018 the risk management contracts resulted in a realized loss of $3.7 million and $9.4 million.
For the three months ended September 30, 2018, Delphi recorded an unrealized gain on its risk management contracts of $1.1 million. The unrealized gain recognized for the three months ended September 30, 2018 is the difference between the fair values of the risk management contracts outstanding as at September 30, 2018 and the fair values as at June 30, 2018. For the nine months ended September 30, 2018, Delphi recorded an unrealized loss on its risk management contracts of $11.8 million. The unrealized loss recognized for the nine months ended September 30, 2018 is the difference between the fair values of the risk management contracts outstanding as at September 30, 2018 and the fair values as at December 31, 2017.
As at September 30, 2018, if the future strip prices for crude oil were $1.00 per barrel higher with all other variables held constant, the unrealized gain on risk management contracts for the three months ended September 30, 2018 would have decreased by $1.5 million and the unrealized loss on risk management contracts for the nine months ended September 30, 2018 would have increased by $1.5 million. As at September 30, 2018, if the future strip prices for natural gas were $0.10 per gigajoule or $0.10 per million British thermal unit higher with all other variables held constant, the unrealized gain on risk management contracts for the three months ended September 30, 2018 would have decreased by $0.8 million and the unrealized loss on risk management contracts for the nine months ended September 30, 2018 would have increased by $0.8 million.
As at September 30, 2018, if the U.S. to Canadian dollar exchange rate would have been $0.01 higher with all other variables held constant, the unrealized gain on risk management contracts for the three months ended September 30, 2018 would have decreased by $0.1 million and the unrealized loss on risk management contracts for the nine months ended September 30, 2018 would have increased by $0.1 million.
37
6) EXPLORATION AND EVALUATION ASSETS
Total Balance as at December 31, 2016 15,748 Additions 3,749 Transfer to oil and gas properties (6,742) Balance as at December 31, 2017 12,755 Additions 490 Dispositions (115) Expense (47) Transfer to oil and gas properties (1,242) Balance as at September 30, 2018 11,841
Exploration and evaluation assets consist of the Company’s exploration projects which are pending the determination of proven and probable reserves.
During the first nine months of 2018, Delphi added $0.5 million of exploration and evaluation expenditures related to the Montney formation at Bigstone and expensed $47.0 thousand of exploration and evaluation assets due to the expiry of a lease in the Company’s Bigstone area. During the first nine months of 2018, a partner exercised its right to participate in a previous acquisitions of undeveloped land for $115.0 thousand. In the nine months ending September 30, 2018, $1.2 million of exploration and evaluation assets were transferred to property, plant and equipment following the addition of proved and probable reserves.
7) PROPERTY, PLANT AND EQUIPMENT
Cost
Crude oil and natural gas properties
Production equipment
Other assets Total
Balance as at December 31, 2016 435,528 43,402 1,076 480,006 Additions 106,911 9,335 277 116,523 Decommissioning obligations 480 2,778 - 3,258 Disposals and derecognition (190) (994) - (1,184) Transfers from exploration and evaluation assets 6,742 - - 6,742 Balance as at December 31, 2017 549,471 54,521 1,353 605,345 Additions 58,215 5,625 31 63,871 Decommissioning obligations 139 1,031 - 1,170 Disposals and derecognition (28) - - (28) Transfers from exploration and evaluation assets 1,242 - - 1,242 Balance as at September 30, 2018 609,039 61,177 1,384 671,600
Accumulated depletion and depreciation Crude oil and natural gas properties
Production equipment
Other assets Total
Balance as at December 31, 2016 (209,427) (14,531) (831) (224,789) Depletion and depreciation (33,666) (2,108) (80) (35,854) Disposals and derecognition 32 752 - 784 Balance as at December 31, 2017 (243,061) (15,887) (911) (259,859) Depletion and depreciation (32,126) (901) (81) (33,108) Balance as at September 30, 2018 (275,187) (16,788) (992) (292,967) Net book value as at December 31, 2017 306,410 38,634 442 345,486
Net book value as at September 30, 2018 335,852 44,389 392 378,633
38
For the three and nine months ended September 30, 2018, Delphi has included $270.9 million (September 30, 2017: $193.9 million) for future development costs and excluded $1.1 million (September 30, 2017: $1.1 million) for estimated salvage to its costs subject to depletion and depreciation.
8) BANK DEBT
September 30, 2018 December 31, 2017 Senior Credit Facility (1) Prime-based loans - 2,000 Bankers’ acceptances, net of discount 64,774 24,878 Balance as at September 30, 2018 64,774 26,878
(1) As at September 30, 2018, Delphi had outstanding letters of credit of $7.4 million.
During the fourth quarter of 2018, Delphi’s lenders completed the semi-annual review of the Company’s senior credit facility and maintained the borrowing base at $105.0 million. The facility is a 364 day committed facility available on a revolving basis until May 28, 2019 at which time it may be extended at the lenders’ option. If the revolving period is not extended, the undrawn portion of the facility will be cancelled and the amount outstanding would be required to be repaid at the end of the non-revolving term being May 29, 2020. The non-extension provisions are applicable to the lenders on an individual basis. The borrowing base of the facilities will be based on the lenders’ evaluation of the Company’s petroleum and natural gas reserves at the time and commodity prices. A decrease in the borrowing base could result in a reduction to the credit facility, which may require a repayment to the lenders.
Interest payable on amounts drawn under the facility is at the prevailing bankers’ acceptance or LIBOR rates plus stamping fees, lenders’ prime rate or U.S. base rate plus the applicable margins, depending on the form of borrowing by the Company. The applicable margins and stamping fees are based on a sliding scale pricing grid tied to the Company’s trailing debt to earnings before interest, taxes, depreciation and amortization ratio: from a minimum of the bank’s prime rate or U.S. base rate plus 0.5 percent to a maximum of the bank’s prime rate or U.S. base rate plus 2.5 percent or from a minimum of bankers’ acceptances or LIBOR rate plus a stamping fee of 1.5 percent to a maximum of bankers’ acceptances rate plus a stamping fee of 3.5 percent.
The senior credit facility is secured by a $200.0 million demand floating charge debenture and a general security agreement over all assets of the Company.
As at September 30, 2018, Delphi had $32.8 million (net of outstanding letters of credit) available to be drawn on the senior credit facility.
The senior credit facility is subject to the following financial covenants: Financial covenant
Requirement
As at September 30, 2018
Adjusted working capital ratio > 1.0 1.5 Adjusted bank debt to EBITDA ratio < 3.0 1.1 Adjusted debt to EBITDA ratio < 4.0 2.4
For the purpose of the financial covenants, the following definitions are applicable:
Adjusted working capital ratio
Current assets include the undrawn portion of the senior credit facility and exclude the current portion of the fair value of financial instruments. Current liabilities exclude the current portion of the senior credit facility and the current portion of the fair value of financial instruments.
39
Adjusted bank debt to EBITDA ratio
Adjusted bank debt is defined as amounts outstanding under the senior credit facility, including outstanding letters of credit and liabilities associated with the unutilized take-or-pay contract.
EBITDA is calculated based on the terms and definitions set out in the senior credit facility agreement which adjusts net earnings (loss) for financing costs, certain specific unrealized and non-cash transactions and acquisition and disposition activity. EBITDA is calculated on an annualized basis based on the last two completed quarters. EBITDA for the purposes of this calculation as at September 30, 2018 was $65.4 million.
Adjusted debt to EBITDA ratio
The calculation of adjusted debt excludes accounts payable and accrued liabilities, decommissioning obligations and the fair value of financial instruments. The calculation includes outstanding letters of credit, bank debt, senior secured notes and liabilities associated with the unutilized take-or-pay contract.
EBITDA is defined as above.
Delphi was in compliance with all covenants as at September 30, 2018.
9) SENIOR SECURED NOTES
Senior secured notes Balance as at December 31, 2017 83,642 Accretion of discount and amortization of issue costs 1,319 Balance as at September 30, 2018 84,961
On June 15, 2016, Delphi issued $60.0 million of 10 percent senior secured notes with attached warrants (see Note 10). The Company issued 60 thousand units with each unit consisting of a $1,000 note and 245 warrants. On June 7, 2017, Delphi issued an additional $30.0 million of senior secured notes through a private placement. The senior secured notes have a face value of $1,000 each and were issued at a discount to par. The senior secured notes mature on July 15, 2021. Interest is payable quarterly to the holders of record on the immediately preceding April 1, July 1, October 1 and January 1. The senior secured notes are redeemable at the Company’s option, in whole or part during the twelve month period beginning on June 15 of the years indicated at the following specified redemption prices (expressed as a percentage of the principal amount): 2018 at 107.50 percent, 2019 at 105.00 percent and 2020 and thereafter at 100.00 percent.
The senior secured notes are secured on a second-priority basis by substantially all of the Company’s assets and are subordinate to indebtedness under the senior credit facility.
The senior secured notes are presented net of debt issue costs and are accreted at an effective interest rate of 12.1 percent such that the carrying amount of the senior secured notes will equal the principal amount at maturity. The senior secured notes that were issued with warrants were initially recognized at fair value based on similar debt securities without the warrant feature, net of debt issue costs and subsequently are carried at amortized cost. The principal amount of the senior secured notes less the initial fair value has been allocated to the warrants. The senior secured notes issued on June 7, 2017 were initially recognized at fair value, net of issue costs and subsequently are carried at amortized cost.
The senior secured notes have no financial covenants but have an incurrence covenant in place that limits the Company’s ability to among other things (subject to certain exceptions, limitations and qualifications): make certain restricted payments and investments; incur additional debt; create liens; restrict dividends or other payments; consolidate, merge, sell, or otherwise dispose of all or substantially all of its assets; and enter into certain transactions with affiliates.
On November 9, 2018, Delphi issued $15.0 million principal amount of ten percent senior secured notes (the “Additional Notes”) through a private placement with Luminus Management, LLC (“Luminus”). Luminus is a US-based institutional investor which owns approximately 21.2 percent of Delphi’s outstanding common shares. The Additional Notes were issued under the same indenture as the existing senior secured notes and collectively are treated as a single class of debt securities with identical terms.
40
10) SHARE CAPITAL
Delphi is authorized to issue an unlimited number of common shares. All shares are issued as fully paid and non-assessable and have no par value. The holders of common shares are entitled to receive dividends as declared by the Company and are also entitled to one vote per share.
(a) Issued and outstanding
September 30, 2018 December 31, 2017
Outstanding shares (000’s)
Amount
Outstanding shares (000’s)
Amount
Balance, beginning of period 185,547 347,011 155,994 310,146 Issued on exercise of stock options - - 1,994 2,245 Transferred on exercise of options - - - 822 Private placement - - 27,559 35,000 Share issue costs - - - (1,202) Balance as at September 30, 2018 185,547 347,011 185,547 347,011
On June 7, 2017, through a private placement, Delphi issued 27.6 million common shares at a price of $1.27 per share for gross proceeds of $35.0 million.
As at September 30, 2018, 9.5 million stock options were outstanding with a weighted exercise price of $1.46 per option.
As at September 30, 2018, no restricted share units were outstanding.
(b) Warrants
As at September 30, 2018, 14.7 million warrants were outstanding. Each warrant entitles the holder to purchase one common share of the Company at an exercise price of $1.40.
(c) Net earnings (loss) per share
Net earnings (loss) per share has been calculated based on the following weighted average common shares:
Three Months Ended September 30
Nine Months Ended September 30
2018 2017 2018 2017 Weighted average common shares - basic 185,547 185,383 185,547 169,026 Dilutive effect of share options and warrants outstanding - - - 976 Weighted average common shares – diluted 185,547 185,383 185,547 170,002
For the three and nine months ended September 30, 2018, a total of 9.5 million stock options and 14.7 million warrants were excluded from the calculation as they were anti-dilutive. For the three and nine months ended September 30, 2017, a total of 9.8 million and 8.8 million stock options, respectively, and 14.7 million warrants were excluded from the calculation as they were anti-dilutive.
11) REVENUE
In the three and nine months ended September 30, 2018, Delphi sold approximately 60 percent and 75 percent, respectively, of its natural gas production in the United States via the Alliance Pipeline system, which is sold in Chicago, Illinois. In 2017, approximately 90 percent of the Company’s natural gas was sold in the United States via the Alliance Pipeline system. Accordingly, Chicago City Gate is the primary benchmark for Delphi’s natural gas sales in the United States. The remainder of Delphi’s natural gas production is sold in Alberta on the NGTL system. The AECO 5A price is the primary benchmark for the Company’s natural gas sales in Alberta. Condensate and natural gas liquids are delivered and sold in Edmonton, Alberta and are generally priced off light oil and natural gas prices.
41
Crude oil and natural gas sales are comprised of the following:
Three Months Ended September 30 Nine Months Ended September 30 2018 2017 2018 2017 Natural gas 8,767 11,403 29,897 31,840 Field condensate 16,092 9,454 51,748 28,452 Natural gas liquids 6,484 4,166 18,505 10,448 Sulphur 56 84 318 200 Total crude oil and natural gas sales 31,399 25,107 100,468 70,940
12) SUPPLEMENTAL CASH FLOW INFORMATION
Changes in non-cash working capital are comprised of the following:
Three Months Ended September 30 Nine Months Ended September 30 2018 2017 2018 2017 Source (use) of cash Accounts receivable (516) 1,714 24,753 8,888 Prepaid expenses and deposits 355 712 (1,059) (413) Accounts payable and accrued liabilities 15,062 (999) (32,934) (1,468) Total change in non-cash working capital 14,901 1,427 (9,240) 7,007 Relating to: Operating activities (215) 3,489 7,072 1,334 Financing activities - (159) - 48 Investing activities 15,116 (1,903) (16,312) 5,625 14,901 1,427 (9,240) 7,007
42
DIRECTORS David J. Reid President and Chief Executive Officer Delphi Energy Corp. Harry S. Campbell, Q.C. (1)(4) Chairman Emeritus Burnet, Duckworth & Palmer LLP Peter T. Harrison (2)
Manager Oil and Gas Investments CN Investment Division Robert A. Lehodey, Q.C. (4) Partner Osler, Hoskin & Harcourt LLP Andrew E. Osis (2)(4) Independent Businessman David J. Sandmeyer (3) Independent Businessman Lamont C. Tolley (3) Independent Businessman Ian G. Wild (2)(3)
Independent Businessman
(1) Chair of the Board (2) Member of the Audit Committee (3) Member of the Reserves Committee (4) Member of the Corporate Governance and Compensation Committee AUDITORS KPMG LLP LEGAL COUNSEL Osler, Hoskin & Harcourt LLP ABBREVIATIONS bbls...........................................................................barrels bbls/d ...........................................................barrels per day mbbls..........................................................thousand barrels mcf .......................................................thousand cubic feet mcf/d .........................................thousand cubic feet per day mmcf ..........................................................million cubic feet
OFFICERS
David J. Reid President and Chief Executive Officer
Mark D. Behrman
Chief Financial Officer
Rod A. Hume Senior Vice President Engineering
Hugo H. Batteke
Vice President Operations
John Behr Vice President Geosciences
Michael K. Galvin
Vice President Land
CORPORATE OFFICE
2300, 333 – 7th Avenue S.W. Calgary, Alberta T2P 2Z1
mmcf/d ...............................million cubic feet per day NGL ..............................................natural gas liquids bcf ....................................................billion cubic feet boe ...................barrels of oil equivalent (6 mcf:1 bbl) boe/d ........................barrels of oil equivalent per day mmboe .......................million barrels of oil equivalent