20
1 Third Quarter 2019 Earnings Conference Call Third Quarter 2019 Earnings Conference Call November 7, 2019

1 Third Quarter 2019 Earnings Conference Call
Third Quarter 2019
Earnings Conference Call
November 7, 2019
2 Third Quarter 2019 Earnings Conference Call
Forward-Looking Statements
Statements made during this presentation that set
forth expectations, predictions, projections or are
about future events are based on facts and situations
that are known to us as of November 7, 2019.
We believe that our expectations and assumptions are
reasonable. Actual results may differ materially, due
to risks and uncertainties, such as those described on
pages 11-20 of our 2018 Form 10-K filed on March 4,
2019 and other subsequent filings by Matson with the
SEC. Statements made during this presentation are
not guarantees of future performance.
We do not undertake any obligation to update our
forward-looking statements.

3 Third Quarter 2019 Earnings Conference Call
Opening Remarks
• Recap of Matson’s 3Q19 results:
– Consolidated performance as expected
– Slightly weaker-than-expected in Ocean Transportation
• Strong demand for our CLX service
• Weakness in Hawaii market
• Softer-than-expected volume in our Alaska service
– Stronger-than-expected quarter for Logistics
• Nearly all of the service lines performed well
• Maintain Consolidated FY 2019 Outlook:
– Slight decrease in Ocean Transportation outlook
– Slight increase in Logistics outlook despite some market headwinds
• Reaffirm $30 million in financial benefits in 2020 compared to 2019

4 Third Quarter 2019 Earnings Conference Call
Current Priorities
Priority Commentary
Complete Hawaii
service fleet renewal
• Lurline on track for delivery later this quarter
• Matsonia on track for delivery in 3Q20
Upgrade Sand Island
terminal
• All three new cranes in service by the end
of 3Q19
• Demolition of four existing cranes has begun
• Remaining infrastructure work in Phase I
progressing well
Prepare for IMO 2020 • Second scrubber installed; vessel back in service
• Third of six vessels in scrubber program is in
dry-dock
De-lever the balance
sheet beginning in 2020
• 3Q19 leverage covenant level below 3.25x
• Cash flow remains strong
Organic growth
opportunities
• Leverage our network into new opportunities
• Niche opportunities in Logistics
• New Span Alaska Anchorage facility open
5 Third Quarter 2019 Earnings Conference Call
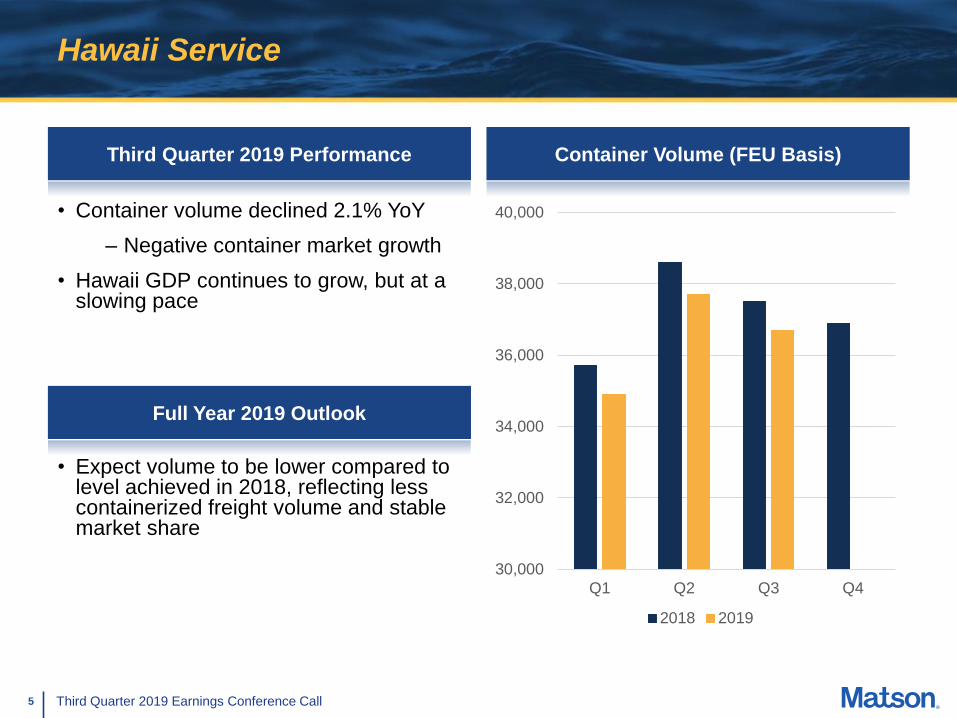
Hawaii Service
Third Quarter 2019 Performance
• Container volume declined 2.1% YoY
– Negative container market growth
• Hawaii GDP continues to grow, but at a slowing pace
Container Volume (FEU Basis)
30,000
32,000
34,000
36,000
38,000
40,000
Q1 Q2 Q3 Q4
2018 2019
Full Year 2019 Outlook
• Expect volume to be lower compared to level achieved in 2018, reflecting less containerized freight volume and stable market share

6 Third Quarter 2019 Earnings Conference Call
Hawaii Economic Indicators
Real GDP Growth Construction Jobs Growth
Select Hawaii Economic Indicators
Hawaii’s economy continues to slow, but conditions remain favorable for continued economic growth.
Source: https://uhero.hawaii.edu/assets/19Q3_SU_Public.pdf
• Modest GDP growth with slowing trend
• Population growth remains muted
• Slight uptick in unemployment from prior level
• Visitor arrivals at record highs, but expenditures expected to decline
• Construction has remained stable at a healthy pace
– Construction jobs expected to remain elevated to support broad mix of projects across the islands
2017 2018 2019P 2020P
Population Growth (0.3)% (0.3)% (0.2)% 0.0%
Unemployment Rate 2.4% 2.5% 2.8% 3.2%
Growth in Visitor Arrivals by Air 5.2% 5.9% 5.1% (1.2)%
Growth in Real Visitor
Expenditures3.0% 3.9% (0.5)% (0.7)%
Market Commentary

7 Third Quarter 2019 Earnings Conference Call
China Expedited Service (CLX)
Third Quarter 2019 Performance
• Container volume decreased 3.4% YoY
– Additional sailing in 3Q18
• Continued to realize a sizeable rate premium
Container Volume (FEU Basis)
Full Year 2019 Outlook
• Expect 2019 volume to approximate 2018 level
– Experienced unusually strong 2H18 due to U.S.-China trade situation
• FY 2019 CLX average rates to approach the levels achieved in 2018
• Expect another strong year for Matson’s highly differentiated service
8,000
10,000
12,000
14,000
16,000
18,000
20,000
Q1 Q2 Q3 Q4
2018 2019

8 Third Quarter 2019 Earnings Conference Call
Guam Service
Third Quarter 2019 Performance
• Container volume decreased 2.1% YoY
• Container market was softer YoY
Container Volume (FEU Basis)
Full Year 2019 Outlook
• Expect volume to approximate the 2018 level
– Highly competitive environment remains
• Matson’s transit advantage expected to remain with significantly better on-time performance 3,000
3,500
4,000
4,500
5,000
5,500
Q1 Q2 Q3 Q4
2018 2019
9 Third Quarter 2019 Earnings Conference Call
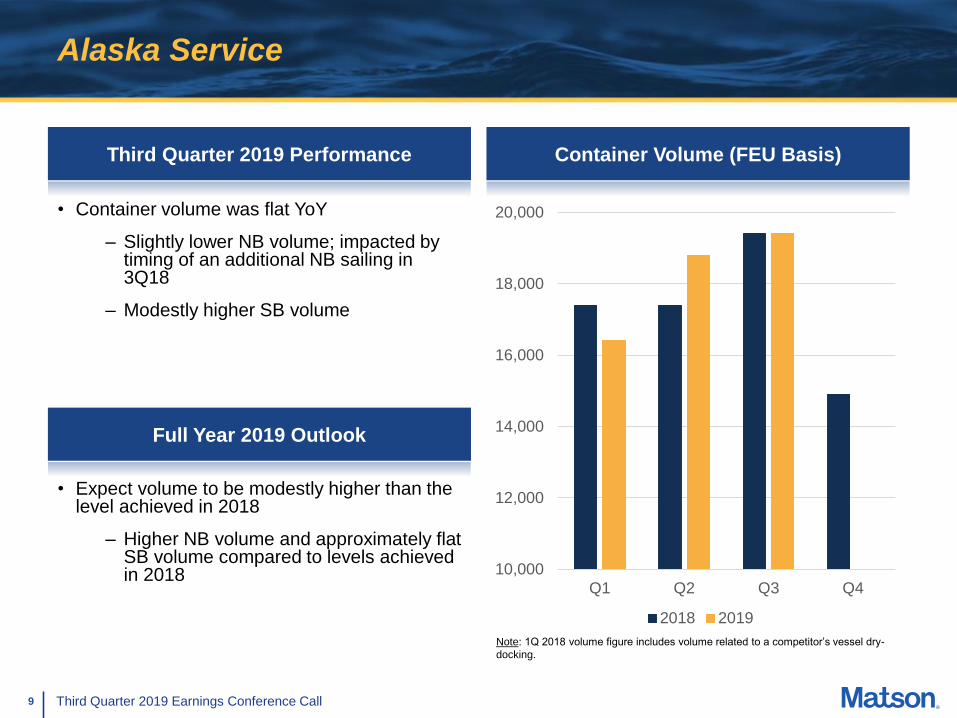
Alaska Service
Third Quarter 2019 Performance
• Container volume was flat YoY
– Slightly lower NB volume; impacted by timing of an additional NB sailing in 3Q18
– Modestly higher SB volume
Container Volume (FEU Basis)
10,000
12,000
14,000
16,000
18,000
20,000
Q1 Q2 Q3 Q4
2018 2019
Full Year 2019 Outlook
• Expect volume to be modestly higher than the level achieved in 2018
– Higher NB volume and approximately flat SB volume compared to levels achieved in 2018
Note: 1Q 2018 volume figure includes volume related to a competitor’s vessel dry-
docking.

10 Third Quarter 2019 Earnings Conference Call
SSAT Joint Venture
Third Quarter 2019 Performance
• Terminal joint venture contribution was $8.4 million, $0.8 million lower than last year
– Higher terminal operating costs
– Timing of the additional expense related to the early adoption of new lease accounting standard in 2Q19
– Higher lift volume YoY
Equity in Income of Joint Venture
$ 0.0
$ 2.0
$ 4.0
$ 6.0
$ 8.0
$ 10.0
$ 12.0
Q1 Q2 Q3 Q4
$ in m
illio
ns
2018 2019
Full Year 2019 Outlook
• Expect terminal joint venture contribution to be lower than the 2018 level
– Higher terminal operating costs
– Higher lift volume expected to be a benefit in 2H19
• SSAT is the premier stevedore on the U.S. West Coast Note: 1Q 2018 equity in income of JV includes favorable one-time items.

11 Third Quarter 2019 Earnings Conference Call
Matson Logistics
Third Quarter 2019 Performance
• Operating income increased $1.4 million YoY
to $11.3 million
– Positive contributions from nearly all
service lines
– YoY increase primarily driven by Span
Alaska
Operating Income
Full Year 2019 Outlook
• Expect FY 2019 operating income to be 15 to 20% higher than 2018 level of $32.7 million
• New Span Alaska Anchorage facility successfully opened in October
$ 0.0
$ 2.0
$ 4.0
$ 6.0
$ 8.0
$ 10.0
$ 12.0
Q1 Q2 Q3 Q4
$ in m
illio
ns
2018 2019

12 Third Quarter 2019 Earnings Conference Call
New Span Alaska Anchorage Facility
• Consolidated two leased facilities into one larger-
owned facility
• Expect significant operating efficiencies
• Capacity for long-term growth and service offering
expansion

13 Third Quarter 2019 Earnings Conference Call
Financial Results – Summary Income Statement
See the Addendum for a reconciliation of GAAP to non-GAAP Financial Metrics.
(1) Includes a non-cash tax expense reversal of $2.9 million resulting from discrete adjustments in applying the provisions of the Tax Cuts and Jobs Act of 2017 (“Tax Act”).
(2) Includes a non-cash tax expense of $3.1 million resulting from discrete adjustments in applying the provisions of the Tax Act.
Year-to-Date Third Quarter
YTD ended 9/30 D Quarters Ended 9/30 D
($ in millions, except per share data) 2019 2018 $ % 2019 2018 $ %
Revenue
Ocean Transportation $ 1,250.5 $ 1,223.2 $ 27.3 2.2% $ 437.2 $ 437.3 ($ 0.1) (0.0)%
Logistics 411.9 434.7 ( 22.8) (5.2)% 134.9 152.1 ( 17.2) (11.3)%
Total Revenue $ 1,662.4 $ 1,657.9 $ 4.5 0.3% $ 572.1 $ 589.4 ($ 17.3) (2.9)%
Operating Income
Ocean Transportation $ 73.0 $ 109.7 ($ 36.7) (33.5)% $ 43.9 $ 48.7 ($ 4.8) (9.9)%
Logistics 30.7 23.6 7.1 30.1% 11.3 9.9 1.4 14.1%
Total Operating Income $ 103.7 $ 133.3 ($ 29.6) (22.2)% $ 55.2 $ 58.6 ($ 3.4) (5.8)%
Interest Expense ( 16.9) ( 14.4) ( 6.2) ( 4.4)
Other income (expense), net 0.9 1.9 ( 0.5) 0.7
Income Taxes ( 20.6) ( 32.4) ( 12.3) ( 13.3)
Net Income $ 67.1 $ 88.4 ($ 21.3) (24.1)% $ 36.2 $ 41.6 ($ 5.4) (13.0)%
GAAP EPS, diluted $ 1.55 $ 2.06 ($ 0.51) (24.8)% $ 0.84 $ 0.97 ($ 0.13) (13.4)%
$ 98.7 $ 97.7 $ 1.0 1.0% $ 34.4 $ 32.2 $ 2.2 6.8%
EBITDA $ 203.3 $ 232.9 ($ 29.6) (12.7)% $ 89.1 $ 91.5 ($ 2.4) (2.6)%
Depreciation and Amortization
(incl. dry-dock amortization)
(1) (2)

14 Third Quarter 2019 Earnings Conference Call
Cash Generation and Uses of Cash
($ 50.0)
$ 0.0
$ 50.0
$ 100.0
$ 150.0
$ 200.0
$ 250.0
$ 300.0
$ 350.0
$ 400.0
$ 450.0
Cash Flow fromOperations
Proceeds fromSale-Leasebacks
NetBorrowings
Maint.Capex
New VesselCapex (1)
Dividends Other CashFlows
Net increase incash
$ in m
illio
ns
Last Twelve Months Ended September 30, 2019
$ 282.4
$ 106.0 ($ 25.1)
($ 80.6)
($ 224.7)
($ 36.8)
$ 20.2($ 1.0)
(1) Includes capitalized interest and owner’s items.

15 Third Quarter 2019 Earnings Conference Call
Financial Results – Summary Balance Sheet
• Total debt of $883.0 million
• Net debt of $859.4 million
• Net debt-to-LTM EBITDA of 3.2x
• We are continuing to look at
capital structure optimization
alternatives, including Title XI
financing
See the Addendum for a reconciliation of GAAP to non-GAAP Financial Metrics.
Debt Levels($ in millions)
ASSETS
Cash and cash equivalents $ 23.6 $ 19.6
Other current assets 275.9 298.8
Total current assets 299.5 318.4
Investment in Terminal Joint Venture 83.7 87.0
Property and equipment, net 1,485.5 1,366.6
Intangible assets, net 205.7 214.0
Goodwill 327.8 327.8
Other long-term assets 351.6 116.6
Total assets $ 2,753.8 $ 2,430.4
LIABILITIES AND SHAREHOLDERS’ EQUITY
Current portion of debt $ 48.4 $ 42.1
Other current liabilities 389.3 328.7
Total current liabilities 437.7 370.8
Long-term debt 834.6 814.3
Other long-term liabilities 683.8 490.0
Total long-term liabilities 1,518.4 1,304.3
Total shareholders’ equity 797.7 755.3
Total liabilities and shareholders’ equity $ 2,753.8 $ 2,430.4
September 30, December 31,
2019 2018

16 Third Quarter 2019 Earnings Conference Call
Percent of
Completion(1)
Current Delivery
Timing
Lurline 99% 4Q ’19
Matsonia 41% 3Q ’20
New Vessel Payments and Percent of Completion
Actual and Estimated Vessel Progress Payments(2)
FY 2019
($ in millions) 1Q 2Q 3Q
Cash Capital Expenditures $ 16.2 $ 6.4 $ 74.6
Capitalized Interest 4.7 3.3 3.5
Capitalized Vessel Construction Expenditures $ 20.9 $ 9.7 $ 78.1
($ in millions)
Cumulative
through
09/30/19
Remaining
3-months
2019(3) FY 2020 Total
Two Aloha Class Containerships(4) $ 400.3 $ 4.3 $ 4.0 $ 408.6
Two Kanaloa Class Con-Ro Vessels 360.4 98.5 58.5 517.4
Total New Vessel Progress Payments $ 760.7 $ 102.8 $ 62.5 $ 926.0
Matsonia, October 2019.
Updated Vessel Timing and Percent of Completion
Vessel Construction Expenditures
(1) As of November 1, 2019.
(2) Excludes owner’s items, capitalized interest and other cost items associated with final milestone payments.
(3) As of November 7, 2019, Matson has paid approximately $72.7 million in milestone payments.
(4) Remaining progress payments on Aloha Class vessels held in restricted cash on balance sheet.

17 Third Quarter 2019 Earnings Conference Call
2019 Outlook
FY 2019 Outlook Items
Operating Income:
Ocean Transportation Approximately 25% lower than the $131.1 million achieved in FY 2018
after adjusting 2018 result for full year impact of vessel sale-leaseback
Logistics 15 to 20% higher than FY 2018
level of $32.7 million
Depreciation and
Amortization
Approximately $135 million, including $35 million in dry-dock
amortization
EBITDA To approximate $270 million
Other Income/(Expense) Approximately $1 million
Interest Expense(excluding capitalized interest)
Approximately $25 million
GAAP Effective Tax Rate Approximately 26%, excluding positive non-cash tax adjustment of $2.9
million in 1Q 2019

18 Third Quarter 2019 Earnings Conference Call
Appendix

19 Third Quarter 2019 Earnings Conference Call
A Look at 2020
NOTE: Numbers used in this slide include previously disclosed: (i) approximately $30 million of total benefits from the 4 new vessels, the magnitude and timing of benefits subject
to change based on fleet configuration and in-service timing; (ii) the expected financial pay-back benefits from the exhaust gas scrubber installations; and (iii) benefits from the
new crane installations and modifications to existing cranes and other infrastructure investments at the Sand Island terminal. Actual operating cost reductions and additional
revenue achieved may vary compared to those used in our projection of benefits. These benefits exclude the net effects of any changes in business activity in the tradelanes and
should not be construed to mean that the Company’s Outlook for 2020 will be $30 million higher than 2019. The Company is making no statement regarding overall 2020
Outlook at this time.
We expect approximately $30 million in financial benefits in
2020 from new vessels and other infrastructure investments
and $40 million annually thereafter.
• 2019 is a transition year with several significant investment programs nearing finalization
• Reaffirm the previously mentioned financial benefits of the new vessels
– Some portion of these benefits already being captured in fiscal 2019 with Daniel K. Inouye and Kaimana Hila in service, the impact of which is included in our full year 2019 Outlook
• In 2020, we expect approximately $30 million in incremental financial benefits compared to 2019 comprised of:
– Vessel benefits of a 9 ship deployment for a full year, reduced operating and maintenance expenses, utilization of the newly installed exhaust gas scrubbers, autos/rolling stock garage capacity utilization, and larger capacity vessel in the CLX; and
– Crane and other infrastructure investments at Sand Island
• In 2021 and thereafter, we expect approximately $40 million in annual benefits compared to 2019, due to full year run-rates from all investments

20 Third Quarter 2019 Earnings Conference Call
Appendix – Non-GAAP Measures
Matson reports financial results in accordance with U.S. generally accepted accounting principles (“GAAP”). The Company also considers other
non-GAAP measures to evaluate performance, make day-to-day operating decisions, help investors understand our ability to incur and service
debt and to make capital expenditures, and to understand period-over-period operating results separate and apart from items that may, or could,
have a disproportional positive or negative impact on results in any particular period. These non-GAAP measures include, but are not limited to,
Earnings Before Interest, Income Taxes, Depreciation and Amortization (“EBITDA”), and Net Debt/EBITDA.


