37
Third Quarter 2019 Earnings (Unaudited Results) October 29, 2019
Third Quarter 2019 Earnings(Unaudited Results)October 29, 2019
©2019 Mattel, Inc. All Rights Reserved. 2
This presentation contains a number of forward-looking statements within the meaning of the Private Securities Litigation Reform Act of 1995. Forward-looking statements can be identified by the fact that they do
not relate strictly to historical or current facts. The use of words such as “anticipates,” “expects,” “intends,” “plans,” “confident that” and “believes,” among others, generally identify forward-looking statements.
These forward-looking statements are based on currently available operating, financial, economic and other information, and are subject to a number of significant risks and uncertainties. A variety of factors, many
of which are beyond our control, could cause actual future results to differ materially from those projected in the forward-looking statements. Specific factors that might cause such a difference include, but are not
limited to: (i) Mattel’s ability to design, develop, produce, manufacture, source and ship products on a timely and cost-effective basis, as well as interest in and purchase of those products by retail customers and
consumers in quantities and at prices that will be sufficient to profitably recover Mattel’s costs; (ii) downturns in economic conditions affecting Mattel’s markets which can negatively impact retail customers and
consumers, and which can result in lower employment levels, lower consumer disposable income and spending, including lower spending on purchases of Mattel’s products; (iii) other factors which can lower
discretionary consumer spending, such as higher costs for fuel and food, drops in the value of homes or other consumer assets, and high levels of consumer debt; (iv) potential difficulties or delays Mattel may
experience in implementing cost savings and efficiency enhancing initiatives; (v) other economic and public health conditions or regulatory changes in the markets in which Mattel and its customers and suppliers
operate, which could create delays or increase Mattel’s costs, such as higher commodity prices, labor costs or transportation costs, or outbreaks of disease; (vi) currency fluctuations, including movements in
foreign exchange rates, which can lower Mattel’s net revenues and earnings, and significantly impact Mattel’s costs; (vii) the concentration of Mattel’s customers, potentially increasing the negative impact to
Mattel of difficulties experienced by any of Mattel’s customers, including the bankruptcy and liquidation of Toys “R” Us, Inc., or changes in their purchasing or selling patterns; (viii) the future willingness of licensors
of entertainment properties for which Mattel currently has licenses or would seek to have licenses in the future to license those products to Mattel; (ix) the inventory policies of Mattel’s retail customers, including
retailers’ potential decisions to lower their inventories, even if it results in lost sales, as well as the concentration of Mattel’s revenues in the second half of the year, which coupled with reliance by retailers on quick
response inventory management techniques increases the risk of underproduction of popular items, overproduction of less popular items and failure to achieve compressed shipping schedules; (x) the increased
costs of developing more sophisticated digital and smart technology products, and the corresponding supply chain and design challenges associated with such products; (xi) work disruptions, which may impact
Mattel’s ability to manufacture or deliver product in a timely and cost-effective manner; (xii) the bankruptcy and liquidation of Toys “R” Us, Inc. or other of Mattel’s significant retailers, or the general lack of success
of one of Mattel’s significant retailers which could negatively impact Mattel’s revenues or bad debt exposure; (xiii) the impact of competition on revenues, margins and other aspects of Mattel’s business, including
the ability to offer products which consumers choose to buy instead of competitive products, the ability to secure, maintain and renew popular licenses and the ability to attract and retain talented employees; (xiv)
the risk of product recalls or product liability suits and costs associated with product safety regulations; (xv) changes in laws or regulations in the United States and/or in other major markets, such as China, in
which Mattel operates, including, without limitation, with respect to taxes, tariffs, trade policies, or product safety, which may increase Mattel’s product costs and other costs of doing business, and reduce Mattel’s
earnings, (xvi) failure to realize the planned benefits from any investments or acquisitions made by Mattel, (xvii) the impact of other market conditions, third party actions or approvals and competition which could
reduce demand for Mattel’s products or delay or increase the cost of implementation of Mattel’s programs or alter Mattel’s actions and reduce actual results; (xviii) changes in financing markets or the inability of
Mattel to obtain financing on attractive terms (xix) the impact of litigation or arbitration decisions or settlement actions; (xx) uncertainty from the expected discontinuance of LIBOR and transition to any other
interest rate benchmark; and (xxi) other risks and uncertainties as may be described in Mattel’s periodic filings with the Securities and Exchange Commission, including the “Risk Factors” section of Mattel’s
Annual Report on Form 10-K for the fiscal year ended December 31, 2018, Quarterly Reports on Form 10-Q for 2019, as well as in Mattel’s other public statements. Mattel does not update forward-looking
statements and expressly disclaims any obligation to do so, except as required by law.
To supplement the financial results presented in accordance with generally accepted accounting principles in the United States (“GAAP”), Mattel presents certain non-GAAP financial measures within the meaning
of Regulation G promulgated by the Securities and Exchange Commission. The non-GAAP financial measures used herein include: Gross Sales, Adjusted Gross Profit and Adjusted Gross Margin, Adjusted Other
Selling and Administrative Expenses, Adjusted Operating Income (Loss), Adjusted Earnings (Loss) Per Share, EBITDA, adjusted EBITDA, and constant currency. Mattel uses these metrics to analyze its
continuing operations and to monitor, assess and identify meaningful trends in its operating and financial performance, and each is discussed in detail on the following page. These measures are not, and should
not be viewed as, substitutes for GAAP financial measures. A glossary of non-GAAP financial measures is located in the Appendix and reconciliations of non-GAAP financial measures to the most directly
comparable GAAP financial measures can be found in the attached Appendix and in our earnings release, which is available in the “Investors” section of our corporate website, http://corporate.mattel.com/, under
the subheading “Financial Information – Earnings Releases.”
Forward-Looking Statements / Regulation G
©2019 Mattel, Inc. All Rights Reserved. 3
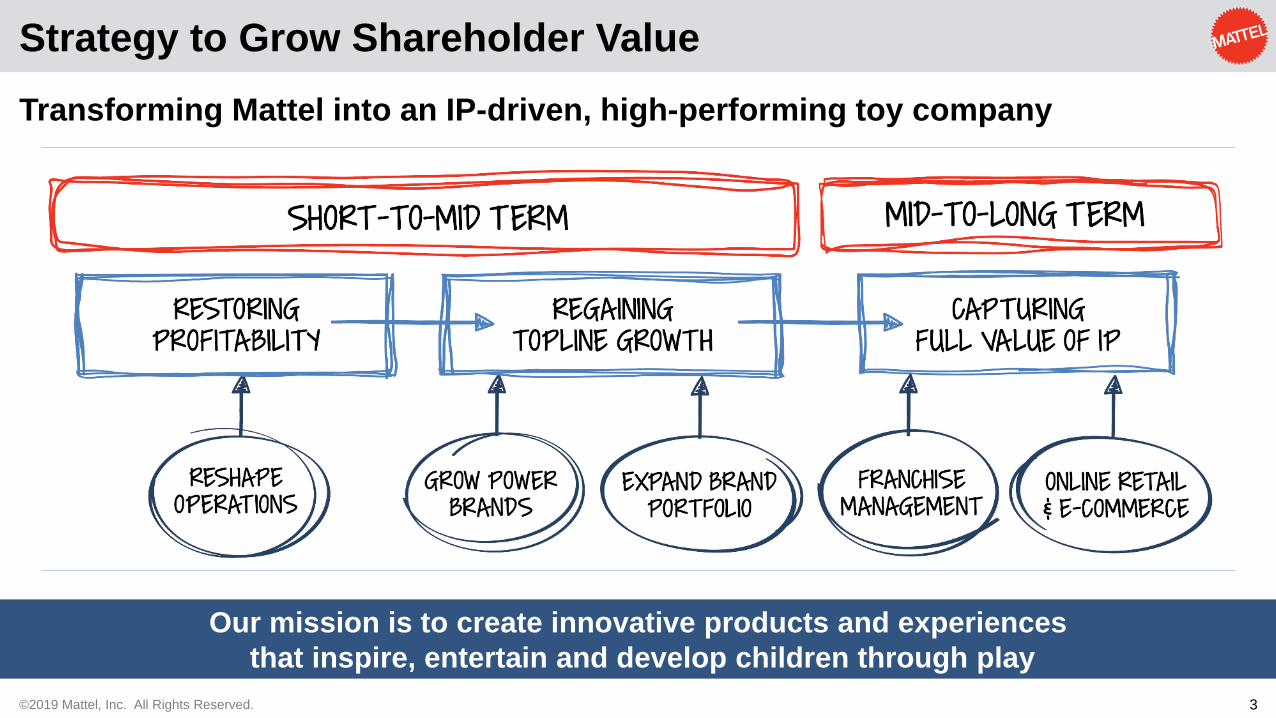
Strategy to Grow Shareholder Value
Transforming Mattel into an IP-driven, high-performing toy company
Our mission is to create innovative products and experiences
that inspire, entertain and develop children through play
©2019 Mattel, Inc. All Rights Reserved. 4
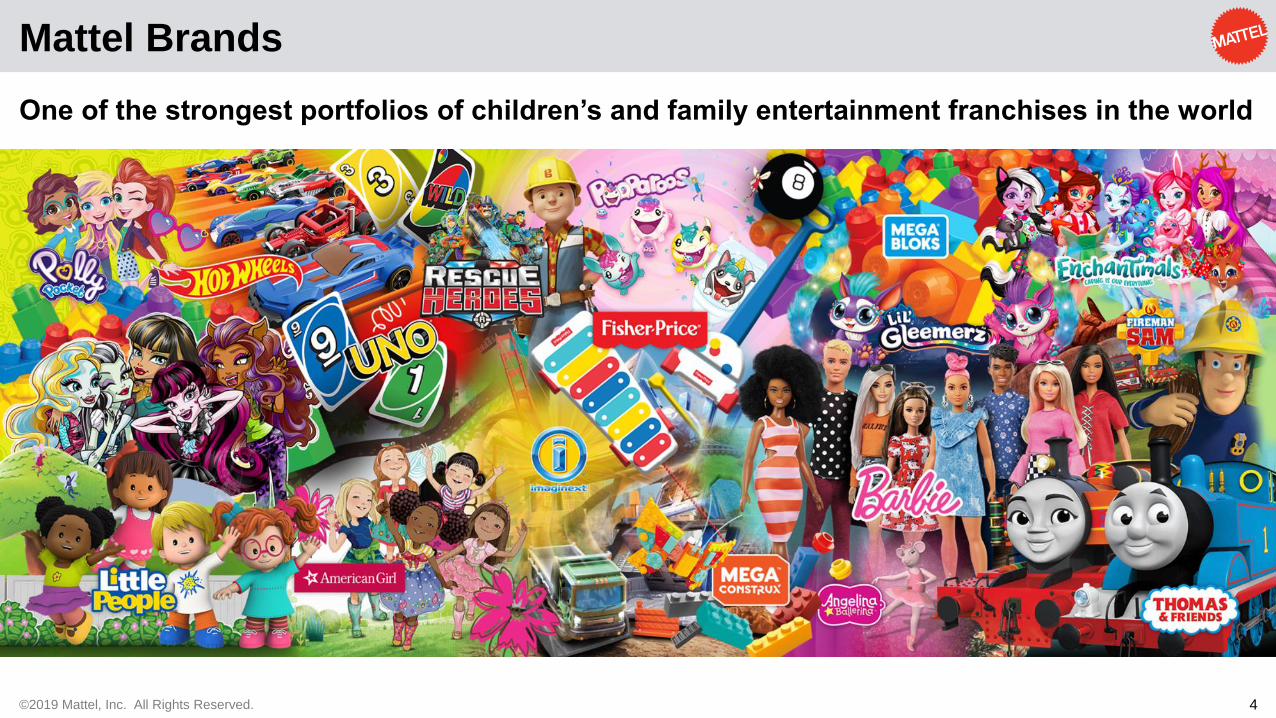
Mattel Brands
One of the strongest portfolios of children’s and family entertainment franchises in the world

©2019 Mattel, Inc. All Rights Reserved. 5
Third consecutive quarter of revenue growth in constant currency
Q3 2019 Key Takeaways
• Third quarter Net Sales of $1,481.6 million, up 3% as reported, and up 4% in constant currency,
vs. prior year
• Gross Sales of $1,656.9 million, up 3% as reported and up 4% in constant currency
• Dolls category Gross Sales up 5% as reported, and up 7% in constant currency; Barbie® Gross
Sales up 10% as reported, and up 12% in constant currency
• Infant, Toddler and Preschool category Gross Sales down 11% as reported, and down 10% in
constant currency; Fisher-Price® and Thomas & Friends® Gross Sales down 3% as reported, and
down 2% in constant currency
• Vehicles category Gross Sales up 13% as reported, and up 15% in constant currency; Hot Wheels®
Gross Sales up 25% as reported, and up 27% in constant currency
• Action Figures, Building Sets and Games categories combined Gross Sales up 12% as reported,
and up 13% in constant currency
Continued progress towards transforming Mattel into an IP-driven, high-performing toy company
For Gross Sales and constant currency, please see Glossary of Non-GAAP Financial Measures and non-GAAP reconciliations. Beginning in Q1 2019, our reporting includes breakout by categories including: Dolls, Vehicles, Infant, Toddler and Preschool and Action Figures, Building Sets and Games. See Appendix for additional information.

©2019 Mattel, Inc. All Rights Reserved. 6
Q3 2019 Key Takeaways - Continued
• Structural Simplification run-rate savings of $826 million, exceeding target of $650 million
exiting 2019; expect to exceed $854 million of run-rate savings by the end of 2019
• Reported Gross Margin of 46.3%, an improvement of 370 basis points; Adjusted Gross Margin
of 46.9%, an improvement of 390 basis points
• Reported Operating Income of $150.1 million, an improvement of $28.2 million or 23%;
Adjusted Operating Income of $173.7 million, an improvement of $20.7 million or 14%
• Reported Earnings Per Share of $0.20, an improvement of $0.18; Adjusted Earnings Per Share
of $0.26, an improvement of $0.08
• For the nine months ended September 30, Cash Flows Used for Operating Activities improved
$218 million
Continued progress towards transforming Mattel into an IP-driven, high-performing toy company
For Adjusted Gross Margin, Adjusted Operating Income, Adjusted Earnings Per Share, EBITDA and constant currency, please see Glossary of Non-GAAP Financial Measures and non-GAAP reconciliations. Beginning in Q1 2019, our reporting includes breakout by categories including: Dolls, Vehicles, Infant, Toddler and Preschool and Action Figures, Building Sets and Games. See Appendix for additional information.
Financial information reflects the impact of immaterial revisions to the financial statements.
Fifth consecutive quarter of improving profitability

©2019 Mattel, Inc. All Rights Reserved. 7
56%
25%
13%
6%
ByRegion(2)
North America w/ American
Girl
EMEA
LatinAmerica
Asia Pacific
34%
26%
21%
19%
ByCategories(1)
Dolls
Vehicles
Infant, Toddler
and Preschool
Action Figures, Building Sets and Games
Q3 2019 Worldwide Gross Sales Mix
Highly-diversified sales mix across categories and regions
1) Mattel modified its reporting structure for revenues in the first quarter of 2019 to disclose revenues by categories
2) Mattel reorganized its regional sales reporting structure in the first quarter of 2019. As a result, the new International regions are Europe, the Middle East, and Africa ("EMEA"), Latin America, and Asia Pacific. The Middle East, Africa, Russia, and Turkey were previously included in the Asia Pacific region (previously Global Emerging Markets) and are now included in EMEA (previously Europe). Prior period amounts have been reclassified to conform to the current period presentation.
For Gross Sales, refer to the Appendix for a Glossary of Non-GAAP Financial Measures and non-GAAP reconciliations.
Amounts may not foot due to rounding.

©2019 Mattel, Inc. All Rights Reserved. 8
54%
25%
13%
8%
ByRegion(2)
North America w/ American
Girl
EMEA
LatinAmerica
Asia Pacific
32%
26%
22%
20%
ByCategories(1)
Dolls
Vehicles
Infant, Toddler
and Preschool
Action Figures, Building Sets and Games
YTD 2019 Worldwide Gross Sales Mix
Highly-diversified sales mix across categories and regions
1) Mattel modified its reporting structure for revenues in the first quarter of 2019 to disclose revenues by categories
2) Mattel reorganized its regional sales reporting structure in the first quarter of 2019. As a result, the new International regions are Europe, the Middle East, and Africa ("EMEA"), Latin America, and Asia Pacific. The Middle East, Africa, Russia, and Turkey were previously included in the Asia Pacific region (previously Global Emerging Markets) and are now included in EMEA (previously Europe). Prior period amounts have been reclassified to conform to the current period presentation.
For Gross Sales, refer to the Appendix for a Glossary of Non-GAAP Financial Measures and non-GAAP reconciliations.
Amounts may not foot due to rounding.
©2019 Mattel, Inc. All Rights Reserved. 9
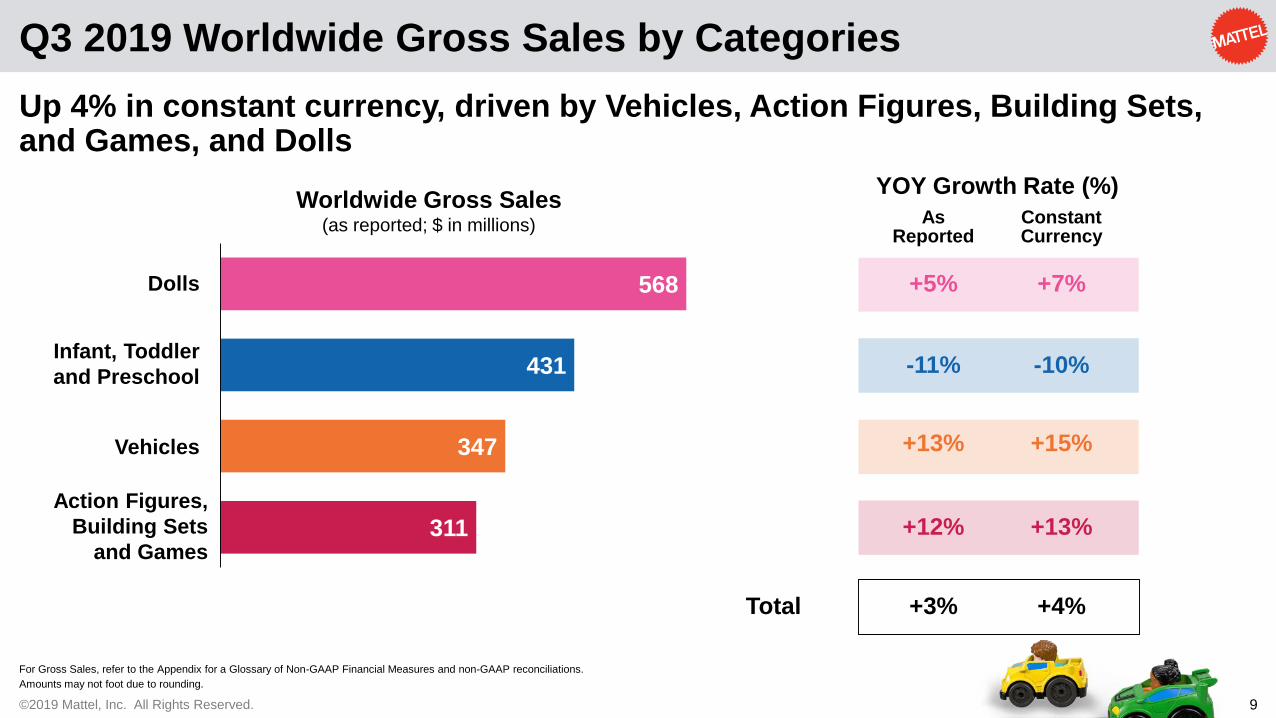
568
431
347
311
Worldwide Gross Sales(as reported; $ in millions)
Dolls
Vehicles
Infant, Toddler
and Preschool
Action Figures,
Building Sets
and Games
Q3 2019 Worldwide Gross Sales by Categories
Up 4% in constant currency, driven by Vehicles, Action Figures, Building Sets, and Games, and Dolls
Total
YOY Growth Rate (%)
As Reported
+5% +7%
-11% -10%
+13% +15%
+12% +13%
Constant Currency
+3% +4%
For Gross Sales, refer to the Appendix for a Glossary of Non-GAAP Financial Measures and non-GAAP reconciliations.
Amounts may not foot due to rounding.

©2019 Mattel, Inc. All Rights Reserved. 10
1,094
877
744
684
Worldwide Gross Sales(as reported; $ in millions)
Dolls
Vehicles
Infant, Toddler
and Preschool
Action Figures,
Building Sets
and Games
YTD 2019 Worldwide Gross Sales by Categories
Up 4% in constant currency, driven by Action Figures, Building Sets and Games, Vehicles, and Dolls
Total
YOY Growth Rate (%)
As Reported
+3% +6%
-12% -10%
+5% +8%
+16% +18%
Constant Currency
+1% +4%
For Gross Sales, refer to the Appendix for a Glossary of Non-GAAP Financial Measures and non-GAAP reconciliations.
Amounts may not foot due to rounding.
©2019 Mattel, Inc. All Rights Reserved. 11
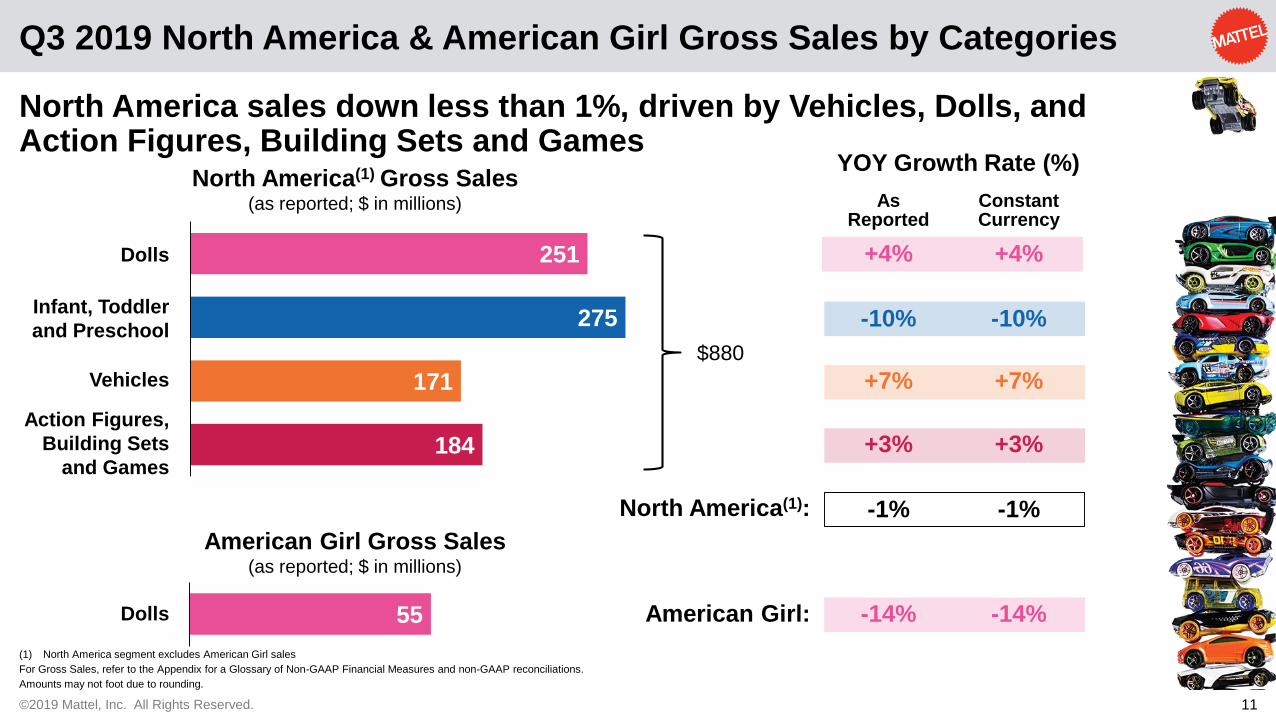
Q3 2019 North America & American Girl Gross Sales by Categories
North America sales down less than 1%, driven by Vehicles, Dolls, and Action Figures, Building Sets and Games
YOY Growth Rate (%)North America(1) Gross Sales
(as reported; $ in millions)
North America(1):
+4%
-10%
+7%
+3%
As Reported
-1%
-14%
+4%
-10%
+7%
+3%
Constant Currency
-1%
-14%American Girl:
251
275
171
184
Dolls
Vehicles
Infant, Toddler
and Preschool
Action Figures,
Building Sets
and Games
$880
American Girl Gross Sales (as reported; $ in millions)
55Dolls
(1) North America segment excludes American Girl sales
For Gross Sales, refer to the Appendix for a Glossary of Non-GAAP Financial Measures and non-GAAP reconciliations.
Amounts may not foot due to rounding.
©2019 Mattel, Inc. All Rights Reserved. 12
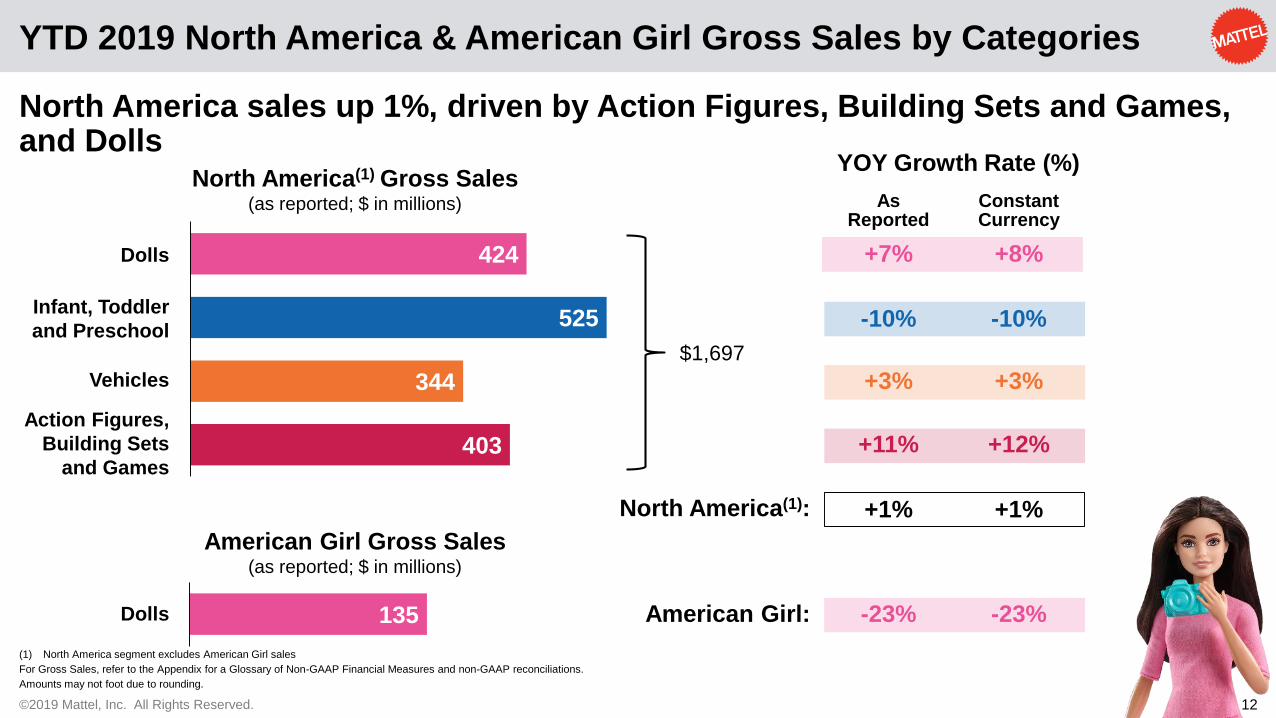
YTD 2019 North America & American Girl Gross Sales by Categories
North America sales up 1%, driven by Action Figures, Building Sets and Games, and Dolls
(1) North America segment excludes American Girl sales
For Gross Sales, refer to the Appendix for a Glossary of Non-GAAP Financial Measures and non-GAAP reconciliations.
Amounts may not foot due to rounding.
North America(1) Gross Sales(as reported; $ in millions)
424
525
344
403
Dolls
Vehicles
Infant, Toddler
and Preschool
Action Figures,
Building Sets
and Games
$1,697
American Girl Gross Sales (as reported; $ in millions)
135Dolls
North America(1):
+7%
-10%
+3%
+11%
As Reported
+1%
-23%
+8%
-10%
+3%
+12%
Constant Currency
+1%
-23%American Girl:
YOY Growth Rate (%)

©2019 Mattel, Inc. All Rights Reserved. 13
Q3 2019 International Gross Sales by Categories
Up 13% in constant currency, driven by Dolls, Vehicles and Action Figures, Building Sets and Games
For Gross Sales, refer to the Appendix for a Glossary of Non-GAAP Financial Measures and non-GAAP reconciliations.
Amounts may not foot due to rounding.
262
156
176
127
International Gross Sales(as reported; $ in millions)
Dolls
Vehicles
Infant, Toddler
and Preschool
Action Figures,
Building Sets
and Games
Total
YOY Growth Rate (%)
As Reported
+12% +16%
-12% -9%
+20% +23%
+28% +32%
Constant Currency
+10% +13%
©2019 Mattel, Inc. All Rights Reserved. 14
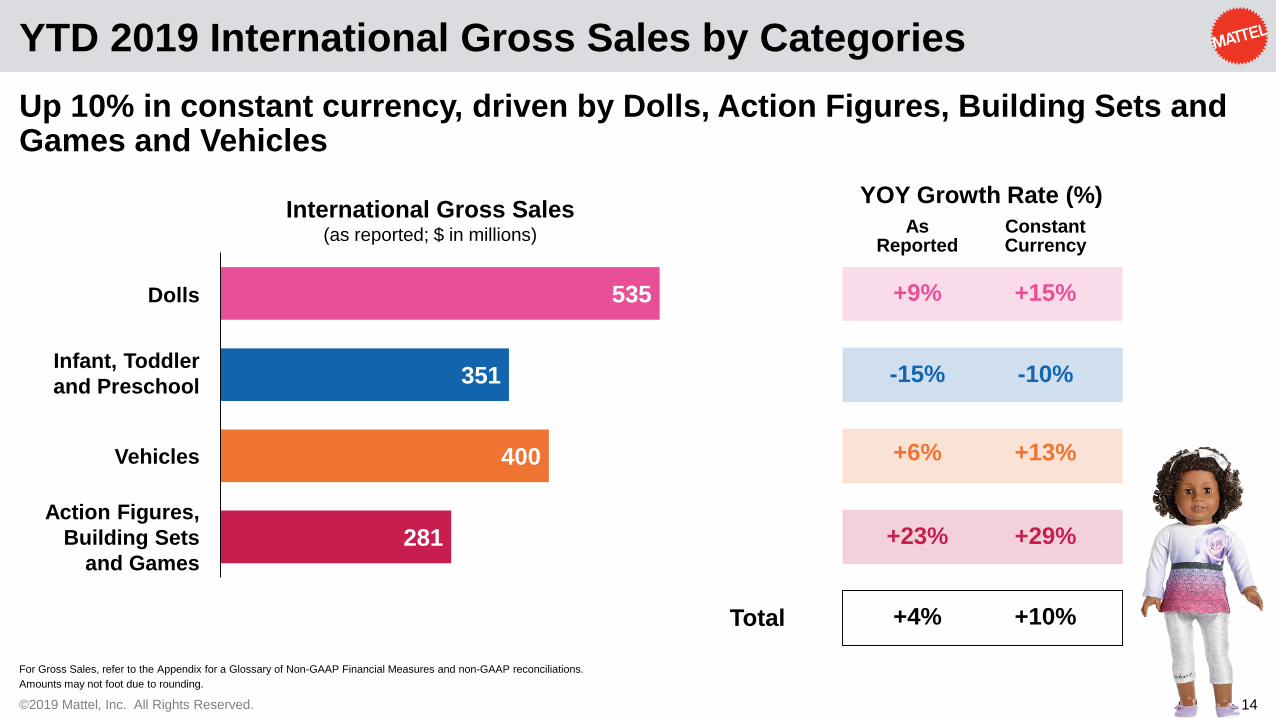
YTD 2019 International Gross Sales by Categories
Up 10% in constant currency, driven by Dolls, Action Figures, Building Sets and Games and Vehicles
For Gross Sales, refer to the Appendix for a Glossary of Non-GAAP Financial Measures and non-GAAP reconciliations.
Amounts may not foot due to rounding.
535
351
400
281
International Gross Sales(as reported; $ in millions)
Dolls
Vehicles
Infant, Toddler
and Preschool
Action Figures,
Building Sets
and Games
Total
YOY Growth Rate (%)
As Reported
+9% +15%
-15% -10%
+6% +13%
+23% +29%
Constant Currency
+4% +10%
©2019 Mattel, Inc. All Rights Reserved. 15
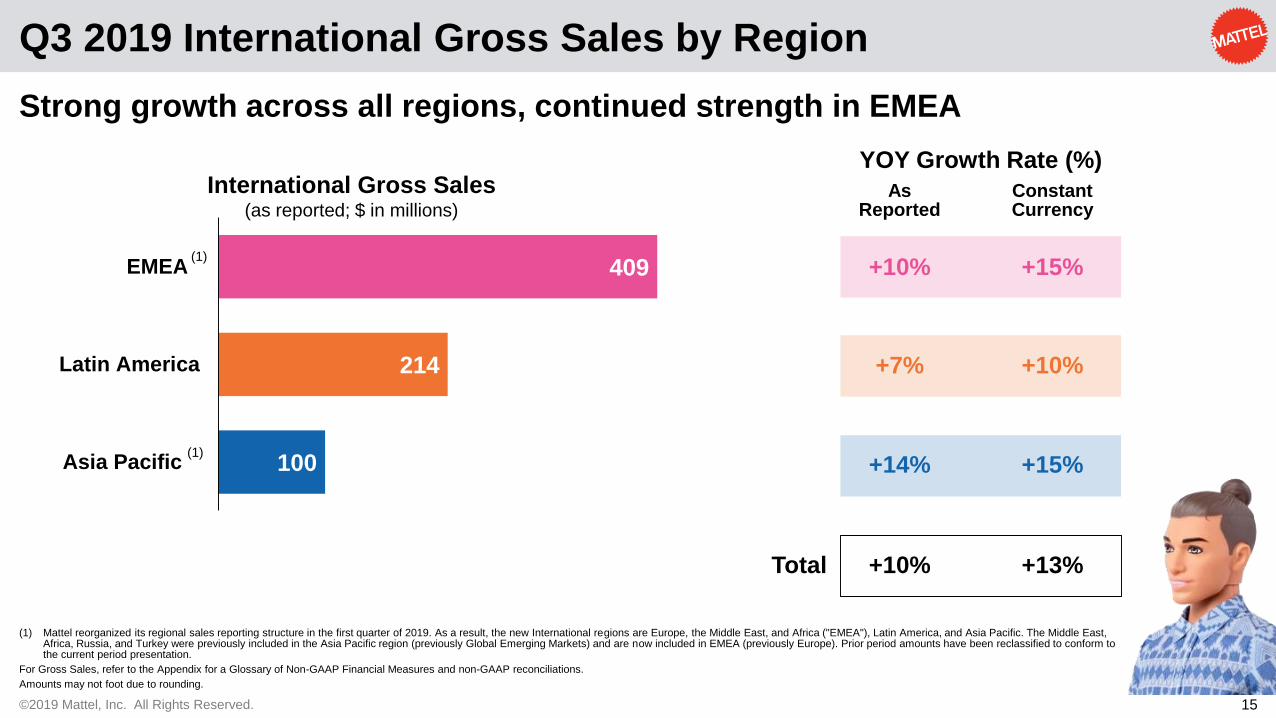
Q3 2019 International Gross Sales by Region
Strong growth across all regions, continued strength in EMEA
409
214
100
EMEA
Latin America
Asia Pacific(1)
International Gross Sales (as reported; $ in millions)
(1) Mattel reorganized its regional sales reporting structure in the first quarter of 2019. As a result, the new International regions are Europe, the Middle East, and Africa ("EMEA"), Latin America, and Asia Pacific. The Middle East, Africa, Russia, and Turkey were previously included in the Asia Pacific region (previously Global Emerging Markets) and are now included in EMEA (previously Europe). Prior period amounts have been reclassified to conform to the current period presentation.
For Gross Sales, refer to the Appendix for a Glossary of Non-GAAP Financial Measures and non-GAAP reconciliations.
Amounts may not foot due to rounding.
Total
+10%
+7%
+14%
+10%
As Reported
+15%
+10%
+15%
+13%
Constant Currency
YOY Growth Rate (%)
(1)
©2019 Mattel, Inc. All Rights Reserved. 16
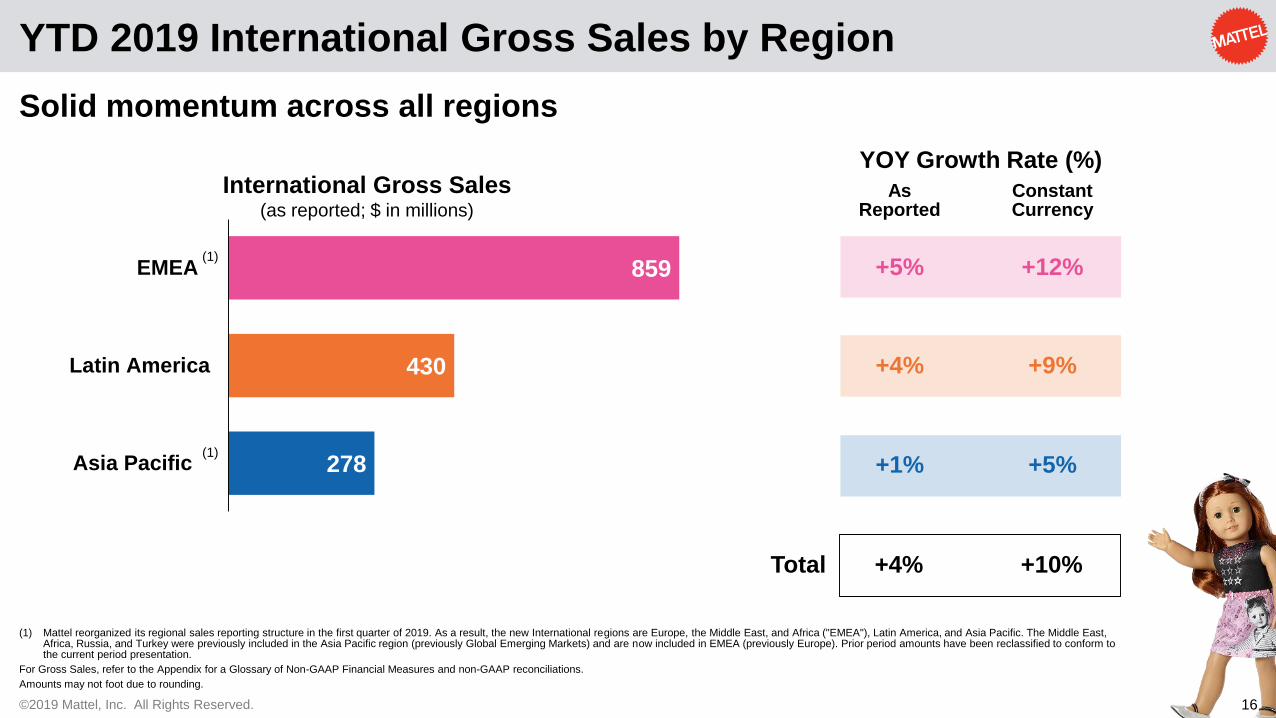
YTD 2019 International Gross Sales by Region
Solid momentum across all regions
859
430
278
EMEA
Latin America
Asia Pacific(1)
International Gross Sales (as reported; $ in millions)
(1) Mattel reorganized its regional sales reporting structure in the first quarter of 2019. As a result, the new International regions are Europe, the Middle East, and Africa ("EMEA"), Latin America, and Asia Pacific. The Middle East, Africa, Russia, and Turkey were previously included in the Asia Pacific region (previously Global Emerging Markets) and are now included in EMEA (previously Europe). Prior period amounts have been reclassified to conform to the current period presentation.
For Gross Sales, refer to the Appendix for a Glossary of Non-GAAP Financial Measures and non-GAAP reconciliations.
Amounts may not foot due to rounding.
(1)
Total
+5%
+4%
+1%
+4%
As Reported
+12%
+9%
+5%
+10%
Constant Currency
YOY Growth Rate (%)
©2019 Mattel, Inc. All Rights Reserved. 17
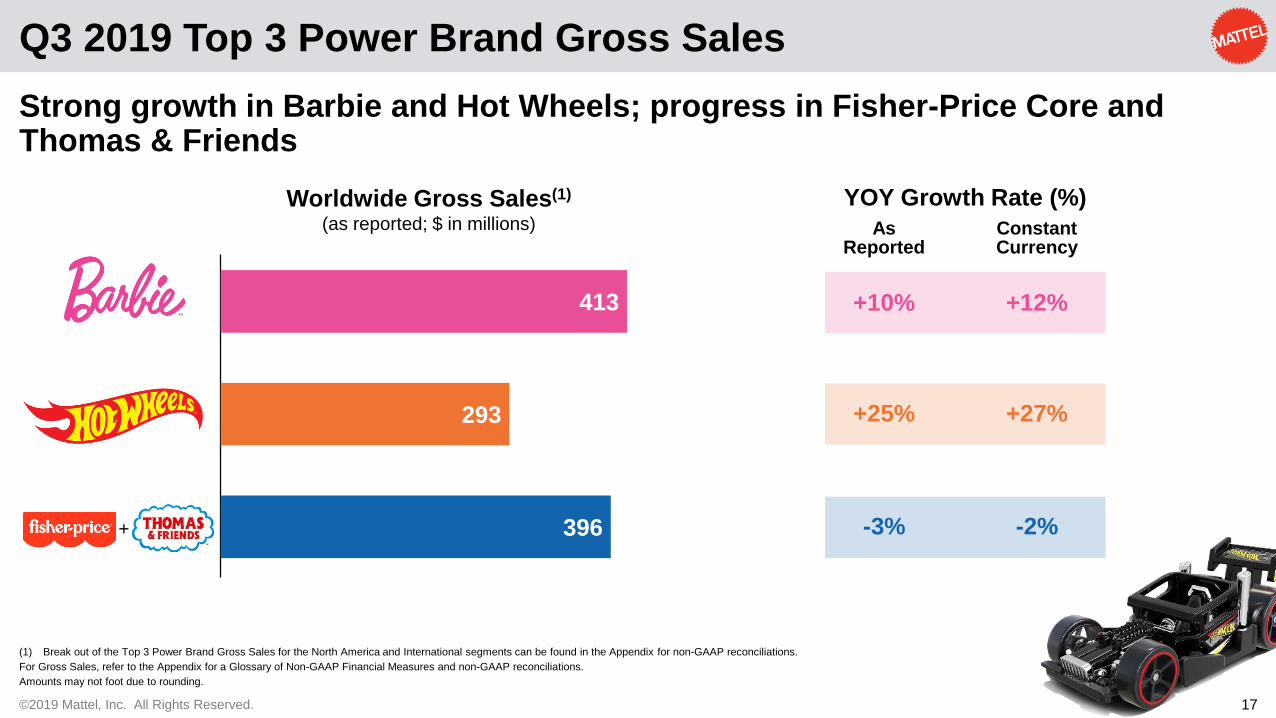
Q3 2019 Top 3 Power Brand Gross Sales
Strong growth in Barbie and Hot Wheels; progress in Fisher-Price Core and Thomas & Friends
(1) Break out of the Top 3 Power Brand Gross Sales for the North America and International segments can be found in the Appendix for non-GAAP reconciliations.
For Gross Sales, refer to the Appendix for a Glossary of Non-GAAP Financial Measures and non-GAAP reconciliations.
Amounts may not foot due to rounding.
+10%
+25%
-3%
As Reported
+12%
+27%
-2%
Constant Currency
YOY Growth Rate (%)
413
293
396
-
Worldwide Gross Sales(1)
(as reported; $ in millions)
+

©2019 Mattel, Inc. All Rights Reserved. 18
763
619
791
-
Worldwide Gross Sales(1)
(as reported; $ in millions)
YTD 2019 Top 3 Power Brand Gross Sales
Strong growth in Barbie and Hot Wheels; progress in Fisher-Price Core and Thomas & Friends
(1) Break out of the Top 3 Power Brand Gross Sales for the North America and International segments can be found in the Appendix for non-GAAP reconciliations.
For Gross Sales, refer to the Appendix for a Glossary of Non-GAAP Financial Measures and non-GAAP reconciliations.
Amounts may not foot due to rounding.
+9%
+13%
-5%
As Reported
+12%
+17%
-3%
Constant Currency
YOY Growth Rate (%)
+
©2019 Mattel, Inc. All Rights Reserved. 19
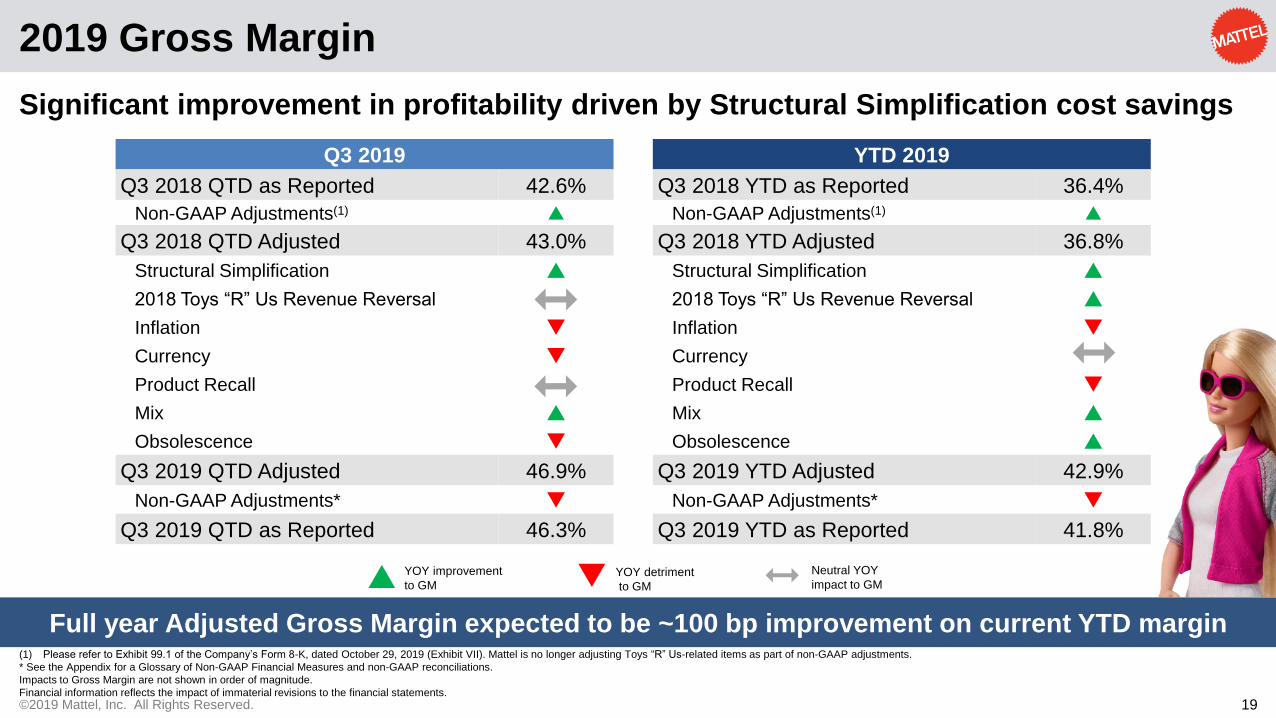
Q3 2019
Q3 2018 QTD as Reported 42.6%
Non-GAAP Adjustments(1)
Q3 2018 QTD Adjusted 43.0%
Structural Simplification
2018 Toys “R” Us Revenue Reversal
Inflation
Currency
Product Recall
Mix
Obsolescence
Q3 2019 QTD Adjusted 46.9%
Non-GAAP Adjustments*
Q3 2019 QTD as Reported 46.3%
2019 Gross Margin
Significant improvement in profitability driven by Structural Simplification cost savings
(1) Please refer to Exhibit 99.1 of the Company’s Form 8-K, dated October 29, 2019 (Exhibit VII). Mattel is no longer adjusting Toys “R” Us-related items as part of non-GAAP adjustments.
* See the Appendix for a Glossary of Non-GAAP Financial Measures and non-GAAP reconciliations.
Impacts to Gross Margin are not shown in order of magnitude.
Financial information reflects the impact of immaterial revisions to the financial statements.
Neutral YOY
impact to GMYOY improvement
to GMYOY detriment
to GM
Full year Adjusted Gross Margin expected to be ~100 bp improvement on current YTD margin
YTD 2019
Q3 2018 YTD as Reported 36.4%
Non-GAAP Adjustments(1)
Q3 2018 YTD Adjusted 36.8%
Structural Simplification
2018 Toys “R” Us Revenue Reversal
Inflation
Currency
Product Recall
Mix
Obsolescence
Q3 2019 YTD Adjusted 42.9%
Non-GAAP Adjustments*
Q3 2019 YTD as Reported 41.8%
©2019 Mattel, Inc. All Rights Reserved. 20
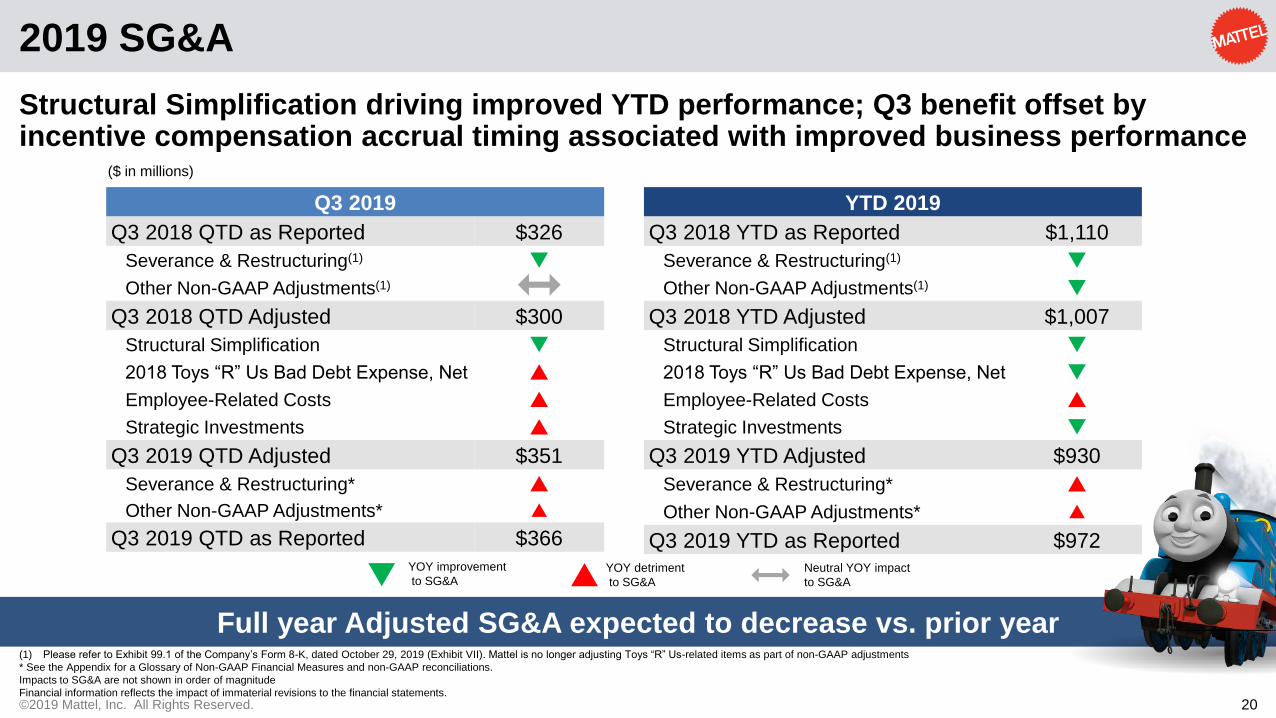
Full year Adjusted SG&A expected to decrease vs. prior year
2019 SG&A
Structural Simplification driving improved YTD performance; Q3 benefit offset by incentive compensation accrual timing associated with improved business performance
(1) Please refer to Exhibit 99.1 of the Company’s Form 8-K, dated October 29, 2019 (Exhibit VII). Mattel is no longer adjusting Toys “R” Us-related items as part of non-GAAP adjustments
* See the Appendix for a Glossary of Non-GAAP Financial Measures and non-GAAP reconciliations.
Impacts to SG&A are not shown in order of magnitude
Financial information reflects the impact of immaterial revisions to the financial statements.
Neutral YOY impact
to SG&A
YOY improvement
to SG&A
YOY detriment
to SG&A
($ in millions)
Q3 2019
Q3 2018 QTD as Reported $326
Severance & Restructuring(1)
Other Non-GAAP Adjustments(1)
Q3 2018 QTD Adjusted $300
Structural Simplification
2018 Toys “R” Us Bad Debt Expense, Net
Employee-Related Costs
Strategic Investments
Q3 2019 QTD Adjusted $351
Severance & Restructuring*
Other Non-GAAP Adjustments*
Q3 2019 QTD as Reported $366
YTD 2019
Q3 2018 YTD as Reported $1,110
Severance & Restructuring(1)
Other Non-GAAP Adjustments(1)
Q3 2018 YTD Adjusted $1,007
Structural Simplification
2018 Toys “R” Us Bad Debt Expense, Net
Employee-Related Costs
Strategic Investments
Q3 2019 YTD Adjusted $930
Severance & Restructuring*
Other Non-GAAP Adjustments*
Q3 2019 YTD as Reported $972
©2019 Mattel, Inc. All Rights Reserved. 21
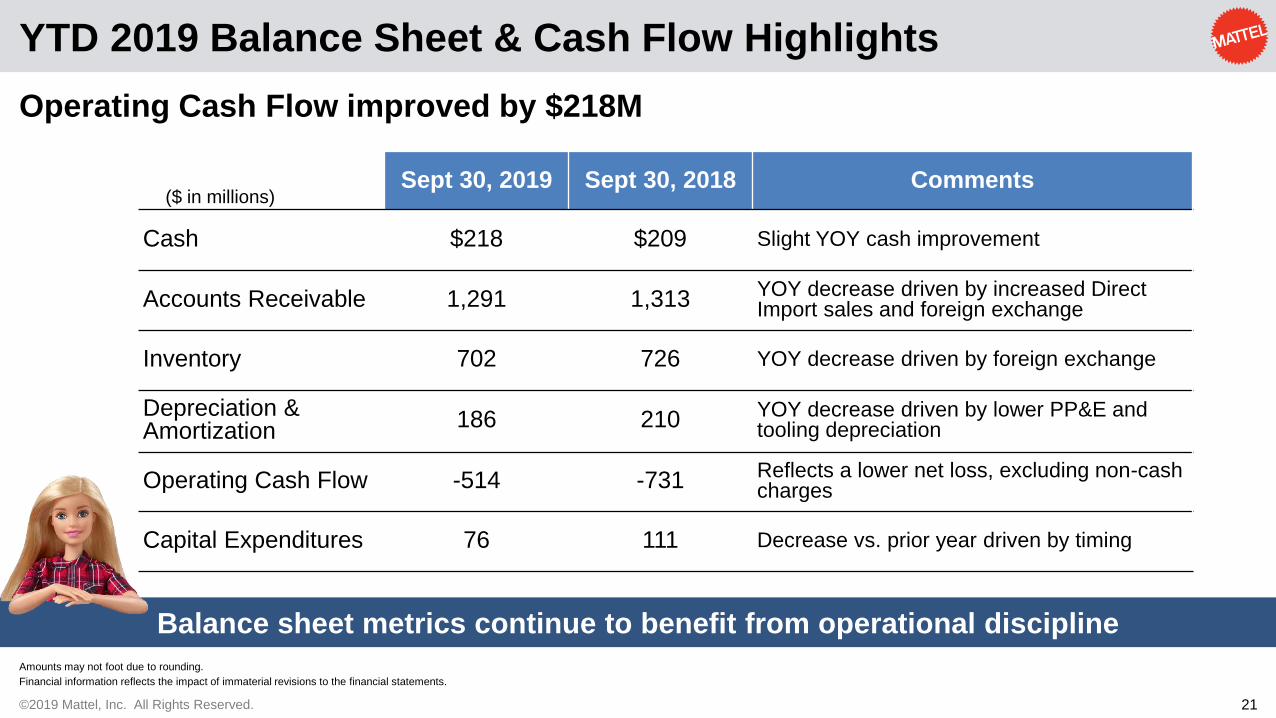
Balance sheet metrics continue to benefit from operational discipline
YTD 2019 Balance Sheet & Cash Flow Highlights
Sept 30, 2019 Sept 30, 2018 Comments
Cash $218 $209 Slight YOY cash improvement
Accounts Receivable 1,291 1,313 YOY decrease driven by increased Direct Import sales and foreign exchange
Inventory 702 726 YOY decrease driven by foreign exchange
Depreciation & Amortization
186 210 YOY decrease driven by lower PP&E and tooling depreciation
Operating Cash Flow -514 -731 Reflects a lower net loss, excluding non-cash charges
Capital Expenditures 76 111 Decrease vs. prior year driven by timing
($ in millions)
Operating Cash Flow improved by $218M
Amounts may not foot due to rounding.
Financial information reflects the impact of immaterial revisions to the financial statements.
©2019 Mattel, Inc. All Rights Reserved. 22
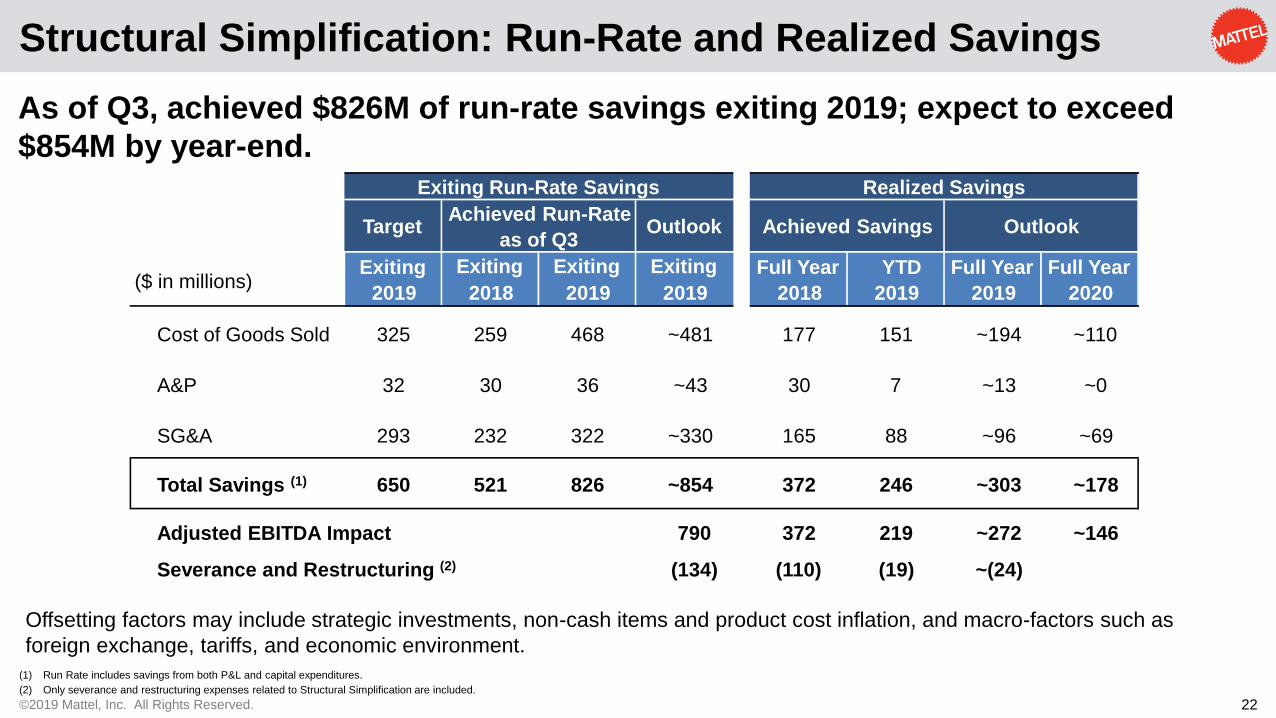
Structural Simplification: Run-Rate and Realized Savings
(1) Run Rate includes savings from both P&L and capital expenditures.
(2) Only severance and restructuring expenses related to Structural Simplification are included.
As of Q3, achieved $826M of run-rate savings exiting 2019; expect to exceed
$854M by year-end.
Offsetting factors may include strategic investments, non-cash items and product cost inflation, and macro-factors such as
foreign exchange, tariffs, and economic environment.
Exiting Exiting Exiting
2018 2019 2019
Cost of Goods Sold 325 259 468 ~481 177 151 ~194 ~110
A&P 32 30 36 ~43 30 7 ~13 ~0
SG&A 293 232 322 ~330 165 88 ~96 ~69
Total Savings (1) 650 521 826 ~854 372 246 ~303 ~178
372 219 ~272 ~146
(110) (19) ~(24)
Exiting Run-Rate Savings Realized Savings
TargetAchieved Run-Rate
Outlook Achieved Savings Outlookas of Q3
Full Year
2018
YTD
2019
Severance and Restructuring (2)
Full Year
2019
Full Year
2020($ in millions)
Exiting
2019
Adjusted EBITDA Impact 790
(134)
©2019 Mattel, Inc. All Rights Reserved. 23
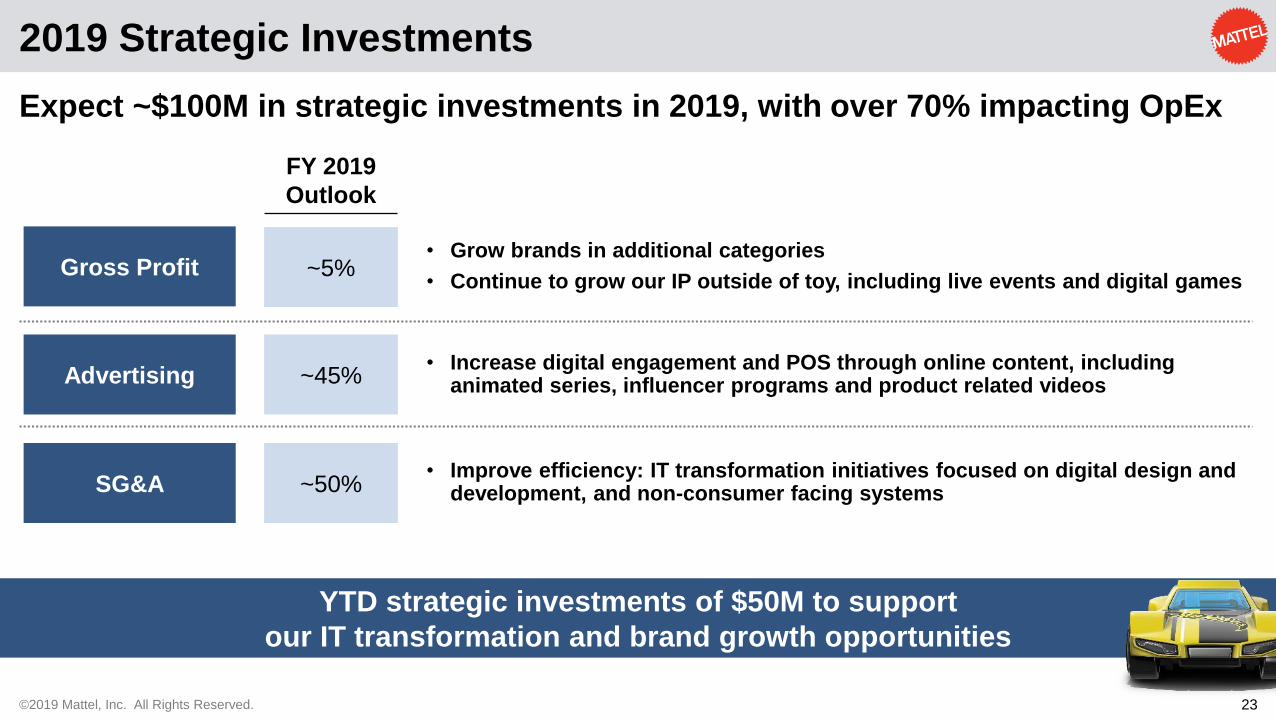
2019 Strategic Investments
• Grow brands in additional categories
• Continue to grow our IP outside of toy, including live events and digital games
Expect ~$100M in strategic investments in 2019, with over 70% impacting OpEx
Gross Profit
Advertising
SG&A
• Increase digital engagement and POS through online content, including animated series, influencer programs and product related videos
• Improve efficiency: IT transformation initiatives focused on digital design and development, and non-consumer facing systems
~45%
~50%
YTD strategic investments of $50M to support
our IT transformation and brand growth opportunities
~5%
FY 2019
Outlook
©2019 Mattel, Inc. All Rights Reserved. 24
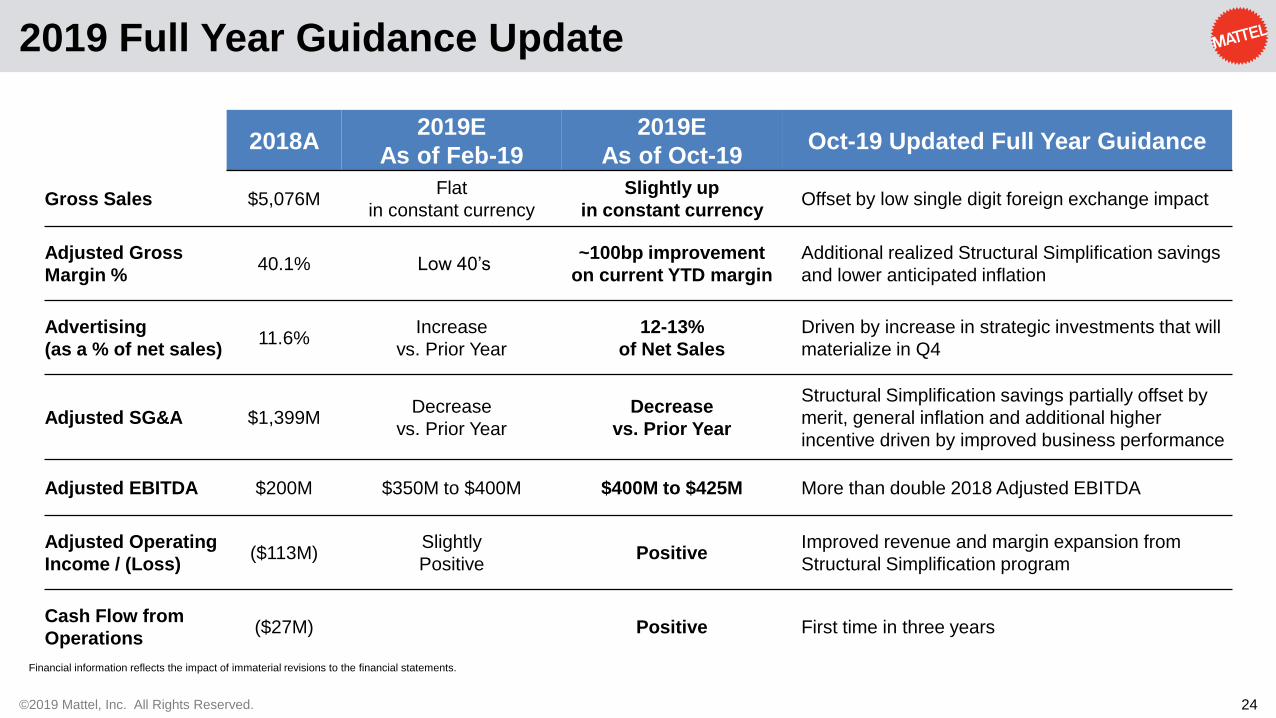
2018A2019E
As of Feb-19
2019E
As of Oct-19Oct-19 Updated Full Year Guidance
Gross Sales $5,076MFlat
in constant currency
Slightly up
in constant currencyOffset by low single digit foreign exchange impact
Adjusted Gross
Margin %40.1% Low 40’s
~100bp improvement
on current YTD margin
Additional realized Structural Simplification savings
and lower anticipated inflation
Advertising
(as a % of net sales)11.6%
Increase
vs. Prior Year
12-13%
of Net Sales
Driven by increase in strategic investments that will
materialize in Q4
Adjusted SG&A $1,399MDecrease
vs. Prior Year
Decrease
vs. Prior Year
Structural Simplification savings partially offset by
merit, general inflation and additional higher
incentive driven by improved business performance
Adjusted EBITDA $200M $350M to $400M $400M to $425M More than double 2018 Adjusted EBITDA
Adjusted Operating
Income / (Loss)($113M)
Slightly
PositivePositive
Improved revenue and margin expansion from
Structural Simplification program
Cash Flow from
Operations($27M) Positive First time in three years
2019 Full Year Guidance Update
Financial information reflects the impact of immaterial revisions to the financial statements.
©2019 Mattel, Inc. All Rights Reserved. 25
26
Appendix
©2019 Mattel, Inc. All Rights Reserved. 27
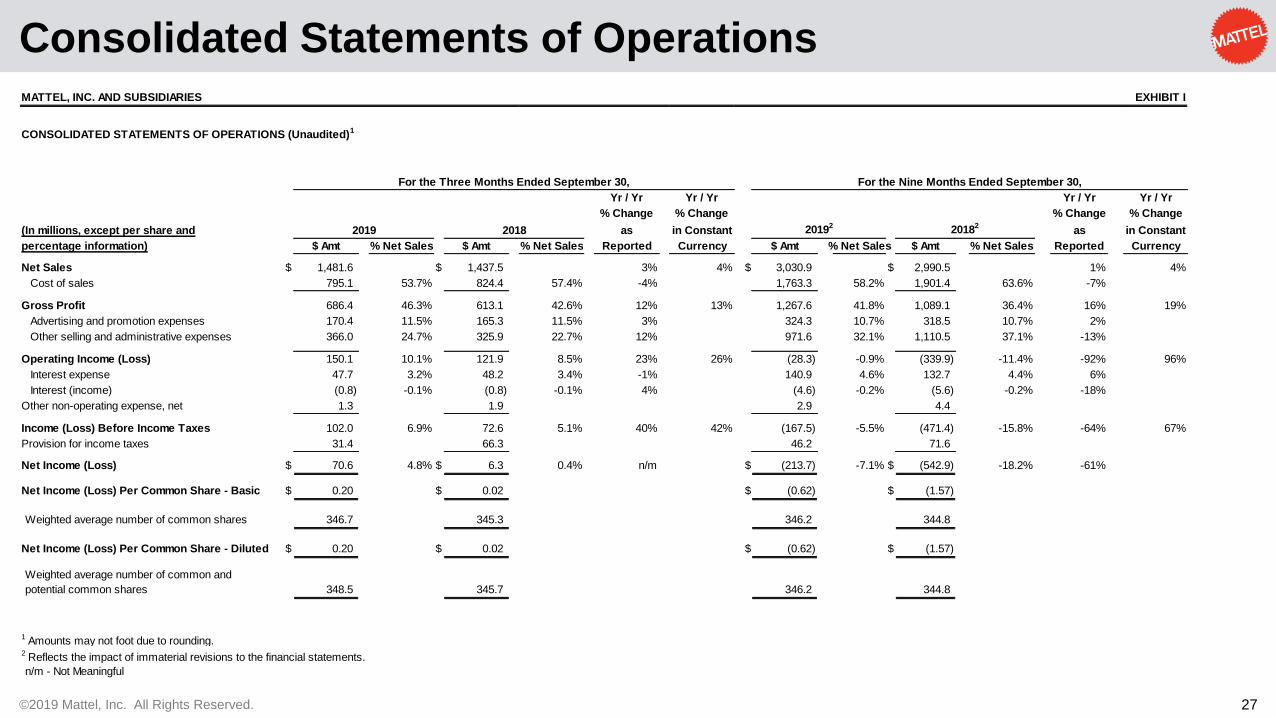
Consolidated Statements of OperationsMATTEL, INC. AND SUBSIDIARIES EXHIBIT I
CONSOLIDATED STATEMENTS OF OPERATIONS (Unaudited)1
Yr / Yr Yr / Yr Yr / Yr Yr / Yr
% Change % Change % Change % Change
(In millions, except per share and 2019 2018 as in Constant 20192 20182as in Constant
percentage information) $ Amt % Net Sales $ Amt % Net Sales Reported Currency $ Amt % Net Sales $ Amt % Net Sales Reported Currency
Net Sales $ 1,481.6 $ 1,437.5 3% 4% $ 3,030.9 $ 2,990.5 1% 4%
Cost of sales 795.1 53.7% 824.4 57.4% -4% 1,763.3 58.2% 1,901.4 63.6% -7%
Gross Profit 686.4 46.3% 613.1 42.6% 12% 13% 1,267.6 41.8% 1,089.1 36.4% 16% 19%
Advertising and promotion expenses 170.4 11.5% 165.3 11.5% 3% 324.3 10.7% 318.5 10.7% 2%
Other selling and administrative expenses 366.0 24.7% 325.9 22.7% 12% 971.6 32.1% 1,110.5 37.1% -13%
Operating Income (Loss) 150.1 10.1% 121.9 8.5% 23% 26% (28.3) -0.9% (339.9) -11.4% -92% 96%
Interest expense 47.7 3.2% 48.2 3.4% -1% 140.9 4.6% 132.7 4.4% 6%
Interest (income) (0.8) -0.1% (0.8) -0.1% 4% (4.6) -0.2% (5.6) -0.2% -18%
Other non-operating expense, net 1.3 1.9 2.9 4.4
Income (Loss) Before Income Taxes 102.0 6.9% 72.6 5.1% 40% 42% (167.5) -5.5% (471.4) -15.8% -64% 67%
Provision for income taxes 31.4 66.3 46.2 71.6
Net Income (Loss) $ 70.6 4.8% $ 6.3 0.4% n/m $ (213.7) -7.1% $ (542.9) -18.2% -61%
Net Income (Loss) Per Common Share - Basic $ 0.20 $ 0.02 $ (0.62) $ (1.57)
Weighted average number of common shares 346.7 345.3 346.2 344.8
Net Income (Loss) Per Common Share - Diluted $ 0.20 $ 0.02 $ (0.62) $ (1.57)
Weighted average number of common and
potential common shares 348.5 345.7 346.2 344.8
1 Amounts may not foot due to rounding. 2 Reflects the impact of immaterial revisions to the financial statements.
n/m - Not Meaningful
For the Three Months Ended September 30, For the Nine Months Ended September 30,

©2019 Mattel, Inc. All Rights Reserved. 28
Condensed Consolidated Balance SheetsMATTEL, INC. AND SUBSIDIARIES EXHIBIT II
CONDENSED CONSOLIDATED BALANCE SHEETS1
December 31,
20193 20183 20183
(In millions)
Assets
Cash and equivalents $ 218.3 $ 209.2 $ 594.5
Accounts receivable, net 1,291.3 1,312.9 970.1
Inventories 701.6 726.0 542.9
Prepaid expenses and other current assets 225.9 287.0 239.7
Total current assets 2,437.0 2,535.1 2,347.2
Property, plant, and equipment, net 572.3 677.0 657.6
Right-of-use assets, net2 306.2 - -
Other noncurrent assets 2,212.1 2,269.7 2,233.4
Total Assets $ 5,527.6 $ 5,481.8 $ 5,238.2
Liabilities and Stockholders' Equity
Short-term borrowings $ 230.0 $ 275.0 $ 4.2
Accounts payable and accrued liabilities21,244.8 1,220.6 1,242.3
Income taxes payable 48.8 5.8 13.5
Total current liabilities 1,523.5 1,501.4 1,260.0
Long-term debt 2,856.8 2,849.9 2,851.7
Noncurrent lease liabilities2273.9 - -
Other noncurrent liabilities 419.7 471.5 469.7
Stockholders' equity 453.7 659.0 656.8
Total Liabilities and Stockholders' Equity $ 5,527.6 $ 5,481.8 $ 5,238.2
September 30,
(Unaudited)
1 Amounts may not foot due to rounding.
2 Mattel adopted ASU 2016-02, Leases (Topic 842), on January 1, 2019 using the modified retrospective transition method. Upon adoption,
Mattel recorded a right-of-use asset and lease liability on its balance sheet. Prior periods were not retrospectively adjusted.3 Reflects the impact of immaterial revisions to the financial statements.

©2019 Mattel, Inc. All Rights Reserved. 29
Supplemental Balance Sheet and Cash Flow Data
SUPPLEMENTAL BALANCE SHEET AND CASH FLOW DATA (Unaudited)1
2019 20183
Key Balance Sheet Data:
Accounts receivable, net days of sales outstanding (DSO) 78 82
(In millions) 20193 20183
Condensed Cash Flow Data:
Cash flows used for operating activities (514)$ (731)$
Cash flows used for investing activities (78) (115)
Cash flows provided by (used for) financing activities and other 216 (24)
Decrease in cash and equivalents (376)$ (870)$
1 Amounts may not foot due to rounding.
2 Mattel adopted ASU 2016-02, Leases (Topic 842), on January 1, 2019 using the modified retrospective transition method. Upon adoption,
Mattel recorded a right-of-use asset and lease liability on its balance sheet. Prior periods were not retrospectively adjusted.3 Reflects the impact of immaterial revisions to the financial statements.
September 30,
Nine Months Ended September 30,
MATTEL, INC. AND SUBSIDIARIES EXHIBIT II

©2019 Mattel, Inc. All Rights Reserved. 30
Reconciliation of Non-GAAP Financial MeasuresMATTEL, INC. AND SUBSIDIARIES EXHIBIT III
WORLDWIDE GROSS SALES INFORMATION (Unaudited)1
RECONCILIATION OF GAAP AND NON-GAAP FINANCIAL MEASURES
(In millions, except percentage information)
2019 2018
% Change
as Reported
% Change in
Constant
Currency 2019 20184
% Change
as
Reported
% Change in
Constant
Currency
Worldwide Gross Sales:
Net Sales 1,481.6$ 1,437.5$ 3 % 4 % 3,030.9$ 2,990.5$ 1 % 4 %
Sales Adjustments2175.4 169.2 368.4 370.2
Gross Sales 1,656.9$ 1,606.6$ 3 % 4 % 3,399.3$ 3,360.8$ 1 % 4 %
Worldwide Gross Sales by Categories:3
Dolls 567.6$ 538.4$ 5 % 7 % 1,093.9$ 1,062.4$ 3 % 6 %
Infant, Toddler and Preschool 431.0 483.4 -11 -10 876.6 998.1 -12 -10
Vehicles 346.9 306.5 13 15 744.4 710.5 5 8
Action Figures, Building Sets and Games 311.4 278.4 12 13 684.4 589.9 16 18
Gross Sales 1,656.9$ 1,606.6$ 3 % 4 % 3,399.3$ 3,360.8$ 1 % 4 %
Supplemental Gross Sales Disclosures
Worldwide Gross Sales by Top 3 Power Brands:
Barbie 412.8$ 374.7$ 10 % 12 % 762.8$ 698.1$ 9 % 12 %
Hot Wheels 293.3 235.0 25 27 619.0 547.2 13 17
Fisher-Price and Thomas & Friends 396.3 409.5 -3 -2 791.1 833.5 -5 -3
Other 554.4 587.4 -6 -4 1,226.3 1,281.9 -4 -2
Gross Sales 1,656.9$ 1,606.6$ 3 % 4 % 3,399.3$ 3,360.8$ 1 % 4 %
1 Amounts may not foot due to rounding. 2 Sales Adjustments are not allocated to individual products. As such, Net Sales are not presented on a categories or brand level.3 Mattel modified its reporting structure for revenues in the first quarter of 2019 to disclose revenues by categories. Refer to Note 23, Segment Information, in the Form 10-Q for additional information. 4 Reflects the impact of immaterial revisions to the financial statements.
For the Three Months Ended September 30, For the Nine Months Ended September 30,
©2019 Mattel, Inc. All Rights Reserved. 31
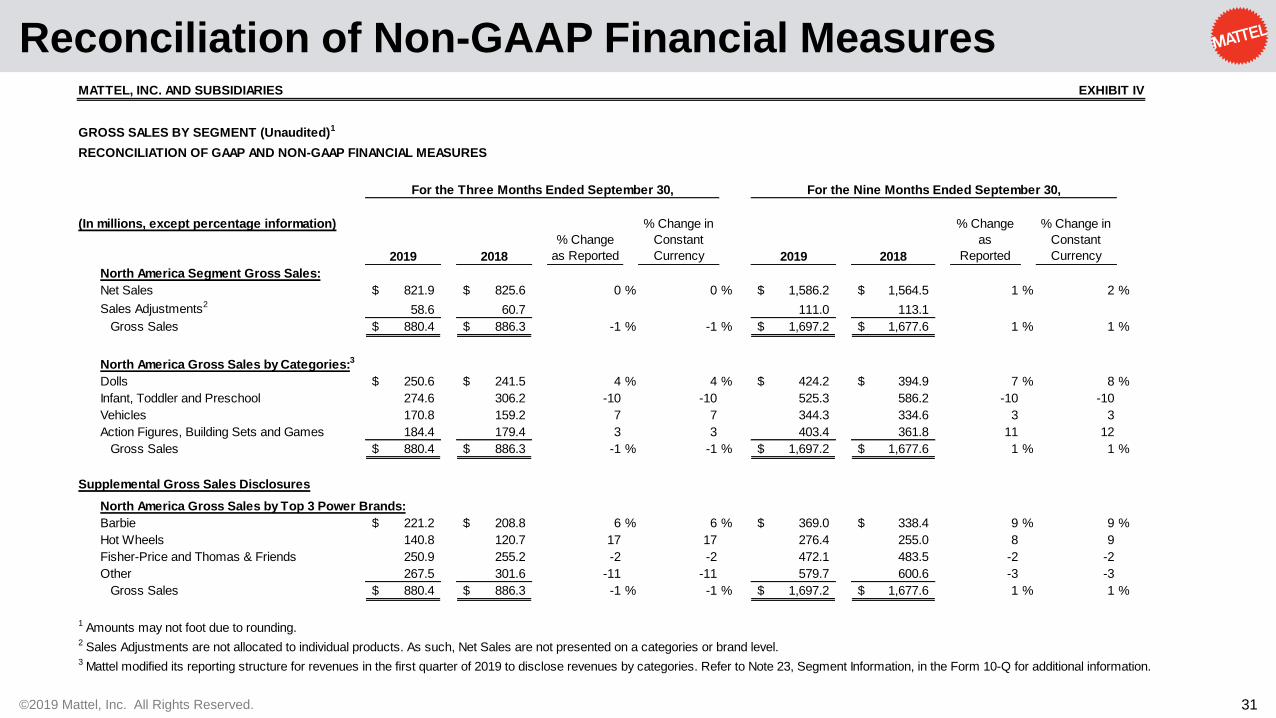
Reconciliation of Non-GAAP Financial MeasuresMATTEL, INC. AND SUBSIDIARIES EXHIBIT IV
GROSS SALES BY SEGMENT (Unaudited)1
RECONCILIATION OF GAAP AND NON-GAAP FINANCIAL MEASURES
(In millions, except percentage information)
2019 2018
% Change
as Reported
% Change in
Constant
Currency 2019 2018
% Change
as
Reported
% Change in
Constant
Currency
North America Segment Gross Sales:
Net Sales 821.9$ 825.6$ 0 % 0 % 1,586.2$ 1,564.5$ 1 % 2 %
Sales Adjustments258.6 60.7 111.0 113.1
Gross Sales 880.4$ 886.3$ -1 % -1 % 1,697.2$ 1,677.6$ 1 % 1 %
North America Gross Sales by Categories:3
Dolls 250.6$ 241.5$ 4 % 4 % 424.2$ 394.9$ 7 % 8 %
Infant, Toddler and Preschool 274.6 306.2 -10 -10 525.3 586.2 -10 -10
Vehicles 170.8 159.2 7 7 344.3 334.6 3 3
Action Figures, Building Sets and Games 184.4 179.4 3 3 403.4 361.8 11 12
Gross Sales 880.4$ 886.3$ -1 % -1 % 1,697.2$ 1,677.6$ 1 % 1 %
Supplemental Gross Sales Disclosures
North America Gross Sales by Top 3 Power Brands:
Barbie 221.2$ 208.8$ 6 % 6 % 369.0$ 338.4$ 9 % 9 %
Hot Wheels 140.8 120.7 17 17 276.4 255.0 8 9
Fisher-Price and Thomas & Friends 250.9 255.2 -2 -2 472.1 483.5 -2 -2
Other 267.5 301.6 -11 -11 579.7 600.6 -3 -3
Gross Sales 880.4$ 886.3$ -1 % -1 % 1,697.2$ 1,677.6$ 1 % 1 %
1 Amounts may not foot due to rounding. 2 Sales Adjustments are not allocated to individual products. As such, Net Sales are not presented on a categories or brand level.3 Mattel modified its reporting structure for revenues in the first quarter of 2019 to disclose revenues by categories. Refer to Note 23, Segment Information, in the Form 10-Q for additional information.
For the Three Months Ended September 30, For the Nine Months Ended September 30,
©2019 Mattel, Inc. All Rights Reserved. 32
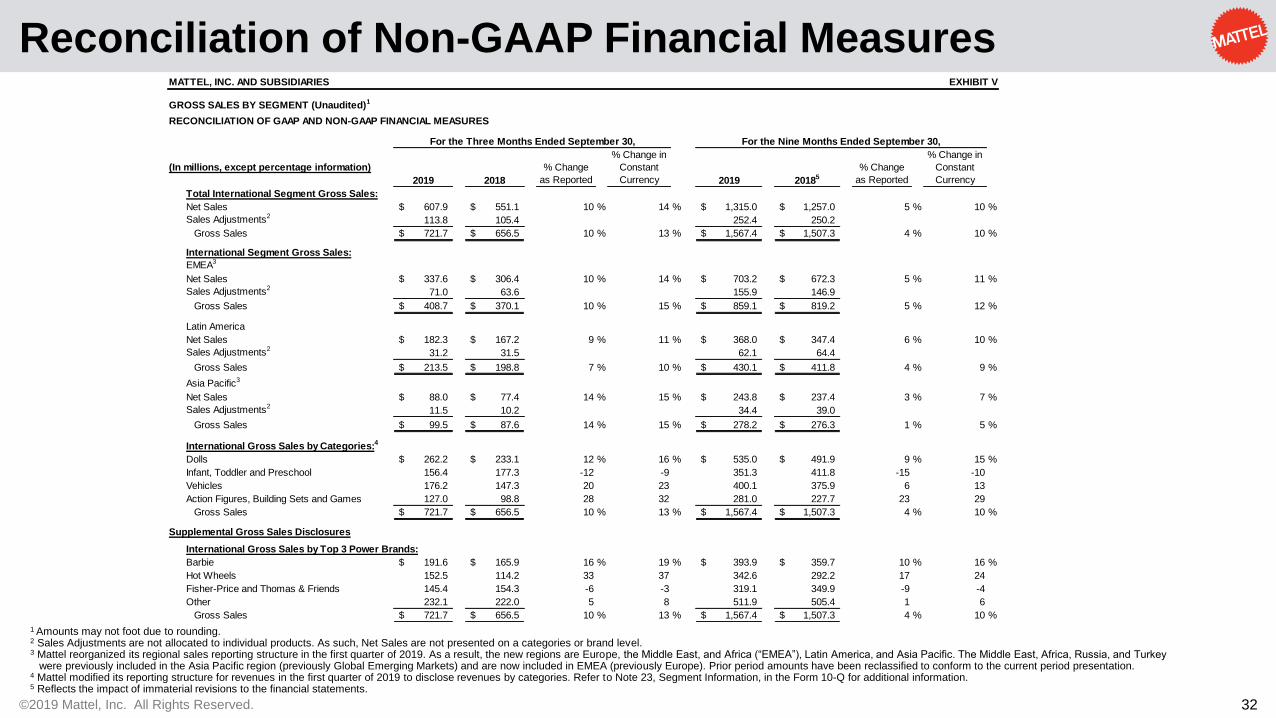
Reconciliation of Non-GAAP Financial MeasuresMATTEL, INC. AND SUBSIDIARIES EXHIBIT V
GROSS SALES BY SEGMENT (Unaudited)1
RECONCILIATION OF GAAP AND NON-GAAP FINANCIAL MEASURES
(In millions, except percentage information)
2019 2018
% Change
as Reported
% Change in
Constant
Currency 2019 20185
% Change
as Reported
% Change in
Constant
Currency
Total International Segment Gross Sales:
Net Sales 607.9$ 551.1$ 10 % 14 % 1,315.0$ 1,257.0$ 5 % 10 %
Sales Adjustments2113.8 105.4 252.4 250.2
Gross Sales 721.7$ 656.5$ 10 % 13 % 1,567.4$ 1,507.3$ 4 % 10 %
International Segment Gross Sales:
EMEA3
Net Sales 337.6$ 306.4$ 10 % 14 % 703.2$ 672.3$ 5 % 11 %
Sales Adjustments271.0 63.6 155.9 146.9
Gross Sales 408.7$ 370.1$ 10 % 15 % 859.1$ 819.2$ 5 % 12 %
Latin America
Net Sales 182.3$ 167.2$ 9 % 11 % 368.0$ 347.4$ 6 % 10 %
Sales Adjustments231.2 31.5 62.1 64.4
Gross Sales 213.5$ 198.8$ 7 % 10 % 430.1$ 411.8$ 4 % 9 %
Asia Pacific3
Net Sales 88.0$ 77.4$ 14 % 15 % 243.8$ 237.4$ 3 % 7 %
Sales Adjustments211.5 10.2 34.4 39.0
Gross Sales 99.5$ 87.6$ 14 % 15 % 278.2$ 276.3$ 1 % 5 %
International Gross Sales by Categories:4
Dolls 262.2$ 233.1$ 12 % 16 % 535.0$ 491.9$ 9 % 15 %
Infant, Toddler and Preschool 156.4 177.3 -12 -9 351.3 411.8 -15 -10
Vehicles 176.2 147.3 20 23 400.1 375.9 6 13
Action Figures, Building Sets and Games 127.0 98.8 28 32 281.0 227.7 23 29
Gross Sales 721.7$ 656.5$ 10 % 13 % 1,567.4$ 1,507.3$ 4 % 10 %
Supplemental Gross Sales Disclosures
International Gross Sales by Top 3 Power Brands:
Barbie 191.6$ 165.9$ 16 % 19 % 393.9$ 359.7$ 10 % 16 %
Hot Wheels 152.5 114.2 33 37 342.6 292.2 17 24
Fisher-Price and Thomas & Friends 145.4 154.3 -6 -3 319.1 349.9 -9 -4
Other 232.1 222.0 5 8 511.9 505.4 1 6
Gross Sales 721.7$ 656.5$ 10 % 13 % 1,567.4$ 1,507.3$ 4 % 10 %
For the Three Months Ended September 30, For the Nine Months Ended September 30,
1 Amounts may not foot due to rounding. 2 Sales Adjustments are not allocated to individual products. As such, Net Sales are not presented on a categories or brand level.3 Mattel reorganized its regional sales reporting structure in the first quarter of 2019. As a result, the new regions are Europe, the Middle East, and Africa (“EMEA”), Latin America, and Asia Pacific. The Middle East, Africa, Russia, and Turkey
were previously included in the Asia Pacific region (previously Global Emerging Markets) and are now included in EMEA (previously Europe). Prior period amounts have been reclassified to conform to the current period presentation.4 Mattel modified its reporting structure for revenues in the first quarter of 2019 to disclose revenues by categories. Refer to Note 23, Segment Information, in the Form 10-Q for additional information. 5 Reflects the impact of immaterial revisions to the financial statements.

©2019 Mattel, Inc. All Rights Reserved. 33
Reconciliation of Non-GAAP Financial MeasuresMATTEL, INC. AND SUBSIDIARIES EXHIBIT VI
GROSS SALES BY SEGMENT (Unaudited)1
RECONCILIATION OF GAAP AND NON-GAAP FINANCIAL MEASURES
(In millions, except percentage information)
2019 2018
% Change
as Reported
% Change in
Constant
Currency 2019 2018
% Change
as Reported
% Change in
Constant
Currency
American Girl Segment Gross Sales:
Net Sales 51.8$ 60.8$ -15 % -15 % 129.7$ 169.0$ -23 % -23 %
Sales Adjustments 3.0 3.0 5.0 6.9
Gross Sales 54.8$ 63.9$ -14 % -14 % 134.7$ 175.9$ -23 % -23 %
1 Amounts may not foot due to rounding.
For the Three Months Ended September 30, For the Nine Months Ended September 30,
©2019 Mattel, Inc. All Rights Reserved. 34
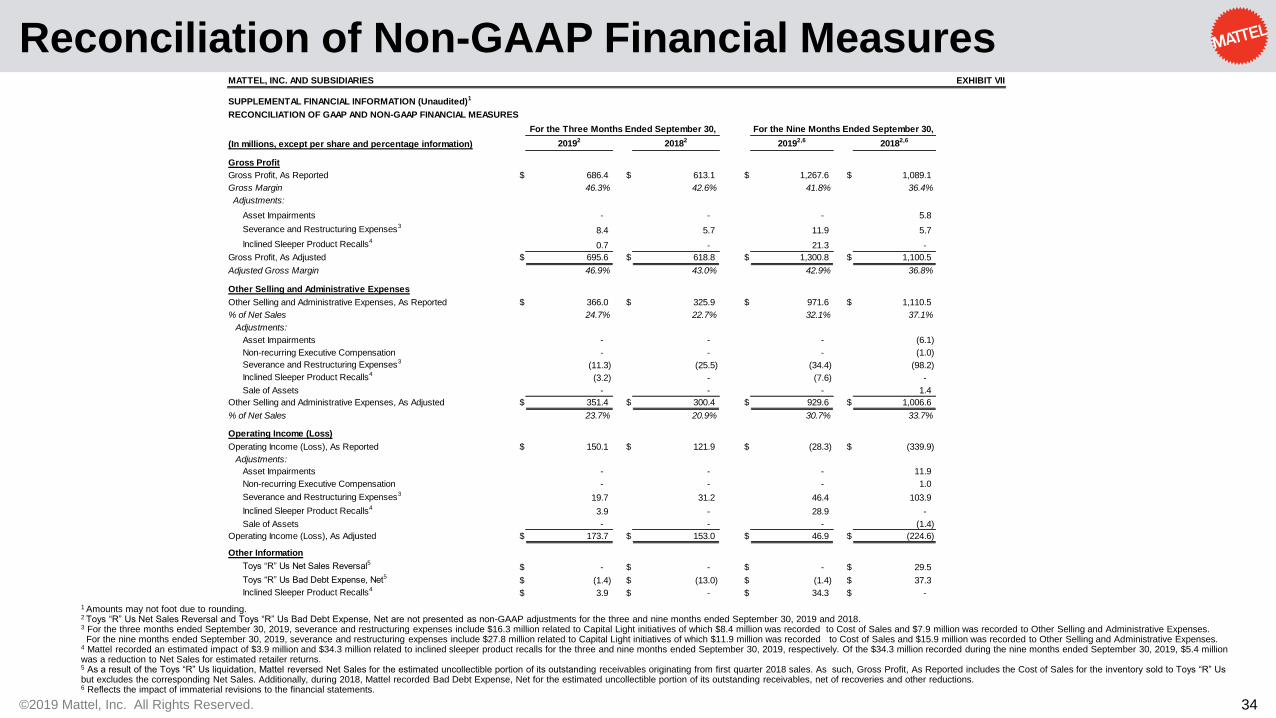
Reconciliation of Non-GAAP Financial MeasuresMATTEL, INC. AND SUBSIDIARIES EXHIBIT VII
SUPPLEMENTAL FINANCIAL INFORMATION (Unaudited)1
RECONCILIATION OF GAAP AND NON-GAAP FINANCIAL MEASURES
(In millions, except per share and percentage information) 20192 20182 20192,6 20182,6
Gross Profit
Gross Profit, As Reported $ 686.4 $ 613.1 $ 1,267.6 $ 1,089.1
Gross Margin 46.3% 42.6% 41.8% 36.4%
Adjustments:
Asset Impairments - - - 5.8
Severance and Restructuring Expenses38.4 5.7 11.9 5.7
Inclined Sleeper Product Recalls40.7 - 21.3 -
Gross Profit, As Adjusted $ 695.6 $ 618.8 $ 1,300.8 $ 1,100.5
Adjusted Gross Margin 46.9% 43.0% 42.9% 36.8%
Other Selling and Administrative Expenses
Other Selling and Administrative Expenses, As Reported $ 366.0 $ 325.9 $ 971.6 $ 1,110.5
% of Net Sales 24.7% 22.7% 32.1% 37.1%
Adjustments:
Asset Impairments - - - (6.1)
Non-recurring Executive Compensation - - - (1.0)
Severance and Restructuring Expenses3(11.3) (25.5) (34.4) (98.2)
Inclined Sleeper Product Recalls4(3.2) - (7.6) -
Sale of Assets - - - 1.4
Other Selling and Administrative Expenses, As Adjusted $ 351.4 $ 300.4 $ 929.6 $ 1,006.6
% of Net Sales 23.7% 20.9% 30.7% 33.7%
Operating Income (Loss)
Operating Income (Loss), As Reported $ 150.1 $ 121.9 $ (28.3) $ (339.9)
Adjustments:
Asset Impairments - - - 11.9
Non-recurring Executive Compensation - - - 1.0
Severance and Restructuring Expenses319.7 31.2 46.4 103.9
Inclined Sleeper Product Recalls43.9 - 28.9 -
Sale of Assets - - - (1.4)
Operating Income (Loss), As Adjusted $ 173.7 $ 153.0 $ 46.9 $ (224.6)
Other Information
Toys “R” Us Net Sales Reversal5 $ - $ - $ - $ 29.5
Toys “R” Us Bad Debt Expense, Net5 $ (1.4) $ (13.0) $ (1.4) $ 37.3
Inclined Sleeper Product Recalls4$ 3.9 $ - $ 34.3 $ -
For the Three Months Ended September 30, For the Nine Months Ended September 30,
1 Amounts may not foot due to rounding. 2 Toys “R” Us Net Sales Reversal and Toys “R” Us Bad Debt Expense, Net are not presented as non-GAAP adjustments for the three and nine months ended September 30, 2019 and 2018. 3 For the three months ended September 30, 2019, severance and restructuring expenses include $16.3 million related to Capital Light initiatives of which $8.4 million was recorded to Cost of Sales and $7.9 million was recorded to Other Selling and Administrative Expenses.
For the nine months ended September 30, 2019, severance and restructuring expenses include $27.8 million related to Capital Light initiatives of which $11.9 million was recorded to Cost of Sales and $15.9 million was recorded to Other Selling and Administrative Expenses.4 Mattel recorded an estimated impact of $3.9 million and $34.3 million related to inclined sleeper product recalls for the three and nine months ended September 30, 2019, respectively. Of the $34.3 million recorded during the nine months ended September 30, 2019, $5.4 million was a reduction to Net Sales for estimated retailer returns.5 As a result of the Toys “R” Us liquidation, Mattel reversed Net Sales for the estimated uncollectible portion of its outstanding receivables originating from first quarter 2018 sales. As such, Gross Profit, As Reported includes the Cost of Sales for the inventory sold to Toys “R” Us but excludes the corresponding Net Sales. Additionally, during 2018, Mattel recorded Bad Debt Expense, Net for the estimated uncollectible portion of its outstanding receivables, net of recoveries and other reductions. 6 Reflects the impact of immaterial revisions to the financial statements.
©2019 Mattel, Inc. All Rights Reserved. 35
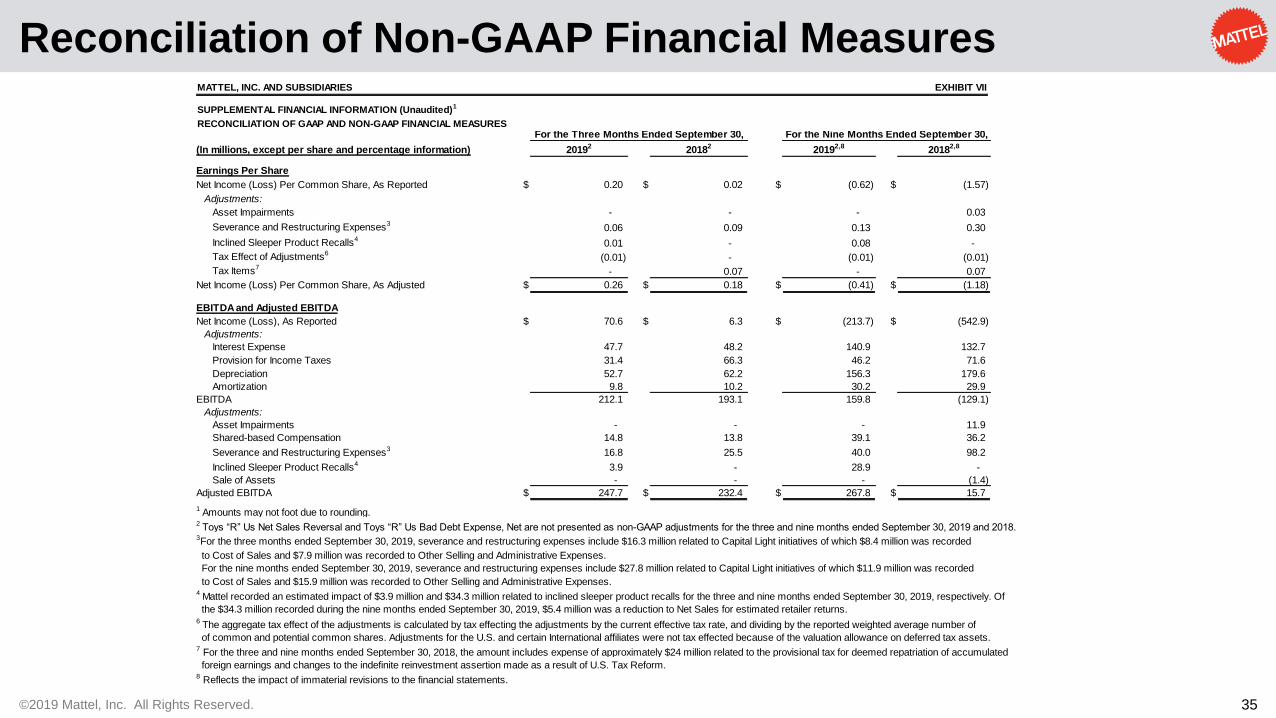
Reconciliation of Non-GAAP Financial Measures
(In millions, except per share and percentage information) 20192 20182 20192,8 20182,8
Earnings Per Share
Net Income (Loss) Per Common Share, As Reported $ 0.20 $ 0.02 $ (0.62) $ (1.57)
Adjustments:
Asset Impairments - - - 0.03
Severance and Restructuring Expenses30.06 0.09 0.13 0.30
Inclined Sleeper Product Recalls40.01 - 0.08 -
Tax Effect of Adjustments6(0.01) - (0.01) (0.01)
Tax Items7 - 0.07 - 0.07
Net Income (Loss) Per Common Share, As Adjusted $ 0.26 $ 0.18 $ (0.41) $ (1.18)
EBITDA and Adjusted EBITDA
Net Income (Loss), As Reported $ 70.6 $ 6.3 $ (213.7) $ (542.9)
Adjustments:
Interest Expense 47.7 48.2 140.9 132.7
Provision for Income Taxes 31.4 66.3 46.2 71.6
Depreciation 52.7 62.2 156.3 179.6
Amortization 9.8 10.2 30.2 29.9
EBITDA 212.1 193.1 159.8 (129.1)
Adjustments:
Asset Impairments - - - 11.9
Shared-based Compensation 14.8 13.8 39.1 36.2
Severance and Restructuring Expenses3 16.8 25.5 40.0 98.2
Inclined Sleeper Product Recalls4 3.9 - 28.9 -
Sale of Assets - - - (1.4)
Adjusted EBITDA $ 247.7 $ 232.4 $ 267.8 $ 15.7
1 Amounts may not foot due to rounding.2 Toys “R” Us Net Sales Reversal and Toys “R” Us Bad Debt Expense, Net are not presented as non-GAAP adjustments for the three and nine months ended September 30, 2019 and 2018. 3For the three months ended September 30, 2019, severance and restructuring expenses include $16.3 million related to Capital Light initiatives of which $8.4 million was recorded
to Cost of Sales and $7.9 million was recorded to Other Selling and Administrative Expenses.
For the nine months ended September 30, 2019, severance and restructuring expenses include $27.8 million related to Capital Light initiatives of which $11.9 million was recorded
to Cost of Sales and $15.9 million was recorded to Other Selling and Administrative Expenses.4 Mattel recorded an estimated impact of $3.9 million and $34.3 million related to inclined sleeper product recalls for the three and nine months ended September 30, 2019, respectively. Of
the $34.3 million recorded during the nine months ended September 30, 2019, $5.4 million was a reduction to Net Sales for estimated retailer returns.6 The aggregate tax effect of the adjustments is calculated by tax effecting the adjustments by the current effective tax rate, and dividing by the reported weighted average number of
of common and potential common shares. Adjustments for the U.S. and certain International affiliates were not tax effected because of the valuation allowance on deferred tax assets.7 For the three and nine months ended September 30, 2018, the amount includes expense of approximately $24 million related to the provisional tax for deemed repatriation of accumulated
foreign earnings and changes to the indefinite reinvestment assertion made as a result of U.S. Tax Reform.8 Reflects the impact of immaterial revisions to the financial statements.
For the Three Months Ended September 30, For the Nine Months Ended September 30,
MATTEL, INC. AND SUBSIDIARIES EXHIBIT VII
SUPPLEMENTAL FINANCIAL INFORMATION (Unaudited)1
RECONCILIATION OF GAAP AND NON-GAAP FINANCIAL MEASURES
©2019 Mattel, Inc. All Rights Reserved. 36
Glossary of Non-GAAP Financial MeasuresTo supplement our financial results presented in accordance with generally accepted accounting principles in the United States (“GAAP”), Mattel presents certain non-GAAP financial measures within the meaning of Regulation G promulgated by the Securities and Exchange Commission. The non-GAAP financial measures that Mattel uses in this earnings release include Gross Sales, Adjusted Gross Profit, Adjusted Gross Margin, Adjusted Other Selling and Administrative Expenses, Adjusted Operating Income (Loss), Adjusted Earnings (Loss) Per Share, earnings before interest expense, taxes, depreciation and amortization (“EBITDA”), Adjusted EBITDA, and constant currency. Mattel uses these metrics to analyze its continuing operations and to monitor, assess and identify meaningful trends in its operating and financial performance, and each is discussed in detail below. Mattel believes that the disclosure of non-GAAP financial measures provides useful supplemental information to investors to be able to better evaluate ongoing business performance and certain components of the Company’s results. These measures are not, and should not be viewed as, substitutes for GAAP financial measures. Reconciliations of the non-GAAP financial measures to the most directly comparable GAAP financial measures are attached to our earnings release as exhibits and to this earnings slide presentation as an appendix.
Gross Sales
Gross Sales represent sales to customers, excluding the impact of Sales Adjustments. Net Sales, as reported, include the impact of Sales Adjustments, such as trade discounts and other allowances. Mattel
presents changes in Gross Sales as a metric for comparing its aggregate, categorical, brand and geographic results to highlight significant trends in Mattel’s business. Changes in Gross Sales are discussed
because, while Mattel records the details of such Sales Adjustments in its financial accounting systems at the time of sale, such Sales Adjustments are generally not associated with brands and individual
products, making Net Sales less meaningful. Since Sales Adjustments are determined by customer rather than at the brand level, Mattel believes that the disclosure of Gross Sales by categories and brand is
useful supplemental information for investors to be able to assess the performance of its underlying brands (e.g., Barbie) and also enhances their ability to compare sales trends over time.
Adjusted Gross Profit and Adjusted Gross Margin
Adjusted Gross Profit and Adjusted Gross Margin represent reported Gross Profit and Reported Gross Margin, respectively, adjusted to exclude asset impairments, severance and restructuring expenses and
the impact of the inclined sleeper product recalls. Adjusted Gross Margin represents Mattel’s Adjusted Gross Profit, as a percentage of Net Sales. Adjusted Gross Profit and Adjusted Gross Margin are
presented to provide additional perspective on underlying trends in Mattel’s core Gross Profit and Gross Margin, which Mattel believes is useful supplemental information for investors to be able to gauge and
compare Mattel’s current business performance from one period to another.
Adjusted Other Selling and Administrative Expenses
Adjusted Other Selling and Administrative Expenses represents Mattel’s Reported Other Selling and Administrative Expenses, adjusted to exclude asset impairments, non-recurring executive compensation,
severance and restructuring expenses, the impact of the inclined sleeper product recalls, and sale of assets, which are not part of Mattel’s core business. Adjusted Other Selling and Administrative Expenses is
presented to provide additional perspective on underlying trends in Mattel’s core other selling and administrative expenses, which Mattel believes is useful supplemental information for investors to be able to
gauge and compare Mattel’s current business performance from one period to another.
Adjusted Operating Income (Loss)
Adjusted Operating Income (Loss) represents Mattel’s reported Operating Loss, adjusted to exclude the impact of asset impairments, non-recurring executive compensation, severance and restructuring
expenses, sale of assets, and the impact of the inclined sleeper product recalls, which are not part of Mattel’s core business. Adjusted Operating Income (Loss) is presented to provide additional perspective on
underlying trends in Mattel’s core operating results, which Mattel believes is useful supplemental information for investors to be able to gauge and compare Mattel’s current business performance from one
period to another.
Adjusted Earnings (Loss) Per Share
Adjusted Earnings (Loss) Per Share represents Mattel’s Reported Diluted Earnings (Loss) Per Common Share, adjusted to exclude the impact of asset impairments, severance and restructuring expenses,
and the impact of the inclined sleeper product recalls, which are not part of Mattel’s core business. The aggregate tax effect of the adjustments is calculated by tax effecting the adjustments by the current
effective tax rate, adjusting for certain discrete tax items, and dividing by the reported weighted average number of common shares. Adjusted Earnings (Loss) Per Share is presented to provide additional
perspective on underlying trends in Mattel’s core business. Mattel believes it is useful supplemental information for investors to gauge and compare Mattel’s current earnings results from one period to another.
Adjusted Earnings (Loss) Per Share is a performance measure and should not be used as a measure of liquidity.
©2019 Mattel, Inc. All Rights Reserved. 37
Glossary of Non-GAAP Financial MeasuresEBITDA and Adjusted EBITDAEBITDA represents Mattel’s Net Income (Loss), adjusted to exclude the impact of interest expense, taxes, depreciation and amortization. Adjusted EBITDA represents EBITDA adjusted to exclude the impact of asset impairments, share-based compensation, severance and restructuring expenses, sale of assets, and the impact of the inclined sleeper product recalls, which are not part of Mattel’s core business. Mattel believes EBITDA and Adjusted EBITDA are useful supplemental information for investors to gauge and compare Mattel’s business performance to other companies in our industry with similar capital structures. The presentation of Adjusted EBITDA differs from how we will calculate EBITDA for purposes of covenant compliance under the indenture governing our 6.75% senior notes due 2025 and the syndicated facility agreement governing our senior secured revolving credit facilities. Because of these limitations, EBITDA and Adjusted EBITDA should not be considered as measures of discretionary cash available to us to invest in the growth of our business. As a result, we rely primarily on our GAAP results and use EBITDA and Adjusted EBITDA only supplementally.
Constant currencyPercentage changes in results expressed in constant currency are presented excluding the impact from changes in currency exchange rates. To present this information, Mattel calculates constant currency information by translating current period and prior period results for entities reporting in currencies other than the US dollar using consistent exchange rates. The constant currency exchange rates are determined by Mattel at the beginning of each year and are applied consistently during the year. They are generally different from the actual exchange rates in effect during the current or prior period due to volatility in actual foreign exchange rates. Mattel considers whether any changes to the constant currency rates are appropriate at the beginning of each year. The exchange rates used for these constant currency calculations are generally based on prior year actual exchange rates. The difference between the current period and prior period results using the consistent exchange rates reflects the changes in the underlying performance results, excluding the impact from changes in currency exchange rates. Mattel analyzes constant currency results to provide additional perspective on changes in underlying trends in Mattel’s operating performance. Mattel believes that the disclosure of the percentage change in constant currency is useful supplemental information for investors to be able to gauge Mattel’s current business performance and the longer-term strength of its overall business since foreign currency changes could potentially mask underlying sales trends. The disclosure of the percentage change in constant currency enhances investor’s ability to compare financial results from one period to another.


