28
Third quarter 2021 report November 3, 2021

Third quarter 2021 report
November 3, 2021

Third quarter report 20213Q21 Odfjell Group
| Page
Highlights – 3Q21
• Strong market in the eastern hemisphere, but challenging market in the west
• Timecharter earnings in Odfjell Tankers of USD 125 mill compared to USD 123 mill 2Q21
• Net result contribution from Odfjell Terminals of USD 1 mill, in line with previous quarter
• Impairment of USD 21 mill related to sale agreement of our last remaining short-sea regional vessels in Asia
• EBIT of USD -7 mill compared to USD 11 mill 2Q21
• Net result of USD -25 mill compared to USD -8 mill 2Q21
• Adjusted for one offs, the 3Q21 net result of USD -4 mill compared to adjusted net result of USD -10 mill in the previous quarter
• We are entering COA renewal season. In 3Q21 we only renewed a
minor part of our portfolio, but at an average rate increase of 5%
Subsequent events
• Concluded the sale of our two Ethylene/LPG carriers to BW EPIC Kosan Ltd with proceeds received partly in cash and partly in freely transferable shares
• Entered into a sales agreement for the sale of three short-sea vessels. This will mark the exit of Odfjell's presence in the short-seal trade in Asia
• Distribution of USD 6 mill from Den Norske Krigsforsikring for Skib to be booked in our 4Q21 results
Key figures, USD mill
*Includes figures from Odfjell Gas** Based on 78.6 million outstanding shares*** Ratios are annualised
“The chemical tanker market was strong in the eastern hemisphere, but continued supply disruptions in the west (in particular the US) remain a challenge. Fundamental demand is high, which supports our positive outlook. The exit from Gas and our last short-sea vessels operating in Asia concludes the streamlining of our deep-sea platform. There are signs of improvements in our markets, but it will take time for a recovery to materialize and we therefore expect the underlying results in 4Q21 to be in line with 3Q21".
Kristian Mørch, CEO Odfjell SE
(USD mill, unaudited) 4Q20 1Q21 2Q21 3Q21 3Q20 YTD21 YTD20
Timecharter earnings 125.0 120.4 123.4 125.0 128.4 368.8 387.5Total opex, TC, G&A (65.9) (67.9) (67.3) (68.1) (64.5) (203.4) (192.0)Net result from JV's 0.0 0.8 0.5 1.1 0.9 2.5 13.5EBITDA 59.0 53.2 56.6 58.2 64.9 167.9 209.0EBIT 17.6 7.8 11.1 (6.8) 26.1 12.1 97.5Net financial items (19.9) (22.1) (18.3) (17.6) (21.1) (57.9) (63.9)Net result (2.6) (15.6) (7.8) (25.3) 3.9 (48.6) 30.4EPS** (0.03) (0.20) (0.10) (0.32) 0.05 (0.62) 0.39ROE*** (2.0 %) (9.9 %) (6.4 %) (7.7 %) 3.5 % (10.5 %) 6.7 %ROCE*** 3.6 % 1.5 % 2.1 % 1.6 % 5.4 % 1.1 % 6.7 %
2
Result development3Q21 Odfjell Group
| Page3
3Q21 EBIT
versus
2Q21 EBIT
(USDm)
11.11.6
(1.2)
2.2 0.6
(1.8)
(19.5)
(6.8)
2Q21 TCE TC Exp. Opex JV Netresult
G&A Depreciation 3Q21
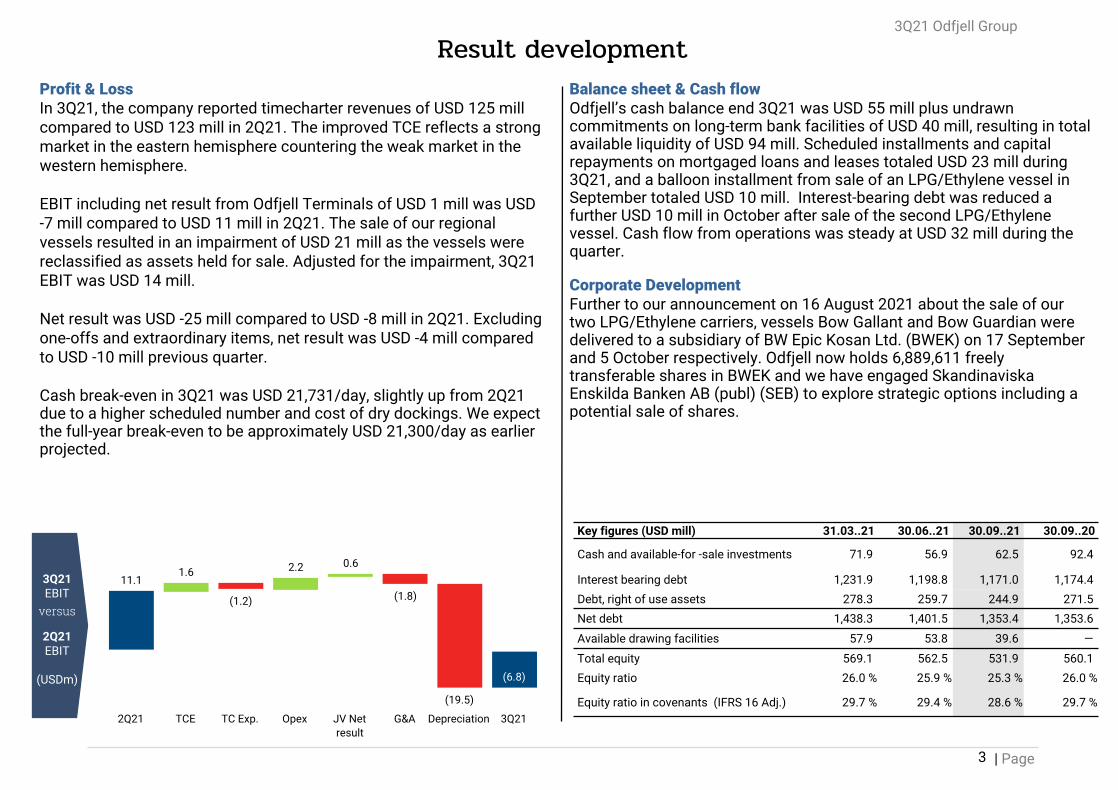
Profit & LossIn 3Q21, the company reported timecharter revenues of USD 125 mill compared to USD 123 mill in 2Q21. The improved TCE reflects a strong market in the eastern hemisphere countering the weak market in the western hemisphere.
EBIT including net result from Odfjell Terminals of USD 1 mill was USD -7 mill compared to USD 11 mill in 2Q21. The sale of our regional vessels resulted in an impairment of USD 21 mill as the vessels were reclassified as assets held for sale. Adjusted for the impairment, 3Q21 EBIT was USD 14 mill.
Net result was USD -25 mill compared to USD -8 mill in 2Q21. Excluding one-offs and extraordinary items, net result was USD -4 mill compared to USD -10 mill previous quarter.
Cash break-even in 3Q21 was USD 21,731/day, slightly up from 2Q21 due to a higher scheduled number and cost of dry dockings. We expect the full-year break-even to be approximately USD 21,300/day as earlier projected.
Balance sheet & Cash flowOdfjell’s cash balance end 3Q21 was USD 55 mill plus undrawn commitments on long-term bank facilities of USD 40 mill, resulting in total available liquidity of USD 94 mill. Scheduled installments and capital repayments on mortgaged loans and leases totaled USD 23 mill during 3Q21, and a balloon installment from sale of an LPG/Ethylene vessel in September totaled USD 10 mill. Interest-bearing debt was reduced a further USD 10 mill in October after sale of the second LPG/Ethylene vessel. Cash flow from operations was steady at USD 32 mill during the quarter.
Corporate DevelopmentFurther to our announcement on 16 August 2021 about the sale of our two LPG/Ethylene carriers, vessels Bow Gallant and Bow Guardian were delivered to a subsidiary of BW Epic Kosan Ltd. (BWEK) on 17 September and 5 October respectively. Odfjell now holds 6,889,611 freely transferable shares in BWEK and we have engaged Skandinaviska Enskilda Banken AB (publ) (SEB) to explore strategic options including a potential sale of shares.
Key figures (USD mill) 31.03..21 30.06..21 30.09..21 30.09..20
Cash and available-for -sale investments 71.9 56.9 62.5 92.4
Interest bearing debt 1,231.9 1,198.8 1,171.0 1,174.4 Debt, right of use assets 278.3 259.7 244.9 271.5 Net debt 1,438.3 1,401.5 1,353.4 1,353.6
Available drawing facilities 57.9 53.8 39.6 —
Total equity 569.1 562.5 531.9 560.1 Equity ratio 26.0 % 25.9 % 25.3 % 26.0 %
Equity ratio in covenants (IFRS 16 Adj.) 29.7 % 29.4 % 28.6 % 29.7 %
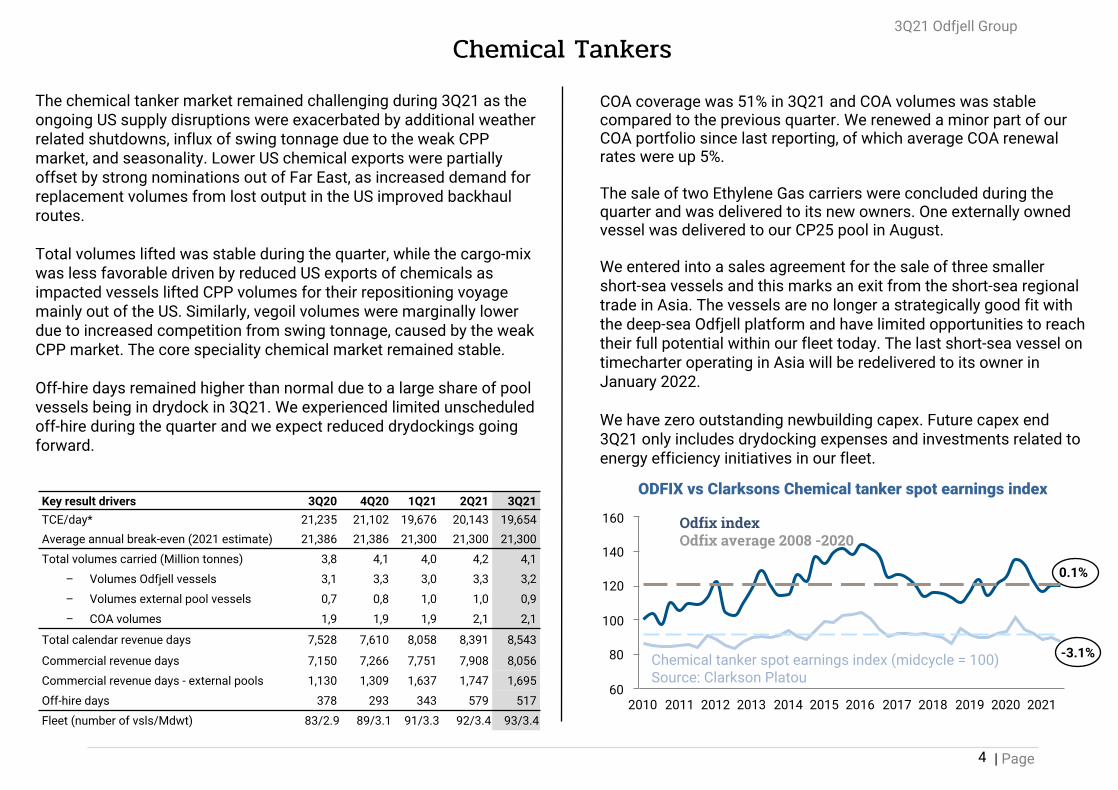
COA coverage was 51% in 3Q21 and COA volumes was stable compared to the previous quarter. We renewed a minor part of our COA portfolio since last reporting, of which average COA renewal rates were up 5%.
The sale of two Ethylene Gas carriers were concluded during the quarter and was delivered to its new owners. One externally owned vessel was delivered to our CP25 pool in August.
We entered into a sales agreement for the sale of three smaller short-sea vessels and this marks an exit from the short-sea regional trade in Asia. The vessels are no longer a strategically good fit with the deep-sea Odfjell platform and have limited opportunities to reach their full potential within our fleet today. The last short-sea vessel on timecharter operating in Asia will be redelivered to its owner in January 2022.
We have zero outstanding newbuilding capex. Future capex end 3Q21 only includes drydocking expenses and investments related to energy efficiency initiatives in our fleet.
3Q21 Odfjell Group
The chemical tanker market remained challenging during 3Q21 as the ongoing US supply disruptions were exacerbated by additional weather related shutdowns, influx of swing tonnage due to the weak CPP market, and seasonality. Lower US chemical exports were partially offset by strong nominations out of Far East, as increased demand for replacement volumes from lost output in the US improved backhaul routes.
Total volumes lifted was stable during the quarter, while the cargo-mix was less favorable driven by reduced US exports of chemicals as impacted vessels lifted CPP volumes for their repositioning voyage mainly out of the US. Similarly, vegoil volumes were marginally lower due to increased competition from swing tonnage, caused by the weak CPP market. The core speciality chemical market remained stable.
Off-hire days remained higher than normal due to a large share of pool vessels being in drydock in 3Q21. We experienced limited unscheduled off-hire during the quarter and we expect reduced drydockings going forward.
| Page
Chemical Tankers
4
Key result drivers 3Q20 4Q20 1Q21 2Q21 3Q21TCE/day* 21,235 21,102 19,676 20,143 19,654Average annual break-even (2021 estimate) 21,386 21,386 21,300 21,300 21,300
Total volumes carried (Million tonnes) 3,8 4,1 4,0 4,2 4,1
– Volumes Odfjell vessels 3,1 3,3 3,0 3,3 3,2
– Volumes external pool vessels 0,7 0,8 1,0 1,0 0,9
– COA volumes 1,9 1,9 1,9 2,1 2,1
Total calendar revenue days 7,528 7,610 8,058 8,391 8,543
Commercial revenue days 7,150 7,266 7,751 7,908 8,056
Commercial revenue days - external pools 1,130 1,309 1,637 1,747 1,695
Off-hire days 378 293 343 579 517
Fleet (number of vsls/Mdwt) 83/2.9 89/3.1 91/3.3 92/3.4 93/3.42010 2011 2012 2013 2014 2015 2016 2017 2018 2019 2020 2021
60
80
100
120
140
160
ODFIX vs Clarksons Chemical tanker spot earnings index
Odfix indexOdfix average 2008 -2020
Chemical tanker spot earnings index (midcycle = 100) Source: Clarkson Platou
-3.1%
0.1%

3Q21 Odfjell Group
| Page
OverviewDespite challenging circumstances due to Covid-19, all terminals managed by Odfjell continued to maintain safe and efficient operations.
Market developmentThe average commercial occupancy of the terminal portfolio ended at 93.9% in 3Q21, as compared to 94.8% in 2Q21. The negative variance mainly relates to a reduction in the occupancy level at the terminal in Korea.
The portfolio experienced another quarter of strong growth in throughput with 3Q21 ending with the highest throughput levels experienced since 1Q19. The pick-up largely relates to continued recovery at the terminal in Houston and high activity levels at the terminal in Antwerp.
The terminals in the US noted a strong quarter, with high demand for storage capacity and increased activity levels. The US market is still experiencing disruption in production and low inventory levels resulting in reduced exports and a focus on meeting local demand. With a build-up of inventory levels, we expect to see a continued recovery in export activity.
In Europe, we saw a continuation of the positive trend from 2Q21 with high demand for storage capacity at our terminal in Antwerp and healthy activity levels also in 3Q21.
In Asia, our terminal in Ulsan experienced another quarter with a reduction in occupancy levels. This was in part caused by lower production in the region and the continued threat of COVID-19 negatively impacting petrochemical and base oil demand. In 3Q21, the region was also negatively impacted by port congestion and bottlenecks in several key ports in China as well as power outages in selected areas.
Tank Terminals
Odfjell Terminals key figures (Odfjell share) 1Q21 2Q21 3Q21 3Q20 YTD21 FY20
Gross revenues 16.4 18.1 17.9 16.3 52.5 65.6Odfjell Terminals US EBITDA 4.3 5.1 5.6 5.4 15.0 21.1Odfjell Terminals Asia EBITDA 1.5 1.0 1.0 0.6 3.5 3.5Noord Natie Odfjell EBITDA 1.4 1.8 1.5 1.7 4.7 5.7Total Odfjell Terminals EBITDA* 7.1 7.6 7.9 7.8 22.7 30.0EBIT 1.3 1.3 2.3 2.2 4.9 17.7Net financials (1.8) (1.0) (1.0) (0.5) (2.9) (4.3)Net results 0.2 0.0 0.9 1.5 1.1 13.5Cash flow from operations (2.8) 3.6 5.8 7.6 6.5 27.6Cash flow from investments (5.1) (10.2) (5.4) (6.8) (20.7) (23.4)Cash flow from financing 8.2 (0.9) (1.8) 0.8 5.5 19.5Net debt 109.8 116.8 117.0 90.6 117.0 103.3Commercial average occupancy rate (%) 95.9 94.8 93.9 98.9 94.9 97.9Commercial available capacity (1,000 cbm) 1,146 1,143 1,154 1,147 1,154 1,148
5
Capital expenditure & expansions
▪ In Antwerp, the construction of an additional 35k cbm of stainless steel capacity is progressing according to schedule. The new tankpit will be operational during 2Q22
▪ The events in 4Q20 and 1Q21 at Houston have contributed to a delay in the engineering of the Bay 13 expansion project. Subject to final investment decision, commissioning of the new tank pit is scheduled for completion in 4Q23
▪ All CAPEX will be funded locally in the respective JVs
*Including corporate items
3Q21 Odfjell Group
| Page
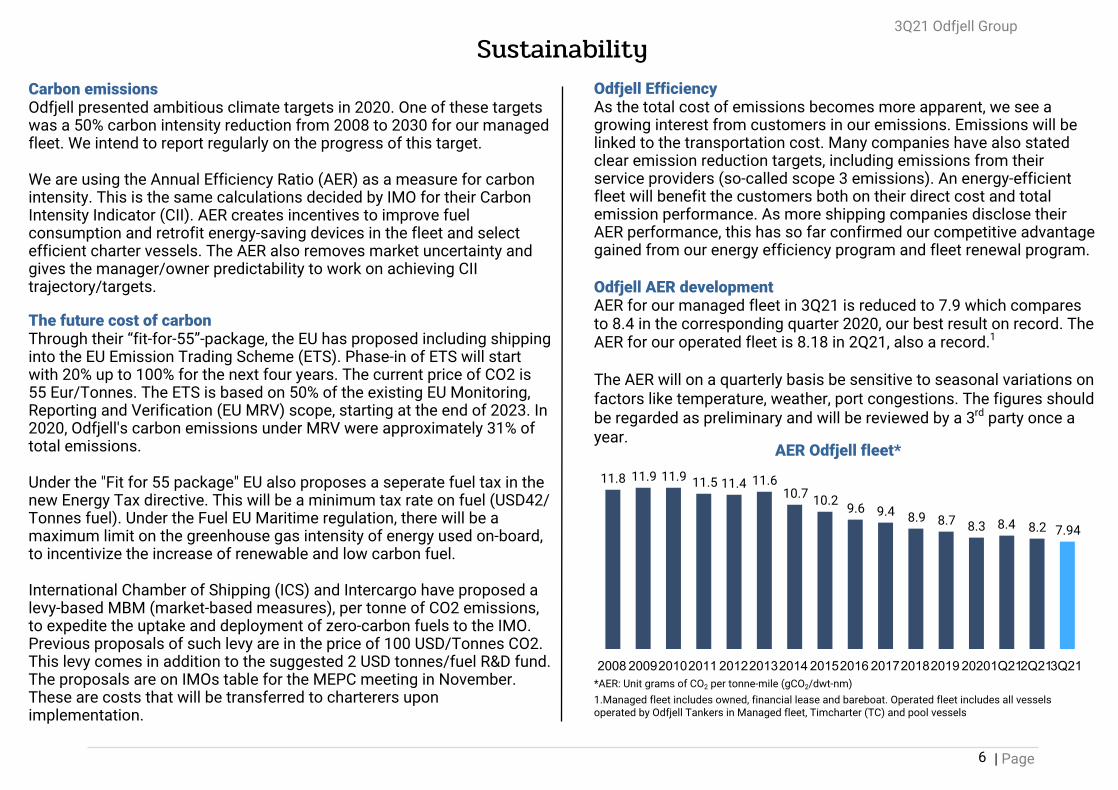
Carbon emissionsOdfjell presented ambitious climate targets in 2020. One of these targets was a 50% carbon intensity reduction from 2008 to 2030 for our managed fleet. We intend to report regularly on the progress of this target.
We are using the Annual Efficiency Ratio (AER) as a measure for carbon intensity. This is the same calculations decided by IMO for their Carbon Intensity Indicator (CII). AER creates incentives to improve fuel consumption and retrofit energy-saving devices in the fleet and select efficient charter vessels. The AER also removes market uncertainty and gives the manager/owner predictability to work on achieving CII trajectory/targets.
The future cost of carbonThrough their “fit-for-55”-package, the EU has proposed including shipping into the EU Emission Trading Scheme (ETS). Phase-in of ETS will start with 20% up to 100% for the next four years. The current price of CO2 is 55 Eur/Tonnes. The ETS is based on 50% of the existing EU Monitoring, Reporting and Verification (EU MRV) scope, starting at the end of 2023. In 2020, Odfjell's carbon emissions under MRV were approximately 31% of total emissions.
Under the "Fit for 55 package" EU also proposes a seperate fuel tax in the new Energy Tax directive. This will be a minimum tax rate on fuel (USD42/Tonnes fuel). Under the Fuel EU Maritime regulation, there will be a maximum limit on the greenhouse gas intensity of energy used on-board, to incentivize the increase of renewable and low carbon fuel.
International Chamber of Shipping (ICS) and Intercargo have proposed a levy-based MBM (market-based measures), per tonne of CO2 emissions, to expedite the uptake and deployment of zero-carbon fuels to the IMO. Previous proposals of such levy are in the price of 100 USD/Tonnes CO2. This levy comes in addition to the suggested 2 USD tonnes/fuel R&D fund. The proposals are on IMOs table for the MEPC meeting in November. These are costs that will be transferred to charterers upon implementation.
Sustainability
6
Odfjell AER development AER for our managed fleet in 3Q21 is reduced to 7.9 which compares to 8.4 in the corresponding quarter 2020, our best result on record. The AER for our operated fleet is 8.18 in 2Q21, also a record.1
The AER will on a quarterly basis be sensitive to seasonal variations on factors like temperature, weather, port congestions. The figures should be regarded as preliminary and will be reviewed by a 3rd party once a year.
11.8 11.9 11.9 11.5 11.4 11.610.7 10.2 9.6 9.4 8.9 8.7 8.3 8.4 8.2 7.94
2008 200920102011 201220132014 20152016 201720182019 20201Q212Q213Q21
AER Odfjell fleet*
*AER: Unit grams of CO2 per tonne-mile (gCO2/dwt-nm)1.Managed fleet includes owned, financial lease and bareboat. Operated fleet includes all vessels operated by Odfjell Tankers in Managed fleet, Timcharter (TC) and pool vessels
Odfjell EfficiencyAs the total cost of emissions becomes more apparent, we see a growing interest from customers in our emissions. Emissions will be linked to the transportation cost. Many companies have also stated clear emission reduction targets, including emissions from their service providers (so-called scope 3 emissions). An energy-efficient fleet will benefit the customers both on their direct cost and total emission performance. As more shipping companies disclose their AER performance, this has so far confirmed our competitive advantage gained from our energy efficiency program and fleet renewal program.

3Q21 Odfjell Group
| Page
Prospects
7
Market outlookThe global economy continued to expand at a healthy but more muted rate during 3Q21. Increasing vaccination rates and continued easing of lockdown restrictions were partially offset by supply chain issues leading to strained manufacturing activities and potential risks of a slowdown in leading economies. IMF projects the global economy to grow by 5.9% in 2021 and 4.9% in 2022. The consensus remains unchanged and the global economy will be led by advanced economies, driven by faster vaccine rollouts and policy support.
The ongoing weakness in crude and CPP markets continues to impede a recovery in the chemical tanker market. Although uncertainty regarding when these markets will rebound persists, there are indicators that point to improved markets going forward. Stronger crude and CPP markets are expected to reduce supply pressure from swing tonnage in the chemical tanker market.
The rising energy prices have increased the relative competitiveness of US chemical producers by driving up the cost base in Europe and NE Asia. Naphtha prices are still more than double in Asia and Europe compared with US ethane and the current trend remains supportive of increased US exports once supply chain issues ease. This combined with new export-oriented chemical plants ramping up production in the US and Middle East is expected to support strong tonne-mile demand growth in the years to come.
Interest for newbuilding orders remains limited due to weak markets, emission regulations and uncertainty regarding future propulsion systems. This combined with an aging fleet is expected to limit fleet growth for chemical tankers through 2023.
We forecast annual chemical tanker demand growth to average 4% between 2021 and 2023, which compares to supply growth of 1% per year on average in the corresponding time period.
Bergen, 19 August 2021THE BOARD OF DIRECTORS OF ODFJELL SE
4Q21 guidanceThere are signs of improvements in our markets, but it will take time for a recovery to materialize and we therefore expect the underlying results in 4Q21 to be in line with 3Q21.
Bergen, 3 November 2021
THE BOARD OF DIRECTORS OF ODFJELL SE
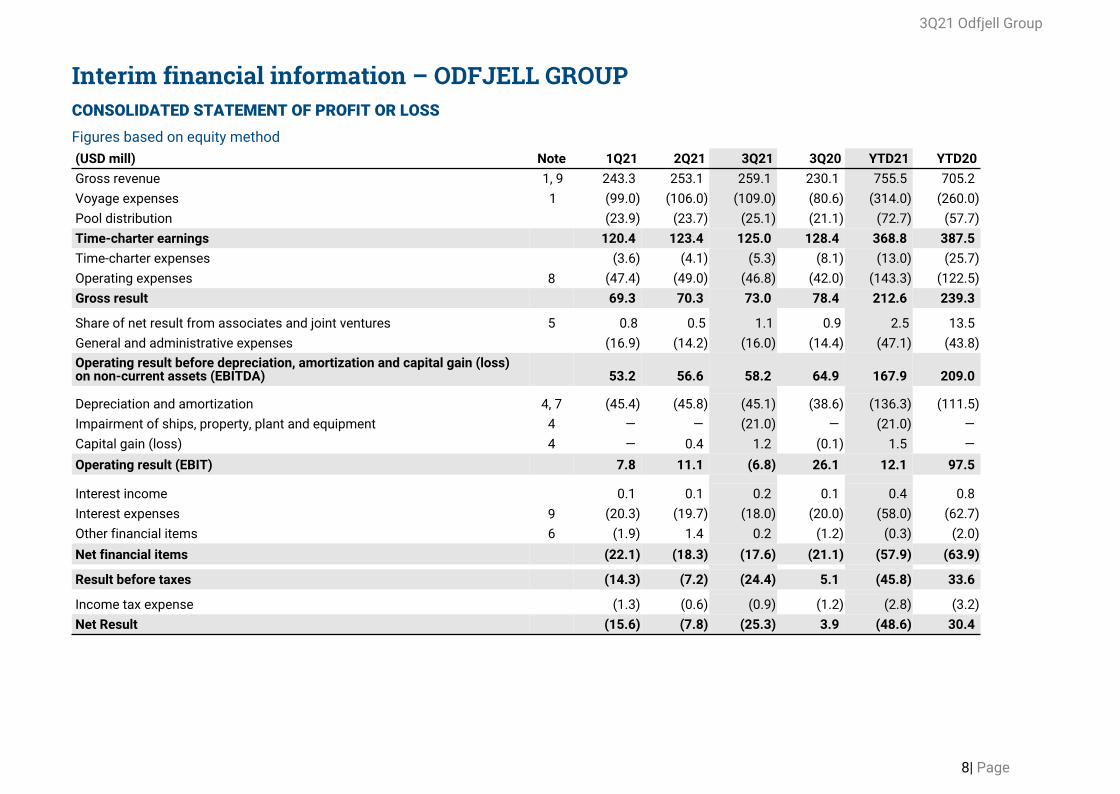
Interim financial information – ODFJELL GROUPCONSOLIDATED STATEMENT OF PROFIT OR LOSSFigures based on equity method(USD mill) Note 1Q21 2Q21 3Q21 3Q20 YTD21 YTD20Gross revenue 1, 9 243.3 253.1 259.1 230.1 755.5 705.2 Voyage expenses 1 (99.0) (106.0) (109.0) (80.6) (314.0) (260.0) Pool distribution (23.9) (23.7) (25.1) (21.1) (72.7) (57.7) Time-charter earnings 120.4 123.4 125.0 128.4 368.8 387.5 Time-charter expenses (3.6) (4.1) (5.3) (8.1) (13.0) (25.7) Operating expenses 8 (47.4) (49.0) (46.8) (42.0) (143.3) (122.5) Gross result 69.3 70.3 73.0 78.4 212.6 239.3
Share of net result from associates and joint ventures 5 0.8 0.5 1.1 0.9 2.5 13.5 General and administrative expenses (16.9) (14.2) (16.0) (14.4) (47.1) (43.8) Operating result before depreciation, amortization and capital gain (loss) on non-current assets (EBITDA) 53.2 56.6 58.2 64.9 167.9 209.0
Depreciation and amortization 4, 7 (45.4) (45.8) (45.1) (38.6) (136.3) (111.5) Impairment of ships, property, plant and equipment 4 — — (21.0) — (21.0) — Capital gain (loss) 4 — 0.4 1.2 (0.1) 1.5 — Operating result (EBIT) 7.8 11.1 (6.8) 26.1 12.1 97.5
Interest income 0.1 0.1 0.2 0.1 0.4 0.8 Interest expenses 9 (20.3) (19.7) (18.0) (20.0) (58.0) (62.7) Other financial items 6 (1.9) 1.4 0.2 (1.2) (0.3) (2.0) Net financial items (22.1) (18.3) (17.6) (21.1) (57.9) (63.9)
Result before taxes (14.3) (7.2) (24.4) 5.1 (45.8) 33.6
Income tax expense (1.3) (0.6) (0.9) (1.2) (2.8) (3.2) Net Result (15.6) (7.8) (25.3) 3.9 (48.6) 30.4
3Q21 Odfjell Group
8| Page
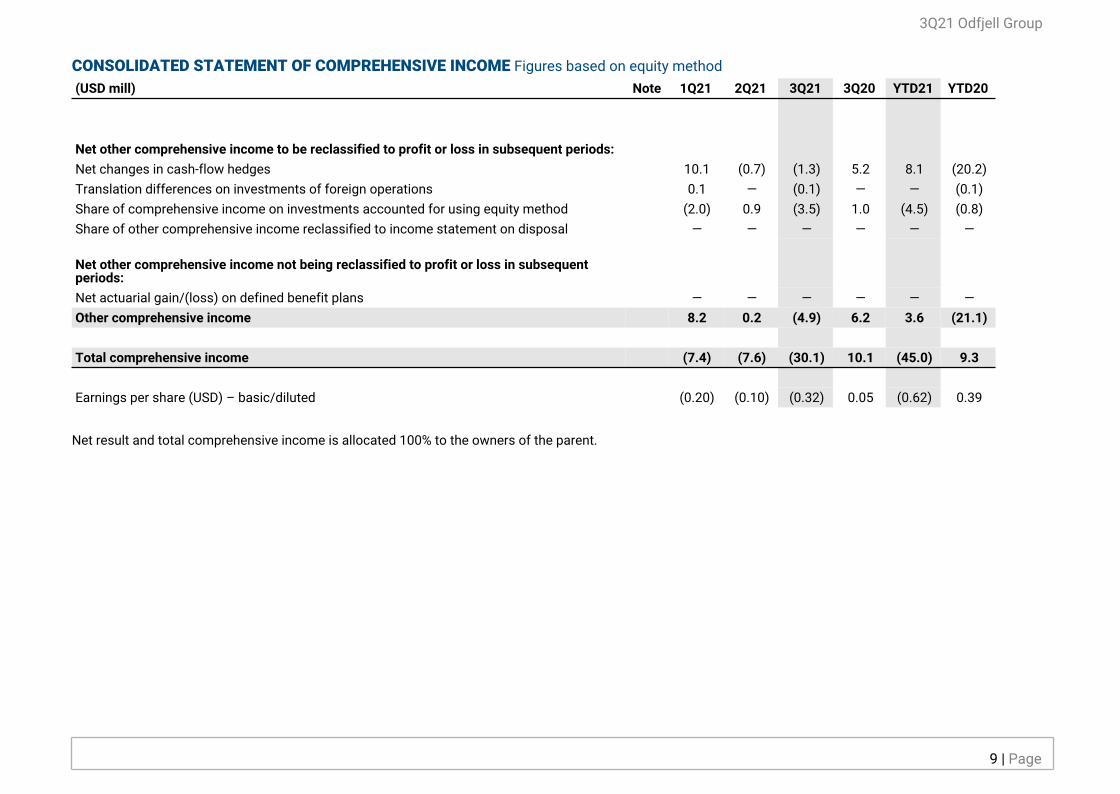
CONSOLIDATED STATEMENT OF COMPREHENSIVE INCOME Figures based on equity method(USD mill) Note 1Q21 2Q21 3Q21 3Q20 YTD21 YTD20
Net other comprehensive income to be reclassified to profit or loss in subsequent periods: Net changes in cash-flow hedges 10.1 (0.7) (1.3) 5.2 8.1 (20.2)Translation differences on investments of foreign operations 0.1 — (0.1) — — (0.1)Share of comprehensive income on investments accounted for using equity method (2.0) 0.9 (3.5) 1.0 (4.5) (0.8)Share of other comprehensive income reclassified to income statement on disposal — — — — — —
Net other comprehensive income not being reclassified to profit or loss in subsequent periods:Net actuarial gain/(loss) on defined benefit plans — — — — — —Other comprehensive income 8.2 0.2 (4.9) 6.2 3.6 (21.1)
Total comprehensive income (7.4) (7.6) (30.1) 10.1 (45.0) 9.3
Earnings per share (USD) – basic/diluted (0.20) (0.10) (0.32) 0.05 (0.62) 0.39
Net result and total comprehensive income is allocated 100% to the owners of the parent.
3Q21 Odfjell Group
9 | Page

CONSOLIDATED STATEMENT OF FINANCIAL POSITION (Figures based on equity method) (USD mill) Note 31.03.21 30.06.21 30.09.21 30.09.20 31.12.20Deferred tax assets 0.7 0.9 0.9 0.5 0.7Ships 4 1,531.1 1,509.8 1,413.2 1,483.5 1,515.1Property, plant and equipment 4 9.7 9.4 9.2 9.7 9.7Right of use assets 7 266.9 247.3 232.1 261.4 258.8Investments in associates and joint ventures 5 181.2 179.8 177.6 174.4 200.4Derivative financial instruments 1.1 0.7 0.3 0.2 1.7Non-current receivables 4.6 4.7 4.6 9.7 6.6Total non-current assets 1,995.2 1,952.7 1,837.8 1,939.5 1,993.0
Current receivables 123.9 121.5 125.9 101.6 92.1Bunkers and other inventories 32.3 34.9 38.1 21.5 25.2Derivative financial instruments 8.2 7.5 4.2 — 6.7Available-for-sale investment — — 7.8 — —Cash and cash equivalents 3 71.9 56.9 54.6 92.4 103.1Assets classified as held for sale 4 — — 37.7 — —Total current assets 236.3 220.9 268.4 215.4 227.1
Total assets 2,231.4 2,173.6 2,106.2 2,154.9 2,220.1
Equity 569.1 562.5 531.9 560.1 575.9
Non-current interest bearing debt 3 1,132.1 1,005.2 981.2 1,006.7 1,059.8Non-current debt, right of use assets 7 220.6 201.9 187.2 222.3 209.6Derivatives financial instruments 19.9 20.2 20.4 37.4 25.7Other non-current liabilities 9.1 7.3 7.0 5.6 6.9Total non-current liabilities 1,381.7 1,234.6 1,195.8 1,271.9 1,301.9
Current portion interest bearing debt 3 99.8 193.5 189.8 167.8 178.8Current debt, right of use assets 7 57.7 57.8 57.7 49.2 59.6Derivative financial instruments 6.0 6.4 9.1 26.2 8.4Other current liabilities 117.1 118.8 122.0 79.7 95.5Total current liabilities 280.6 376.5 378.5 322.9 342.3
Total equity and liabilities 2,231.4 2,173.6 2,106.2 2,154.9 2,220.1
3Q21 Odfjell Group
10 | Page

CONSOLIDATED STATEMENT OF CHANGES IN EQUITYFigures based on equity method
(USD mill) Paid in equity
Exchange rate
differences
Cash-flow hedge
reserves
Pension remeasure
-ment
OCI associates
and JVsRetained
equityTotal other
equity Total equity
Equity as per January 1, 2020 199.2 0.3 (13.7) (1.2) 4.7 361.9 351.9 551.2Other comprehensive income — — (7.7) (0.5) 5.9 — (2.4) (2.4)Net result — — — — — 27.8 27.8 27.8Dividend payment — — — — — — — —Sale of treasury shares — — — — — — — —Other adjustments — — — (0.2) — (0.5) (0.7) (0.7)Equity as at December 31, 2020 199.2 0.3 (21.4) (1.9) 10.6 389.2 376.7 575.9
Equity as per January 1, 2021 199.2 0.3 (21.4) (1.9) 10.6 389.2 376.7 575.9Other comprehensive income — 0.1 8.0 — (4.5) — 3.6 3.6Net result — — — — — (48.7) (48.7) (48.7)Sale of treasury shares 1) — — — — — 0.4 0.4 0.4Other adjustments — — — — — 0.5 0.5 0.5Equity as at September 30, 2021 199.2 0.4 (13.4) (1.9) 6.1 341.5 332.6 531.9
(1) In the first quarter of 2021 senior management received a total of 137,127 shared related to long-term incentive programs for a total value of NOK 3.6 million.
3Q21 Odfjell Group
11 | Page
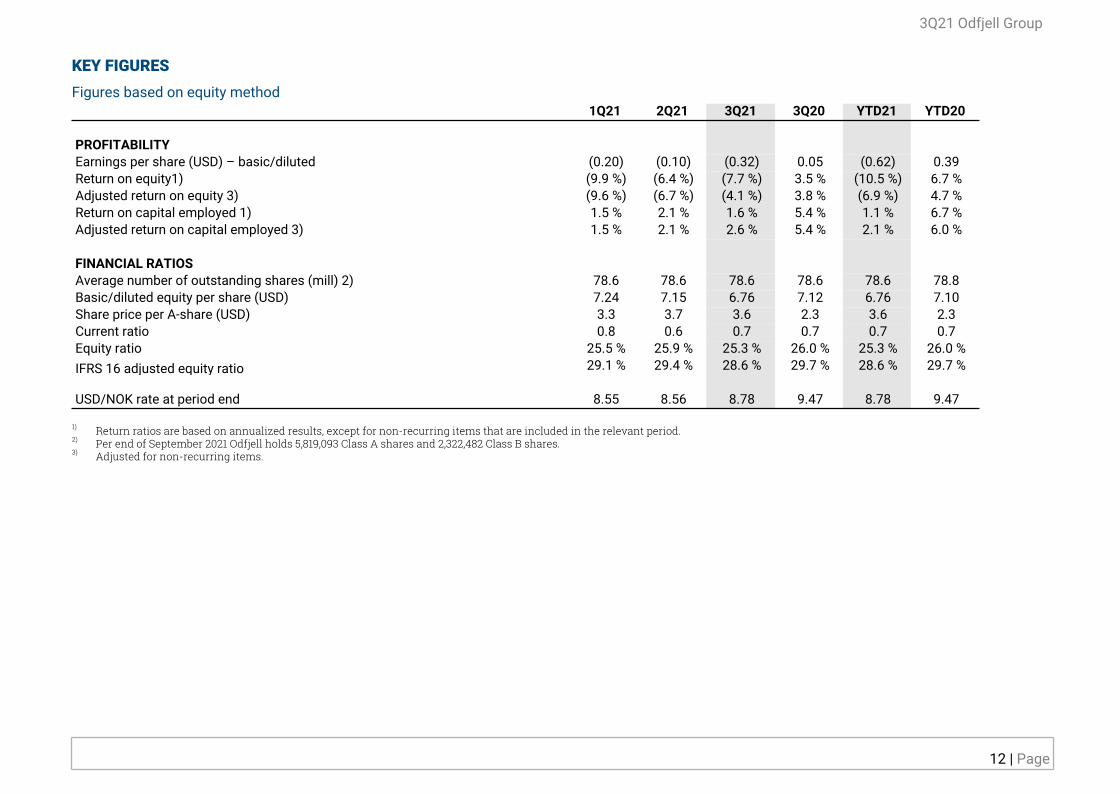
KEY FIGURES Figures based on equity method
1Q21 2Q21 3Q21 3Q20 YTD21 YTD20
PROFITABILITYEarnings per share (USD) – basic/diluted (0.20) (0.10) (0.32) 0.05 (0.62) 0.39Return on equity1) (9.9 %) (6.4 %) (7.7 %) 3.5 % (10.5 %) 6.7 %Adjusted return on equity 3) (9.6 %) (6.7 %) (4.1 %) 3.8 % (6.9 %) 4.7 %Return on capital employed 1) 1.5 % 2.1 % 1.6 % 5.4 % 1.1 % 6.7 %Adjusted return on capital employed 3) 1.5 % 2.1 % 2.6 % 5.4 % 2.1 % 6.0 %
FINANCIAL RATIOSAverage number of outstanding shares (mill) 2) 78.6 78.6 78.6 78.6 78.6 78.8Basic/diluted equity per share (USD) 7.24 7.15 6.76 7.12 6.76 7.10Share price per A-share (USD) 3.3 3.7 3.6 2.3 3.6 2.3Current ratio 0.8 0.6 0.7 0.7 0.7 0.7Equity ratio 25.5 % 25.9 % 25.3 % 26.0 % 25.3 % 26.0 %IFRS 16 adjusted equity ratio 29.1 % 29.4 % 28.6 % 29.7 % 28.6 % 29.7 %
USD/NOK rate at period end 8.55 8.56 8.78 9.47 8.78 9.47
1) Return ratios are based on annualized results, except for non-recurring items that are included in the relevant period.2) Per end of September 2021 Odfjell holds 5,819,093 Class A shares and 2,322,482 Class B shares.3) Adjusted for non-recurring items.
3Q21 Odfjell Group
12 | Page

CONSOLIDATED CASH FLOW STATEMENTFigures based on equity method
(USD mill) 1Q21 2Q21 3Q21 3Q20 YTD21 YTD20
Profit before income taxes (14.3) (7.2) (24.3) 5.1 (45.8) 33.6 Taxes paid in the period (1.5) (0.8) (0.9) (1.4) (3.3) (3.3) Depreciation, impairment and capital (gain) loss fixed assets 45.6 45.7 65.2 38.6 156.4 111.6 Change in inventory, trade debtors and creditors (increase) decrease (20.2) 7.7 (3.6) (10.1) (16.2) (8.5) Share of net result from associates and JV's (0.8) (0.5) (1.2) (0.9) (2.5) (13.5) Net interest expenses 20.2 19.6 17.9 19.9 57.6 61.9 Interest received 0.1 0.1 0.2 0.1 0.4 0.9 Interest paid (18.7) (19.6) (18.1) (20.5) (56.5) (63.5) Effect of exchange differences and changes in unrealized derivatives 1.6 0.1 (4.2) (0.4) (2.6) 1.3 Change in other current accruals 7.4 (8.1) 4.0 (0.3) 3.4 (4.7) Net cash-flow from operating activities 19.3 37.0 34.8 30.1 91.0 115.9 Sale of ships, property, plant and equipment 2) — — 10.1 — 10.1 4.1 Investment in ships, property, plant and equipment (10.5) (8.4) (8.7) (48.2) (27.6) (150.3) Dividend/other from investments in associates and JV’s — 2.9 — — 2.9 1.4 Acquisition of subsidiary 1) (11.7) — — — (11.7) — Other non-current receivables and investments 1.0 0.5 0.6 (0.5) 2.2 3.4 Net cash-flow from investing activities (21.1) (5.0) 2.0 (48.7) (24.1) (141.3) New interest bearing debt (net of fees paid) 121.2 69.1 — 127.9 190.3 260.4 Repayment of interest bearing debt (114.3) (101.8) (33.8) (101.7) (249.9) (153.4) Repayment of drawing facilities (20.0) — 10.1 (50.0) (9.9) (50.0) Repayment of lease debt related to right of use assets (15.6) (14.8) (14.8) (13.5) (45.1) (38.0) Net cash-flow from financing activities (28.6) (47.5) (38.5) (37.4) (114.6) 19.0 Effect on cash balance from currency exchange rate fluctuations (0.7) 0.6 (0.6) — (0.7) (2.0) Net change in cash and cash equivalents (31.2) (15.0) (2.3) (56.0) (48.5) (8.4) Opening cash and cash equivalents 103.1 71.9 56.9 148.4 103.1 100.8 Closing cash and cash equivalents 71.9 56.9 54.6 92.4 54.6 92.4
3Q21 Odfjell Group
13 | Page

1) Odfjell SE purchased the remaining 50 % of shares in Odfjell Gas AS in March 2021. The purchase price was USD 16.7 million, fully settled in cash. Cash and cashequivalents in the Odfjell Gas group at the time of purchase was USD 4.9 million for a net cash outflow of USD 11.7 million, presented under investing activities.
Through the purchase, the Group acquired two gas vessels for a total of USD 34.1 million and assumed current interest bearing debt of USD 6.8 million, see note 3 and 4.
2) Cash proceeds from the sale of the vessel Bow Gallant. An additional USD USD 7.8 million from the transaction was settled in shares in BW Epic Kosan Ltd. and isclassified as an available-for-sale investment.
3Q21 Odfjell Group
14 | Page
NOTES TO THE INTERIM CONSOLIDATED FINANCIAL STATEMENTS
Note 1 – Accounting principlesOdfjell SE is ultimate parent company of the Odfjell Group. Odfjell SE is a public listed company traded on the Oslo Stock Exchange. The company’s address is Conrad Mohrs veg 29, Bergen, Norway.
Basis of preparation and changes to the Group’s accounting policies
The interim consolidated financial statements ended September 30, 2021 for the Odfjell Group and have been prepared in accordance with International Accounting Standard IAS 34 “Interim Financial Reporting”. The interim financial statements do not include all the information and disclosures required in the annual financial statements and should be read in conjunction with the Group’s annual financial statements as at December 31, 2020. The interim financial statements are unaudited.
The accounting principles used in the preparation of these financial statements are consistent with those used in the annual financial statements for the year ended December 31, 2020.
Impairment assessment
The Group last performed an impairment test at the end of 2020. The Group considers the relationship between its market capitalization and its book value, among other factors, when reviewing for indicators of impairment. As at September 30, 2021, the market capitalization of the Group was below the book value of its equity. As a result, the Group performed an impairment test at the end of the third quarter 2021 for the deep sea cash generating unit.
Deep sea The Group used the cash-generating unit’s value-in-use to determine the recoverable amount, which exceeded the carrying amount. Cash flows are estimated through the useful life of the owned ships and over the lease term for right of use assets, consistent with previous years impairment tests. The estimates for 2021 have been updated from our previous assessment, reflecting current market conditions. The Group has maintained its view of future earnings assumptions in subsequent periods as applied in the impairment test at year end 2020.
Performing impairment test, the Group has conducted three scenarios. The key uncertainties in all scenarios are related to the development of the economic recovery and potential effects of further Covid-19 outbreaks on our operations and the economy as a whole. Estimated time-charter earnings are aligned with our view of the long-term fundamental supply and demand of tonnage.
For all scenarios, the weighted average cost of capital is used as the discount rate. The discount rate used is 7.8 %. This is also an assumption when performing the impairment assessment.
The book value of the cash generating unit is USD 1,645 million. The impairment test did not reveal any need for impairment.
RegionalThe regional cash generating unit has been reclassified to assets held for sale. An impairment loss of USD 21 million has been recognized in connection to the agreed-upon sale.
Investment in terminalsThe estimated cash flows used when performing impairment test at the end of 2020 have been updated and do not reveal any need for impairment at the end of the third quarter.
3Q21 Odfjell Group
15 | Page

Changes in presentationAs of the first quarter of 2021, Odfjell has changed it's presentation of expenses related to IFRS 16 by aggregating them into their related line items. The information will be made available in separate disclosures which are listed below. The changes made relate to the following line items:
'Operating expenses' and 'Operating expenses, right of use assets' are now aggregated into a single line item. The information is now shown in note 8.
'Depreciation and amortization' and 'Depreciation expense, right of use assets' are now aggregated into a single line item. The information is now shown in note 4.
'Interest expenses' and Interest expenses, right of use assets' are now aggregated into a single line item. The information is now shown in note 9.
Acquisition of shares in Odfjell Gas AS
The acquisition of the shares in Odfjell Gas AS is considered an asset acquisition and not a business combination. The acquisition of the 50% of the shares in March 2021 is booked at fair value. The cost price of the two gas vessels was booked at historical cost until the third quarter of 2021, where one vessel was sold and the other reclassified to assets held for sale awaiting final delivery in October.
Assets held for sale
The Group has finalized a sale of the vessel Bow Guardian in October, and has agreed to sell the Asia regional vessels to be finalized this year. A total of USD 37.7 million has been reclassified to assets held for sale as a result of the agreed-upon transactions.
Available-for-sale investments
The sale of Bow Gallant was partly settled in equity, resulting in shares received for a total of USD 7.8 million using the market value at the closing date of the transaction. The shares are classified as an available-for-sale investment and subsequent changes in the fair value will be booked through profit or loss.
3Q21 Odfjell Group
16 | Page

Note 2 – Segment information Management has determined the operating segments based on the information regularly reviewed by executive management. In accordance with the internal financial reporting, investments in joint venture are reported by applying the proportionate consolidation method.
As of the first quarter of 2021, the Group has discontinued its reporting of the gas carriers segment as the two LPG/Ethylene carriers have been included in the chemical tankers segment in our internal reporting from this quarter. Comparative figures for the chemical tankers segment have been restated to include the Gas segment in accordance with IFRS 8. From the third quarter of 2021, one LPG carrier has been sold and the remaining reclassified to assets held for sale pending final delivery.
The Group therefore has two remaining reportable segments:
Chemical Tankers: The Chemical Tankers segment involves a ‘round the world’ transportation of chemicals with ships. The composition of the ships enables the Group to offer both global and regional transportation. The segment also includes corporate entities.
Tank Terminals: The tank terminal segment offers storage and distillation of various chemical and petroleum products. The segment is operated through joint ventures owned by the subsidiary Odfjell Terminals BV.
3Q21 Odfjell Group
17 | Page

Note 2 – Segment information - continued Chemical Tankers Tank Terminals Total
USD mill 1Q21 2Q21 3Q21 3Q20 1Q21 2Q21 3Q21 3Q20 1Q21 2Q21 3Q21 3Q20Gross revenue 243.0 252.8 258.8 231.4 16.4 18.1 17.9 16.3 259.4 270.9 276.7 247.7Voyage expenses (99.0) (106.0) (109.0) (81.3) — — — — (99.0) (106.0) (109.0) (81.3)Pool distribution (23.9) (23.7) (25.1) (21.1) — — — — (23.9) (23.7) (25.1) (21.1)TC earnings 120.1 123.1 124.7 129.0 16.4 18.1 17.9 16.3 136.4 141.2 142.7 145.3TC expenses (3.6) (4.1) (5.3) (8.1) — — — — (3.6) (4.1) (5.3) (8.1)
Operating expenses (41.0) (42.5) (40.9) (37.6) (6.6) (7.6) (7.1) (6.1) (47.6) (50.0) (48.0) (43.7)Operating expenses - right of use assets (6.4) (6.6) (6.0) (5.1) — — — — (6.4) (6.6) (6.0) (5.1)
General and adminstrative expenses (16.5) (13.6) (15.5) (14.4) (2.7) (2.9) (2.9) (2.4) (19.2) (16.5) (18.3) (16.8)EBITDA 52.6 56.4 57.2 63.9 7.1 7.6 7.9 7.8 59.7 64.0 65.1 71.7Depreciation (29.1) (29.7) (29.8) (24.4) (5.6) (6.0) (5.6) (5.3) (34.7) (35.7) (35.7) (29.8)Depreciation - right of use assets (16.1) (16.1) (15.3) (14.6) (0.2) (0.1) — (0.1) (16.3) (16.2) (15.3) (14.7)Impairment — — (21.0) — — — — — — — (21.0) —Capital gain/loss — 0.4 1.2 — — (0.3) — (0.1) — 0.1 1.5 (0.1)Operating result (EBIT) 7.4 10.9 (7.8) 24.8 1.3 1.3 2.3 2.2 8.7 12.2 (5.4) 27.1Net interest expense (16.6) (16.1) (14.7) (16.3) (0.7) (0.8) (0.8) (0.6) (17.3) (16.9) (15.5) (16.9)
Interest expense - right of use assets (3.6) (3.5) (3.2) (3.6) — — — — (3.6) (3.6) (3.2) (3.7)Other financial items (1.8) 1.4 0.3 (1.3) (0.2) (0.2) (0.2) 0.2 (2.0) 1.2 0.1 (1.2)Taxes (1.3) (0.4) (0.9) (1.1) (0.1) (0.3) (0.4) (0.3) (1.4) (0.8) (1.3) (1.4)Net result (15.8) (7.8) (26.2) 2.4 0.2 — 0.9 1.5 (15.6) (7.8) (25.3) 3.9Non current assets 1,814.0 1,772.9 1,660.2 1,780.1 325.5 329.6 329.3 292.0 2,139.5 2,102.5 1,989.5 2,072.9Cash and cash equivalents 67.8 51.3 50.0 88.6 39.5 31.9 30.5 47.0 107.3 83.3 80.5 135.6Other current assets 157.1 155.3 164.8 122.4 14.7 16.2 15.9 31.8 171.8 170.9 180.1 134.7Total assets 2,038.9 1,979.5 1,912.7 1,991.0 379.7 377.7 375.8 370.9 2,418.6 2,356.6 2,287.9 2,343.2Equity 404.7 397.1 368.8 397.0 164.4 165.4 163.0 163.7 569.1 562.5 531.9 560.1Non-current interest bearing debt 1,132.1 1,005.2 981.2 1,006.7 140.5 139.6 138.8 132.9 1,272.5 1,144.9 1,120.0 1,139.5Non-current debt, right of use assets 220.6 201.9 187.2 222.3 3.1 3.0 3.0 0.6 223.8 204.9 190.2 222.9Other non-current liabilities 26.9 27.3 27.4 43.0 29.8 29.5 28.6 27.2 56.7 56.9 56.0 70.1Current interest bearing debt 99.8 193.5 189.8 171.7 8.8 9.1 8.7 4.7 108.6 202.6 198.4 176.3Current debt, right of use assets 57.7 57.8 57.7 49.2 0.3 0.3 0.3 0.2 58.0 58.1 58.0 49.4Other current liabilities 97.2 96.5 100.7 101.1 32.7 30.8 33.3 41.7 129.9 126.7 133.4 124.8Total equity and liabilities 2,038.9 1,979.5 1,912.7 1,991.0 379.7 377.7 375.8 370.9 2,418.6 2,356.6 2,287.9 2,343.2Cashflow from operating activities 18.8 39.3 35.2 24.5 (2.8) 3.6 5.8 7.6 16.0 42.9 41.0 32.1Cashflow from investment activities (21.1) (7.9) 2.0 (48.7) (5.1) (10.2) (5.4) (6.8) (26.2) (18.1) (3.4) (55.5)Cashflow from financing activities (29.2) (47.9) (38.5) (31.9) 8.2 (0.9) (1.8) 0.8 (21.0) (48.8) (40.3) (31.1)Net change in cash and cash equivalents (31.5) (16.5) (1.3) (56.0) 0.2 (7.6) (1.4) 1.6 (31.3) (24.1) (2.7) (54.4)
3Q21 Odfjell Group
18 | Page

Note 2 – Segment information - reconciliation of segment reporting to group figures The following table reconciles reported revenue, EBIT, assets and liabilities in our segments to the income statement and statement of financial position.
Chemical Tankers (2) Tank Terminals Total (1)USD mill 1Q21 2Q21 3Q21 3Q20 1Q21 2Q21 3Q21 3Q20 1Q21 2Q21 3Q21 3Q20
Total segment revenue 243.0 252.8 258.8 231.4 16.4 18.1 17.9 16.3 259.4 270.9 276.7 247.7Segment revenue JV's — — — (1.7) (16.2) (17.9) (17.8) (15.9) (16.2) (17.9) (17.8) (17.6)
Consolidated revenue in income statement 243.0 252.8 258.8 229.7 0.2 0.2 0.2 0.4 243.1 252.9 259.0 230.1Total segment EBIT 7.4 10.9 (7.8) 24.8 1.3 1.3 2.3 2.2 8.7 12.2 (5.4) 27.1Segment EBIT JV's — — — 0.1 (1.5) (1.6) (2.5) (1.9) (0.4) (0.5) (0.2) (1.8)Share of net result JV's (4) — — — (0.2) (0.5) (0.5) (1.2) 1.1 (0.5) (0.5) (1.2) 0.9
Consolidated EBIT in income statement 7.4 10.9 (7.8) 24.8 (0.7) (0.9) (1.3) 1.4 7.8 11.1 (6.8) 26.2Total segment asset 2,038.9 1,979.5 1,912.7 1,991.0 379.7 377.7 375.8 370.9 2,418.6 2,356.6 2,287.9 2,343.2Segment asset (3) 2.0 0.8 (0.3) (19.5) (370.3) (363.7) (358.9) (364.3) (368.3) (362.9) (359.2) (362.7)Investment in JV's (4) — 0.1 0.1 15.6 181.2 179.9 177.6 158.8 181.2 179.8 177.6 174.4
Total consolidated assets in statement of financial position 2,041.0 1,980.3 1,912.5 1,987.1 190.5 193.9 194.5 165.4 2,231.4 2,173.6 2,106.2 2,154.9Total segment liabilities 1,634.3 1,582.2 1,543.9 1,595.9 215.2 212.3 212.8 207.2 1,862.3 1,808.7 1,773.3 1,783.1Segment liability (3) 2.0 0.8 (0.4) (19.5) (189.1) (183.7) (181.4) (204.0) (200.0) (197.6) (199.1) (188.3)
Total consolidated liabilities in statement of financial position 1,636.3 1,583.0 1,543.5 1,576.4 26.1 28.6 31.4 3.2 1,662.3 1,611.1 1,574.3 1,594.8
(1) The table is shown without eliminations, therefore Total doesn't equal sum of Chemical Tankers ad Tank Terminals..(2) This segment also includes «corporate».(3) Investments in joint ventures are presented according to the proportionate consolidation method in the segment reporting.(4) Investments in joint ventures are presented according to the equity method in the consolidated income statement and balance sheet.
3Q21 Odfjell Group
19 | Page
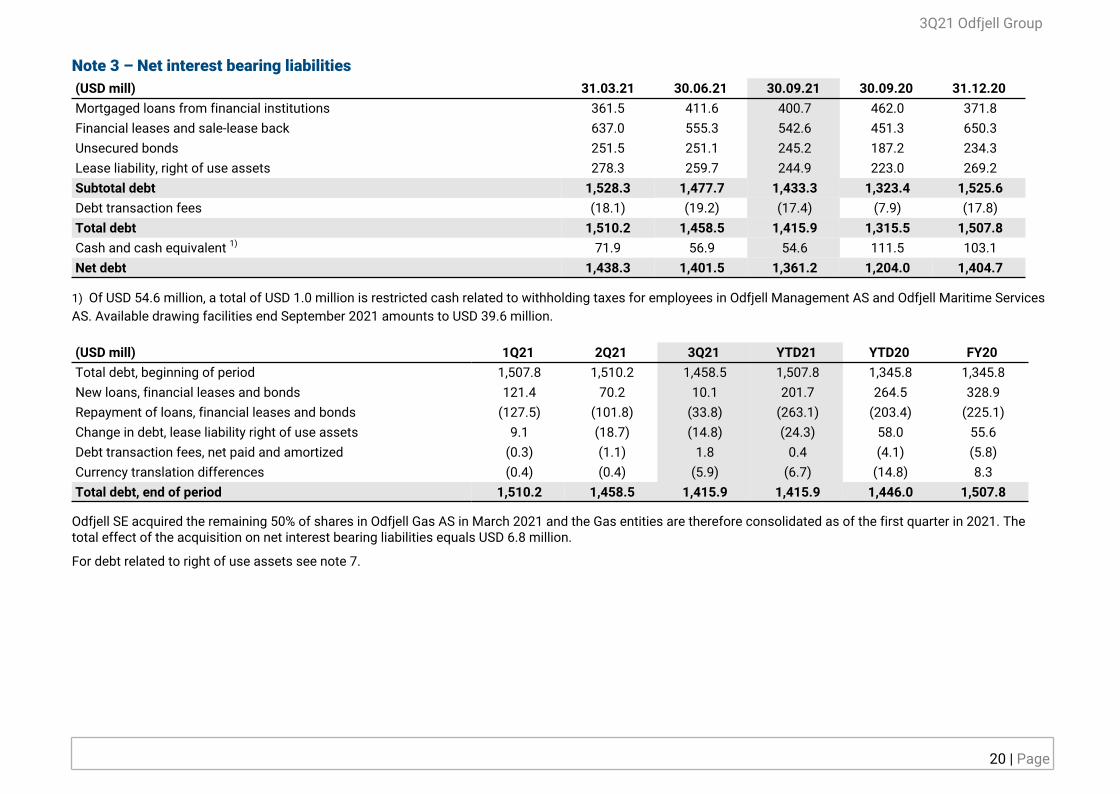
Note 3 – Net interest bearing liabilities(USD mill) 31.03.21 30.06.21 30.09.21 30.09.20 31.12.20Mortgaged loans from financial institutions 361.5 411.6 400.7 462.0 371.8Financial leases and sale-lease back 637.0 555.3 542.6 451.3 650.3Unsecured bonds 251.5 251.1 245.2 187.2 234.3Lease liability, right of use assets 278.3 259.7 244.9 223.0 269.2Subtotal debt 1,528.3 1,477.7 1,433.3 1,323.4 1,525.6Debt transaction fees (18.1) (19.2) (17.4) (7.9) (17.8)Total debt 1,510.2 1,458.5 1,415.9 1,315.5 1,507.8Cash and cash equivalent 1) 71.9 56.9 54.6 111.5 103.1Net debt 1,438.3 1,401.5 1,361.2 1,204.0 1,404.7
1) Of USD 54.6 million, a total of USD 1.0 million is restricted cash related to withholding taxes for employees in Odfjell Management AS and Odfjell Maritime ServicesAS. Available drawing facilities end September 2021 amounts to USD 39.6 million.
(USD mill) 1Q21 2Q21 3Q21 YTD21 YTD20 FY20Total debt, beginning of period 1,507.8 1,510.2 1,458.5 1,507.8 1,345.8 1,345.8New loans, financial leases and bonds 121.4 70.2 10.1 201.7 264.5 328.9Repayment of loans, financial leases and bonds (127.5) (101.8) (33.8) (263.1) (203.4) (225.1)Change in debt, lease liability right of use assets 9.1 (18.7) (14.8) (24.3) 58.0 55.6Debt transaction fees, net paid and amortized (0.3) (1.1) 1.8 0.4 (4.1) (5.8)Currency translation differences (0.4) (0.4) (5.9) (6.7) (14.8) 8.3Total debt, end of period 1,510.2 1,458.5 1,415.9 1,415.9 1,446.0 1,507.8
Odfjell SE acquired the remaining 50% of shares in Odfjell Gas AS in March 2021 and the Gas entities are therefore consolidated as of the first quarter in 2021. The total effect of the acquisition on net interest bearing liabilities equals USD 6.8 million.
For debt related to right of use assets see note 7.
3Q21 Odfjell Group
20 | Page

Note 4 – Ships, property, plant and equipment
(USD mill) 1Q21 2Q21 3Q21 3Q20 YTD21 YTD20Net carrying amount, beginning of period 1,524.8 1,540.7 1,519.2 1,468.8 1,524.8 1,412.1Investments in ships, property, plant and equipment 10.5 8.2 8.4 48.4 27.2 150.5Depreciation (28.8) (29.7) (29.8) (24.0) (88.3) (69.3)Impairment 1) — — (21.0) — (21.0) —Sale of property, plant and equipment 2) — — (16.8) — (16.8) —Acquisition of remaining 50 % share of two gas vessels 34.1 — — — (16.8) —Assets classified as held for sale 3) — — (37.7) — (37.7) —Net carrying amount, end of period 1,540.7 1,519.2 1,422.4 1,493.2 1,422.4 1,493.2
(USD mill) 1Q21 2Q21 3Q21 3Q20 YTD21 YTD20Depreciation property, plant and equipment (28.8) (29.7) (29.8) (24.0) (88.3) (69.2)Depreciation right of use assets (16.6) (16.1) (15.3) (14.6) (48.0) (42.3)Total (45.4) (45.8) (45.1) (38.6) (136.3) (111.5)
1) Odfjell has agreed to the sale of three vessels in the Asia regional trade. An impairment loss of USD 21 million has been recognized related to the agreed-upon sale,while a remaining book value of USD 21.1 million has been reclassified to assets held for sale.
2) Odfjell has finalized the sale of the vessel Bow Gallant with a book value of USD 16.8 million. A gain of USD 1.2 million has been recognized related to the sale. Thesale was partly settled in equity resulting in a USD 7.8 million asset classified as an available-for-sale investment.
3) Total assets of USD 37.7 million has been reclassified to assets held for sale in the third quarter. The amount consists of USD 21.1 million for the Asia regionaltrade vessels and USD 16.6 million related to the vessel Bow Guardian. The sale of Bow Guardian was finalized in October.
3Q21 Odfjell Group
21 | Page

Note 5 – Investments joint venturesThe share of result and balance sheet items from investments in associates and joint ventures are recognized based on equity method in the interim financial statements. The figures below show our share of revenue and expenses, total assets, total liabilities and equity. See note 2 for further details about joint ventures.
(USD mill)YTD21 YTD20
Tank Terminals Gas Carriers 1) Total
Tank Terminals Gas Carriers Total
Gross revenue 52.5 0.9 53.4 49.7 5.2 54.9EBITDA 22.4 0.6 23.0 24.3 1.1 25.4EBIT 4.6 0.3 4.9 16.2 (0.2) 16.0Net result 0.8 0.3 1.1 13.9 (0.4) 13.5
Depreciation of excess values net of deferred taxUSA (3.8) — (3.8) (3.8) — (3.8)Europe (1.3) — (1.3) (1.3) — (1.3)Total (5.1) — (5.1) (5.1) — (5.1)
Non current assets 329.3 — 329.3 292.0 17.5 309.5Cash and cash equivalents 26.4 — 26.4 41.7 1.5 43.2Other current assets 30.6 — 30.6 29.0 0.5 29.5Total assets 386.4 — 386.4 362.8 19.6 382.4Total equity closing balance 177.6 — 177.6 158.8 15.6 174.4Long-term debt 141.8 — 141.8 132.9 — 132.9Other non-current liabilities 28.6 — 28.6 27.7 — 27.7Short-term debt 9.0 — 9.0 4.8 3.9 8.7Other current liabilities 29.4 — 29.4 38.7 — 38.7Total equity and liabilities 386.4 — 386.4 362.8 19.6 382.4
1) Odfjell SE acquired the remaining 50% of shares in Odfjell Gas AS in March 2021. The amount's represent revenue and net result in the period 1.1.2021 to15.3.2021. Going forward, the entities formerly in the Gas segment are accounted for as subsidiaries under the chemical tankers segment.
3Q21 Odfjell Group
22 | Page
Note 6 – Other financial items(USD mill) 1Q21 2Q21 3Q21 3Q20 YTD21 YTD20
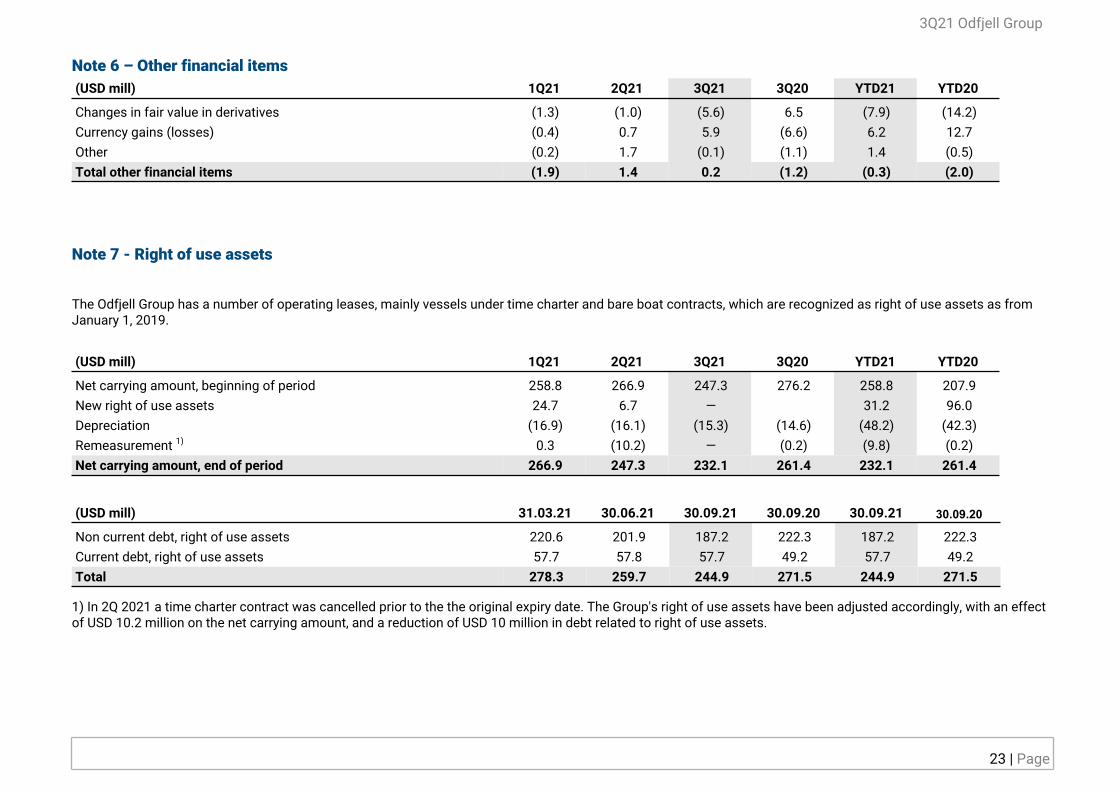
Changes in fair value in derivatives (1.3) (1.0) (5.6) 6.5 (7.9) (14.2)Currency gains (losses) (0.4) 0.7 5.9 (6.6) 6.2 12.7Other (0.2) 1.7 (0.1) (1.1) 1.4 (0.5)Total other financial items (1.9) 1.4 0.2 (1.2) (0.3) (2.0)
Note 7 - Right of use assets
The Odfjell Group has a number of operating leases, mainly vessels under time charter and bare boat contracts, which are recognized as right of use assets as from January 1, 2019.
(USD mill) 1Q21 2Q21 3Q21 3Q20 YTD21 YTD20
Net carrying amount, beginning of period 258.8 266.9 247.3 276.2 258.8 207.9New right of use assets 24.7 6.7 — 31.2 96.0Depreciation (16.9) (16.1) (15.3) (14.6) (48.2) (42.3)Remeasurement 1) 0.3 (10.2) — (0.2) (9.8) (0.2)Net carrying amount, end of period 266.9 247.3 232.1 261.4 232.1 261.4
(USD mill) 31.03.21 30.06.21 30.09.21 30.09.20 30.09.21 30.09.20
Non current debt, right of use assets 220.6 201.9 187.2 222.3 187.2 222.3Current debt, right of use assets 57.7 57.8 57.7 49.2 57.7 49.2Total 278.3 259.7 244.9 271.5 244.9 271.5
1) In 2Q 2021 a time charter contract was cancelled prior to the the original expiry date. The Group's right of use assets have been adjusted accordingly, with an effectof USD 10.2 million on the net carrying amount, and a reduction of USD 10 million in debt related to right of use assets.
3Q21 Odfjell Group
23 | Page

Note 8 - Operating expenses
(USD mill) 1Q21 2Q21 3Q21 3Q20 YTD21 YTD20
Operating expenses right of use assets (6.7) (6.6) (6.0) (5.1) (19.3) (16.0)Other operating expenses (40.7) (42.4) (40.8) (36.9) (124.0) (106.5)Total (47.4) (48.9) (46.8) (42.0) (143.3) (122.5)
Note 9 - Interest expenses
(USD mill) 1Q21 2Q21 3Q21 3Q20 YTD21 YTD20
Interest expenses - right of use assets (3.6) (3.5) (3.2) (3.6) (10.3) (10.4)Other interest expenses (16.7) (16.2) (14.8) (16.4) (47.7) (52.3)Total (20.3) (19.7) (18.0) (20.0) (58.0) (62.7)
Note 10 - Subsequent eventsDistribution
Distribution from Den Norske Krigsforsikring for Skib to its members was approved in October 2021. Odfjell Group considers the receipt of distribution as a repayment of previously paid insurance premiums and will therefore recognize the received dividend within the operating result in its fourth quarter 2021 report.
The distribution to be received is estimated to USD 6 million with an estimated withholding tax of USD 0.4 million which will be booked as a tax expense.
Cash is expected to be received during the first quarter of 2022. Until cash is received, the distribution will be classified as a short-term receivable in the balance sheet.
3Q21 Odfjell Group
24 | Page

Fleet list September 30, 2021STAINLESS STAINLESS
VESSEL TYPE Class CHEMICAL TANKERS DWT BUILT OWNERSHIP CBM STEEL, CBM TANKS VESSEL TYPE Class CHEMICAL TANKERS DWT BUILT OWNERSHIP CBM STEEL, CBM TANKSSuper-segregator POLAND Bow Sea 49 592 2006 Owned 52 244 52 244 40 Coated PIONEER Bow Pioneer 75 000 2013 Owned 87 330 0 31Super-segregator POLAND Bow Summer 49 592 2005 Owned 52 252 52 252 40 Coated FLUMAR Flumar Brasil 51 188 2010 Owned 54 344 0 12Super-segregator POLAND Bow Saga 49 559 2007 Owned 52 243 52 243 40 Coated MR POOL Bow Triumph 49 622 2014 Leased 54 595 0 22Super-segregator POLAND Bow Sirius 49 539 2006 Owned 52 242 52 242 40 Coated MR POOL Bow Trident 49 622 2014 Leased 54 595 0 22Super-segregator POLAND Bow Star 49 487 2004 Owned 52 222 52 222 40 Coated MR POOL Bow Tribute 49 622 2014 Owned 54 595 0 22Super-segregator POLAND Bow Sky 49 479 2005 Leased 52 222 52 222 40 Coated MR POOL Bow Trajectory 49 622 2014 Owned 54 595 0 22Super-segregator POLAND Bow Spring 49 429 2004 Owned 52 252 52 252 40 Coated MR POOL Bow Elm 46 098 2011 Owned 49 996 0 29Super-segregator POLAND Bow Sun 42 459 2003 Owned 52 222 52 222 40 Coated MR POOL Bow Lind 46 047 2011 Owned 49 996 0 29Super-segregator KVAERNER Bow Chain 37 518 2002 Owned 40 966 40 966 47Super-segregator KVAERNER Bow Faith 37 479 1997 Leased 41 960 34 681 52 Regional BRAGE/FLUMAR Bow Oceanic 17 460 1997 Owned 19 224 19 224 24Super-segregator KVAERNER Bow Cedar 37 455 1996 Owned 41 947 41 947 52 Regional BRAGE/FLUMAR Bow Atlantic 17 460 1995 Owned 19 848 19 848 24Super-segregator KVAERNER Bow Cardinal 37 446 1997 Owned 41 953 34 674 52 Regional OT16-17x20-30 Bow Condor 16 121 2000 Owned 16 642 16 642 30Super-segregator KVAERNER Bow Firda 37 427 2003 Owned 40 994 40 994 47 Regional TC-ASIA ASL Orchid 12 571 2011 Time charter 14 419 14 419 16Super-segregator KVAERNER Bow Fortune 37 395 1999 Leased 41 000 41 000 47 Regional CHUANDONG Bow Nangang 9 124 2013 Owned 11 074 11 074 14Super-segregator KVAERNER Bow Fagus 37 375 1995 Owned 41 952 34 673 52 Regional CHUANDONG Bow Dalian 9 156 2012 Owned 11 094 11 094 14Super-segregator KVAERNER Bow Flora 37 369 1998 Leased 41 000 33 721 47 Regional CHUANDONG Bow Fuling 9 156 2012 Owned 11 080 11 080 14Super-segregator KVAERNER Bow Cecil 37 369 1998 Leased 41 000 33 721 47 Total Chemical Tankers: 2 448 615 69 2 692 701 2 182 162 2 106Super-segregator KVAERNER Bow Clipper 37 221 1995 Owned 40 775 33 496 52Super-segregator KVAERNER Bow Flower 37 221 1994 Owned 41 492 34 673 52Super-segregator CP40 Bow Hercules 40 847 2017 Bareboat 44 085 44 085 30
Super-segregator CP40 Bow Gemini 40 895 2017 Bareboat 44 205 44 205 30 3rd party* STAINLESSSuper-segregator CP40 Bow Aquarius 40 901 2016 Bareboat 44 403 44 403 30 VESSEL TYPE Class CHEMICAL TANKERS DWT BUILT OWNERSHIP CBM STEEL, CBM TANKSSuper-segregator CP40 Bow Capricorn 40 929 2016 Bareboat 44 184 44 184 30 Large Stainless steel CP33 Bow Agathe 33 609 2009 Pool 37 218 37 218 16Super-segregator HUDONG49 Bow Orion 49 042 2019 Owned 55 186 55 186 33 Large Stainless steel CP33 Bow Caroline 33 609 2009 Pool 37 236 37 236 16Super-segregator HUDONG49 Bow Olympus 49 000 2019 Leased 55 186 55 186 33 Large Stainless steel CP33 Bow Hector 33 694 2009 Pool 36 639 36 639 16Super-segregator HUDONG49 Bow Odyssey 49 000 2020 Owned 54 175 54 175 33Super-segregator HUDONG49 Bow Optima 49 042 2020 Leased 55 186 55 186 33 Super-segregator CP40 SC Taurus 40 963 2017 Pool 44 156 44 156 30Super-segregator HUDONG40 Bow Explorer 38 236 2020 Leased 45 118 45 118 40 Super-segregator CP40 SC Scorpio 40 964 2017 Pool 44 150 44 150 30Super-segregator HUDONG40 Bow Excellence 38 234 2020 Leased 45 118 45 118 40 Super-segregator CP40 SC Virgo 40 870 2017 Pool 42 787 42 787 30
Super-segregator CP40 SC Draco 40 870 2017 Pool 42 787 42 787 30Large Stainless steel 35x28 Bow Persistent 36 225 2020 Bareboat 39 221 39 221 28Large Stainless steel 35x28 Bow Performer 35 118 2018 Time charter 37 987 37 987 28 Medium Stainless steel CP25 Navig8 Stellar 25 193 2016 Pool 29 709 29 709 18Large Stainless steel 35x28 Bow Prosper 36 221 2020 Bareboat 39 234 39 234 28 Medium Stainless steel CP25 Navig8 Spark 25 197 2016 Pool 29 718 29 718 18Large Stainless steel 35x30 Bow Precision 35 155 2018 Time charter 36 668 36 668 28 Medium Stainless steel CP25 Navig8 Spica 25 269 2017 Pool 28 570 28 570 18Large Stainless steel CP33 Bow Harmony 33 619 2008 Leased 39 758 39 758 16 Medium Stainless steel CP25 Navig8 Sky 25 193 2016 Pool 29 710 29 710 18Large Stainless steel CP33 Bow Compass 33 609 2009 Owned 38 685 38 685 16Large Stainless steel 30x28 Bow Engineer 30 086 2006 Leased 36 970 36 970 28 Coated Handy Pool TRF Mobile 37 596 2016 Pool 41 619 0 16Large Stainless steel 30x28 Bow Architect 30 058 2005 Leased 36 956 36 956 28 Coated Handy Pool TRF Moss 37 596 2016 Pool 41 619 0 16Large Stainless steel CP33 Sagami 33 615 2008 Time charter 37 238 37 238 16 Coated Handy Pool TRF Marquette 37 596 2016 Pool 41 619 0 16
Coated Handy Pool TRF Memphis 37 596 2016 Pool 41 619 0 16Coated Handy Pool TRF Mandal 37 596 2016 Pool 41 619 0 16
Medium Stainless steel CP25 Southern Quokka 26 077 2017 Time charter 29 049 29 049 26 Coated Handy Pool TRF Mongstad 37 596 2016 Pool 41 619 0 16Medium Stainless steel CP25 Southern Owl 26 057 2016 Time charter 29 048 29 048 26 Coated MR Pool TRF Bergen 50 698 2015 Pool 49 126 0 22Medium Stainless steel CP25 Southern Puma 26 071 2016 Time charter 29 055 29 055 26 Coated MR Pool Navig8 Tanzanite 49 780 2016 Pool 51 723 0 16Medium Stainless steel CP25 Southern Shark 26 051 2018 Time charter 27 112 27 112 26 Coated MR Pool Navig8 Topaz 49 560 2015 Pool 51 723 0 16Medium Stainless steel CP25 Bow Platinum 27 500 2017 Leased 28 059 28 059 24 Coated MR Pool Navig8 Tourmaline 49 513 2016 Pool 51 723 0 16Medium Stainless steel CP25 Bow Neon 27 500 2017 Leased 29 041 29 041 24 Coated MR Pool Navig8 Turquoise 49 516 2016 Pool 51 723 0 16Medium Stainless steel CP25 Bow Titanium 27 500 2018 Leased 29 006 29 006 24 Coated MR Pool Navig8 Victoria 49 126 2015 Pool 50 699 0 20Medium Stainless steel CP25 Bow Palladium 27 500 2017 Leased 28 051 28 051 24 Coated MR Pool Navig8 Violette 49 126 2015 Pool 50 699 0 20Medium Stainless steel CP25 Bow Tungsten 27 500 2018 Leased 28 067 28 067 24Medium Stainless steel CP20 Southern Koala 21 290 2010 Time charter 20 008 20 008 20 Total 3rd party: 938 326 24 1 009 810 402 680 462Medium Stainless steel CP20 Bow Santos 19 997 2004 Owned 22 626 22 626 22 * Pool participation and commercial managementMedium Stainless steel FLUMAR Flumar Maceio 19 975 2006 Owned 21 713 21 713 22 STAINLESSMedium Stainless steel CP20/FLUMAR Moyra 19 806 2005 Time charter 23 707 23 707 18 SUMMARIZED NUMBER DWT CBM STEEL, CBM TANKSMedium Stainless steel CP25 Pacific Endeavor 26 197 2011 Time Charter 27 591 27 591 16 Owned 31 1 168 997 1 287 959 908 447 1 025Medium Stainless steel CP25 Southern Xantis 25 887 2020 Time Charter 27 078 27 078 26 Time charter 13 339 490 366 522 366 522 290
Medium Stainless steel CP25 Bow Emma 25 595 2009 Time charter 27 562 27 562 18 Leased 19 704 110 782 888 651 861 615Bareboat 6 236 018 255 332 255 332 176Pool 24 938 326 1 009 810 402 680 462
Total Chemical Tankers: 93 3 386 941 3 702 511 2 584 842 2 568

NEWBUILDINGS ON ORDER:CHEMICAL TANKERS NUMBER DWT CBM STEEL, CBM TANKS DELIVERY OWNERSHIP
Asakawa/Nissen 4 26 000 26 2022 / 2023 Time Charter
Total newbuildings: 4 104 000 0 0 104
GAS CARRIERS CLASS BUILT DWT CBM TYPE TANKS OWNERSHIPBow Gallant FLUMAR 2008 10 282 8 922 LPG/Ethylene 2 TimecharterBow Guardian FLUMAR 2008 10 282 8 922 LPG/Ethylene 2 OwnedTotal Gas Carriers: 2 20 564 17 844 4
FLEET CHANGES SINCE LAST QUARTER: STAINLESSCHEMICAL TANKERS BUILT DWT CBM STEEL, CBM TANKS OWNERSHIP MONTHFleet additions:Bow Emma 2009 25 595 27 562 27 562 18 Time Charter
Fleet redeliveries:- - - - - - - -

TANK TERMINALS LOCATION OWNERSHIP¹ CBMSTAINLESS STEEL, CBM
NUMBER OF TANKS
Odfjell Terminals (Houston) Inc. Houston, USA 51 % 379 658 113 180 119Odfjell Terminals (Charleston) LLC Charleston, USA 51 % 79 400 0 9Odfjell Terminals (Korea) Co. Ltd Ulsan, Korea 50,00 % 313 710 15 860 85Odfjell Nangang Terminals (Tianjin) Co.,Ltd Tianjin, China 24.99% 137 800 7 000 26Noord Natie Terminals NV Antwerp, Belgium 25,00 % 382 061 71 542 253Total terminals 5 terminals 1 292 629 207 582 492
TANK TERMINALS PARTLY OWNED BY RELATED PARTIES LOCATION CBMSTAINLESS STEEL, CBM
NUMBER OF TANKS
Depositos Quimicos Mineros S.A. Callao, Peru 66 230 1 600 55Granel Quimica Ltda Rio Grande, Brazil 70 150 2 900 32Granel Quimica Ltda Sao Luis, Brazil 125 390 0 49Granel Quimica Ltda Ladario, Brazil 8 050 0 6Granel Quimica Ltda Teresina, Brazil 7 640 0 6Granel Quimica Ltda Palmas, Brazil 16 710 0 12Granel Quimica Ltda Santos, Brazil 51 190 0 17Odfjell Terminals Tagsa S.A. Buenos Aires, Argentina 38 720 530 60Odfjell Terminals Tagsa S.A. Campana, Argentina 68 670 10 190 102Terquim S.A. San Antonio, Chile 33 590 0 25Terquim S.A. Mejillones, Chile 16 840 0 7Total tank terminals partly owned by related parties 11 terminals 503 180 15 220 371
PROJECTS AND EXPANSIONS TANK TERMINALS PARTLY OWNED BY RELATED PARTIES LOCATION CBM
ESTIMATED COMPLETION
Granel Quimica Ltda Sao Luis, Brazil 24 800 0 1Q 2022Total expansion tank terminals partly owned by related parties 24 800 0
Grand total (incl. related tank terminals partly owned by related parties) 16 existing terminals 1 795 809 222 802
¹Odfjell SE's indirect ownership share