27
Third Quarter Earnings Presentation November 18, 2020

Third Quarter Earnings PresentationNovember 18, 2020

2
Safe Harbor Statement Under the Private Securities Litigation Reform Act of 1995
We caution that any forward-looking statements (as such term is defined in the Private Securities Litigation Reform Act of 1995) contained in this presentation or made by ourcompany or our management involve risks and uncertainties and are subject to change based on various factors, many of which are beyond our control. Accordingly, our futureperformance and financial results may differ materially from those expressed or implied in any such forward-looking statements. Words such as “estimate,” “project,” “plan,” “believe,”“expect,” “anticipate,” “intend,” “planned,” “potential” and any similar expressions may identify forward-looking statements. Risks associated with the following factors, among others, insome cases have affected and in the future could affect our financial performance and actual results and could cause actual results to differ materially from those expressed or impliedin any forward-looking statements included in this presentation or otherwise made by our company or our management:
General economic conditions, consumer confidence, consumer spending patterns and market disruptions including pandemics or significant health hazards, severe weather conditions, natural disasters, terrorist activities, financial crises, political crises or other major events, or the prospect of these events;
divestitures or other dispositions, including any divestiture of Victoria’s Secret and related operations, could negatively impact our business, and contingent liabilities from businesses that we have sold could adversely affect our financial statements;
the seasonality of our business; difficulties arising from turnover in company leadership or other key positions; our ability to attract, develop and retain qualified associates and manage labor-related costs; liabilities arising from divested businesses; the dependence on mall traffic and the availability of suitable store locations on appropriate terms; our ability to grow through new store openings and existing store remodels and expansions; our ability to successfully expand internationally and related risks; our independent franchise, license and wholesale partners; our direct channel businesses; our ability to protect our reputation and our brand images; our ability to attract customers with marketing, advertising and promotional programs; our ability to protect our trade names, trademarks and patents; the highly competitive nature of the retail industry and the segments in which we operate; consumer acceptance of our products and our ability to manage the life cycle of our brands, keep up with fashion trends, develop new merchandise and launch
new product lines successfully; our ability to source, distribute and sell goods and materials on a global basis, including risks related to:
political instability, environmental hazards or natural disasters; significant health hazards or pandemics, which could result in closed factories, reduced workforces, scarcity of raw materials, and scrutiny or embargoing
of goods produced in infected areas; duties, taxes and other charges; legal and regulatory matters;
- CONTINUED -
Safe Harbor Statement Under the Private Securities Litigation Reform Act of 1995
volatility in currency exchange rates; local business practices and political issues; potential delays or disruptions in shipping and transportation and related pricing impacts; disruption due to labor disputes; and changing expectations regarding product safety due to new legislation;
our geographic concentration of vendor and distribution facilities in central Ohio; fluctuations in foreign currency exchange rates; stock price volatility; our ability to pay dividends and related effects; our ability to maintain our credit rating; our ability to service or refinance our debt; shareholder activism matters; the ability of our vendors to deliver products in a timely manner, meet quality standards and comply with applicable laws and regulations; fluctuations in product input costs; our ability to adequately protect our assets from loss and theft; fluctuations in energy costs; increases in the costs of mailing, paper and printing; claims arising from our self-insurance; our ability to implement and maintain information technology systems and to protect associated data; our ability to maintain the security of customer, associate, third-party or company information; our ability to comply with laws and regulations or other obligations related to data privacy and security; our ability to comply with regulatory requirements; legal and compliance matters; and tax, trade and other regulatory matters.
We are not under any obligation and do not intend to make publicly available any update or other revisions to any of the forward-looking statements contained in this presentation toreflect circumstances existing after the date of this presentation or to reflect the occurrence of future events even if experience or future events make it clear that any expected resultsexpressed or implied by those forward-looking statements will not be realized.
3
4
% Increase Increase
(Decrease) (Decrease)
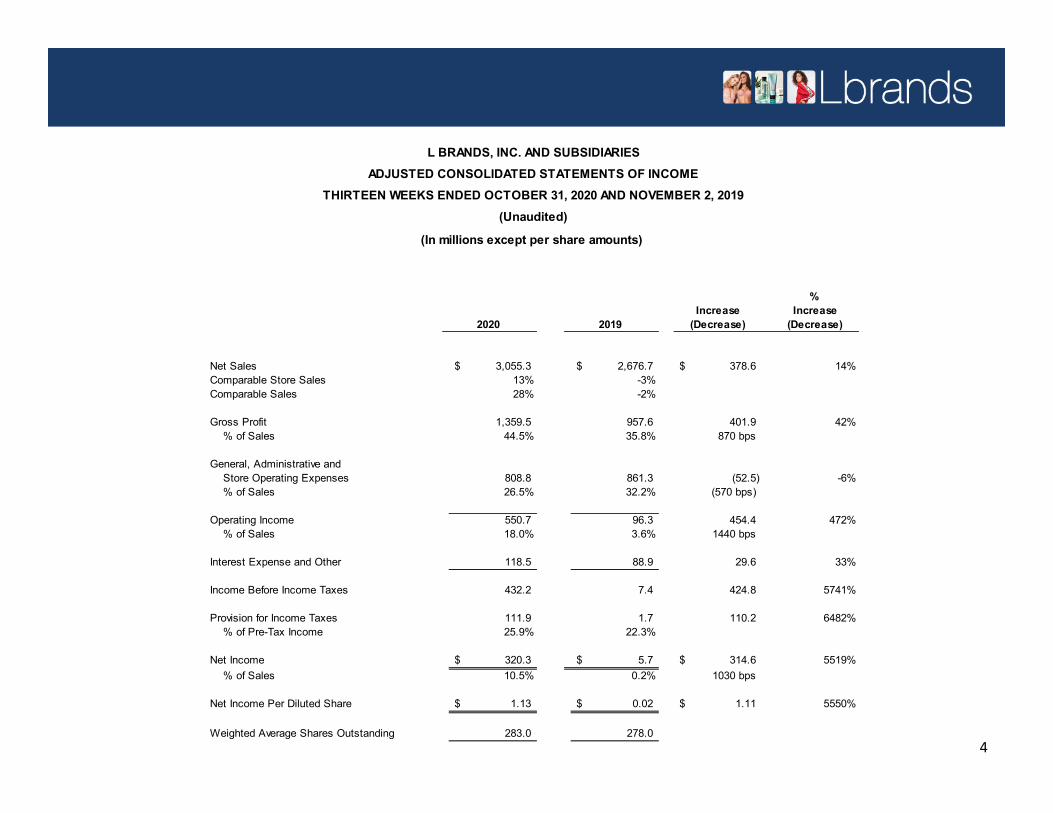
Net Sales 3,055.3$ 2,676.7$ 378.6$ 14%Comparable Store Sales 13% -3%Comparable Sales 28% -2%
Gross Profit 1,359.5 957.6 401.9 42%% of Sales 44.5% 35.8% 870 bps
General, Administrative andStore Operating Expenses 808.8 861.3 (52.5) -6%% of Sales 26.5% 32.2% (570 bps)
Operating Income 550.7 96.3 454.4 472%% of Sales 18.0% 3.6% 1440 bps
Interest Expense and Other 118.5 88.9 29.6 33%
Income Before Income Taxes 432.2 7.4 424.8 5741%
Provision for Income Taxes 111.9 1.7 110.2 6482%% of Pre-Tax Income 25.9% 22.3%
Net Income 320.3$ 5.7$ 314.6$ 5519%% of Sales 10.5% 0.2% 1030 bps
Net Income Per Diluted Share 1.13$ 0.02$ 1.11$ 5550%
Weighted Average Shares Outstanding 283.0 278.0
20192020
L BRANDS, INC. AND SUBSIDIARIESADJUSTED CONSOLIDATED STATEMENTS OF INCOME
THIRTEEN WEEKS ENDED OCTOBER 31, 2020 AND NOVEMBER 2, 2019(Unaudited)
(In millions except per share amounts)
% Increase Increase
(Decrease) (Decrease)
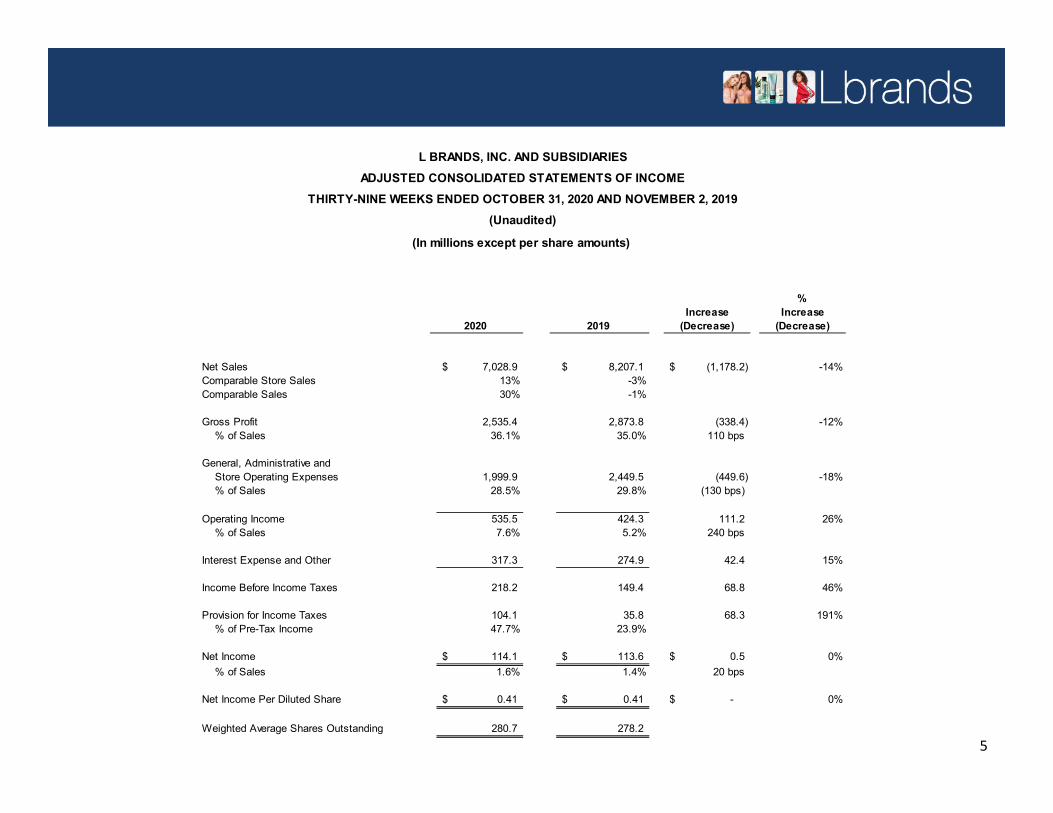
Net Sales 7,028.9$ 8,207.1$ (1,178.2)$ -14%Comparable Store Sales 13% -3%Comparable Sales 30% -1%
Gross Profit 2,535.4 2,873.8 (338.4) -12%% of Sales 36.1% 35.0% 110 bps
General, Administrative andStore Operating Expenses 1,999.9 2,449.5 (449.6) -18%% of Sales 28.5% 29.8% (130 bps)
Operating Income 535.5 424.3 111.2 26%% of Sales 7.6% 5.2% 240 bps
Interest Expense and Other 317.3 274.9 42.4 15%
Income Before Income Taxes 218.2 149.4 68.8 46%
Provision for Income Taxes 104.1 35.8 68.3 191%% of Pre-Tax Income 47.7% 23.9%
Net Income 114.1$ 113.6$ 0.5$ 0%% of Sales 1.6% 1.4% 20 bps
Net Income Per Diluted Share 0.41$ 0.41$ -$ 0%
Weighted Average Shares Outstanding 280.7 278.2
20192020
L BRANDS, INC. AND SUBSIDIARIESADJUSTED CONSOLIDATED STATEMENTS OF INCOME
THIRTY-NINE WEEKS ENDED OCTOBER 31, 2020 AND NOVEMBER 2, 2019(Unaudited)
(In millions except per share amounts)
5
6
% Increase Increase
(Decrease) (Decrease)
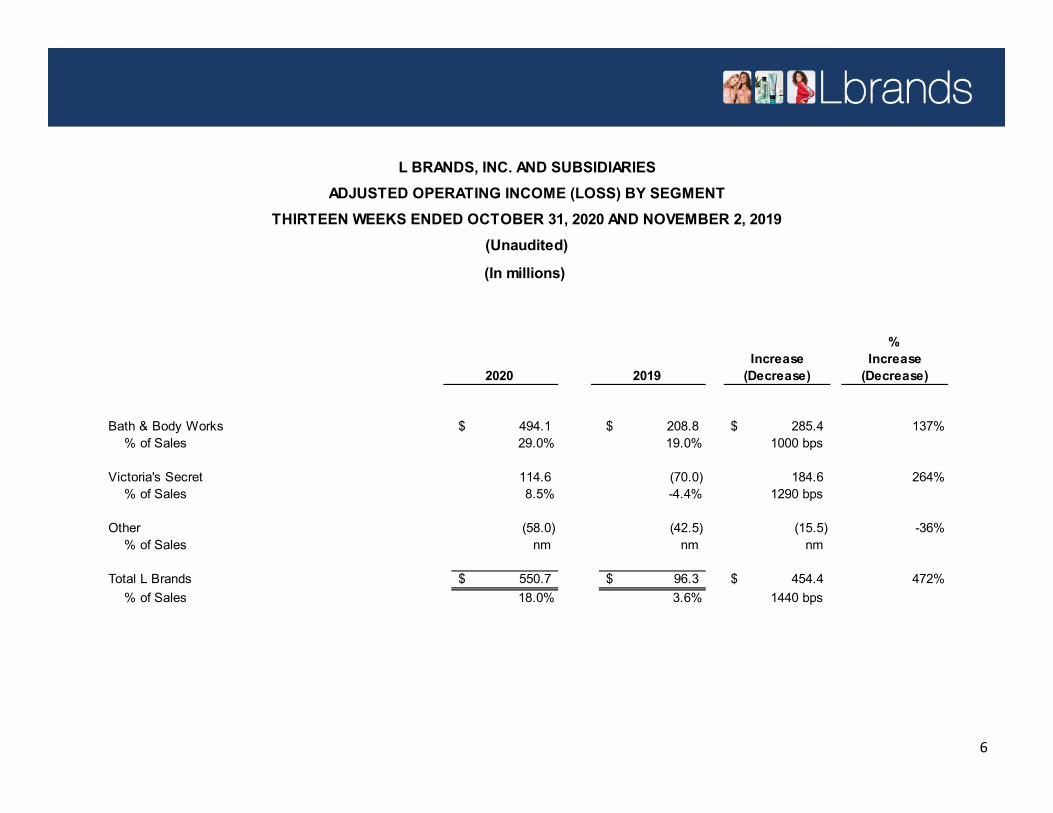
Bath & Body Works 494.1$ 208.8$ 285.4$ 137%% of Sales 29.0% 19.0% 1000 bps
Victoria's Secret 114.6 (70.0) 184.6 264%% of Sales 8.5% -4.4% 1290 bps
Other (58.0) (42.5) (15.5) -36%% of Sales nm nm nm
Total L Brands 550.7$ 96.3$ 454.4$ 472%% of Sales 18.0% 3.6% 1440 bps
20192020
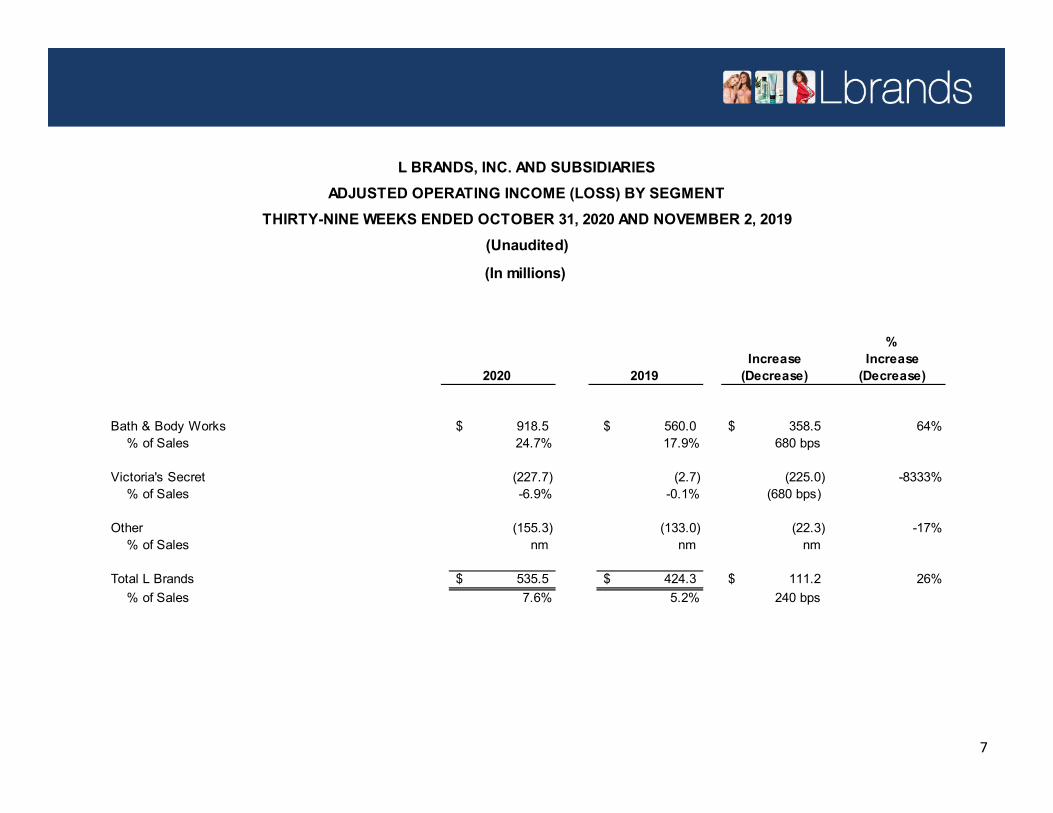
L BRANDS, INC. AND SUBSIDIARIESADJUSTED OPERATING INCOME (LOSS) BY SEGMENT
THIRTEEN WEEKS ENDED OCTOBER 31, 2020 AND NOVEMBER 2, 2019(Unaudited)
(In millions)
7
% Increase Increase
(Decrease) (Decrease)
Bath & Body Works 918.5$ 560.0$ 358.5$ 64%% of Sales 24.7% 17.9% 680 bps
Victoria's Secret (227.7) (2.7) (225.0) -8333%% of Sales -6.9% -0.1% (680 bps)
Other (155.3) (133.0) (22.3) -17%% of Sales nm nm nm
Total L Brands 535.5$ 424.3$ 111.2$ 26%% of Sales 7.6% 5.2% 240 bps
20192020
L BRANDS, INC. AND SUBSIDIARIESADJUSTED OPERATING INCOME (LOSS) BY SEGMENT
THIRTY-NINE WEEKS ENDED OCTOBER 31, 2020 AND NOVEMBER 2, 2019(Unaudited)
(In millions)
8
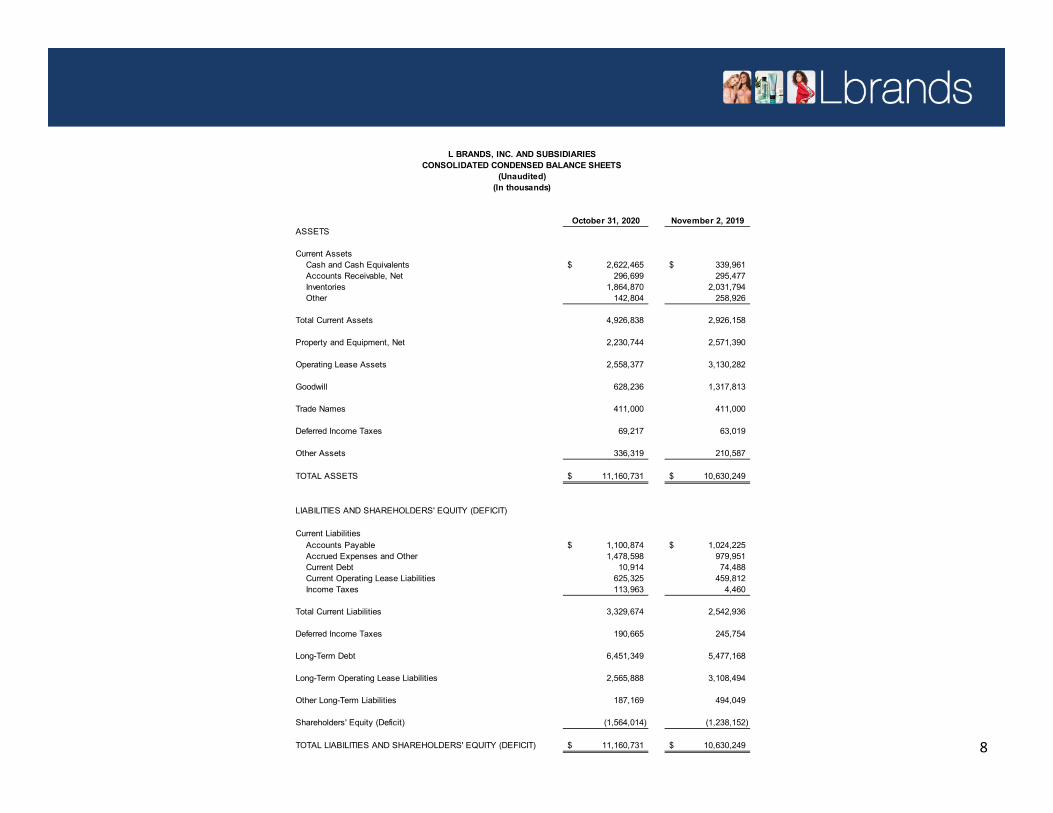
L BRANDS, INC. AND SUBSIDIARIESCONSOLIDATED CONDENSED BALANCE SHEETS
(Unaudited)(In thousands)
October 31, 2020 November 2, 2019ASSETS
Current AssetsCash and Cash Equivalents 2,622,465$ 339,961$ Accounts Receivable, Net 296,699 295,477 Inventories 1,864,870 2,031,794 Other 142,804 258,926
Total Current Assets 4,926,838 2,926,158
Property and Equipment, Net 2,230,744 2,571,390
Operating Lease Assets 2,558,377 3,130,282
Goodwill 628,236 1,317,813
Trade Names 411,000 411,000
Deferred Income Taxes 69,217 63,019
Other Assets 336,319 210,587
TOTAL ASSETS 11,160,731$ 10,630,249$
LIABILITIES AND SHAREHOLDERS' EQUITY (DEFICIT)
Current LiabilitiesAccounts Payable 1,100,874$ 1,024,225$ Accrued Expenses and Other 1,478,598 979,951 Current Debt 10,914 74,488 Current Operating Lease Liabilities 625,325 459,812 Income Taxes 113,963 4,460
Total Current Liabilities 3,329,674 2,542,936
Deferred Income Taxes 190,665 245,754
Long-Term Debt 6,451,349 5,477,168
Long-Term Operating Lease Liabilities 2,565,888 3,108,494
Other Long-Term Liabilities 187,169 494,049
Shareholders' Equity (Deficit) (1,564,014) (1,238,152)
TOTAL LIABILITIES AND SHAREHOLDERS' EQUITY (DEFICIT) 11,160,731$ 10,630,249$
9
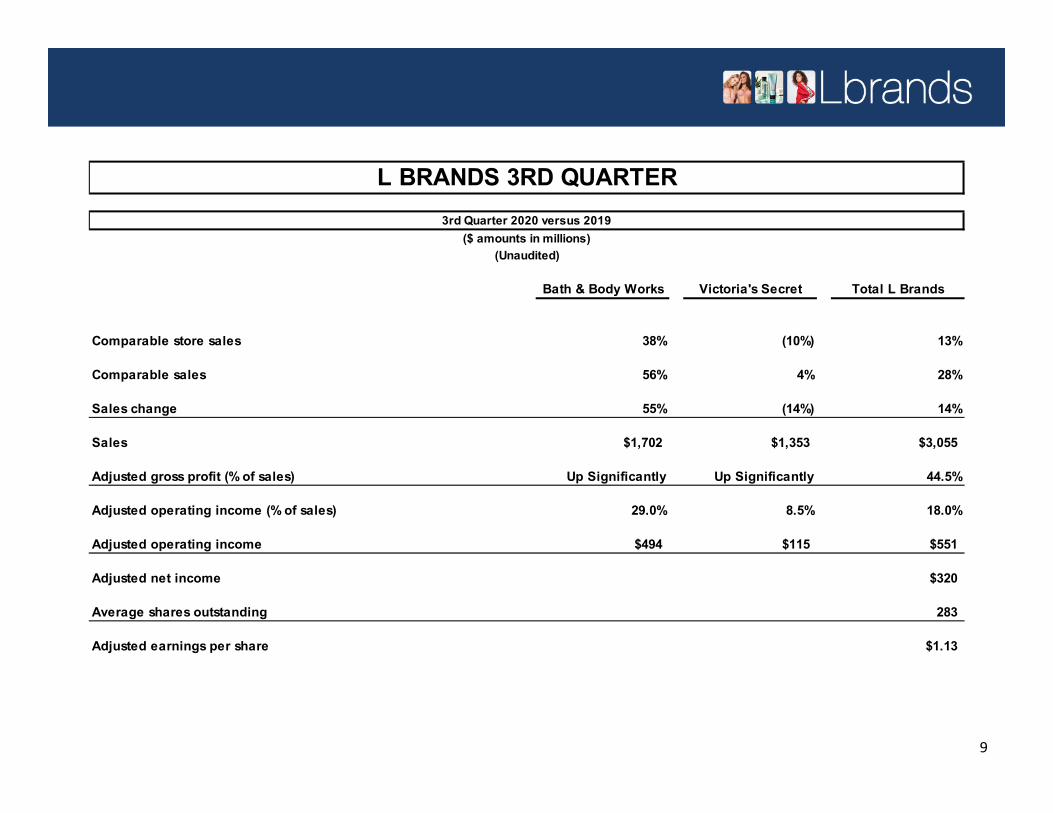
Bath & Body Works Victoria's Secret Total L Brands
Comparable store sales 38% (10%) 13%
Comparable sales 56% 4% 28%
Sales change 55% (14%) 14%
Sales $1,702 $1,353 $3,055
Adjusted gross profit (% of sales) Up Significantly Up Significantly 44.5%
Adjusted operating income (% of sales) 29.0% 8.5% 18.0%
Adjusted operating income $494 $115 $551
Adjusted net income $320
Average shares outstanding 283
Adjusted earnings per share $1.13
(Unaudited)
L BRANDS 3RD QUARTER3rd Quarter 2020 versus 2019
($ amounts in millions)
10
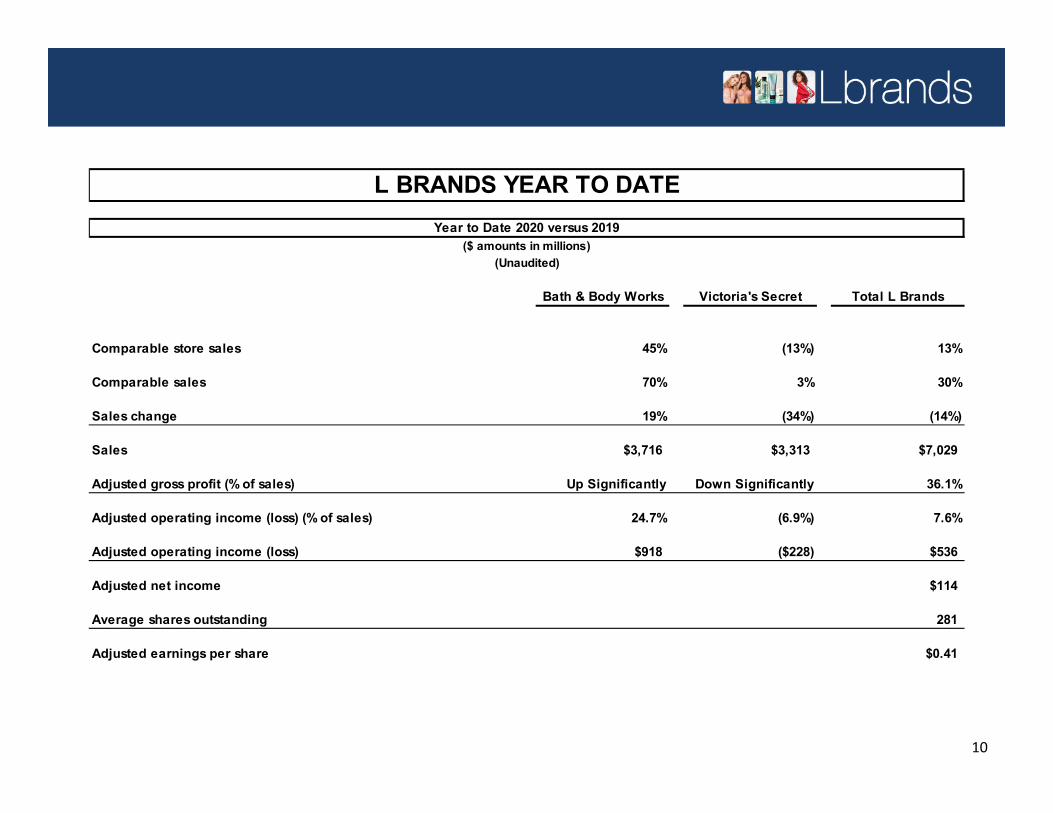
L BRANDS YEAR TO DATEYear to Date 2020 versus 2019
Bath & Body Works Victoria's Secret Total L Brands
Comparable store sales 45% (13%) 13%
Comparable sales 70% 3% 30%
Sales change 19% (34%) (14%)
Sales $3,716 $3,313 $7,029
Adjusted gross profit (% of sales) Up Significantly Down Significantly 36.1%
Adjusted operating income (loss) (% of sales) 24.7% (6.9%) 7.6%
Adjusted operating income (loss) $918 ($228) $536
Adjusted net income $114
Average shares outstanding 281
Adjusted earnings per share $0.41
($ amounts in millions)(Unaudited)
11
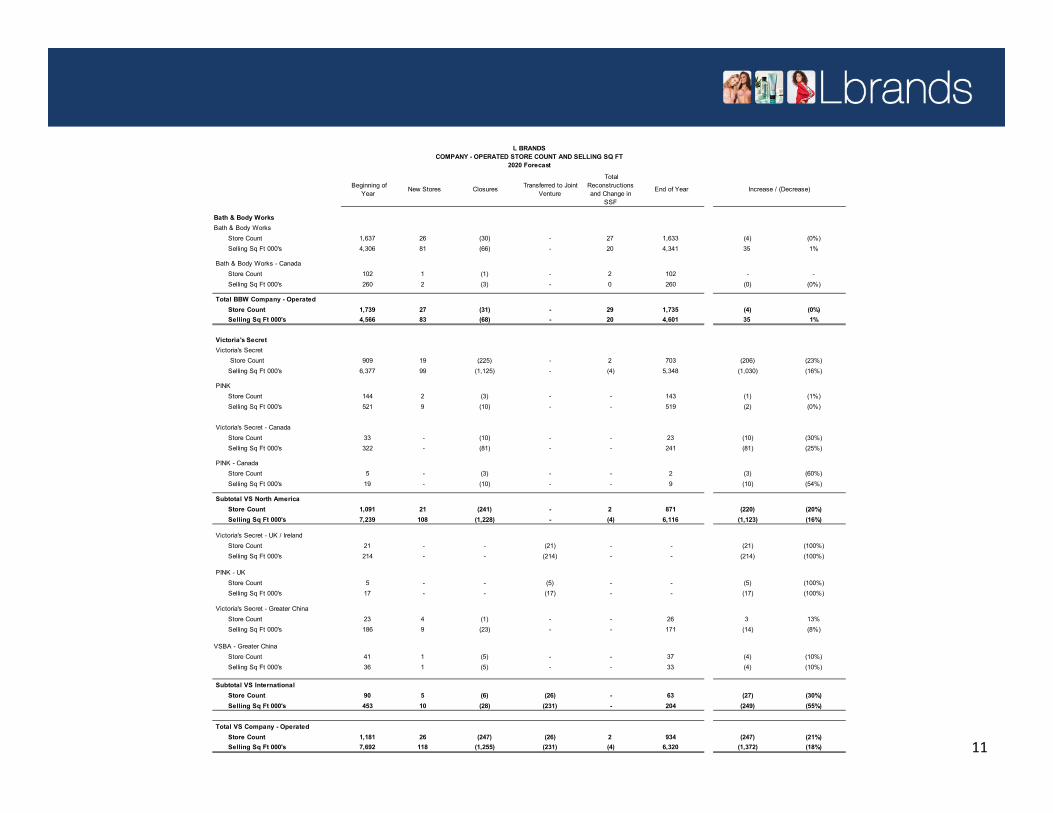
Beginning of Year
New Stores Closures Transferred to Joint Venture
Total Reconstructions and Change in
SSF
End of Year
Bath & Body WorksBath & Body Works
Store Count 1,637 26 (30) - 27 1,633 (4) (0%)Selling Sq Ft 000's 4,306 81 (66) - 20 4,341 35 1%
Bath & Body Works - CanadaStore Count 102 1 (1) - 2 102 - -Selling Sq Ft 000's 260 2 (3) - 0 260 (0) (0%)
Total BBW Company - OperatedStore Count 1,739 27 (31) - 29 1,735 (4) (0%)Selling Sq Ft 000's 4,566 83 (68) - 20 4,601 35 1%
Victoria's SecretVictoria's Secret
Store Count 909 19 (225) - 2 703 (206) (23%)Selling Sq Ft 000's 6,377 99 (1,125) - (4) 5,348 (1,030) (16%)
PINKStore Count 144 2 (3) - - 143 (1) (1%)Selling Sq Ft 000's 521 9 (10) - - 519 (2) (0%)
Victoria's Secret - CanadaStore Count 33 - (10) - - 23 (10) (30%)Selling Sq Ft 000's 322 - (81) - - 241 (81) (25%)
PINK - CanadaStore Count 5 - (3) - - 2 (3) (60%)Selling Sq Ft 000's 19 - (10) - - 9 (10) (54%)
Subtotal VS North AmericaStore Count 1,091 21 (241) - 2 871 (220) (20%)Selling Sq Ft 000's 7,239 108 (1,228) - (4) 6,116 (1,123) (16%)
Victoria's Secret - UK / IrelandStore Count 21 - - (21) - - (21) (100%)Selling Sq Ft 000's 214 - - (214) - - (214) (100%)
PINK - UKStore Count 5 - - (5) - - (5) (100%)Selling Sq Ft 000's 17 - - (17) - - (17) (100%)
Victoria's Secret - Greater ChinaStore Count 23 4 (1) - - 26 3 13%Selling Sq Ft 000's 186 9 (23) - - 171 (14) (8%)
VSBA - Greater ChinaStore Count 41 1 (5) - - 37 (4) (10%)Selling Sq Ft 000's 36 1 (5) - - 33 (4) (10%)
Subtotal VS InternationalStore Count 90 5 (6) (26) - 63 (27) (30%)Selling Sq Ft 000's 453 10 (28) (231) - 204 (249) (55%)
Total VS Company - OperatedStore Count 1,181 26 (247) (26) 2 934 (247) (21%)Selling Sq Ft 000's 7,692 118 (1,255) (231) (4) 6,320 (1,372) (18%)
L BRANDSCOMPANY - OPERATED STORE COUNT AND SELLING SQ FT
2020 Forecast
Increase / (Decrease)
12
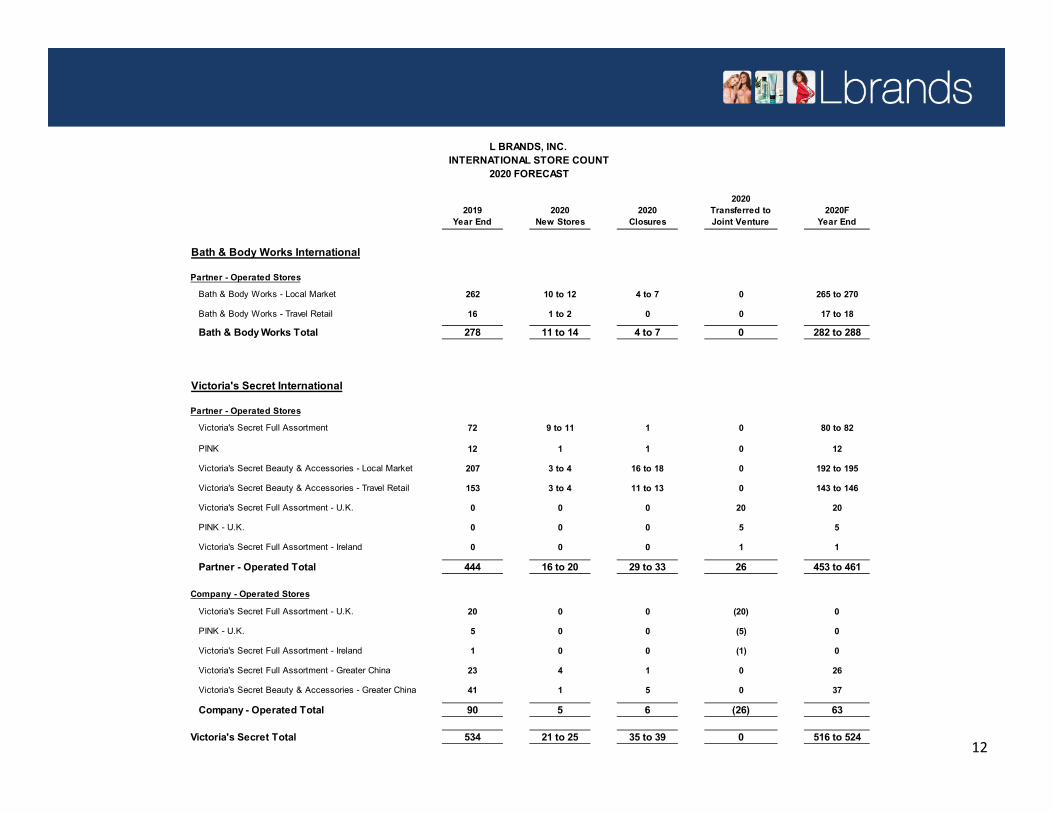
L BRANDS, INC. INTERNATIONAL STORE COUNT
2020 FORECAST
2019Year End
2020New Stores
2020Closures
2020Transferred to Joint Venture
2020FYear End
Bath & Body Works International
Partner - Operated Stores
Bath & Body Works - Local Market 262 10 to 12 4 to 7 0 265 to 270
Bath & Body Works - Travel Retail 16 1 to 2 0 0 17 to 18
Bath & Body Works Total 278 11 to 14 4 to 7 0 282 to 288
Victoria's Secret International
Partner - Operated Stores
Victoria's Secret Full Assortment 72 9 to 11 1 0 80 to 82
PINK 12 1 1 0 12
Victoria's Secret Beauty & Accessories - Local Market 207 3 to 4 16 to 18 0 192 to 195
Victoria's Secret Beauty & Accessories - Travel Retail 153 3 to 4 11 to 13 0 143 to 146
Victoria's Secret Full Assortment - U.K. 0 0 0 20 20
PINK - U.K. 0 0 0 5 5
Victoria's Secret Full Assortment - Ireland 0 0 0 1 1
Partner - Operated Total 444 16 to 20 29 to 33 26 453 to 461
Company - Operated Stores
Victoria's Secret Full Assortment - U.K. 20 0 0 (20) 0
PINK - U.K. 5 0 0 (5) 0
Victoria's Secret Full Assortment - Ireland 1 0 0 (1) 0
Victoria's Secret Full Assortment - Greater China 23 4 1 0 26
Victoria's Secret Beauty & Accessories - Greater China 41 1 5 0 37
Company - Operated Total 90 5 6 (26) 63
Victoria's Secret Total 534 21 to 25 35 to 39 0 516 to 524

APPENDIX
14
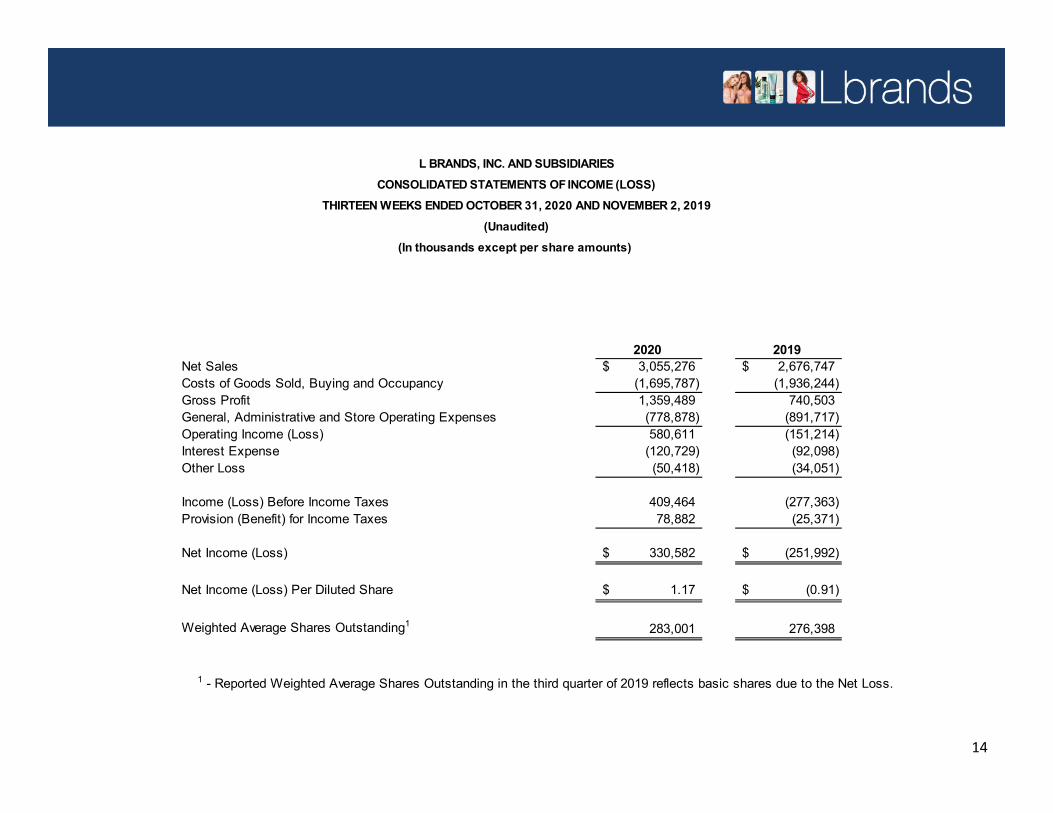
L BRANDS, INC. AND SUBSIDIARIESCONSOLIDATED STATEMENTS OF INCOME (LOSS)
THIRTEEN WEEKS ENDED OCTOBER 31, 2020 AND NOVEMBER 2, 2019(Unaudited)
(In thousands except per share amounts)
2020 2019Net Sales 3,055,276$ 2,676,747$ Costs of Goods Sold, Buying and Occupancy (1,695,787) (1,936,244) Gross Profit 1,359,489 740,503 General, Administrative and Store Operating Expenses (778,878) (891,717) Operating Income (Loss) 580,611 (151,214) Interest Expense (120,729) (92,098) Other Loss (50,418) (34,051)
Income (Loss) Before Income Taxes 409,464 (277,363) Provision (Benefit) for Income Taxes 78,882 (25,371)
Net Income (Loss) 330,582$ (251,992)$
Net Income (Loss) Per Diluted Share 1.17$ (0.91)$
Weighted Average Shares Outstanding1 283,001 276,398
1 - Reported Weighted Average Shares Outstanding in the third quarter of 2019 reflects basic shares due to the Net Loss.
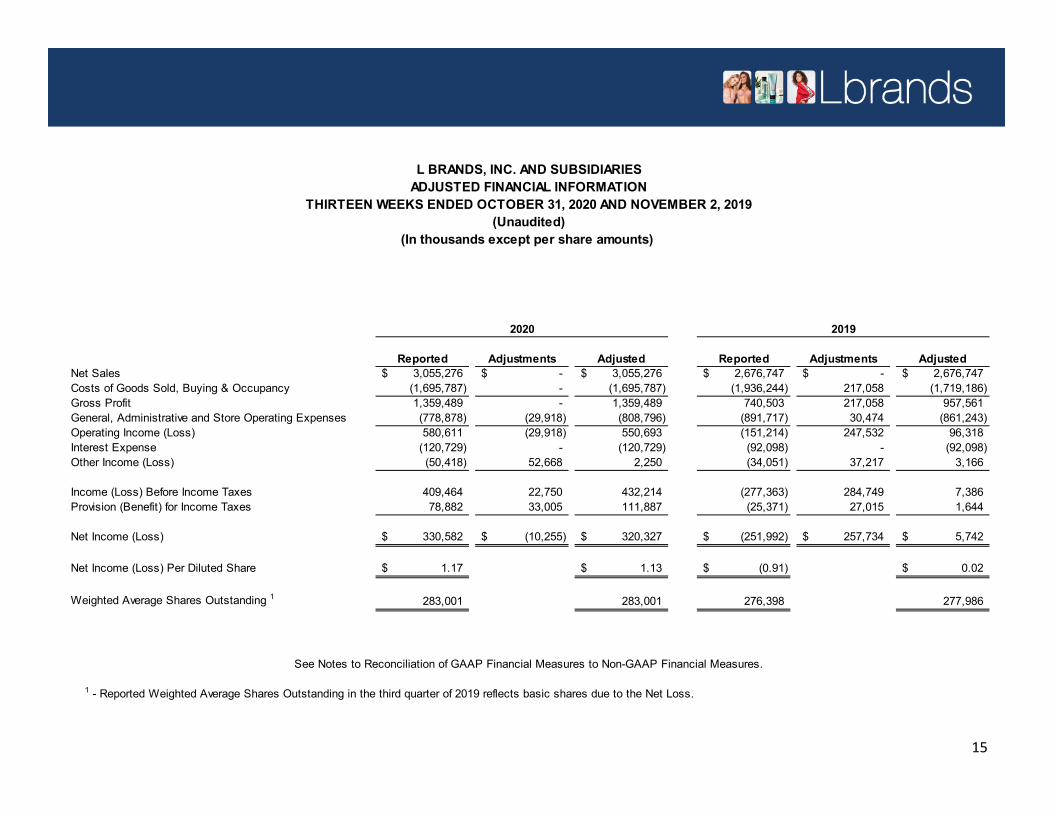
2020
Reported Adjustments Adjusted Reported Adjustments AdjustedNet Sales 3,055,276$ -$ 3,055,276$ 2,676,747$ -$ 2,676,747$ Costs of Goods Sold, Buying & Occupancy (1,695,787) - (1,695,787) (1,936,244) 217,058 (1,719,186) Gross Profit 1,359,489 - 1,359,489 740,503 217,058 957,561 General, Administrative and Store Operating Expenses (778,878) (29,918) (808,796) (891,717) 30,474 (861,243) Operating Income (Loss) 580,611 (29,918) 550,693 (151,214) 247,532 96,318 Interest Expense (120,729) - (120,729) (92,098) - (92,098) Other Income (Loss) (50,418) 52,668 2,250 (34,051) 37,217 3,166
Income (Loss) Before Income Taxes 409,464 22,750 432,214 (277,363) 284,749 7,386 Provision (Benefit) for Income Taxes 78,882 33,005 111,887 (25,371) 27,015 1,644
Net Income (Loss) 330,582$ (10,255)$ 320,327$ (251,992)$ 257,734$ 5,742$
Net Income (Loss) Per Diluted Share 1.17$ 1.13$ (0.91)$ 0.02$
Weighted Average Shares Outstanding 1 283,001 283,001 276,398 277,986
1 - Reported Weighted Average Shares Outstanding in the third quarter of 2019 reflects basic shares due to the Net Loss.
L BRANDS, INC. AND SUBSIDIARIESADJUSTED FINANCIAL INFORMATION
THIRTEEN WEEKS ENDED OCTOBER 31, 2020 AND NOVEMBER 2, 2019(Unaudited)
(In thousands except per share amounts)
See Notes to Reconciliation of GAAP Financial Measures to Non-GAAP Financial Measures.
2019
15
16
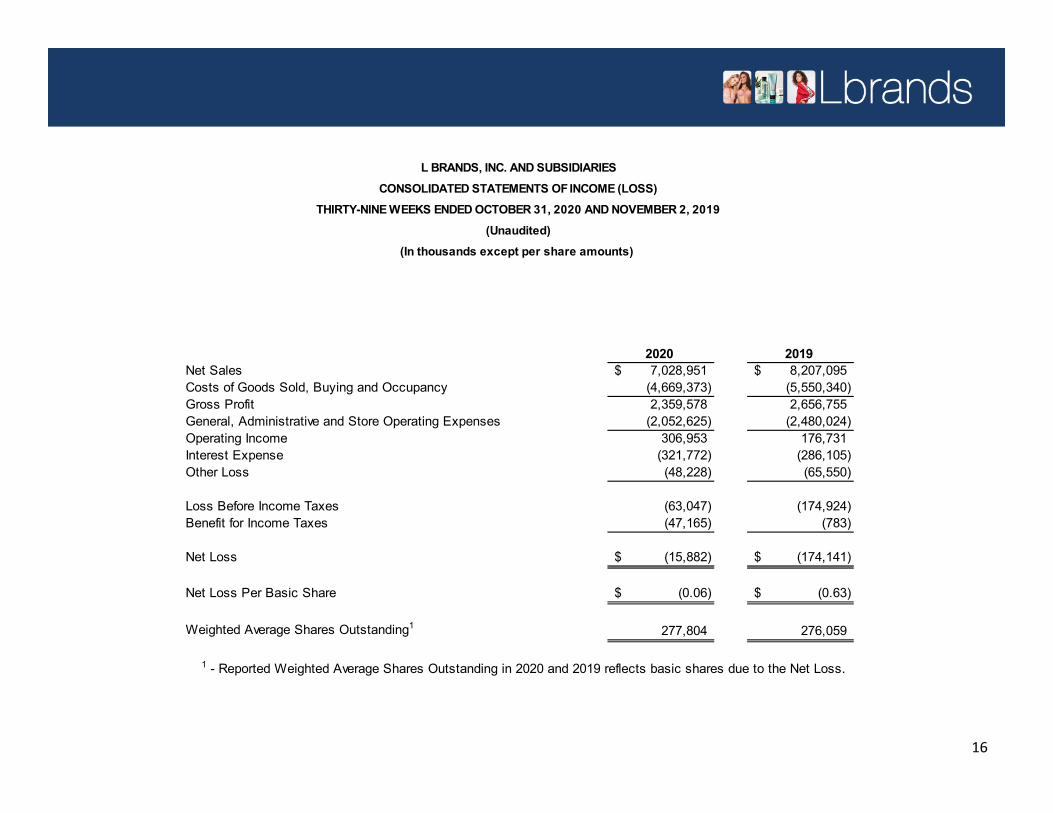
L BRANDS, INC. AND SUBSIDIARIESCONSOLIDATED STATEMENTS OF INCOME (LOSS)
THIRTY-NINE WEEKS ENDED OCTOBER 31, 2020 AND NOVEMBER 2, 2019(Unaudited)
(In thousands except per share amounts)
2020 2019Net Sales 7,028,951$ 8,207,095$ Costs of Goods Sold, Buying and Occupancy (4,669,373) (5,550,340) Gross Profit 2,359,578 2,656,755 General, Administrative and Store Operating Expenses (2,052,625) (2,480,024) Operating Income 306,953 176,731 Interest Expense (321,772) (286,105) Other Loss (48,228) (65,550)
Loss Before Income Taxes (63,047) (174,924) Benefit for Income Taxes (47,165) (783)
Net Loss (15,882)$ (174,141)$
Net Loss Per Basic Share (0.06)$ (0.63)$
Weighted Average Shares Outstanding1 277,804 276,059
1 - Reported Weighted Average Shares Outstanding in 2020 and 2019 reflects basic shares due to the Net Loss.

L BRANDS, INC. AND SUBSIDIARIES
THIRTY-NINE WEEKS ENDED OCTOBER 31, 2020 AND NOVEMBER 2, 2019(Unaudited)
(In thousands except per share amounts)
2020 2019
Reported Adjustments Adjusted Reported Adjustments AdjustedNet Sales 7,028,951$ 7,028,951$ 8,207,095$ -$ 8,207,095$ Costs of Goods Sold, Buying & Occupancy (4,669,373) 175,806 (4,493,567) (5,550,340) 217,058 (5,333,282) Gross Profit 2,359,578 175,806 2,535,384 2,656,755 217,058 2,873,813 General, Administrative and Store Operating Expenses (2,052,625) 52,749 (1,999,876) (2,480,024) 30,474 (2,449,550) Operating Income 306,953 228,555 535,508 176,731 247,532 424,263 Interest Expense (321,772) (321,772) (286,105) - (286,105) Other Income (Loss) (48,228) 52,668 4,440 (65,550) 76,781 11,231
Income (Loss) Before Income Taxes (63,047) 281,223 218,176 (174,924) 324,313 149,389 Provision (Benefit) for Income Taxes (47,165) 151,205 104,040 (783) 36,547 35,764
Net Income (Loss) (15,882)$ 130,018$ 114,136$ (174,141)$ 287,766$ 113,625$
Net Income (Loss) Per Diluted Share (0.06)$ 0.41$ (0.63)$ 0.41$
Weighted Average Shares Outstanding 1 277,804 280,694 276,059 278,213
1 - Reported Weighted Average Shares Outstanding in 2020 and 2019 reflects basic shares due to the Net Loss.
See Notes to Reconciliation of GAAP Financial Measures to Non-GAAP Financial Measures.
ADJUSTED FINANCIAL INFORMATION
17
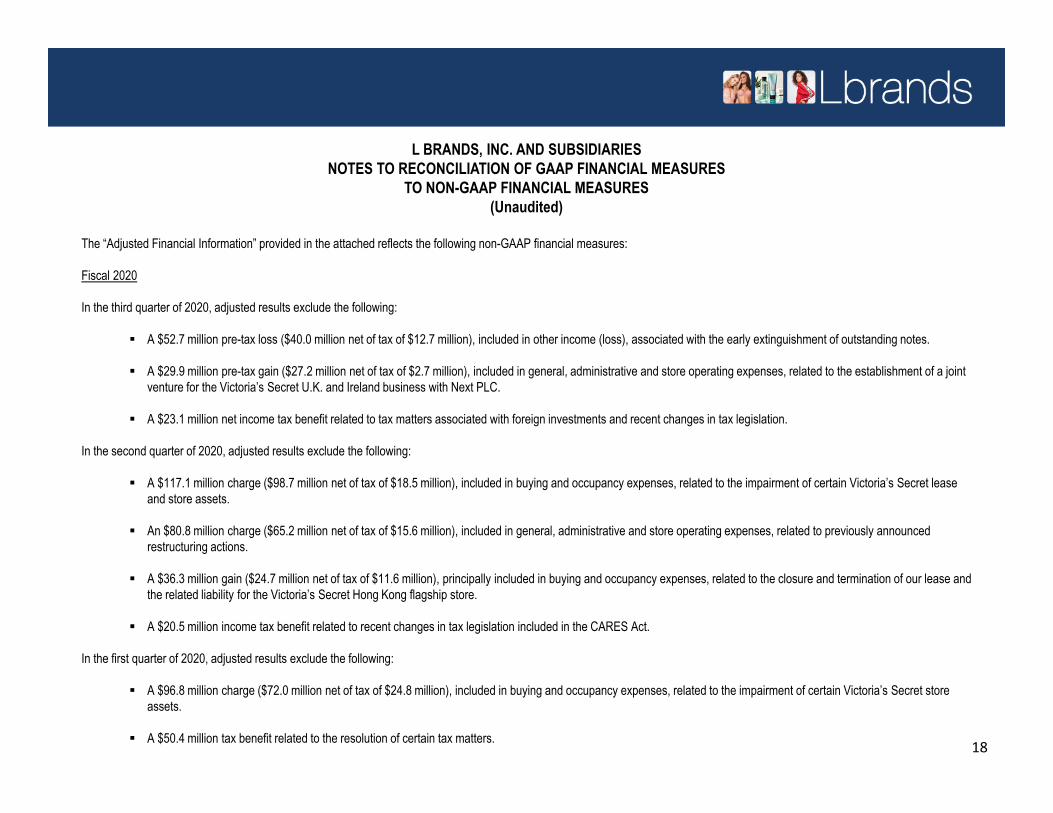
L BRANDS, INC. AND SUBSIDIARIESNOTES TO RECONCILIATION OF GAAP FINANCIAL MEASURES
TO NON-GAAP FINANCIAL MEASURES(Unaudited)
The “Adjusted Financial Information” provided in the attached reflects the following non-GAAP financial measures:
Fiscal 2020
In the third quarter of 2020, adjusted results exclude the following:
A $52.7 million pre-tax loss ($40.0 million net of tax of $12.7 million), included in other income (loss), associated with the early extinguishment of outstanding notes.
A $29.9 million pre-tax gain ($27.2 million net of tax of $2.7 million), included in general, administrative and store operating expenses, related to the establishment of a joint venture for the Victoria’s Secret U.K. and Ireland business with Next PLC.
A $23.1 million net income tax benefit related to tax matters associated with foreign investments and recent changes in tax legislation.
In the second quarter of 2020, adjusted results exclude the following:
A $117.1 million charge ($98.7 million net of tax of $18.5 million), included in buying and occupancy expenses, related to the impairment of certain Victoria’s Secret lease and store assets.
An $80.8 million charge ($65.2 million net of tax of $15.6 million), included in general, administrative and store operating expenses, related to previously announced restructuring actions.
A $36.3 million gain ($24.7 million net of tax of $11.6 million), principally included in buying and occupancy expenses, related to the closure and termination of our lease and the related liability for the Victoria’s Secret Hong Kong flagship store.
A $20.5 million income tax benefit related to recent changes in tax legislation included in the CARES Act.
In the first quarter of 2020, adjusted results exclude the following:
A $96.8 million charge ($72.0 million net of tax of $24.8 million), included in buying and occupancy expenses, related to the impairment of certain Victoria’s Secret store assets.
A $50.4 million tax benefit related to the resolution of certain tax matters. 18

L BRANDS, INC. AND SUBSIDIARIESNOTES TO RECONCILIATION OF GAAP FINANCIAL MEASURES
TO NON-GAAP FINANCIAL MEASURES(Unaudited)
The “Adjusted Financial Information” provided in the attached reflects the following non-GAAP financial measures:
Fiscal 2019
In the third quarter of 2019, adjusted results exclude the following:
A $247.5 million charge ($230.0 million net of tax of $17.5 million), $217.1 million included in buying and occupancy expenses and $30.5 million included in general, administrative and store operating expenses, related to the impairment of certain Victoria’s Secret store and other assets.
A $37.2 million charge ($27.7 million net of tax of $9.5 million), included in other income (loss), to increase reserves related to ongoing guarantees for the La Senza business which was sold in the fourth quarter of 2018.
In the second quarter of 2019, adjusted results exclude the following:
A $39.6 million pre-tax loss ($30.0 million net of tax of $9.5 million), included in other income (loss), associated with the early extinguishment of $764 million in outstanding notes maturing between 2020 and 2022 through the issuance of $500 million of new notes maturing in 2029 and the use of $315 million in cash, lowering total debt by $264 million.
In the first quarter of 2019, there were no adjustments to results.
The Adjusted Financial Information should not be construed as an alternative to the reported results determined in accordance with generally accepted accounting principles. Further, theCompany’s definition of adjusted income information may differ from similarly titled measures used by other companies. Management believes that the presentation of adjusted financialinformation provides additional information to investors to facilitate the comparison of past and present operations. While it is not possible to predict future results, management believesthe adjusted information is useful for the assessment of the ongoing operations of the Company because the adjusted items are not indicative of our ongoing operations due to their sizeand nature. Additionally, management uses adjusted financial information as key performance measures of results of operations for the purpose of evaluating performance internally.The Adjusted Financial Information should be read in conjunction with the Company’s historical financial statements and notes thereto contained in the Company’s quarterly reports onForm 10-Q and annual report on Form 10-K.
19
20
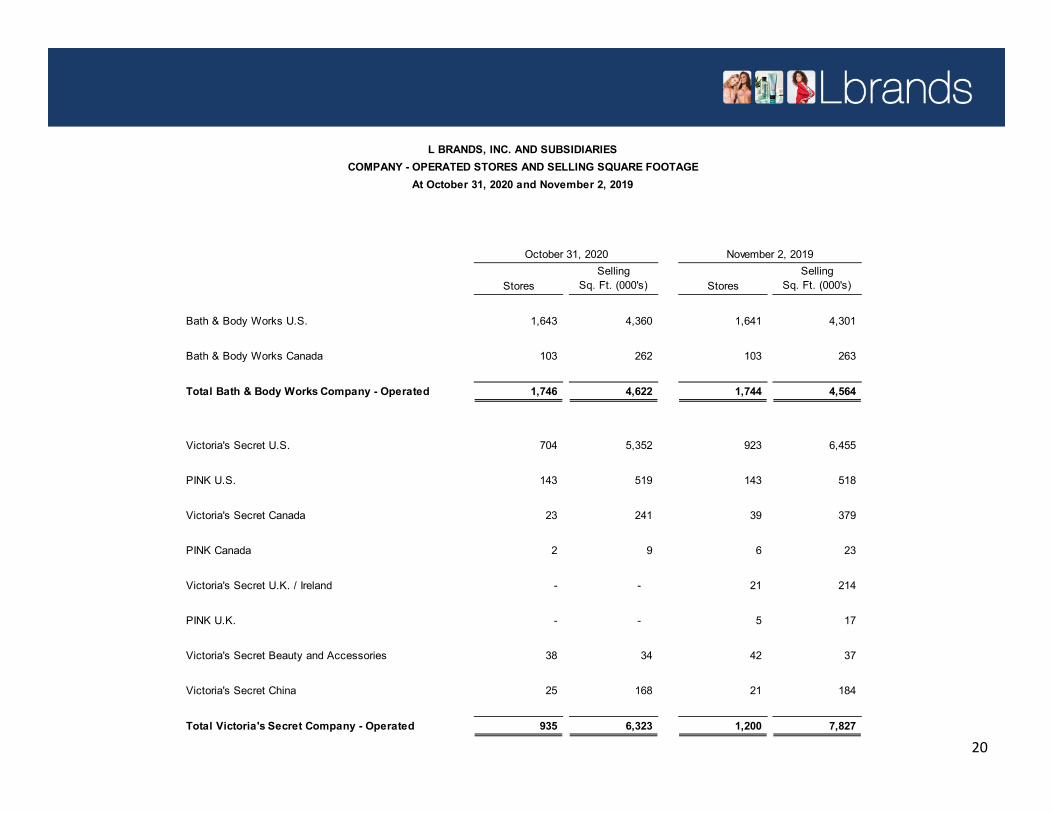
L BRANDS, INC. AND SUBSIDIARIESCOMPANY - OPERATED STORES AND SELLING SQUARE FOOTAGE
At October 31, 2020 and November 2, 2019
StoresSelling
Sq. Ft. (000's) StoresSelling
Sq. Ft. (000's)
Bath & Body Works U.S. 1,643 4,360 1,641 4,301
Bath & Body Works Canada 103 262 103 263
Total Bath & Body Works Company - Operated 1,746 4,622 1,744 4,564
Victoria's Secret U.S. 704 5,352 923 6,455
PINK U.S. 143 519 143 518
Victoria's Secret Canada 23 241 39 379
PINK Canada 2 9 6 23
Victoria's Secret U.K. / Ireland - - 21 214
PINK U.K. - - 5 17
Victoria's Secret Beauty and Accessories 38 34 42 37
Victoria's Secret China 25 168 21 184
Total Victoria's Secret Company - Operated 935 6,323 1,200 7,827
November 2, 2019October 31, 2020
21
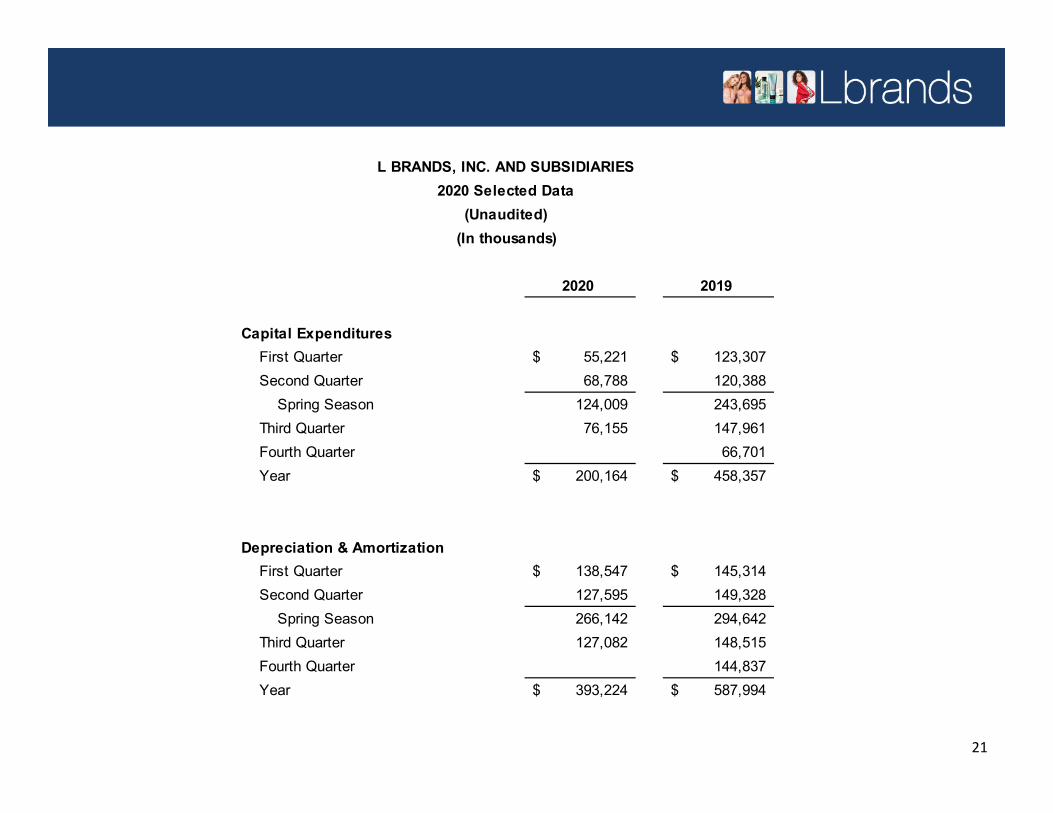
L BRANDS, INC. AND SUBSIDIARIES2020 Selected Data
(Unaudited)(In thousands)
2020 2019
Capital ExpendituresFirst Quarter 55,221$ 123,307$ Second Quarter 68,788 120,388
Spring Season 124,009 243,695 Third Quarter 76,155 147,961 Fourth Quarter 66,701 Year 200,164$ 458,357$
Depreciation & AmortizationFirst Quarter 138,547$ 145,314$ Second Quarter 127,595 149,328
Spring Season 266,142 294,642 Third Quarter 127,082 148,515 Fourth Quarter 144,837 Year 393,224$ 587,994$
22
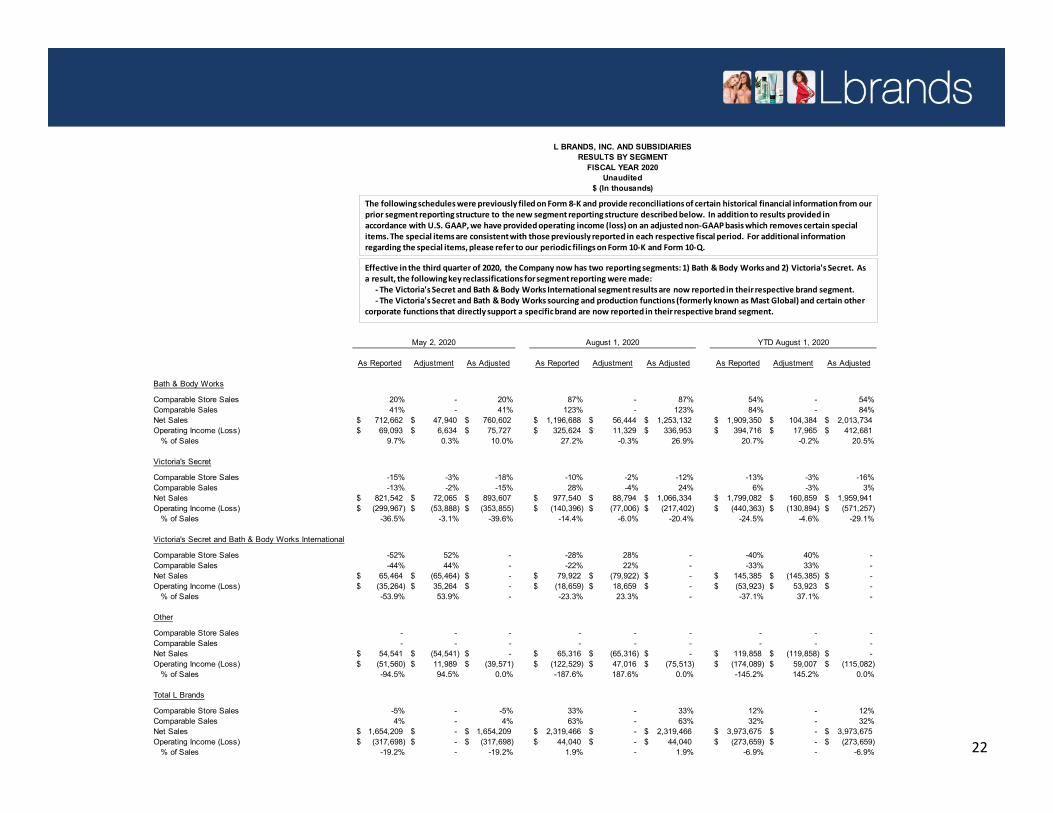
As Reported Adjustment As Adjusted As Reported Adjustment As Adjusted As Reported Adjustment As Adjusted
Bath & Body Works
Comparable Store Sales 20% - 20% 87% - 87% 54% - 54%Comparable Sales 41% - 41% 123% - 123% 84% - 84%Net Sales 712,662$ 47,940$ 760,602$ 1,196,688$ 56,444$ 1,253,132$ 1,909,350$ 104,384$ 2,013,734$ Operating Income (Loss) 69,093$ 6,634$ 75,727$ 325,624$ 11,329$ 336,953$ 394,716$ 17,965$ 412,681$
% of Sales 9.7% 0.3% 10.0% 27.2% -0.3% 26.9% 20.7% -0.2% 20.5%
Victoria's Secret
Comparable Store Sales -15% -3% -18% -10% -2% -12% -13% -3% -16%Comparable Sales -13% -2% -15% 28% -4% 24% 6% -3% 3%Net Sales 821,542$ 72,065$ 893,607$ 977,540$ 88,794$ 1,066,334$ 1,799,082$ 160,859$ 1,959,941$ Operating Income (Loss) (299,967)$ (53,888)$ (353,855)$ (140,396)$ (77,006)$ (217,402)$ (440,363)$ (130,894)$ (571,257)$
% of Sales -36.5% -3.1% -39.6% -14.4% -6.0% -20.4% -24.5% -4.6% -29.1%
Victoria's Secret and Bath & Body Works International
Comparable Store Sales -52% 52% - -28% 28% - -40% 40% - Comparable Sales -44% 44% - -22% 22% - -33% 33% - Net Sales 65,464$ (65,464)$ -$ 79,922$ (79,922)$ -$ 145,385$ (145,385)$ -$ Operating Income (Loss) (35,264)$ 35,264$ -$ (18,659)$ 18,659$ -$ (53,923)$ 53,923$ -$
% of Sales -53.9% 53.9% - -23.3% 23.3% - -37.1% 37.1% -
Other
Comparable Store Sales - - - - - - - - - Comparable Sales - - - - - - - - - Net Sales 54,541$ (54,541)$ -$ 65,316$ (65,316)$ -$ 119,858$ (119,858)$ -$ Operating Income (Loss) (51,560)$ 11,989$ (39,571)$ (122,529)$ 47,016$ (75,513)$ (174,089)$ 59,007$ (115,082)$
% of Sales -94.5% 94.5% 0.0% -187.6% 187.6% 0.0% -145.2% 145.2% 0.0%
Total L Brands
Comparable Store Sales -5% - -5% 33% - 33% 12% - 12%Comparable Sales 4% - 4% 63% - 63% 32% - 32%Net Sales 1,654,209$ -$ 1,654,209$ 2,319,466$ -$ 2,319,466$ 3,973,675$ -$ 3,973,675$ Operating Income (Loss) (317,698)$ -$ (317,698)$ 44,040$ -$ 44,040$ (273,659)$ -$ (273,659)$
% of Sales -19.2% - -19.2% 1.9% - 1.9% -6.9% - -6.9%
May 2, 2020 August 1, 2020 YTD August 1, 2020
L BRANDS, INC. AND SUBSIDIARIESRESULTS BY SEGMENT
FISCAL YEAR 2020Unaudited
$ (In thousands)
Effective in the third quarter of 2020, the Company now has two reporting segments: 1) Bath & Body Works and 2) Victoria's Secret. As a result, the following key reclassifications for segment reporting were made:
‐ The Victoria's Secret and Bath & Body Works International segment results are now reported in their respective brand segment. ‐ The Victoria's Secret and Bath & Body Works sourcing and production functions (formerly known as Mast Global) and certain other
corporate functions that directly support a specific brand are now reported in their respective brand segment.
The following schedules were previously filed on Form 8‐K and provide reconciliations of certain historical financial information from our prior segment reporting structure to the new segment reporting structure described below. In addition to results provided in accordance with U.S. GAAP, we have provided operating income (loss) on an adjusted non‐GAAP basis which removes certain special items. The special items are consistent with those previously reported in each respective fiscal period. For additional information regarding the special items, please refer to our periodic filings on Form 10‐K and Form 10‐Q.
23
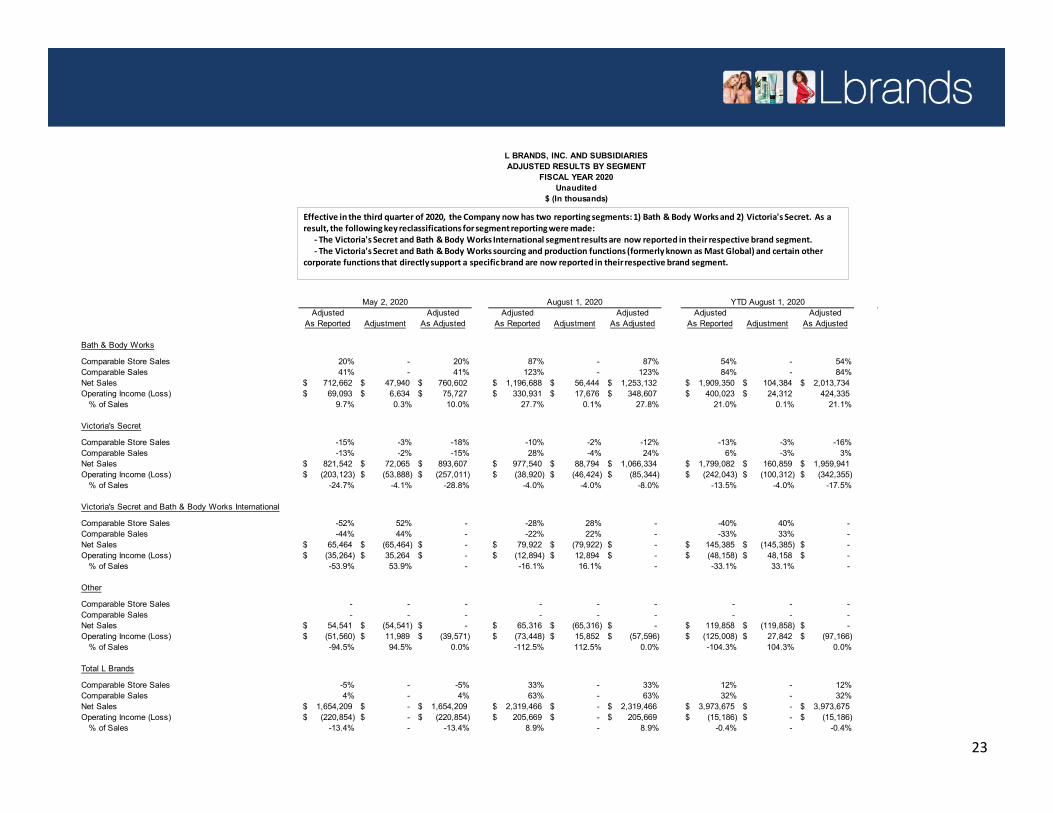
Adjusted Adjusted Adjusted Adjusted Adjusted AdjustedAs Reported Adjustment As Adjusted As Reported Adjustment As Adjusted As Reported Adjustment As Adjusted
Bath & Body Works
Comparable Store Sales 20% - 20% 87% - 87% 54% - 54%Comparable Sales 41% - 41% 123% - 123% 84% - 84%Net Sales 712,662$ 47,940$ 760,602$ 1,196,688$ 56,444$ 1,253,132$ 1,909,350$ 104,384$ 2,013,734$ Operating Income (Loss) 69,093$ 6,634$ 75,727$ 330,931$ 17,676$ 348,607$ 400,023$ 24,312$ 424,335
% of Sales 9.7% 0.3% 10.0% 27.7% 0.1% 27.8% 21.0% 0.1% 21.1%
Victoria's Secret
Comparable Store Sales -15% -3% -18% -10% -2% -12% -13% -3% -16%Comparable Sales -13% -2% -15% 28% -4% 24% 6% -3% 3%Net Sales 821,542$ 72,065$ 893,607$ 977,540$ 88,794$ 1,066,334$ 1,799,082$ 160,859$ 1,959,941$ Operating Income (Loss) (203,123)$ (53,888)$ (257,011)$ (38,920)$ (46,424)$ (85,344)$ (242,043)$ (100,312)$ (342,355)$
% of Sales -24.7% -4.1% -28.8% -4.0% -4.0% -8.0% -13.5% -4.0% -17.5%
Victoria's Secret and Bath & Body Works International
Comparable Store Sales -52% 52% - -28% 28% - -40% 40% - Comparable Sales -44% 44% - -22% 22% - -33% 33% - Net Sales 65,464$ (65,464)$ -$ 79,922$ (79,922)$ -$ 145,385$ (145,385)$ -$ Operating Income (Loss) (35,264)$ 35,264$ -$ (12,894)$ 12,894$ -$ (48,158)$ 48,158$ -$
% of Sales -53.9% 53.9% - -16.1% 16.1% - -33.1% 33.1% -
Other
Comparable Store Sales - - - - - - - - - Comparable Sales - - - - - - - - - Net Sales 54,541$ (54,541)$ -$ 65,316$ (65,316)$ -$ 119,858$ (119,858)$ -$ Operating Income (Loss) (51,560)$ 11,989$ (39,571)$ (73,448)$ 15,852$ (57,596)$ (125,008)$ 27,842$ (97,166)$
% of Sales -94.5% 94.5% 0.0% -112.5% 112.5% 0.0% -104.3% 104.3% 0.0%
Total L Brands
Comparable Store Sales -5% - -5% 33% - 33% 12% - 12%Comparable Sales 4% - 4% 63% - 63% 32% - 32%Net Sales 1,654,209$ -$ 1,654,209$ 2,319,466$ -$ 2,319,466$ 3,973,675$ -$ 3,973,675$ Operating Income (Loss) (220,854)$ -$ (220,854)$ 205,669$ -$ 205,669$ (15,186)$ -$ (15,186)$
% of Sales -13.4% - -13.4% 8.9% - 8.9% -0.4% - -0.4%
May 2, 2020 August 1, 2020 YTD August 1, 2020
L BRANDS, INC. AND SUBSIDIARIESADJUSTED RESULTS BY SEGMENT
FISCAL YEAR 2020
$ (In thousands)Unaudited
Effective in the third quarter of 2020, the Company now has two reporting segments: 1) Bath & Body Works and 2) Victoria's Secret. As a result, the following key reclassifications for segment reporting were made:
‐ The Victoria's Secret and Bath & Body Works International segment results are now reported in their respective brand segment. ‐ The Victoria's Secret and Bath & Body Works sourcing and production functions (formerly known as Mast Global) and certain other
corporate functions that directly support a specific brand are now reported in their respective brand segment.
24
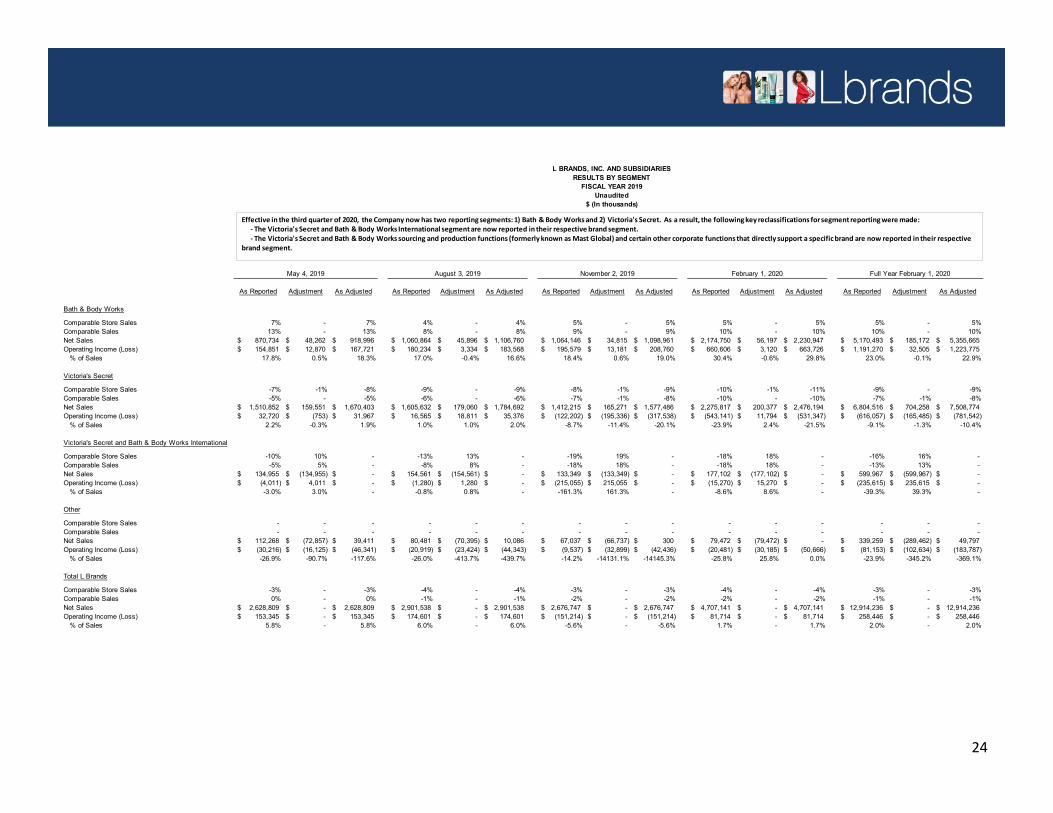
As Reported Adjustment As Adjusted As Reported Adjustment As Adjusted As Reported Adjustment As Adjusted As Reported Adjustment As Adjusted As Reported Adjustment As Adjusted
Bath & Body Works
Comparable Store Sales 7% - 7% 4% - 4% 5% - 5% 5% - 5% 5% - 5%Comparable Sales 13% - 13% 8% - 8% 9% - 9% 10% - 10% 10% - 10%Net Sales 870,734$ 48,262$ 918,996$ 1,060,864$ 45,896$ 1,106,760$ 1,064,146$ 34,815$ 1,098,961$ 2,174,750$ 56,197$ 2,230,947$ 5,170,493$ 185,172$ 5,355,665$ Operating Income (Loss) 154,851$ 12,870$ 167,721$ 180,234$ 3,334$ 183,568$ 195,579$ 13,181$ 208,760$ 660,606$ 3,120$ 663,726$ 1,191,270$ 32,505$ 1,223,775$
% of Sales 17.8% 0.5% 18.3% 17.0% -0.4% 16.6% 18.4% 0.6% 19.0% 30.4% -0.6% 29.8% 23.0% -0.1% 22.9%
Victoria's Secret
Comparable Store Sales -7% -1% -8% -9% - -9% -8% -1% -9% -10% -1% -11% -9% - -9%Comparable Sales -5% - -5% -6% - -6% -7% -1% -8% -10% - -10% -7% -1% -8%Net Sales 1,510,852$ 159,551$ 1,670,403$ 1,605,632$ 179,060$ 1,784,692$ 1,412,215$ 165,271$ 1,577,486$ 2,275,817$ 200,377$ 2,476,194$ 6,804,516$ 704,258$ 7,508,774$ Operating Income (Loss) 32,720$ (753)$ 31,967$ 16,565$ 18,811$ 35,376$ (122,202)$ (195,336)$ (317,538)$ (543,141)$ 11,794$ (531,347)$ (616,057)$ (165,485)$ (781,542)$
% of Sales 2.2% -0.3% 1.9% 1.0% 1.0% 2.0% -8.7% -11.4% -20.1% -23.9% 2.4% -21.5% -9.1% -1.3% -10.4%
Victoria's Secret and Bath & Body Works International
Comparable Store Sales -10% 10% - -13% 13% - -19% 19% - -18% 18% - -16% 16% - Comparable Sales -5% 5% - -8% 8% - -18% 18% - -18% 18% - -13% 13% - Net Sales 134,955$ (134,955)$ -$ 154,561$ (154,561)$ -$ 133,349$ (133,349)$ -$ 177,102$ (177,102)$ -$ 599,967$ (599,967)$ -$ Operating Income (Loss) (4,011)$ 4,011$ -$ (1,280)$ 1,280$ -$ (215,055)$ 215,055$ -$ (15,270)$ 15,270$ -$ (235,615)$ 235,615$ -$
% of Sales -3.0% 3.0% - -0.8% 0.8% - -161.3% 161.3% - -8.6% 8.6% - -39.3% 39.3% -
Other
Comparable Store Sales - - - - - - - - - - - - - - - Comparable Sales - - - - - - - - - - - - - - - Net Sales 112,268$ (72,857)$ 39,411$ 80,481$ (70,395)$ 10,086$ 67,037$ (66,737)$ 300$ 79,472$ (79,472)$ -$ 339,259$ (289,462)$ 49,797$ Operating Income (Loss) (30,216)$ (16,125)$ (46,341)$ (20,919)$ (23,424)$ (44,343)$ (9,537)$ (32,899)$ (42,436)$ (20,481)$ (30,185)$ (50,666)$ (81,153)$ (102,634)$ (183,787)$
% of Sales -26.9% -90.7% -117.6% -26.0% -413.7% -439.7% -14.2% -14131.1% -14145.3% -25.8% 25.8% 0.0% -23.9% -345.2% -369.1%
Total L Brands
Comparable Store Sales -3% - -3% -4% - -4% -3% - -3% -4% - -4% -3% - -3%Comparable Sales 0% - 0% -1% - -1% -2% - -2% -2% - -2% -1% - -1%Net Sales 2,628,809$ -$ 2,628,809$ 2,901,538$ -$ 2,901,538$ 2,676,747$ -$ 2,676,747$ 4,707,141$ -$ 4,707,141$ 12,914,236$ -$ 12,914,236$ Operating Income (Loss) 153,345$ -$ 153,345$ 174,601$ -$ 174,601$ (151,214)$ -$ (151,214)$ 81,714$ -$ 81,714$ 258,446$ -$ 258,446$
% of Sales 5.8% - 5.8% 6.0% - 6.0% -5.6% - -5.6% 1.7% - 1.7% 2.0% - 2.0%
May 4, 2019 August 3, 2019 November 2, 2019 February 1, 2020 Full Year February 1, 2020
L BRANDS, INC. AND SUBSIDIARIESRESULTS BY SEGMENT
FISCAL YEAR 2019Unaudited
$ (In thousands)
Effective in the third quarter of 2020, the Company now has two reporting segments: 1) Bath & Body Works and 2) Victoria's Secret. As a result, the following key reclassifications for segment reporting were made:‐ The Victoria's Secret and Bath & Body Works International segmentare now reported in their respective brand segment. ‐ The Victoria's Secret and Bath & Body Works sourcing and production functions (formerly known as Mast Global) and certain other corporate functions that directly support a specific brand are now reported in their respective
brand segment.

25
Adjusted Adjusted Adjusted Adjusted Adjusted Adjusted Adjusted Adjusted Adjusted AdjustedAs Reported Adjustment As Adjusted As Reported Adjustment As Adjusted As Reported Adjustment As Adjusted As Reported Adjustment As Adjusted As Reported Adjustment As Adjusted
Bath & Body Works
Comparable Store Sales 7% - 7% 4% - 4% 5% - 5% 5% - 5% 5% - 5%Comparable Sales 13% - 13% 8% - 8% 9% - 9% 10% - 10% 10% - 10%Net Sales 870,734$ 48,262$ 918,996$ 1,060,864$ 45,896$ 1,106,760$ 1,064,146$ 34,815$ 1,098,961$ 2,174,750$ 56,197$ 2,230,947$ 5,170,493$ 185,172$ 5,355,665$ Operating Income (Loss) 154,851$ 12,870$ 167,721$ 180,234$ 3,334$ 183,568$ 195,579$ 13,181$ 208,760$ 660,606$ 3,120$ 663,726$ 1,191,270$ 32,505$ 1,223,775$
% of Sales 17.8% 0.5% 18.3% 17.0% -0.4% 16.6% 18.4% 0.6% 19.0% 30.4% -0.6% 29.8% 23.0% -0.1% 22.9%
Victoria's Secret
Comparable Store Sales -7% -1% -8% -9% - -9% -8% -1% -9% -10% -1% -11% -9% - -9%Comparable Sales -5% - -5% -6% - -6% -7% -1% -8% -10% - -10% -7% -1% -8%Net Sales 1,510,852$ 159,551$ 1,670,403$ 1,605,632$ 179,060$ 1,784,692$ 1,412,215$ 165,271$ 1,577,486$ 2,275,817$ 200,377$ 2,476,194$ 6,804,516$ 704,258$ 7,508,774$ Operating Income (Loss) 32,720$ (753)$ 31,967$ 16,565$ 18,811$ 35,376$ (81,072)$ 11,067$ (70,005)$ 146,435$ 47,178$ 193,613$ 114,649$ 76,302$ 190,951$
% of Sales 2.2% -0.3% 1.9% 1.0% 1.0% 2.0% -5.7% 1.3% -4.4% 6.4% 1.4% 7.8% 1.7% 0.8% 2.5%
Victoria's Secret and Bath & Body Works International
Comparable Store Sales -10% 10% - -13% 13% - -19% 19% - -18% 18% - -16% 16% - Comparable Sales -5% 5% - -8% 8% - -18% 18% - -18% 18% - -13% 13% - Net Sales 134,955$ (134,955)$ -$ 154,561$ (154,561)$ -$ 133,349$ (133,349)$ -$ 177,102$ (177,102)$ -$ 599,967$ (599,967)$ -$ Operating Income (Loss) (4,011)$ 4,011$ -$ (1,280)$ 1,280$ -$ (8,653)$ 8,653$ -$ 20,114$ (20,114)$ -$ 6,172$ (6,172)$ -$
% of Sales -3.0% -3.0% - -0.8% -0.8% - -6.5% -6.5% - 11.4% 11.4% - 1.0% 1.0% -
Other
Comparable Store Sales - - - - - - - - - - - - - - - Comparable Sales - - - - - - - - - - - - - - - Net Sales 112,268$ (72,857)$ 39,411$ 80,481$ (70,395)$ 10,086$ 67,037$ (66,737)$ 300$ 79,472$ (79,472)$ -$ 339,259$ (289,462)$ 49,797$ Operating Income (Loss) (30,216)$ (16,125)$ (46,341)$ (20,919)$ (23,424)$ (44,343)$ (9,537)$ (32,899)$ (42,436)$ (20,481)$ (30,185)$ (50,666)$ (81,153)$ (102,634)$ (183,787)$
% of Sales -26.9% -90.7% -117.6% -26.0% -413.7% -439.7% -14.2% -14131.1% -14145.3% -25.8% 25.8% 0.0% -23.9% -345.2% -369.1%
Total L Brands
Comparable Store Sales -3% - -3% -4% - -4% -3% - -3% -4% - -4% -3% - -3%Comparable Sales 0% - 0% -1% - -1% -2% - -2% -2% - -2% -1% - -1%Net Sales 2,628,809$ -$ 2,628,809$ 2,901,538$ -$ 2,901,538$ 2,676,747$ -$ 2,676,747$ 4,707,141$ -$ 4,707,141$ 12,914,236$ -$ 12,914,236$ Operating Income (Loss) 153,345$ -$ 153,345$ 174,601$ -$ 174,601$ 96,318$ -$ 96,318$ 806,674$ -$ 806,674$ 1,230,939$ -$ 1,230,939$
% of Sales 5.8% - 5.8% 6.0% - 6.0% 3.6% - 3.6% 17.1% - 17.1% 9.5% - 9.5%
L BRANDS, INC. AND SUBSIDIARIESADJUSTED RESULTS BY SEGMENT
FISCAL YEAR 2019
$ (In thousands)
May 4, 2019 August 3, 2019 November 2, 2019 February 1, 2020 Full Year February 1, 2020
Unaudited
Effective in the third quarter of 2020, the Company now has two reporting segments: 1) Bath & Body Works and 2) Victoria's Secret. As a result, the following key reclassifications for segment reporting were made:‐ The Victoria's Secret and Bath & Body Works International segmentresults are now reported in their respective brand segment. ‐ The Victoria's Secret and Bath & Body Works sourcing and production functions (formerly known as Mast Global) and certain other corporate functions that directly support a specific brand are now reported in their
respective brand segment.

As Reported Adjustment As Adjusted As Reported Adjustment As Adjusted As Reported Adjustment As Adjusted As Reported Adjustment As Adjusted As Reported Adjustment As Adjusted
Bath & Body Works
Comparable Store Sales 5% - 5% 7% - 7% 10% - 10% 8% - 8% 8% - 8%Comparable Sales 8% - 8% 10% - 10% 13% - 13% 12% - 12% 11% - 11%Net Sales 760,434$ 27,582$ 788,016$ 963,586$ 38,235$ 1,001,821$ 956,202$ 34,357$ 990,559$ 1,950,798$ 44,337$ 1,995,135$ 4,631,020$ 144,512$ 4,775,532$ Operating Income (Loss) 123,660$ 5,691$ 129,351$ 168,766$ 3,787$ 172,553$ 177,845$ 13,082$ 190,927$ 607,183$ 3,070$ 610,253$ 1,077,454$ 25,632$ 1,103,086$
% of Sales 16.3% 0.1% 16.4% 17.5% -0.3% 17.2% 18.6% 0.7% 19.3% 31.1% -0.5% 30.6% 23.3% -0.2% 23.1%
Victoria's Secret
Comparable Store Sales -5% - -5% -5% - -5% -6% - -6% -7% - -7% -6% - -6%Comparable Sales 1% -1% 0% -1% - -1% -2% 1% -1% -3% - -3% -2% - -2%Net Sales 1,589,427$ 169,825$ 1,759,252$ 1,724,803$ 172,876$ 1,897,679$ 1,528,799$ 166,907$ 1,695,706$ 2,531,836$ 218,285$ 2,750,121$ 7,374,864$ 727,894$ 8,102,758$ Operating Income (Loss) 83,170$ 6,736$ 89,906$ 114,250$ 8,450$ 122,700$ (35,872)$ (19,855)$ (55,727)$ 300,739$ 60,164$ 360,903$ 462,288$ 55,495$ 517,783$
% of Sales 5.2% -0.1% 5.1% 6.6% -0.1% 6.5% -2.3% -1.0% -3.3% 11.9% 1.2% 13.1% 6.3% 0.1% 6.4%
Victoria's Secret and Bath & Body Works International
Comparable Store Sales -20% 20% - -14% 14% - -10% 10% - -9% 9% - -13% 13% - Comparable Sales -6% 6% - 2% -2% - -1% 1% - 0% - - -1% 1% - Net Sales 135,117$ (135,117)$ -$ 145,489$ (145,489)$ -$ 134,004$ (134,004)$ -$ 190,673$ (190,673)$ -$ 605,284$ (605,284)$ -$ Operating Income (Loss) (4,803)$ 4,803$ -$ (9,392)$ 9,392$ -$ (41,806)$ 41,806$ -$ 18,666$ (18,666)$ -$ (37,335)$ 37,335$ -$
% of Sales -3.6% 3.6% - -6.5% 6.5% - -31.2% 31.2% - 9.8% -9.8% - -6.2% 6.2% -
Other
Comparable Store Sales -1% - -1% -2% - -2% 5% - 5% 8% - 8% 3% - 3%Comparable Sales 3% - 3% 1% - 1% 10% - 10% 13% - 13% 7% - 7%Net Sales 140,868$ (62,291)$ 78,577$ 149,972$ (65,623)$ 84,349$ 155,868$ (67,259)$ 88,609$ 179,003$ (71,949)$ 107,054$ 625,710$ (267,121)$ 358,589$ Operating Income (Loss) (47,220)$ (17,232)$ (64,452)$ (45,488)$ (21,628)$ (67,116)$ (45,772)$ (35,033)$ (80,805)$ (127,141)$ (44,565)$ (171,706)$ (265,620)$ (118,462)$ (384,082)$
% of Sales -33.5% -48.5% -82.0% -30.3% -49.3% -79.6% -29.4% -61.8% -91.2% -71.0% -89.4% -160.4% -42.5% -64.6% -107.1%
Total L Brands
Comparable Store Sales -2% - -2% -1% - -1% 0% - 0% -1% - -1% -1% - -1%Comparable Sales 3% - 3% 3% - 3% 4% - 4% 3% - 3% 3% - 3%Net Sales 2,625,846$ -$ 2,625,846$ 2,983,849$ -$ 2,983,849$ 2,774,874$ -$ 2,774,874$ 4,852,309$ -$ 4,852,309$ 13,236,878$ -$ 13,236,878$ Operating Income (Loss) 154,807$ -$ 154,807$ 228,137$ -$ 228,137$ 54,396$ -$ 54,396$ 799,448$ -$ 799,448$ 1,236,787$ -$ 1,236,787$
% of Sales 5.9% - 5.9% 7.6% - 7.6% 2.0% - 2.0% 16.5% - 16.5% 9.3% - 9.3%
L BRANDS, INC. AND SUBSIDIARIESRESULTS BY SEGMENT
FISCAL YEAR 2018Unaudited
May 5, 2018 August 4, 2018 November 3, 2018 February 2, 2019 Full Year February 2, 2019
$ (In thousands)
Effective in the third quarter of 2020, the Company now has two reporting segments: 1) Bath & Body Works and 2) Victoria's Secret. As a result, the following key reclassifications for segment reporting were made:‐ The Victoria's Secret and Bath & Body Works International segment results are now reported in their respective brand segment. ‐ The Victoria's Secret and Bath & Body Works sourcing and production functions (formerly known as Mast Global) and certain other corporate functions that directly support a specific brand are now reported in their respective
brand segment.
26
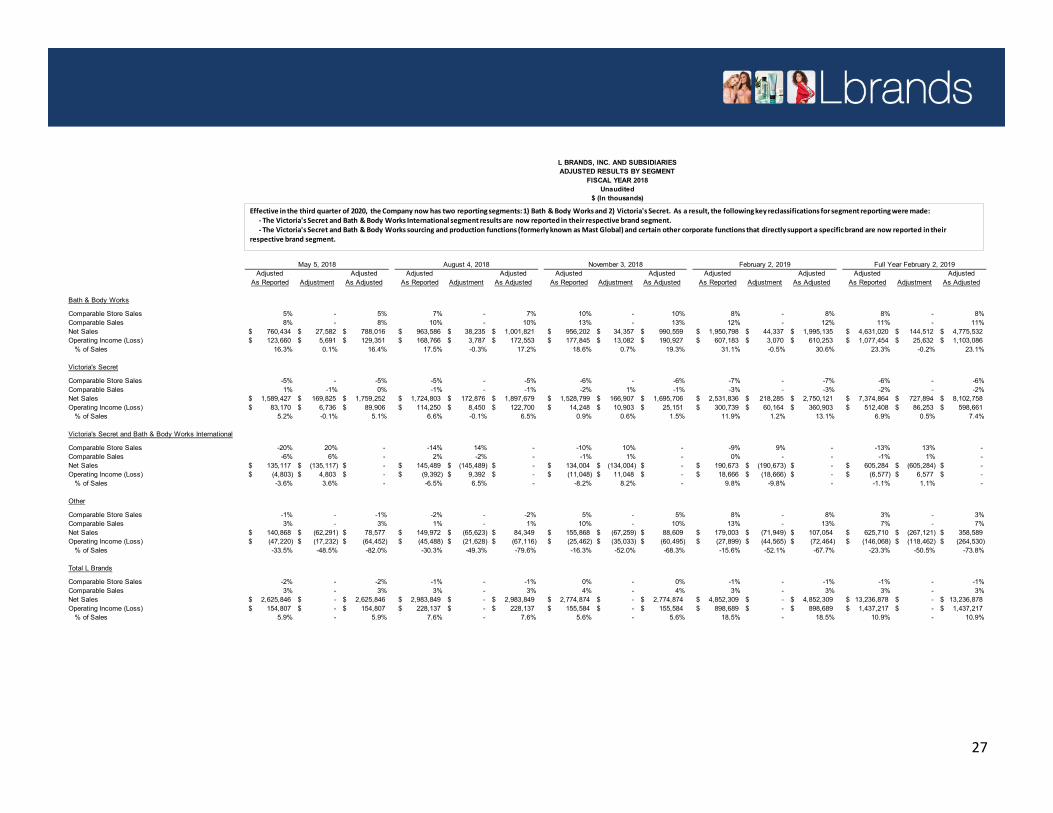
Adjusted Adjusted Adjusted Adjusted Adjusted Adjusted Adjusted Adjusted Adjusted AdjustedAs Reported Adjustment As Adjusted As Reported Adjustment As Adjusted As Reported Adjustment As Adjusted As Reported Adjustment As Adjusted As Reported Adjustment As Adjusted
Bath & Body Works
Comparable Store Sales 5% - 5% 7% - 7% 10% - 10% 8% - 8% 8% - 8%Comparable Sales 8% - 8% 10% - 10% 13% - 13% 12% - 12% 11% - 11%Net Sales 760,434$ 27,582$ 788,016$ 963,586$ 38,235$ 1,001,821$ 956,202$ 34,357$ 990,559$ 1,950,798$ 44,337$ 1,995,135$ 4,631,020$ 144,512$ 4,775,532$ Operating Income (Loss) 123,660$ 5,691$ 129,351$ 168,766$ 3,787$ 172,553$ 177,845$ 13,082$ 190,927$ 607,183$ 3,070$ 610,253$ 1,077,454$ 25,632$ 1,103,086$
% of Sales 16.3% 0.1% 16.4% 17.5% -0.3% 17.2% 18.6% 0.7% 19.3% 31.1% -0.5% 30.6% 23.3% -0.2% 23.1%
Victoria's Secret
Comparable Store Sales -5% - -5% -5% - -5% -6% - -6% -7% - -7% -6% - -6%Comparable Sales 1% -1% 0% -1% - -1% -2% 1% -1% -3% - -3% -2% - -2%Net Sales 1,589,427$ 169,825$ 1,759,252$ 1,724,803$ 172,876$ 1,897,679$ 1,528,799$ 166,907$ 1,695,706$ 2,531,836$ 218,285$ 2,750,121$ 7,374,864$ 727,894$ 8,102,758$ Operating Income (Loss) 83,170$ 6,736$ 89,906$ 114,250$ 8,450$ 122,700$ 14,248$ 10,903$ 25,151$ 300,739$ 60,164$ 360,903$ 512,408$ 86,253$ 598,661$
% of Sales 5.2% -0.1% 5.1% 6.6% -0.1% 6.5% 0.9% 0.6% 1.5% 11.9% 1.2% 13.1% 6.9% 0.5% 7.4%
Victoria's Secret and Bath & Body Works International
Comparable Store Sales -20% 20% - -14% 14% - -10% 10% - -9% 9% - -13% 13% - Comparable Sales -6% 6% - 2% -2% - -1% 1% - 0% - - -1% 1% - Net Sales 135,117$ (135,117)$ -$ 145,489$ (145,489)$ -$ 134,004$ (134,004)$ -$ 190,673$ (190,673)$ -$ 605,284$ (605,284)$ -$ Operating Income (Loss) (4,803)$ 4,803$ -$ (9,392)$ 9,392$ -$ (11,048)$ 11,048$ -$ 18,666$ (18,666)$ -$ (6,577)$ 6,577$ -$
% of Sales -3.6% 3.6% - -6.5% 6.5% - -8.2% 8.2% - 9.8% -9.8% - -1.1% 1.1% -
Other
Comparable Store Sales -1% - -1% -2% - -2% 5% - 5% 8% - 8% 3% - 3%Comparable Sales 3% - 3% 1% - 1% 10% - 10% 13% - 13% 7% - 7%Net Sales 140,868$ (62,291)$ 78,577$ 149,972$ (65,623)$ 84,349$ 155,868$ (67,259)$ 88,609$ 179,003$ (71,949)$ 107,054$ 625,710$ (267,121)$ 358,589$ Operating Income (Loss) (47,220)$ (17,232)$ (64,452)$ (45,488)$ (21,628)$ (67,116)$ (25,462)$ (35,033)$ (60,495)$ (27,899)$ (44,565)$ (72,464)$ (146,068)$ (118,462)$ (264,530)$
% of Sales -33.5% -48.5% -82.0% -30.3% -49.3% -79.6% -16.3% -52.0% -68.3% -15.6% -52.1% -67.7% -23.3% -50.5% -73.8%
Total L Brands
Comparable Store Sales -2% - -2% -1% - -1% 0% - 0% -1% - -1% -1% - -1%Comparable Sales 3% - 3% 3% - 3% 4% - 4% 3% - 3% 3% - 3%Net Sales 2,625,846$ -$ 2,625,846$ 2,983,849$ -$ 2,983,849$ 2,774,874$ -$ 2,774,874$ 4,852,309$ -$ 4,852,309$ 13,236,878$ -$ 13,236,878$ Operating Income (Loss) 154,807$ -$ 154,807$ 228,137$ -$ 228,137$ 155,584$ -$ 155,584$ 898,689$ -$ 898,689$ 1,437,217$ -$ 1,437,217$
% of Sales 5.9% - 5.9% 7.6% - 7.6% 5.6% - 5.6% 18.5% - 18.5% 10.9% - 10.9%
Unaudited
L BRANDS, INC. AND SUBSIDIARIESADJUSTED RESULTS BY SEGMENT
FISCAL YEAR 2018
$ (In thousands)
May 5, 2018 August 4, 2018 November 3, 2018 February 2, 2019 Full Year February 2, 2019
Effective in the third quarter of 2020, the Company now has two reporting segments: 1) Bath & Body Works and 2) Victoria's Secret. As a result, the following key reclassifications for segment reporting were made:‐ The Victoria's Secret and Bath & Body Works International segment results are now reported in their respective brand segment. ‐ The Victoria's Secret and Bath & Body Works sourcing and production functions (formerly known as Mast Global) and certain other corporate functions that directly support a specific brand are now reported in their
respective brand segment.
27


