39
Third Quarter FY 2012 Quarterly Update Infineon Technologies AG Investor Relations

Third Quarter FY 2012 Quarterly Update Infineon Technologies AG Investor Relations

Table of Contents
Infineon at a Glance
Growth Outlook
Results and Outlook
Copyright © Infineon Technologies 2012. All rights reserved. 31 July 2012 Page 2
Disclaimer: This presentation contains forward-looking statements about the business, financial condition and earnings performance of the Infineon Group.
These statements are based on assumptions and projections resting upon currently available information and present estimates. They are subject to a multitude of uncertainties and risks. Actual business development may therefore differ materially from what has been expected.
Beyond disclosure requirements stipulated by law, Infineon does not undertake any obligation to update forward-looking statements.

31 July 2012 Page 3 Copyright © Infineon Technologies 2012. All rights reserved.
Revenue Split by Division
ATV € 428m
CCS € 122m
OOS+ C&E*
€ 30m
* Other Operating Segments; Corporate & Eliminations.
Q3 FY 2012 revenue: EUR 990m
IPC € 177m
PMM € 233m

31 July 2012 Page 4 Copyright © Infineon Technologies 2012. All rights reserved.
Decreasing Segment Result Margin due to High Investment
986 990
144 126
Q2 FY12 Q3 FY12
Revenue Segment Result
[EUR m] Q3 FY11 Q2 FY12 Q3 FY12
Revenue 1,043 986 990
Segment Result 212 144 126
SR Margin 20.3% 14.6% 12.7%
Net Income* 190 111 82
Investment 319 192 158
FCF from cont. operations -8 -10 -22
Gross Cash 2,585 2,190 2,150
Net Cash 2,246 1,927 1,907
• Net Income includes „income from discontinued operations, net of income taxes“ in Q3 FY11 EUR 15m, in Q2 FY12 EUR 2m and in Q3 FY12 EUR -8m.
[EUR m]

31 July 2012 Page 5 Copyright © Infineon Technologies 2012. All rights reserved.
Tight Customer Relationships are Based on System Knowhow and App Understanding
ATV IPC CCS
Distributors
PMM

31 July 2012 Page 6 Copyright © Infineon Technologies 2012. All rights reserved.
Infineon Holds Top Positions in All Target Markets
#1
Power Chip Card
#1
Automotive
#2
Calendar Year 2010.
Source: IMS Research, August 2011.
Calendar Year 2010.
Source: IMS Research, August 2011.
Calendar Year 2011.
Source: Strategy Analytics, April 2012.
6%
8%
9%
10%
NXP
Freescale
STMicro
Infineon
Renesas
6%
7%
7%
7%
11%
Vishay
Mitsubishi
STMicro
Toshiba
Infineon
8%
18%
21%
21%
27%
Renesas
STM
NXP
Samsung
Infineon14%

Table of Contents
Infineon at a Glance
Growth Outlook
Results and Outlook
Copyright © Infineon Technologies 2012. All rights reserved. 31 July 2012 Page 7

31 July 2012 Page 8 Copyright © Infineon Technologies 2012. All rights reserved.
New Era: Multiple Factors Driving Demand for Power Semiconductors
Shift towards renewable energies requires orders of magnitude more high-power semis per MW of power generated.
'90 – '10
Electrification of powertrain fuels demand for high-power semis in cars and doubles silicon content.
Higher efficiency in power conversion lowers CO2, material and electricity costs.
Stronger demand for goods containing power semis due to faster increase in standard of living in BRIC countries.
'10 – '30 Changes
Courtesy: Tesla

31 July 2012 Page 9 Copyright © Infineon Technologies 2012. All rights reserved.
Despite Near-Term Outlook Cuts, Long-Term Prospect Still Healthy
16 19 20 19 19 20 21 22 22
21 28 29 31 33 36 39 41 44 12 16 17 19 20 21 22 23 24
8 9 8 10 8 8 8 8 8
2009 2010 2011 2012 2013 2014 2015 2016 2017
Europe APAC North America Japan ROW
CAGR(11-15) = 4.8%
Source: IHS, July 2012.
[units m]
Global car production (cars ≤ 6t)
59.5 74.4 76.8 80.7 82.3 87.6 92.9 97.0 100.3

31 July 2012 Page 10 Copyright © Infineon Technologies 2012. All rights reserved.
Rising Semiconductor Value Per Car Drives Market
Source: Strategy Analytics, January 2012.
5.3
4.7
6.7
5.1
7.5
7.1
11.3
8.4
Infotainment
Body
Safety
Powertrain
2015 2011
CAGR +11.2%
CAGR +10.9%
CAGR +7.9%
CAGR +7.6%
Source: Strategy Analytics, Oct. 2011; including semiconductor sensors.
[USD per car] [USD bn]
Semiconductor value per car Semiconductor market by segment
415
403
408
324
189
176
462
459
475
379
241
228
North America
Europe
Japan
South Korea
China
Brazil
2015 2011
CAGR +6.7%
CAGR +6.3%
CAGR +4.0%
CAGR +3.9%
CAGR +3.3%
CAGR +2.7%

31 July 2012 Page 11 Copyright © Infineon Technologies 2012. All rights reserved.
Every Electricity Conversion Step Requires Infineon Components
AC
[Hz]
DC AC
Solar inverter
Wind turbine
Variable speed drive
Power supply
DC/DC conversion
1
2
3
4
5
Generation
Generation
Grid
Grid
Grid
Grid
Consumption
Consumption
Gen
erat
ion
to G
rid
Grid
to C
onsu
mpt
ion
AC DC
[Hz]
[V]
[V]
Generation Grid Consumption
50/60 Hz

31 July 2012 Page 12 Copyright © Infineon Technologies 2012. All rights reserved.
About 10% Growth p.a. for Cycle Average Expected for Infineon
ATV growth:
~10% p.a.
IPC + PMM growth:
> 10% p.a.
CCS growth:
~5-7% p.a.
ATV IPC + PMM CCS
Infineon: ~10% growth p.a. cycle average
Courtesy: Hyundai
Growth target

Table of Contents
Infineon at a Glance
Growth Outlook
Results and Outlook
Copyright © Infineon Technologies 2012. All rights reserved. 31 July 2012 Page 13

31 July 2012 Page 14 Copyright © Infineon Technologies 2012. All rights reserved.
After Record Revenues in 2011, Sales in 2012 Are Almost Flat
Revenue and Segment Result [EUR m]
1043 1038 946 986 990
212 195 141 144 126
Q3FY11
Q4 Q1FY12
Q2 Q3
Revenue Segment Result Segment Result margin
20% 19% 15% 15% 13%
-5%
Power eControl others
FY 2011 revenue split by product category

31 July 2012 Page 15 Copyright © Infineon Technologies 2012. All rights reserved.
All-Time-High in Revenues in ATV; Slight Recovery in PMM
410 396 391 425 428
204 216 196 174 177
268 256 222 227 233
107 116 97 112 122
80 66 55 63 54 47 49 39 27 26 69 64 40 32 33 14 16 6 14 18
Q3FY11
Q1FY12
Q3FY11
Q1FY12
Q3FY11
Q1FY12
Q3FY11
Q1FY12
Revenue Segment Result Segment Result margin
-13%
[EUR m]
-13%
20% 17% 14% 15% 13%
16% 15% 20% 23% 23%
14% 13%
14%
+4%
ATV IPC CCS PMM [EUR m] [EUR m] [EUR m]
+14%
13%
14% 26% 25% 18%
Courtesy: Hyundai
6% 15%
31 July 2012 Page 16 Copyright © Infineon Technologies 2012. All rights reserved.
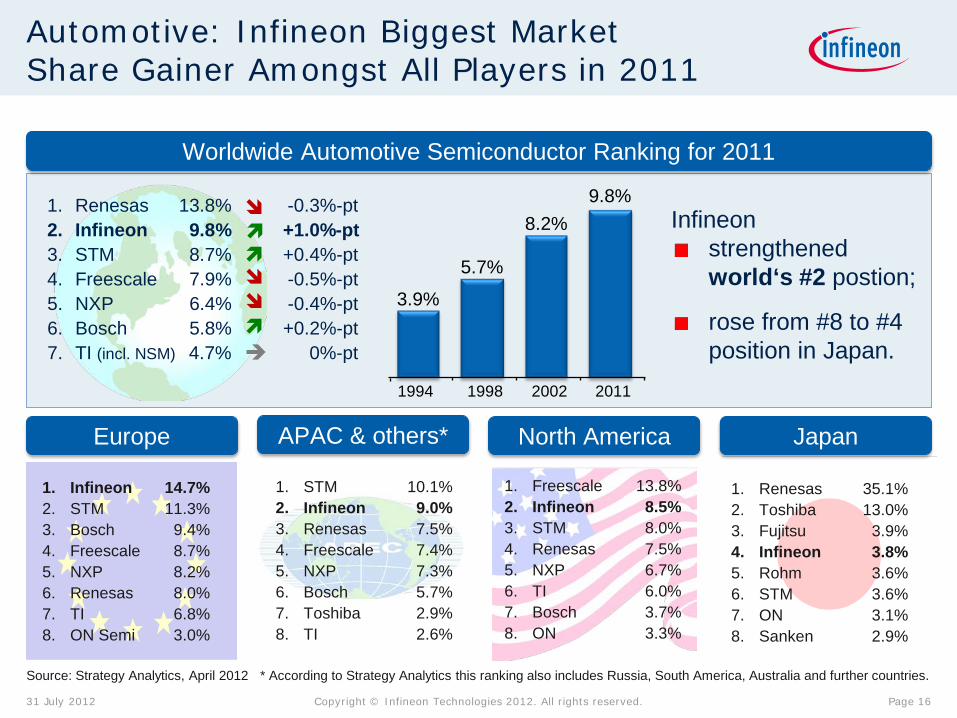
Automotive: Infineon Biggest Market Share Gainer Amongst All Players in 2011
1. Freescale 13.8% 2. Infineon 8.5% 3. STM 8.0% 4. Renesas 7.5% 5. NXP 6.7% 6. TI 6.0% 7. Bosch 3.7% 8. ON 3.3%
Source: Strategy Analytics, April 2012
1. Infineon 14.7% 2. STM 11.3% 3. Bosch 9.4% 4. Freescale 8.7% 5. NXP 8.2% 6. Renesas 8.0% 7. TI 6.8% 8. ON Semi 3.0%
1. STM 10.1% 2. Infineon 9.0% 3. Renesas 7.5% 4. Freescale 7.4% 5. NXP 7.3% 6. Bosch 5.7% 7. Toshiba 2.9% 8. TI 2.6%
1. Renesas 35.1% 2. Toshiba 13.0% 3. Fujitsu 3.9% 4. Infineon 3.8% 5. Rohm 3.6% 6. STM 3.6% 7. ON 3.1% 8. Sanken 2.9%
3.9%
5.7%
8.2% 9.8%
1994 1998 2002 2011
Infineon strengthened world‘s #2 postion;
rose from #8 to #4 position in Japan.
* According to Strategy Analytics this ranking also includes Russia, South America, Australia and further countries.
Worldwide Automotive Semiconductor Ranking for 2011
North America Japan Europe APAC & others*
1. Renesas 13.8% -0.3%-pt 2. Infineon 9.8% +1.0%-pt 3. STM 8.7% +0.4%-pt 4. Freescale 7.9% -0.5%-pt 5. NXP 6.4% -0.4%-pt 6. Bosch 5.8% +0.2%-pt 7. TI (incl. NSM) 4.7% 0%-pt

31 July 2012 Page 17 Copyright © Infineon Technologies 2012. All rights reserved.
London Hybrid Buses Powered by Infineon’s EconoDUAL™3 and PrimePACK™ IGBT Module
London hybrid-electrical buses
Courtesy: Siemens
Powered by EconoDUAL™3
Transport is responsible for ~20% of London’s CO2 emission. London has been building up a fleet of environmentally-friendly hybrid-electrical buses. Olympic athletes and visitors are shuttled around the city. Fuel saving of 30%; reduction in NOx of 20%.
Powered by PrimePACK™

31 July 2012 Page 18 Copyright © Infineon Technologies 2012. All rights reserved.
Infineon’s CoolSiC™ And SiC JFET Driver Lift Inverter Efficiency to > 99%
Japan formally implemented new feed-in-tariffs for the PV industry in July 2012 as part of the new clean energy policy.
Infineon’s Japanese customer built a prototype of a 10kW inverter using SiC products in Easy modules.
CoolSiC™ (SiC JFET transistors) successfully entered the market of efficiency-critical applications such as solar inverters.
In contrast to Si-based MOSFETs, SiC JFETs require dedicated control circuitry, drivers and design know-how allowing Infineon to increase value and Si-content in customer applications.
Infineon entering the Japanese photovoltaic market with SiC products
CoolSiC™ Easy module

31 July 2012 Page 19 Copyright © Infineon Technologies 2012. All rights reserved.
Social Networks and Cloud Computing Driving Demand for Highest Efficient Power Supplies
Globally, we see one new data center per week with up to 100 MW of power consumption.
Efficiency of power supply (AC/DC, DC/DC) of utmost importance.
DPM best solution for flexible load dynamics.
Change in value chain: servers no longer from the shelf but designed by ODMs according to specification of data center operator.
Digital power management (DPM) gaining traction in server market
DPM opens the door for bundling with other products.
Recent design win: IFX offers DPM controllers along with driver ICs and MOSFETs to Taiwanese ODM.
CoolMOS™ OptiMOS™ Driver IC

31 July 2012 Page 20 Copyright © Infineon Technologies 2012. All rights reserved.
Infineon Supplies Security Chips to Malaysia and South Africa
Largest chip-based Government smart card project in South Africa. Start of issuance in April 2012.
Government smart card for 10m South African recipients of social grants.
Enables South African citizens to securely receive their social grants on the chip cards.
Malaysia’s national ID card “MyKad” South Africa’s smart card project
MyKad is one of first multi-application national electronic ID card projects implemented worldwide.
Multi-application cards allow implementation of numerous additional functions such as eGovernment, eDriving license, eHealth, eSignature, ePurse and transport.

31 July 2012 Page 21 Copyright © Infineon Technologies 2012. All rights reserved.
Guidance for Q4 and FY 2012
Segment Result Margin
Revenue
Outlook Q4 FY12* (compared to Q3 FY12)
Outlook FY 2012* (compared to FY 2011)
Approximately 12 percent.
Revenue flat to down slightly
Segment Result margin between 13 and 14 percent.
previously: mid teens percentage.
Declining approximately 3 percent.
previously: Low single-digit percentage decline.
* This outlook is based on an assumed Euro/US Dollar exchange rate of 1.25 for Q4 FY12.
Investments in FY 2013 Significantly lower than in FY 2012.
31 July 2012 Page 22 Copyright © Infineon Technologies 2012. All rights reserved.
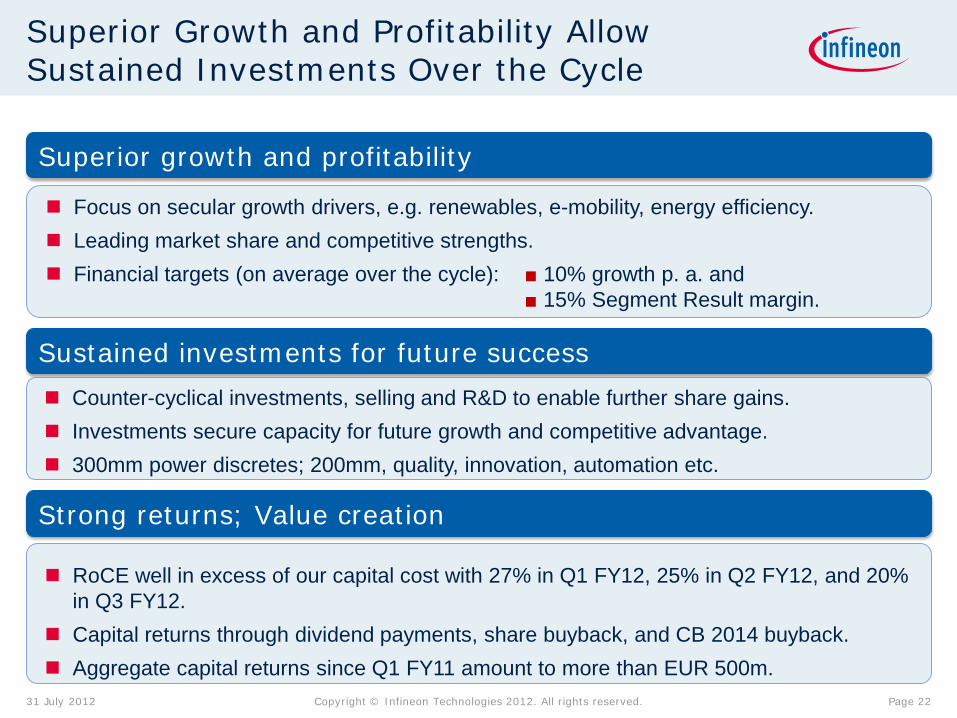
Superior Growth and Profitability Allow Sustained Investments Over the Cycle
Superior growth and profitability
Sustained investments for future success
Strong returns; Value creation
Focus on secular growth drivers, e.g. renewables, e-mobility, energy efficiency. Leading market share and competitive strengths. Financial targets (on average over the cycle): ■ 10% growth p. a. and
■ 15% Segment Result margin.
Counter-cyclical investments, selling and R&D to enable further share gains. Investments secure capacity for future growth and competitive advantage. 300mm power discretes; 200mm, quality, innovation, automation etc.
RoCE well in excess of our capital cost with 27% in Q1 FY12, 25% in Q2 FY12, and 20% in Q3 FY12.
Capital returns through dividend payments, share buyback, and CB 2014 buyback. Aggregate capital returns since Q1 FY11 amount to more than EUR 500m.

31 July 2012 Page 24 Copyright © Infineon Technologies 2012. All rights reserved.
Target to Sustain 15% Cycle-Average Segment Result Margin
High barriers to entry
SR target margins
Semiconductors enable high functionality
Value of semis small relative to end product
Infineon's core competencies: Power and eControl
#1 #2 #3 #4
Total profitability target
Infineon: ~15% operating margin cycle-average
Courtesy: Hyundai
ATV IPC CCS PMM

31 July 2012 Page 25 Copyright © Infineon Technologies 2012. All rights reserved.
4 Reasons for Sustainable Profitability ─ High Barriers to Entry #1
Long product life cycles
System knowhow and understanding
Strong quality and reliability req's
For many markets we address, deliveries of semis need to be ensured for very long periods of time: for car industry:
7 to 24 years; for train industry: about
15 years.
Both deep and wide know-how and understanding of our customers' applications needed for making best in class solutions: e.g. HEV/EV needs
both automotive and industrial expertise.
Products need to reliably perform well in the field over longer periods of time: airbag reliability
required as long as the car is in use;
wind turbines should function 30 years.
Courtesy: Siemens Courtesy: BMW

31 July 2012 Page 26 Copyright © Infineon Technologies 2012. All rights reserved.
Semiconductors – Core Enablers of Innovation and Higher Functionality
#2
Power supplies More advanced power semiconductors allow smaller, denser, lighter and more efficient power supplies.
VSD More precise and efficient RPM-control versus mechanical transmission.
Recuperation Implemented in trains for years; brought to cars by the advent of HEV/EVs.
Power steering EPS is replacing hydraulic-mechanical power steering allowing more flexibility in car design and less power consumption.
Identification Chip-based passports and national ID cards allow much higher level of security compared with paper-only ID cards.
Brand protection Chip-based authentication of accessories, e.g. batteries, cartridges.
Energy Efficiency Mobility Security

31 July 2012 Page 27 Copyright © Infineon Technologies 2012. All rights reserved.
Semis Represent a Negligible Part of the Value of the End Product
#3
Example 1: mid-range car
1.0% of
product value
Example 2: high-speed train
1.0% of
product value
EUR 6m
Semi BoM:
€250
€25,000 €10,000,000
Semi BoM:
€100,000
Courtesy: Siemens Courtesy: Volkswagen

31 July 2012 Page 28 Copyright © Infineon Technologies 2012. All rights reserved.
Infineon's Core Competencies ─ Power Semiconductors and eControl
#4
Design
Manu- facturing
Thin-wafer technology Super-junction MOSFETs Silicon-Carbide (SiC) IGBT module packaging
Core competence power Design and manufacturing of power semis tightly coupled
Core competence eControl
Automotive real-time 32-bit microcontroller (TriCore™) and multi-core design (AURIX™).
Industry microcontroller with premium peripheral functions (XMC4000 family).
Low-power security controller.
31 July 2012 Page 29 Copyright © Infineon Technologies 2012. All rights reserved.
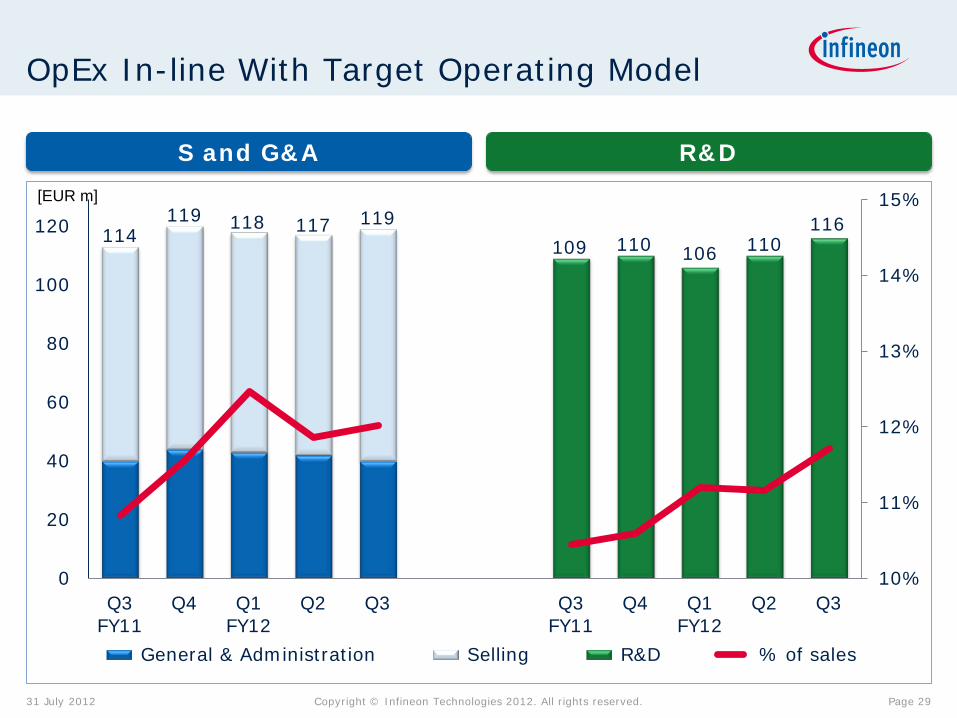
OpEx In-line With Target Operating Model
114 119 118 117 119
109 110 106 110 116
10%
11%
12%
13%
14%
15%
0
20
40
60
80
100
120
Q3FY11
Q4 Q1FY12
Q2 Q3 Q3FY11
Q4 Q1FY12
Q2 Q3
General & Administration Selling R&D % of sales
S and G&A R&D [EUR m]
31 July 2012 Page 30 Copyright © Infineon Technologies 2012. All rights reserved.
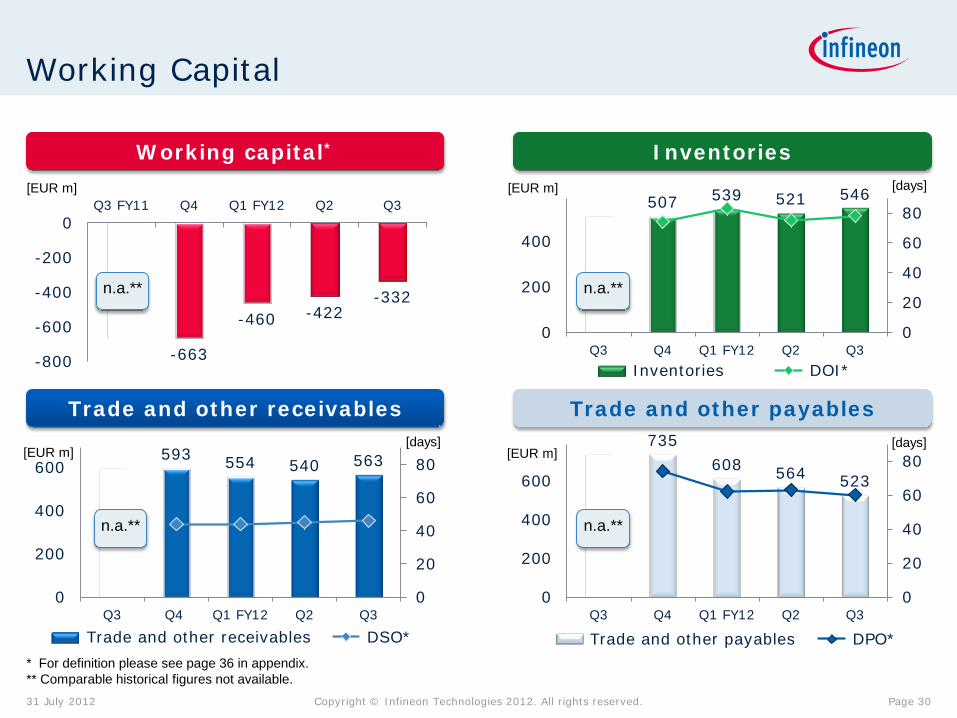
Working Capital
Working capital* Inventories
Trade and other receivables Trade and other payables
[EUR m]
* For definition please see page 36 in appendix. ** Comparable historical figures not available.
507 539 521 546
0
20
40
60
80
0
200
400
Q3 Q4 Q1 FY12 Q2 Q3 Inventories DOI*
[EUR m]
593 554 540 563
0
20
40
60
80
0
200
400
600
Q3 Q4 Q1 FY12 Q2 Q3
Trade and other receivables DSO*
[EUR m] 735
608 564 523
0
20
40
60
80
0
200
400
600
Q3 Q4 Q1 FY12 Q2 Q3
Trade and other payables DPO*
[EUR m] [days]
-663
-460 -422 -332
-800
-600
-400
-200
0Q3 FY11 Q4 Q1 FY12 Q2 Q3
n.a.**
n.a.** n.a.**
n.a.**
[days]
[days]

31 July 2012 Page 31 Copyright © Infineon Technologies 2012. All rights reserved.
Investments Remain High to Exploit Growth Potential
Investments*
FY 2009 FY 2010 FY 2011 GuidanceFY 2012
FY 2009 FY 2010 FY 2011 GuidanceFY 2012
Q1
Q2
Q3
Q4
325
~ flat
~ 430
887
336 364
D&A
[EUR m]
Guidance for investments: FY13: significantly lower than in FY12.
Guidance for D&A: FY13: increase compared to FY12.
* For definition please see page 36 in appendix.
115
453

31 July 2012 Page 32 Copyright © Infineon Technologies 2012. All rights reserved.
High Gross Cash and Net Cash Position Maintained
2585
2692
2337
2190
2150
212 191 169
162 140
127 114 100 101 103
2246
2387
2068
1927
1907
Q3FY11
Q4 Q1FY12
Q2 Q3
Gross Cash Debt Equity-linked Net Cash
Liquidity Development
* Consists of convertible bond (nominal value EUR 118m; book value EUR 103m).
[EUR m]
*
Gross cash decreased due to negative Free Cash Flow and debt reduction of EUR 20m. Net cash impact correspondingly lower.
Bought back another EUR 5m nominal of convertible bond for EUR 12m. No buyback of shares during the quarter. But put options for 9.6m shares lapsed with EUR 3.6m
premium received.

31 July 2012 Page 33 Copyright © Infineon Technologies 2012. All rights reserved.
Value Creation of Infineon by Sustainably High RoCE Above WACC
RoCE history
-9% 27% 31%
64%
46% 59% 53%
82%
27% 25% 20%
-20%0%
20%40%60%80%
100%
Q1 FY10 Q2 Q3 Q4 Q1 FY11 Q2 Q3 Q4 Q1 FY12 Q2 Q3
WACC: low teens % FY10: 30%
FY11: 62%
[EUR m]
1,496 1,456 1,499 1,273 1,397
1,196 1,347 1,239
1,629 1,760
1,889
0,000
0,500
1,000
1,500
2,000
Q1 FY10 Q2 Q3 Q4 Q1 FY11 Q2 Q3 Q4 Q1 FY12 Q2 Q3
Capital Employed history

Copyright © Infineon Technologies 2010. All rights reserved. 2011
12 3 2 8 8 0
4 3
6.25
6.55 6.70 6.40 6.27 6.20 6,11 6.23
6.82 7.05
6.81 6.68 6.74 6,72
5
6
7
8
0
2
4
6
8
10
12
Q1 FY11 Q2 Q3 Q4 Q1 FY12 Q2 Q3
# of shares underlying the convertible [lhs] # of exercised options [lhs]
cum. avg. price incl. opt. premium [rhs] cum. VWAP [rhs]
Average Price Per Underlying Share Below Volume Weighted Average Share Price
Total share buyback history via convertible bond and put options
[shares m] [EUR]
Page 34
End
of C
apita
l Ret
urn
Prog
ram
on
31
Mar
ch 2
013.
31 July 2012
0

31 July 2012 Page 35 Copyright © Infineon Technologies 2012. All rights reserved.
Total Gross Capital Returns
Total gross capital returns history [EUR m]
80 27
16 50 50 0 0
173
50
26 20
26
20 109
130
109
130
0
50
100
150
200
250
300
350
Q1FY11
Q2 Q3 Q4 Q1FY12
Q2 Q3 Q4 FY11 FY12
CB 2014 share buyback (via put options) dividends
308
200
0

31 July 2012 Page 36 Copyright © Infineon Technologies 2012. All rights reserved.
Notes
Investments = 'Purchase of property, plant and equipment‘ + 'Purchase of intangible assets and other assets' incl. capitalization of R&D expenses
RoCE = NOPAT / Capital Employed =
('Income from continuing operations' – 'financial income' – 'financial expense') / ('Total assets' – 'Cash and cash equivalents' – 'Financial investments' – 'Assets classified as held for sale' – ['Total Current liabilities' – 'Short-term debt and current maturities of long-term debt' – 'Liabilities classified as held for sale']) Working Capital =
('Total current assets‘ – 'Cash and cash equivalents‘ – ‘Financial investment‘ – 'Assets classified as held for sale') – ('Total current liabilities‘ – 'Short term debt and current maturities of long-term debt‘ – 'Liabilities classified as held for sale')
DOI (inventory days; quarter-to-date) = ('Net Inventories' / 'Cost of goods sold') * 90
DSO (days sales outstanding; quarter-to-date) = ('Trade accounts receivables (net)' / 'revenue') * 90
DPO (days payables outstanding; quarter-to-date) = ('Trade payables' / ['Cost of goods sold' + 'Purchase of property, plant and equipment']) * 90
31 July 2012 Page 37 Copyright © Infineon Technologies 2012. All rights reserved.
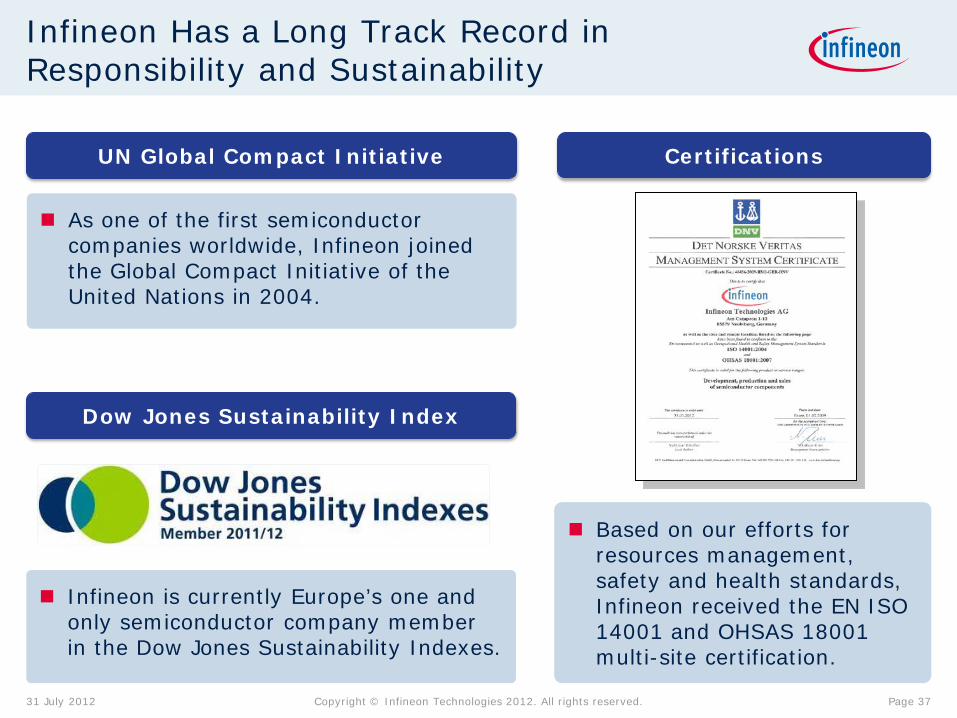
Infineon Has a Long Track Record in Responsibility and Sustainability
Infineon is currently Europe’s one and only semiconductor company member in the Dow Jones Sustainability Indexes.
As one of the first semiconductor companies worldwide, Infineon joined the Global Compact Initiative of the United Nations in 2004.
Based on our efforts for resources management, safety and health standards, Infineon received the EN ISO 14001 and OHSAS 18001 multi-site certification.
Certifications
Dow Jones Sustainability Index
UN Global Compact Initiative

31 July 2012 Page 38 Copyright © Infineon Technologies 2012. All rights reserved.
Financial Calendar
Date Location Event
29 Aug 2012 Frankfurt Commerzbank Sector Conference Week
26 Sep 2012 Munich Baader Investment Conference
14 Nov 2012* Q4 FY12 Results
15-16 Nov 2012 Barcelona Morgan Stanley TMT Conference
20 – 21 Nov 2012 London Company Roadshow – including presentation by Dr. Helmut Gassel, Division President ,Industrial Power Control (IPC)
27-28 Nov 2012 Scottsdale Credit Suisse Technology Conference
* provisional

31 July 2012 Page 39 Copyright © Infineon Technologies 2012. All rights reserved.
Institutional Investor Relations Contact
31 July 2012 Page 39 Copyright © Infineon Technologies 2012. All rights reserved.
Ulrich Pelzer Corporate Vice President +49 89 234-26153 Finance, Treasury & Investor Relations [email protected]
Joachim Binder Senior Director +49 89 234-25649 Investor Relations [email protected]
Holger Schmidt Manager +49 89 234-22332 Investor Relations [email protected]
Bernard Wang Manager +49 89 234-22669 Investor Relations [email protected]


