13
Third Quarter FY2017 Earnings Presentation February 14, 2017 Transitioning into the Next Phase of Growth

Third Quarter FY2017
Earnings Presentation
February 14, 2017
Transitioning into the Next Phase of Growth
2 │ Earnings Presentation
Disclaimer
This presentation contains statements that contain “forward looking statements” including, but without
limitation, statements relating to the implementation of strategic initiatives, and other statements relating to
Vivimed Labs’ future business developments and economic performance. While these forward looking
statements indicate our assessment and future expectations concerning the development of our business, a
number of risks, uncertainties and other unknown factors could cause actual developments and results to differ
materially from our expectations. These factors include, but are not limited to, general market, macro-
economic, governmental and regulatory trends, movements in currency exchange and interest rates,
competitive pressures, technological developments, changes in the financial conditions of third parties dealing
with us, legislative developments, and other key factors that could affect our business and financial
performance. Vivimed Labs undertakes no obligation to publicly revise any forward looking statements to reflect
future / likely events or circumstances.

3 │ Earnings Presentation
Transitioning into the Next Phase of Growth
Leveraging chemistry skills and quality compliant manufacturing platform to scale up custom manufacturing and generic product revenue lines within the API vertical
Harvesting blue chip customer base more effectively by introduction of new and competitive products across API and FDF
Capitalising on new opportunities for selective forward integration given presence of US FDA approved manufacturing facility for FDF
Specialty Chemicals segment to continue focus on niche product portfolio and bolt-on opportunities in adjacent segments
New projects on anvil for India FDF with leading global / domestic names
Recent corporate developments reinforce commitment to improving shareholder returns over the long term
4 │ Earnings Presentation
Performance Highlights
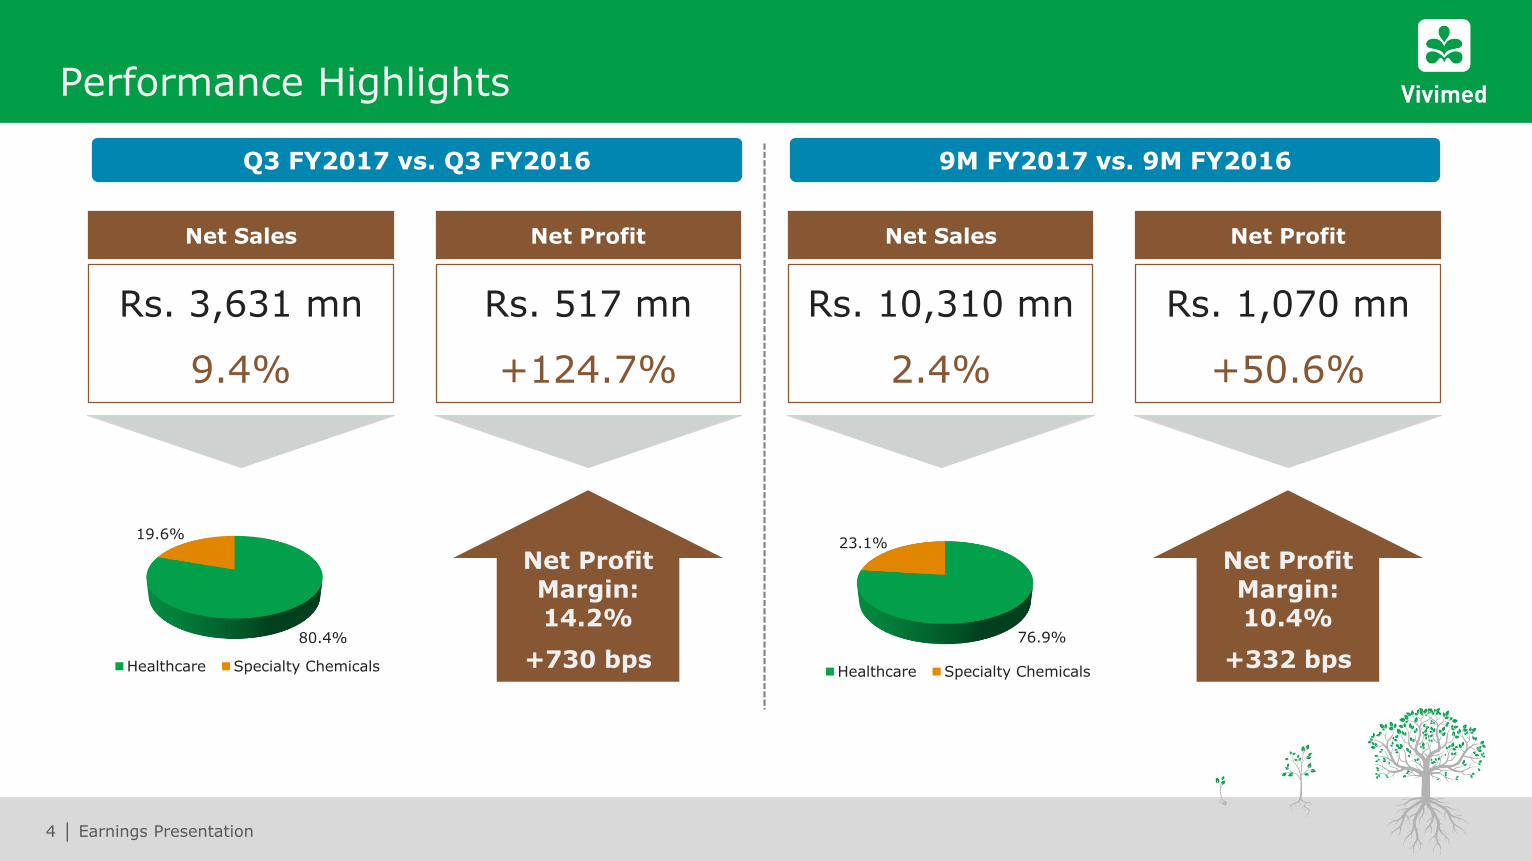
Net Sales
Rs. 10,310 mn
2.4%
Net Profit
Rs. 1,070 mn
+50.6%
9M FY2017 vs. 9M FY2016
Net Profit Margin: 10.4%
+332 bps
Q3 FY2017 vs. Q3 FY2016
Net Sales
Rs. 3,631 mn
9.4%
Net Profit
Rs. 517 mn
+124.7%
Net Profit Margin: 14.2%
+730 bps80.4%
19.6%
Healthcare Specialty Chemicals
76.9%
23.1%
Healthcare Specialty Chemicals

5 │ Earnings Presentation
Management Perspectives
Commenting on the performance, Mr. Santosh Varalwar, Managing Director of Vivimed Labs said:
“As you are aware, we have taken a number of strategic initiatives over the last 12-18 months which have now started to
bear fruits. Our pharmaceuticals business is going from strength to strength. In the API segment, better product mix,
increase in custom manufacturing coupled with higher market share for our generic product portfolio continue to drive the
performance. Our successful track record of regulatory compliance has provided us a competitive edge and has been a key
differentiator for both the CMO and the generic businesses. During the last quarter, we completed a number of registrations
for supply of finished formulations in the semi regulated markets. We will start the commercial production for these regions
in FY2018 onwards.
In the Specialty Chemicals division, we remain focused higher margin photochromic and hair dyes product portfolio. We are
working on a number on new high value niche products. We expect to start commercial production of fast fading
photochromic dyes in Q1 FY2018. A differentiated product mix and focus on new opportunities will continue to drive a
profitable growth for this division.
We have strengthened our balance sheet and that has helped us invest in developing a stronger filing pipeline and product
portfolio. This has enabled us to establish a strong market positioning in the API custom manufacturing and generic
business segments. We expect that our strategic initiatives and investments will be the primary driver of growth for our
business in near term.”

6 │ Earnings Presentation
Financial Performance
Consolidated financial summary
Q3 y-o-y Q2 q-o-q Nine Months y-o-y
(Rs. million) FY2017 FY2016 Growth (%) FY2017 Growth (%) FY2017 FY2016 Growth (%)
Net Sales 3,631 3,319 9.4% 2,993 21.3% 10,310 10,064 2.4%
EBITDA 1,031 613 68.3% 612 68.4% 2,312 1,917 20.6%
Margin (%) 28.4% 18.5% 20.5% 22.4% 19.0%
Net Profit 517 230 124.7% 269 92.6% 1,070 711 50.6%
Margin (%) 14.2% 6.9% 9.0% 10.4% 7.1%
Basic EPS (Rs.) 6.38 2.84 124.7% 3.31 92.6% 13.21 8.77 50.6%
Notes:
1. Net Sales includes Other Operating Income
2. Basic EPS adjusted for 2:10 stock split
7 │ Earnings Presentation
Performance Discussion
Q3 FY2017 vs. Q3 FY2016
Revenues increased by 9.4% y-o-y to Rs. 3,631 million
o Pharmaceuticals segment recorded a growth of 19.1% y-o-y to reach Rs. 2,894 million. Proceeds on divestment of Klar
Sehen of Rs. 400 million (net of expenses) were recognised during the quarter. Adjusted for this, growth in the
pharmaceuticals vertical was 2.6% y-o-y
o Specialty Chemical segment recorded a revenue of Rs. 706 million in Q3 FY2017, a decline of 18.7% compared to same
period last year. This was primarily due to the divestiture of certain product lines effected earlier in the last fiscal year.
EBITDA for the period was Rs. 1,031 million with margin of 28.4%
o Pharmaceuticals segment EBIT margins were benefitted from the proceeds on divestment of Klar Sehen. Adjusted for the
proceeds, EBIT margins expanded from 11.7% in Q3 FY2016 to 13.4% in Q3 FY2017. Better product mix, increase in custom
manufacturing coupled with higher market share for generic product portfolio in the healthcare segment supported the margins
o Despite the decline in revenues, Specialty Chemicals EBIT margins remained strong at 20.1%
Finance cost was Rs. 173 million, a decline of 9.8% compared to the same period last year. This decline was due to repayment
of long term debt coupled with better working capital management

8 │ Earnings Presentation
Financial Performance
Net Sales EBITDA and Margins
Net Profit and Margins
3,319 3,500 3,686 2,993 3,631
Q3 FY16 Q4 FY16 Q1 FY17 Q2 FY17 Q3 FY17
Rs.
Millio
n
613 512 668 612 1,031
18.5%
14.6%
18.1% 20.5%
28.4%
Q3 FY16 Q4 FY16 Q1 FY17 Q2 FY17 Q3 FY17
Rs.
Millio
n
EBITDA Margin (%)
230 126 279 269 517
6.9%
3.6%
7.6% 9.0%
14.2%
Q3 FY16 Q4 FY16 Q1 FY17 Q2 FY17 Q3 FY17
Rs.
Millio
n
Net Profit Margin (%)

9 │ Earnings Presentation
Consolidated Quarterly P&L Statement
Profit & Loss Statement (Rs. million) Q3 FY16 Q4 FY16 Q1 FY17 Q2 FY17 Q3 FY17
Revenues
Net Sales / Income from Operations (Net of Excise Duty) 3,299 3,472 3,668 2,984 3,600
Other Operating Income 20 29 18 9 31
Total Revenues 3,319 3,500 3,686 2,993 3,631
Total expenses 2,706 2,988 3,017 2,381 2,600
Operating Profit (EBITDA) 613 512 668 612 1,031
Depreciation and Amortization Expenses 155 148 158 149 155
EBIT 458 365 510 463 876
Finance Costs 192 245 152 149 173
PBT 266 120 358 313 703
Tax Expenses 36 (7) 79 45 186
PAT 230 126 279 269 517
Basic EPS (Rs) 2.84 1.56 3.44 3.31 6.38
Margins (%)
Gross Margins 54.6% 52.7% 53.4% 55.1% 65.5%
EBITDA margins 18.5% 14.6% 18.1% 20.5% 28.4%
PAT margins 6.9% 3.6% 7.6% 9.0% 14.2%
Y-o-Y Growth (%)
Total Revenues (3.7)% (1.9)% 10.7% (12.4)% 9.4%
EBITDA 1.6% (2.6)% (0.6)% (3.1)% 68.3%
PAT 11.9% (29.8)% 15.2% 12.5% 124.7%
Q-o-Q Growth (%)
Total Revenues (2.8)% 5.5% 5.3% (18.8)% 21.3%
EBITDA (3.0)% (16.4)% 30.5% (8.4)% 68.4%
PAT (3.6)% (45.2)% 121.0% (3.6)% 92.6%
Effective Tax Rate 13.4% nm 22.2% 14.3% 26.4%
Notes:
1. Basic EPS adjusted for 2:10 stock split

10 │ Earnings Presentation
Consolidated Segment Performance
Q3 y-o-y Q2 q-o-q Nine Months y-o-y
(Rs. million) FY2017 FY2016 Growth (%) FY2017 Growth (%) FY2017 FY2016 Growth (%)
Segment Revenue 3,600 3,299 9.1% 2,984 20.7% 10,252 9,985 2.7%
Specialty Chemicals 706 869 (18.7)% 811 (12.9)% 2,367 2,769 (14.5)%
Pharmaceuticals 2,894 2,431 19.1% 2,173 33.2% 7,885 7,216 9.3%
EBIT 876 458 91.3% 463 89.3% 1,855 1,450 27.9%
Margin (%) 24.3% 13.9% 15.5% 18.1% 14.5%
Specialty Chemicals 142 173 (18.1)% 207 (31.5)% 501 558 (10.3)%
Margin (%) 20.1% 20.0% 25.5% 21.2% 20.2%
Pharmaceuticals 734 285 157.8% 256 187.1% 1,354 892 51.8%
Margin (%) 25.4% 11.7% 11.8% 17.2% 12.4%
Capital Employed 16,547 14,292 15.8% 15,897 4.1% 16,547 14,292 15.8%
Specialty Chemicals 7,222 7,558 (4.4)% 7,172 0.7% 7,222 7,558 (4.4)%
Pharmaceuticals 9,325 6,735 38.5% 8,725 6.9% 9,325 6,735 38.5%

11 │ Earnings Presentation
Key Ratios
FY2011 FY2012 FY2013 FY2014 FY2015 FY2016 H1 FY2017
Net Worth (Rs. million) 1,967 4,748 5,091 5,604 5,592 5,852 6,151
Net Debt (Rs. million)Including current maturities of LT Debt
2,959 5,279 6,414 8,591 9,852 8,618 8,074
Fixed Assets (Rs. million) 2,643 5,953 7,090 8,079 8,135 8,142 8,045
ROE (%) 24.8% 18.4% 18.8% 13.4% 14.5% 16.1% 16.4%
ROCE (%) 13.6% 8.3% 10.1% 7.7% 9.3% 10.3% 10.4%
Interest Coverage Ratio (x) 3.50 3.74 3.39 2.44 1.98 2.23 2.43
Net Debt to EBITDA (x) 3.38 3.97 3.25 4.03 4.42 3.55 3.36
Net Debt to Equity (x) 1.50 1.11 1.26 1.53 1.76 1.47 1.31
Notes:
1. Ratios as at the of H1 FY2017 is based on last twelve months P&L numbers

12 │ Earnings Presentation
Glossary
ANDA: Abbreviated New Drug Application
API: Active Pharmaceutical Ingredients
CEP: Certificates of Suitability to the monographs of European Pharmacopoeia
CMO: Contract Manufacturing Organization
DMF: Drug Master File
FDF: Finished Dosage Formulation
GMP: Good Manufacturing Practices
H&PC: Home and Personal Care
MRs: Medical Representatives
MA: Marketing Authorization

Vivimed Labs Limited(CIN: L02411KA1988PLC009465)
Veernag Towers, Habsiguda
Hyderabad 500 007
www.vivimedlabs.com
Phone: +91 40 2717 6005 / 06
Fax: +91 40 2715 0599
Raja Prasad B.
Vivimed Labs Limited
+91 40 2717 6005
Saket Somani / Bijay Sharma
Churchgate Partners
+91 22 6169 5988


