43


This book is a work of fiction. Any resemblance to actual events or persons, living or dead, is entirely coincidental. “Lean Engineering,” by J.T. Black and Don T. Phillips. ISBN 978-1-62137-343-8. Published 2013 by Virtualbookworm.com Publishing Inc., P.O. Box 9949, College Station, TX 77842, US. 2013, J.T. Black and Don T. Phillips. All rights reserved. No part of this publication may be reproduced, stored in a retrieval system, or transmitted in any form or by any means, electronic, mechanical, recording or otherwise, without the prior written permission of J.T. Black and Don T. Phillips. Manufactured in the United States of America.

i
Dedication This book is dedicated to Carol Strom Black who passed away in 2012. You can hardly find this kind of woman anymore. JT Black This book is also dedicated to Candyce Jean Phillips, who endured countless hours of composition, editing and changes by a usually frustrated old college professor. Don T. Phillips

ii
The Toyota style is not to create results by working hard. It is a system that says there is no limit to people’s creativity. People don’t go to Toyota to work, they go there to think.
Taiichi Ohno
February 29, 1912 – May 28, 1990

iii
Acknowledgements There are many individuals who have contributed to this book on Lean Engineering. Shovan Mishra worked tirelessly on the manuscript, figures and problem sets, Kavit Antani wrote the bulk of Mixed Model Final Assembly in Appendix A as part of his PhD research; and Dr. David Cochran wrote Chapter 18 and made significant contributions to Chapter 5. Thanks go out to Dr. Guy L. Curry and Dr. Richard Feldman of Texas A&M University, who have served as a constant source of encouragement and created a deeper understanding of Queuing Processes. Dr. Hiram Moya provided a great deal assistance in creating the Index, Bibliography and Table of Contents. The pioneering work of Dr. Ward Whitt should not go unnoticed. Dr. Mark Spearman and Dr. Wallace Hopp first awakened interest in the field of Factory Physics and without their pioneering work of establishing a scientific body of knowledge to unify Manufacturing Systems Analysis, the content of this book would not be placed in its proper perspective. Their work in awakening the engineering community to the corrupting influence of variance has not gone unnoticed. Of Course, there are numerous pioneers of the Toyota Production System which must be acknowledged including Taiichi Ohno and Shigeo Shingo. Early lean pioneers such as Bob Hall, Kenichi Sekine, Dr. Dick Schonberger and Yasuhiro Monden must also be recognized. The contributions of former students Dr. Steve Hunter and Dr. Joseph Chen are gratefully acknowledged, along with the work and publications of Dr. Bernard Schroer and Michael Baudin. Each were lean engineers in their own way. Concepts and ideas have been modified, presented and summarized which stem directly from Dr. Rajan Suri, Dr. John M. Nicholas, Dr. Dave Sly of ProPlanner and of course Mark Spearman and Wallace Hopp. Admiration and respect are offered to James P. Womack and Daniel T. Jones for their landmark publications in Lean Thinking, and to John Krafcik who coined the term Lean. We join these pioneers in believing that Lean thinking and Lean Manufacturing are here to stay. We only hope that in some small way we have captured the DNA of a new engineering discipline called Lean Engineering in this book.
iv
Henry Ford Pioneer, Visionary, Genius….. Lean Engineer
July 30, 1863 – April 7, 1947

v
Table of Contents Dedication..........................................................................................................................................................................i
Acknowledgements.....................................................................................................................................................iii
Preface .....................................................................................................................................................................xixChapter1IntroductiontoLeanEngineering 1.1 WhatisLeanEngineering?.............................................................................................................1 1.2 ManufacturingSystems...................................................................................................................3 1.3 CriticalControlFunctionsinaManufacturingSystem......................................................5 1.4 TrendsinManufacturingSystemsDesign...............................................................................6 1.5 FourBasicManufacturingSystemDesigns.............................................................................9 1.6 EvolutionofFactoryDesigns......................................................................................................21 1.7 LeanTransformation,KaizenEventsandContinuousImprovement......................28 1.8 TheLeanEngineer..........................................................................................................................29 1.9 EnvironmentalandGreenEngineering.................................................................................29 ReviewQuestions............................................................................................................................31Chapter2ManufacturingSystemDesign 2.1Introduction.......................................................................................................................................33 2.2TheManufacturingSystem...........................................................................................................34 2.3TypicalManufacturingSystemProductionFacilities.......................................................35 2.4TheToyotaProductionSystem(TPS)......................................................................................36 2.5FourKeyTermsinLeanEngineering.......................................................................................43
2.5.1LevelingProduction..................................................................................................................432.5.2MixedModelLeveling...............................................................................................................462.5.3SmoothingFinalAssembly.....................................................................................................47
2.6Mixed‐modelFinalAssembly.......................................................................................................49 2.7DeterminingTaktTime(s)............................................................................................................49 2.8DeterminingtheProperSequenceofOperations..............................................................50
2.8.1DeterminingtheMixedmodelSequenceSchedule.....................................................502.8.2Scheduling....................................................................................................................................512.8.3LongRangeForecasting..........................................................................................................52
2.9LineBalance........................................................................................................................................532.9.1BalancingSubassemblyCellstoFinalAssembly.........................................................532.9.2BalancingtheEntireFactory...............................................................................................54
2.10StandardOperations(AlsocalledStandardWork).........................................................56 2.11InternalCustomers........................................................................................................................57 2.12Inventory:NotzerobutMinimized.........................................................................................58 2.13Synchronization...............................................................................................................................59

vi
2.13.1Yo‐i‐donSynchronization...................................................................................................592.14HowLeanManufacturingCellsWork....................................................................................602.15FinalAssembly................................................................................................................................632.16GroupTechnology(GT)...............................................................................................................672.17KaizenandContinuousImprovement..................................................................................672.18DesignforFlexibility.....................................................................................................................692.19ControlofManufacturingFunctions‐Revisited...............................................................702.20ComparingLeanProductiontoOtherSystems.................................................................71
ReviewQuestions...........................................................................................................................74Chapter3DesignRulesforLeanManufacturingSystems
3.1Introduction.......................................................................................................................................753.2DesignRulesfortheL‐CMS.........................................................................................................763.3TheEvolutionofLeanFactoryDesign.....................................................................................803.4DefiningaManufacturingSystem..............................................................................................813.5StepsNecessarytoImplementingLeanManufacturingStrategies.............................833.6TaktTimeDesignRules..................................................................................................................843.7SubassemblyCellsvs.ManufacturingCells...........................................................................873.8Decouplers...........................................................................................................................................883.8.1ClassifyingandDefiningDecouplers.................................................................................91
3.9IntegratingProductionControl..................................................................................................923.10ProductionControlinaLinkedCellSystem.......................................................................933.11KanbanSignals................................................................................................................................943.12MixedModelFinalAssembly....................................................................................................95
3.13MoreKanbans?...............................................................................................................................953.14CharacterizingandDefiningWIP............................................................................................973.15LeanManufacturingCellsReplacetheFlowShop.........................................................1003.16Summary..........................................................................................................................................104
ReviewQuestions..........................................................................................................................105Chapter4ManufacturingCellDesign
4.1Introduction.......................................................................................................................................1094.2CaseStudy:DesignandImplementationofaDrivePinion...........................................114
4.3TraditionalManufacturing:.........................................................................................................114 4.4TheU‐shaped,LeanProductionCell........................................................................................115 4.5CellCycleTime..................................................................................................................................118
4.5.1OneWorker................................................................................................................................1194.5.2Twoworkers..............................................................................................................................1194.5.3ThreeWorkers..........................................................................................................................119
4.6U‐ShapedLeanCellswithMachiningTime(s)GreaterthanCellCycleTime......124 4.7CreatingCapacity...........................................................................................................................125

vii
4.8TaktTimeandCellCycleTime..................................................................................................126 4.9Variancevs.Variation...................................................................................................................126
4.10EliminatingVariance:ACaseStudy.....................................................................................1274.10.1ReducingVariancebyOptimizingMachiningParameters.................................127
4.11FlexibilityandCellDesign.........................................................................................................1284.12ClustersofLeanManufacturingCells...................................................................................1294.13CapacityAnalysisandLeanEngineering............................................................................1314.14PlantDesignandLeanCellDesign.........................................................................................1324.15HowCellsareLinkedandRegulated....................................................................................1324.16StandardOperationsRoutineSheet(SORS)......................................................................1334.17LeanManufacturingCellswithManualMachiningandManualAssemblyOperations.....................................................................................................................................1354.18 DesignforCustomerSatisfaction...........................................................................................1374.19TheEndGame:BenefitsofConvertingtoLeanManufacturingandInterimCells.................................................................................................................................1384.20InterimCellstoMatureLeanCells.........................................................................................1384.21PokayokeDevices.........................................................................................................................1404.22ErgonomicandHumanFactorsConsiderationsinLeanCellDesign......................1404.23SummaryandConclusions........................................................................................................141
ReviewQuestions..........................................................................................................................143Chapter5SubassemblyCells
5.1Introduction.....................................................................................................................................1475.2ConvertingConveyorLinestoLeanCells............................................................................1495.3TheToyotaProductionSystem(TPS)...................................................................................1505.4SubassemblyCellDesignandOperation.............................................................................1525.5TaktTimeandCellOperation...................................................................................................1525.5.1TaktTime(TT)Example......................................................................................................152
5.6SequencingCellOperations.......................................................................................................1535.7MinimizingCellWIP:Stock‐on‐Hand(SOH)......................................................................1535.8OperatingLeanCells.....................................................................................................................1545.8.1SingleWorker..........................................................................................................................1545.8.2Multipleworkers.....................................................................................................................154
5.8.2.1RabbitChase..................................................................................................................1545.8.2.2BucketBrigade(BartholomewandEinstein)..................................................1555.8.2.3TheToyotaSewingSystem(TSS).........................................................................156
5.9LinkingCells......................................................................................................................................1595.10CellPerformanceMeasures.....................................................................................................1615.11StaffingLeanCellsandRespondingtoDemand(Takttime).....................................1615.12CellDescription.............................................................................................................................1625.12.1SingleWorker........................................................................................................................1625.12.2TwoWorkersinaSubcell...............................................................................................1625.12.3FiveWorkersinaSub‐cell..............................................................................................164

viii
5.12.4RabbitChase...........................................................................................................................166 5.13TheSubCellDesignMethod(MultipleWorkersinoneU‐shapedCell)..............166
5.14FlexibilityandCellDesign.......................................................................................................1685.15SummaryandConclusions......................................................................................................171
Chapter6APlantTrip(LeanShopvstheJobShopforaRackBar)
6.1Introduction....................................................................................................................................1756.2DescriptionoftheStudy............................................................................................................1756.3TheTraditionalMassProductionSystem..........................................................................1816.4ALeanSubassemblyCell...........................................................................................................1836.5MassPlantvsLeanPlantMachiningAreas.......................................................................1846.6TheLeanShop................................................................................................................................1876.7HowLeanCellsOperate.............................................................................................................1896.8TheRulesforLeanManufacturingCellDesign................................................................1906.9ErgonomicsofLeanManufacturingCells...........................................................................1916.10AdvantagesofHome‐BuiltEquipment.............................................................................1936.11MeasurableParameters(MassvsLean)..........................................................................1966.12ManufacturingProcessTechnology:LeanvsMassProduction.............................1976.13MassVsLeanCapacity.............................................................................................................2016.14Summary........................................................................................................................................203
ReviewQuestions..........................................................................................................................205Chapter7BalancingandLevelingProduction
7.1Introduction.....................................................................................................................................2077.2BalancingWorkload.....................................................................................................................2087.3BalancingSingleProductProductionLines.......................................................................2107.4ASingleProductBalancingProblem.....................................................................................2117.4.1TheLargestEligibleTimeRule(LETR)..........................................................................2127.4.2TheAssignmentProcedure.................................................................................................2137.4.3TheRankedPositionalWeightingTechnique(RPWT)...........................................2157.4.4ManufacturingaCD/VHSComboPlayerUnit.............................................................215
7.5MixedModelProduction............................................................................................................2187.5.1BottleneckProcessesandPacingParameters...........................................................2197.5.2BalancingMixedModelProductionLines:...................................................................220
7.6AMixedModelLineBalancingExample..............................................................................2227.7MaintainingBalance.....................................................................................................................2257.7.1AWorkerAssignmentStrategy........................................................................................2277.7.2SequencingtheProducts......................................................................................................2307.7.3ComputationalDifficulties...................................................................................................234
7.8Set‐upandChangeoverTimesRevisited:GeneralObservations..............................2347.9RespondingtoDemandChanges:GeneralObservations.............................................236

ix
7.10SolvingShortTermImbalanceinProductionRequirements...................................2367.11Summary..........................................................................................................................................237
Chapter8LeanMSPImplementationMethodology
8.1Introduction.....................................................................................................................................2458.2HowManufacturingSystemDesignsHaveEvolved.......................................................2478.3ManufacturingPhilosophyMustChange.............................................................................2488.4STEP1:LevelingtheManufacturingSystem......................................................................2528.5STEP2:RestructuringSubassemblyandtheJobShop..................................................2558.5.1DesigningCells.........................................................................................................................255
8.6ValueStreamMapping.................................................................................................................256 8.7VSMProcessSteps:.......................................................................................................................260 8.8DetermineProductFamily........................................................................................................261 8.9MappingtheCurrentState:TheProcessFlow..................................................................263
8.9.1VSMSummary,CurrentState............................................................................................266 8.10CreatingtheFutureState..........................................................................................................266 8.11ValueStreamMappingSummary..........................................................................................266 8.12STEP3:RapidExchangeofToolingandDies...................................................................268
8.13STEP4:IntegrateQualityControl.........................................................................................2708.14STEP5:MakeOutputPredictable:IntegratePreventiveMaintenance................2748.15STEP6:IntegratingProductionControl.............................................................................2758.16STEP7:IntegratingInventoryControl................................................................................2778.17STEP8:IntegratetheSuppliers..............................................................................................2788.18STEP9:Autonomation...............................................................................................................2798.19STEP10:RestructuretheProductionSystem..................................................................2808.20WhyLeanManufacturingImplementationsFail............................................................2828.21Leadership.......................................................................................................................................2838.22Outsourcing....................................................................................................................................2848.23Summary..........................................................................................................................................285
Chapter9FundamentalsofWorkstationModeling
9.1Introduction.....................................................................................................................................2899.2WorkstationComponentsandCharacteristics.................................................................2929.3TheServerUtilizationandtheOfferedWorkload...........................................................2959.4Kendall’sNotation.........................................................................................................................2959.5GeneralNotation............................................................................................................................2969.6GeneralComments........................................................................................................................2969.7Example1..........................................................................................................................................2989.7.1PerformanceMeasures‐Revisited..................................................................................302
9.8Example2...........................................................................................................................................3039.9MultipleServerWorkstations...................................................................................................304

x
9.10Example3........................................................................................................................................3059.11Example4........................................................................................................................................3059.12Example5........................................................................................................................................3079.13GeneralNon‐MarkovianWorkstations..............................................................................3089.13.1TheM/G/1Model.................................................................................................................308
9.14Example6........................................................................................................................................309 9.15TheG/G/1Model.........................................................................................................................310 9.16Example7........................................................................................................................................310 9.17TheG/G/CModel.........................................................................................................................311 9.18Example8........................................................................................................................................311
9.19Summary..........................................................................................................................................313 ReviewQuestions..........................................................................................................................313Chapter10SingleProductFactoryFlowModels
10.1Introduction....................................................................................................................................31710.2ASerialProductionLinewithConstantProcessingTimes........................................31710.3AnUnbalancedSerialProductionLine...............................................................................31710.4AStochasticSerialProductionLine.....................................................................................32210.5JacksonNetworks........................................................................................................................32510.5.1AJacksonNetworkExample:NoReentrantFlow.................................................32610.5.2AJacksonFlowNetworkwithRecirculation...........................................................328
10.6 SingleProductSerialProductionLines.............................................................................329 10.7CharacterizingInputandOutputProcessesfromGeneralServiceWorkstations..............................................................................................................................331
10.7.1TheArrivalandDepartureProcess.............................................................................33110.8AThreeWorkstationNon‐MarkovianModel..................................................................33210.9SerialSystemswithRe‐entrantFlows................................................................................33410.10AFiveStep,ThreeWorkstationNetworkFlowProblem.........................................33810.10.1DeterminingWorkstationWorkload.........................................................................33810.10.2AnalyzingtheProductFlowNetwork.......................................................................33910.10.3CalculatingCompositeWorkstationProcessingTimesandtheWorkstationServiceSCVValues.........................................................................34010.10.4Calculatingthe (j)andthe (j)Values........................................................34110.10.5WorkstationAnalysis.......................................................................................................343
10.11Summary.......................................................................................................................................344 ReviewQuestions..........................................................................................................................345
Chapter11SingleProductFactoryFlowModels
11.1Introduction....................................................................................................................................34911.2ComputationalNotation............................................................................................................35011.3ComputationalProcedures......................................................................................................352

xi
11.3.1CalculatingtheProductFlowloads,WorkstationOfferedWorkloadsandtheNumberofServersRequiredateachWorkstation..................................35311.3.2TheOfferedWorkloadtoeachWorkstation,theRequiredNumberof MachinesandtheWorkstationUtilization........................................................35511.3.3CalculatingtheCompositeWorkstationProcessingTimes................................35611.3.4CalculatingtheCompositeWorkstationProcessingTimesSquaredCoefficientofVariation: (j)j=1,2…..M......................................................35711.3.5CalculatingtheCompositeWorkstationArrivalTimeSquaredCoefficientofVariations: (j)j=1,2…..M...........................................................................35711.3.6WorkstationAnalysis..........................................................................................................36111.3.7SystemAnalysis.....................................................................................................................36311.3.8ProductAnalysis...................................................................................................................363
11.4AFlowShopModel....................................................................................................................36511.4.1TheProductFlowRates.....................................................................................................36611.4.2CalculatingtheOfferedWorkloads,ServerUtilizationandtheNumberofServersRequiredateachWorkstation.........................................................36611.4.3CalculatingtheCompositeWorkstationProcessingTimes(Sj)andthetheCV (j)valuesforj=1,2,3,4...........................................................................36711.4.4Calculatingthe (j)valuesforj=1,2,3,4............................................................36811.4.5WorkstationPerformanceMeasures...........................................................................36911.4.6SystemPerformanceMeasures......................................................................................37011.4.7IndividualProductPerformanceMeasures...............................................................371
11.5GroupTechnologyandFocusedFactories......................................................................37211.5.1ModelingaFocusedFactory............................................................................................373 Model1:TwoManufacturingCellsSharingMachine3........................................375
Model2:TwoManufacturingCellsOperatingIndependently..........................37811.6Summary.........................................................................................................................................379
Chapter12TheDisruptiveEffectsofVariance
12.1Introduction....................................................................................................................................38312.2FailuretoReduceVarianceinTimeBetweenArrivals................................................38412.3InducingVariancebyPoorOrderReleasePolicies.......................................................38612.4TheDisruptiveEffectsofPoorMaintenancePractices................................................38812.5RandomFailuresandProcurement.....................................................................................39012.6TheDisastrousEffectsofBadQualityandRework.......................................................39212.6.1TheEffectsofPoorQuality...............................................................................................39412.6.2OfferedFlowLoads..............................................................................................................39512.6.3SolvingfortheArrivalSCV’s............................................................................................39512.6.4WorkstationAnalysis..........................................................................................................39712.6.5SystemPerformanceMeasures......................................................................................39812.6.6NoReworkorScrap.............................................................................................................39812.6.7SystemPerformanceMeasures......................................................................................39912.6.8ComparingtheTwoSystems...........................................................................................399

xii
12.7TheEffectsofBatching..............................................................................................................40012.8AnalysisofaSerialBatchingSystem...................................................................................40112.8.1TimeinQueueatWorkstation1...................................................................................40212.8.2TimeinQueueplusProcessingTimeatWorkstation1.......................................40212.8.3TimetoformaBatchatWorkstation1........................................................................40212.8.4ThroughputTimeatWorkstation1perPart............................................................40312.8.5CycletimeatWorkstation2..............................................................................................40312.8.6Determiningthe 2(2)intoWorkstation2......................................................40312.8.7TimetoUn‐batchatWorkstation2..............................................................................40412.8.8Determiningthe 2(2)atWorkstation2..........................................................40412.8.9DeterminingtheWaitingTimeperPartatWorkstation2.................................40412.8.10ServerUtilizationatWorkstation2..........................................................................40412.8.11ThroughputTimeatWorkstation2..........................................................................40512.8.12BatchingNumericalExample.......................................................................................40512.8.13FinalCommentsonBatching.......................................................................................408
12.9SummaryandConclusions.......................................................................................................408Chapter13PushandPullSystems
13.1Pushvs.Pull:Whataretheissues?.......................................................................................41313.2HistoricalPerspectives..............................................................................................................41313.3TheCharacteristicsofPullSystems.....................................................................................41613.4WhyPull??......................................................................................................................................41813.5IsitPushorPull???....................................................................................................................41913.6CONWIP:AHybridPush‐PullSystem..................................................................................42213.7APurePush‐PullSystem...........................................................................................................42413.8TheCONWIPModel.....................................................................................................................42413.9ClosedQueuingNetworks........................................................................................................42413.9.1OptimumSystemPerformance.......................................................................................429
13.10ObservationsonVariabilityanditsInfluence...............................................................43113.11SummaryandConclusions....................................................................................................432
ReviewQuestions..........................................................................................................................432Chapter14IntegratedQualityControl
14.1Introduction..................................................................................................................................43514.2StatisticalQualityControl........................................................................................................43614.2.1AcceptanceSampling..........................................................................................................43614.2.2ControlCharts........................................................................................................................43814.2.3IntegratedQualityControl(IQC)....................................................................................441
14.3ProcessAnalysis:ToolsandTechniques...........................................................................44214.4The7ToolsofLeanQC..............................................................................................................44314.4.1TheHistogram........................................................................................................................443

xiii
14.4.2TheRunChart.......................................................................................................................44414.4.3TheProcessFlowChart....................................................................................................44414.4.4TheParetoDiagram............................................................................................................44614.4.5TheCauseandEffectDiagram.......................................................................................44714.4.6TheScatterDiagram...........................................................................................................44814.4.7CheckSheets...........................................................................................................................448
14.5MonitoringProcessQuality.....................................................................................................44814.5.1Controlcharts.........................................................................................................................450
14.6ProcessCapabilityofaCenteredProcess..........................................................................45214.7ProcessCapabilityforanOff‐CenteredProcess.............................................................45414.8PrecisionversusAccuracy........................................................................................................45514.9AdditionalBenefitsofQualityControl(QC)Studies.....................................................45714.10QualityRedefined......................................................................................................................45814.11InternalQualityChecks(IQC)inLeanManufacturingCells...................................45914.12IQCConcepts................................................................................................................................45914.13BasicPrinciplesofIQC.............................................................................................................46114.14SixSigmaManufacturing........................................................................................................46214.15SixSigmaMethodologies........................................................................................................46314.16LeanSixSigmaTools................................................................................................................46414.17TaguchiMethods........................................................................................................................46414.18TeamingandQualityCircles.................................................................................................46814.19Poka‐yokes...................................................................................................................................46914.20LineStops......................................................................................................................................47214.21ProperlyImplementingQC....................................................................................................47214.22MakingQualityVisible.............................................................................................................47314.23MovingtoWorldClassQuality............................................................................................47314.24OneHundredPercentInspection?.....................................................................................47414.25Conclusions..................................................................................................................................475
ReviewQuestions..........................................................................................................................476Chapter15IntegratedProductionandInventoryControl
15.1Introduction................................................................................................................................48115.2WhatisKanban?..........................................................................................................................48115.3HowDoesAKanbanSystemWork?....................................................................................48315.4TypesofKanbanSystems........................................................................................................48415.4.1Single‐CardSystem..........................................................................................................48415.4.2Dual‐CardKanbanSystem................................................................................................48715.4.3MaterialOrderingKanbans(MOK’s)........................................................................494
15.5AdvantagesoftheCONWIPSystem.....................................................................................49615.5.1AdvantagesoftheCONWIPSystem..............................................................................49715.5.2LimitationsofCONWIP......................................................................................................498
15.6IntegratedInventoryControl..................................................................................................49815.7Inventory:AnIndependentControlVariable.................................................................500

xiv
15.8UsingKanbanasaControlVariable.....................................................................................50115.9KanbanPullSystemComparedtoMRP..............................................................................50215.10SupplyChainManagement(SCM).....................................................................................50415.11LeanSupplyChainManagement(L‐SCM).....................................................................50715.12CharacteristicsofL‐CMSPurchasing...............................................................................50915.13EightBestPracticeGoals.......................................................................................................50915.14KanbanSummary.....................................................................................................................511
ReviewQuestions..........................................................................................................................512Chapter16IntegratedPreventiveMaintenance(IPM),Reliabilityand ContinuousImprovement
16.1Introduction....................................................................................................................................51516.2An4‐8‐4‐8Schedule=LTFC...................................................................................................51516.3SchedulingPreventativeMaintenance................................................................................51616.4WhatPMMeans............................................................................................................................51716.5ValueofPreventiveMaintenance..........................................................................................51716.6InternalPreventiveMaintenanceInvolvestheInternalCustomer........................51816.7RoleofMaintenance....................................................................................................................51816.8LeanEngineeringandMaintenance....................................................................................51916.9TotalProductiveMaintenance(TPM).................................................................................51916.9.1Nakajima’s5PillarsofPreventiveMaintenance.....................................................52016.9.2Developanautonomousmaintenanceprogram.....................................................520
16.10ZeroDowntime...........................................................................................................................52116.11IntegratedPreventiveMaintenance(IPM)inLeanProduction.............................52216.11.1BenchmarkingYourCompany......................................................................................52316.11.2Piloting....................................................................................................................................52316.11.3PreventiveMaintenance.................................................................................................52316.11.4PredictiveMaintenance...................................................................................................52316.11.5ComputerizedMaintenanceManagementSystem..............................................524
16.12ContinuousImprovement(CI).............................................................................................52516.12.1StandardizationandContinuousImprovement...................................................525
16.13ContinuousImprovementandEmployeeInvolvement............................................52816.13.1ContinuousImprovementandtheFiveSPrinciples..........................................529
16.14KaizenActivitiesSuggestionSystem.................................................................................53016.15Reliability......................................................................................................................................53116.15.1ReliabilityasaConcept....................................................................................................53116.15.2ReliabilityStudies..............................................................................................................53216.15.3HardwareReliability.........................................................................................................53216.15.4SoftwareReliability...........................................................................................................53416.15.5WorkforceReliability.......................................................................................................535
16.16ShiftWork.....................................................................................................................................53616.17ImplementationofIntegratedProductiveMaintenance..........................................53816.18Summary.......................................................................................................................................539

xv
Chapter17LeanTools
17.1Introduction..................................................................................................................................54317.2ProcessFlowCharts....................................................................................................................54317.2.1Productionflowanalysis(PFA)......................................................................................54317.2.2ConductingValueStreamMapping...............................................................................54417.2.3ProcessFlowSymbols........................................................................................................544
17.3LeanSixSigma...............................................................................................................................54817.3.1TaguchiMethodsIncorporatetheFollowingGeneralFeatures.......................548
17.4SMED................................................................................................................................................55017.5DecreasingtheSetupTimeResultsInSmallerLots.....................................................55017.6OrganizingtoEliminateSetupTime....................................................................................55117.7TheProjectTeam........................................................................................................................55117.8MotivationforSingle‐MinuteExchangeofDies(SMED)............................................55217.9FourStagesforReducingSetupTime.................................................................................55317.10DeterminingExistingPractices(As‐Is)............................................................................55317.11SeparatingInternalfromExternalElements.................................................................55517.12ConvertingInternalSetuptoExternalSetup................................................................55717.13ReduceorEliminateInternalElements...........................................................................55817.14IntermediateWorkHolders..................................................................................................55917.15ApplyingmethodsAnalysis...................................................................................................56017.16StandardizeMethodsandPracticeSetups.....................................................................56017.17AbolishSetup...............................................................................................................................56117.18SummaryforSMED...................................................................................................................56217.19ThePaperlessFactoryoftheFuture.................................................................................56317.20VisualControlorManagementbySight..........................................................................56317.20.1InformationonDisplay....................................................................................................56417.20.2WorkplaceOrganizationthroughtheShop............................................................56417.20.3VisualControlforHousekeepingandWorkPlaceOrganization...................56417.20.4VisualControlforStorageArea...................................................................................56617.20.5VisualControltoConveyInformation......................................................................56617.20.6LineStopConcepts............................................................................................................56617.20.7LineStopwithMachinesandLineOperations......................................................566
17.21OtherControlTechniques......................................................................................................56617.21.1HourlyCheck........................................................................................................................56617.21.2ControlCharts,CheckSheets,andOtherProcessDocumentation...............566
17.22GroupTechnology.....................................................................................................................56717.22.1Coding/ClassificationMethods...................................................................................56817.22.2OtherGTCellDesignMethods......................................................................................569
17.23Summary.......................................................................................................................................570

xvi
Chapter18SustainingtheLeanEnterprise
18.1Introduction....................................................................................................................................57118.2WhatistheMeaningofLean?.................................................................................................57118.3EnterpriseSystemDesign........................................................................................................57218.4SystemDesignandEngineeringofaLeanEnterprise.................................................57318.5SustainingtheEnterpriseDesign..........................................................................................58018.6StableSystemDesign..................................................................................................................58818.7TheUnitCostEquationandStableSystemDesign........................................................58918.8AFactoryRe‐DesignExample.................................................................................................59218.9MovingForward...........................................................................................................................59518.10WorkingwithEnterpriseSystems.....................................................................................59518.11Summary.......................................................................................................................................596
Chapter19AdvancesinMixedModelFinalAssembly
19.1Introduction..................................................................................................................................59819.2History.............................................................................................................................................59819.3MixedModelFinalAssembly.................................................................................................59919.4AReal‐WorldExampleofMMFA..........................................................................................60119.5KeyEnablingSystems...............................................................................................................60219.5.1Just‐In‐Time(JIT)ComponentDeliveries.................................................................602
19.6AssemblyLineBalancing(ALB).............................................................................................60319.6.1ManualAssemblyLineBalancing..................................................................................60619.6.2PrecedenceConstraints.....................................................................................................60719.6.3ManualPrecedenceMapping...........................................................................................60919.6.4ChallengeswithManualPrecedenceMapping.........................................................61119.6.5PrecedenceRelationshipLearning...............................................................................61219.6.6Termsanddefinitions.........................................................................................................61319.6.7ResultsofthePilotStudy:PrecedenceLearning.....................................................616
19.7Sequencing......................................................................................................................................61619.7.1WorkOverload.......................................................................................................................61819.7.2Just‐in‐Timeobjectives.......................................................................................................618
19.8Mixed‐ModelSequencing..........................................................................................................61919.8.1Sequencing...............................................................................................................................62119.8.2LevelScheduling....................................................................................................................62219.8.3Conclusion................................................................................................................................622
19.9Summary..........................................................................................................................................622

xvii
Bibliography...................................................................................................................................571
Index....................................................................................................................................................634
GlossaryofImportantLeanConceptsandTerms...................................................640


xix
PREFACE
“Perhaps we should stop looking for the sharpest needle in the haystack And find one that we can sew with….” March & Siman, Organizations
The motivation for constructing this textbook evolved from over 30 years teaching and industrial experience in manufacturing systems design and analysis. As the years passed, it became abundantly clear that traditional mass production lines were not suited to the flexibility and versatility required to competitively compete in an evolving international marketplace. In order to frame this observation and describe how it came about, we need to briefly describe the evolution of modern manufacturing systems. Manufacturing is not a new endeavor; it has been around since ancient times. Biblical and historical records record extended battles between ancient empires. These encounters required thousands of bows, arrows, knives, swords and shields. We know that the Romans manufactured these items in Rome to equip their legions. In those days, manufacturing was a craft activity. Skilled individuals made these and other things using crude tools and no automation. This continued for over 3000 years. In the late 18th century and the early 19th century all of this began to change. Exploiting the wheel and the concept of leveraging power by using gears, a new manufacturing paradigm slowly emerged. Using the power of water from streams, manufacturing plants began to automate by generating power from falling water. Pulleys and gears were connected by crude homemade belts and the cottage industries of individual skilled craftsman gave way to groups of powered machines and the job shop emerged. These initial efforts at automation were pioneered and perfected in the Eastern United States where water power was plentiful and creative men were out to make their fortune. The world came to see……and the world adopted these methodologies. Water power reached its zenith and its destiny when James Watt (1726-1819) invented the first modern steam engine. This paved the way for the locomotive, ocean liners and powerful machinery. The old had passed away, and the new had emerged. This was the First Industrial Revolution, called the American Armory System by the historians. The first true Manufacturing engineer was undoubtedly Henry Ford. Henry Ford pursued a vision of creating an automobile that almost any American could afford, and at the same time operate without failure for long periods of time. Initially, Henry Ford was influenced by two key principles: (1) standardization and interchangeability of parts and (2) specialization of labor (Turner, Mize and Case). As far as we can tell, Adam Smith (1776) and Charles Babbage (1832) were among the first to recognize the efficiency and productivity of division of labor. The advantages and superiority in mass production of part standardization and interchangeability were pioneered by Eli Whitney (1785-1793) when he standardized parts which were used to build a cotton gin. Fueled by these two key principles, Henry Ford became the progenitor of the Second Industrial Revolution. Almost single handedly, he designed and built the first Mass Production Assembly line and built millions of Model T (1908-1927) and Model A (1927-1931) Ford vehicles. As a testimony to his genius and engineering skills, many of these vehicles are still running today.

xx
"I will build a car for the great multitude. It will be large enough for the family, but small enough for the individual to run and care for. It will be constructed of the best materials, by the best men to be hired, after the simplest designs that modern engineering can devise. But it will be so low in price that no man making a good salary will be unable to own one – and enjoy with his family the blessing of hours of pleasure in God's great open spaces” Henry Ford, 1908 Although Henry Ford was very successful, he had a fatal flaw in his thinking. Obsessed with standardization, he purposely eliminated any variety or customization of mass produced vehicles. One of his famous quotations was: “You can buy any color of Model A that you choose, as long as it is black”. Reluctant or unable to respond to the individual customer, his pioneering efforts were soon to come to an end. Almost simultaneously, entrepreneur name William C. Durant arrived on the scene. In 1908, Durant recognized that the automobile was here to stay, but that a customer was going to demand variety and customization. He formed General Motors Corporation, and the Second Industrial Revolution was underway. Durant set up several automotive divisions (Buick, Pontiac, Cadillac and Chevrolet) and within each division he produced one line of automobiles, but with variety in several different models. General Motors pioneered the Mass production of mixed-model automobiles and the concepts of high speed assembly lines. A new engineer emerged which we now call a manufacturing engineer, but they were mostly Mecanical engineers. This new breed of manufacturing engineers and manufacturing practices were fueled by the work of Frederick F. Taylor (Scientific management) and Frank & Lillian Gilbreath (Motion and time Study). Both were concerned about the best way to perform a task (time and cost). Henry Gantt developed charts to schedule these factors. These people can rightly be considered to be the first Industrial Engineers. The world’s first Industrial engineering Degree was established at Penn State University in 1909 in the Department of Mechanical engineering. While mass production lines were being pioneered by General Motors, there was a dark cloud which hung over world peace. In 1914 WWI started and lasted until 1918. Mass production of war machines such as guns, tanks and planes were built upon existing knowledge and much success was achieved. However, modern mass manufacturing and paced assembly lines were not begun until 1941 when the United States entered WWII (1939-1945). Between 1941 and 1945 there were enormous strides taken in the mass production of war machines. After WWII, these methodologies and production innovations began to find their way into general American Manufacturing. Following WWII, America emerged as the world leader in manufactured goods and services. Led by the aerospace and automotive industries, mass production continued to evolve and produce at higher rates. During this era, Industrial Engineering played a large role in finding better ways to do things, designing more efficient systems and optimizing key parameters. The work of Charles Babbage, Henry Metcalf, Henry Gantt, Frederick Taylor and the Gilbreaths (Frank & Lillian) established Industrial Engineering as the productivity people. Between 1923-1932 Elton Mayo conducted his now famous Hawthorne Experiments at the Western Electric Company. Mayo directed a series of studies which scientifically established that there were close and undeniable connections between the physical conditions, mental attitudes and welfare of the workforce to productivity, quality, and a host of other factors. These factors were directly related to corporate profits. These experiments expanded the scope of Industrial engineering to include Human factors and Ergonomics, and had a dramatic influence

xxi
on Taylor and the Gilbreaths. George Danzig developed Linear Programming at Stanford University in 1939, and proved its usefulness in solving a wide range of practical problems. During WWII, the field of Operations Research emerged in England under a group called Blackett’s Circus. The Industrial Engineering community adopted Operations Research into their program of study, and modern Industrial Engineering emerged. The Second Industrial Revolution was not instantaneous, but spanned a period of over 50 years, including two world wars. The evolution of assembly line manufacturing started with Henry Ford’s production system and is currently best typified by the high speed assembly lines of General Motors Corporation, Ford Motor Company and the Chrysler Corporation. In this era, the Mass Production System reached unprecedented capabilities to produce a wide variety of automobiles. However, as previously discussed, the Achilles heel of American Automobile Manufacturing is the lack of flexibility and versatility to rapidly change from one set of finished products to another. This may seem paradoxical in contrast of the previous statement that a wide variety of automobiles are produced, but manufactured variety is actually built into the mass production systems. A typical American automobile manufacturer will spend up to 3 years designing future automobiles, and to change mass production from one year to the next requires a complicated and expensive changeover sometimes spanning 6 months. Modern Mass production Lines often involve massive supermachines and highly automated processes, blended with some manual tasks. This is a highly automated form of Henry Ford’s flow line for building and producing modern automobiles in extremely large volumes (400,000 to 500,000 per year). The enabling technologies are repeat-cycle, dedicated machines with automated material handling devices and sophisticated control systems. Although a wide variety of automobile configurations are produced, within any one family of cars there is a large degree of standardized basic configurations and interchangeability of parts.
As the modern Mass Production System evolved, it became necessary to develop and deploy highly sophisticated Production Planning and Control Systems. In 1964 Joseph Orlicky introduced Materials Requirement Planning (MRP) as a tool to combat emerging international competition. In 1983 Oliver Wight transformed MRP into Manufacturing Resource Planning or MRP II. As the modern computer matured into an incredible computational platform and the PC emerged, the race to implement computerized production planning and control was underway. By 1975, MRP was implemented in 150 companies. By 1981, this had risen to over 8000 companies. MRP II brought master scheduling, rough-cut capacity planning, and material requirements planning under one computational umbrella. By 1989, about one third of the software industry software sold to American industry was MRP II ($1.2 billion worth of software). However, major problems began to surface. First, modern MRP II systems can require a large support staff to manage its capabilities. Second, there has been a failure to fully integrate factory floor status into the planning framework because of cost and time. Third, such a wide degree of computer control tends to dehumanize the factory worker. Skilled labor with years of experience began to be supplanted by computerized instructions. When things went bad (frequently) and work flow priorities disrupted the planned schedule, expeditors were sent to resolve the problem. Worse, because expensive high speed mass production lines were driven to 100 % utilization, any disruption to product flow caused a corresponding failure in planned production. The stage was set for a new Industrial Revolution to emerge.

xxii
The Third Industrial Revolution came from an unpredictable and surprising source. After WWII ended, the Japanese Toyota automobile manufacturing company was ready to take on the world supremacy of American Automobile Manufacturing; but there was a lack of sophisticated computer software and hardware to build upon. Further, labor was plentiful and comparatively cheap. Finally, the Japanese economy was not ready to support the sales required to support another General Motors Corporation. In the early 1950s Taiichi Ohno conceived and designed an entirely new manufacturing system concept that was destined to change the entire manufacturing world. His system became known as the Toyota Production System (TPS), and was rooted in five(5) basic concepts: (1) Just-in-time production… only manufacture what is needed, in the quantity needed, at the correct point in time (2) Implement pull vs push production strategies (3) Control production with simple, manual control strategies which became known as Kanban (4) convert all Mass Production lines into a Linked-Cell Manufacturing System (L-CMS) with Mixed Model Final Assembly (MMFA). Finally, and most important (5) Aggressively and continuously vigorously attack any form of waste (Muda) in the entire manufacturing system from the supply chain to final product delivery. The methodologies, strategies and tools to accomplish this transformation are contained in this textbook.
Ohno found perhaps the one man in Japan that could make the TPS concept a reality. His name was Shigeo Shingo. When history records the Third Industrial Revolution, the name of Shigeo Shingo will rank with those of Henry Ford, Frederick Taylor and Lillian Gilbreath. Shingo was a Japanese Industrial Engineer. If Ohno was the conceptual force behind TPS, Shingo was the driving force behind its implementation. Every Industrial Engineer should read his books on the Toyota Production System. This new design took years to develop and implement, but by the mid-1960s the world began to take notice. In 1982 Shoenberger wrote a landmark textbook called Japanese Manufacturing Techniques after visiting Japan. In 1990, Black published his first book describing manufacturing cells called the Design of the Factory with a Future. In 1991 Womack, Jones and Roos published a book called The Machine that Changed the World. The term lean production introduced here was coined by John Krafcik. After extensive trips to Japan, Womack and Jones rocked the entire industrial world by publishing a textbook called Lean Thinking in 1996. The term Lean stuck, and TPS became known as the Lean Production System. Academicians such as Hall, Monden and Black soon joined the chase; and understanding the transformation to Lean Production began to emerge. The concepts of U-shaped, Lean Production Cells were published by Black and his colleagues (Black and Hunter, 2003). Lean concepts are now being applied to service systems, hospitals, insurance companies, small job shops and large manufacturing companies. One of the first companies to jump on the Lean bandwagon was Harley-Davidson, who reported spectacular results (1980s).
Around 2008, JT. Black and Don T. Phillips met and discussed the need for an exciting new breed of manufacturing engineer… one who would be thoroughly trained and equipped to lead Lean implementation across a wide variety of applications. It was agreed that perhaps the best engineering discipline from which this new engineer might emerge was Industrial Engineering. This decision was by no means self-serving: The modern Industrial Engineer is trained to continuously improve the intersection of people, scarce resources and equipment. The TPS and current Lean transformations require extensive knowledge of this intersection, with specific training in systems design and analysis, statistics, human factors and ergonomics, production planning and control, facilities layout and design, supply chain management and

xxiii
warehousing/distribution/material handling. However, Black and Phillips soon realized that while modern Industrial engineering provided a strong foundation, there were significant educational changes which needed to take place. Traditional IE skills need to be augmented with the methodologies of aggressive variance reduction, the principles of Factory Physics, Lean cell design, setup time reduction, decoupler design, Poka-yoke insertion, Kanban control, full preventative maintenance, total quality management and zero defects, 5 S methodologies and WIP reduction strategies: Worker paced production and not machine paced production, push versus pull strategies and many other new skills including the intersection of 6-sigma methods. This new breed of Industrial Engineer deserved a new name: We call this new engineer a Lean Engineer. We will be quick to state that the new Lean Engineer does not supplant or replace the traditional Industrial Engineer, but rather creates a new career path and game-changing engineering discipline with specialized training in Lean Concepts. This concept prompted us to construct this textbook, which represents only an initial effort to define and equip this new engineer with a core set of tools. In a real sense, we seek to convince the discipline of Industrial Engineering to embrace, support and educate this new Lean Engineer. Succinctly stated, this new baby needs a home. We propose….. now we plead…. that Lean Engineering and Lean Thinking be unified under Industrial Engineering and taught as a new, emerging discipline.
Many academic institutions, including Texas A&M University and Auburn University, have introduced stand-alone Lean course(s). While this has created a general awareness of Lean concepts, a unified body of knowledge and the unique design aspects of Lean Systems design have not yet emerged. The truth is also that Lean Thinking and Lean Concepts are no longer confined to automobile manufacturing. These concepts have been found to be universally effective in reducing wastes, improving system performance, increasing quality and simply resulting in higher profits. Lean is now surfacing as a transformative theory in all forms of production, service and mass production systems. In a recent informal survey by the authors, 61% of all manufacturers reported that they were either planning to implement Lean or were in the process of doing so. This is not a fad nor is it a temporary fix…. It is the Third Industrial Revolution. It demands to be unified under the title of Lean Engineering. The authors are convinced that when some Engineering discipline decides to do this… the world will beat a path to their door. But much needs to be done; this text is only a meager beginning.
As efforts to integrate Lean concepts, Industrial engineering and 6-sigma emerge into a unified engineering discipline; it will become clear that the main benefit will be to create a deeper understanding of the unified power in these now mostly disjoint but complementary disciplines. The first step is not simply to integrate these concepts into a cohesive program of study, but to transform and change the very culture of manufacturing engineering. If 60%-70% of all manufacturing companies have begun this cultural change, how can we not also do so?
We are simply hopeful that this book will help articulate and define the very unique nature of Lean Transformation and Lean Systems Design, creating a pathway to Factories with a Future and Companies with a new Concept.
JT. Black and Don T. Phillips 2013

1
Chapter 1 Introduction to Lean Engineering
Changing any system will always take longer than you might think. JT. Black
KISS…Keep It Simple Stupid, or at least as simple as possible. Don T. Phillips
1.1 What is Lean Engineering? In the second decade of the 21st Century we are witnessing in America the restructuring of manufacturing systems. Manufacturing is on the decline, and assembly is on the rise. Extensive outsourcing to operations outside the United States border is becoming more commonplace. The entire manufacturing and assembly Enterprise is now the focus of intensive cost saving activities and waste reduction. The restructuring of the manufacturing enterprise and the supply chain which supports that enterprise is underway to produce goods and services at less cost, with higher quality in less time with higher customer satisfaction. Underlying these goals are principles of lean engineering, six-sigma engineering and Industrial Engineering. Leading these innovative practices is a Japanese company called Toyota, who has risen from meager beginnings to the world leader in automobile manufacturing. Toyota pioneered a new manufacturing system design and operation called the Toyota Production System or TPS. Since its origin in the early 1950s this new system has acquired many names; including Just-in Time (JIT), World-Class-Manufacturing, Stockless Production, Zero Inventory and Integrated Manufacturing Production System (IMPS). A full suite of common names for Lean Production is given in the following. The most commonly used name for this new system of operation is the Lean Production System which originated in a book called The Machine Which Changed the World by Womack and Jones in 1990. The term Lean Production stands in opposition and contrast to traditional Mass Production systems. In the early 1950s, Toyota Motor Company restructured its business with the goal of being the number 1 automobile manufacturer in the world. To achieve this goal it invented and implemented a new manufacturing system design which it called The Toyota Production System (TPS). In any manufacturing system, products, goods and services are produced by transforming raw materials to finished goods and products by a set of manufacturing process involving people, materials and machines. The manufacturing system systematically transforms raw materials into final product(s) through a system of Value Added activities. It is important that we distinguish the Manufacturing System from the Manufacturing Enterprise.

2
It is interesting to note that the term Lean Thinking has come to be synonymous with Lean Manufacturing. Lean thinking is simply the mental process of aggressively and continuously reducing Muda or waste. While this is certainly a necessary and continuous goal of Lean Manufacturing, it fails to capture the whole range of design, implementation and sustainment activities required to create a true Lean Enterprise System. The Lean Engineer does not represent a completely new body of knowledge, but a unique combination of several traditional and some new areas of knowledge. This book is an attempt to capture the tools, techniques and operational activities necessary to transform a traditional system or enterprise into a Lean System or enterprise. The force required to do this is embodied in what we now call a Lean Engineer. An Enterprise System supports and manages the Manufacturing System where the actual value-added activities take place. Figure 1.1 provides a high level view of the management and control functions which constitute a typical Enterprise System. The manufacturing system is a self-contained or distributed system which includes all of the manufacturing and operational components to manufacture a final product. In today’s global economy, this system may be distributed among various plant locations or international subassembly operations. These operational components are coordinated, managed and controlled by a Supply Chain Management System. The elements in a typical manufacturing system are automated or semi-automated machine tools, workstations, tooling and fixtures to support the workstation, human resources to support the system, material handling, warehousing and distribution systems to
Table 1.1 Name and Origin of Lean Manufacturing System

3
support product flows. The arrangement, functions, physical locations flexibility and versatility of these elements are largely determined by the Manufacturing System Design.
Figure 1.1
The enterprise system takes product demand data and product definition data to plan the work in the manufacturing system.
1.2 Manufacturing Systems The collection of processes and people that actually produce a final product is called a Manufacturing System. A typical manufacturing system is shown in Figure 1.2, and is characterized by a complex arrangement of physical elements characterized by measurable operating parameters (Black, 1991). Typical operating parameters are machine availability, through put time, cycle time and output rates (or production). The relationship of necessary manufacturing components and their complexity determine how efficiently a system can be operated and controlled. System control not only involves individual process steps, but also involves the entire manufacturing system. How well each process and element of the system harmoniously exists and supports one another largely affects the profit margin, efficient use of scarce resources and satisfaction of stated system goals and objectives. The entire manufacturing system must be continuously coordinated and controlled to efficiently move raw materials (work-in-process) throughout the system, schedule people, processes and customer orders, manage inventory levels, insure high product quality, maintain target production rates and minimize system costs.

4
Figure 1.2
Definition of a Manufacturing System with Inputs and Outputs The manufacturing system receives inputs that include materials, information and energy. The integrated system is a complex set of elements that include a wide variety of machines, tooling, material handling equipment and people. The entire system exists to serve customers; both internal and external. Individual machine centers within the system represent internal customers. The external customer is the person or entity who consumes goods and services produced by the
manufacturing system. Internal customers create value as raw materials are transformed into final product. External customers (usually) pay money for the delivery of these final goods and services. There is (usually) only one reason for a competitive, production system to exist… and that is to generate profit (revenue). In a traditional manufacturing system, revenue or profit is usually determined as a reasonable corporate goal, and is accomplished by calculating the total cost of production and establishing a sales price to guarantee revenue. This traditional way of thinking is a recipe for corporate disaster in a competitive sales environment. If the sales price is too high, the consumer will look elsewhere for a comparable product. In the Lean Engineering world, a subtle but powerful alternative is used.
Revenue = Sales Price – Cost of Production
Sales Price = Revenue + Cost of Production

5
In this world view, if desired revenue is set at say 30% profit, then the path to lower unit cost to the consumer….and hence higher sales if a quality product is produced…. is to lower the cost of production. This is the real driving force behind Lean Engineering. Lean Engineering and its associated methodologies are directed to waste reduction. In the Lean world, all forms of waste are aggressively attacked and systematically reduced. The result is reduced through put times, increased production rates, tighter system control and a higher quality product. This book will provide a framework and definition of how to achieve these goals, which we call Lean Engineering. All manufacturing systems are complex, dynamic and subject to variation. This means that they must be designed and built to constantly accommodate change. Many inputs previously described cannot be fully controlled by management, and the typical response to variance and disturbances are counteracted by constantly manipulating, changing and modifying order release, sequencing, scheduling and material availability. Constantly changing these functions of a manufacturing system can only create more variability in a system. Lean Engineering seeks to level production and create a stable manufacturing environment. In order understand the difficulty in designing or changing existing systems using modeling and analysis tools the following list will provide insight.
A Manufacturing system is usually very complex, difficult to rigorously define and exhibit different goals in different areas
Accurate data describing system operational behavior is usually either nonexistent or difficult to easily obtain. Even when system data exists, it may be inaccurate, out of date or too obscure to analyze and use without considerable effort.
Interactive behavior and operational relationships may be awkward to express in analytical terms and exist in nonlinear form. Hence, many standard modeling tools cannot be applied without oversimplification.
The physical size of large manufacturing systems may inhibit detailed modeling and analysis
Real-world systems rarely reach “steady state” behavior, and dynamically change through time. Many external forces such as environmental parameters can change system behavior.
All forms of accurate systems analysis are subject to modeling errors (inaccuracy or lack of sufficient detail); errors of omission (missing data and operational logic) and errors of commission (failure to properly use all of the data).
Because of these and other difficulties, systems simulation analysis has emerged as the most important tool for detailed systems analysis and for manufacturing system design. Of course, higher levels of modeling and analysis such as queuing networks often provide extremely valuable insight. As new Lean Engineering modeling and analysis capabilities emerge, systems analysis will be more effective. 1.3 Critical Control Functions in a Manufacturing System Ideally, manufacturing systems control should be vertically integrated, with each level of system control being composed of horizontally integrated subsystems dedicated to appropriate tasks. Each level of control is vertically integrated to support the goals and objectives of the entire

6
system. The most critical control functions are production control, inventory control, quality control and machine tool control. While the system as an integrated entity will have a number of goals and objectives (cost control, profit, etc.) these system goals are often sought to be optimized by optimizing selected bits and pieces of existing subsystems. This will never work in a complex, interactive system. Real system control functions require complex information analysis from the lowest levels of operation to the highest. All decisions and operational policies must reflect both local (machine level) and global (corporate level) impact. To control any system:
The boundaries, constraints and interactive dependencies must be clearly identified.
System response and behavior to any system change must be identified. System behavioral objectives (Cost, profit, span times, throughput rates, etc,)
must be linked to subsystem operational rules
The rules and laws which describe and capture system behavior are difficult to discover and describe. Recent landmark work in this area is beginning to produce meaningful methodologies and procedures (Factory Physics by Hopp and Spearman for example). Accurate rules and laws of behavior must accurately link the behavior of a system to perturbations or changes in both input and behavioral characteristics. The entire field of Lean analysis is directed to this goal. 1.4 Trends in Manufacturing Systems Design In Chapter 2, we will devote considerable time to describing historical, current and future Lean systems design of manufacturing systems. The behavior of both greenfield systems and existing systems can be greatly influenced by the principles of Lean Engineering which will be presented in this book. However, the operational field of systems engineering has been partially clouded if not destroyed by academic researchers; principally those in Operations Research. Academicians have historically looked at manufacturing systems as an application playground for optimization theory. In order to sustain this approach, many important nonlinearities, complex systems interactions and stochastic behavior have been assumed away. The exception to this rule seems to be a subset of researchers applying simulation modeling techniques. In almost all cases, the operational and production system has often been assumed to be given or fixed to a large degree, and not something which requires change. As the reader proceeds through this book, it will become clear that Lean thinking and Lean operation is a path that requires and demands system behavioral, operational and managerial change in the fundamental way that a system is designed and operated. This new way of systems design and operation has been fueled by the following trends.
Many manufacturing systems now operate on an international, global scale. There are two aspects of this trend that should be noted.
o As manufacturers and producers of goods and services build plants around the world, the new manufacturing systems design must function in places with different cultures, currency ad languages.
o Outsourcing United States manufacturing functions to other high-tech, low-cost countries like Indonesia, Brazil and China will continue.
These two facts do not negate the reason to embrace Lean Thinking and to apply the principles of Lean engineering …. Rather they demand that waste elimination,

7
WIP control and more effective system control policies be adapted to survive and be cost competitive.
The proliferation of variety in products has resulted in a significant decrease in manufacturing build quantities. Smaller production lot sizes are necessary to facilitate increases in product options and variety; level production; quickly respond to customer demand; and support manufacturing versatility and agility.
The use of modern, exotic varieties of raw materials such as composites and plastics have created a need for old manufacturing processes and equipment to be seamlessly replaced by new, modern processes. New manufacturing systems must be designed to support rapid system change, and existing systems must be reengineered to support versatility and agility. In fact, many manufacturing systems such as those in the semiconductor and automobile industry feel that they must respond to new technologies to even exist.
The United States over the past decade has experienced a continual decrease in both the skills and desire for workers to embrace a career in advanced manufacturing (See Figure 1.3). This trend has resulted in increased automation and the emergence of “workerless warehouses”. As a consequence, direct labor hours are no longer considered the basis for calculating cost per unit and direct labor cost has dropped to 5%-10% of total cost in almost every modern factory today.
Product reliability has increased in response to competition. Product liability
(lawsuits) from use, misuse and abuse of products has also increased. To remain competitive, the total time from product design to finished product has
had to decrease. This requires a more flexible manufacturing system design.
Figure 1.3 The Number of Manufacturing Jobs in the USA

8
The continued growth of computer usage has led to more tightly integrated product design and manufacturing system design. The use of 3D simulations, CAD/CAM application and rapid virtual prototyping has significantly impacted the design/manufacturing cycle time.
Ergonomics and worker safety continue to grow in importance as worker absenteeism and compensation costs have escalated.
Green Manufacturing philosophies and social pressures to become environmentally friendly are rapidly becoming driving forces. Zero wastes and disposable products will continue to present themselves as significant product design issues.
Typically, 50% of total manufacturing costs come from the materials used (Direct cost) and almost 35%-40% from overhead and indirect cost. The Total Cost for a typical unit of product is shown in Figure 1.4. For example, if a small model car cost $20,000 in a modern automated factory, then $10,000 would be for direct cost and $7,000-$8,000 in overhead and indirect costs This would result in $2,000
(10%) to$3,000 (15%) profit per car. Viewed another way, on an assembly line producing 400 cars per 8 hour shift, we might have 1600 workers. Each worker works on each car for 1 minute. If the worker is paid $20 per hour, the cost per laborer per car is $.30. Direct labor cost per car would be $480 or about 5% of the manufacturing cost.
The response to customer demands for cheaper-better-faster is translated into lower profits and higher costs unless Lean Manufacturing principles are applied throughout the product development life cycle. Reducing unit cost while increasing value; delivering superior quality products; meeting on-time delivery and literally guaranteeing customer satisfaction has forced American companies to adopt Lean strategies to become more nimble and responsive. Either using original TPS strategies; adopting TPS strategies to system design and operation; or developing new Lean methodologies are enabling companies to bring competitive products to
Figure 1.4 Manufacturing Cost as a Percentage of Sales Prices

9
market cheaper, faster and on-time by matching production rates to final assembly, employing just-in-time strategies, implementing pull systems and smoothing production. These same strategies have resulted in increased flexibility and the capability to quickly respond to varying product demands and product mix. 1.5 Four Basic Manufacturing System Designs All factory configurations may look different, but there are only four basic manufacturing system designs (MSDS); four classic configurations and a new linked cell Lean manufacturing system design. The four classic system configurations are (1) the job shop (2) the flow shop (3) the project shop (4) continuous processing. The new design is a (5) Lean Linked cell system. The linked cell design is a new Lean manufacturing concept composed of manufacturing, assemblies, and subassembly lines configured in U-shaped cells; all feeding a mixed model final assembly. It is conceivable that some might view the high speed assembly line as another type of manufacturing system which is a specialized and typically highly automated flow shop. Table 1.2 lists examples of each system and Table 1.3 compares each type of manufacturing line in terms of operating characteristics. These two tables are not meant to be an exhaustive enumeration but representative.
Table 1.2 Types and Examples of Manufacturing Systems

10
1.5.1 The Job Shop
The distinguishing feature of a job shop is its flexibility. In a typical job shop, small and even unit lot sizes are produced to specific customer order specifications. Because the job shop must perform a wide variety of manufacturing operations, several different manufacturing processes and basic machine types are usually found, sometimes in a random fashion as new capabilities are added. General purpose and highly flexible machines are required, and each manufacturing operation is usually done by highly skilled labor. Process steps are frequently characterized by a wide range of work content, and standardization is usually difficult if not impossible. As the demand for certain parts increase, machines are grouped according to the general manufacturing capabilities and characteristics represented by each work group. For example, one area might contain lathes; other milling machines; other grinders…etc. A finished product (part) will have a unique sequence of operations to be performed in a serial fashion, which usually results in and scheduling rarely exists. As the demand for certain parts increases, jobs may be manufactured and moved in medium sized lots or batches. A typical Job shop is shown in Figure 1.5. A particular part may enter or leave the same functional area many times in a re-visitation sequence. The process flow chart for products in a job shop often looks like what is sometimes called spaghetti flow. Routing sheets or travelers are used to specify particular routing sequence with operating instructions. Material handlers, fork lift trucks or pusher dogs are often used to manually transfer a part from one machine to another. Sophisticated sequencing and scheduling rarely exists. A typical Job shop is shown in Figure 1.5.
Table 1.3 Characteristics of Basic Manufacturing Systems

11
A job shop becomes extremely difficult to manage as it grows, resulting in long throughput times, large in-process inventory and unpredictable delivery dates. Charles Carter, an engineer who worked for Cincinnati Milacron, performed a study where he tracked several parts and part types as they moved through the factory. He found that parts moving from start to finish spent about 95% of their time waiting and only about 5% of their time in actual value added processing (raw material transformation). Further studies revealed that even when a part was at a machining operation; only 30%-50% of value added time was actually material transformation.
Figure 1.5 The job shop collects machines into functional groups of processes, uses highest skilled
labor and produces products in small lot sizes The remaining percentage of time was spent waiting on set-ups, tool changing, loading and unloading parts and inspection. Thus, the total time actually adding value was only 2%-3% of the through put time. These figures have since been verified many times, and even seem to hold in other type of manufacturing or assembly operations. In recent years, programmable controllers and CNC/DNC capabilities have created standardization within certain classes of manufactured parts. However, the modern job shop still produces a lot of low volume parts, but by grouping orders and building make-to-stock, larger lot sizes or batch production can be achieved. Manufacturing lot sizes are often determined by well-known Economic Lot Size (EOQ) calculations. This is due to the simplicity of EOQ model calculations and not due to the efficacy of these models. The basic assumptions of EOQ simply cannot be met in a job shop. In later Chapters, we will show that a basic pull- strategy with load leveling yield far superior operating systems.

12
Basic batch and large lot production is usually used to satisfy continuous customer demand or relatively stable yearly demand patterns for an item. Because the production capability of any one machine often exceeds customer demand over a given period of time, most job shops build-to-stock for each item. The machine is continually being reconfigured to build value into a product at a particular step in its routing sheet. The corruptive effects of this policy are insidious and often financially large. It is necessary to build large quantities of work-in-process from which products are pulled as needed. Perhaps worse, each part will experience delays at each processing step as the machine needed is being set up and being changed over. In the case of DNC or CNC machines, these tools are often designed for higher production rates, which necessarily use higher speeds and feeds with multiple cutting tools. For example, automatic lathes capable of using many stored machine tools with computerized changeover will far outperform manually operated lathes. These machines are typically equipped with specialized jigs and fixtures, which increase precision, accuracy and output rates. However, such superiority over manually operated machines comes with a price. If the tooling required to manufacture a particular part is not part of the machine tool set on, the part cannot be produced. If tool sets are added to mitigate this problem, they may be highly underutilized and subject to obsolescence. One of the authors of this book was asked to perform an analysis of such a system with many automated machining centers because the cost of tooling was beginning to bankrupt the company and other alternatives were needed. Many domestic products are made in small to medium sized job shops, such manufacturing systems may be called machine shops, specialty shops, foundries or press working shops to name a few. It is unfortunate that a wide variety of names exist, because they all exhibit similar serious problems. The old adage is true… a rose by any name is still a rose.
It is estimated that as much as 75% of all domestic manufacturing in the United States is done in job shops with between 5 and 100 machines with production lot sizes of 5-100 pieces per order. Hence, traditional and modern job shop operations constitute a large part of our gross national product. All forms of job shop operations can greatly be benefitted by the allocation of Lean thinking and Lean engineering.
1.5.2 The Flow Shop When product demand is fairly stable and is of sufficient volume to support large lot or batch sizes, a flow shop configuration becomes a superior manufacturing option to a job shop. A flow shop emerges when a single product or a group of products can be made on identical or similar dedicated machines at each step in a routing sequence. Traditionally, the flow shop is arranged such that the manufacturing line is serial and sequential. Flow shops arranged in such a fashion can be very long with many different types of machines arranged such that the output of one machine proceeds directly to the next machine in the manufacturing sequence as shown in Figure 1.6.
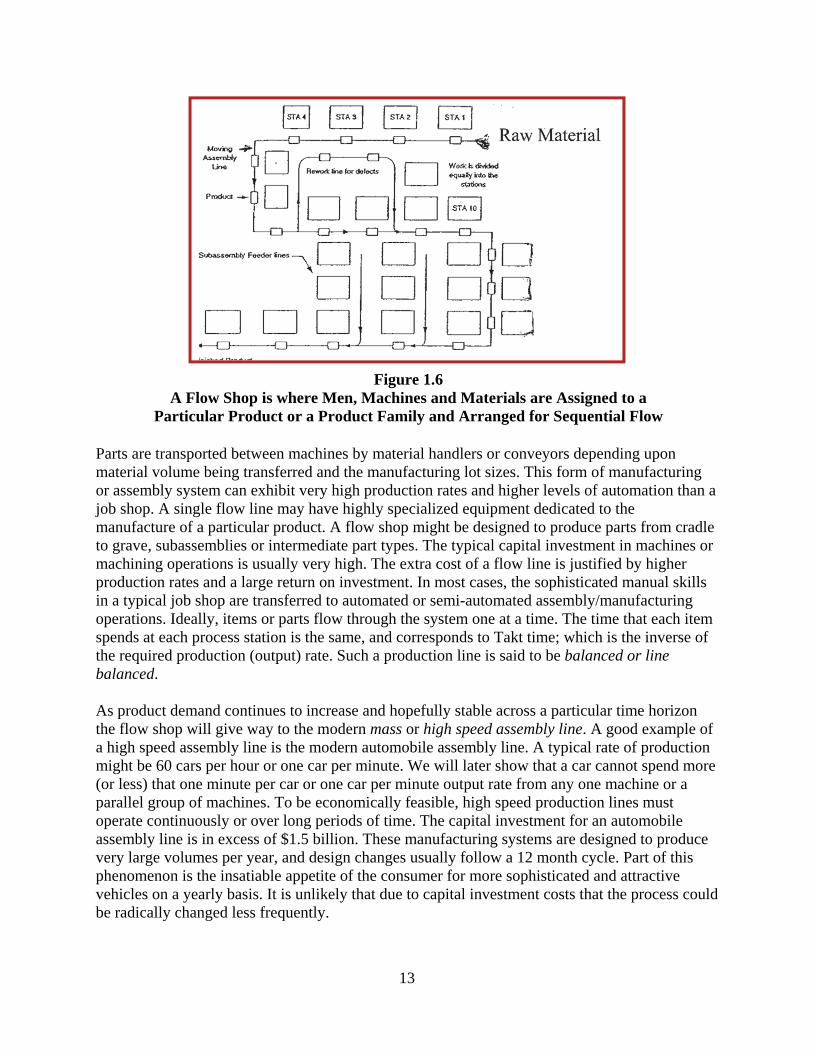
13
Parts are transported between machines by material handlers or conveyors depending upon material volume being transferred and the manufacturing lot sizes. This form of manufacturing or assembly system can exhibit very high production rates and higher levels of automation than a job shop. A single flow line may have highly specialized equipment dedicated to the manufacture of a particular product. A flow shop might be designed to produce parts from cradle to grave, subassemblies or intermediate part types. The typical capital investment in machines or machining operations is usually very high. The extra cost of a flow line is justified by higher production rates and a large return on investment. In most cases, the sophisticated manual skills in a typical job shop are transferred to automated or semi-automated assembly/manufacturing operations. Ideally, items or parts flow through the system one at a time. The time that each item spends at each process station is the same, and corresponds to Takt time; which is the inverse of the required production (output) rate. Such a production line is said to be balanced or line balanced. As product demand continues to increase and hopefully stable across a particular time horizon the flow shop will give way to the modern mass or high speed assembly line. A good example of a high speed assembly line is the modern automobile assembly line. A typical rate of production might be 60 cars per hour or one car per minute. We will later show that a car cannot spend more (or less) that one minute per car or one car per minute output rate from any one machine or a parallel group of machines. To be economically feasible, high speed production lines must operate continuously or over long periods of time. The capital investment for an automobile assembly line is in excess of $1.5 billion. These manufacturing systems are designed to produce very large volumes per year, and design changes usually follow a 12 month cycle. Part of this phenomenon is the insatiable appetite of the consumer for more sophisticated and attractive vehicles on a yearly basis. It is unlikely that due to capital investment costs that the process could be radically changed less frequently.
Figure 1.6 A Flow Shop is where Men, Machines and Materials are Assigned to a
Particular Product or a Product Family and Arranged for Sequential Flow

14
Paradoxically, automobile consumers expect and demand many variations in color, add-ons and style. So to meet the demands of a free economy and be competitive in an international market, automotive assembly lines need to be designed to exhibit flexibility and versatility, while retaining the capability to mass produce. In the flow line manufacturing system, the processing and assembly workstations are arranged in accordance to the product’s sequencing of operations. Work stations or machines are arranged in a serial production line with only one type of operation being performed at each processing step. Duplicate workstation (parallel machines) might be added to balance the line, but they all perform the same function. The entire line is designed to produce a product or subassembly of the same type or from the same family of products. In most cases, there are little or no changeover and setup operations, and if there are they may be long and complicated. Hence, basic line integrity and functionality is difficult and expensive to change.
1.5.3 Mass Production A mass production line is an extension of a flow line to produce more products in shorter periods of time due to extensive automation and control. Mass production facilities require a steady demand of product over relatively short periods of time. As demand dictates a shift from batch mode to high volume production, mass production lines emerge. Mass production lines are usually fed by other high volume flow lines which insert key subassemblies into the main line. A variety of approaches have been used to develop machines and machine centers which are highly effective in mass assembly lines. Line efficiency and effectiveness usually depends in a large degree to how closely coupled engineering and product design are to the mass production line. Standardization of products, methods and methodologies are key to balanced line operation. If a particular part is fairly standardized and can be manufactured in large quantities, specialized machines with a minimum of touch labor can be designed and implemented. It should be noted that the emergence of mass production lines with little or no skilled labor intervention has created havoc in many old corporate planning systems. Key performance metrics and product costing can no longer be based upon direct labor hours per part. This has given rise to Activity Based Costing and other new accounting schemes.
1.5.4 The Product Shop (Fixed Position Layout) In some types of manufacturing systems, the product must remain in the same geographical area, and product transformation must be done in a fixed location. All raw materials, people, processing including machining, assembly and inspection operations must be brought to the product site as shown in Figure 1.8. In the late 1920’s Henry Ford built his automobiles using a product shop. Skilled laborers with specialized tools and raw materials were brought to a single point of assembly. Some years later, Henry Ford used a skid drawn on by horses to move the car-in-progress along a straight line to the same (now stationary) set of workers and raw materials. This is when the modern assembly line was born. The product shop might be considered an archaic, historical production strategy today but in fact it still exists in many forms. Large ships, aircraft, dams, machines and skyscrapers are just a few product shop examples. A typical product shop may in fact contain elements of job shops, flow shops and mass production within its boundaries. Subassemblies and components may even use mass production lines. All product shops are fertile ground for Lean engineering principles.

15
Figure 1.7
The Manufacturing System Design called Mass Production Produces Large Volumes at Low Unit Cost but Lacks Flexibility
Clearly, the product shop is used to produce very large and often one-of-a-kind products. Work is usually scheduled by project management techniques like the Critical Path Method (CPM) or the Project Evaluation and Review Technique (PERT). These methods use precedence diagrams and specialized analysis algorithms to sequence work and maintain project schedules (time and cost). Project shops are usually very complex, labor intensive and very expensive, often producing only a single product for millions of dollars, like the space shuttle.

16
Figure 1.8 Building a House is an Example Product Manufacturing
1.5.5 Continuous Processing
Lean Engineering and Lean practices have not been widely used in the continuous processing industries, but significant cost savings and waste reduction have recently been reported (King and Floyd). In continuous processing, products usually flow in large quantities measured in barrels of product or thousands of gallons. Hence, these systems are often referred to as Flow Production Systems. Oil refineries, chemical processing plants and Biofarma production facilities are good examples of Continuous processing, although each of the previous examples of continuous processing actually have mass production components associated with many final products (cans of oil, plastic products, bottles of pills, etc.). In reality, most continuous processing facilities are not strictly processing products continuously, but rather in a mixture of high-volume flow lines. Movement of liquids, gasses and powders do flow continuously and require extremely complicated transformations of raw materials (distillation columns and separators). See Figure 1.9. It is also true that facilities such as oil refineries are the least flexible of all mass production systems, but paradoxically very efficient with large output rates. The control systems are very complex, and work-in-process is hard to measure and discretize. Lean Engineering in these types of systems requires specialized knowledge in Chemical engineering, Materials engineering and Metallurgical engineering in many cases. There is an interesting intersection between the Lean engineer who is attempting to execute waste reduction and the Chemical engineer who is usually assigned the task of managing and controlling the system
1.5.6 The Lean Linked-Cell Manufacturing System (L-CMS) The Toyota Production System (TPS) has developed a radical new approach to the design and operation of almost any piece-part manufacturing system and many other types of manufacturing systems as well. In a linked-cell manufacturing system, three major parts of mass production
Figure 1.9 An Oil Refinery is an Example of a
Continuous Flow Process

17
facility and flow shops are reconfigured to greatly improve product time in the system, WIP levels and output rates. (Figure 1.10). The product dedicated final assembly lines are changed over to mixed model final assembly line so that the daily production rates for erratic customer requirements can be leveled and smoothed. Production leveling, also called production smoothing is a set of Lean Engineering principles for reducing waste and guaranteeing that each process step produces the same output rate. When demand is relatively constant production leveling can easily be accomplished, but when customer demand fluctuates, flexible and versatile manufacturing strategies with optimal WIP must be developed. The subassembly lines that feed final assembly or intermediate assemblies are also reconfigured from linear, straight-line, flow lines, using conveyers into volume-flexible U-shaped cells with tightly controlled WIP as shown in Figure 1.11. The operations are all manual which require smaller capital investment, and are performed by cross-trained walking workers. Multiple workers are assigned to multiple tasks to achieve worker equality and line balance; often self-balanced, ergo patterns based upon preference and skill sets. Any job shop layout like that shown in Figure 1.5 can be redesigned into a U-shaped manufacturing cell such as that one shown in Figure 1.12. U-shaped Lean manufacturing cells allow each operator access to multiple machine tools with a minimum of transit or walking time. The operators usually walk in pre-assigned clockwise or counterclockwise loops with no crossing patterns. This U-shaped design lends itself well to standard operations sheets and worker flexibility. The implementation strategy to form these cells and the methodology used to rapidly adjust to changing production rate requirements will be thoroughly discussed in Chapters 3, 4 and 5. After U-shaped cells are implemented, the cells can then be linked to other sub-assembly points or final assembly with a production control system called Kanban which is based upon a pull strategy versus a push strategy. Similar production and implementation design rules are used to configure final assembly. Key proprietary processes are easily protected and hidden within cell structures. In a typical linked-cell system, a predetermined level of inventory is maintained within each cell and between cells to minimize work-in progress. These inventory levels are tightly controlled by Kanban cards to match the desired output rate and quantity of goods produced. The system is also configured to compensate for any disturbances or variation which cannot be controlled or eliminated. Kanban card systems are discussed in Chapters 13 and 15.


