This dissertation has been - microfilmed exactly as received 67... 13,687 ACHEE, Frances Maunaalani, 1936- THE ASSOCIATION-DISSOCIATION AND SOME PHYSICAL- CHEMICAL STUDIES OF PLASMA AMINE OXIDASE. University of Hawaii, Ph.D., 1966 Chemistry, biological University Microfilms, Inc., Ann Arbor, Michigan
Transcript
This dissertation has been
microfilmed exactly as received 67...13,687
ACHEE, Frances Maunaalani, 1936-THE ASSOCIATION-DISSOCIATION AND SOME PHYSICALCHEMICAL STUDIES OF PLASMA AMINE OXIDASE.
University of Hawaii, Ph.D., 1966Chemistry, biological
University Microfilms, Inc., Ann Arbor, Michigan
THE ASSOCIATION-DISSOCIATION A~~ SOME PHYSICAL-GHEMICAL
STUDIES OF PLASMA ANITNE OXIDASE
A THESIS SUBMITTED TO THE GRADUATE SCHOOL OF THE
UNIVERSITY OF HAWAII IN PARTIAL FULFILLMENT
OF THE REQUIREMENTS FCR THE DEGREE OF
DOCTOR OF PHI LOSOPHY
IN BIOCHEMISTRY
SEPTEMBER 1966
by
Frances Maunaalani Achee
Thesis Committee:
Dr. Kerry T. Yasunobu, ChairmanDr. Theodore WinnickDr. Leslie BergerDr. Howard F. MowerDr. John B. Hall
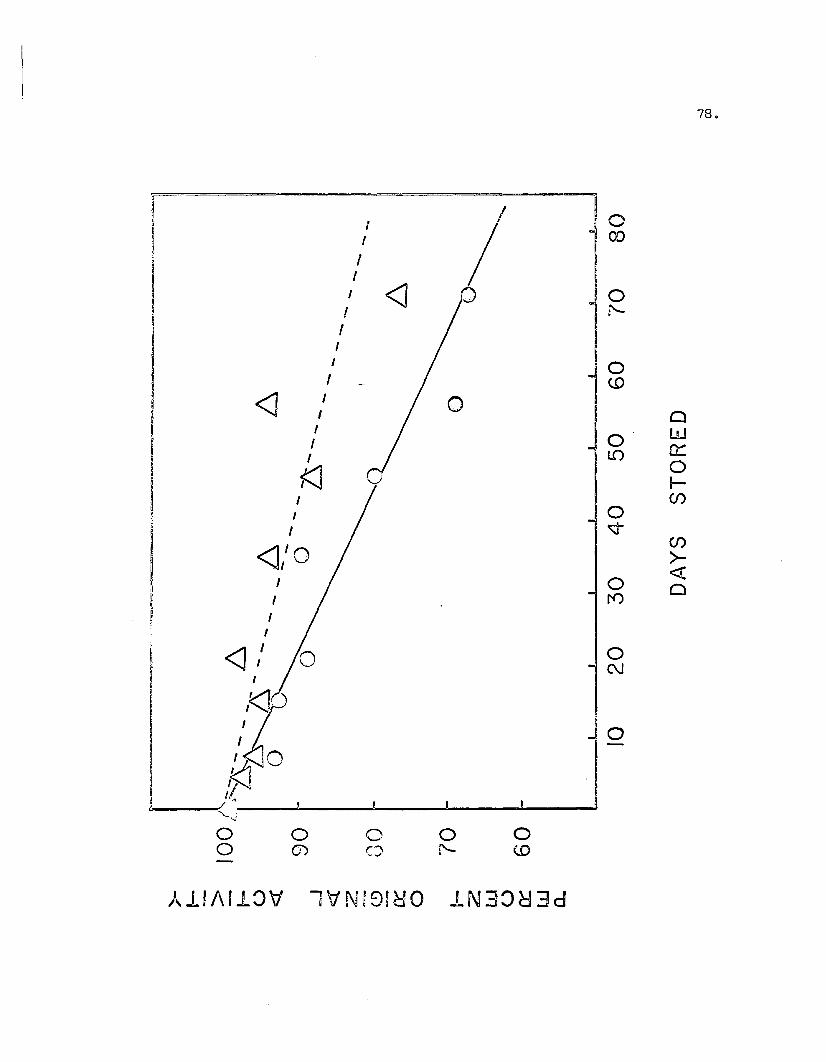
31. Decrease of PAO Activity upon Storage ••••••••••••••••••••••• 78
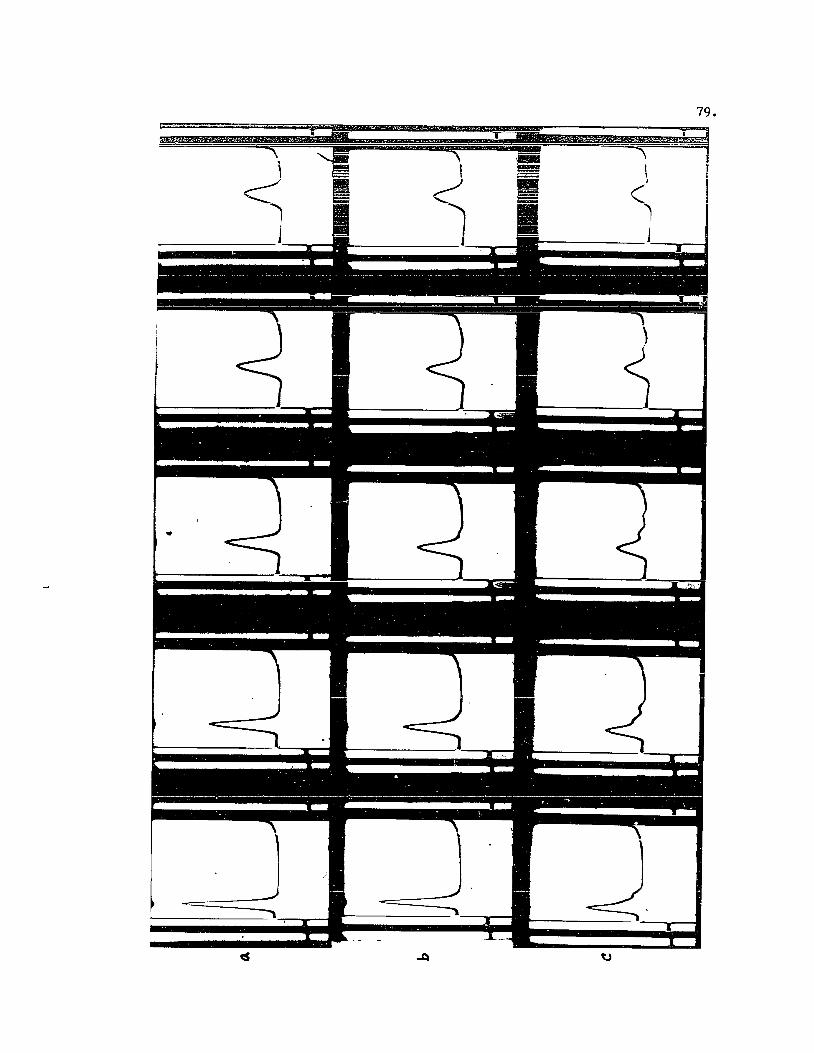
32. Association of PAO upon Storage (I) ••••••••••••••••••••••••• 79
33. Association of PAD upon Storage (II) •••••••••••••••••••••••• 80
CMB
DEAE-ce11ulose
D
D~O,W
Gu-HCl
mJ.l
M
J,JIIlole
N
PAO
SOS
-SH
s
S
s~O,w
ABBREVIATIONS
para-Chlorcmercuribenzoic ~cid
Diethylaminoethyl-cellulose
Diffusion coefficient
Diffusion coefficient in water at200 , e~trapolated to zeroconcentration
Guanidine-hydrochloride
Millimicron
Molar concentration
Micromole
Normal concentration
Plasma amine oxidase
Sodium dodecyl sulfate
Sulfhydryl group
Sedimentation coefficient
Svedberg unit of sedimentationcoefficient (10-13 sec.)
Sedimentation coefficient in water200 C, extrapolated to zeroconcentration
x
xi
THE ASSOCIATION-DISSOCIATION AND SOME PHtSICAL
CHEMICAL STUDIES OF PLASMA AMINE OXIDASE
ABSTRACT
Beef plasma amine oxidase has been isolated and crystallized by
Yamada and Yasunobu (J. BioI. Chem., ~ 1511, 1962). The high molec
ular weight reported for the enzyme and other preliminary studies (Gee,
Master's Thesis, U. of Hawaii, 1963) indicated that the enzyme might be
composed of subunits. An investigation was made of the 3ssociation
dissociation properties of plasma amine oxidase.
The usual methods employed to break down non-covalent linkages in
proteins, such as raising or lowering the pH, detergent treatment, suc
cinylation, and urea denaturation, proved to be unsuccessful in dissoci
ating the enzyme as revealed by ultracentrifugal analysis of the treated
protein. Dissociation was achieved only in 6 Mguanidine-hydrochloride
in the presence of ~ reducing agent.
Determination of SUlfhydryl groups and the total cystine and cys
teine content of the enzyme revealed that there are two free thiol
groups and nine disulfide bonds present in the molecule. The number of
-S-S- bridges gave support to the hypothesis that the polypeptide chains
of PAO are covalently bonded.
A re-evaluation of the molecular weight of the native enzyme led
to the realization that PAO is a chemically interacting system and ex
ists in solution as monomeric species 1n rapid equilibrium with higher
polymers. The techniques of sedimentation equilibrium and Sephadex
gel filtration gave a molecular weight of 170,000 for native PAD. The
high melecular weight of 261,000 previously reported (Yamada ~ si.,
xii
Biochim. Biophys. Acta, §l, 165, 1964) was explained as probably being
an average of the monomer and higher polymers.
Molecular weight determinations of the reduced enzyme in 6 M guani
dine-hydrochloride by sedimentation equilibrium and sedimentation
diffusion methods yielded values of 86,600 and 87,000, respectively.
The data suggested that plasma amine oxidase is composed of two poly
peptide chains which are covalently linked by disulfide bonds.
The enzyme was found to undergo a loss of activity upon standing
at low temperatures which was characterized by the presence of faster
moving components along with the original component in the ultracentri
fuge. The sedimentation coefficients of these components were indica
tive of the presence of monomers, dimers, and trimers. This associ
ation phenomenon appeared to be a mass action effect. A 1% enzyme
solution in 0.06 Mphosphate buffer, pH 7.0 gave rise to the presence
of more polymer and greater loss of activity than did a 0.5% solution
prepared and kept under identical conditions.
I • I NTRODUCTION
A. Historical Backgrgund
The amine oxidase of beef plasma is one of the classes of enzymes
which catalyze the oxidation of certain monoamines according to the fol
lowing equationz
R-C~-NH2 + 02 ;- ~O ~ RCHO + NH3 + ~02.
The first mention of the enzyme known as amine oxidase (or mono
amine oxidase) was in 1928 when Hare (1928) described the oxidative de
amination of tyramine by liver tissue. Subsequently, it was discovered
that the enzyme is widely distributed in animals. The early history on
this subject has been fUlly reviewed (Zeller, 1951; Blaschko, 1953).
Amine oxidases were found to be present not only in animal tissues,
but also in animal sera and in plants and bacteria. Although the gen
eral reaction catalyzed was the same as for the typical amine oxidase
first described, differences among the enzymes from the different
sources were soon apparent. Blaschko (1963) has found it convenient to
distinquish between the "classical" amine oxidase (found only in ani
mals) and other amine oxidases on the basis of their distinctive in
hibitor specificity and their substrate specificity. Thus, beef plasma
amine oxidase may be considered as a non-classical amine oxidase by
virtue of its inhibition by carbonyl reagents and its inability to act
on N-substituted amines.
There has been a revived interest in the metabolism of amines in
recent years due to the possible relationship between amines and var
ious diseased states (Davison, 1958; Belleau, 1960). From this in
terest, there arose a certain impetus for obtaining amine oxidase in
2.
a more purified state than had been previously acquired, in order that
more detailed studies could be carried out. Tabor, Tabor, and Rosenthal
(1954) described a soluble amine oxidase four~ in beef plas~a which was
purified approximately 150-200 fold. Yamada (Yamada and Yasunobu,
1962a) in our laboratory was able to modify and extend the purification
scheme to obtain a crystalline enzyme preparation which was essentially
homogeneous. The enzyme was found to be a copper and pyridoxal-phos
phate-containing protein (Yamada and Yasunobu, 1962b, 1963) with a
molecular weight reported to be about 261,000 and an s20,W value of
9.23 S (Yamada ~ !l., 1964).
B. Enzyme StruGtYre and Catalytic Activity
Enzymes function by catalyzing the chemical reactions that are es-
sential to life, and biochemists seek to understand this phenomenon by
studying the various factors underlying the mechanism of enzyme action.
A primary approach to this problem is the study of enzyme structure.
In general, an enzyme may be pictured as a protein containing a special
structural feature, the active center, with scmetimes an additional
prosthetic group attached (Dixon and Webb, 1958). The problem of en-
zyme structure, therefore, encompasses first, the structure of the
proteins the size or molecular weight of the moleCUle, the primary,
secondary, tertiary and quarternary structures; second, the nature of
the active centers the number of active sites per molecule, the chem-
ical nature of the substrate-binding and activating groups in the
active center; and third, the nature of the prosthetic group and the
mode of its attacn.ent.
3.
The determination of the molecular weight of a protein as an index
of molecular size is taken to be a fairly routine procedure now with
the many advances in the techniques for its measurement (Alexander and
Block, 1961; Tanford, 1962; Haurowitz, 1963). More recently, there has
been much interest in the association and dissociation of proteins.
Many proteins have now been shown to be isolated as stable assemblies
of structural subunits (Reithel, 1963) and it is generally felt that
those preteins whose preparative molecular weights are over 50,000
100,000 may be expected to reveal such structure (Kendrew, 1959;
Reithel, 11 li., 1964). Dissociation of these stable assemblies most
often lead to loss of biological activity, but active subunits have
been obtained with molecular weights less than the preparative molecu
lar weights (Metzenberg, 1964; Klee, 1962).
c. statement of the Prpble.
It was the ebjective of this research to study sOle of the struc
tural features of plasma amine oxidase as a step towards learning a
bout its mechanism of action. The study centered mainly on an investi
gation of the association-dissociation of the molecule. The work of
Yamada l1 il., (1964) has indicated that PAO is of a relatively large
molecular size and would, therefore, fall in the category of being made
up of more than one polypeptide chain. A preliminary investigation by
Gee (1963) on the effect ef denaturing agents on PAO indicated this
also. In view of these findings, it was hoped that the use of dis
ruptive agents would lead to a simple breakdown of the lIo1ecule as in
the cases of other large proteins such as aldolase (molecular weight
150,000) which was shown to be readily dissociated into three subunits
4.
by lo~ring the pH to pH 2 (Deal ~Al., 1963a; Stellwagen and Schachmnn,
1962) or lactic dehydrogenase (molecular weight 134,000) which is dis
sociated into four inactive subunits by treatment with guanidine hydro
chloride (Appella and Markert, 1961). From prel~inary investigations
on the dissociation of the molecule it so~n became apparent that plasma
amine oxidase is not easily dissociated. A further coaplicltion arose
when it was realized that the -native- molecular weight is not as large
as was previously reported, and the enzyme may be a case of an inter
acting system.
Throughout this study, it was borne in mind that a primary in
terest in enzyme structure is how it relates to enzyme activity and,
therefore, activity measure.ents were carried out as an integral part
.f the assGciation-dissociatien studies.
5.
II. MATERIALS AND METHODS
Ao Materials
1. Materials and Reagents Obtained frOlB Gq=ercial Sources
tl. Carl Schleicher & SChuell «0.. New Hampshire
DEAE-Gellulose, Type 20
b. Eastman ara,nic CheRiclis. New York
Benzyl_ine
Guanidine Hydrochloride
2-Mercaptoethanol
c. Mann Research Laboratories. Inc •• New York
Iodoacetic Acid (Lot B 2478)
d. Nutritional Biochemical Corppr§tion, Ohio
Bovine Serum Albumin (2x Crystalline)
p-Chloromercuribenzoate (Sc~ium Salt)
e. pentex, Incorporated. Illinois
Bovine eY-Globulin (Fraction II; Lot 12)
f. Pharmlcia Fioe Chemicals, Inc •• New Jersey
Blue Dextran 2000
Sephadex G-200 (Lot TO 3380)
2. Materials Obtained as Gifts
a. Steer beef blood was kindly supplied by the Hawaii Meat
Company, HonolUlu, Hawaii.
b. Sodium dodecyl sulfate (Duponol C) was generously supplied
by E. I. Du Pont De Nemours & Co., Inc., Wilmington,
Delaware.
6.
c. Crystalline beef heart cytochrome £ was prepared by
Rodney Chu.
3. Materials Obtained by Preoarative Methods
Plasma amine oxidase ~as prepared from steer beef blood es
sentially as described by Yamada and Yasunobu (1962a) with
slight modifications.
B. Methods
1. Preparation of Resins
a. DEAE-cellulose, obtained as a dry powder, was prepared
for use as described by Peterson and Sober (1962). The dry
material was allowed to sink into 1 N sodium hydroxide and the
suspension was filtered on a coarse grade sin~ered-glass fun
nel and washed with additional 1 N sodium hydroxide until no
more yellow color was removed. This was followed by the ad
dition of sufficient HCL (1 N) to make a strongly acidic
suspension which was filtered almost ~ediately and washed
free of acid with deionized water. The filter cake was again
suspended in 1 N NaOH, filtered and washed free of alkali
with water before adjusting to the pH of the selected starting
buffer.
b. Hydroxylapatite was prepared by the method of Levin (1962).
c. Sephadex G-200 was suspended in buffer by slowly adding
the dry powder to the buffer with constant stirring. The sus
pension was allowed to swell for at least five days before
being packed in the column.
2. PreParatiqn of Plasma Amine Oxidase
Plasma amine oxidase was prepared from steer beef blood as
described by Yamada and Yasunebu (1962a) with the following
modifications. The active ~ecipitate from the first ammonium
sulfate fractionation was dissolved in 0.01 Mphosphate buffer,
pH 7.0 and dialyzed against the same buffer. The first DEAE
cellulose column was equilibrated with 0.01 Mbuffer, instead of
0.003 M. After removal of much of the inactive protein with
0.03 Mphosphate buffer, pH 7.0, the coluan was eluted with 0.07
Mbuffer and fractions collected.
The active precipitate froa the secend aDaonium sulfate
fractionation was dissolved in 0.06 Mphosphate buffer, pH 6.8,
and the hydroxylapatite column was also equilibrated with 0.06
Mphesphate buffer, instead of 0.006 Mbuffer. The column was
eluted with 0006 Mphosphate buffer, pH 6.8, followed by 0.2 M
phosphate buffer, pH 6.8. The active fraction from the hydro
xylapatite column was generally subjected to a third ammonium
sulfate fractionation before attempting crystallization. It was
found that at least two or more crystallizations were necessary
before an ultracentrifugally homogeneous fraction was obtained.
3. Method pf Assay. The MeasureMent of Enzymic Actiyity
The enzyaic activity of plasma amine oxidase was determined
spectrophotometrically using benzylamine as the substrate as de
scribed by Tabor, Tabor, and Rosenthal (1954). The assay is
based on the difference between the molar extinction coefficients
of benzylamine and benzaldehyde at 250 m~. In a standard assay,
7.
8.
enzyme is added to 1 ml of 0.2 M phosphate buffer, pH 7.2 and an
appropriate amount of deionized w~ter to a total volume of 3.0
mls. After addition of 0.05 ml of 0.2 Mbenzyla=ine sulfate
(final substrate concentration 3.33 x 10⁻³ M), the increase in
optical density with time is measured in the Beckman DU spectro
photometer. The spectrophotometer is equipped with a thermospacer
set connected to a water bath which maintains the compartment
temperature at 250 C. The change in absorbancy is deterJllined from
the initial slope of a plot of optical density versus t~e in .in
utes. A unit of enzyme activity is defined as the amount of en
zyme catalyzing a change of 0.001 absorbance per minute at 250 C
under the standard assay conditions. Specific activity is the
change in absorbancy at 250 mJl per minute at 250 C per mg of en-
zyme.
4. Ultracentrifuge Stygies •"
a. ~d1gumtatiQnVelocity
Sed~entation velocity measurements were aade in a Spinco
Model E Analytical ultracentrifuge equipped with an RTIC
(Rotor Temperature Indicator Control) unit for temperature
regulation within 0.1 0 C. The conventional 12 am aluminum
cell with a 40 sector centerpiece was used for most :runs. In
a few cases the 12mm filled-epon double sector cell was used.
The generally employed speeds were 59,780 rpm for the stand
ard cell and 42,040 rpm for the double sector cell. Most runs
were carri~d out at 22.50 C.
The sedimentation coefficient (S) was calculated according
to the equation.
1 dxs=2
\If x dt
9.
(1)
~here x is the distance of the boundary from the a~is of rota~
tion in centi~eters, t is the t~e in seconds, and =is the
angular velocity in radians per second (2 ~r~60)o The ob
served sedimentation coefficients (sobs) were corrected to
standard conditions, s20, w' (the value the material would
have in a solvent with the density and viscosity of water at
200 C) according to Svedberg and Pedersen (1940).
b. Sediflentation Eguilibri\ll!
Molecular weight determinations by the sed~entation
equilibrium method involves the use of the general equation:
1 dc- -c drMapp (1 - ve )
RT
w2 r (2)
where Mapp =apparent molecular weight
c =concentration of solute in gas/ml
r =radial distance from the axis of rotation
R = Gas constant, 8.314 x 10⁷ ergs/degree/mole
T = absolute temperature
v = partial specific volume
t = density of the solvent
• = angular velocity
Molecular weights of plasma amine oxida£e" denatured in
6 M guanidine-hydrochleride were determined by the method of
Chervenka (1966) which utiliz~s both schlieren and inter-
ference optics and is essentially a modification of Method II
of Van Holde and Baldwin (1958). The general equation givenabove takes the form:
r
10.
1 dc
r dr=
M (1 - \j p) w2 capo \,RT
(3)
When c = c f + ~c, where C f is the concentration ofre resolute at a convenient level of the cell, e.g., the meniscus,
and AC =difference in concentration between this level and
any other level, equation (3) can be rewritten as:,
.: ~ =MaRc (1 - v e ) w2
(cre f + .:3 c) (4)r dr RT
On the assumption that solute concentrations are propor-
tional to refractive index changes, values of ~c are derived
from the interferograms and values of dc/dr are read directly
(5)
by the following relationship:RT
Mapp .:: slope
from schlieren patterns. Mapp is determined from the slope
of the plot of l/r dC/dr vs ~c
Determinations were made in a double sector aluminum
filled-epon interference cell with sapphire windows, using the
An-J rotor in an ultracentrifuge equipped with electronic
speed control. Samples were run at 8,000 rpm at 12.5° C (non
reduced PAO in 6 MGu-HCl) and at 12,000 rpm at 12.70 C (re
duced with mercaptoethanol in 6 M gu-HCl). Equilibrium was
reached in abeut 70 heurs.
Fer .elecular weight determinations of the native enzyme,
the general sed~entation equilibrium equation (2) was used
in its usual integrated fermI
M _ 2 RT In (c-/cl)app - 2f
(l-v~) w2 (r~ - rf)(6)
11.
Absorption optics in conjunction with a photoelectric
scanner was employed. In this technique, concentration in
terms of optical density of the solution versus distance in
the cell is automatically recorded. The log of the concen-
tration is plotted Against the ~quare of the distance from
the axis of rotation and the molecular weight is calculated
from the slope of the line according to equation (7)s
2 RI..Mapp = slope (I-v ~ ?
Runs were Jude at 4,000, 7,200, and 9,000 rpll. The
temperature was 14.70 c.
c. Diffusion
(7)
Diffusion measurements were also made in the Spinco Model
E analytical ultracentrifuge utilizing the technique of bound-
ary spreading at low speeds. The double sector capillary
synthetic boundary cell was used~ The speed employed was
8,225 rpm and the temperature was 22.50 C. The diffusion co-
efficient was calculated according -maximum ordinate-area-
(eqn. 8) and the -aax~um ordinate- (eqn. 9) methods as de
scribed by Ehrenberg (1957).
~ :: 4 K2
D (t - to )Yaax
d2 =16 K2 D (t - t )e 0
(8)
In equation 8, A is the area between the gradient curve and
the baseline at time t measured fr~ the instance when the
synthetic boundary was formed, Ymax is the maxtmum height of
the curve and K is the magnification along the baseline. D
120
is obtained from the slope of a plot of A2j y2 versus t. Inmaxequation 9, de is the distance along the baseline between the
points on the gradien~ curve having y • y je.ma
The measured diffusion coefficients were reduced to stand-
ard conditions, D20 ,W (the value the material would have in a
solvent having the viscosity and density of water at 200 C)
according to Schachman (1957).
d. Molecular Weight by Combined sedimentation and Diffusion
Molecular weights can be calculated directly from the
sedimentation and diffusion coefficients at infinite dilution
despite the absence of knowledge regarding the shape, hy-
dration or degree of flexibility or permeability of the mo
lecules through the use of the Svedberg equation (Schachman,
1957) :
Sedimentation and diffusion coefficients were determined
at varying concentrations and extrapolated to infinite dilu-
tion using the method of least squares.
5. Estimation Qf Molecular Weight by SeRhade~ G~l Filtration
The molecular weight of plasma amine oxidase was estimated by
the technique of gel filtration through Sephadex G-200, following
the suggestions of Whitaker (1963) and Andrews (1964, 1965). The
Sephadex G-200 was allowed to swell in 0.06 M phosphate buffer,
pH 7.0, for five days, the gel was packed in a 2 x 50 cm column
and the column was equilibrated with the same buffer. The void
volume of the column was determined by the passage through of
13.
Blue Dextran 2000, an artificially colored dextran of high
molecular weight (Mw • 2,000,000) which is comp19tely excluded
from all types of sephadex. The column was then calibrated with
·standard" proteins of known molecular weight before finally ap
plying the ·unknown" protein (in this case, PAO) to the coluan.
The elution volume (Ve ) of each substance was defined as the
effluent volume corresponding to maximum concentration of the
solute as determined by optic.l density at 280mp. Fractions of
approxtmately 1 ml were collected and the optical densities at
280 mu were deter.lned and plotted against the total effluent
volume. The elution volume was estt.ated by extrapolation of
both sides of the solute peak to an apex.
Calculation of the molecular weight was done by the method of
Whitaker (1963).
6. Determination of -SH groups
The spectrophotaaetric lIethod of Boyer (1954) was used for
the determination of -SH groups of PAO. Due to the difference in
reactivity of -SH groups in proteins towards the CMS reagent, de
terminations were done at pH 7.0 (0.06 Mphosphate buffer), pH
4.6 (0.33 MAcetate buffer) and in the presence of 5 M guanidine
hydrochloride at pH 7•.0. To a constant .ount of protein (ap
prox. 0.02 - 0.04 aole), graded amounts of CMS was added and the
final volu.e adjusted to 3.5 or 3.0 ,,1 with the appropriate
solvent. In the case of the reaction in guanidine hydrochloride,
, sufficient volume of 6 MGu-HCl solution was added to give a
final concentration of 5 M. Each tube was read at 255 mp (pH
4.6) or 250 mp (pH 7.0) with appropriate blanks to correct for
14.
the contribution to the total absorbancy of the protein and CMS.
A time course of the optical density readings indicated that the
reaction between CMB and PAO was exceedingly slow. At pH 4.6 and
in the presence of guanidine hydrochloride, the reaction was es-
sentially complete at 22 hours. The reaction at pH 7.0 was about
three times slower, being complete in about 72 hours.
7. Carboxymethylation
Carboxymethylation was carried out on both reduced and non
reduced PAO in the presence of 6 MGu-HCl. The protein solution
was made 6 Min guanidine-hydrochloride by the addition of solid,
recrystallized reagent. The sample was then allowed to dialyze
overnight against 6 MGu-HCI which had been buffered to pH 8.1.
In the cases where reduced enzyme was desired, dialysis was done
against a solution which was 6 Min Gu-HCl and 0.1 Min mercapto
ethanol at pH 8.1. After the dialysis, iodoacetic acid in 6 M
Gu-HCl solution was added to the denatured protein in approximately
a ten-fold excess over the expected number of cysteine residues
or the mercaptoethanol present. The reaction was allowed to pro
ceed 15 minutes in a Radiometer pH Stat and the reaction mixture
was kept at pH 8.1 by the constant addition of 6 N NaOH. At the
end of the reaction, the sample was diluted 3-fold with deionized
water and exhaustively dialyzed against deionized water. The car-
boxymethylated PAO precipitated upon dialysis.
8. Determination of Cysteic Acid
The cysteic acid content of plasma amine oxidase was checked
by amino acid analysis of a performic acid-oxidized sample. Per
formic acid oxidation was carried out the method of Moore (1963).
15.
The protein sample (001 ml) was treated with two mls of the per
formic acid reagent (88% Formic acid/30% hydrogen peroxid~ which
had been allowed to stand at room temperature for 80 minutes, then
cooled in the freezer for at least 30 minutes prior to use. The
reaction mixture was then allowed to incubate overnight (15-16
hours) in the freezer. After the incubation period, 0.3 III of
48% HBr was added to the reaction tube while swirling in an ice
bath. The sample was then concentrated to dryness in a vacuum
desiccator.
The dried sample was hydrolyzed with 1 ml redistilled HCl
(5.7 N) for 24 hours at 1050 C. and the cysteic acid content was
determined quantitatively on a Spinco Model 120 aaino acid ana
lyzer. Calculations were carried out according to standard
lIethods (Spinco Instruction Manual and Handbook). The maher of
half-cystine and cysteine residues (as cysteic acid) per molecule
of protein is conveniently calculated by reference to the molar
quantity of a stable amino acid (alanine, leucine, glutamic acid,
or aspartic acid) determined from the same chrOllatogrllll.
16.
III. RESULTS AND DISCUSSION
Ae Dissociation Studies
1. Effect of pH Changes on PAC Structure
Preliminary investigation of the dissociation of PAO was car-
ried out by dialyzing the enzyme against buffers of various pHs
and by subjecting it to other denaturing conditions to see what
reactions would lead to a breakdown of the molecule.
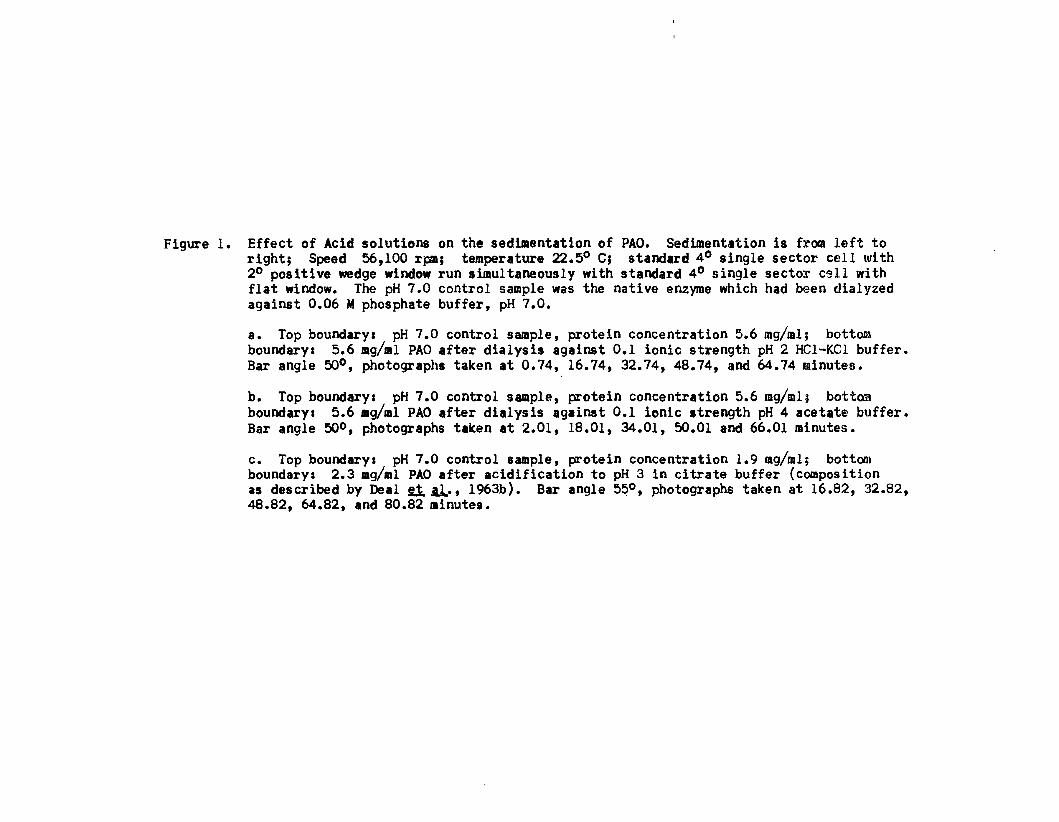
The effect of acidic and basic solutions on the sedimentation
coefficient of PAO is summarized in Table I. Figure 1 shows the
sedimentation of PAC in acidic solutions as'compared to sedimen-
tat ion at pH 7. The effect of basic solutions on the sedimen-
tation of PAO is seen in Figure 2. At all pHS studied only one
major peak was evident and it was noted that while the sedimen-
tat ion coefficients in acid or basic media were slightly lower
than that in pH 7, the boundaries associated with these s values
were much sharper, showing less boundary spreading.
2. Succinylation of PAD
The reaction of proteins with succinic anhydride under reI a-
tively mild conditions can lead to dissociation of protein sub
units as has been shown in the case of hemerythrin (Klotz and
Keresztes-Nagy, 1962) and aldolase (Hass, 1964). In the reaction,.,.
each cationic S-NH3 charge on the protein is replaced by the
anionic carboxylate group and the high negative charge density
imposed upon the molecule leads to electrostatic repulsion within
the molecule.
TABLE I
SUMMARY OF EFFECT OF ACIDIC AND BASIC SOLUTIONS ON
THE SEDIMENTATION COEFFICIENT OF PAO
pH BUFFER SYSTEM* PROTEIN CONCENTRATION Sobs S20,.(.g/'l)
2 HCL-KCL 6.0 8.15 7.80
3 Citrate** 2.3 8.58
4 Acetate 6.1 8.22 8.12
7 Phosphate 5.6 9.92 9.63
1.9 9.39 9.26
9 Tris-HCl 7.05 6.44
11 Carbonate 5.2 8.52 8.21
*0.1 ionic strength buffers aade up from tables given in ~chemists' Handbook, (Cyril Long, ed.) D. Van Nostrand, Co., Inc.,Princeton, New Jersey (1961). Dialysis was carried out for 24 hoursat 40 C.
**Buffer systea as described by Deal till. (1963b).
17.
Figure 1. Effect of Acid solutions on the sed~entation of PAO. Sedimentation is from left toright; Speed 56,100 rpm; temperature 22.50 C; standard 40 single sector cell with20 positive wedge window run simultaneously with standard 4° single sector cell withflat window. The pH 7.0 control sample was the native enzyme which had been dialyzedagainst 0.06 Mphosphate buffer, pH 7.0.
a. Top boundary: pH 7.0 control sample, protein concentration 5.6 mg/ml; bottomboundary: 5.6 mg/ml PAO after dialysis against 0.1 ionic strength pH 2 HCI-KCl buffer.Bar angle 50°, photographs taken at 0.74, 16.74, 32.74, 48.74, and 64.74 minutes.
b. Top bOUndary: pH 7.0 control sample, protein concentration 5.6 mg/ml; bott~boundary: 5.6 ag/ml PAO after dialysis against 0.1 ionic strength pH 4 acetate buffer.Bar angle 500, photographs taken at 2.01, 18.01, 34.01, 50.01 and 66.01 minutes.
c. Top boundary: pH 7.0 control sample, protein concentration 1.9 mg/m1; bottomboundary: 2.3 mg/ml PAO after acidification to pH 3 in citrate buffer (compositionas described by Deal ~ Ji., 1963b). Bar angle 5~0, photographs taken at 16.82, 32.82,48.82, 64.82, and 80.82 minutes.
18.
Figure 2. Effect of Blsic Solutions on the 5edtmentltion of PAO. Sedtmentltion is from left toright; speed 56,100 r~; teaperlture 22.50 C. Standard 40 single sector cell with20 positive wedge window run st.ultineoully with standard 40 single sector cell withflat window. The pH 7.0 control ...ple is native enzyme dialyzed against 0.06 M phosphite buffer, pH 7.0.
a. Top boundary: ~H 7.0 control s.-ple, protein concentration 5.8 mg/ml; bottODboundary: 7.05 IIg/al PAO after dialysis aglinst pH 9 tria-HCl buffer, 0.1 ionicstrength. Bar angle 55°, photographs taken at 3.11, 19.1J., 35.11, 51.11 and 67.11minutes.
b. Top boundary: pH 7.0 control s..ple, protein concentration 5.8 IIg/ml; bottomboundary: 5.2.g/ml PAC Ifter dialysis Igainst pH "II carbonate buffer, 0.1 ionicstrength. Bar angle 550 , photogrlphs taken at 3.83, 19.83, 35.83, 51.83, and 67D83minutes.
. .. .----~-------------
~ - -~ . - - - -- . --- - - --- -,-
19.
20.
Plasma amine oxidase has been reported to contain 56 residues
of lysine (Yamada ~Jl., 1964) and thus, the reaction with suc-
cinic anhydride would be expected to change the charge on the
molecule by 112 charge units. Succinylation was carried out s~-
ply by adding small quantities of the solid anhydride to the pro-
tein solution with constant stirring and aaintaining the pH at
7.5 in the RadiOmeter pH Stat. After addition of the succinic
anhydride, an aliquot was removed ar~ exaained in the ultracentri-
fuge. Figure 3 shows the sedt.entation pattern of PAO after treat
ment with approximately a 25-feld excess of succinic anhydride
over the maber of lysine residues pres\Ded present in the enzyae.
No breakdown was evident from the ultracentrifuge pattern. The
s20,1 of the succinylated protein was 8.475 in c~parison to an
s20,W of 9.345 for the untreated enzyae. The enzyae activity
reaained the saae even after the succinylation reaction.
3. Effect of Detergent 'Dd Denatwina Agents gn PAC
a. SgdiUl Dgdecyl Sulfate
It has long been known that relatively low concentrations
of detergents can produce profOUnd effects on the properties
of proteins in solution. These effects vary according to the
nature of the protein, the detergent, and the solvent, taking
the fora of aggregation, of dissociation, or s~ply, of coa-
plex foraation with or without extensive unfolding of the
protein. The different phenoaena are thought to be governed
by aass relations between the reactants, depending aore uponthe relative proportions of the constituents than on the
absolute detergent concentration (Putnam, 1948).
I / \
J \
Figure 3.
--------------------------
~=J\:t-......J
The Effect of Succinylation of the Sedimentation of PAO. Sedimentation is from leftto right; speed 56,100 rpm; temperature 22.50 C. Standard 40 single sector cellwith positive wedge window run simultaneously with a standard 40 single sector cellwith flat window. Top boundary. untreated enzyme in 0.06 Mphosphate buffer, pH 7.0,protein concentration 4.59 mg/ml. Bottom boundary. succinylated PAO in 0.06 M phosphate buffer, pH 7.5, protein concentration 4.59 mg/ml. Bar angle 500 ; photographstaken at 21.39, 29.39, 37.39, 45.39, and 53.39 minutes.
I\)I-'.
22.
The effect of the anionic detergent, sodium dodecyl sul-
fate, on PAO was studied by examining the sed~entation
pattern~ vi varying protein-detergent mixtures. Table II sum-
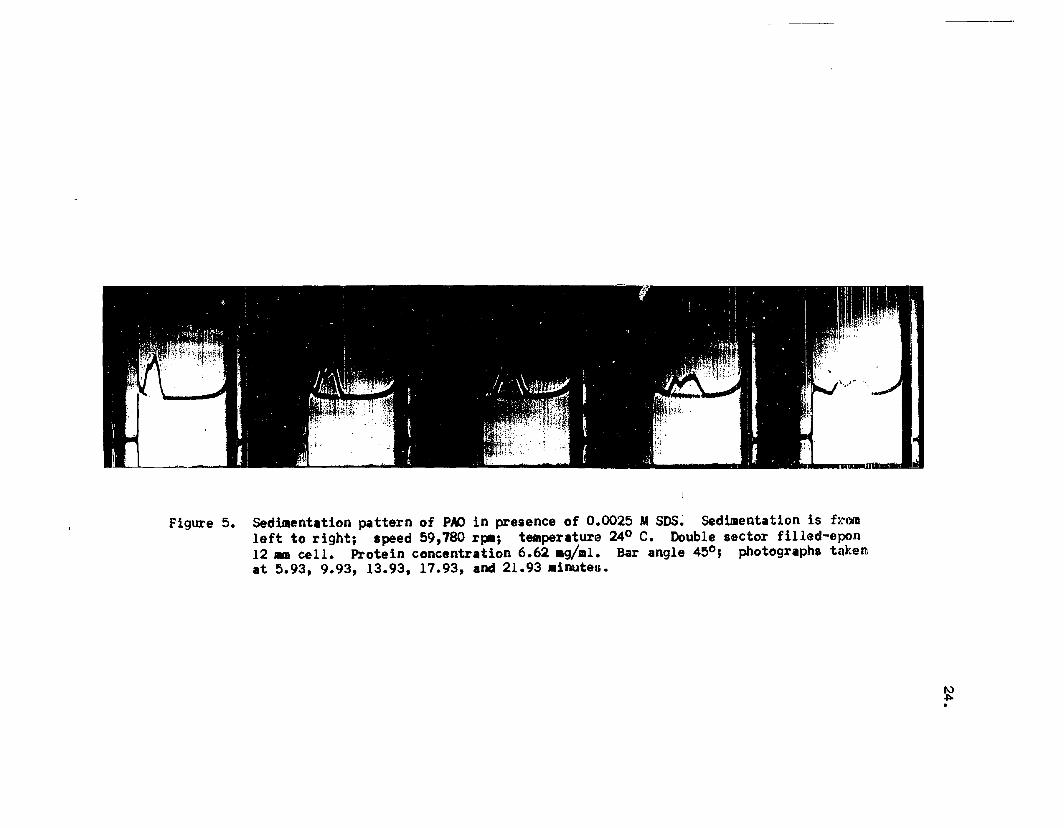
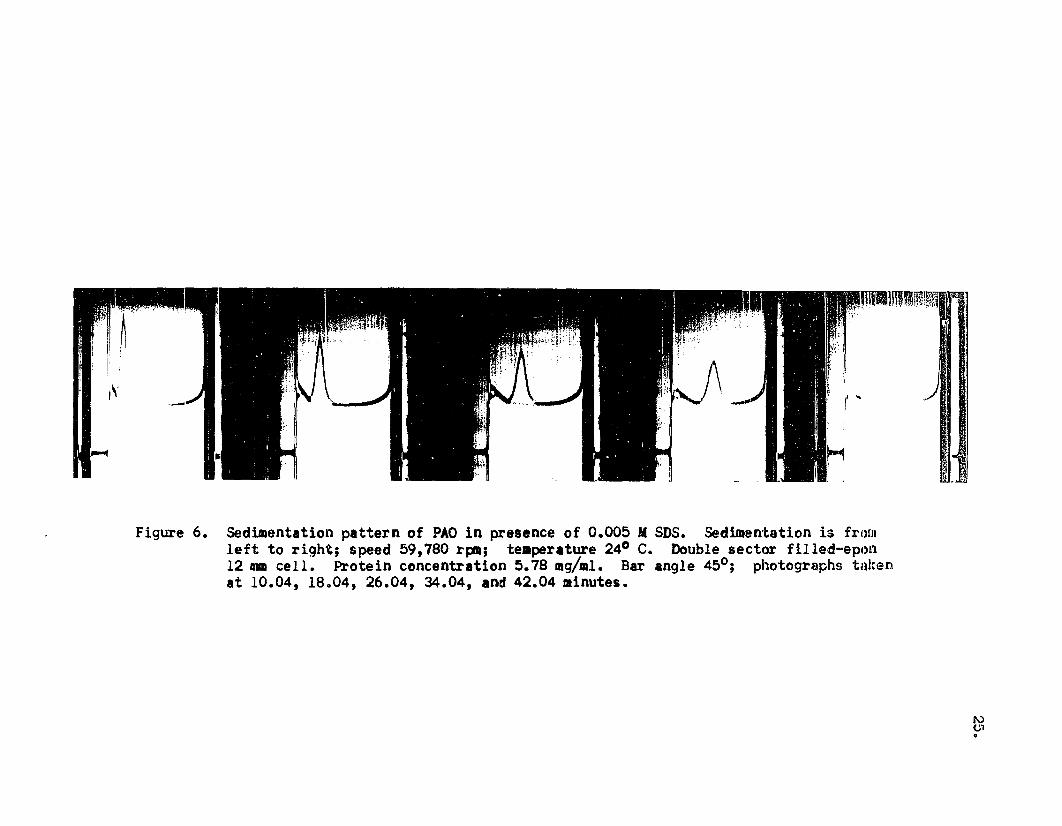
marizes the effect of SDS on the sedimentation of PAO. Fig-
ures 4, 5, 6, and 7 illustrate the sedimentation patterns of
the respective systems. Unlike the pH effects or succiny-
lation, reaction with SDS led to a more complex picture. On
the basis of the s values it appeared that there was some ag
gregation at low SDS/protein ratios, but no aggregation as
the ratio was increased, with eventu~l breakdown of the mole-
cule as this ratio was increased even further. However, no
decision on the extent of the apparent dissociation could be
made at this time without further studies. The interpre
tation of the s values obtained with an SDS/PAO ratio of
312:1 will be discussed in more detail later.
TABLE II
EFFECT OF SODIUM OODECYL SULFATE ON THE SEDIMENTATION OF PAO
SDSCONCENTRATION SOS/PAO RATIO s20,W
0.0010 M 30:1 9.36 15.58
0.0025 66:1 9.09 15.83
0.0050 150:1 8.81
0.1000 312:1 3.04 5.77 8.32
"-.,
Figure 4. Sedillentation pattern of PAO in presence of 0.001 II 50S. Sedimentation is fromleft to right; speed 59,780 rpa; teaperature 240 C. Double sector filled-epen12 _ cell. Protein concentration 5.78 Jlg/al. Bar Ingle 450 • Photographs takenat 10.35, 18.35, 26.35, 34.35 and 42.35 minutes.
~w•
Figure 5. Sed~entation pattern of PAD in presence of 0.0025 MSDS~ Sed~entation is fromleft to right; speed 59,780 r~; te.perature 240 C. Double sector filled-epoD12 8m cell. Protein concentration 6.62 ag/ml. Bar angle 45°; photographs takenat 5.93, 9.93, 13.93, 17.93, and 21.93 aioutes.
~.
Figure 6. Sedimentation pattern of PAO in presence of 0.005 M SDS. Sedimentation is frl)mleft to right; speed 59,780 rpll; temperature 240 C. Double sector filled-epl)fl12 IDII cell. Protein concentration 5.78 IIIg/_1. Bar angle 450 ; photographs takenat 10.04, 18004, 26.04, 34.04, and 42.04 minutes.
tv(JI•
Figure 7. Sedimentation pattern of PAO in presence of 0.010 MSDS. Sedimentation is fromleft to right; Speed 56,190 rpm; temperature 240 C. Standard 40 single sectorcell with 20 positive wedge window run simultaneously with standard cell withflat window. Top boundaryz 0.010 MSOS solv~nt; Bottom boundoryl PAO in presence of SDS. Protein concentration 5.71 .g/cc. Bar angle 500 ; photographs takenat 9.92, 17.92, 25.92, 33.92 and 41.92 .inutes.
I\)0'o
27.
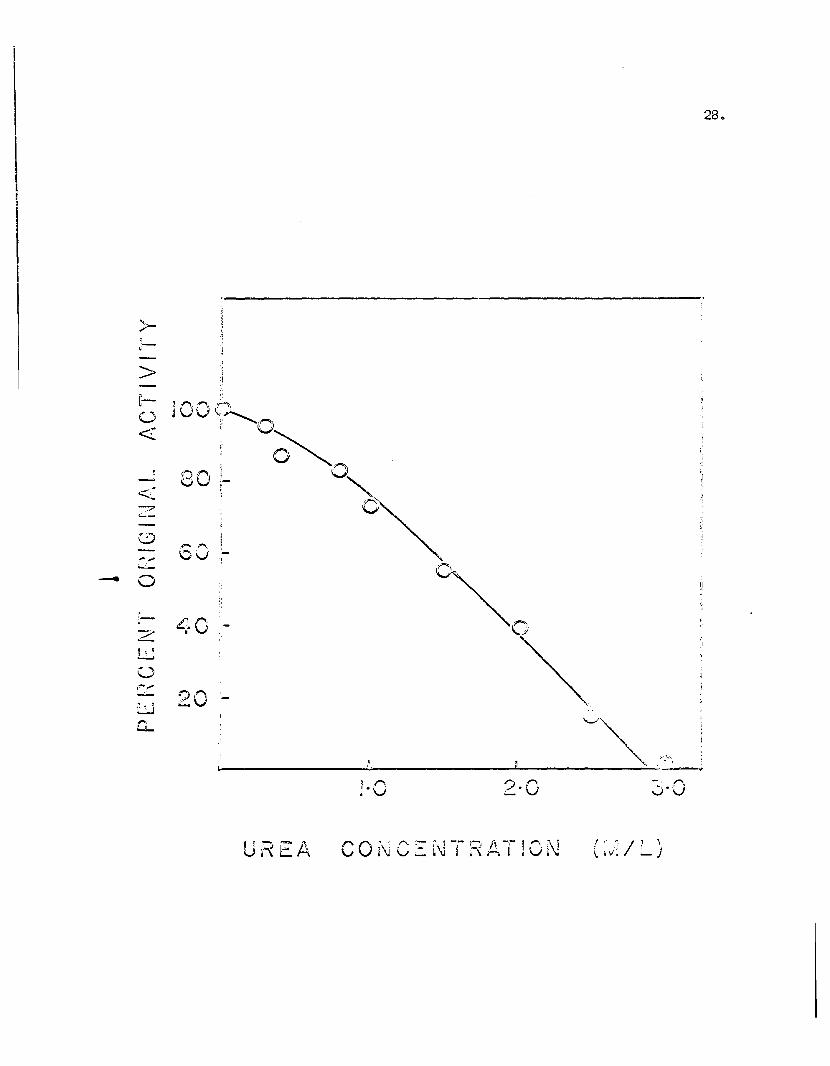
b. Urea
i. Effect of urea on PAC activity
The decrease of PAO activity with increasing urea
concentration is shown in Figure 8Q Th~ data indicated
that a relatively high concentration of urea was neces
sary to inactivate PAO completely. At a concentration
of 1. 7 Murea, 50% of the original enzyme activity still
remained. For complete inhibition a concentration of
approximately 3 Murea was necessary.
ii. Eff~ct on PAC sedLmentation
It was reported by Gee (1963) that dialysis of PAO
against 7 Murea for 16 hours had no effect on the enzyme
dissociation. Because many workers have found guanidine
hydrochloride to be a more effective denaturing agent,
i.e., it acts at a much lower concentration, it was de
cided to concentrate on this reagent rather than urea for
dissociation studies. However, one preliminary experi
ment was carried out with 6 M urea + 0.1 Mmercapto
ethanol. Curiously, the sed~entation pattern of PAO in
this system showed a somewhat unsymmetrical peak which
diffused out rapidly and which had an S20,w of 15.18 s
compared to an S20,w of 9.31 for a control sample.
c. Guanidi~-Hydrochloride
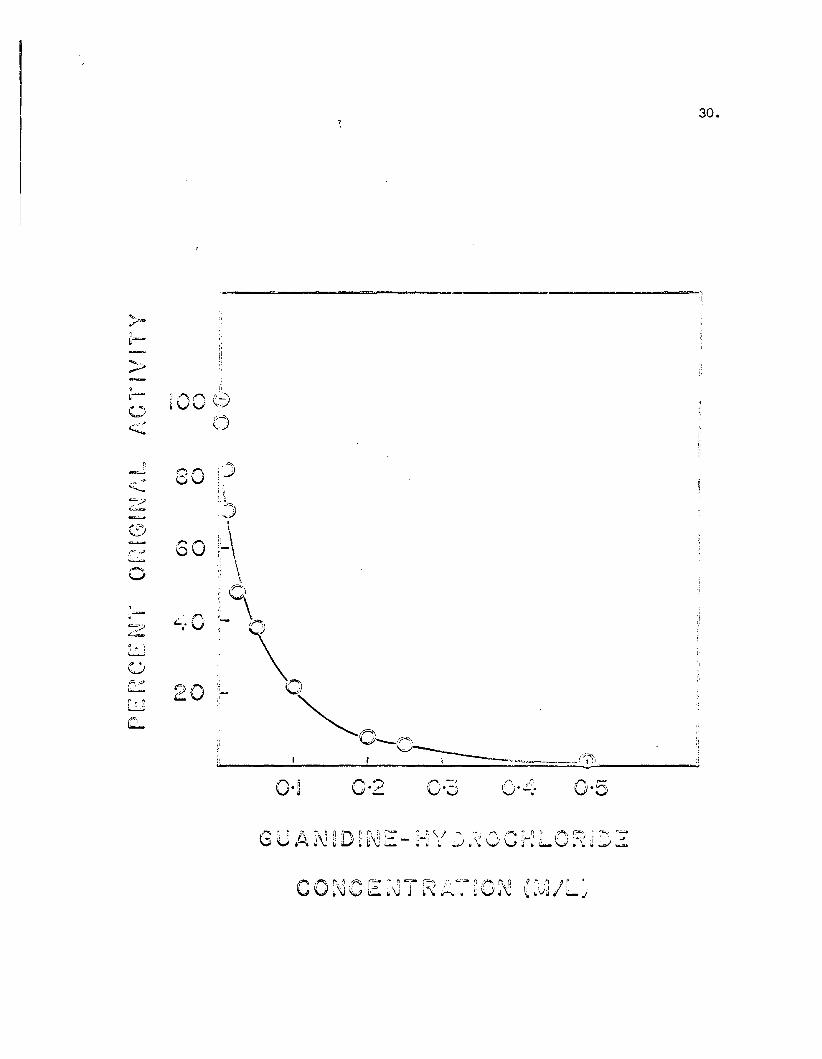
i. Effect on PAC activity
An experiment similar to that with urea on the inac
tivation of PAO was carried out with guanidine-hydro
chloride.
Figure 8. The effect of urea on PAO activity.Aliquots of a stock solution of 6M urea were added toapprox. 0.5 ~ mole of 0.067M phosphate buffer, pH 7.2to give the desired urea concentration, and the systemallowed to incubate for 10 minutes at 250 before addition of the benzylamine substrate to start the standard assay. Final volume was 3.0 mI.
>-
>
<:
<""7'"--
(;)
... ,..~- 0
,~-
zu()r,..~
U"..,
~
,,.... ?'\.
CU '-
20
~ .r"I,i V 2·0
28.
Ui-<EA I " ',/ 1 ,l ,v; :..... )
The results are shown in Figure 9. In contrast to the
results with urea, inactivation of the enzyme was ac
complished at a much lower concentration. Whereas ap
proximately 90% of the enzyme activity remained on
incubation with 0.4 Murea, there was almost complete
inactivation with the same concentration of Gu-HCl. The
rate of inactivation also differed with the two reagents.
There was a gradual loss of activity with increasing
urea concentration as shown by the sloping curve in
Figure 8. Addition of Gu-HCl caused a relatively rapid
loss in activity. (This rapid rate of inactivation de
creased as inactivation approached completion).
ii. Effect on PAC sedimentation
Solid recrystallized guanidine-hydrochloride was
added directly to 1-2 ml samples of native PAO in 0.06 M
phosphate buffer, pH 7.0, to give approximately the de
sired concentration. The treated samples were then dia
lyzed against 500 mls of a Gu-HCl solution of the indi
cated concentration for 24 hours in a closed container.
The Gu-HCl was made up in the 0.06 Mphosphate buffer and
the final pH ranged from 5.92 for the 2 MGu-HCl solution
to 5.20 for the 6 Msolutions.
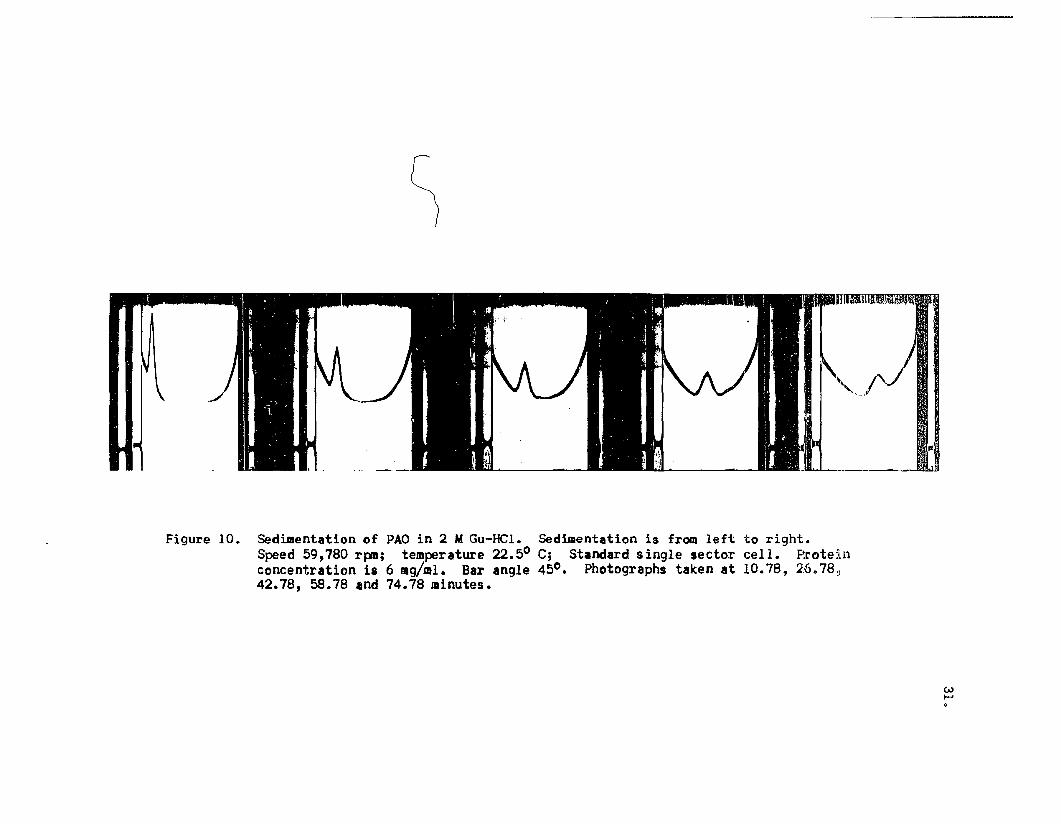
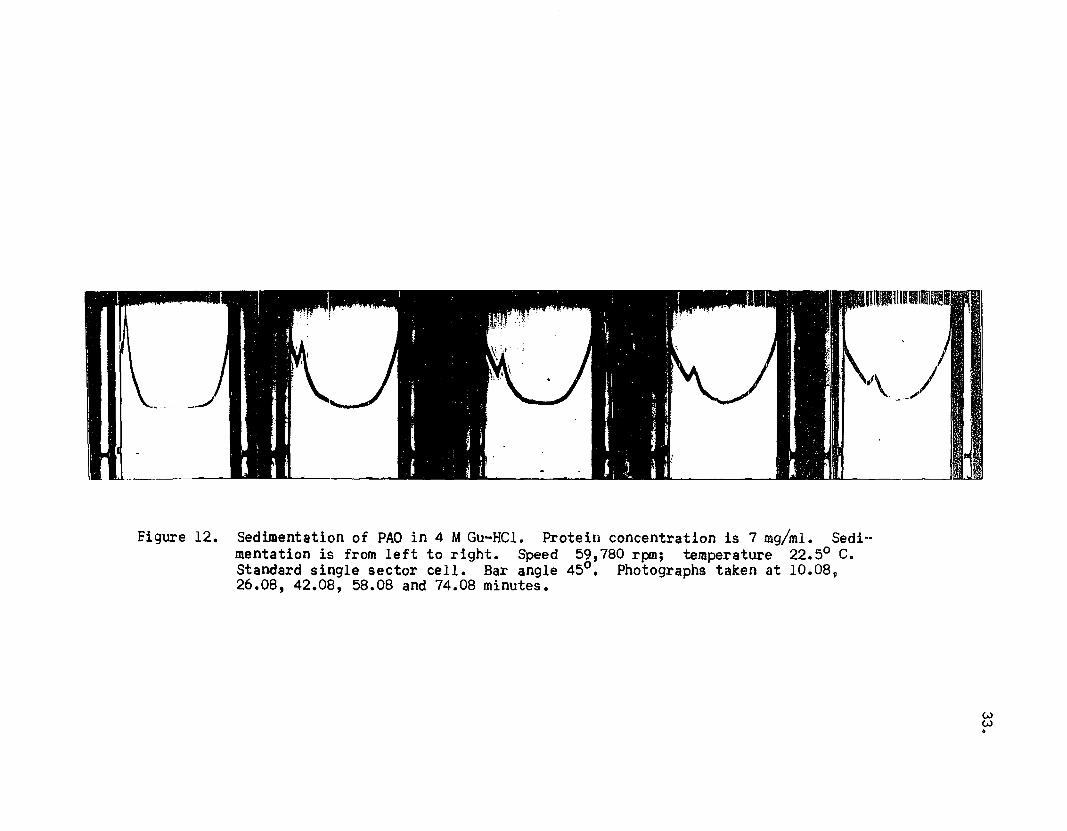
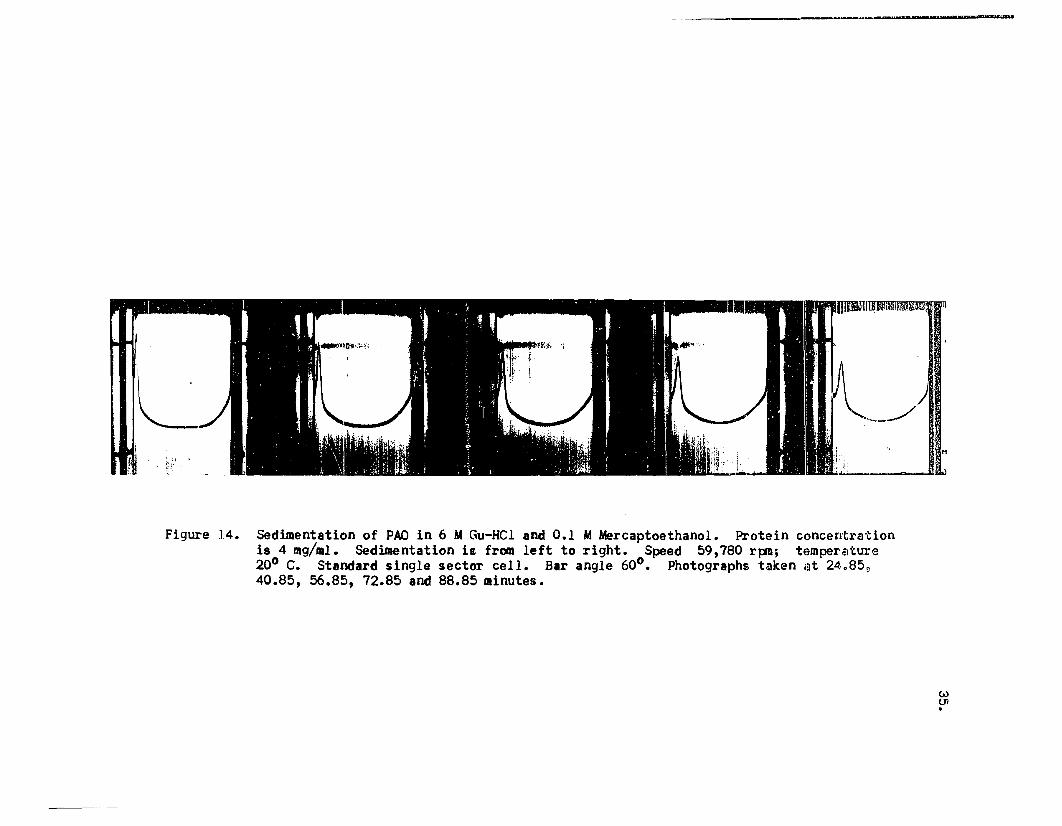
Figures 10, 11, 12, 13 and 14 illustrate the sedi
mentation patterns of PAD treated with various concen
trations of Gu-HCl. Table III lists the sedimentation
coefficients determined from these patterns.
Figure 9. The effect of guanidine-hydrochloride on PAO activity.Aliquots of a stock solution of 3M guanidine-hydrochloride were added to approximately 0.5 m~ mole enzymein 0.067M phosphate buffer, pH 7.2 to give the desiredGu-HCl concentration and the system was allowed to incubate for 10 minutes at 250 C. before addition of thebenzyl amine substrate to start the standard assay.Final volume was 3.0 mI.
>:J
J00 (:)()
30.
-.'u
80
60
'-.. 0
20
o·~r-. ?u·_ 1.,-..".• -,v·':) U·"'··3., 0·5
s
Figure 10. Sed~ent8tion of PAO in 2 MGu-HCl. Sed~entation is from left to right.Speed 59,780 rpm; temperature 22.50 C; Standard single sector cell. Proteinconcentration is 6 mg/ml. Bar angle 45°. Photographs taken at 10.78, 26078~42.78, 58.78 and 74.78 minutes.
If
w......
Figure 11. Sedimentation of PAO in 3 MGu-HCl. Protein concentration is 6 mg/mlo Sedimentation is from left to right. Speed 59,780 rpm; temperature 22.5 C. B~r
angle 45°. Standard single sector cell. Photographs taken at 11.50, 27.50,43.50, 59.50, and 75.50 minutes.
wI\).
Figure 12. Sedimentation of PAO in 4 MGu-HCl. Protein concentration is 7 mg/ml. Sedi-mentation is from left to right. Speed 59,780 rpm; temperature 22.50 c.Standard single sector cell. Bar angle 45°. Photographs taken at 10.08,26.08, 42.08, 58.08 and 74.08 minutes.
Figure 13. Sedimentation of PAO in 6 MGu-HC1. Protein Concentration 5 mg/ml. Sedimentationis from left to right. S~ed 59,780 rpm; temperature 22.50 C. Standard singlesector cell. Bar angle 500 ; photographs taken at 26.64, 42.64, 58.64, 74.64 and90.64 minutes.
~.
-nam.
!~,-_/,:t~, ~
Figure 14. sedimentation of PAD in 6 MGu-HCl and 0.1 MMercaptoethanol. Protein concentrationis 4 mg/al. sedimentation is from left to right. Speed 59,780 rpm; temper~ture200 C. Standard single sector cell. Bar angle 60°. Photographs takan at 24.85,40.85, 56.85, 72.85 and 88.85 minutes.
..
wOJ·
360
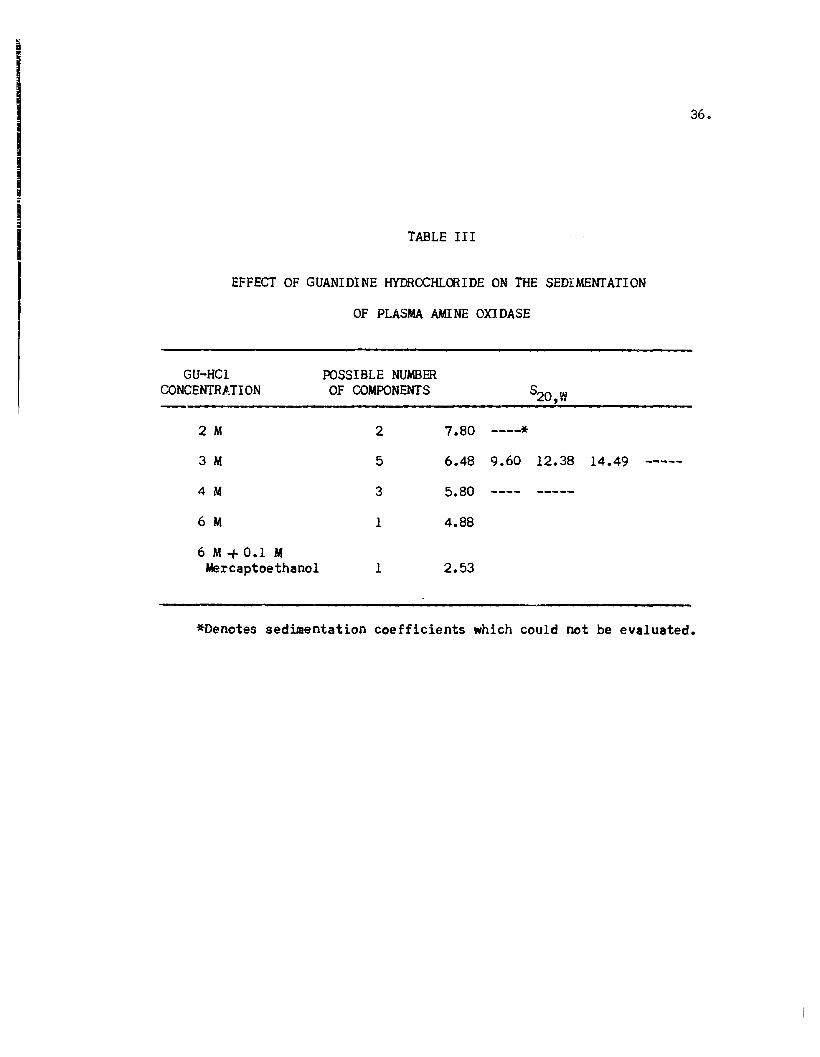
TABLE III
EFFECT OF GUANIDINE HYDROCHLffiIDE ON THE SEDIMENTATION
OF PLASMA AMITNE OXIDASE
GU-HCl roSSI BLE NUMBERCONCENTRATION OF COMPONENTS S20,W
2 M 2 7.80 ----*3 M 5 6.48 9.60 12.38 14.49 -----4 M 3 5.80
6 M 1 4.88
6 M-to 0.1 MMercaptoethanol 1 2.53
*Denotes sedimentation coefficients which could not be evaluated.
37.
Like the results of the sodium dodecyl sulfate treat-
ment, reaction with guanidine hydrochloride also presented
a comple~ picture of possible dissociation together with
aggregation. Multiple peaks with a range of s20,W values
from 5.80 - 14.49 S occurred in Gu-HCl concentrations
lower than 6 M. In 6 M Gu-HCl the sedimentation pattern
was that of a sharp single peak which appeared fairly
symmetrical (Figure 13). The s of this component was20,W
4.88 S and it was felt that dissociation was finally
achieved with this solvent. (That this was a premature
conclusion will be discussed in detail later).
Because the possibility existed that further break-
down of the molecule could occur with the reduction of
-S-S bridges, the sed~entation of PAO in 6 MGu-HCl
reduced with 0.1 Mmercaptoethanol was also checked
(Figure 14). Here again, a single sharp pea~ was seen
with an s20,W value of 2.53 S which seemed to bear out
the hypothesis that some of the polypeptide chains
present in the molecule are covalently linked by di-
sulfide bonds.
4. Effect of Mercaptoethanol on PAP
Dialysis of PAO against an 0.1 Mmercaptoethanol solution,
buffered at pH 7, resulted in very little effect on the structure
of PAO as indicated by the sedimentation pattern (Figure 15).
The sedL~entation pattern appeared almost identical with that of
the native, untreated enzyme, although the s20,W value of 8.56 S
was somewhat lower than that of the native enzyme. Due to the
_lJfiiIjiIUllliilJllilllll
A- ~-
j\j
lIImlIumJl!immJlWJIII
Figure 15. Sedimentation of PAO in 0.1 M Merc.ptoethanol, pH 7.0. Protein concentratiolll 6.72mg/ml. Sedinlentation is from left to right. Speed 59,780 rpn; temperature 22.5° C.Standard single sector cell. Bar angle 45°; photographs taken at 11.05, 19.05, 27.05,35.05, and 43.05 minutes.
wco.
39.
compactness of the PAO structure, it is possible that the molecule
is not effectively reduced in the absence of a denaturing agent to
expose the -5-5 bonds.
5. piscussion of the Results
The studies on the effect of pH, detergent, denaturing and
other chemical agents on the structure of plasma amine oxidase in
dicated that a s~ple dissociation is not accomplished by these
means. Rather than dissociation, the sedimentation behavior of
PAO in the various systems, except in the case of 6 MGu-HCl,
seemed to indicate denaturation of the molecular structure. (Here,
denaturation is taken to denote that class of reactions which lead
to changes in the structure of the macromolecule with no change in
molecular weight (Rice ~ Al., 1958).
Because no other molecular parameters were determined in con
nection with these studies, it was not possible to evaluate com
pletely the response of the native protein to all the environ
mental changes, but from the sed~entation coefficients alone,
one could make some inferences of what had taken place. It is
well recognized that the behavior of protein molecules in the
ultracentrifuge is often affected by denaturation treatments and
denatured proteins frequently show a decrease in sedimentation
coefficient (Joly, 1965). This decrease in sedimentation coef
ficient may reflect either a decrease in molecular weight or a
change in the molecular shape (Lundgren and William, 1939).
In the study of pH effects on PAC, it was noted that the sed
imentation coefficients at acid and alkaline pHs were lower than
40.
that of the native enzyme ~t pH 7. From a consideration of the
rel~tionship of the frictional ratio, sedimentation coefficient,
and the molecular weight, it can be shown th~t for the minimum
dissociation of a molecule into halves, the decrease in s20,W
should be at least 35% or more. For PAO with an 820,W of 9.23
(Yamada ~ !l., 1964), a dissociation to two subunits should
yield an s20 Wof approx~ately 6.0. Therefore, the general,interpretation of the pH studies was that the molecule was under-
going a change in molecular shape, be it v.~f~lding or expansion,
at the pH extremes due to electrostatic repu15ion since none of
the sedimentation cl)efficients in Table I showed a ~~ufficient
decrease to be taken as indicative of dissociation. As men-
tioned ear1ier, the sedimentation pattern of the pH 7 control
sample showed a much broader boundary coapared to the samples in
acid or alkaline media. The possible significance of this ob-
servation will be discussed later.
By the same reasoning, the succinylation experiment was also
interpreted us reflecting a change in molecular shape. However,
because the extent of the reaction was not determined, the pos-
sibility exists that the negative results in this case may be
due to incomplete succinylation of the molecule. As in the case
of the attempted reduction with mercaptoethanol in the absence
of a den=turing ~gent, the susceptible residues may have been
buried within the molecule and therefore, not able to react with
the succinic anhydride. Since this experiment was designed to
check the effectiveness of this relatively simple reaction with-
out recourse to more drastic measures, no advantage was thought
41.
to be gained by succinylating in the presence of a denaturing
agent and the reaction was not pursued further.
Reaction of PAO with low concentrations of sodium dodecyl
sulfate yielded sedimentation coefficients which were higher than
that of the native enzyme (Table II), a sign of molecular aggre
gation. The formation of aggregates in protein solutions involves
a modification of the quarternary structure, generally considered
as a secondary effect ensuing from changes in the secondary or
tertiary structure caused by denaturation. In some cases it seems
that aggregation stabilizes the configuration of the denatured
molecules (Joly, 1965). Thus, this may have been the case with
low SDS/PAO ratios, but as the SDS concentration was increased,
the denaturation was such that the formation of aggregates was
not possib~a and, hence, only a single boundary representing a
somewhat unfolded molecule was seen. Finally an SDS/protein
ratio was reached where three boundaries which moved slower than
the native molecule were seen present in the sed~entation pat
tern. A priori, one might have concluded that this high concen
tration of 50s caused PAD to dissociate partially into smaller
units, but this decrease in sediment.tion coefficient of the en
zyme aolecule could not be taken as conclusive evidence for dis
sociation because of the possibility of ·swelling" of the molecule
due to binding of SDS with consequent decrease in density. From
Figure 7, it was seen that the detergent alone aggregated to form
a micelle which sedimented with an appreciable velocity. The
slowest moving boundary in the protein sample cell thus, may not
42.
have been dissociated protein but a larger dete~gent aggregate.
The two faster boundaries may have represented either dissoci-
ated protein, denatured molecules, or protein-detergent complexes.
The advantages of using such detergents as SDS in dissociation
studies with the ultracentrifuge have been pointed out by
Schachman (1960), but use of SDS is also not without its attendant
experimental difficulties. There is direct evidence that deter
gents are bound to protein (Edelhoch and Lippoldt, 1960) and in
some cases only incomplete dissociation has been found (Klotz and
Keresztes-Nagy, 1962, 1963). It cannot be assumed that a deter-
gent, at any concentration, will have an effect equivalent to
that of urea or guanidinium salts (Reithel, 1963) and for this
reason the dissociation studies were further pursued with
guanidine-hydrochloride. As mentioned earlier, urea did not ap
pear to be very effective in dissociating PAO.
The results with Gu-HCl were somewhat s~ilar to those with
SDS. Initially there appeared to be some aggregatien, followed
by prevention of aggregation as increased unfolding takes place,
denoted bythe reduction in s20,W. When the concentration of
Gu-HCl was increased to 6 M, it seemed that the transformation
in the molecule was that of dissociation. Further dissociation
appeared to be accomplished with the use of a reducing agent.
The conclusions drawn fr~ these experiments were that PAO
is not readily dissociated by the conventional, relatively mild
treatments which have been u~ed to dissociate other large pro
teins. Partial dissociation appeared to be effected with sodiu:
dodecyl sulfate and moderate concentrations of guanidine-hydro
chloride. In order to achieve complete dissociation~ a higher
concentration of Gu-HCl seemed necessary and the maximum effect
only through the use of a reducing agent.
More exacting information of the dissociation of plasma
amine oxidase would be obtained frnm molecular weight determi
nations and these are discussed in section C.
43.
B. SUlfhydryl Groups and Disulfide Bonds of PAG
1. Sulfhydryl Groups by CMS Titration
The number of -SH groups in a protein which react with CMS
is determined from the break in a plot of the change in ab
sorbancy at 250 or 255 m~ (corrected for CMS and protein ab
sorbance) versus the molar ratio of CMS/protein. Because some
-SH groups may not be readily reactive with the -SH reagent, it
is necessary to assay the protein under varying conditions. The
estimation of reactive -SH groups is carried out in as mild con
ditions as possible. Unreactive -SH groups are made available
by denaturation of the protein by chemical or physical means.
The reaction of PAO with CMS in pH 7 buffer is shown in Fig
ure 16. The results indicated that only a very low amount of
reactive thiol was present in the molecule. The value obtained
from this determination was 0.38 -SH/mole PAG. In the presence
~f a denaturing agent, such as guanidine-hydrochloride, or in pH
4.6 buffer, the number of -SH groups detected by CMS mercaptide
formation was increased to approximately two. Figures 17 and 18
show the reaction of PAD with CMS in 5 M guanidine-hydrochloride
Figure 16. The reaction of PAO with CMS at pH 7.0. Aliquots of the enzyme were treated withvarious amounts of CMS and the absorbancy at 250 mu read at different time intervals.The reaction was judged to be complete after 72 hours at room temperature by the constancy of the optical density. The reactions were carried out in 0.06 M phosphatebuffer, pH 7.0.
oCOo
ooo
.......,i J
0
0
;.-""\IJ
:".../
,,-...,U
o
()".o
.'-...-1
C\.,o
'I 0:'_.;
Nii
~i'
~ L')~j -
o
44 •
45.
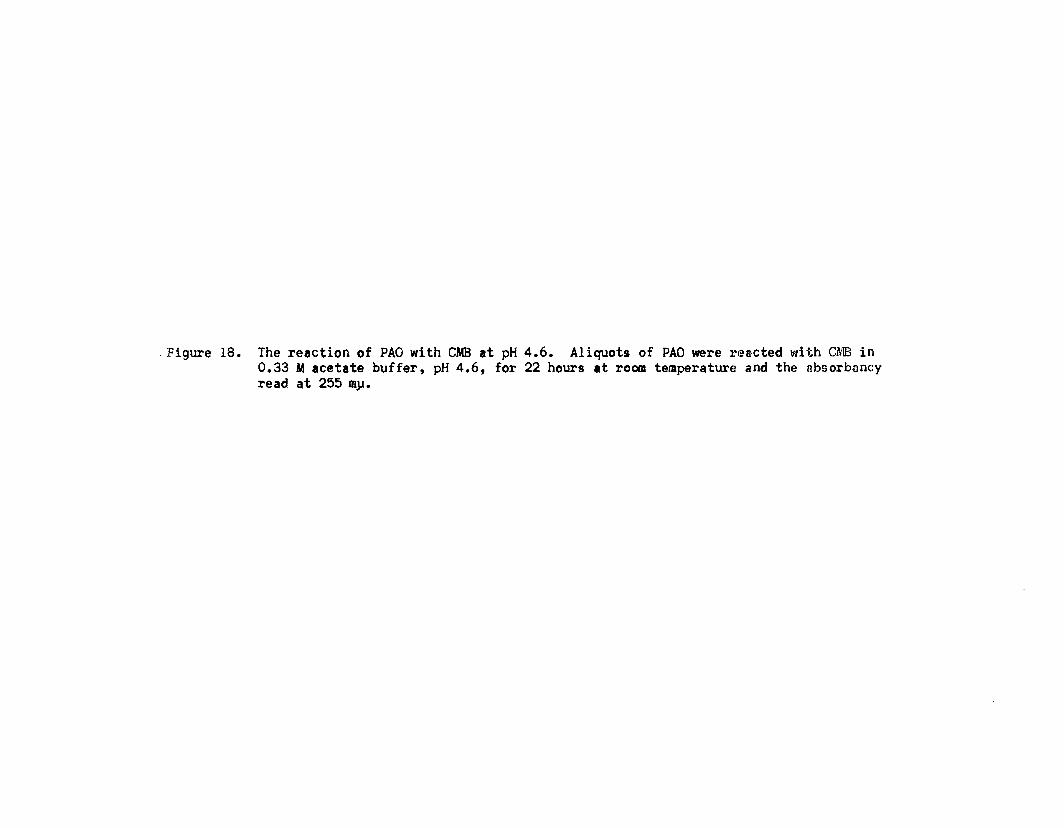
and in pH 4.6 acetate buffer, respectively. The values obtained
for the number of thiols were 1.80 -SH/mole PAC in 5 MGu-HCl and
1.58 -SH/mole PAC in pH 4.6 buffer. (All values given were based
on the re-evaluated molecular weight of PAC of 170,000 which is
discussed in the next section).
2. TQtal Cysteine and Cystine CQntent
TQtal cysteine and cystine value was determined as cysteic
acid Qr as S-carbQxymethyl cysteine by the methQds described
earlier. A value Qf 20.14 - 20.40 residues Qf cysteic acid per
170,000 grams Qf prQtein was fQund. The number of S-carbQxy
methyl cysteine residues per 170,000 grams Qf protein was calcu
lated to be 20.31.
3. DiscussiQn
The determinatiQn Qf the SUlfhydryl grQups and disulfide
bQnds Qf PAC was undertaken when it appeared likely that cQvalent
linkages were invQlved in the binding Qf the subunits Qf the
mQlecule. The enzyme is nQt a "sulfhydryl enzyme", i.e., the
sulfhydryl grQups are nQt directly invQlved in the enzyme ac
tivity as judged by the lack Qf inhibitiQn by CMB. CuriQusly,
in this regard, it was Qbserved in the titratiQn Qf PAC with CMS
in pH 7.0 buffer that the presence Qf CMS seemed tQ stabilize
the enzyme somewhat at rQom temperature. After the three day
periQd during which the reactiQn was allowed to proceed, all
samples containing CMS, (even in the lowest ratio of 0.26 mQles
CMS/mQle PAO) remained reasonably clear and retained the very
slight pink color of the enzyme. In contrast, at the same time,
Figure 17. The reaction of PAO with eMS in 5 MGuanidine Hydrochloride at pH 7.0. The changein absorbancy at 250 OUJ represents the maximum absorbancy (after 22 hour~,) attainedat room temperature minus the appropriate blanks.
46.
c;
o
o "
(/)
o~-
o
o"" r;"''-'
oCOo
o(0
ooC\J
· Figure 18. The reaction of PAG with CMS at pH 4.6. Aliquots of PAO were re~cted with CMS in0.33 Macetate buffer, pH 4.6, for 22 hours at room temperature and the absorbnncyread at 255 m~.
47.
-.Jo
C)-' ." ~-
..-.Jo
u
o(\j
o<o e:.-
1"-')
o
'0u'Jo
oo.
ot()
oo(\j
( r[ u.; 99 Z) A8 N\j 8 dO S8 \1
the enzyme blank which contained enzyme and no CMS was observed
to be markedly turbid and slightly yellowish in coloro The Ct~
containing samples retained mere than half of the original ac
tivity while the enzyme sample containing no CMB had lost prac
tically all of its activity.
From the CMS exper~ents in quanidine-hydrochloride and in
pH 4.6 buffer, it was found that there are two -SH groups
present in the PAD molecule. These -SH groups are not very re
active and are probably slightly -buried- within the molecule.
Under the ordinary cold temperatures and short periods that the
enzyme solutions are kept, very little ~nteractions between these
groups is evident, but the observations made above has indicated
a possible role for these -SH groups in the in vitro denaturation
of PAO.
In the experiment at pH 7, the exposure of the enzyme so-
lution to room temperature for such a considerable length of
tLme apparently led to greater interaction between the molecules.
It is also possible that some configurational changes occurred
and under these conditions the -SH groups which were previously
buried in the interior of the molecule were able to interact and
form disulfide bonds. Multiple intermolecular S-S bond formation
resulted in aggregation and precipitation of the enzyme. The
presence of CMS which ties up the -SH groups prevented this poly
merization reaction. As observed in the succinylation experiment
8 slight unfolding or conformational change does not seem to af
fect the enzyme activity significantly. Therefore, the inter
action b~tween the free thiol groups of PAO to form disulfide
49.
bonds may be in part responsible for the denaturation and loss of
activity of the enzyme upon standing and a way to stabilize the
enzyme might be to store it in the presence of a sulfhydryl re-
It was four~ that there were twenty h31f-cystine residues in
PAO, as determined from the number of cysteic acid residues in the
oxidized enzyme or the number of S-carboxyaethyl cysteine residues
in reduced and alkylated PAC. Two of these residues must repre-
sent the free SUlfhydryl groups present and by subtraction 9 there
are eighteen half-cystine residues which are involved in disulfide
bond formation or nine -5-5- bonds in all. No differentiation was
made as to what portion of the disulfide bonds were inter- or
intrl- chain; but the possibility is very strong that the subunits
may be covalently linked based on the number of disulfide bonds
in the molecule and the reduction in the sedimentation coefficient
of denatured PAO in the presence of a reducing agent.
c. Molecular weight Studies
1. Molecular Weight PetQrmioation of Reduced PAQ
a. Sedimentation-Diffusion
i. Measurement and Calculation of S~o,w
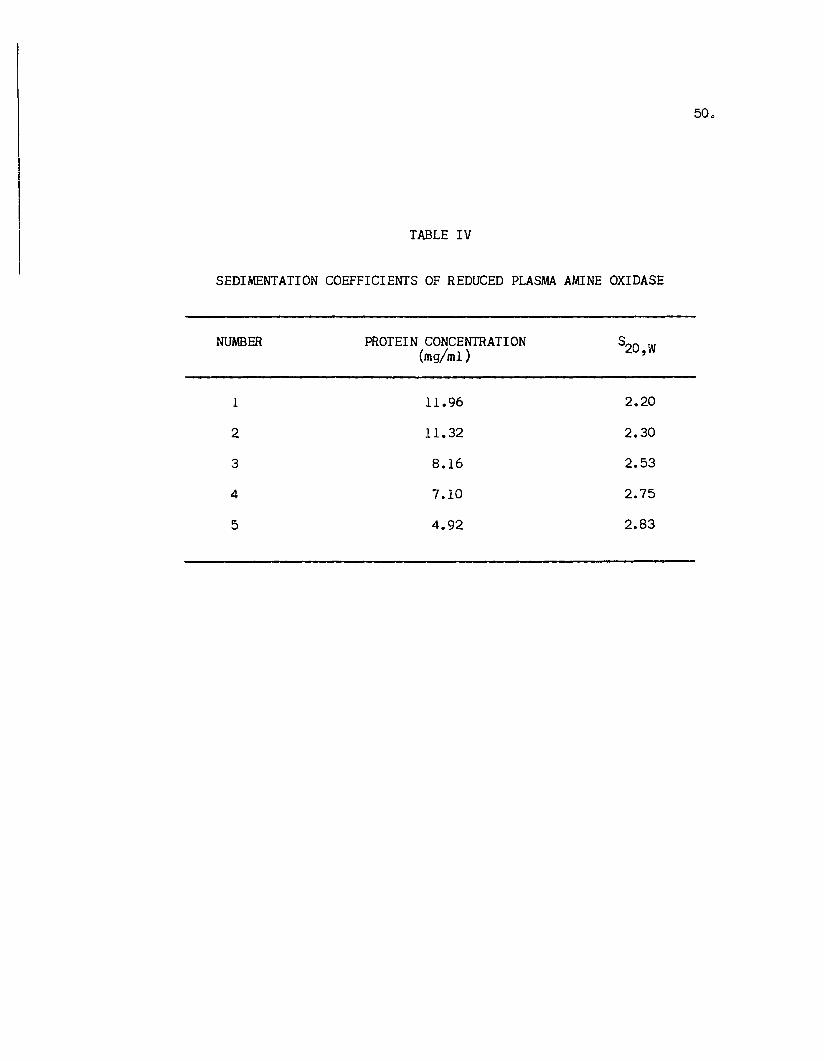
Table IV suamarizes the values obtained for the
sedimentation coefficients of reduced PAO determined in
6 MGu-HCl + 0.1 Mmercaptoethanol and converted to
standard conditions. The sedt.entation coefficients as
a function of protein concentration is shown in Figure
19. There was a negative dependency of the s values20,W
TABLE IV
SEDIMENTATION COEFFICIENTS OF REDUCED PLASMA AMINE OXIDASE
NUMBER PROTEIN CONCENTRATION S20,W(mg/m1 )
1 11.96 2.20
2 11.32 2.30
3 8.16 2.53
4 7.10 2.75
5 4.92 2.83
Figure 19. sedimentation coefficients of reduced plasma amine oxidase as a function of proteinconcentration. PAO was studied in 6 MGu-HCl + 0.1 Mmercaptoethanol, pH 7.0 at22.50 C. The straight line drawn represents a linear least squares analysis andextrapolation to zero concentration.
51.
52.
on the protein concentration and analysis by the least
squares method yielded the following relationship:
s20,W =3.32 - 0.0914 c
where c is the protein concentration in mg/ml. From this
relationship, the extrapolated value of the sedimentation
coefficient at infinite dilution (s~O,w) was found to be
3.32 ! 0.06 S.
ii. Measurement and Calculation of D~O,w
An example of a diffusion run using the ultracentri-
fugure is shown in Figure 20. The diffusion coefficients
of reduced PAO in 6 MGu-HCl are shown in Table V. Fig-
ure 21 shows the concentration dependency of D20 ,W on
PAO concentration. Least squares analysis yielded a
D~O,w value of 3.83 ! 0.03 x 10⁻⁷ cm2/sec.
iii. Calculation of Mf (s/D)
Use of the s~o,w and D~O,W values determined above
in the Svedberg equation yielded a molecular weight of
87,000! 2,200 for reduced plasma amine oxidase.
b. Sedimentation Equilibrium
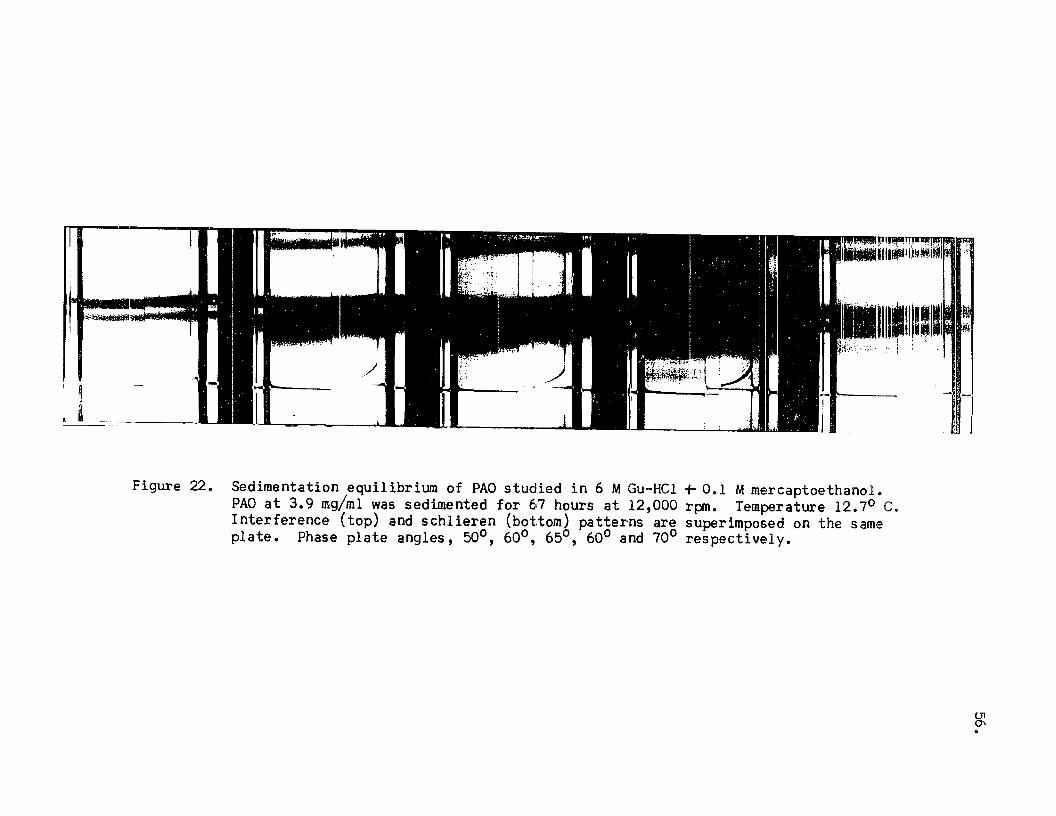
Figure 22 is an example of the patterns obtained from a
sedimentation equilibrium run utilizing both schlieren and
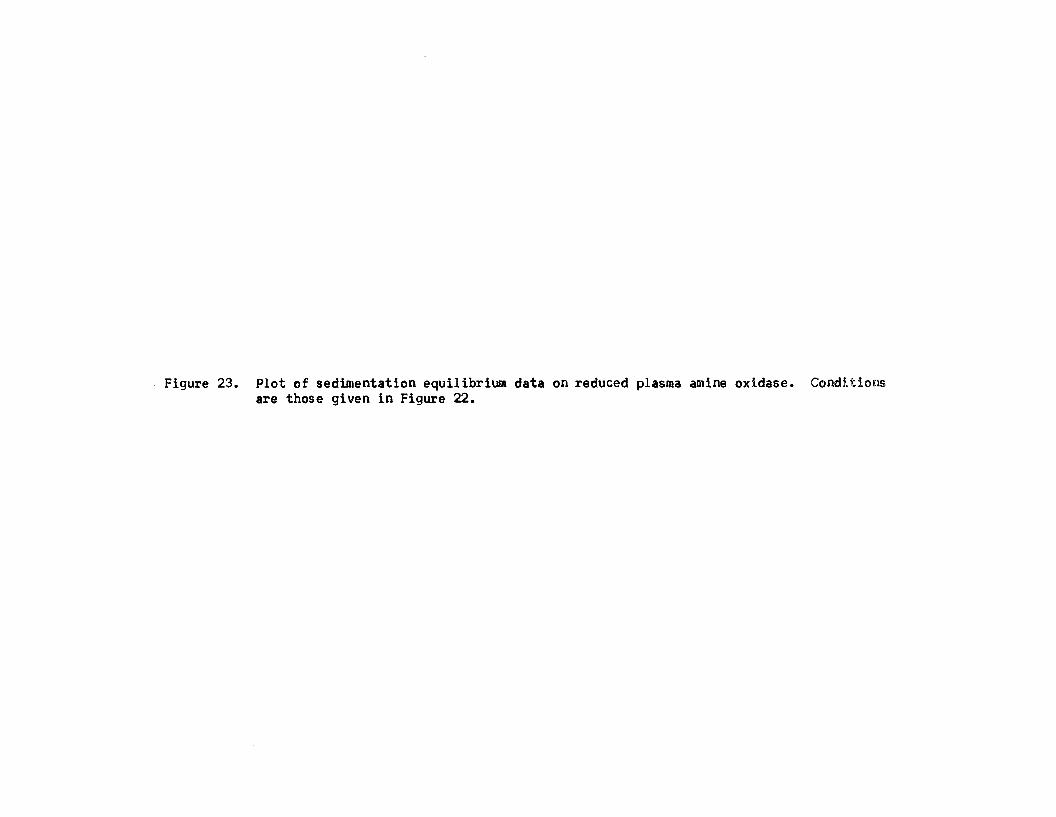
interference optics. Figure 23 shows a plot of l/r dc/dr
versus fringe number for PAO in 6 MGu-HCl + 0.1 Mmercapto
ethanol, pH 7.0. For determination of molecular weight, the
fringe count was converted to units of concentration (~c) by
the use of a conversion factor which is a function of the
J=-
Figure 20.
"ula»-
Diffusion of reduced plasma amine oxidase in 6 MGu-HCI TO.I Mmercaptoethanol,pH 7.0. Protein concentration 9.99 mg/ml. Double sector capillary syntheticboundary cell. Speed 8,225 rpm; temperature 22.50 C. Bar angle 500 ; photo"graphs taken at 4.05, 20.05, 36.05, 52.05, 68.05 and 84.05 minutes.
I'.-
{Jlw.
TABLE V
DIFFUSION COEFFICIENTS OF REDUCED PLASMA AMINE OXIDASE
54.
NUMBER
1
2
3
PROTEIN CONCENTRATION(mg/m1)
11.96
9.99
7.10
3.09
3.23
3.39
Figure 21. Diffusion coefficients of reduced PAO as a function of Protein concentration. PAOstudied in 6 MGu-HCl -+ 0.1 Mmercaptoethanol, pH 7.0 at 22.50 C. The straightline drawn represents a linear least squares analysis and extrapolation to zeroconce ntrat ion.
Io/-\J
/I.r-,.
\../
,"
jC\.l~,~
JO,-!!~
-00
---.!
--'
'/"..... -o[
<c::::
55.
/.C\J co. .~- i"')
"'- o.l'0
()
zou
zw
0..
,.<'~'.- . I I I I I '.•.• ;;,:.,;-.:~......... iiII.ii. "I
i
I i 11 · .l..I~Tr-- -Im----'0- I_II m J
Figure 22. Sedimentation equilibrium of PAO studied in 6 MGu-HCl + 0.1 Mmercaptoethano1.PAO at 3.9 mg/m1 was sedimented for 67 hours at 12,000 rpm. Temperature 12.70 C.Interference (top) and schlieren (bottom) patterns are superimposed on the sameplate. Phase plate angles, 50°, 60°, 65°, 60° and 70° respectively.
(Jl0'.
Figure 23. Plot of sedimentation equilibrium data on reduced plasma amine oxidase. Conditionsare those given in Figure 22.
';
Jo~
-' N:iH11
ii~Ii
w(9
Z
57.
CDo.
(0
o.¢o.
(\j
o.
58.
phase plate angle (Chervenka, 1966). The apparent molecule
weight of reduced PAC in 6 MGu-HCl at a protein concen
tration of 3.9 mg/ml calculated from the slope of the line
was 86,600.
2. Molecular Weight Determinations of PAC in 6 M Gu-HCl
a. Sedimentation-Diffusion
i. Measurement and calculation of s~O W,The sedimentation coefficients of plasma amine oxi-
dase studied in 6 M Gu-HCl, pH 7.0, and corrected to
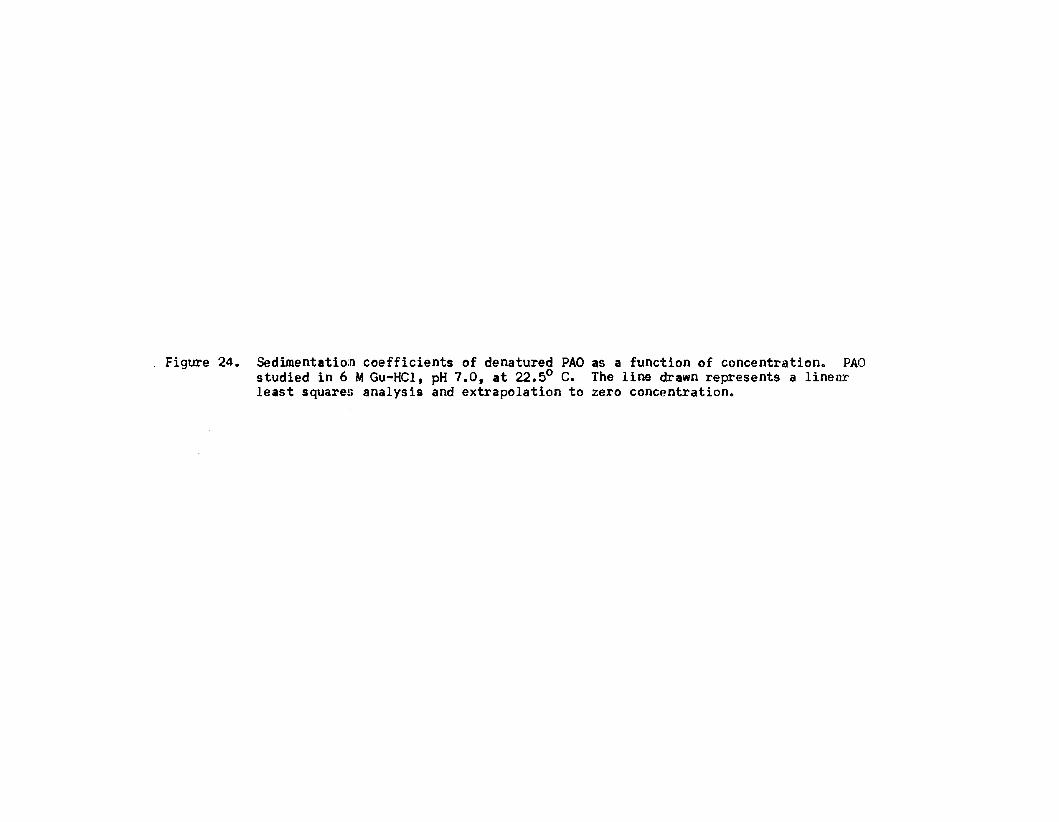
standard conditions are shown in Table VI. The sedi-
mentation coefficient was found to vary as a function
of protein concentration according to the relationship:
s =5.30 - 0.0731 c20,W
as shown in Figure 24. As with the reduced enzyme, there
was also a negative dependency on concentration.
Extrapolation of the line to zero concentration yields an
s20,Wof 5.30! 0.10.
ii. Measurement and Calculation of D~O W,
Table VII summarizes the diffusion coefficients of
PAC studied in 6 M guanidine-hydrochloride. The rela-
tionship between D20 ,w and ~otein concentration is shown
in Figure 25. Extrapolation to zero concentration
o + -7 2/yielded a D20 ,w value of 3.80 _ 0.03 x 10 cm second.
TABLE VI
SEDIMENTATION COEFFICIENTS OF DENATURED PLASMA AMINE OXIDASE
59.
NUMBER
1
2
3
4
PROTEIN CONCENTRATION(1I9/m1)
12.17
10.41
7.88
4.08
4.49
4.48
4.67
5.05
· Figure 24. Sedimentation coefficients of denatured PAO as a function of concentration. PAOstudied in 6 M Gu-HCl, pH 7.0, at 22.50 C. The line drawn represents a linearlelst square!» analysis and extrapolation to zero concentration.
60.
I--E
C\J "-!
I0r~~::
""-
I 0 z-i
i 0-I-I ro «
lCt:1-?
~ 1O w
-I()
z0
0 ¢()-,
Z
W-j C\J ~! 0
! ~
l 0-Ilj
'...c0 N OJ ~. . . ,l() L() r-'-
~-'..J
61.
TABLE VII
DIFFUSION COEFFICIENTS OF PAO IN 6 MGu-HCl
1
2
3
PROTEIN CONCENTRATION(mg/ml)
12.17
10.41
4.08
2.46
2.65
3.35
iii. Calculation of Mf (s/n)
The molecular weight of PAO in 6 MGu-HCl as deter-
mined from sed~entation and diffusion measurements was
calculated to be 140,200 ± 3,800.
b. Sedimentation Equilibrium
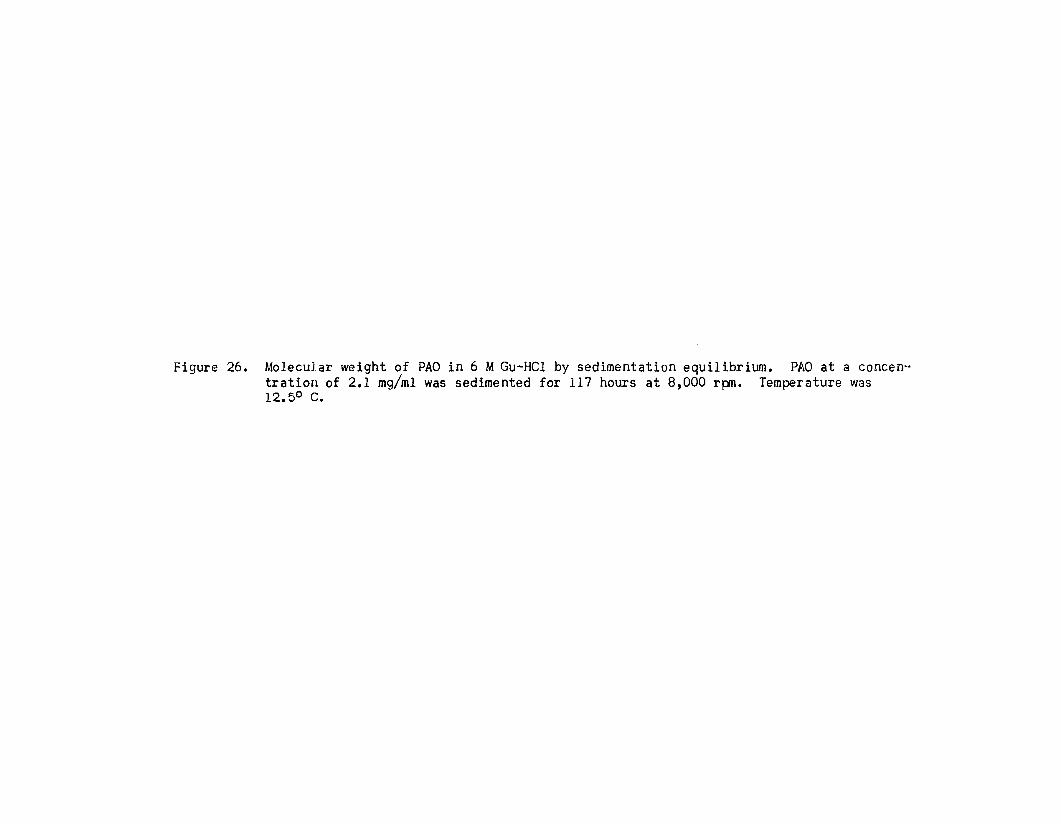
The plot of l/r dc/dr versus fringe number for PAO in
6 MGu-HC1, pH 7.0, is seen in Figure 26. The apparent mole-
cular weight of denatured PAO at a concentration of 2.1
mg/ml was calculated to be 197,300.
3. Molecular Weight Determination of the Native Enzyme
a. Estimation of Molecular Weight by Sephadex Gel Filtration
Figure 27 shows the elution pattern of PAO on Sephadex
G-200, along with the other substances which were used for
the calibration of the column. Table VIII lists the mole-
cular weights and elution volumes pertinent to this
· Figure 25. Diffusion coefficients of denatured PAO as a function of protein concentration.PAO was studied in 6 M guanidine-hydrochloride, pH 7.0, at 22.5°. The straightline drawn represents a linear least squares analysis and extrapolation to zeroconcentration.
62.
-II N E
-jH "~a
O'Ji Ei 0 ....--J
I zI 0Ii; :-I
CO-j <C!p 0:::, t-~ Z-f c..o lU
()
Z('~
~0
'~-~' - ()II
, Z,
C\J- LnJa, ,~-
0~
CLro ~- 0 <.D C\J. .10 r-.;) f't) C'J C\.1
{"\f02
0f'\~ .... /....( il I ...
L
Figure 26. Molecular weight of PAO in 6 M Gu-HCl by sedimentation equilibrium. PAO at a concentration of 2.1 mg/ml was sedimented for 117 hours at 8,000 rpn. Temperature was12.50 c.
o.cr-,..-'-j
oC\.!o
63.
· Figure 27. Chromatography of Proteins on Sephadex G-200. 2 x 50 em column equilibrated with0.06 Mphosphate buffer, pH 7.0. Dotted curves represent standard proteins.Peak Ai Blue Dextran 2000; Peak Be Bovine Y~lobulin; Peak C3 Bovine SerumAlbumin; Peak 01 Cytochrome £.. Solid curve is the elution pattern of plasDllIamine oxidase.
-E-w:§:
:::>--I0>
.'z0-I-
0 :::>en --I
w
oL{)
oLOo
------ ..........
oo
- - --
-
......\
\
.... ~..,,---::---------=-.....
) ,........ ,..-'" <: ... -.... - ....
-- -- - -:--J::'_ ...- ....
-
o
- - - -
--
-----
. -- - - - - - - - ....
,- - - . -'. - -- -
1\ __. "'"'" .,\, -:-- ,"'"
. \i _ .. ~ ..... '-.~" dO' ",.; v ~_
TABLE VIII
RELATIONSHIP BETWEEN MOLECULAR WEIGHTS AND ELUTION VOLUME
IN GEL FILTRATION ON SEPHADEX G-200
PROTEIN K>LECULAR LOG K)L. ELUTION VOL. v IvWEIGHT WT. (m!) e 0
Blue Dextran 2000 2,000,000 53.25
Bovine ¥-Globulin 150,000 5.1761 75.20 1.41
Bovine SerumAlbumin 70,000 4.8451 90.75 1.70
Beef Cytochrome ~ 13,000 4.1139 132.75 2.49
Plasma Amine Oxi-dase 166,700 5.2219 71.67 1.35
66.
experiment. A void volume of 53.25 ml was determined by the
elution of Blue Dextran 2000.
Figure 28 shows the relationship of the log of molecular
weight to the ratio of elution volume to void volume (ve/ve ).
The ratio of ve/vo for PAO was found to be 1.35. From the
slope of the line in Figure 28, this value was found to cor
respond to a log mol. wt. = 5.2219. Therefore, the molecular
weight of native PAO was estimated to be 166,700.
b. S~dMnentatiQn Equilibrium
As previously mentioned, the molecular weight of the na-
tive enzyme was determined in an equilibrium run using ab-
sorption optics. Molecular weight is calculated from the
slope of the curve of log c versus r 2, where c is the concen-
tration and r is the radial distance from the axis of rota-
tion. Figure 29 is a plot of log c (in terms of optical
density units) versus r 2• The apparent molecular weight
calculated from this run for the native PAO at a concentra-
tion of 0.24 mg/ml was 171,000. It appeared that the con-
centration dependency of the molecular weight was small and,
therefore, the ideal molecular weight is about 170,000.
4. Discuss ion
From the preliminary experiments on the dissociation of
PAO, it appeared that the dissociation of the molecule could
be accomplished through the use of guanidine-hydrochloride as
a denaturing agent and that further breakdown to single poly-
peptide chains then resulted in the presence of a reducing
Figure 28. Determination of the molecular weight of plasma amine oxidase by gel filtration. Relationship between elution volume, velvo' and log of molecular weight of standard proteins. 5ephadex G-200; 2 x 50 em; 0.06 M phosphate buffer,pH 7.0; 4-50 C; flow rate approximately 10 ml/hour.
c
o>"(l)
>
67.
it~
!2·6 ~-
~x\~
2·4 r
II2· 2 i-i
I2·0 II·al
1
iJ. 6 ~
!
~i·4 1- r.-G~obunn 1)
~ ,.... . ..,. . "~ ;,,; ~ Cl s r:~ ~ A ~1 Ul 0 10 ~ f (d 0 SG C\.·1'--------------------....----:~
~
4·2 4·4 4·6 5·0 5·2
LOG MOL ECULAR Vvl:.1GHT
Figure 29. Equilibrium sedimentation of pl~5ma amine oxidase.-Native- enzyme in 0006 M phosphate buffer, pH 7.0, ata concentration of 0.24 mg/ml sedimented at 7,200 rpm.
J·4
-C\J/·20
'-J.........00
'·0-C!>0..J
0-8
0-6
44 45 48 49
68.
69.
agent such as mercaptoethanol. Because no clear indication
of the number of subunits present in the molecule could be
obteined frem the sed~ent~tion velocity studies, ~ttention
was directed toward molecular weight determinations in these
two different systems.
As seen in the results, reduced PAC in guanidine-hydro
chloride has a molecular weight of about 87,000. The reported
molecular weight of PAO is 261,000 (Yamada ~ Ai., 1964) and
on this basis, it appeared that there were three polypeptide
chains in the molecule which were covalently linked by di
sulfide bonds.
The values obtained for the molecular weight of non
reduced PAO in guanidine-hydrochloride were 140,000 and
197,000 for the two methods used and although these r~sults
were not in good agreement, they indicated a molecular weight
which could not be rationalized with the other data. The re
duced PAD molecular weight. seemed to point to three chains of
approximately equal size and, assuming all chains to be co
valently bonded, there should be no change in the molecular
weight of the denatured enzyme from that of the native enzyme.
On the other hand, if only two of the chains were covalently
linked and the other linked by types of non-covalent bonds,
then one would have expected to have seen this type of break
down in the Ultracentrifuge patterns as two distinct bound
aries upon treatment with a denaturing agent. Heterogeneity
70.
would also have been observed in the equilibrium runs, but no
such evidence was noted.
To ur~erst~nd more fully what was happening 9 a Ee~e~alua
tion of the native molecular weight was deemed necessary.
Sedimentation equilibrium and the method of gel filtration
both indicated a molecular weight of about 170,000. As noted
previously, the reported molecular weight of the native PAO
is 261,000. Observations during the sedimentation equilibrium
study of the native enzyme suggested the possible explanation
for the large discrepancy between the two results. In the sed
imentation equilibrium run the sample appeared to be either
grossly heterogeneous or an associating-dissociating system.
A molecular weight value of 260,000 was obtained from the
center of the fluid column of the sedimentation equilibrium
run. It seems likely that the values previously determined
were averages of the molecular weight of the monomer and
higher polymers and PAO exists as an interacting protein
system in solution.
It is now known that in aqueous solutions many proteins,
such as insulin, Cl(-chymotrypsin, ~-lactoglobulin and lyso
zyme, associate to form dimers and higher aggregates which
exist in chemical equilibrium with the monomeric species.
Transport and thermodynamic properties of such chemically
reacting systems have been investigated by a number of
authors (Oncley ~ ~., 1952; Rao and Kegeles, 1958;
Townend ~ £1., 1960; Bruzzesi ~ sl., 1965). On the basis
71.
of results in transport experiments, it has been possible to
classify such systems with the criteria being the magnitude
of the rate constants of the forward and reverse reactions
(Ni~hols ti .s.!.., 1964). We are interested in that clas~ in
which the rate constants of both reactions are very large and
comparable in size. In sedimentation velocity experiments,
equilibrium is maintained despite the tendency toward sepa
ration of the individual species according to their sedi
mentation coefficients.
The system is generally readily recognizable by its un-
usual sedimentation behavior. With non-interacting systems,
~s versus c" curves normally have a negative slope because of
hydrodynamic effects and the presence of reversible aggre
gation can generally be assumed if the sedimentation velocity
of a substance increases with increasing concentration
(Gilbert, 1963). In many cases, only a single, al~ost sym-
metrical boundary is observed and at some concentration,
depending on the system, the sedimentation coefficient either
becomes constant or actually slowly decreases as the concen
tration is increased further (Schachman, 1959).
That PAO is a system of this class is indicated by the
sedimentation velocity experiments of Yamada ~ Al., (1964).
The linear relationship between the sedimentation coef
ficients and protein concentration may be described by
s20,W =9.23 + 0.042 c and here, the concentration dependen
cy is seen to be positive in nature. Because the
72.
sedimentation coefficients of PAC v~re not measured at con-
centrations greater than 12 mg/ml, no leveling or reversal of
the slope of the curve is evident, but it might be expected
that addition&l experiments in this direction would show this.
The usual theories of ultracentrifugal analysis are not
applicable to analysis of ultracentrifugal patterns of systems
which react chemically with itself or with-other components.
Due to the great mathematical difficulties, theoretical 1n-
vestigations in this field are still in the premature stage,
but developments are rapidly being made in the areas of sedi
mentation velocity and sedimentation equilibrium (Fujita,
1962; Adams and Fujita, 1963). An important contribution to
the problem of boundary shapes in sedimentation velocity and
electrophoresis experiments has been made by Gilbert (1955,
1959) in considering the interaction, nA~ An where n can
have values of 2 or more. The theory is based on analogies
to chromatography and neglects the effect of diffusion. It
predicts that there will be a single boundary if n = 2, but
that two boundaries will~e observed if n 2. Prior to this
treatment, it was generally accepted that only a single
boundary would be orserved in association-dissociation
equilibria as long as the reactions were instantaneous or
very rapid compared with the differential rate of migration
(Field and Ogston, 1955).
An extension to Gilbert's theory was made by Rao and
Kegeles (1958). In their work on ~-chymotrypsin, they found
73.
that the schlieren pattern consisted of a single peak, out
molecular weight data indicated a higher polymer than the
dimer. With the aid of GilbertQs theory, theoretical sedi
mentation velocity patterns were calculated for the cases of
eqUilibrium mixtures of monomers and trimers and monomers,
dimers, and trimers. The prediction from the theory was that
a single peak occurred for the latter c;se, but a double peak
for monomer and trimer in equilibrium. Therefore, considering
all the evidence at hand, it was concluded that ~-chymotrypsin
was present as an equilibrium mixture containing monomers,
dimers, and trimers.
Figure 30 is a typical sedimentation pattern obtained
from purified PAO (3 x crystallized). Only 8 single, rather
symmetrical peak is seen. From the above discussioa on
Gilbert's th~ory and the extension of Rao and Kegeles and in
keeping with the earlier conclusion drawn that plasma amine
oxidase is an associating-dissociating system, it seems highly
probable that PAO consists of an equilibrium mixture of mono
mer and dimer or of monomer, dimer, and trimer. No decision
can be made at this time between the two possibilities since
extensive molecular weight studies were not carried out, but
this might be the subject of future research on thie enzyme.
The conclusion that PAO is an interacting protein system
existing in rapid eqUilibrium might now be used to explain
some of the earlier puzzling observations. In the attempt
to dissD~iat~ PAO by acid or alkaline dialysis, it was noted
that the sedimenting boundary of the test solution was
, ~
I}
Figure 30. Example of a typical sed~entation pattern of purified plasma amine oxidase.Enzyme was thrice-crystallized from ammonium sulfate. Protein concentration9.27 mg/ml. Solvent 0.06 M phosphate buffer, pH 7.0. Specific activity 571.Sed~entatien is from left to right; speed 59,780 rpm; temperature 22.50 c.Standard 4° single sector cell. Bar angle 550 ; photographs taken at 11.11,19.11, 27.11, 35.11, and 43.11 minutes.
~~o
75.
sharper than that of the control solution. If we consider
PAD at pH 7 to contain appreciable quantities of eon~er ~nd
higher polymers. then this polydispersity is reflected in the
greater boundary spreading, due to the fact that the boundary
is a site of continually readjusting equilibria. The revers-
ible polymerization of PAO might be pH-dependent with the
interactions occurring more pred~inantly at the pHs around
neutrality, as in the case of lysozyme, which undergoes a
reversible association between pH 5 - 9 (Sophianopoulos and
Van Holde, 1964). If only a single species were present at
the more acid and alkaline pHs, this would explain the sharper
peaks, and the lower sed~entation coefficients might reflect
the decrease in s20,W with concentration that is typical of
most proteins suffering hydrodynamic effects.
D. A§§9ciatiQn Stygies
1. Th§ Effect 9f Stprage pn PAD Actiyity
In a preliminary investigation by Gee (1963), it was re-
ported that PAO associated to give rise to a 14.0 S polymer upon
dilution to approxtmately 0.5% and storage at 40 C. It was de-
cided to reinvestigate this phenomenon in more detail in an at-
tempt to relate loss of activity with polymerization of the
enzyme. For this purpose, fresh enzyme was prepared and, im-
mediately after final crystallization, two solutions of approxi
mately 1% and 0.5% concentration were made up in 0.06 Mphosphate
buffer, pH 7.0 and stored at 40 C. The activity of each fraction
was determined at appropriate intervals by the standard assay pro-
cedure.
76.
T~ble IX relates the percent of original activity (Specific
activity 480) remaining at different time interv~lSe Figure 31
is a graphical represent~~ion of ~his cl~~~. A qualitative inter~
pretation of the data was that the activity of PAO slowly decreases
upon storage and this decrease was more pronounced in the more pro
nounced in the more concentrated sample, i.e., the 1% solution
loses its activity faster than the 0.5% sample. How this might
be related to association of the enzyme is discussed at the end
of this section.
The same two samples used for the activity study above were
examined in the ultracentrifuge 1mmediately after preparation and
after three weeks and eight weeks storage. Figure 32 shows the
ultracentrifuge patterns obtained from the 1% solution. The
ultracentrifuge patterns from the 0.5% solution is shown in Fig-
ure 33. Comparison of the two figures seemed to indicate that the
1% solution gave rise to more polymer formation than the 0.5%
solution stored for the same length of time. Initially at ·zero·
storage, there appeared 8 single, fairly symmetrical peak with
both samples. s20,W values calculated were 9.86 and 9.58 S for
the 1% and 0.5% samples respectively. After three weeks, the 1%
sample showed a slight shoulder to the right of the major peak,
indicating the presence of 8 higher molecular weight fraction.
No corresponding peak was observed in the 0.5% sample. (Sedi
mentation coefficients were not calculated for these patterns).
After eight weeks, the 1% sample showed three somewhat distinct
TABLE IX
THE DECREASE OF PAO ACTIVITY UPON STORAGE
77.
DAYSSTORED
%ORIGINAL ACTIVITY OF1% PAO SOLUfION
%ORIGINAL ACTIVITY OF0.5% PAO SOLUfION
0 100.00 100.00
4 98.09
7 93.42 96.18
15 92.80 94.90
21 88.89 98.51
35 89.91 94.06
46 80.04 88.54
56 69.14 94.06
71 67.28 76.86
Figure 31. The decrease of PAO activity upon storage. 0.5% and 1.0% PAO solutions in 0.06 Mphosphate buffer, pH 7.0, were stored at 40 C. The activity was measured at intervals by the standard assay procedure. (..a .d ) 0.5% PAC solution; ( o-_.(D )
1% PAO solution.
78.
o
o(\J
o<.0
o['-
o(J
o(J)
I Ir\;
/ 100I
II
I <J 0/ l"-
II
I 0I lO
<J I 0I 0
I WI 0 CCI L()
K] 0I-(f)
0~
(f)
>-0
<Cr<) 0
AlfAf1.8'1 l\1NI9~~O J..N3J~3d
_••_~_....__._.~.-;___ __ rneNLtI
Figure 32. The association of PAO upon storage. I. Storage of PAO in 0.06 Mphosphate buffer,pH 7.0, at a concentration of approximately 1% (10.71 mg/ml) at 4° C. Sedimentationis from left to right; speed 59780 rpn; temperature 22.50 C. Standard 40 singlese~tor cell. Bar angle 55°.a. Control (Zero storage time). Photographs taken at 8.67, 16.67, 24.67, 32.67~
and 40.67 minutes.b. After storage for three weeks. Photographs taken at 8.52, 16.52, 24.52, 32.52,
and 40.52 minutes.c. After storage for 8 weeks. Photographs taken at 8.57, 16.57, 24.57, 32.!),7, and
40.57 minutes.
..
--"
79 .
Figure 33. The association of PAO upon storage. II. Storage of PAO in 0.06 Mphosphate buffer,pH 7.0, at a concentration of approximately 0.5% (5.52 mg/ml) at 40 C. Sedimentationis from left to right; speed 59,780 rpm; temperature 22.50 C. Standard 40 singlesector cell. Bar angle 450 •
a. Control (zero storage time). Photographs taken at 8.77, 16.77, 24.77, 32.'77, and40.77 minutes.
b. After storage for 3 weeks. Photographs taken at 8.49, 16.49, 24.49, 32.49, and40.49 minutes.
c. After storage for 8 weeks. Photographs taken at 8.48, 16.48, 24.48, 32.48, and40.48 minutes.
•
,.~
- ~.
d
-;--
80.
81.
boundaries and the 0.5% sample also showed three possible peaks.
These latter peaks were present in a much lower concentration 9
judging from the size of the boundaries. s20,W values calculated
for the peaks were 9.67, 14.26, and 19.23 S for the 1% sample and
9.30, 11.62, and 20.44 S for the 0.5% sample.
3. Oiscu§sion of the Results
From toe results of the effect of storage on PAO, it would
appear that there is some correlation between the loss of ac-
tivity and the association of the enzyme and that the concen-
tration of the enzyme solution stored is a significant factor.
In contrast to the assumption of Gee (l963) that dilution of PAO
and storage lead to association, the present studies give evi-
dence that increased concentrations lead to greater association
and that the increased association leads to a lower activity.
The s20,W values of the boundaries after eight weeks are
possibly indicative of the presence of monomers, dimers, and
trimers in the system. Theoretical sedimentation coefficients
for a dimer and a trimer species may be calculated from the
following equations:
sd/sm = {2Ml /Ml )2/3 = (2)2/3 =1.587;
/ { / )2/3 (3)2/3St sm· 3Ml MI· • 2.080,
where sm' sd, and St are the sedimentation coefficients for the
monomer, dimer, and trimer respectively, and MI is the monomer
molecular weight. The equations are derived from the relation
ships of the molar frictional constant (Svedberg and Pedersen,
1940) and the basic assumption here is that these molecular
82.
species are spherical in shape. Using a value of 9.23 S for the
monomer sedimentation coefficient (Yamada ~ ~.9 1964)9 the
calculated theoretical sd and St values are 14.65 and 19.20 S
respective1y.
A comparison of the theoretical values with the measured
sedimentation coefficients show that they are quite similar and
the components present in the aged samples might indeed be mono
mers, dimers and trimers. The question at hand is whether this
assay is a reflection of the original composition of the solu
tion, since it was found that PAO at pH 7 exists as a reversibly
associating system of either monomers and dimers, or monomers,
dimers, and trimers. Ageing of the enzyme might have altered
the equilibrium so that partial resolution of the components was
accomplished under the ultracentrifugal field. In a situation
where the equilibrium rates of the forward and reverse reactions
are comparable, but very small in magnitude, all species might
be expected to be seen in the u1tracentrifugal pattern (Schachman,
1960). On the other hand, the association to monomers, dimers,
and t~imers upon ageing may have no bearing on the reversible
interaction of PAO and may be a phenomenon unique to the de
naturation of the enzyme.
From the parallel studies at the different concentrations,
it appeared that the association is a mass-action effect, with
more polymer being formed in the more concentrated sample. The
more enzymatically active form appeared to be the monomeric
species, evident from the activity studies. The 0.5% enzyme
83.
solution which contained a smaller amount of the associated forms
retained more of its activity than the 1.0% solution which re
vealed greater polymer formation when stored over identical peri
ods of time under the same conditions.
84.
IV. SUWAARY
An investigation has been made of the association-dissociation
propeEties of beef plasma amine oxidaseo The high molecular weight
reported for the enzyme and some other previous studies indicated that
the enzyme might be composed of subunits. The usual methods employed
to break down non-covalent linkages proved to be unsuccessful as re
vealed by ultracentrifugal patterns of the treated enzyme. Only the