N O T I C E THIS DOCUMENT HAS BEEN REPRODUCED FROM MICROFICHE. ALTHOUGH IT IS RECOGNIZED THAT CERTAIN PORTIONS ARE ILLEGIBLE, IT IS BEING RELEASED IN THE INTEREST OF MAKING AVAILABLE AS MUCH INFORMATION AS POSSIBLE https://ntrs.nasa.gov/search.jsp?R=19810010492 2018-07-14T10:56:36+00:00Z
Transcript
N O T I C E
THIS DOCUMENT HAS BEEN REPRODUCED FROM MICROFICHE. ALTHOUGH IT IS RECOGNIZED THAT
CERTAIN PORTIONS ARE ILLEGIBLE, IT IS BEING RELEASED IN THE INTEREST OF MAKING AVAILABLE AS MUCH
Vortex-Lattice Model for Augmentor Wing/Flap System
General description
Rr Vortex layout
Boundary condition
Forces and moments
Jet Model Including Jet Wake
General approach
Diffusor region
Downstream region
Method of Solution
THEORETICAL RESULTS AND COMPARISONS
Panel Layout on Surfaces
Chordal plar:es
Symmetry
Number of horseshoe vortices
Layout of Jet Boundaries and Blockage Panels, and JetInduced Velocities
':fy Layout inside diffusor
input velocities for jet model
Wake centerline locations and spreading rates
Blockage panels layout
Velocities induced by jet model
Predicted Velocity Distributions at Diffusor Exit
Force and Moment Comparisons
CONCLUDING REMARKS
--^ REFERENCES
FIGURES 1 THROUGH 12
PageNo.
1
2
4
6
6
6
7
a
9
10
10
1'1
15
17
19
19
19
19
20
21
22
23
25
25
26
28
29
32
34
THEORETICAL ANALYSIS Or AN AUM%.NTOR WING
I FOR A VTOL FIGHTER
by Marnix F. E. Dillanius and Michael R. Mendenhall
SUMARY
All analytical method has been developed for predicting forces and
moments aof,inq on
avgmentor wings in hover or forward flight for pre-
scribed ejector jet characteristics. The method is based on incomprov-
siblo, potential ;Clow theory. Attached flow is assumed. Two potential
flow models are incorporated in the prediction method: a model for
the
wing/flap system And a model for the jet and its wake. A throo-dimoll-
sional nonplanar vortex lattice is laid out on the chordal planes of the
augmentor wing components. Vlap surfncoo and het can be at; largo anglet-,
to the oncoming stream. 11orsushoe vortex strongths are dot armined from
the application of the flow tangancy condition at
points on the surf^ices
inclmdinu interforance offocts from the
JeL Thu jet is made to expand
from t11o, primary 1)0 ,zvlcs to the
ditfusor exit, and a distribution of vor-
Iticity is placed on the jet boundary to model ontrainmont. In addition,
blockage panels are positioned on the boundary of thu jc?t wake downstream
of the
augmentor wing. Jot, wake centorlinc location and spreading rate
are taken from experimental data. The solution proceeds in an iterative
manner using the two glow models in sequence and comparing the predicted
diffusor exit velocity wiih the specified velocity.
Experimental data involving VTOL fighter-type augmentor wings are
not readily available, liowuvor, some comparisons are shown using data on
a V/STOL transport model in forward flight. Good agroamont is shown at
low thrust Settings, ror high thrust scttings, the present method over-
predicts the overall lift and drag and underpredicts the pitching moment.
The discrepancy is at least partly attributable to the attached flow
assumption.
7
XNTRODUCTION
There has boon an increasing Interest in tho devOlOPMent of VTOLhigh performance aircraft. Ono concept urea to achievo VTOL capabilityis tha ougmentor wing. Xn this concept, the propulsion system iq into-
grated with the lifting nurfacon for generating direct Litt. T110 aug-
mentor wing of interasL hore consists of a fixed wing with it set oflarge flap surracou at Lho trailing co- o which can be dericatea ,It largeaaagl to guide and conLrol the engine exhaust gas. The gas or primary
Jet omanat es, from nozzles aL the trailing edgo of the oonter finppositioned above the forward and aft flaps, douigned to form a diffusoror ejector -system, In this proQesn, the jot elitrainS secondary airdrawn ilito the diffurior and 11axes, with
it rovulting in in augmuntation
in mass flow. As a rosulte the ovorall thrust is larger, than the primarythrust go.noraLed by tho engine exha"st divertod from tho 011g no Lo theau9montor wing. Vurthormoro, adelitional lift is ganorated by the winganO flap systom clue to intorforonQo effects induced by tho augnionLudjot rlov?t
The objective of thin report it, to describe an analytical mathoddovelol,)ed for the prediction of tho exLornal aerodynamic; ehar-acLoristics
of tin auqmontor wing for specified jot voloQitIes at the primary jotnozzle and the diKrusor oxit. Flow conditions include hover and forwardflight. This efftrt is a necessary procur.9or to
the prodiction or the
longitudinal aerodynamio fog cts and moments acting on a complote VTOL-
typo fighter aircraft with ont., or more augmentot wing systems. Tho workperformed during thim, Phase Was funded jointly by NASA and NAVAIA.
Several analytical methods based on jot-, flap theory have belon
developed to analyze wind-on performance of auqmentor wings. Two-diman-sional approaches are given in reforencas I through 4. The thill jotflap theory is not a realistic mode for the "thieX," augmantor wingjets. Bovilaqua, reference 5, presents a two-dimensional analysis for
the static (wind-off) case using a viscous solution for the flow through
the diffusor and an inviscid solution for the external f-low. The Viscous
inner flow solution Is based on
a turbulence kcinatic energy model to
account-. for mixing. Very recently, the inner solution was axtanded toaccount for hypor-mixinc,T nozzles (ref. 6) • novilaqua I s methods can pre-
dict details of tho jot-, flow inside the diffusor includiag average jet
velocities at, tho exit of the diffusor.
2
Tile pro-solit mothod is directed towards the three-dimensional case
of a winq with swoop and Lapor having a highlydorloctod t thick AugmQlltor jet. it is desirable # as well, to account
for spanwiso variation of tho Jet width and
jet, Velocities for a
,rOZlliSL*!0 thrOO-dillIOnSiOlIal. WISC. The approach consists of do-joloping
models for the wing-flilp System and hose aspects Of tile augmentor jet
that aro required to properly mode-1 the interference Qtfeots of W10 JUL
on the wing-flap loadirtI. Tile details or the flow inns We thin augmotitorand the Mixing of the primary
and secondary flows are not addressed,
and the aug"'OntOr Jet characteristics are assumed to be prt.)sOribod
initially in torms of parameters which yii:l1d the primary jot Velocity
and the mixed flow volociLy at the ejector. exit. Potential flow mot hodsare employed, and no flow separation oil the wi ng or 1'141i stirfaces isassumed to ocour.
RecentLy, a Navy ficIhLar proLOty1V eMploying all auqmenLor canardand W 11 1 war; built and testaid. It is dosignaLed XVV-122 and is describedin mCoronec 7. No test data is readily avc-lilable rot this configuration.
The basic features, including t1vi augmentur wince systems, arc indicated
in fig'-M 1. X11 order to evaluate tile methods and p •ovido Some C:0111-
parj,sons with data, calculIti011S W01-0 Made oil it roctan1 jular, finitu-
aspect-ratio V/STOL transport conriguration for which wind tunnel data
arc available (rCf. 8). Unlike the fighter configuration, the transport
04 wing 114MI; a short chord and high Lhickmoss ratio and the flap sagiAt-ints
also have high thickness ratios. A cross saction of the configuration
is shown in figure 2. Results are presented on this configuratioil, and
Jdiscussion is presented oil the flow ,,md load characteristics as
nated by the comparisons between prediction and data.
.Wm
i
I -M3
U.
SYMBOL$
AR aspect ratio
b width of jot measured perpendicular to jet center
CAaxial force coefficient, axial force/qS l,,, ( figure 3
Cm piLohing moment coefficient, pitchincj momont/q$RBF tlW l figure 3
C N normal force coefficient, normal forco/qS AUI figure 3
C jot momen t um coefficient, eqn. (9)
avoraile wing chord
aerodynamic force vector
t t;, reference length, ''REP
M mass flow rate
III p
jet mass flow rate at Jut exhaust
Ms entrained air mass flow rate
n vector normal to surface
q dynamic pressurei'+
resultant flow volopity vector
9 length along jet centerlineS V reference area
T thrust force
VC0free stream velocity
v flow velocity
x f y 1 z wing coordinate system, figure 3
a angle of at-tack, degrees
S flap deflection angle:, degrees, figure 24T vortex vector with strungth V
vorticity strongth/unit length
thrust augmentation ratio
nondimensional length along jot centerline
4
SYMBOLS (Concluded)
CG center of rravity
jet centerlina
U diUusor exit
I initial (at center flap exhaust nozzle location)
jet
^j
5
-A
TECHNICAL APPROACH
The basic objective of the analytical method is to represent the
solid surfaces of the augmentor wing by a distribution of lifting-typo
singqlaritias for the
purpose of calculating aerodynamic loads including
jet interference effect.,-,. To this end, the jot must be roproscntod by
suitable singularities front its origin to some distance: downstream of the
diffuser in order to model the jot induced effects. A nonplanar vortex
lattice is laid out on the augmentor wing components, Thin lifting sur-
face m000l, is basically a modified form of the vortex lattice approachdescribed in reference 9.
The vortex distribution used to modal the
Jets its length
is an adaptation of the Jot niodol use in
the work
described in references 9 and 10. In addition, tho jot wake (jet down-stream of the diffusor exit) makes use of blockage panels
on its bound-
ary. This part of the jet model is an
extension of the blockage panel
scheme described In reference 11.
Tho lifting surface and jet models have boon programmed and are
used in sequence to form nn iterative approach to the calculation of the
made that flow ontrainniont by the primary jot is such that the flow at
the diffusor exit is completely mixed. This condition, to a first
approximation, in approached in practice when hypor-mixing primary
nozzles are employed in conjunction with limited boundary layer blowing.
In the following sections, brier descriptions are given of the lirt-
ing surface and the jet flow models. ALtontion will be focused on the
special features developed to apply the flow models to augmentor wings.
The Iteration scheme is described in the section concerned with the
method of solution.
Vortax-Lattice Model for Augmentor Wing/Flaps System
Gonaral description.- The vortex-lattice lifting-surfaca model used
to represent the solid surfaces is a modified version of the model used
in reference 9. Configurations of interest in that reference compriseexternally blown flaps attached to the trailing edge of a wing.
In the
present investigation, the computer program of reference 9 was extendedto handle flaps typical of augmentor wing/flap systems, as shown in
6
figures 2 and 3. Bach component is covered with horseshoe vortices on
its moan surface. The trailing legs of tho horseshoe vortices are
ziada
to lie in # nnd extend to infinity in the piano of each surface, However,
the trailing logs of th ,) horseshoe. vortices on the wing (or that surfAcQ
of the augmenLor winq ahead of the forward flap) are. hunt at, the
wing
trailinq edge so that they lie in the plane of the forward flap asillustratud in figure 3.
The wing/flap, geometric parameters and flow conditions takenaccount of in the pr000nt methods are summarized below. More detailed
descriptions are given in reference J. The wing may Yavo
• finite span
• breaks in sweet) of the leading and trailing edges• uniform dihedral over the span• taper set by leading- and trailing-odge, shapes0 twist and camber
• zero wing thickness only
Up to 10 41,lzp surfaces can be
accounted for. The description of
the planform of the flaps is governed by the following geometric char-
actoristics.
• partial span
a straight leading- and Lrailing-odtje shaped over the spantaper, set by loading- and trailing-odgo sweeps
• root chord in
plane parallel to vertical or x-z plane, seefigure 3
tip chord must- lie in a vertical plane parallel to the verticalplane containing the root 7,hord
• twist and camber
• zero flap thickness only
effects of angle of sideslip and compressibility are not i,11cluded. Angle
of attack, flap deflection angla t dihedral angle, twist and camber angles
are accounted for in the flow tangoncy condition using trigonometric
functions since some of these angles can be large.
Vortex layout.- A few horseshoe vortices and the reference coordinate
system (x,y,z) are shown in figure 3 for a tapered atiginontor wing/flap
system with swept leading- and trailing-edges. The flaps are set at
large deflectiol, angles typical of hover and transition flight. An4
7
------------
augmentor diffusor section Is formod, by the forward And Aft flaps. Thnchordal planes of tho wing, cantor flap # and diffuoor flaps are divided
in'to uvapozoidal area olomonts or panels. on the forward flap, tho
app,nwiso distribution of the panels must be
WIQ asumo as on
the wing. A
horseshoe vortex is placed in each panel such that the Lound (or apanwiva)leg lies along the panel quarter 0ord
and the trailing Iogs lie along
the side edges of the panel. Tho, trailing logs extend back to infinityin tho plane of the panel except for tho horsQahoe vortices on the wings,The legs originatinq
on this surface trail back to the trailing edge
and are than bunt to lie in tho plane of the forwi- rd flap, in fact, thewing trailing logs will coincide with the trailing lofts oC tho horseshoevortices on the forward flap. Pigure 3 shows ona horsoshoo vortex onlyon the chordal planes of the wing, forward flap, center flap and aftflap. On the
forward flap the trailing logs ass-)ciatod with the
wing
vortices are shown slightly separated from the
trailing leg gy; of thehorseshoe vortices of the forward flap for the purpose of clarity. Thestrengths of the horsonhoo vortices, unknown so fad:, are obtained trcm
the fl,)w condition dencribod next.
T^!ri flow L ►ngency boundary condition is appliedat control points located it the midspan of the
throo-quartor chord line
of each aroa element or panel, DeLaila are given in reference 9, pages
9 through 14, A brief account only i:^ given here. Some control points
arc -ndicatod on figure 3. Designate the total rasultant v(., loci Ly
vector at one control point as and the normal to the surface inquestion as 11, then the boundary condition states
4 .).
q . 11 = 0
for the finite set of control points. With no jet. pror=t # velocity ;^
includes contributions from all the horsICS1100 vortices laid Out Over theaugmentor wing surfaces and the free stream component.
The velocity
components induced by the horseshoe vortices are related to the
unknown
vortox strengths through. the use of influenoe functions given in rof-or-
once 9. The functions associated with horseshoe vortices on
the wing
account for the effects of the angle of deflection of the trailing logs.
In the application to augmentor wings, velocity contributions induced by
the jet singularitics are included in equation (1) for the purpose of
accounting for jot interference. A later section concerned with the jet
8
modol describes the mothod used to gonorato tho jet induced velocitycontributions, Noto that the free stroam componont represents theflight condition ,. hover (zoro velocity) I transition or forward flightinonzoro) ,
The application of the flow tangency condition, equation (1) j at,the control points distributed over the chordal planas Of the augmantorwing surtacos resultu In a sat of simult-anaoun equationo from which theunknown vortex strengths are obtained. Once the strengths are }mown,the aorodynamic forces and moments acting on the augli*1entor wing compo-nents are calculated "Inq Lhe method describe(! noxt. At, this stage itis also possible, to compute, at any field pain::, the flow field inducedby the horseshoo vortices roprosunting the surfaces of the augmentorwing.
Forces and moments.- The aerodynamic forces acting on one elementalarea or panel can bu dotorminod from the application of the itut La—Joukowski law for forcou noting on a vortox filament. The fundamentalstatements are Vivoii in reference 12. This approach lias been usedsuccessfully in rcfarenqos 9 and 10 and others, Detailt'; of the applica-tion of the vortex filament, force mothod are discussed in roforonce 9#pages 17 and 10. A summarizod account only will be given here.
The nerodlynamic force acting oil a vortex filament per unit lengthof filament iz expressed as the victor product of the volocity of theflow (I pasL t-ho vortex of strength 11.
r a 9
X (2)
Contributions from 4.11 horse,shoe vortices laid out over Lho ;Wgmentorwing colAlpollents, froo stream and jet induced contributions are included
in t1le calculation of q. The C-1cmantal I)MICI force calculated Vith
equation (2) can be used to compute spariwise load distributions by eum-
min( over all the panels and overall pitching moments are determined byusing the panol forces times the 4ippropriate moment: arms. The result;include normal force, axial force and pitching moment coefficients. The
directions of the normal and axial force ooeffin.ients, C N
and CA
respectively, are shown in f igura 3.
4
Jot Model XnclUdinq Jot Wake
The analytical singularity distribution choson to represent theexternal induQod, effects of than Jot is doscribed in this section. TheJot, oxhuusting from the trailing edge of the contor flap (tiguro 3),is diviOcd into two distinct rug ions for modeling, The first roVion isthat portion of tho Jot from its exhaust nozzle to than of the dif-fusor. Secondary Jan are not included in the present analysis. Thesecond region is the remainder of the Jot from thu diffuser exit to itschosen end point at a finite distance downstroam or the exit. Thefollowing is a description of Lho details of this Jot model.
General a22roach.- The objoctivo of the Ju l; modal is to reprosontthe induced oxternal flow effects of the Jot, ignoring the details ofthe mixing flow inaido the dif-runor anu the internal flow of the initial
region of the Jot. The basic flow modal used as a starLintj point for ',:he
required jet modal is that of in
actuator disk which can be Used to
roprosqnt a jet of fluid with higher velocity and higher total hood thantho wa3.Mulid'.419 fluid. ThiS flow modal Maas been ut-oed to rop,=Daont theexternal flow field induced by the wake from a turboj qt or turl)Qfanengine (rots. 9
and 10). In reference 9 1 tho development of the flow
model for oircular and elliptic cross section jets is described, and in
reference 10, the extension of this model to a rectangular cross section
jet is presented. Tho latter rectangular Jot modal is the most appropri-
ato model for the application -to augmentor wings.
They singularity distribution for an actuator disk is a
semi--infinite length cylinder with a uniform distribution of vorticity
on its surfaerr (rof. 13). Two characteristics of this model are a
uniform velocity profile inside the jot; and an increasing mass flow with-
in the boundary over the initial few diameters of length. This modelhas been extended to expanding boundaries, various cross sectional shapost
and bent conterlinoo for use as a turbojet wake model. in making those
modifications t the analytical singularity modal of a uniform vorticitydistribution on a semi-infinite cylinder was changed to a finite length
distribution of vortex rings. This change was necessitated by numerical
difficulties in calculating the induced velocity field associated with
the singularity distribution for curved jets, and more details of thischange are presented in reforenco 10.
10
_-_77
The above mentioned singularity distribution will be adapted to the
current problem of developing a jet model for an augmentor wing. Down-
stream of the augmantor, the jet should behave as a free jet and thus
can be handlod in the same manner as the previous jet wake models. Theupstream region of the jet model, in the diffusor region, is quite dif-ferent from previous jet models. For the case at hand, the jet exhaustsfrom a very high aspect ratio slot nozzle at the trailing edge of the
center flap and expands very rapidly to fill the diffusor. in thisprocess the jet entrains air drawn into the diffusor. The assumptionis made that tho jet and entrained air are completely mixed and fill thediffusor exit. The rates of expansion and entrainment of secondaryfluid by the jet are much larger than typi6al free jet rate., bucause of
the enhanced mixing over the relatively short length of the diffusor,Therefore, a now flow modal is required
in this region. This is describedin the following socticns.
Diffuser region.- This port-ion of the jot model, between the cantor
flap trailing edge exhaust nozzle and the and of the diffusor section,
is quite different from the jet models described in references 9 and 10.
The major difference is the high rate of expansion of the jet boundario2i
due to the mixing in the diffusor. In actual practice, the mixing process
is enhancod by the use of hyper-mixing nozzles and boundary layer blowing
on the inner surfaces of the diffusor. The entrainment rate of the
jet
is therefore much higher than that of a free jet because of the mass
augmentation effect of the diffuser. In this context, the fluid entrained
by the jet is assumed to be the entire amount of secondary fluid; that
is, the entrained flow is the
difference between the total mass flow at
the diffusor exit and the jet mass flow at the primary nozzle.
The boundaries of the jet in the diffuser region are shown dashed
in figures 3 (and 6). Since the present model is not concerned with thedetails of the internal flow, the idealized boundaries are prescribed by
straight line segments as shown. The only requirement is that the jet
model expand to fill the exit at the and of the diffusor. The initialportion of the jet is sized to match the a e;tual cross sectional area of
the jet nozzle at the center flap. The short length of nonexpanding
boundaries near the trailing edge of the center flap, shown in figures
3 (and 6) is included to give the analytical jet model an initial run
length to build ap to the correct jet velocity. This length is typically
11
t
four or five times the minimum cross sactioi-a dimension, in this case,
the width of the
jet. since details of the actual jet in T, use diffusor
arc unknown, the jot boundary is specified to expand linearly to the
exit of the diffusor after the initial run length, and the centerline
of the jot is positioned approximately midway betwef-.,n the forward and
aft flaps. Tho spanwise dimension of the jet is assumed constant;
thoroforc, the
width of the jot is the only changing dimension. Thisresults in a decreasing cross-seetion aopocL-ratio along the length of
the jet in the diffusor. A schematic of the jet model, to be used later,
is shown in figure 4(a).
I,rha distribution of
vorticity, y, along the length of -the jot
boundary is datermined in the following m rtnner. The initial vorticity
P.trongth at: the primary jet novvlo is spocifted from the
known value of
primary nozzle mass flow velocity v, , to be
YJ = V j I (3)
This vor4ioity rtrungth por unit length remains constant in the:region to give the contorlina volocity an opportunity to stabilizfj at thecorrect value. Since the Jot model does not attempt to model the dis-
tribution of velocity inside the diffusor., the
next point at which jet
magq r, flow is known is at the
diffusor oxit. At this station the vor-
Licity stron(JUI por Unit length is Specified to be
Y t = V
j 1,(4)
w)iere vj ,,, is t he flow velocit the total as with
th total mass flow at
the and of the diffusor.
The distribution of vorticity botwoon the initial and exit valueswas examined using two different methods. The first me •hod is a linear
variation of
strength between tl,e two known valUo ,,I . The local vorticity
strength is given by the relation
2 - IE,Y = Y, - S
-!-
_ S
S 1: 11 Y1 Y
as illustrated in figure 4(b). This distribution was abandoned after
some preliminary calculations. The discontinuity in the slope of the
strength curve at each end caused certain difficulties in the calculation
12
of the induced volocitiom inaiaQ tho jet I)oundary. The indttooa voloc-it.ias on tho contarlino could not stabilize at tho aivrot)riata initial
and exit val`ies because of the rapid change, in
vortex stranUth owurrinV
tit tho becjinninq and and of the linear region.
The second approaCh to WIQ Specific4tiOn Of the
Vorticity between
Y1 and y L, users a ninth-ordor polynomial distribution. It is definod asw.
Yt 9 0 7 6 4 3 2
b r, q. 0 t, •1 , a t e + f 4 + U1, 3 + 11
where S S
tic raquirQ that the first three doriVIUVLIS Of with roSI)L'Ct to t,Y1 Y)",
Sao, ""aro at S " S I rind the fi:I uL six deriva4ivos be
zero at S - SJ]"*
In
this way, the vortiuity is concentrated towards the Jet exhaust. This
is nocesuary Lo mo0ol Lhe high joL-flow velocity at tho exhaust 11ozzle
and allows for high antrainmaxiL mates Over
the lon(jth O-C the (liffusor.
Lquation (6) becomes
Y 0 7^o- " ".- oL = 8111 634 36^YI - YL"
mbs smooth contorlino velocity distributions otwean S I randwhichliroduco b
SL for any valuo's of yI and YL
ConLora.ino. volocity distlx,ibutions for two LhvusL levels Lira shown
in f ipro 5. rrom the and
of the initial rogion of thu, jet to the and
of the diffusor region, the volootity is vary smooth and wall behaved.
Th ^qion is typical of tic rLsu tse predict-elocity in Lho initial rLotl. v
obtaino(l with this jet model.
Mato cotutont can ))o- includod , it this time regarding th('.^ possibility
of calculating the strength of tho vortioity distributian which will
,cifie tl velocity distribution. i ) ro I wasproduce a $p (, s V11 p ac I
ox,1111i llud with
success. If the expansion of the jet is moderate,
-sofor e.xamplo, if b2 :: 4b I (b is the jet width) I than
this invu I. pro-
codure works very well. It does havo the disadvantage that Volocitios
11ju-,L be specified at a large number of points on the contarlinu, but -this
can be handlod by curve fittinq or assuming a distribULi011 Of volOcitio.".
13
When the expansion is much larger # numerical difficulties arise which
provent a rcAsonable solution for the vorticity strengths. Those dif-ficulties stem from an i11 conditioned matrix
in which the diagonal
terms are not dominant. The results indicate an orratia distribution
of vorticity which do not produce a realistic external velocity field.For this reason, this approach was abandoned in favor of the method
employing the ninth-order polynomial distribution.
Downstream rQq ion.- The portion of the jet model in the region
downstream of -Lha diffuser exit is troated as a free jut wake. The
length of the jot is chosen to be sufficiently long so that any furtherincrease
in length does not affect appreciably the flow velocities pro-
dictod by the
job model at the exhaust nozzle and the diffusor exit.
The vorticity distribution on the wake boundary is hold constant at the
value y. specifio(3 at the and of the diffusor, Which is the requirement
for a free jet model (ref. 10) . The remainder of the jet is specified
in a manner similar; the ,̂,.)rocodure presented in reference 11.
The Wake Cross Section i rectangular over the entire length of tho
wake, but tho boundary is allowed to oxpand according to availableempirical information. 11olding the span of the Wake constant, the
spreading information contained in reference 11 is applied to tho wake
width. The effect of an expanding boundary does not have a large effect
on the induced loading on the wing and flap surfaces; therefore, this
approximate approach for setting the spieading rate is considered
adequ,.'o for the current investigation.
The path taken by the jet after it leaves the end of the diffusormust be spot ,ficd with respocL to the location of tho diffusor exit.This is done using empirical information on the path of a rectangular jet
in a crossflow (ref. 14). Small differences in the centerline path do
not croato large difforonces in the induced loading on the lifting sur-
faces; tIIQrQfOr0, based on the success of a similar approach in refer-
ence 11, the empirical data of reference 14 are used for all calculationsincluded in this report. The jet wake boundaries are shown in figure 6afor the case vj./V. = 4 and in figure 61.) for vj,./V. = 1.4.
The final component of the jet Wake model in the downstream region
is the blockage model. it is well known that a jot exhausting into a
crossflow behaves as if the jet boundary is nearly a solid surface. Toapproximate this effect-, the surface of the Wake is represented by a
14
finite number of vortex quadrilateral panels with a control point at the
panel controid as shown in figure G. The boundary condition of no flowthrough the control point on each
panel results in a
set of simultaneous-,
equations. The volocity to be canceled at the blockage panel, control
points consists of a contribution of the free stroam to which aro added
the perturbation velocity components induced by the vortex lattice on
the wing/flap system with power off. This has the effect of
allowing
the blockage panels to be porous to the fluid ontrained by the distrj,bu-
Lion of vorticity modeling the wake (as wel=l as the jet) . It also takes
account, in the first approximation, of the effects caused by the aug-montor wing on the jet wake. The blockage panel or quadrilateral vortexstrengths are than determined from the s. mulLanoous equations. Vcloc-itios induced by the blockage panels will be included in the calculationof the power-on horseshoe vortex strengths of the wing/flap system
at a
later stage.
Method of solution
The flow models discussed above have been iraplentented in cotiputor
programs which are arranged to be used in a sequential mannnr. Thisarrangement was found to be convoniont in the iteration scheme used toarrive at a solution. in a series of steps, the vortex lattice and jetanalysis are applied as follows;
Stop 1. The vortex lattice analysis is applied to the augmentorwing surfaces without- jet induced effects in the boundary,
condition. The power-off horseshoe vort-,o\ strength.,,, are
determined. Volocitics inducod by the horseshoo vortices
at the control points of the blockage panels tirecomputed.
Stop 2. The jet wake conterline and boundaries are located.
Blockage panel strengths are calculated using velocities
induced by the power-off horseshoe vortex lattice with
strengths determined in stop 1. At this point the block-
ago portion of the jet wake modal has boon. modeled. The
blockage--induced effects at the control points on the
wing/flaps surfaces are calculated and will be used in a
later stow.
i^
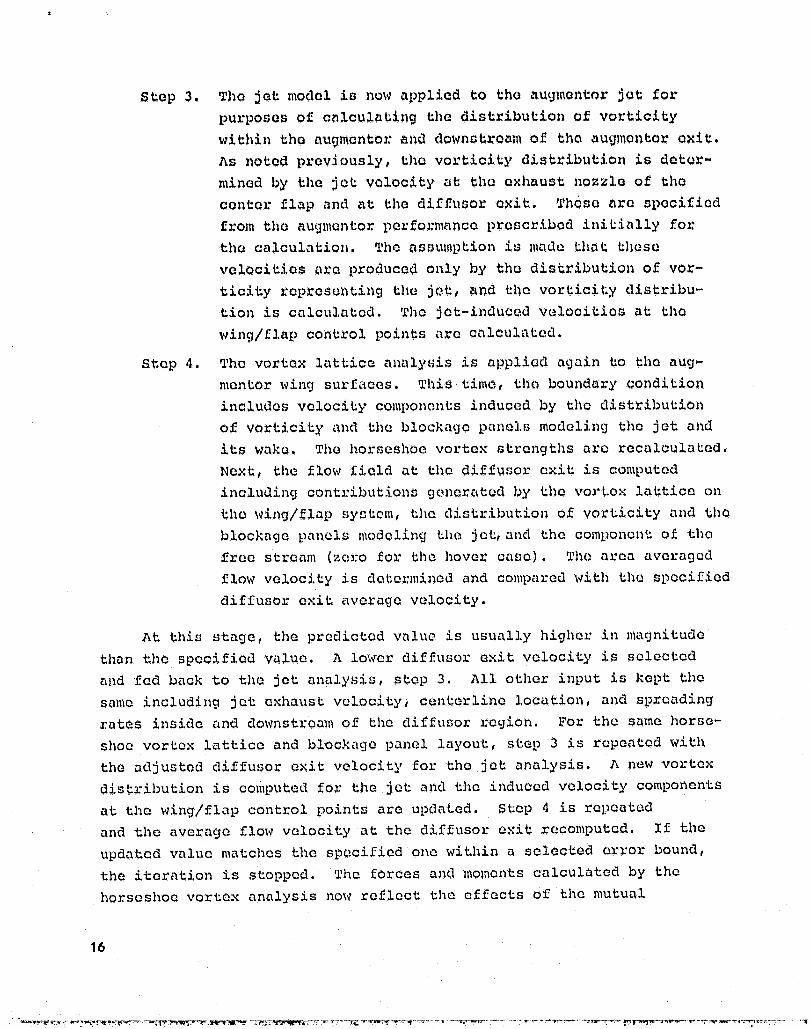
Step 3. The jet model is now applied to the augmontor jet for
purposes of calculating the distribution of vorticity
within the augmentor and downstream of the auUmentor exit.As noted previously, the vorticity distribution is dater-
mined by the jet velocity at the exhaust nozzle of the
center flap and at the diffusor exit. Those are specified
from the augillentor performance prescribed initially forthe calculation. The assumption iu made that those
velocities are produced only by the distribution of vor-
ticity representing the jet, and the vorticity distribu-tion is c alculated. The jet-induced velocities at the
wing/flap control points are calculated.
Shop A. The vortex lattice 4nalyclis is applied again to the aug-mentor wind surfaces. This time, they boundary conditionincludes velocity components induced by the distribution
of vorticity and the blockade panels modeling the jet and
its wake.. Mica horseshoe vortex strengths area recalculated.
TIo:xt, the flow field at the diffusor exit is commuted
including contributions generated ))y the vortex lattice onthe wing/flap system, the distribution of vorticity and theblockage panels modeling thoa Jet, and the componen t. of thefree stream (zero for the hover case). The area averaged
flow velocity is determined and compared with the specified
diffusor exit average velocity.
At this stage, the predicted value is usually higher in magnitude
than the specified value. A lower diffusor exit velocity is selectedand fed back to the jet analysis, stop 3. All other input is kept the
same including jet exhaust velocity, conterline location, and spreadingrates inside and downstream of the diffusor region. For the same horse-
shoe vortex lattice and blockage panel layout, step 3 is repeated with
the adjusted diffusor exit velocity for the jet analysis, n new vortex,
distribution is computed for the jet and the induced veloc i ty componentsat the wing/flap control points are updated. Step 4 is repeated
and the average flow velocity at the diffusor exit recomputed. If the
updated value matches the specified ono within a selected error bound,
the iteration is stopped. The forces and moments calculated by the
horseshoe vortex analysis now reflect tlae effects of the mutual
interference between the jot and the augmentor wing surfaces and the
effect of the free stream. The overall forces and moments are calculated
as the sum or the contribution from the jet itself (thrust at the exhaust
nozzle) and tho contribution from forces acting on the horseshoe vortexlattice representing the wing/flaps systom.
It should be noted that the spocifiod velocities at the exhaustnozzle (at the trailing edge of the center flap) and the diffusor exitshould
be for the actual flow conditions at hand. As such, the specified
diffusor exit velocity deduced from experimental data (or directly
moasu ,_,ud) is already representative of the presence of the augmentor wing
surfaces and capccially the effects of the actual jet wake. Therefore,as long as the iteration scheme described above results in a predictedflow velocity at the diftusor exit that matches the specified value,the location and shape of the jet wake is not of primary importance inthe calculation of the forces and moments. in other words, under theseconditions the jet wake has a small effect on lords. The region of thejet inside the diffusor, through its large entrainment effect, is mainly
rosponsible for the interEerenco effects of the let on tho aerodynamic
loads acting on the augmentor wing surfaces. Finally, it is noted that
this procedure not: only produces the correct mass flow at the center flapnozzle exit and the diffusor exit, but the correct secondary flow enter-
ing the diffusor.
THEORETICAL RESULTS AND COMPARISONS
Partially due to the newness of the augmentor wing concept andpartially for proprietary reasons, vary limited experimental data
involving augmentor wing configurations are in the public domain. in
particular, component loading and pressure distribution data on
a VTOL
fighter-typo configuration such. as shown in figure I are practically
unavailable. There is probably more data available for static (zero
forward velocity) conditions. Even though the methods described in this
report can handle the static (or hover) case, it was more important to
test the methodology with forward flight conditions because of the
emphasis placed on developing a lifting surface modeling scheme ., account-
ing for jet intorference effects, applicable to VTOL fighter-type aug-
mentor wings in flight.
17
The only data made available to test the au9montor wing analysis de-
scribed herein involves the wind tunnel transport model of reference R.
This model is shown in figure 7. A cross section of its rectangular aug-mentor wing system is indicated in figure 2 for a set of flap deflootionangles representative of transition conditions. Inherently, this IlAodol
does not resemble a VTOL fighter type, figure I t in that the augmentor
wing system is unswopt and thick in section. Compared to the stroamwise
flap lengths, the forward or wing part is extremely short. In addition,
the model employs a fuselage with considerable cross section area atypical
of a VTOL fighter. Purthermore, figure 2 shows secondary jet 1102zlCls On
the forward and aft flap components. In VTOL fighter configurations, these
jets serve to control the boundary layers on the diffusor walls formed by
the forward and aft flap surfaces. The
amount of engine exhaust divorced
to the secondary nozzles may vary. For the transport model under consid-eration, the size of the secondary nozzles in the forward
and aft- flaps
indicate that appreciable amounts of exhaust air could be diverted to them.
References 8 and 15 do not contain information about the division of flowbetwoon the primary and socondary nozzles.
in spite of the somewhat unsuitable geometric characteristics of tile
wind tunnel model doscribed -Above and the uncertainty in the division of
flow between the primary and secondary jet nozzles, the, thooretical methods
were applied to this configuration for preliminary verification and to
point out the usefulness of the methods for indicating areas of improve-
ment, in the preliminary design stages of augmentor wings.
ff .
In what follows, the layout of the horseshoe vortices on the surfaces
of the augmentor wing under consideration is described. Then, based on
tho as sumption that the flow out of the secondary nozzles is small com-
pared to tha flow from the primary nozzle, the jet centerline and boundary
positions are specified and the blockage panel layout is given for two
power settings. Some of the calculated flow fields induced by the vortex
lattice alone and jet alone will be shown. They are the results of the
intermcdiate steps described in the section entitled "Method of Solution".
As a result of the iteration, the adjusted diffusor exit velocities input
to the jet model are given, and. final velocity distributions calculated
by the present method at the exit: are shoan. Finally, comparisons are
made between the predicted and measured overall forces and moments.
18
wy
Panel Layout on surfaces
The horseshoe vortex lattice layout on the surfaces of the augmentor
wing for use
in the comparisons with data obtained with the transport
model shown in figure 7 will now be described. As can be
soon on that
figure, tho model includes a fuselage and a tail section. The former
will only be
partially accounted for by the present method but the latter
(horizontal tail) is roprosented by an Additional horseshoe vortex
lattioo to ba solved simultaneously with the vortex lattice on the sur-
faces of the augmontor wing. Thus, as far as the model components are
concerned, th y: augraentor wing System And
horizontal tail will be handled
by the prosont mathodn including an approximation for the lift carried
over on to the fuselage. glow conditions include zero Angle of Attack
and two forward flight speeds.
Chordal planes.- The wing, forward flap, center flap, and aft flap
components of the
augmentor wing system, shown in figure 2, are idealized
to the
choidal plane representation shown in figure G. The wing/flap
components are extended through to the fuselage centerline to account for
body lift carryover. However, the jet is made to span only over the
exposed wing/flap region and the effects of the jet are felt by the sur-
faces in that region only (i.e., no jet effects are included on
the part
of the augmentor wing surfaces inside the fuselage). In this way, the
lift carryover onto the fuselage is accounted for to first order for both
power-on and power-off conditions. At the present time, the methods can-
not account for the effects of the fuselage (Beskin upwash) on the aug-
mentor wing surfaces. Therefore, flow conditions including nonzero angle
of attack introduce uncertainty with the present method when a fuselage
is part of the configuration under consideration.
Symmetry.- It should be noted that because of geometrical and flow
symmetry about the vertical plane through the fuselage contarline, only
one half of a given configuration need be covered with a vortex lattice.
In fact, the transport wind-tunnel model under consideration here is a
half model mounted on the tunnel wall for the same reasons.
Number of horseshoe vortices.- For all comparisons discussed later,
the augmentor wing surfaces on one side of the vertical plane of symmetry
will be
treated as follows. In the chordal plane of the wing of the
rectangular wing/flap system, shown in cross section in figure 6, 11
19
0
A
horseshoe vortices are laid Along the span and throe along the chord. on
the forward flap, the spanwiso number is the same but four horseshoe vor-t1ces are laid out on the chord because of the longer length involved.On the center flap,
the spanwise number is also 11, and threw arc placedalong the chord. The aft flap, with the longest chord length, is coveredby 11 spanwise and five chordwiso horseshoe vortices. As A consequenco,there are 33 horseshoe vortices on the wing, 44 on the forward flap, 33on the center flap and 55 on the aft flap. Note that the trailing logsof the horseshoe vortices on the wing are bent at the wing trailing odgeto lie in the chordal plane of the forward flap. This construction isalso indicated for the one horseshoe vortex on the wing of the generalaugmentor wing systom of figure 3. Finally, the horizontal tail is
covered by an a"uitional horseshoe vortex lattice consisting of fivevortices along the span and throe along the chord. Thus, a 'total of 180horseshoe vortices represent the augn-iontor wing/flaps rand horizontal tail.
Their strengths are determined from one sat of simultaneous equations as
described in an earlier section.
Layout of Jet Boundaries and Blockage Panels,and Jet Induced Velocities
For the case at hand, the jet and jet wake are to be modeled for two
power settings usin^j. the method described above in the section concernedwith the jot model. The power; settings are expressed as the thrust- orjet momentum coefficient, C t ^ r associated with the jot at the exhaustnozzle located at the trailing edge of the center flap. The assumptionis made that the secondary nozzles have negligible effect.
C 11 ;= q S
TMv.
i l
REP 4SREF
In the above expression, T is the thrust force produced al- the trailing
edge of the center flap, M is the mass flow rate and, vj I is the exhaustnozzle mass flow velocity referred to earlier in equation (3). Com-parisons with experimental data from reference 8 will be discussed for
C o = 1.5 and 7.31. Note that due to syiiunetry, the effects of the jet ontho opposite side of the vertical plane of symmetry must be accountedfor. At the present time, the mutual interference between the left andright jets is not included in the analysis.
(9)
20
Layout Insida diffusor.- Consider the chordAl plane representation,shown in figure 6, of the rectangular augmontor wing of figures 2 and 7.The boundaries of the portion of the Jet inside the diffusor formed by theforward and aft flaps is indicated by the dashod line in figure G. it isbased on the procedure described earlier concerned with the diffusor, region.The "oxit" location is defined by the location along the straight jotconterlina whero , the jet boundaries reach their maximum width, This posi-tion is also marked on figures 4(a) # 5 and 6. RLrerring to figures 6(a)and 60)), the coordinates of the contorline and the width b of the jet in-side the diffusor are the same for both power settings and are specified
below. For the jet on
the left side of the plane of synutiotry, the goo-
metrical characteristics are given in the following table.
respectively. Density at tho diffusor exit was taken equal to freestream don p l.f--y. The diffusor exit velocities, v- E (shown above), requireknowledge of the secondary or entrained mass flow rai , t*.' nos and primarynozzle flow rato m.. Reference 15, page 687, contains a curve relatingthe mass flow ratio, m./m P , to the, thrust augmentation ratio. The thrust
augmentation ratio, ^, is given in reEcronce 8, enclosure 20, for the two
thrust coefficients listed above.
The above mentioned mass flow rates are for the actual flow conditions
at hand and include the affects of Jot flow issuing from the primary and
secondary nozzles. The average diffusor exit velocities are determined
I
22
4 .
from those data. Thus, even though the analysis assumoo that all the
exhaust gas is diverted to the primary nozzloe the use of the Abovo exitvelocities guarantees that the monsured 4mount of entrainment isaccounted tor in the present method.
The values givon above for the jet velocity At the primary nozzleexit and the diffusor exit will be used in the determination or, the dis-
tribution of v^rticiLy in accordance with equation (8) As noted earlier
in the section describing the stopwiao mothod of, solution, the
diffuser
exit velocity will require adj"stmant during the successive jot cal qulA-tions in the iteration process. The values given in tho above table forthe two power settings will be used as the iniLi4l choice.
Wake cantorline locations and s preading rates.- ror the case aL hand,
the empirical procedure described in an earlioar section under the headingh Downstroam, region" is applied.
The Jot cantorline location is obtained
for tho two diffusor exit velocity ratios shown in the
previous table
from equation (1) of
reference 14, which is based on oxporimontal datA.
The aspect ratio of the Jot in a crossflow, associated with the cite reference is tour, whereas
the aspect ratio of the augmantor jet: is
approximately seven. Therefore, the centerlino paths obtained for tho
two power settings using tho data of reforenoo 14 are only approximate.
However, in accordance with the arguments given at the end of the section
entitled "Method of Solution", the
coordinates of the jet aft of thee
section need not be very accurate as long as the dif-fusor exit
velocity used in
the prediction sahemo, is dirootly measured or deduced
from data for the
cont-iguration and flow conditions at hand.
The cross section of the jet wake is rectangular. Proceeding down-stream, tba width of the waka expands but the dimension in the SpanWise
direction is hold constant. This latter asg.tmption should be
suffi-
ciently adequate for the largo aspect ratio (AR r-- 7) of the augmentor Jet
under consideration. Reference 11, giguro 9 1 contains information from
which the expansion rates are obtained for the two diffusor oxit veloc-
ity ratios indicated in the previous table for the two power settings.Note that the remarks
made above with regard to the accuracy apply to
the expansion rates as well. The following tables contain the coordi-
nato-W of the conterlino and the width of the jet wake for the two power
settings. Quantity b is the width of the jot wake. Figure 6 shows" the
coordinate syntem and the jot wake on thu left side of the plane of
23
-W
symmotry in accordance with the coordinates given .in tho tables below.
For bath power oettNizygs, the spanwise extse nL of the jet: and its wakeis X42.37 cm (56. 06 in.) .
24
Blockage panels layout.- The length of the jet wake (measured along
the centerline) is taken as approx,^mately three times the chord length of
the forwaT:d flap, see figure 5. Calculations presented in reference 9 in
connection with externally blown flaps indicate that greater jet lengths
produce very small changes in aerodynamic loadings at the expense of
additional computer time. The blockage of the jet boundaries is modeled
).)y quadrilateral vortex panels described as follows.
on the front and rear faces of the jet wake, ten blockage panels are
laid out in the spanwise direction and seven panels in the lengthwise
direction. The sides of the jet wake are covered with four blockage
panels in the direction normal to the centerline and seven panels are laid
out in the lengthwise direction. Thus, the boundaries of the jet wake on
the left hand side of the plane of symmetry are covered by 196 panels. To
preserve symmetry, the same jet wake and its singularity layout is posi-
tioned on the right hand side of the symmetry plane.
w. The velocity field to be counteracted by the jet wake blockage panels
is shown in figure 8 in a vertical plane for part of the jet length. in 3
accordance with step 1 of the section headed "Method of Solution", the
'' 3 flora velocities are generated by the vortex lattice Laid out on the sur-
faces of the augmentor wing and include the free stream velocity. The
- flow vectors indicated in figure 8 are calculated by the vortex lattice
descri.boi earlier in connection with the horseshoe vortex paneling layout
(180 horseshoe vortices) on the lifting surfaces. Flow conditions are
} _ zero degrees angle of pttack and zero power setting. Note that the flow
velocities at the blockage panel control, points are directed downwards.
-- Since the vortex lattice and blockage panel strengths are solved for i
,a - separately, the flow field soon by the jet wake should be generated by
the horseshoe vortices as influencsad by the jet. As a first approxima-
tion, the power-off horseshoe vortex strengths are used and in the
succeeding steps of the iterative approach the blockage panel strengths
are kept constant. This constraint can be relaxed and the flow field
impressed on the jet wake recalculated once the jet singularities are
known. At this time, for thca sake of economy the former approach is
adopted.
Velocities induced b y jot model.- In order to provide some under-
standing of the entrainment properties of the jet, it is instructive
to discuss briefly the flow field induced by the jet model at points
25i
A
on the components of the
augmontor wing. For tho jcL centerline and I)ound-
ary locations divert in the above tables, the induced flow .Gold in a planeparallel to tile X-2 plane for the higher (C 7. 31) power set-zing is shownin f ic,jurQ J. The. directions of the flow vectors at the control points onthe forward and aft flaps and the
diffusor entianco indicate strong
inflow or entrainment towards the initial or narrow part of the jet nearthe trailing edge of
the center flap. in addition, the
flow inside the
jet at the diffusor exit is fairly uniform and the average velocity ratio
(vj E,,/V,O) at the diffusor exit is about 3.8. Note that at this stage the
effects of the horseshoe vortices are not included in the diffusor exitvelocities.
ProdioLod Velocity Distributions at Diffusor Exit
Tho augmentor wing of -the transport model shown in figure 7 (andwith more detail in figure 2) is modolod by the panaling layouts and ,jet..
model spooified above. The
stopwise, procodure described ill all earlier
section entitled "blothod of Solution" is than applied. At the and oftile first pass through that procedure, the flow velocities across thediffusor exit are computed as the sum of the vortex lattice and jet-
sintj ularitios-induced volocities added to the free strazim. For bothpower settings, the predicted velocities at the exit were highor than
the zpacifiad average flow velocity. In accordance with step 4 of thesolution pr000dure, the diffusor exit volocity, serving os one of thevolocity inputs to the jet model, is reduced and the jet model rerun(stop 3). The adjusted jet singularity strengths and induced volocitias,such as shown in figure: aro than used in stop 4. At the end of stop4, the diffusor exit velocities are calculated again and compared withthe spociried average flow velocity. When the prodictod average diffusorexit voloAty mat chess (to within a certain margin) the specified one,the solution is considered to be converged.
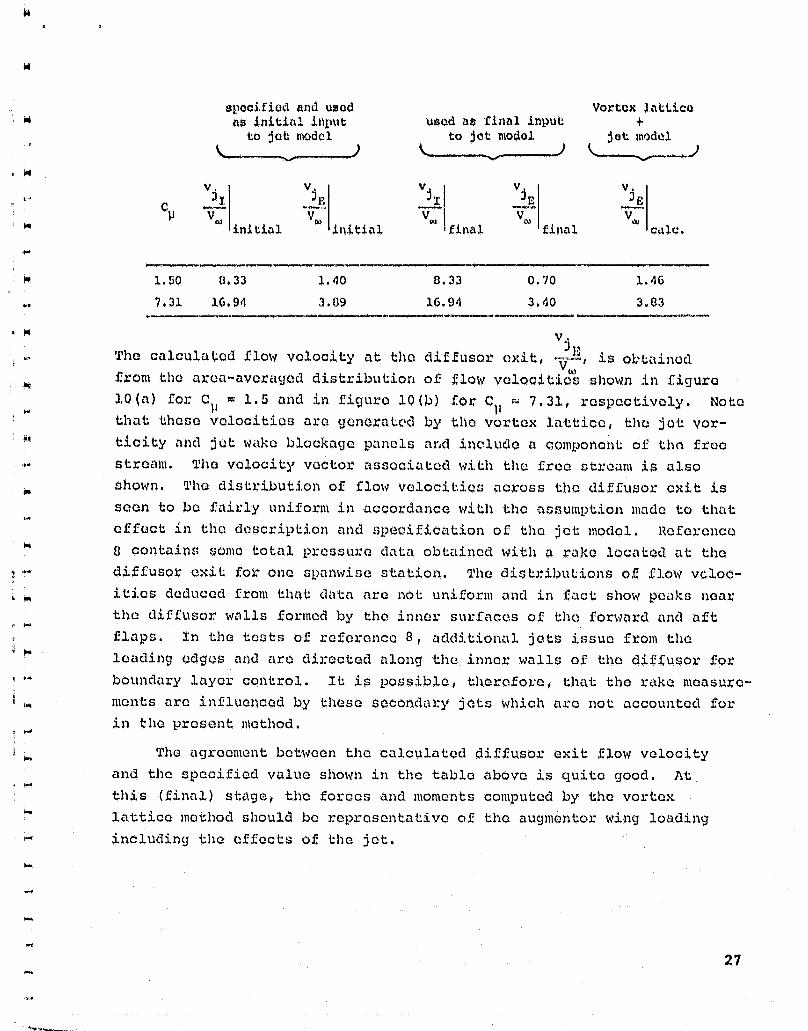
For tile C R 1.5 and 7.?I power settings, the following table con-tains the final input velocities for the jot model and t)io average ofthe predicted and specified diffuser exit velocities. The last Cluan-titics have been dis-cu.ssed earlier in the section entitled "Layout ofJest 13oundaries and Blockage Panels, and Jot Induced Volooitics".
26
W
specified And used Vortex 1atLiceas initial ij)put used as final input +
diffUsor exit, is obtainedfrom the area-averaged distribution
of flow velocities) shown in figure
10 (a) for C It = 1.5 and in figure 10(b) for C11 = 7.31, respectively. Notethat -these velocities are ganaratod by the vortex lattice, the
Jet vor-
ticity and jut wake blockage panels and include, a component of tho free
stream. The velocity vector associated with the free stream is also
shown. The distribution of flow velocities across the diffusor exit is
seen to be fairly uniform in accordance with the assumption made to that
effect in the description and specification of the jot model. Reference8 contains some total pressure data obtained with a rake located at the
diffusor exit for one spanwise station. The disO.-i).)uLions of flow veloc-
ities deduced from that data are not uniform and in fact show peaks near
the difEusor walls formed by the inner surfaces of tho forward and aft
f laps . 1 1, the tests of reference 8, additional jets issue from the
leading edges and are directed along the inner walls of the diffusor for
boundary layer control. It is possible, therefore, that the rake measure-ments are influenced by these secondary jets which are not accounted for
in the present mothod.
The agreement between the calculated aiffusor exit flow velocityand the specified value shown in the table above is quite good. At
this (final) stage, the forces and moments computed by the vortax
lattice mothod should be ropros onta Live of the augniontor wing loading
including the effects of the jet.
27
7^ 1 4
Force and Moment Comparisons
Lift, drag and moment coefficients are shown as a function of
thrust or jot momentum coefficient C ,, in figures 11(a), 11(b), and 11(c),respectively, for zero angle of attack. The open symbols are valuesmeasured on the complete configuration shown in figure 7 for the sat offlap deflection angles specified. The closed symbols represent calcu-
lated values for C 0 - 0.0 # 1.5 and 7,31, obtained with the paneling lay-
out and jet specification described above for the same flap deflectionangles. Only the augmentor wing and horizontal tail surfaces are
accounted for in the present method; therefore, any effects from the
fuselage on the
aerodynamic loads are not included in the calculated
vallies. As far as the drag is concerned, the theory calculates the
induced (due to lift) drag contribution only.
At the zero and lower (C. = 0.0, 1.5) power settings, the agreement
between measurement and theory is good. At the highest moment cocffi-
cient (C11 = 7.31) the lift and drag coefficients are overpredicted and
the pitching moment is underpradicted. overall, the predictions show
similar trends as the experiment for increasing thrust coefficient.
Reference 8 contains a few chordwiso pressure distributions for one
spanwise location for the selected flap settings. 1Spacially at the
hiVher power setting, flow separation is indicated on the center and aft
flap. The experimental pressure distribution along the upper surface of
the wing and forward flap components (see figure 2) indicate strong
suction pressures aft of the secondary nozzle. Similar behavior is
indicated at the loading edge of the aft flap on the surface ahead of
the secondary nozzle. Those observations and the nonuniform measured
total pressure across the diffusor exit discussed earlier seem to indi-
cato strong blowing out of the secondary nozzles. This behavior makes
itself felt more strongly at the higher power setting since the total
pressure distribution at the diffusor exit is shown to be more uniform
for the C )I = 1.5 case. Thus, the partial separation and the strong
effects of the secondary nozzles at
the higher power setting (C. = 7.31)
may account for the discrepancy between theory and expni^iment for that
condition.
When interpreting the aerodynamic forces acting on the individual
flap surfaces of the augmentor wing system, it is often helpful to
analyze the flow field in which these components are immersed. The
28
present method is capable of determining these flow fields. If, for a
given wing/flap segmant,the oncoming flow field is at a large angle to
it, partial flow separation over that surface would be expected to oct.'ur
and subsequent loss of lift may result.
As an example of a flow field around the
augmentor wing at the
some
flap deflection angles, consider figure 12. Plow vectors are shown
for
the case of zero power. It is soon that the wing , is subjected to anaverage upwash of about 15". The cant-or flap is immersed in a flow field
at about 90 0 to it, and is likely to suffer from flow separation and itsconsequences on "lift". It is interesting to note that the aft flap is
immersed in flow largely aligned with it thus reducing its lift effec-
tiveness. Upstream of the forward flap, there appears to be a low veloc-ity recirculation region. Note that at as much as two chord lengths
upstream, strong interference off-cots are predicted by the present method.
CONCLUDING REMARKS
A method has been developed for determining the external aero-
dynamics of VTOL fighter-type au9montor wings in hover or transition
flight for prescribed ejector jot characteristics. Spocifically t the
flow velocity at the primary nozzle and an average velocity at the dif-fusor exit must be prescribed for the flight condition at hand. Theaugniontor wing may have swoop and taper. The method is based on Poton-tial flow theory and attached flow is assumed.
Basically, horseshoe vortex lattice thoory is u sed to represent- the
solid surfaces of the augmentor wing components. Effects of the jet arerM
included in the flow tangency condition. The jet is modolod by a dis-
tribution of vorticity on its boundary. In addition, blockage panels
pre placed on the jet boundaries downstream of the, diffusor exit. Insidethe diffusor, the jet model. is made to expand from the primary nozzlewidth to the full width of the diffusor exit as seen in SideVieW. The
jot model accounts for entrainment of secondary air. ror given primarynozzle and diffusor exit jet velocities, the aerodynamic loadings acting
on tho augmentor wing are obtained as the result of an iteration scheme
which produces a calculated average diffusor exit flow velocity to match
the specified one in magnitude. The iteration scheme consists of aserial application of the vortex lattice and jet model methods.
A
W
29
Experimental data suitable for testing the
developed theoretical
methods are scarce and/or very difficult to acquire. Solna comparisons
with experimental data taken with a V/STOL transport model equipped with
an unswept and untapored augmentor wing are shown. This configurationis not representative of a VTOL fighter
in that the streamwisa sections
of the augmentor wing components are very thick and it al)poars that the
division of exhaust gas flow between the primary nozzle and secondary
nozzles is not representative. At the present time, the method can only
accommodate a primary jet issuing from the trailing edge of the center
flap located above the diffusor. Consequently, the assumption was made
that all the angina exhaust is fed to the primary novzlo. The actual
transport model was idealized to chordal plane representations of tile
augmentor wing components and horizontal tail. Lffects of the fuselage
are accounted in part only. With these simplifications, the present
method calculates lift, drag and pitchinc,I moments which agreed well with
the experimental data at low power settings. For the higher power
setting, the lift and drag are overestimated and the pitohing moment is
undorostimated; however, the predictions show the same trends as cxpori-
ment for increasing thrust.
With all the engine e:,haust assumed to emanate from the primary
nozzles, the total entrainment by the single jet is made to be the same
as in the case when the power is divided into primary and secondary
nozzles. As a result, the calculated overall forces and moments should
be representative but detailed inforination such as component loadings
require more knowledge about the flow division.
Notwithstanding the above mentioned limitations, the usefulness of
the present method includes the capability of indicating potential prob-
lain areas during preliminary design of an atigniontor wing system. The
developed methods can be used to map the flow field in the vicinity of
the augmentor wing for do-tormining interference on other components of
the aircraft. In addition, the flow field impressed on each of the flap
surfaces of the augmentor wing system can be analyzed so that secondary
nozzles for boundary control can be positioned and sized on the basis of
that knowledge. Furthermore, the present method, can be applied to an
existing configuration for which component loads have been measured. 13y
comparing the coinponenL load prediction with measurement, components
suffering from flow separation and stall can be identified and remedies
affected.
30
on the basis of the work performed so far, the following rocoittmon-dations are offered.
1. To validate the present method further, additional compai- 4, soils
should be mado with available data for different: flap nottings
Bind nonzero angle of attack. Component load comparisons should
be made. The majority or the engine exhaust should be aVpliodto the primary nozzles for comparison Purposes.
2. Detailed data should be taken with it XVV-12A typo augmentor
wing and made available for testing the developed method.
3. Used on the outcome of I and 2, the single augmontor wing
system model can be improved by sLudyin(j effects of different:
jet boundary layouts and jot vorticity distributions (affecting
entrainment) inside the diffusor. Also, the effects of the jot
wake on overall and component loads should be determined.
4. It is possiblo to circumvent the specification of experimentally
doduv.od jet valucities at the primary nozzle and the diffusor
exit. Detailed inturnzil flow analyses have boon developed also-where (ref. 6) capable of generating the required quantities
for Lho jet model of the present inet.hod.
S. The prosent method can be extended to account for more than one
jot, i.e. to handle secondary jets and account for the associ-
ated Coanda effects on the aerodynamic loads acting on the aug-
mentor wing components. The applicable technology has been
developed in connection with USB (Upper Surface Blowing) work
described in reference 10.
G. The present method can be extended to account for augmantor
canard/augmentor wing systems attached to a fuselage, accounting
for mutual interference between the canard, wing, and fuselage.
Nielson Engincering & Research, Inc.Mountain View, California 94045
December 1978
31
REFERENCES
1. Spence, D. A.: The Lift on a Thin Airfoil with a Jet AugmentedFlap. Aeronautical Quarterly, Vol. 9, August 1958.
2. Spence, D. A.: The Lift Coefficient of a Thin Jet Flapped Wing.Proo. of Roy. Soo., of London, Ser. A, Vol. 238, No. 1212, Dec.1956, pp. 46-68.
3. Wilson, J. D., Chandra, S., and Loth, J. L.; Thrust Augmented WingSections in Transition Flight. AIAA Paper 75-169, ann. 1975.
4. Wilson, J. D., Loth, J. L., and Chandra, S.: Thrust Augmented WingSections in Potential Flow. West Virginia University, TR-25, Aug.1974.
5. Bovilaqua, P. M., I)eaoode, A. D.: Viscid/Inviscid InteractionAnalysis of Thrust Augmenting Ejectors, Interim Report, ONR-CR212-249-1, Feb. 28, 1978.
6. Bovilaqua, P. M.: optimization of Hypormixing Nozzles. Paper givenat the ONR-NAVAIR Contractors Review. Nov. 28-29, 1978. Proceedingsto be published.
7. Lewis, E. L., CDR.: XFV-12A, Thrust* Augmented Wing (TAW) PrototypeAircraft. Paper given at the Workshop on Thrust Augmenting Ejectorsheld at Ames Rosearch Center Co-sponsored by NASA/Antes, NADC andAFFDL, June 28-29, 1978, Ames Research Center t Moffett Field, CA94035.
8. White, E. R.: Experimental and Theoretical Analysis of AuqmcntorDiffusor Effectiveness oil Transport Model (TPA 210, Task 0010).Rockwell International internal Letter 511-38-75, March 1975.
9. Mendenhall, M. R., Spangler, S. B., Nielsen, J. N. and Goodwin,F. K. : Calculation of tho. Longitudinal Aerodynamic Characteristicsof Wing-Flap Configurations with Externally Blown Flaps. NASACR-2705, Sept. 1976.
10. Mendenhall, M. R. and Spangler, S. B.: Calculation of the Longi-tudinal Aerodynamic Charactoristics of Upper-Surface-Blown Wing-Flap Configurations. NASA CR-3004, .1978.
11. Perkins, S. C., Jr. and Mendenhall, M. R.: A Cotrelation Method toPredict the Surface Pressure Distribution oil an Infinite Plato fromwhich a Jet is Issuing. NASA CR-152,160, May 1978.
13. Kilchemann, D. and Weber, J.: Aerodynamics of Propulsion. McGraw-Hill Book Co., Inc., 1953.
14. Thames, F. C. and Weston, R. P.: Properties of Aspect Ratio 4.0Rectangular Jets in a Subsonic Crossflow. AIAA Paper No. 78-1508,Aug. 21, 1978.
32
t "
1
RDFrIU-'LACES (Concluded)
15. Stewart V. R. , Whi.te, E. R. , and Palmer, W. T .: AerodynamicAnalysis of an Integrated V/STOL Thrust nugniontor Lift System Con-cept. Proceedings of a workshop held at Institute for DefenseAnalysis, Arlington, VA, July 1975. Prediction Methods for JetV/STOL Propulsion Aerodynamics, Vol:.. II, Editor: M. F. Platzer,Naval Postgraduate School, MonLorey, CA.


![Crossing Patterns in Nonplanar Road Networks · 2017. 9. 20. · 2.1 Nonplanar road networks The past work by Eppstein et al. [8–10] has attempted to model nonplanarities in planar](https://static.documents.pub/doc/80x56/60233b10005dce45f42b39c2/crossing-patterns-in-nonplanar-road-networks-2017-9-20-21-nonplanar-road-networks.jpg)


