1 This document was created for a Masters of Education Thesis written by Amanda Freedman Tétrault. If you have any comments, insights or suggestions, please contact me at [email protected]. I appreciate your feedback. The Natural Step The Four System Conditions In the sustainable society, nature is not subject to systematically increasing: 1. concentrations of substances extracted from the Earth's crust, 2. concentrations of substances produced by society, 3. degradation by physical means and, in that society. . . 4. people are not subject to conditions that systematically undermine their capacity to meet their needs. A huge thank you to the piloting teachers Kirsten Morris, Kim Hartikainen and Rowland
Transcript
1
This document was created for a Masters of Education Thesis written by Amanda Freedman Tétrault.
If you have any comments, insights or suggestions, please contact me at [email protected].
I appreciate your feedback.
The Natural Step
The Four System ConditionsIn the sustainable society, nature is not subject to systematically increasing:1. concentrations of substances extracted from the Earth's crust,2. concentrations of substances produced by society,3. degradation by physical means
and, in that society. . .
4. people are not subject to conditions that systematically undermine theircapacity to meet their needs.
A huge thank you to the piloting teachers Kirsten Morris, Kim Hartikainen and Rowland Haywood for their assistance and great teaching!Thank you to Alphonse Tétrault for the French translations.
Lesson 1 Global water distribution & water consumption 8-04-03 4
Lesson 2 Sustainability and The Natural Step
8-0-78-0-88-0-9
14
Lessons 3-5 Heat capacity & characteristics of water
8-04-028-04-038-04-05
16
Lessons 6-7 Ocean Currents 8-04-04 30Lesson 8 Water Consumption 8-04-03 49Lesson 9 North American Drainage System 8-04-07 52
Lessons 10-11 Global Water System 8-04-06 68
Lesson 12-15 Erosion, Flooding & Tides
8-04-088-04-098-04-108-04-118-04-128-04-13
74
Lesson 16 Cutting water consumption by 50% 8-04-03 95
Lessons 17-20 Acquiring and disposing of water 8-04-148-04-16 98
Lesson 21 Who Polluted the Red River? 8-04-15 131Lesson 22 Water for the World 8-04-14 141
Lessons 23-24 Waste Water 8-04-17 170Lessons 25 and
on Change Project 8-4-188-4-19 176
3
Water Systems
3characteristics of salt & f reshwater
18 management of water resources
2 heat capacity & dissolv ing
4 f actors that af f ect ocean
currents
8 water af f ects land
10 tides af f ect shoreline
9 wav e, ice erosion
19 design to solv e water-related
problem
6 water cy cle
14 sources of drinking
water
17 pollution
15 treated water
16 waste water
7 North American drainage sy stem
12 f looding
13 prev ent f looding
11 human interv entions to prev ent erosion
5 water af f ects regional climates
Grade 8 Water Systems
Essential Questions
What are the various ways humans impact water and how do they
attempt to fix what they have damaged?
How does the global water
cycle function?
How does water affect land and how do
humans attempt to alter its path?
What are the unique characteristics of fresh and salt water and how do they affect the Earth's climate?
How does the North American drainage system function?
How can we teach about water from a
sustainability focus?
4
Lesson 1Stage 1 – Desired Results
Established Goals: 8-4-03 Compare and contrast characteristics and properties of fresh and salt water. Examples: freezing point, density, dissolved materials, global distribution, relative amounts, biologically diverse components of each… GLO: D3, D5, E1Understandings:Students will understand that…water is a shared natural resource and there are concerns regarding availability and distribution.
Essential Questions:How do we learn about water from a sustainability focus?
Students will know… The limited amount of water that humans actually have access to.
Students will be able to…Estimate the amount of water as a resource they have use and compare that figure to actual .
Stage 2- Assessment EvidencePerformance Tasks:Students will participate in the introductory lesson on the world’s distribution of water.
Other Evidence:Exit slip: students will hand in an exit slip that reflects on the new knowledge that only 0.03% of the world’s water is actually available for human consumption.
1 litre of waterSalt (34 grams/approx. 2 Tbs)Blue food colouring1000 ml graduated cylinderOne eye dropperStudent worksheet
Background InformationAlthough 75% of the Earth’s surface is covered in water, only a very small fraction is available for human use. Of the water that is available to us, some become contaminated from human actions, such as toxic run off from agriculture, factories or pollutants that we dump in the water supply from our sinks at home. Population growth over the past 30 years has caused demand for water to double in about half the countries in the world. Residents of areas with rapidly growing populations, as well as citizens of other countries often experience a water shortage. In the following activity students will gain an appreciation for the limited amount of water actually accessible and the need to conserve it.
Stage 3 – Learning PlanWater, Water Everywhere Activity (adapted from Population Connection Student Activity 10, used with permission).Prior to lesson:
Fill 500 ml container with sand Fill a one-litre with water, add 4 drops of blue food colouring and stir Label the other 5 containers: one-litre= oceans, 500 ml = polar ice, 500 ml = deep groundwater,
500 ml = freshwater, 500 ml=other Make an overhead of attached BLM Have 34 grams of salt measured (just less than 2 Tablespoons)
LessonSet out the 7 containers Lead a class discussion on the following questions:
How much of the planet is made up of water? Record a prediction. What percentage of that water do humans have available to them for their use? Get students to
write down their prediction Use a graduated cylinder to distribute the one liter of water into the five empty containers according to the percentages indicated in the figure. (For example, 97.1 % of the water on the Earth is found in the oceans. Because one litre contains 1000 milliliters, 97.1 % of one litre is 971 milliliters. Therefore, pour 971
5
milliliters into the container marked “oceans.” 2.2% is polar ice, .1% is other [saltwater lakes, soil & atmospheric moisture, glaciers], 0.3% deep ground water, 0.3% freshwater [rivers, lakes, shallow ground water]).After you have filled the empty containers with the appropriate amounts of water, continue with the demonstration as follows:a) Add 34 grams of salt (just less than 2 Tbs) to “ocean” container; this will match the salinity of the water sample with the salinity of the earth’s oceans (3.5 percent).b) Place the plastic “polar ice” container in the freezer (or put it aside).c) Set the “other” container aside. We do not have access to this water.d) Pour the “deep ground water” into the container of sand.Ask the students which of the containers represents fresh water that is readily available for human use. (They should easily see that only the jar marked “freshwater” has the readily available supply.) Initiate a discussion on the limits of fresh water supplies, the problems of population growth and distribution, and the contamination of existing supplies. Only a small part of this fresh water (.03 percent of the Earth’s total water supply) is accessible. The rest is too remote (found in Amazon or Siberian rivers) to locate, too expensive to retrieve or too polluted to use. Hold a plate in front of the class and dramatically drop theusable portion of fresh water onto it (represent this portion as one drop of water).Teacher to hand out homework – briefly explain how to fill out the water use chart daily to be used in class in one-week’s time.Exit SlipAs the students are getting prepared to leave class, they are to hand in an exit slip sharing their thoughts on the knowledge on the amount of water available for human use and the comparison of their prediction of water availability to the actual.
Homework Learning ActivitiesFill out water use chart (Lesson 1 BLM 2) *make sure to make 2 copies of the first page so that the students can complete all seven days.
Extension Learning ActivitiesIf the teacher feels the students are strong enough, the amount of water in the shower, toilet and brushing teeth can be left blank for the students to determine on their own from researching their current fixtures (ex. to figure out shower amount a student can time how long it takes to fill up a bucket, check on the back of the toilet to determine litres/flush, etc.).
6Water Use Chart (1.1)
Day of Week______________
Minutes in one day or number of times/day
# litres Total
Shower/bath (time it takes to fill tub) X 20 =
Toilet X 12 =
Brush teeth X
4 (if you leave the water running)
or1 (if you turn off the
water while brushing) =Laundry X 200 =
Dishwashing X40 (if dishwasher)
or35 (if by hand)=
Additional drinking water (found in foods)
15 =
Leaky plumbing 50 =Total
Day of Week______________
Minutes in one day or number of times/day
# litres Total
Shower/bath X 20 =Toilet X 12 =
Brush teeth X 4 or1 =
Laundry X 200 =
Dishwashing X 40 or35 =
Additional drinking water
15 =
Leaky plumbing 50 =Total
Day of Week______________
Minutes in one day or number of times/day
# litres Total
Shower/bath X 20 =Toilet X 12 =
Brush teeth X 4 or1 =
Laundry X 200 =
Dishwashing X 40 or35 =
Additional drinking water
15 =
Leaky plumbing 50 =Total
7
Day of Week______________
Minutes in one day or number of
times/day
# litres Total
Shower/bath X 20 =Toilet X 12 =
Brush teethX 4 =
or1 =
Laundry X 200 =
Dishwashing X 40 or35 =
Additional drinking water (found in foods)
15 =
Leaky plumbing 50 =Total
Total for 7 days
Shower/bathToilet
Brush teethLaundry
DishwashingAdditional drinking
water (found in foods)Leaky plumbing
Grand Total (a)
Figuring out averages
Divide grand total _____(a) by 7 = _______(b) to get your household daily average
Take your household daily average and divide by # of people in your house (b)
_________(b) divided by ________(c) = _______(d) to get your personal daily average
1) Compare your daily average (d) to the following national averages (remember that we did not include watering the lawn, washing the car, filling humidifiers, fish tanks, hot tubs, or swimming pools or any water related activities like going to a swimming pool).National Averages
Canada =350 litres/person/day,
United Kingdom=175 litres/person/day,
Bangladesh 45 litres/person/day.
What do you notice about your average as compared to these others. _______________
Divisez le grand total _____(a) par 7 = _______(b) pour obtenir la moyenne quotidienne
de votre maison
Prenez la moyenne quotidienne de votre maison et divisez-la par le # de personnes chez
vous (b)
_________(b) divisé par ________(c) = _______(d) pour obtenir votre moyenne
quotidienne personnelle
Questions :
1) Comparez votre moyenne quotidienne (d) aux moyennes nationales suivantes (n’oubliez pas que nous n’avons pas inclus l’arrosage du gazon, le lavage de voiture, le remplissage des humidificateurs, des aquariums, des bains-cuves ou des piscines, ni toute activité qui se rattache à l’eau comme la visite à une piscine). Moyennes nationales
11
Canada = 350 litres/personne/jour,
Royaume Uni = 175 litres/personne/jour,
Bangladesh = 45 litres/personne/jour.
Que remarquez-vous par rapport à votre moyenne comparée à celle des autres?
2) Faites la revue de votre journal de bord sur l’eau. Quels changements sont les plus faciles à faire?
Quels changements êtes-vous prêts à essayer?
Comment pouvez-vous aider votre famille à conserver l’eau?
12
Lesson 2
Stage 1 – Desired ResultsEstablished Goals:8-0-7f: Reflect on prior knowledge and experiences to construct new understandings and apply this new knowledge in other contexts.8-0-8f: Relate personal activities in formal and informal setting to specific scientific disciplines.8-0-8g: Discuss societal, environmental, and economic impacts of scientific and technological endeavours. Include: local and global impacts.8-0-9e: Be sensitive and responsible in maintaining a balance between the needs of humans and a sustainable environment.8-0-9f: Consider both immediate and long-term effects of their actions.Understandings:Students will understand that…There are three aspects to Sustainable Development
Essential Question:How do we learn about water from a sustainability focus?
Students will know… The four systems conditions of The Natural Step.
Students will be able to…Incorporate SD and TNS in decision making
Stage 2- Assessment EvidencePerformance Tasks:Students will participate in class discussion on Sustainable Development and The Natural Step.
Other Evidence:
Stage 3 – Learning PlanTeacher draws a Venn diagram on the board and point to the middle of the diagram as “quality of life” to ask the students the following leading questions:
1. What do we as humans need to have a positive “quality of life?” (looking for big-picture ideas)Lead the students toward the understanding that in order to have a good quality of life (and remember that it will differ depending on where you live); we need to have a healthy environment to live in, some money (economics) and to be healthy. All of these contribute to a positive quality of life. Encourage a discussion as to the different degrees in different areas – i.e. you might need less money living in Winnipeg than Vancouver or New York City: or less in a rural area if you grow your own food. Discuss the interaction of all of these on each other – i.e. if you are poor and are ill, might it be harder to get medication to get better? If you are poor, might you live in an area that has more pollution (or a hog factory – related to the timely idea of putting the hog factory in Tuxedo versus Transcona - NIMBY).
2. List some points that fit under each category – from students ideas – Here are the priority areas as designated by the United Nations (no need to mention them all):
Environment
Human Health & Well-being
Economics
Quality of Life
13
Socio-Cultural Environmental EconomicHuman rightsPeace and human securityJusticeGender equalityCultural diversity and intercultural understandingCommunity and cultureHealthHIV/AIDSGovernanceDemographicsEquity and rights
Natural resources:• water• energy• agriculture• biodiversity• and habitat• conservation• fish• forests• air
Climate changeRural transformationSustainable urbanizationDisaster prevention and mitigation
Poverty reductionCorporate responsibility and accountabilityMarket economyEnergy efficiency and conservationConsumption and waste managementEconomic performanceAgricultural viabilityMiningEmploymentEducation
Explain that this is called Sustainable Development or SD. Now how do we as citizens make better choices in a sustainable manner? We can use the 4 Systems Conditions created by The Natural Step. The Natural Step is a Non Governmental Organization (NGO) created by a children’s cancer doctor who saw a discrepancy between how people acted in regards to their environment and how they felt about their future.
3. What do you think we need to keep in mind when making choices? (Attempt to lead students into coming up with these 4 ideas)
The Four System ConditionsIn the sustainable society, nature is not subject to systematically increasing:1. concentrations of substances extracted from the Earth's crust, (stop taking things out of the earth such as oil, minerals, etc.),2. concentrations of substances produced by society, (stop putting stuff that cannot break down in to the environment and into landfills/incinerators),3. degradation by physical means (stop damaging the planet – over harvesting, losing topsoil, damaging ecosystems, etc), and4. people are not subject to conditions that systematically undermine theircapacity to meet their needs (make sure all humans have access to basic needs such as food, water, shelter, etc).
When we make decisions, we should keep the framework in mind and will need to do that in future lessons…Students should write these system conditions in their notebook in their own words for future reference.
Extension Learning ActivitiesStudents can look up TNS at www.thenaturalstep.ca for more information
Established Goals:8-4-02 Demonstrate that water, as compared to other substances, has a high heat capacity and is able to dissolve a wide variety of solutes. GLO: C1, C2, C5, D38-4-03 Compare and contrast characteristics and properties of fresh and salt water. Examples: freezing point, density, dissolved materials, global distribution, relative amounts, biologically diverse components of each… GLO: D3, D5, E18-4-05 Describe how the heat capacity of large bodies of water and the movement of ocean currents influence regional climates. Examples: Gulf Stream effects, El Niño, lake effect… GLO: D3, D5, E2Understandings:Students will understand that…Life on Earth is possible because of water's unique properties.
Water is the only natural substance that is found in all three states - liquid, solid (ice), and gas (steam) at the temperatures normally found on Earth. Water can absorb a tremendous amount of heat acting like a heat buffer for the Earth.
Essential Questions:What are the unique characteristics of fresh and salt water and how do they affect the Earth’s climate?How do we teach about water from a sustainability focus?
Students will know… -and describe all three states of matter - solid, liquid, and gas - within the normal temperature range at Earth's surface for fresh water and for saline water.
-how the high heat capacity & abundance of liquid water makes life on Earth possible.
Students will be able to…Participate in three labs in a safe manner-demonstrate through experimentation, that water containing salts and minerals has different properties than fresh water. -graph data to analyze and articulate results/conclusions.
Stage 2- Assessment EvidencePerformance Tasks:Lab reports (with graphs) handed in to be marked
Other Evidence:Peer assessment of lab behaviour
Materials Required
Station 1 Station 2 Station 3distilled water distilled water hot plate
Seawater(saltwater) seawater 4 flasks (same size)stopwatch isopropyl alcohol 4 thermometershot plate 3 thermometers that can measure
from -10°C to 110°Cbucket of ice water
2 flasks with rubber stoppers that hold a thermometer
3 large test tubes with a one hole fitted stoppers
stop watch
2 thermometers that can measure from -10°C to 110°C
3 Pyrex beakers sand
graph paper dry ice chunks* soilstopwatch gloves
graph paper*you can purchase dry ice from Praxair (in Winnipeg) for about $3.00 a kg – you need to bring a small cooler to hold it. Praxair: 663-4393, 650 Nairn. An alternative to dry ice is a salt-ice mixture but with less dramatic results.
Safety ConsiderationsSafety Guidelines for Using Electric Hot PlatesUse a hot plate with a smooth, clean surface. Hot plates appear exactly the same whether hot or at room temperature. Always assume they are hot and act accordingly. Keep the electrical cord of a hot plate away from water and the heating surface. The cord of the hot plate should be checked periodically for frays and faults. Any hot plate with faulty wiring should
15
not be used. Repair or replaced immediately. Safety Rules for All Heating ProcessesWhen heating glassware, make sure to use only glassware made of borosilicate glass (Pyrex® brand or Kimax® brand). Common glass can break, explode or shatter very easily when subjected to heat shock. Never set hot glassware on cold surfaces or in any way change its temperature suddenly. Even a Pyrex® or Kimax® beaker will break if cold water is poured into a hot beaker. Use care when working with hot glass. Hot glass looks exactly the same as room temperature glass. Do not leave hot glassware unattended, and allow ample time for the glass to cool before touching. Check the temperature of the glassware by placing your hand near, but not touching, the potentially hot glass. Have hot pads, thick gloves, or beaker tongs available for grasping hot glassware. Never heat a closed container. Any set-up should be designed to allow for fast removal of the heat source.
Background InformationWater has unique properties. About 97 percent of all water is in the oceans. Salt water or seawater has characteristics similar to fresh water with some noticeable differences because of the salts that are dissolved in water.Prior Knowledge The salt in seawater comes from the weathering of earth's land surface. Water can be a liquid or a solid and can go back and forth from one form to the other. When liquid water disappears, it turns into a gas (vapor) in the air and can reappear as a liquid when cooled, or as a solid if cooled below the freezing point. Common Preconceptions Students generally do not regard freezing as taking place at a specific temperature. Students consider heat and temperature to be the same thing, often arguing that if you increase the amount of heat you will increase the temperature. Boiling is the maximum temperature a substance can reach. Additional InformationLiquid water (H2O) is often perceived to be pretty ordinary as it is transparent, odourless, tasteless and ubiquitous. Water is unique in that it is the only natural substance that is found in all three states -- liquid, solid (ice), and gas (steam) - at the temperatures normally found on Earth. Earth's water is constantly interacting, changing, and in movement. 0° on the Celsius scale is water's freezing point, and 100° is water's boiling point. Water is unusual in that the solid form, ice, is less dense than the liquid form, which is why ice floats. Water has a high specific heat index or capacity. This means that water can absorb a lot of heat before it begins to get hot. This is why water is valuable to industries and in your car's radiator as a coolant. The high specific heat index of water also helps regulate the rate at which air changes temperature, which is why the temperature change between seasons is gradual rather than sudden, especially near the oceans.
Stage 3 – Learning Plan(adapted from AQUARIUS http://www.bigelow.org/aquarius/prop_fresh_sea.html) Used by permission.
Station 1 Boiling PointFill one flask with distilled water and one flask with seawater. Insert the thermometers through the stoppers and cap the flasks. Make sure the thermometers are suspended in the liquids. Set both samples aside for half an hour so that they are all at room temperatureActivity – Station 1 (Boiling Point) In this procedure, students will explore the boiling point of water, including the differences between salt water and fresh water. Ask students to hypothesize: “Which will boil first: salt water or fresh water? Why?”Record the temperature of the distilled water and seawater in the flasks. Turn on the hot plate. Begin with the distilled water. Check and record the temperature every 30 seconds. When the water begins bubbling and the temperature levels off, the water is boiling. Keep recording the temperature for 3 minutes after you see bubbles. Plot and graph your data. What is the boiling point of distilled water? How long did it take the distilled water to reach the boiling point?Repeat the experiment with seawater. Record the thermometer reading every 30 seconds. Plot and graph your data. What is the boiling point of seawater? How long did it take the sea water to reach the boiling point?Compare the results of the two experiments. Use your graphs. Are there any differences in the boiling points? How do you explain these differences?
Station 2 Freezing Point Isopropyl alcohol works nicely because it contains water. When the water in the alcohol freezes, it
should sink. There are numerous stores that sell dry ice as either chunks or cubes. Always use sturdy gloves and / or tongs to handle dry ice. If you do not wish to use dry ice, use a salt-ice mixture instead.In this procedure, students will explore the freezing point of water, including the differences between salt water and fresh water. Ask the students the following questions: “For pure water, the freezing point is defined as 0°C, but have you ever measured it? How can we measure it? Can we put the thermometer in a solid chunk of ice or in chopped ice? What is the temperature of ice? Which will freeze more slowly, salt or fresh water? Why?”Fill one test tube with distilled water, the second with seawater, and the third with alcohol. Insert the thermometer through each rubber stopper and cap the test tubes. Make sure that the thermometer is suspended in the water. Record the temperature of each test tube.Using tongs or heavy gloves, fill the bottom of three Pyrex beakers with chunks of dry ice.**STOP Review Safety Procedures** WARN STUDENTS: “DO NOT TOUCH THE DRY ICE WITH YOUR BARE HANDS!” Place each test tube in a beaker of dry ice.Record the temperatures every 30 seconds until they level off. Observe the test tube of alcohol. What happens to the water that is in the alcohol? Compare it to the freezing point of the salt water and of the fresh water. Does the ice float or sink?Plot and graph your data. Compare the information on the three graphs. What is the freezing point of fresh water? Seawater? Alcohol?
Station 3 Heat Capacity In this procedure, students will examine water’s ability to store heat. Water has a higher heat capacity than almost any other liquid. This means that it takes a lot of heat to change water’s temperature significantly. We can measure and compare the heat capacities of water, air and “earth”. Ask the students: “Based on your experience, which will heat and cool more slowly: water, air, soil or sand? Why?” If your students require more guidance, please use BLM #4.Fill one flask with water, one with soil, one with sand, and leave one flask empty. This flask is filled with air. Insert thermometers through rubber stoppers and cap the flasks.Record the temperature in each flask at room temperature. **STOP Review Safety Procedures** Place all four flasks on top of the hot plate and start the stopwatch. Record the time it takes for the water to reach 33°C. Also record the temperature of the empty flask and the soil and sand flask at that instant. Ask the students: “Is the temperature in the flask of air higher or lower than the temperature of the flask of water, sand and soil?”Remove all flasks from the heat and place them in ice water. Record the time it takes for each flask to reach its original room temperature. Ask the students: “Which flask took longer to reach its original room temperature?”
Class Discussion Questions1. What are the implications of water having a higher heat capacity than that of land when people live
near a large water source like Lake Winnipeg related to climate? Water covers about 71% of Earth’s surface. Thus its ability to store heat strongly affects our climate. The water may absorb the heat during the day and give off the heat in evenings to make for milder nights/seasons than areas further from large water sources.
2. Why do you think that the boiling points of fresh and salt water have an effect on our local climate? How? The boiling point of a liquid is the temperature at which it turns to gas. Water, when heated,evaporates and boils slowly compared to other liquids. This means that the heat of vaporization ishigh—the highest of all common liquids. Because of the high heat of vaporization, water evaporatesslowly and absorbs a lot of heat. Water’s high heat of vaporization gives it a high boiling point(100°C). This is why much of Earth’s water is in liquid form.
3. How can you relate the results of these experiments to the three aspects of sustainable development? Prompt students to think about how this experiment may impact on economics (climate in coastal areas) as well as environment (differences in grow seasons between Vancouver and Winnipeg) and heath.
Homework Learning ActivitiesRemind students to continue to work on water use chart
Extension Activities
17
Each group can be assigned or choose an example of how ocean currents influence regional climates and share with the class (jigsaw). For example, the groups could research
1. Gulf Stream effects2. El Niño3. Lake effects
18
Station 1
1. Predict and record in your science notebook: “Which will boil first: salt water or fresh water? Why?”
2. Record the temperature of the distilled water and seawater in the flasks. Turn on the hot plate. **STOP Review Safety Procedures**
3. Begin with the distilled water. Check and record the temperature every 30 seconds. When the water begins bubbling and the temperature levels off, the water is boiling. Keep recording the temperature for 3 minutes after you see bubbles. Plot and graph your data. What is the boiling point of distilled water? How long did it take the distilled water to reach the boiling point?
4. Repeat the experiment with seawater. Record the thermometer reading every 30 seconds. Plot and graph your data. What is the boiling point of seawater? How long did it take the sea water to reach the boiling point?
Compare the results of the two experiments. Use your graphs. Are there any differences in the boiling points? How do you explain these differences?
19
Station 2
1. Discuss and record answers to the following questions:
a. For pure water, the freezing point is defined as 0°C, but have you ever measured it?
b. How can we measure it?
c. Can we put the thermometer in a solid chunk of ice or in chopped ice?
d. What is the temperature of ice?
e. Which will freeze more slowly, salt or fresh water? Why?
2. Fill one test tube with distilled water, the second with seawater, and the third with alcohol. Insert the thermometer through each rubber stopper and cap the test tubes. Make sure that the thermometer is suspended in the water. Record the temperature of each test tube.
Using tongs or heavy gloves, fill the bottom of three Pyrex beakers with chunks of dry ice.**STOP Review Safety Procedures** “DO NOT TOUCH THE DRY ICE WITH YOUR BARE HANDS!” Place each test tube in a beaker of dry ice.
20
Record the temperatures every 30 seconds until they level off. Observe the test tube of alcohol. What happens to the water that is in the alcohol?
Compare it to the freezing point of the salt water and of the fresh water. Does the ice float or sink?
Plot and graph your data. Compare the information on the three graphs. What is the freezing point of fresh water? Seawater?
21
Station 3
1. Discuss and record in your science notebook the following question: based on your experience, which will heat and cool more slowly: water, air, soil or sand? Why?
2. Fill one flask with water, one with soil, one with sand and leave one flask empty. This flask is filled with air. Insert thermometers through rubber stoppers and cap the flasks.
3. Record the temperature in each flask at room temperature. **STOP Review Safety Procedures** Place all four flasks on top of the hot plate and start the stopwatch. Use sheet to record information. Record the time it takes for the water to reach 33°C. Also record the temperature of the empty, soil and sand flasks at that instant.
4. Record whether the temperature in the flask of air is higher or lower than the temperature of the flask of water, soil and of sand?
5. Remove all four flasks from the heat and place them in ice water. Record the time it takes for each flask to reach its original room temperature.
6. Record which flask took the longest to reach its original room temperature.
22
Première station
1. Prédisez et enregistrez dans votre cahier de sciences: «Laquelle bouillira la première, l’eau salée ou l’eau fraîche? Pourquoi?»2. Enregistrez la température de l’eau distillée et de l’eau de mer dans les flacons. Allumez l’élément. Stop! Revoyez procédés sécuritaires!3. Commencez avec l’eau distillée. Vérifiez et enregistrez la température toutes les 30 secondes. Quand l’eau commence à bouillonner et que la température plafonne, l’eau bout. Continuez à enregistrer la température pendant 3 minutes après avoir vu les bulles. Inscrivez vos données et faites un graphique. Quel est le point d’ébullition de l’eau distillée? Combien de temps a-t-il fallu pour que l’eau distillée atteigne le point d’ébullition?4. Répétez l’expérience avec l’eau de mer. Inscrivez la lecture du thermomètre à toutes les 30 secondes. Inscrivez vos données et faites un graphique. Quel est le point d’ébullition de l’eau de mer? Combien de temps a-t-il fallu pour que l’eau de mer atteigne le point d’ébullition?5. Comparez les résultats des deux expériences. Servez-vous de vos graphiques. Y a-t-il des différences dans les points d’ébullition? Comment expliquez-vous ces différences?
23
Deuxième station
1. Discutez et inscrivez vos réponses aux questions suivantes:
a. Pour l’eau pure, on marque le point de congélation à 0oC. Mais l’avez-vous jamais mesuré?
b. Comment peut-on le mesurer?
c. Peut-on mettre le thermomètre dans un bloc de glace solide ou dans des éclats de glace?
d. Quelle est la température de la glace?
e. Laquelle gèlera plus lentement, l’eau salée ou l’eau fraîche? Pourquoi?
2. Remplissez une éprouvette d’eau distillée, une deuxième avec de l’eau salée et une troisième avec de l’alcool. Insérez un thermomètre à travers chaque bouchon en caoutchouc et refermez bien les éprouvettes. Assurez-vous que le thermomètre est suspendu dans le liquide. Inscrivez la température de chaque éprouvette.
Avec des pinces ou des gants épais, remplissez le fond de trois béchers Pyrex avec des morceaux de glace carbonique. Stop Revoyez procédés sécuritaires! Ne touchez pas la glace carbonique de
24
vos mains nues. Placez chaque éprouvette dans un bécher de glace carbonique. Inscrivez la température à toutes les 30 secondes jusqu’à ce qu’elle s’arrête de descendre. Observez l’éprouvette d’alcool. Qu’arrive-t-il à l’eau qui est dans l’alcool?
Comparez le point de congélation de l’eau salée et de l’eau fraîche. Est-ce que la glace flotte ou sombre?
Inscrivez vos données et faites un graphique. Comparez les renseignements des trois graphiques. Quel est le point de congélation de l’eau fraîche? De l’eau de mer?
25
Troisième station
1. Discutez et inscrivez dans votre cahier de sciences la question suivante : D’après votre expérience, quel élément se réchauffera et se refroidira le plus lentement : l’eau, l’air, le sol ou le sable? Pourquoi?2. Remplissez un flacon d’eau, un de sol, un de sable et laissez un flacon vide. Ce flacon est rempli d’air. Insérez des thermomètres à travers des bouchons en caoutchouc et fermez bien les flacons.
3. Inscrivez la température de chaque flacon à la température de la chambre. **STOP Revoyez procédés sécuritaires** Placez les trois flacons par-dessus l’élément chauffant et commencez le chronomètre. Inscrivez le temps qu’il faut pour que l’eau atteigne 33°C. Au même moment, inscrivez aussi la température des flacons vide, de sol et de sable.
4. Enregistrez si la température du flacon d’air est plus élevée ou plus basse que la température des flacons d’eau, de sol et de sable.
5. Enlevez les quatre flacons de l’élément chauffant et placez-les dans de l’eau glacée. Enregistrez le temps qu’il faut pour que chaque flacon retourne à la température de la chambre originale.
26
6. Enregistrez quel flacon a mis le plus de temps à atteindre la température de chambre originale.
27
BLM #4
Name _______________Lab 3
Heating and Cooling Times
Air Soil Sand H20Room TemperatureTemperature(when H20 is 33 degrees)
* * * Time it took for H20 o reach 33 degrees ______
Is this temp ↑ or ↓ than air?
Is this temp ↑ or ↓ than air?
Is this temp ↑ or ↓ than air?
Remove all from heatPut into ice
Time it takes to get to room temperature
28
Nom _______________
LABO 3
Temps de réchauffement et de refroidissement
Air Terre Sable H20Température de la chambre
Température(quand H20est 33 degrés)
* * * Temps nécessaire pour que H20 atteigne 33 degrés_______
Cettetempératureest-elle ↑ ou ↓ plus que l’air?
Cettetempératureest-elle ↑ ou ↓ plus que l’air?
Cettetempératureest-elle ↑ ou ↓ plus que l’air?
Enlevez tout de la chaleurMettez dans la glace
Temps nécessairepour atteindrela températurede la chambre
29
Lessons 6 & 7
Stage 1 – Desired ResultsEstablished Goals:8-4-04 Identify factors that can work individually or in combination to affect ocean currents. Include: convection, Coriolis effect, prevailing winds, position of continents. GLO: D5, E2Understandings:Students will understand that…Cold water and warm water move in different ways.How the Coriolis Effect works.The importance of the Antarctic Circumpolar current.
Essential Question:What are the unique characteristics of fresh and salt water and how do they affect the Earth’s climate?
Students will know… That there are set currents that the ocean follows.
Students will be able to…Identify why the ocean currents move in the way that they do.
Stage 2- Assessment EvidencePerformance Tasks:Students will make predictions and then apply the learning to determine what the ocean currents look like.
Other Evidence:Completion of questions and partner work
Stage 3 – Learning PlanLesson 6*Prepare ice cubes with a couple of drops of red food colouring ahead of timeFill the baking pan with warm water.Place baking pan on overhead so students can see what happens.Sprinkle some pepper on the surface of the water to see how the water moves.Ask students to predict what will happen when the red ice cube is placed in the water.Put one red ice cube into the baking pan and observe the water movement (on BLM#1).Empty the pan and re-fill with warm water.Predict any changes that might occur with one ice cube at each end of the pan (on BLM#1).Record observations.Answer questions on handout (BLM #1).Lesson 7In partners, get students to review Ocean Currents Facts and The Antarctic Circumpolar Current (BLM #2).Prep students for the Ocean Current prediction by explaining that currents move in a circular motion and that every ocean has a set current as well as in the Gulf Stream.In partners, get students to apply the learning from the experiment and the fact sheet to answer the questions (BLM #4) and determine the Earth’s Ocean Currents (BLM #3)** and use BLM #2** to assist in understandings. An engaging way to do this is to cut out each fact (see BLM 6.6) and place all around the room to get the students moving and recording their information.Discuss answers from previous lesson and compare students predictions of the Ocean currents with that of the one on the Overhead (BLM #5)** get them to record the actual currents in a different colour than used in their predictions, and record on the map which colour is the one that accurately depicts the currents.Discuss answers at end of class. Have students hand in answer sheets to confirm completion.
*(adapted from Hot and Cold Moves - http://coe.west.asu.edu/explorer/MiscUnits/team3/Hot-Cold_Moves.html)
** Source: Manitoba Education and Training. Grades 5 to 8 Science: A Foundation for Implementation. Winnipeg, MB: Manitoba Education and Training, 2000. Reproduced by permission All rights reserved.
Homework Learning ActivitiesContinue to work on water consumption chart
31
Hot and Cold Currents (6.1 page 1 of 2)
Experiment 1 – Single ice cubePrediction of how the water will move when an ice cube is added to warm water
1. Which direction will the cold water move? ____________________2. Draw a picture of how you expect the water to move in the baking pan.
Ice Cube
After the Experiment3. Which direction did the cold water move? ____________________4. Draw a picture of how the water moved in the baking pan.
Ice Cube
Experiment #2Prediction of how the water will move when two ice cubes are added to warm water
5. Which direction will the cold water move? ____________________6. Draw a picture of how you expect the water to move in the baking pan.
Ice Cubes
After the Experiment7. Which direction did the cold water move? ____________________8. Draw a picture of how the water moved in the baking pan.
Ice Cubes
32
(6.1 page 2 of 2)Questions
1. What happened to the cold water as it warmed up? _____________________________________________________________________
Expérience 1 – Un seul cube de glacePrédiction sur comment l’eau bougera quand on ajoute un cube de glace à de l’eau chaude
1. Dans quelle direction l’eau bougera-t-elle? ____________________2. Faites un croquis de vos attentes du mouvement de l’eau dans le plat.
Cube de glace
Après l’expérience3. Dans quelle direction est-ce que l’eau froide a bougé? ___________________4. Faites un croquis de comment l’eau a bougé dans le plat.
Cube de glace
Expérience #2 Prédiction sur comment l’eau bougera quand on ajoute deux cubes de glace à de l’eau chaude
5. Dans quelle direction l’eau froide bougera-t-elle? ____________________6. Faites un croquis de vos attentes du mouvement de l’eau dans le plat.
Cubes de glace
Après l’expérience7. Dans quelle direction l’eau froide a-t-elle bougé? ____________________8. Faites un croquis de comment l’eau a bougé dans le plat.
Cubes de glace
34
(6.1 page 2 de 2)Questions1. Qu’est-il arrivé à l’eau froide à mesure qu’elle se réchauffait?
Facts about Ocean Currents• Ocean waters are constantly on the move. How they move influences climate and living
conditions for plants and animals, even on land.
• Currents flow in complex patterns affected by wind, the water’s salinity and heat
content (density), bottom topography, the position of continents, and the Earth’s rotation
(Coriolis effect).
• The ocean is layered. It is cold at the bottom and warmer on top.
• Warm surface currents invariably flow from the tropics to the higher latitudes, driven
mainly by atmospheric winds and the Earth’s rotation.
• Cold surface currents come from polar and temperate latitudes, and they tend to flow
toward the equator, driven mainly by atmospheric forces.
• Our planet’s rotation produces a force on all bodies of water moving relative to the
Earth. That force is greatest at the poles and least at the equator. It is called the Coriolis
effect, and it causes the direction of winds and ocean currents to be deflected. Water is
deflected clockwise, or to the right, in the northern hemisphere, and counterclockwise, or
to the left, in the southern hemisphere.
• Ocean water at the surface is warmed at the tropics and moves toward the poles where it
loses heat, becomes saltier and denser, and sinks.
• The cold bottom layer of ocean water circulates through the oceans, taking up to 1,000
years to circulate completely throughout the oceans of the Earth.
• The Gulf Stream surface current is one of the strongest currents. It is warm, deep, fast,
and relatively salty.
• Organisms move from one layer of the ocean to another, and plant and animal remains
containing nutrients “rain” down. Upwelling stirs the oceans and brings nutrients that
have settled in deep water back to the surface, providing a rich source of nutrients for
marine organisms, particularly fish. Coastal upwelling occurs against the western sides of
continents in the Atlantic, Indian, and Pacific Oceans. There, colder water rises to replace
36
(6.2 page 2 of 2)
warm surface water blown out to sea by strong winds. Upwelling supports about half of
the world’s fisheries.
The Antarctic Circumpolar Current• The Southern Ocean is the only ocean that circles the globe without being blocked by
land. It contains the Antarctic Circumpolar current and is the world’s largest ocean
current.
• The Antarctic bottom water (cold, salty, and dense) sinks into the deep sea, spills off the
continental shelf, and travels northward hugging the ocean floor beneath other water
masses. This is a huge amount of water that pushes the warmer water out of the way,
usually by flowing underneath it, causing new flows and currents in other directions. It
travels as far as the North Atlantic and North Pacific Oceans. The bottom water flowing
away from Antarctica has to be replaced by other water, so the warmer waters in the
north tend to flow southward to fill the gap. Then they cool down and the cycle keeps
going.
• The Antarctic Circumpolar current has a powerful influence on much of the word’s
climate as it redistributes heat, influencing patterns of temperature and rainfall.
Source: Manitoba Education and Training. Grades 5 to 8 Science: A Foundation for Implementation. Winnipeg, MB: Manitoba Education and Training, 2000. Reproduced by permission. All rights reserved.
37
6.3 Name:
Source: Manitoba Education and Training.
38
Names: __________________Facts About Ocean Currents (6.4)
State the most interesting fact from the points listed
List 3 additional pieces of information in your own words
Draw a diagram to explain the Coriolis effect
Answer the following questionsHow does upwelling affect the economy?
What does density have to do with ocean currents?
Why does the Antarctic Circumpolar current have a powerful influence on the rest of the world?
Faits au sujet des courants océaniques (6.4)Indiquez quel fait tiré de la liste de points est le plus intéressantIndiquez 3 renseignements additionnels dans vos propres paroles
Dessinez un diagramme qui explique l’effet Coriolis
Répondez aux questions suivantesComment la remontée de l’eau froide des océans
affecte-t-elle l’économie?
Quelle relation y a-t-il entre la densité et les courants océaniques?
Pourquoi le courant qui coule autour de l’Antarctique exerce-t-il une si grande influence sur le reste du monde?
State the most interesting fact from the points listed Dependant on student
List 3 additional pieces of information in your own words
Dependant on student
Draw a diagram to explain the Coriolis effect
Answer the following questionsHow does upwelling affect the economy?
Upwelling stirs the ocean and brings nutrients “up” to the surface for marine organisms. It supports the fishing industry.
What does density have to do with ocean currents?
The cold dense water sinks into the deep sea and pushes great amounts of warm water up. This creates a cycle.
Why does the Antarctic Circumpolar current have a powerful influence on the rest of the world?
Due to the cycling of cold and warm water this current influences much of the world’s climate as it redistributes heat and influences temperature patterns and rainfall.
bodies of water moving relative to the Earth. That
force is greatest at the poles and least at the
equator. It is called the Coriolis effect, and it
causes the direction of winds and ocean currents
to be deflected. Water is deflected clockwise, or to
the right, in the northern hemisphere, and
counterclockwise, or to the left, in the southern
hemisphere.
The Southern Ocean is the only ocean that circles the globe without being blocked by land. It contains the Antarctic Circumpolar current and is the world’s largest ocean current
43
Organisms move from one layer of the ocean to another, and plant and
animal remains containing nutrients “rain” down. Upwelling stirs the oceans
and brings nutrients that have settled in deep water back to the surface,
providing a rich source of nutrients for marine organisms, particularly fish.
Coastal upwelling occurs against the western sides of continents in the
Atlantic, Indian, and Pacific Oceans. There, colder water rises to replace
warm surface water blown out to sea by strong winds. Upwelling supports
about half of the world’s fisheries.
The Antarctic bottom water (cold, salty, and
dense) sinks into the deep sea, spills off the
continental shelf, and travels northward hugging
the ocean floor beneath other water masses. This
is a huge amount of water that pushes the warmer
water out of the way, usually by flowing
underneath it, causing new flows and currents in
other directions. It travels as far as the North
Atlantic and North Pacific Oceans. The bottom
water flowing away from Antarctica has to be
replaced by other water, so the warmer waters in
the north tend to flow southward to fill the gap.
Then they cool down and the cycle keeps going.
The Antarctic
Circumpolar current has
a powerful influence on
much of the word’s
climate as it
redistributes heat,
influencing patterns of
temperature and
rainfall.
44
The cold bottom layer
of ocean water
circulates through the
oceans, taking up to
1,000 years to circulate
completely throughout
the oceans of the Earth.
The Gulf Stream
surface current is one of
the strongest currents. It
is warm, deep, fast, and
relatively salty.
45
MLN 6.6L’eau de mer est en
mouvement constant.
Sa façon de se déplacer
influence le climat et
les conditions de vie
pour les plantes et les
animaux, même sur
terre.
Les courants se
déplacent selon des
modèles complexes,
affectés par le vent, le
montant de sel et de
chaleur de l’eau (la
densité), la topographie
du fond, la position des
continents et la rotation
de la terre (l’effet
Coriolis).
L’océan est stratifiée.
Elle est froide au fond
et plus chaude en
surface.
Les courants chauds en
surface coulent
nécessaire- ment des
tropiques aux latitudes
plus élevées, poussés
surtout par les vents
atmosphériques et la
rotation de la terre.
Les courants froids en
surface viennent des
latitudes polaires et
tempérées, et tendent à
couler vers l’équateur,
poussés surtout par les
forces atmosphériques.
L’eau de mer en surface
se réchauffe dans les
tropiques et se dirige
vers les pôles Où elle
perd sa chaleur, devient
plus salée et dense, et
coule.
46
La rotation de notre planète produit une force qui
agit sur toutes les masses d’eau qui bougent
relativement à la terre. Cette force est plus grande
aux pôles et moins grande à l’équateur. Elle
s’appelle l’effet Coriolis, et elle du sud.
océaniques. L’eau est déviée dans le sens de
l’horloge, ou vers la droite, dans l’hémisphère du
nord, et dans le sens contraire de l’horloge, ou
vers la gauche, dans l’hémisphère fait dévier la
direction des vents et des courants
L’océan du sud est le
seul océan qui encercle
le globe sans être
bloqué par la terre. Il
contient le courant
antarctique
circumpolaire qui est le
océanique du monde.
plus grand courant.
Les organismes se déplacent d’une couche océanique à une autre, et les
restes des plantes et des animaux qui contiennent des éléments nutritifs
‘pleuvent’ vers le fond. La remontée brasse les océans et rapporte les
éléments nutritifs reposant près du fond jusqu’à la surface, fournissant une
source riche en éléments nutritifs aux organismes marins, surtout aux
poissons. La remontée côtière a lieu le long du côté ouest des continents
dans les océans Atlantique, Indien et Pacifique. Là, l’eau froide monte pour
remplacer l’eau chaude en surface qui est poussée loin en mer par des vents
forts. La remontée appuie à peu près la moitié des poissonneries du monde.
L’eau de fond antarctique (froide, salée et dense) Le courant
47
s’abaisse dans la mer profonde, s’envole en glissant
du plateau continental et voyage vers le nord en
s’accrochant au fond de l’océan sous d’autres masses
d’eau. Ceci représente un directions. Il voyage aussi
loin que le nord de l’Atlantique de son chemin,
généralement en passant dessous, ce qui énorme
montant d’eau qui repousse l’eau plus chaude hors
de son chemin, généralement en passant dessous, ce
qui cause de nouvelles déviations et des courants
dans d’autres directions. Il voyage aussi loin que le
nord de l’Atlantique et le nord du Pacifique. L’eau de
fond qui s’éloigne de l’Antarctique doit être
remplacée par d’autre eau, alors les eaux plus
chaudes du nord tendent à couler vers le sud pour
remplir le vide. Puis elles se refroidissent et le cycle
continue.
antarctique
circumpolaire a une
puissante influence
sur une grande partie
du climat mondial,
puisqu’il redistribue
la chaleur, ce qui
influence les
modèles de
température et de
précipitation.
La couche d’eau froide au fond des océans circule à
travers les océans. Elle peut prendre jusqu’à 1000
ans pour circuler complètement à travers les océans
de la terre.
Le courant du Golfe
à la surface est un
des courants les plus
puissants. Il est
chaud, profond,
rapide et
relativement salé.
48
Lesson 8Stage 1 – Desired Results
Established Goals:8-4-03 Compare and contrast characteristics and properties of fresh and salt water. Examples: freezing point, density, dissolved materials, global distribution, relative amounts, biologically diverse components of each… GLO: D3, D5, E1
Understandings:Students will understand that…In Canada, humans use an exceptionally great amount of water.
Essential Question:What are the various ways humans impact water and how do they attempt to fix the water they have damaged?How do we learn about water from a sustainability focus?
Students will know… That they must decrease the amount of water used.
Students will be able to…Figure out creative ways to decrease their water consumption.
Stage 2- Assessment EvidencePerformance Tasks:Completion of water chart.Completion of questions accompanying water chart.
Other Evidence:Plan of how to decrease individual consumption by 50%.
Materials RequiredStudents’ completed water chartsNew copies for each student of the water consumption chart to now decrease consumption by 50% (see BLM #2)
Stage 3 – Learning PlanShare Water Chart results with the class – teacher to group water use amounts on board to demonstrate the range of usage in the class.Think – Pair – Share a plan on how students will decrease their water consumption by 50% in the next 7 days.Have students record in notebooks how they will achieve the goal of decreasing their water in realistic ways and make a prediction of if they think they will be able to do it or not.
Homework Learning ActivitiesWork on new chart to decrease consumption by 50%
49Water Use Chart
Day of Week______________
Minutes/day times times/day
# litres Total
Shower/bath (time it takes to fill tub) X 20 =
Toilet X 12 =
Brush teeth X
4 (if you leave the water running)
or1 (if you turn off the
water while brushing) =
Laundry X 200 =
Dishwashing X40 (if dishwasher)
or35 (if by hand)=
Additional drinking water (found in foods)
15 =
Leaky plumbing 50 =Total
Day of Week______________
Minutes /day or times/day
# litres Total
Shower/bath X 20 =Toilet X 12 =
Brush teeth X 4 or1 =
Laundry X 200 =
Dishwashing X 40 or35 =
Additional drinking water
15 =
Leaky plumbing 50 =Total
Day of Week______________
Minutes/day or times/day
# litres Total
Shower/bath X 20 =Toilet X 12 =
Brush teeth X 4 or1 =
Laundry X 200 =
Dishwashing X 40 or35 =
Additional drinking water
15 =
Leaky plumbing 50 =Total
50
Day of Week______________
Minutes in one day or number of
times/day
# litres Total
Shower/bath X 20 =Toilet X 12 =
Brush teethX 4 =
or1 =
Laundry X 200 =
Dishwashing X 41 or35 =
Additional drinking water (found in foods)
15 =
Leaky plumbing 50 =Total
Total for 7 days
Shower/bathToilet
Brush teethLaundry
DishwashingAdditional drinking
water (found in foods)Leaky plumbing
Grand Total (a)
Figuring out averages
Divide grand total _____(a) by 7 = _______(b) to get your household daily average
Take your household daily average and divide by # of people in your house (b)
_________(b) divided by ________(c) = _______(d) to get your personal daily average
Established Goals:8-4-07 Describe features of the North American drainage system. Include: local and regional watersheds, direction of water flow, continental divide. GLO: D3, D5, E2Understandings:Students will understand that…Bodies of water are the end product of drainage from watersheds.
Essential Questions:How does the North American drainage system function?How do we learn about water from a sustainability focus?
Students will know… The student will see the end results of polluting within a watershed and how it impacts bodies of water.
Students will be able to…Predict where the water and pollutants will flow.
Stage 2- Assessment EvidencePerformance Tasks:Students will work together to predict, create and record information about their watershed.Students will use peer and self assessment (BLM #1).
Other Evidence:Students will observe the watershed in action and record observations.
Materials Required (for each group)
One container at least 22 cm wide, 33 cm long, and 6 cm deep. A metal baking pan will work fine
One sheet of thin plastic (saran wrap) at least 20 cm larger in all dimensions than the container or plastic bags (i.e. “Safeway” style)
Two sheets of newspaper or aluminum foil One spray bottleOne book Baby powder (or some very fine soil will also
work)Blue food coloring
Stage 3 – Learning PlanWatershed modelingProcedure1. Divide students into groups of three or four. Each group will need a container, two sheets of newspaper, one sheet of plastic, one book, some baby powder (or soil) and one spray bottle filled with water and a few drops of blue food coloring. It is also helpful to provide students with a guide (BLM 9.4).2. Crumple each sheet of newspaper or foil separately and place them next to each other at one end of the container. Try to vary the shape of the two. Place the sheet of plastic or plastic bag over the crumpled newspaper (or aluminum foil), causing it to form hills over the high places, and streams and rivers in the low places. Put a book under the end of the container with the newspaper, which will allow water to flow down the streams and rivers and collect in the lake at the front of the container. The sides of the plastic sheet should be placed down into the container or the land formations can be covered by a bag.3. The plastic sheet represents the ground surface covering the watershed. Looking at the watershed model, try to guess where the main rivers will flow. Now, it's time to put the model to the test. Spray several pumps of water from the spray bottle on the model. Notice that each stream has its own watershed (the area that drains into it) and that the entire model is a larger watershed because all the water eventually flows into the pool at the bottom of the container. Count the number of small watersheds.4. The model now represents a clean watershed. Let’s add some pollutants. Sprinkle a little baby powder over the model. The baby powder represents a variety of pollutants, including oil, road salt, animal manure, excess fertilizers, pesticides, tiny particles of soil and other harmful materials. Rapidly spray nine pumps of water over the upper portion of the watershed. Observe the way in which the pollutants are carried by the water and the end condition of the lake. Repeat if necessary.Questions (to be put on overhead see BLM #2)To be done in a think, pair, share method before discussing with the class.1. Describe the relationship between small and large watersheds.
52
2. What are some possible solutions to keep bodies of water clean?3. Who pollutes watersheds?4. Think about the watershed(s) in which you live. What is the name of our watershed? Where does our water flow? What possible pollutants exist there?5. How can you link our watershed to the three aspects of sustainable development?Using the watershed map, allow students to come up to review the local watershed. On their own map (BLM #3*) get the students to include the Red River, the Assiniboine River, the direction of water flow and discuss the continental divide.
North America Watershed Map Source: Manitoba Education and Training. Grades 5 to 8 Science: A Foundation for Implementation. Winnipeg, MB: Manitoba Education and Training, 2000. Reproduced by permission. All rights reserved.
Extension Learning ActivitiesBLM 9.4 for a Water Quiz.
Homework Learning ActivitiesStudents to continue working on 50% reduction of water consumption
53Peer and Self Assessment (9.1)
All scored on a scale of 0-20 – below expectations 1 – adequate 2 – exceeds expectations
Tous notés sur l’échelle de 0-20 – en bas des attentes 1 – satisfaisant 2 – au-delà des attentes
Activité Son nom à soi________________
Nom de l’élève ______________
Nom de l’élève ____________
Nom de l’élève _____________
A participé à fond dans l’activité
A fourni des idées/pensées au groupeA bien travaillé avec les
autres
Total /6 /6 /6 /6Commentaires : ____________________________________________________________________________________________________________
Auto-évaluation et par les pairs (9.1)Tous notés sur l’échelle de 0-20 – en bas des attentes 1 – satisfaisant 2 – au-delà des attentes
Activité Son nom à soi________________
Nom de l’élève ______________
Nom de l’élève ____________
Nom de l’élève _____________
A participé à fond dans l’activité
A fourni des idées/pensées au groupeA bien travaillé avec les
autres
Total /6 /6 /6 /6Commentaires : ______________________________________________________________________________________________
55
Watershed Questions (9.2)
Please record your answers in point form first, then turn to your partner to share your thoughts
1. Describe the relationship between small and large watersheds.2. What are some possible solutions to keep bodies of water clean?3. Who pollutes watersheds?4. What did you notice happened to the pollutants?5. Think about the watershed(s) in which you live. What is the name of our watershed? Where does our water flow? What possible pollutants exist here?6. How can you link our watersheds to the three aspects of Sustainable Development?
56
Questions sur le bassin hydrographique (9.2)
D’abord, veuillez inscrire vos réponses sous forme de points, puis partagez vos idées avec votre partenaire.1.Décrivez la relation qui existe entre les petits et les grands bassins hydrographiques.
2. Quelles solutions possibles y a-t-il pour garder nos cours d’eau propres?
3. Qui pollue les bassins hydrographiques?
4. Pensez au bassin hydrographique où vous vivez. Comment s’appelle notre bassin hydrographique? Où coule notre eau? Quels sont les polluants possibles qui existent ici?
5. Comment pouvez-vous rattacher nos bassins hydrographiques aux trois aspects du développement soutenable?
57
Student Name _____________________
Source: Manitoba Education and Training. Grades 5 to 8 Science: A Foundation for Implementation. Winnipeg, MB: ME and T, 2000. Reproduced by permission. All rights reserved.
58
Name ___________________ Date _____________ Room ______________
Watersheds BLM 9.4
1. Prepare the model. Design it so that there will be 2 “rivers”. In this box draw a quick sketch of where you think the following will be: the “rivers”, at least 3 small “streams”, the final watersheds (collection point).
2. Spray the blue water. In this box draw a quick sketch of what REALLY happened. Was your prediction close? _______________________________________________________________.
What surprised you? ____________________________________________________________
Count how many little watersheds there are. __________
3. In the real world sometimes pollutants are added to our waterways. Discuss with your group what these could be. On the space below, list as many pollutants as you can. __________________________________________________________________________
Did you help clean? Is everything in its proper space?
Now it is time to quietly answer these questions.
1. Describe the relationship between small and large watersheds. _________________________ _______________________________________________________________________________
3. Who pollutes watersheds? ______________________________________________________
4. Think about the watershed in which we live. What is it called? ________________________ Where does our water flow? _______________________________________________________
What possible pollutants exist here? _________________________________________________
QU’EST-CE QUI EST ARRIVÉ AUX POLLUANTS, SELON VOUS?
Nom : ________________ Date : _____________ Salle : _________
BASSINS HYDROGRAPHIQUES MLN 9,4
1. Préparez la maquette. Dessinez-la pour qu’il y ait 2 «rivières». Dans cette boîte, dessinez un croquis rapide où vous croyez que seront les objets suivants : les «rivières», au moins 3 petits «ruisseaux», les bassins hydrographiques ultimes (points de collection).
2. Arrosez avec l’eau bleue. Dans cette boîte, dessinez un croquis rapide de ce qui s’est VRAIMENT passé. Votre prédiction était-elle proche? _________________
Qu’est-ce qui vous a surpris? __________________________________________
Comptez combien il y a de bassins hydrographiques. ______________________
Dans le vrai monde, on ajoute quelquefois des polluants à nos cours d’eau. Discutez avec votre groupe ce que cela pourrait être. Dans l’espace ci-dessous, faites une liste d’autant de polluants que vous le pouvez. ________________________________________________________
Ajoutez un polluant au plus haut point de votre maquette. Vaporisez rapidement 9 coups de pompe d’eau. Surveillez précisément comment et où elle voyage. Attendez. Encore 6 coups de pompe. Dessinez un croquis rapide de ce qui arrive.
Décrivez la course du polluant.______________________________________________________________________ ______________________________________________________________________
2. Quelles sont des solutions possibles pour garder nos bassins hydrographiques propres? _______________________________________________________________________ _______________________________________________________________________ _______________________________________________________________________
3. Qui pollue les bassins hydrographiques?_______________________________________________________________________
63
4. Réfléchissez au bassin hydrographique où nous vivons. Comment s’appelle-t-il? __________________________________________________________________ Où s’écoule notre eau? _______________________________________________
___________________________________________________________________ 5. Comment pouvez-vous relier notre bassin hydrographique à 3 aspects du développement soutenable?______________________________________________
1. _________ The Coriolis Effect causes wind and ocean currents to be deflected.2. _________ The movement of oceans has no effect on world climate.3. __________Surface ocean water gets warm around the tropics. It then moves
towards the poles where it becomes cold, denser and sinks.4. _________ Upwelling is the term that describes huge powerful waves that crash
into coastal areas.5. ________ Saltwater is less dense that tap water and therefore boils at a lower
temperature. 6. _________ Ocean currents are affected by bottom topography and salinity.7. ________ The cold bottom layer of the oceans takes about 1 000 years to circulate
completely through the Earth’s waters.8. ________ The Gulf Stream can affect weather in Europe.9. ________ The Antarctic Circumpolar current in the Southern Ocean is the
world’s largest ocean current. It is not blocked by land.10. ________ Upwelling supports about 50% of the world’s fisheries.
Part B. (2 marks)Please draw a diagram of the Coriolis effect in the northern and southern hemisphere.
Marked by: ____________
65
Nom : ___________________ Salle : _________ Date : ___________
Signature d’un parent/gardien : _______________________ Total : _____/12
Quiz sur l’eau No. 1 MLN 95
Première partie
Vrai ou Faux (10 points)
1. _____ L’effet Coriolis cause une déflection du vent et des courants océaniques.2. _____ Le mouvement du vent n’a aucun effet sur le climat mondial.3. _____ L’eau de mer en surface se réchauffe autour des tropiques. Puis elle se dirige
vers les pôles où elle refroidit, devient plus dense et s’enfonce.4. _____ La remontée de l’eau de mer froide est une expression qui décrit d’énormes
vagues puissantes qui s’écrasent sur les régions côtières.5. _____ L’eau salée est moins dense que l’eau du robinet et donc elle bout à une
température plus basse. 6. _____ Les courants océaniques sont affectés par la topographie du fond et par la
salinité. 7. _____ La couche froide au fond des océans prend environ mille ans pour circuler
complètement à travers les eaux de la Terre. 8. _____ Le courant du Golfe peut affecter le temps en Europe.9. _____ Le courant circumpolaire antarctique dans l’océan du Sud est le plus grand
courant océanique au monde. Il n’est pas bloqué par des masses de terre.10. _____ La remontée de l’eau de mer froide fait vivre environ 50% des pêcheries du
monde.
Partie B (2 points)
Veuillez dessiner un schéma de l’effet Coriolis dans l’hémisphère du Nord et celle du Sud.
1. _T___ The Coriolis Effect causes wind and ocean currents to be deflected.2. _F___ The movement of oceans has no effect on world climate.3. _ T___ Surface ocean water gets warm around the tropics. It then moves towards
the poles where it becomes cold, denser and sinks.4. __F__ Upwelling is the term that describes huge powerful waves that crash into
coastal areas.5. __F__ Saltwater is less dense that tap water and therefore boils at a lower
temperature. 6. ___T__ Ocean currents are affected by bottom topography and salinity.7. ___T__ The cold bottom layer of the oceans takes about 1 000 years to circulate
completely through the Earth’s waters.8. ___T_ The Gulf Stream can affect weather in Europe.9. ___T__ The Antarctic Circumpolar current in the Southern Ocean is the world’s
largest ocean current. It is not blocked by land.10. ___T__ Upwelling supports about 50% of the world’s fisheries.
Part B. (2 marks)Please draw a diagram of the Coriolis Effect in the northern and southern hemisphere.
Marked by: ____________
67
Lessons 10 & 11Stage 1 – Desired Results
Established Goals:8-4-06 Describe the component of the global water cycle and explain how it works. GLO D3, D5, E2Understandings:Students will understand that…Water is not new, just goes through a variety of phases.
Essential Question:How does the global water cycle function?
Students will know… The various states of water and how the cycle functions.
Students will be able to…Demonstrate the various states of water through storytelling.
Stage 2- Assessment EvidencePerformance Tasks:Students will be assessed on the children’s book they will write and illustrate (see BLM #2) with the option of self-assessment.
Other Evidence:The adaptation and application of water-cycle knowledge into a different form of sharing information.
Stage 3 – Learning PlanBy grade 8, students should have an understanding of the water cycle. As a method of determining that, hand out a work cycle (BLM #1) and ask the students to fill it in. In class, go through the students’ answers and ask for justification if there is a difference from one student to another. If it appears that they have the main ideas, as the students to write a children’s book on a water droplet. They should be as creative as possible, and it can span any time in history. It must have the water go through the various stages in the water cycle and the story could take place in any era or location.The students can illustrate any way they want (using clip art, hand drawings, in a graphic-novel or comic book manner, etc.) or at the teacher’s discretion.The 3 best stories (or if opportunity presents itself, all of them) will be taken to the local elementary school (to be arranged by the teacher) to be shared with a grade 2 class who is learning about the water cycle.The class will start their story during lesson 10, work on it at home and will have additional class time during lesson 11 to complete it. It will be handed in at the beginning of lesson 12.
Extension Learning ActivitiesInstead of illustrating a booklet, teachers could choose to use a computer program to create comic books for students to use.See a reader’s theatre script at http://www.enchantedlearning.com/rt/weather/watercycle.shtml
Homework Learning ActivitiesContinue to work on 50% reduction in water consumption, completion of story.
Integration Curricular ConnectionsEnglish Language Arts1.2 Clarify and Extend 1.2.3 Combine Ideas
Structure and restructure ideas and information in personally meaningful ways to clarify and extend understanding.2.1 Use Strategies and Cues 2.1.1 Prior Knowledge
Make connections between previous experiences, prior knowledge, and a variety of texts, and apply them to new contexts.2.3 Understand Forms and Techniques 2.3.1 Forms and Genre
Demonstrate appreciation for the appropriate use of various forms and genres according to
purpose, audience, and content.2.3.5 Create Original Texts
Create original texts [such as descriptions, panel discussions, impersonations, collages, timelines, documentary videos, journals or diaries...] to communicate and demonstrate understanding of forms and techniques.
Evaporation PrecipitationRunoffTranspirationBodies of water GroundwaterThe sun Condensation
69
Word Cycle (10.1)
Name: _______________
70
DirectionsRead the list of words in the middle of the circle above. Select one word and place it in any circle. In the next circle, place another word that is related to the first. They could be synonyms, antonyms, steps in a process, examples of something, and so on. Be prepared to finish the statement, “Word A is related to word B because…” Write a note in between the circles of words to remind yourself of the relationship. Continue this process until you have placed all the words. Plan ahead; the last few words will be tricky to place.
Évaporation PrécipitationDéversementTranspirationCours d’eau Eau de sourceLe soleil Condensation
71
Cycle des mots (10.1)
Nom: _______________
72
DirectionsLisez la liste des mots au milieu des cercles ci-dessus. Choisissez un mot et placez-le dans n’importe quel cercle. Dans le prochain cercle, placez un autre mot qui se rattache au premier. Ça pourrait être un synonyme, un antonyme, les étapes d’un procédé, des exemples de quelque chose, etc. Soyez prêts à compléter la phrase : “Le mot A se rattache au mot B parce que …” Écrivez-vous une note entre les cercles de mots pour vous rappeler la relation. Continuez ce processus jusqu’à ce que vous ayez placé tous les mots. Planifiez d’avance; les derniers mots seront difficiles à placer.
73
Water Droplet Story Rating Scale (10.2)
Student name: ________________Write any needed comments in boxes belowTotal / 30 5 4 3 2 1
Creativity
Illustrations
Storyline
Include all aspects of the water cycle
Neatness
Grammar/spelling
total
74
Grille d’évaluation pour l’histoire de la goutte d’eau (10.2)
Nom de l’élève : ________________Écrivez tout commentaire nécessaire dans les boîtes ci-dessous
Total / 30 5 4 3 2 1Créativité
Illustrations
Trame de l’histoire
Incluez tous les aspects du cycle de
l’eau
Propreté
Grammaire/épellation
total
75
Lessons 12, 13, 14, 15
Stage 1 – Desired ResultsEstablished Goals:8-4-08 Describe how erosion and deposition are influenced by the flow rate of a stream or river, and contrast the related characteristics of young and mature streams. Examples: meanders, oxbows, alluvial deposits, sandbars, flood plains, deltas… GLO: C8, D5, E38-4-9 Describe how wave action and ice movement in large bodies of water cause erosion and deposition. GLO: D5, E38-4-10 Explain how tides are caused and describe their effects on shorelines. GLO: D5, D68-4-11 Explain examples of human interventions to prevent riverbank or coastal erosion. Examples: vegetation, reinforcement (concrete, boulders) piers, breakwaters… GLO: B2, B5, D58-4-12 Identify factors that can cause flooding either individually or in combination. Examples: heavy snow pack, quick thaw, rain in sprint, lack of vegetation to remove water, water through transpiration, frozen ground preventing absorption, agricultural drainage systems, dams, diversions… GLO: C8, D58-4-13 Provide examples of the way in which technology is used to contain or prevent damage due to flooding, and discuss related positive and negative impacts. Examples: floodway, diversion, dike, levee… GLO: A5, B1, D5
Understandings:Students will understand that…Water causing erosion and deposition can create land features.Some floods have the potential to be controlled.Different types of soil have different capacities for retaining rainwater.If the soil in an area will not hold enough rainwater, flooding problems will ensue.Soil can be tested for its water-retaining capacityTides affect shorelines.
Essential Question:How does water affect the land and how do humans attempt to alter its path?
Students will know… How the slope, flow of water and land features affect erosion and deposition.Which type of soil is best at preventing flooding and which contributes the greatest to flooding.
Students will be able to…Communicate the steps and results from an investigation in written reports.
Stage 2- Assessment EvidencePerformance Tasks:Use a model to investigate the movement of water and how it shapes land.Describe land features formed by water erosion and deposit of sediment.Label a Winnipeg map of the different landforms (i.e. meanders, oxbow, etc.).Recreate tide movement and describe the effects it has on shorelines.Complete assigned activity data sheets, landforms sheet and final group engineer assignment.
Other Evidence Activity 2AssessmentYou can evaluate your students on their lab reports using the following three-point rating scale:Three: accurate and complete description of each soil test; clear explanation of how tests would be used; careful and error-free writingTwo: satisfactory description of each soil test; explanation of how tests would be used lacking in clarity; some writing errorsOne: weak description; unclear or no explanation; numerous spelling and grammatical errors You can ask your students to contribute to the assessment rubric by determining what information should be included in the description of each soil test.
76
Materials Required
1 stream table per group (dishpan or rectangular aluminium baking pan with drainage holes drilled)
Modeling clay
sand & clay (For each stream table, 2 parts sand to 1 part clay– approx. 6 lbs needed total)
1 cup per group
Watering can per group Buckets with waterDrainage basin per group Textbooks/encyclopaedia/online access with info
about land/river formationsLaminated Winnipeg map per group 1 stream table per group (dishpan or rectangular
aluminium baking pan without drainage holes drilled)
Closed spatula for each group Gravel/small rocksThree soil samples: sand, agricultural soil (potting soil), and clay
Foliage (leaves, branches etc.)
Funnel per group Filter paper per groupThree graduated cylinders per group Blocks or books
Stage 3 – Learning PlanActivity 1:For additional student support, see BLM 9 to provide student groups with stream table scenarios (courtesy of Kirsten Morris).Prior KnowledgeStudents should be aware that- erosion is the process by which weathered rock and soil, or sediment, are transported- models simulate the real world but are not exactly like it- models help us to understand natural processes- landforms change over time
Materials Set-up1. Mix sand and clay in drainage basin. Dampen mixture with some water. 2. In the stream table, pour out the sand and clay mixture. Pack the sand and clay mixture evenly into the upper half of the stream table (do not cover the end with the drainage hole). 3. Set the ruler over the top part of the stream table. Balance the water source cup on the edge of the stream table and the ruler.4. Set the stream table on a flat surface such as a table. Place the wooden block under the upper end of the stream table to increase the slope.5. Place the drainage basin directly below the drainage hole of the stream table to catch water and sediment exiting the stream table.6. Fill bucket with water.
Procedures Teacher asks students how they think the local landforms were created. What caused the hills/mountains to be shaped the way they are? Why are there flat areas? What forces shaped the land? How did water play a part in the process? Introduce the river model and its purpose. Teacher explains to students: You will create a river model to help you understand a river system and the land features created by water moving downhill. Remember that models are used in science to help us understand natural processes. For the river model, imagine you are the size of a small ant. The sand represents the earth and the watering can represents the precipitation, such as rain or snow. Observe what happens to the land as the water flows
down the stream table. Students observe their river model and complete the accompanying data sheet. Teacher leads discussion of land features created by the river model and lists student responses on poster paper to create a list of land features that will be covered in this lesson. Teacher questions might include: If you could not see the water source, how would you know which way
77
the water is flowing? What seems to influence the course that the river takes? What features did you observe in the stream tables that remind you of real land features you have seen before? What happens to the earth that is pushed out of the way when the water cuts a river into your model? What happens to the sediment carried by your model rivers? What would happen to all the mountains and hills in the world if weathering, erosion, and deposition were the only forces shaping the land? Why does this not happen? Why is the Earth not flat?Teacher scaffolds discussion with new vocabulary (meanders, oxbows, alluvial deposits, sandbars, flood plains, deltas), using transparencies (see BLM #5, 6, 7) to show visuals of each part of the river system, highlighting the land features.Students read about the land features identified in the stream table model in the textbook, encyclopedia, or additional teacher provided resources. Students complete the Land Feature chart (OH 12.2). The slope of the first river model was not very steep. How might a steeper slope cause the river to flow differently and create different land features? Students create an investigation to study the effect of slope on water flow. To increase the slope of the river model add more wooden blocks. Discuss with students how to conduct a controlled experiment which fairly tests the effects of slope on river model. Students observe the difference in water flow and land features and collect and analyze data for a brief lab report.
Activity 2 Lessons 13 & 14Materials Set-up1. Use the modeling clay to build levees along the river’s banks and to form a canal leading from the river to a reservoir.2. Set the stream table on a flat surface such as a table. Place the wooden block or textbook under the upper end of the stream table to increase the slope.3. Place the drainage basin directly below the drainage hole of the stream table to catch water and sediment exiting the stream table.4. Fill bucket with water.Procedures Students have previously investigated the effects of an increase of slope on the riverbed. Ask students what might happen if water flow, instead of slope, increases on a gently sloping riverbed. Have students make a prediction and share with the class.Students run the flood stream table and observe how material is eroded and deposited. Present the following scenario to your students. The class is a team of “consulting engineers” for a new
housing development to be built in the next county. Many of the county's citizens are protesting the development. They are saying that the soil in that area will not hold the rain and there will be flooding problems for all dwellings in that area. But others believe this is just an excuse to delay and block the development.
Tell students that their challenge is to aid in the decision-making process by testing different samples of soil to see how much water the soil will absorb.
Divide your class into small groups, distributing materials to each group. Students should first test each type of soil in its dry state by measuring the same amount of each soil,
in turn, into a funnel lined with filter paper, and then pouring a measured amount of water through it. They should use the same amount of water for each type of soil. The water that drains through each type of soil should be collected in another graduated cylinder and the amount recorded.
Have students repeat the test using the same types of soil in their saturated states. Discuss with the class which soil held the most water when dry and which saturated soil held the most
water. Which type of soil would be most likely to cause flooding problems? Perform the same experiment again, but this time mix in different foliage such as branches and leaves
to represent trees, roots and other plants. Have each student record on a separate paper answers to the overhead (BLM #1) describing the soil
tests, and a final discussion of how communities and developers would use such tests.Students complete the accompanying data sheet - Activity 2 – Data Sheet and Flood Lab (BLM#4). Teacher leads discussion of student observations of the flood model. A connection is made between the Red and Assiniboine River and the flood model. Questions include: Where is the eroded material being deposited? Where are the largest sediment particles being deposited? The smallest sediment particles? Is a
78
delta forming? Where? Why is it forming there? Students observe the “controlled flood” river model and apply their knowledge of river systems and their study of how the human have modified their environment to deal with floods. Students complete the accompanying data sheet. Students to make predictions as to what would happen in regards to erosion and deposition in large bodies of water related to wave action and ice movements.Performance Task Assessment: Students look at a Winnipeg map. In groups, label the rivers with the new vocabulary. Then the students take the role of engineers and attempt to create an intervention for erosion and flooding. They are to determine where is needed the most along the two rivers and give reasons (see BLM#8). Then also need to discuss the positive and negative impacts of flooding and erosion related to the three aspects of Sustainable Development?Activity 3 Lesson 15Discuss with students how tides are caused. Get students to predict what they think happens to the shoreline due to tides.Have students create a shoreline of the sand/clay mixture in the stream table without holes drilled in it. Gradually add water and using a closed spatula move the water to the shore. Gradually get students to record what happens to the shoreline. Allow students to be creative and put a variety of things on the shoreline, such as rocks (gravel) or paper or “Monopoly” style houses.
Lesson 15Go through written assignments and discuss answers.
Teacher Background KnowledgeActivity 2A diversion is a channel constructed across the slope to divert excess concentrated and sheetsurface water, and possibly subsurface water, from areas under construction or development, tosites where it can be used or disposed of. This practice applies to sites where:· A diversion is required to control erosion and runoff on construction sites.· Concentrated runoff from higher lying areas is potentially damaging to a developing area.· Overland (sheet) surface flow and shallow subsurface flow caused by seepage ispotentially damaging to areas under construction.· Runoff is in excess and a diversion is required as part of a pollution abatement system.· Diversions shall not be substituted for terracing or land grading where such practices aremore appropriate for erosion control. Levee – is an embankment for preventing flooding or a continuous dike or ridge (of earth) for confining the irrigation areas of land to be flooded http://www.m-w.com/cgi-bin/dictionar
1997 Flood Facts99.9 % of Winnipeggers are protected by the four major flood control works (Shellmouth Dam & Reservoir, Assiniboine River Diversion, Red River Floodway and Primary Diking System). At the flood crest, the flow in the Red River approaching Winnipeg was 138,000 cubic feet per second, enough water to fill Winnipeg's Pan Am Olympic Pool once every second. Approximately half that flow was diverted around Winnipeg by the Red River Floodway. More than 3,000 City staff were involved in the flood effort for a 2 1/2 week period starting April 21st. 800 properties were protected by secondary dikes: 750 by sandbags and 50 by earth fill. Approximately 8.1 million sandbags were filled and delivered in the City. If you placed the sandbags end to end in a straight line, they would run roughly from Winnipeg to Vancouver. The City's four sandbag machines produced 4.4 million sandbags and volunteers hand filled 3.7 million sandbags. Sandbag removal was essentially complete by the end of June, 1997. Over 800,000 cubic yards (600,000 cubic meters) of clay was excavated for earth dike construction. This was approximately 45,000 truck loads. This earth would fill the Winnipeg Football Stadium to a height of 200 feet or a 20 storey building. The primary diking system was raised with earth fill in 25 locations an average of three feet. 50 temporary earth dikes were modified to become permanent structures. Of these, 10 were primary dikes and 40 were secondary dikes.
79
All the City's 34 flood pumping stations were operated and a total of 131 flap and positive gates were checked and/or operated in the sewer systems. The Flood Hotline handled 126,000 calls (peak day was 12,600 calls on April 30th). At the peak there were 60 operators and a 24 hour operation. The City's Flood Information page on the Internet was accessed over 143,000 times with a maximum of 14,800 hits on May 1st. There were 74 printed news releases and 24 live daily news conferences. For 16 consecutive days and nights, Videon and Shaw Cable TV covered the flood, including the daily news conferences. It is estimated that 77% of Winnipeggers watched the cable channels. City council members and staff conducted more than 2,000 media interviews. City staff placed more than 70,000 volunteers. It is estimated that sandbag diking required over 200,000 volunteer days, where one day is an eight hour shift. Almost 1,000 citizens attended the City's sandbag dike building demonstrations. Over 600 media personnel were covering the flood, including 150 national and international media from as far away as Germany, Holland and Japan. Over 9,000 city residents representing 3,000 homes, were evacuated during the flood, primarily in the south end of the City. By mid-May, 97% were returned home. More than 23,000 individuals received social services including shelter, food, clothing and personal services. The original scenario of the potential Z-dike failure meant the potential evacuation of 125,000 City residents. http://www.winnipeg.ca/Services/CityLife/HistoryOfWinnipeg/flood/flood_facts_1997.stm used with permission.
Activity 3What causes the tides?
It is the gravitational attraction of the sun and moon that cause waters of the ocean to raise and lower at different parts of the earth. Tides occur in oceans, and to a much smaller extent, tides also occur in large lakes, in the atmosphere, and within the solid crust of the earth. There are also non-astronomical factors, such as the configuration of the coastline, the local depth of the water, the ocean-floor topography, and other hydrographic and meteorological influences that play an important role in altering the range and interval between high and low water.
Why tides are important to humans?
The knowledge of the times, heights, and the extent of inflow and outflow of tidal waters is of importance in a wide range of practical applications for humans such as the following:
A. Commercial and recreational Navigation through coastal waterways, and within estuaries, bays, and harbours.
B. The establishment of chart datums for Hydrography, which are then used for demarcation of a base line or "coastline" for fixing offshore territorial limits, both on the sea surface and on the submerged lands of the Continental Shelf.
C. For the furnishing of data useful to fishing, recreational boating, surfing, and a considerable variety of related water sport activities and tourism activities.
D. Work on harbour engineering projects, such as the construction of bridges, docks, breakwaters. E. For the provision of information necessary for underwater military engineering uses.
Where are the largest tides in the world? What causes them to occur there?
The largest tidal ranges in the world occur in the Bay of Fundy (more exactly Minas Basin) and in Ungava Bay (more exactly Leaf Basin) on the East Coast of Canada, where you can observe a 16 metre (53 foot) tide range. Tidal range varies during the month according to phase of the moon. They are largest at the new and full moons, and smallest at the quarter phases. Tidal ranges in the Bay of Fundy and Ungava Bay are the highest in the world because of an unusual combination of resonance (or seiche) and the shape of the bay. The Bay of Fundy and Ungava Bay are "V" shaped, so that water entering at their wide mouth at the open ocean end is funneled into less and less space as it moves into the head of the bays and the water can only pile up and form a large tide. The water in the Bay of Fundy and Ungava Bay also has a natural rocking motion called a seiche. You could compare this to the movement of water in a bathtub. Although the water in a bathtub sloshes from one end to the other and back again in a few seconds, it takes about 13 hours for the water in the bays to rock from the mouth of the bays to the head of the bays and back again. The Atlantic ocean tide rising and flooding into the bay every 12 hours and 25 minutes reinforces the rocking motion. The seiche in the Bay of Fundy and Ungava Bay are therefore sustained by a pulse from the ocean tides.
Activity 3 background information is reproduced with the permission of the Canadian Hydrographic Service.
Homework ActivitiesCompletion of flooding questions if not finished in class.Finish 50% water use reduction chart.
81
Activity 1: Observing a River ModelData Sheet (OH 12.1)
You will make 3 observations: before, during,
and after the water flow.
For each observation do the following on your
stream table diagram:
draw and label any changes you observe draw and label the land features you
observe
Include the following on your stream table
diagram:
draw and label any changes you observe draw and label the land features you
observe
Describe what you observe about the stream
table.
82
Première activité : Observer une feuille d’information sur un modèle de rivière (OH 12.1)
Vous ferez 3 observations : avant, pendant et après la coulée de l’eau.
À chaque observation, faites ce qui suit sur votre schéma de coulée d’eau :
Dessinez et étiquetez tout changement que vous observez
Dessinez et étiquetez les aspects physiques du terrain que vous observez
Décrivez ce que vous observez au sujet de la coulée d’eau.
83
Land Features Chart (OH 12.2)Land/River
Feature Written description Diagram
Meanders
Oxbows
Sandbars
Flood plains
Deltas
84
Tableau des aspects physiques du terrain (OH 12.2)
Trait de terre/rivière Description écrite Diagramme
Méandres
Virages en U
Bancs de sable
Basse-terres inondables
Deltas
85
86
Activity 2: FloodData Sheet (OH 12.3)
You have observed river models that vary in the
steepness of slope. Now you will see what
happens when the flow of water changes from
normal to a flood.
Run 3 cupfuls of water through the water source
cup.
For the observation do the following on your
stream table diagram:
draw and label any changes you observe draw and label the land features you observe
Describe where the eroded material is being
deposited.
How is this model the same/different from the
previous model you have observed?
87
Activity 2: FloodFeuille de données (OH 12.3)
Vous avez observé des modèles de rivières qui
varient dans le degré de la pente. Maintenant
vous verrez ce qui arrive quand l’écoulement
d’eau change de la normale à l’inondation.
Faites passer 3 tasses d’eau à travers la tasse
d’eau source.
Pour l’observation, faites ce qui suit sur votre
schéma de coulée d’eau :
dessinez et étiquetez tout changement que vous observez
dessinez et étiquetez les traits du terrain que
vous observez
Décrivez où se dépose la matière érodée.
Comment ce modèle est-il semblable/différent du
modèle précédent que vous avez observé?
88
Name : ____________
Flooding lab (OH 12.4)
Amount of water added Amount drained out
1st attempt 2nd attempt 1st attempt 2nd attempt
SoilSandClay
Adding of foliageSoilSandClayAnswer the following questions on a separate piece of paper. If any questions are not completed in class it will be for homework.1. Explain why a river can flood even if there was no recent rain in that section of the river valley?2. Why are sediments found in rivers? Discuss how rivers carry sediments and explain how this impacts the land during a flood.3. What characteristics determine how much water soil can hold?4. Debate the merits of building dams upstream to prevent flooding that can make former floodplains available for development.5. Discuss why hydrologists (scientists who study the water cycle) track snow accumulation as a part of long-term flood forecasting. What other data would help them make more accurate flood predictions?6. What happens to the water capacity of each soil when foliage is added?7. How does growing trees and other plants with significant root systems affect flooding?8. Discuss with your group whether or not people should be allowed to rebuild homes in an area prone to serious flooding. 9. As the soil engineer, would you recommend the development if the soil in the area was mainly sand? If it were mainly regular soil? If it were mainly clay? 10. What are the positive and negative impacts flooding has on all three aspects of sustainable development?
89
Nom : ____________
Laboratoire d’inondation (OH 12.4)
Montant d’eau ajoutée
Montant d’eau drainée
SolSableGlaiseAddition de feuillageSolSableGlaiseRépondez aux questions suivantes sur une feuille de papier séparée. Toute question non complétée en classe deviendra un devoir.
1. Expliquez pourquoi une rivière peut inonder même s’il n’y a pas eu de pluie récente dans cette section de la vallée de la rivière.2.Pourquoi trouve-t-on des sédiments dans les rivières? Discutez comment les rivières transportent les sédiments et expliquez l’effet que cela a sur la terre durant une inondation.3.Quelles caractéristiques déterminent combien d’eau la terre peut contenir? 4. Débattez les mérites de la construction de barrages en amont pour empêcher les inondations, ce qui permet le développement de terres anciennement inondables.5. Discutez pourquoi les hydrologues (scientifiques qui étudient le cycle de l’eau) tiennent compte des accumulations de neige pour pouvoir prédire de loin les inondations. Quelles autres données pourraient les aider à prédire plus précisément les inondations? 6. Qu’arrive-t-il à la capacité d’eau de chaque sol quand on y ajoute du feuillage? 7. Quel effet cela a-t-il sur les inondations quand on fait pousser des arbres et d’autres plants aux systèmes de racines importants?
90
8. Discutez avec votre groupe si oui ou non on devrait permettre la reconstruction de maisons dans une région portée à de sévères inondations. 9. Comme ingénieur de terrain, recommanderiez-vous le développement si le sol dans la région était surtout du sable? Surtout un sol régulier? Surtout de la glaise? 10. Quels sont les effets positifs et négatifs de l’inondation sur les trois aspects du développement soutenable?
91
Group Members____________ ______________
_____________ _____________
Winnipeg Rivers 12.8
Where are the top three areas as an engineer you would protect Winnipeg from either flooding or erosion? Please include which river and cross streets of importance.1. ____________________________________________________
Human health and well being? ___________________________________________________________________________________
92
Rivières de Winnipeg 12.8
En tant qu’ingénieur, quelles trois régions de Winnipeg protégeriez-vous contre l’inondation ou l’érosion? Veuillez indiquer quelle rivière et quel carrefour important.1. ____________________________________________________
Quel effet l’inondation/l’érosion a-t-elle (pensez aux possibilités positives et négatives) sur :L’économie locale : ____________________________________
These are assigned to groups after they have done the first stream table activity. This can be part of lessons 12, 13, 14, 15.OPTIONAL . Clay for rocks and boulders, trees (Christmas decorations or foam stickers), people (foam decorations or whatever works), houses (Monopoly houses .. or small banks of staples work too) and anything else you can think of to represent a human and nature presence.
Scenario #1 Start with a “fresh” stream table.
Using your observations and the information you gathered in your first stream table, spray or carefully pour water to recreate the Red River around Scotia Street. In your design, include people, houses, trees… etc
Scenario #2 Start with a “fresh” stream table.
Increase the slope of your stream table. B spraying or pouring water form as many of these as you can: delta, sandbars, watershed, oxbow, floodplain…. etcIn your design, include people, houses, trees… etc
Scenario #3 Start with a “fresh” stream table.
Use clay to build banks that would best protect the people, houses, work places, vegetation etc. Then, by pouring water very quickly, create a flash flood.What happened? Did the banks give the needed protection?In your design, include people, houses, trees… etc
94
Scenario #4 Start with a “fresh” stream table.
Using your observations and the information you gathered in your first stream table, spray or carefully pour water to recreate the Red River around Kingston Crescent. In your design, include people, houses, trees… etc
Scenario #5 Start with a “fresh” stream table.
Create a very wet spring. Slowly and gently spray water along the entire top of the stream table. This represents many days of rain. Observe the changes in rivers, tributaries water sheds, etc.In your design, include people, houses, trees… etc
95
Scénarios de tables d’écoulement MLN 12,9
Ceux-ci sont assignés à des groupes après qu’ils ont fini leur première activité de table d’écoulement. Ceci peut faire partie des leçons 12, 13, 14, 15.
FACULTATIF : De la glaise pour les roches et les grosses pierres, les arbres (des décorations de Noël ou des collants en mousse), les gens (décorations en mousse), les maisons (des maisons de Monopoly … ou des petits paquets d’agrafes peuvent servir aussi) et n’importe quoi d’autre qui vous vient à l’esprit pour représenter une présence humaine et naturelle.
Scénario No. 1 Commencez avec une table d’écoulement «vierge».
Selon vos observations et les informations garnies dans votre première table d’écoulement, vaporisez ou versez doucement de l’eau pour recréer la rivière Rouge autour de la rue Scotia. Dans votre maquette, incluez gens, maisons, arbres … etc.
Scénario No. 2 Commencez avec une table d’écoulement «vierge».
Augmentez la pente de votre table d’écoulement. En vaporisant ou en versant de l’eau, formez autant des choses suivantes que possible : un delta, des bancs de sable, un bassin hydrographique, un virage en U, une plaine d’inondation … etc. Dans votre maquette, incluez gens, maisons, arbres … etc.
Scénario No. 3 Commencez avec une table d’écoulement «vierge».
Avec de la glaise, construisez des rives qui offriront la meilleure protection aux gens, aux maisons, aux lieux de travail, à la végétation, etc. Puis, en versant de l’eau très rapidement, créez une inondation éclair.Qu’est-ce qui est arrivé? Est-ce que les rives ont offert la protection nécessaire? Dans votre maquette, incluez gens, maisons, arbres … etc.
96
Scénario No. 4 Commencez avec une table d’écoulement «vierge».
Selon vos observations et les informations garnies dans votre première table d’écoulement, vaporisez ou versez doucement de l’eau pour recréer la rivière Rouge autour du croissant Kingston. Dans votre maquette, incluez gens, maisons, arbres … etc.
Scénario No. 5 Commencez avec une table d’écoulement «vierge».
Créez un printemps très pluvieux. Vaporisez lentement et gentiment de l’eau tout le long du haut de votre table d’écoulement. Ceci représente plusieurs jours de pluie. Observez les changements dans les rivières, les affluents, les bassins hydrographiques, etc. Dans votre maquette, incluez gens, maisons, arbres … etc.
97
Lesson 16Stage 1 – Desired Results
Established Goals:8-4-03 Compare and contrast characteristics and properties of fresh and salt water. Examples: freezing point, density, dissolved materials, global distribution, relative amounts, biologically diverse components of each… GLO: D3, D5, E1Understandings:Students will understand that…They can make a choice to decrease the amount of water they use.
Essential Question:What are the various ways humans impact water and how do they attempt to fix the water they have damaged?
Students will know… How to decrease their individual water consumption
Students will be able to…Make choices for their own consumption of water
Stage 2- Assessment EvidencePerformance Tasks:Students to share ability to decrease water consumption by 50%Students to share methods of decreasing water consumption.
Other Evidence:Students design an eye-catching poster to share with others.
Materials RequiredWater use chart competedPoster paperPencil crayons/markers
Stage 3 – Learning PlanTeacher to record how many of the students were able to decrease their water consumption amount by 50% on the board.Students will share with the class creative ways they have reduced their water use.Students will create posters to put up either within the school or other places (home, community centre, arenas) to share methods of decreasing water.
Homework Learning ActivitiesMinimum of 1 poster per student to be completed by the following class. Poster to be evaluated by student (see BLM#1). Evaluation to be written on the back of the poster.
98
Poster Self-Assessment (OH 16.1)
Did I clearly explain why water is important (either visually or with text) 3 2 1
Did I clearly explain how to decrease water use?3 2 1
Is the poster creative?3 2 1
Where will I hang up this poster?
__________________________
Will I actually hang it up?1 0
Total ____/10
99
Auto-évaluation de l’affiche (OH 16.1)
Est-ce que j’ai expliqué clairement pourquoi l’eau est importante (soit visuellement ou textuellement) 3 2 1
Est-ce que j’ai expliqué clairement comment diminuer l’usage de l’eau?
3 2 1
Est-ce que l’affiche est créatrice?3 2 1
Où est-ce que je vais poser cette affiche?
__________________________
Est-ce que je vais vraiment l’afficher? 1 0
Total ____/10
100
Lessons 17, 18, 19, 20Stage 1 – Desired Results
Established Goals:8-4-14 Identify sources of drinking water and describe methods for obtaining water in areas where supply is limited. Examples: desalination, melting of ice, condensation… GLO: B1, B2, B3, D58-4-16 Compare the waste-water disposal system within their communities to one used elsewhere. Include process involved, environmental impact, cost. GLO: B2, B5Understandings:Students will understand that…In different regions of the world water is accessed and disposed of in different ways.
Essential Question:What are the various ways humans impact water and how do they attempt to fix what they have damaged?How do we learn about water from a sustainability focus?
Students will know… Winnipeg gets its drinking water from Shoal LakeWinnipeg’s wastewater gets treated at one of three facilities in Winnipeg and is then discharged into the Red River.
Students will be able to…Share how other countries get their water and/or dispose of their waste.
Stage 2- Assessment EvidencePerformance Tasks:View City of Winnipeg videos (can be rented from local library) and complete pre/post test.Students in small groups to create a public service announcement as to where other countries get their drinking water and where their wastewater goes.
Other Evidence:Students will work together to create an engaging and information-sharing product.
Materials Required2 City of Winnipeg videos (At the Turn of the Tap [11 minutes] & Down the Drain [13 minutes])Internet access – for additional information if required
Stage 3 – Learning PlanLesson 17*** Get students to do self-evaluation of poster due this class and tell teacher for recording***Teacher gets students to do pre-test (BLM # 1) on Winnipeg’s water supply and treatment. Then students to watch 2 videos about the city of Winnipeg (approximate time: At the Turn of the Tap 11 minutes, Down the Drain 13 minutes) and briefly go over their post-test.In small groups of 4, students will be given an article on a region to do additional research and either video tape a 3 minute PSA or act out in front of the class (see BLM #2) – students are given article to read for homework prior to next class and should come with some ideas of how to proceed (all articles courtesy of UNICEF. Used by permission.)Lessons 18 & 19Students are given time to plan the PSA.Students should find their country on a map prior to starting to get an idea of where it is in the world.Lesson 20Students are to present their PSAs.
Homework Learning ActivitiesRead article on country.Work on any additional research or presentation at home
Extension Learning ActivitiesThe best announcements can be shared at a school assembly
101
Pre & Post Test for Water Supply and Treatment in Winnipeg (OH 17.1)
1.Where does Winnipeg’s water originate from?2.What year was Winnipeg’s water system built?3.How does the water get to Winnipeg?4.How much did the water system cost?5.How long does it take 7 thousand million litres of water
to be used up by the City of Winnipeg?6.Which water reservoir do you think services our area?7.On average, how many litres of water per person is used
in the City of Winnipeg each day?8.Is the water from our taps safe to drink?9.How many pollution control centres are there in
Winnipeg?10. Where does the water go after it has been treated?11. What year did Winnipeg open up its first water treatment facility?12. Which pollution control centre do you think services our area?13. What does the North End Treatment Facility do with the methane gas it produces?14. Why is it important to fix leaks in regards to the water treatment facilities?15. How do you feel about the quality of your drinking water?
102
Pré & Post Test pour l’approvisionnement et le traitement de l’eau à Winnipeg (OH 17.1)
1.D’où vient l’eau de Winnipeg?2.En quelle année le système d’eau de Winnipeg a-t-il été
construit?3.Comment l’eau parvient-elle à Winnipeg?4.Combien le système d’eau a-t-il coûté?5.Combien de temps faut-il pour que Winnipeg utilise 7
mille millions de litres d’eau?6.Selon vous, quel réservoir dessert notre région? 7.En moyenne, combien de litres d’eau sont utilisés par
personne à Winnipeg chaque jour? 8.Peut-on boire l’eau de nos robinets en toute sécurité?9.Combien de centres de contrôle de pollution y a-t-il à
Winnipeg?10. Où va l’eau après avoir été traitée? 11. En quelle année Winnipeg a-t-elle ouvert son premier centre de traitement de l’eau? 12. Selon vous, quel centre de contrôle de pollution dessert notre région?13. Qu’est-ce que le centre de traitement de la région Nord fait du gaz méthane qu’il produit? 14. Pourquoi est-il important de réparer les fuites quand il s’agit d’un centre de traitement d’eau? 15. Comment vous sentez-vous par rapport à la qualité de votre eau potable?
103
Public Service Announcement Assessment (17.2)Group members
Public Service Announcement AssessmentGroup members
___________ _____________________ __________
Total ___/20 5 4 3 2 1
Water supply
Waste disposal
Creativity
Organization
104
105
Évaluation des annonces du service public (17.2)Group members
___________ _____________________ __________
Total ___/20 5 4 3 2 1Approvisionnement
d’eauDisposition des
déchets
Créativité
Organisation
Évaluation des annonces du service public (17.2)Group members
___________ _____________________ __________
Total ___/20 5 4 3 2 1Approvisionnement
d’eauDisposition des
déchets
Créativité
Organisation
106
Small water purifiers make a major difference in keeping Ethiopian children healthy
(17.3 page 1 of 2)
Dereje Abdeta dips a bucket into the polluted waters of the Awash River to take a sample just a few metres from where a group of young herders have brought their cattle to drink. “The water is highly contaminated with organic material. We have tested it, and a there is a lot of bacteria,” says Mr. Abdeta, a consultant working for UNICEF’s Water, Environment and Sanitation [WES] section for the central and southern regions of Ethiopia. But help is at hand. As part of its emergency water response, UNICEF is bringing safe drinking water to the people of Awash-Malkasa, Ethiopia using water purification equipment received as a contribution from the Norwegian government. Since June 2003, 10 units have arrived in Ethiopia. Five have already been installed and are up and running in Oromia, Somali, Afar and Southern Nations, Nationalities and Peoples regions. Ten more units, which cost about $17,000 each, are scheduled to arrive early this year.“We will put this equipment where there are high health risks and diarrhoea in emergency areas and where there are highly polluted ponds and rivers,” says Mr. Abdeta.The same water purification technology has been used all over the world from Afghanistan and Mozambique to the former Yugoslavia in the aftermath of natural disasters like floods, earthquakes and volcanoes, or man-made ones like war.“The Norweigan government asked our company, Plastec AS, to assist after UNICEF said there was a need for clean water in Ethiopia,” explains Steinar Langedahl, who is overseeing the installation of purification equipment. “These are small units, easy to handle, even for unskilled personnel, and they work for nearly every kind of water source. If used properly, you can run them for about 10 years,” he adds. “Minor repairs can be done here. For bigger repairs, Plastec AS can supply the parts.”The metallic hum of the pump powered by its diesel engine fills the air and can be heard over the mooing of the nearby cows. Water from the river is pumped through tubes into a chamber where water purification tablets are added. These bind to the sediment particles, making them bigger and easier to separate from the liquid. The water flows through two filters where the sediment is filtered and the water is chlorinated. The purified water is then channelled into two large tanks, which provide safe drinking water for nearby villages. This area of Awash-Malkasa was selected for the project after a joint water supply assessment was conducted by the Ethiopian Zonal Water Bureau and UNICEF between May and July 2003. “If we get more units, we can increase water supply coverage and reduce water-borne diseases, as purification saves a lot of lives during drought or flood emergencies,” says Haile Gashaw, Assistant Project Officer for UNICEF Ethiopia’s WES section. “We face a lot of diarrhoea and cholera in such areas, and with this equipment we can reach people immediately.”
107
(17.3 page 2 of 2)
The system can process an average of 4,000 litres of water per hour. Highly polluted water takes longer – 2,000 to 3,000 litres per hour. Each unit can provide for between five and 10 litres of drinking water for 5,000 people per day.
“Safe water can really change people’s lives. I’ve talked to many women who say it makes a big difference. They say they have less waterborne diseases and diarrhoea,” says Lillian
Wikstrom, an advisor for the Norwegian Ministry of Foreign Affairs, as she inspects the purification system equipment in Awash-Malkasa. “It’s inspiring to see our efforts taking off on the ground. People are really satisfied, and it’s sustainable. It’s the best payback anyone can have.”www.unicef.org
Les petits purificateurs d’eau jouent un grand rôle dans la bonne santé des enfants éthiopiens (17.3 page 1 de 2)
Dereje Abdeta plonge son seau dans les eaux polluées de la rivière Awash pour prendre un échantillon à quelques mètres de jeunes bouviers qui ont mené leur bétail à boire. «L’eau est très contaminée de matières organiques. Nous l’avons testée et il y a beaucoup de bactéries», dit M. Abdeta, un conseiller qui travaille pour la section d’eau, d’environnement et d’aménagement sanitaire [EEA] de l’UNICEF dans les régions centrale et sud de l’Éthiopie. Mais l’aide est là. Avec sa solution pour les urgences d’eau, l’UNICEF apporte une bonne eau potable au peuple d’Awash-Malkasa, en Éthiopie, grâce à l’équipement de purification d’eau reçu comme contribution du gouvernement norvégien. Depuis juin 2003, 10 unités sont arrivées en Éthiopie. Cinq ont déjà été installées et sont utilisées régulièrement dans les régions d’Oromie, de Somalie, d’Afar et des Nations, Nationalités et Peuples du Sud. Dix autres unités, coûtant environ 17 000$ chacune sont sensées arriver tôt cette année. «Nous installerons cet équipement là où il y a d’énormes risques de santé et de diarrhée dans des régions urgentes et où les rivières et les étangs sont extrêmement pollués,» dit M. Abdeta. On se sert de cette technologie de purification d’eau à travers le monde, depuis l’Afghanistan et la Mozambique à l’ancienne Yougoslavie suivant des désastres naturels comme des inondations, des séismes et des volcans, ou encore les guerres produites par l’homme.«Le gouvernement norvégien a demandé à notre compagnie, Plastec AS, de les aider après que UNICEF eut déclaré le besoin d’eau propre en Éthiopie,» a expliqué Steinar Langedahl, qui surveille l’installation de l’équipement de purification. «Ces unités sont petites, faciles à manier, même pour un personnel non qualifié et elles fonctionnent pour presque toutes les sources d’eau. Si on s’en sert correctement, elles peuvent servir pour une dizaine d’années,» a-t-il ajouté. «Les réparations mineures peuvent être faites sur place. Pour des réparations majeures, Plastec AS peut fournir les pièces.» Le vrombissement métallique de la pompe actionnée par un moteur diesel remplit l’air et on peut l’entendre au-dessus du beuglement des vaches tout près. L’eau de la rivière est pompée à travers de tuyaux dans un réservoir où on y ajoute des comprimés de purification. Ceux-ci se rattachent aux particules sédimentaires, les rendant plus grosses et plus faciles à séparer du liquide. L’eau passe à travers deux filtres où le sédiment est filtré et l’eau est javellisée. L’eau purifiée est ensuite canalisée vers deux grandes citernes qui fournissent une eau potable saine aux villages environnants. Cette région d’Awash-Malkasa fut sélectionnée pour le projet après qu’une évaluation combinée de l’approvisionnement d’eau fut menée par le Bureau de la zone éthiopienne de l’eau et UNICEF entre mai et juillet 2003. «Si nous avons plus d’unités, nous pouvons augmenter le montant d’eau disponible et réduire les maladies portées par l’eau, puisque la purification sauve beaucoup de vies pendant les urgences de sécheresse ou d’inondation,» dit Haile Gashaw, Officier adjoint de projet pour la section EES éthiopienne de l’UNICEF. «Nous faisons face à beaucoup de diarrhée et de choléra dans ces régions, et avec cet équipement nous pouvons rejoindre les gens immédiatement.»Le système peut traiter une moyenne de 4 000 litres d’eau par heure. L’eau extrêmement polluée prend plus de temps – 2 000 à 3 000 litres par heure. Chaque unité peut fournir entre cinq et dix litres d’eau par jour à 5 000 personnes. «Une eau saine peut vraiment changer la
109
(17.3 page 2 de 2)vie des gens. J’ai parlé à bien des femmes qui ont dit que ça faisait une grande différence. Elles ont dit qu’elles avaient moins de maladies portées par l’eau et de diarrhée,» a dit Lillian Wikstrom, conseillère au Ministère des affaires étrangères norvégien, en inspectant l’équipement du système de purification à Awash-Malkasa. «C’est inspirant de voir nos efforts prendre leur envolée sur le terrain. Les gens sont vraiment satisfaits, et c’est soutenable. C’est le meilleur retour sur investissement que n’importe qui pourrait avoir.»www.unicef.org
Guinea worm causes physical pain for people, economic pain for countries
(17.4 page 1 of 2)
John Jal Youl pulls up a pant leg and points to a faded scar on his ankle. "That is where he came out," he says, brushing his hand over a pink circle on his weathered black skin. "The wound burned like a fire."The 52-year-old man from the town of Malakal in Upper Nile State in southern Sudan sounds like a possessed man speaking about exorcising a demon. Which is just how most victims of guinea worm describe their horrible ordeal in the grips of "the fiery serpent," as the disease has been called. Guinea worm is a painful, debilitating and gruesome disease that is contracted when a person consumes stagnant water contaminated with microscopic fleas carrying infective larvae. The larvae mature and grow inside a person's body, with worms sometimes growing to be over a metre long. The worm winds through the body and after a year, slowly emerges through an agonizingly painful blister in the skin. There is no cure."In the beginning, it started like a fever," recalls Mr. Youl. "After that, my body started to swell. Then I had pain around the hips and legs. It took about one month for the whole thing to come out." "Guinea worm disease affects productive people. It's very painful and people can't work. Then it becomes an economic hazard," explains Dr. Emmanuel Baya, UNICEF Resident Project Officer in Malakal."Children just become bedridden. If the rest of the family has the disease, there is no one to care for them. So it affects the whole productive capacity of the community." A global campaign is underway to eradicate guinea worm disease (also known as dracunculiasis) by 2005. The effort is being led by UNICEF, the World Health Organization (WHO), and the Carter Center (a humanitarian organization founded by former President Jimmy Carter), along with other partners. Enormous strides have been made: there has been a 98 per cent reduction in new cases from some 3.2 million cases in 1986. Guinea worm and polio may become the first diseases since smallpox to be wiped off the earth.Sudan is the world's largest reservoir of guinea worm disease, with 70 per cent of the 35,000 cases provisionally reported in 2003. Ghana and Nigeria are the next largest endemic countries.Traditional beliefs have also sustained the disease. "There are two beliefs about how you get it," says Mr. Youl who supervises the guinea worm eradication programme in the state of Jonglei, one of the worst affected areas in Sudan.. “The first is that if someone has it and you step on his urine, you will contract it. The second is that if someone has guinea worm and you touch them, you can get it."Mr. Youl and teams of health workers educate villagers about the real sources of the disease. They teach people about using safe sources of clean water, and distribute simple filters — clay or metal tubes with cloth screens over one end — that can strain out the larva-carrying insects. They instruct those infected with the disease not to bathe in communal water sources so they don't spread the disease.
111
(17.4 page 2 of 2)
"I also go to schools and talk to children about the danger of guinea worm, and I go to talk to people in church,” he says. “In the beginning, people don't usually believe me. But after
seeing how people who use the filter are not affected by the disease, they begin to ask questions."
The ultimate cure for guinea worm disease is not a pill or a filter. It is peace. Dr. Baya has seen proof of this first-hand. "In East Equatoria State [in Sudan] there was a village where almost everyone had guinea worm," he recalls. During a lull in fighting, "UNICEF sank one borehole that delivered clean water to the community. In one year, all the guinea worm cases were gone." UNICEF has linked its guinea worm eradication efforts in Sudan to local peace building initiatives. In 2001, the organization helped broker a peace agreement in the states of Jonglei and Upper Nile between two ethnic Nuer groups that had been warring for years, at a cost of thousands of lives. The mediators offered the warring parties a universally appealing incentive to make peace: the promise of boreholes, which meant, among other things, that guinea worm disease might vanish from the area. The peace compact was signed in 2001, and the worm, John Jal Youl hopes fervently, "is in retreat."www.unicef.org
Le ver de Guinée cause une douleur physique aux gens et une douleur économique aux pays
(17.4 page 1 de 2)
John Jal Youl remonte un côté de son pantalon et indique une cicatrice fanée sur sa cheville. «C’est là qu’il est sorti,» dit-il, frôlant sa main sur un cercle rose sur sa peau noire vieillie. «La blessure brûlait comme un feu.» L’homme de 52 ans de la petite ville de Malakal dans l’État du Nil en Amont au sud du Soudan semble être un homme possédé qui parle d’exorciser un démon. Voilà comment la plupart des victimes du ver de guinée décrivent leur horrible épreuve aux prises du «serpent enflammé», comme on appelle cette maladie. Le ver de guinée est une maladie douloureuse, débilitante et horrible qui est contractée quand une personne boit de l’eau stagnante contaminée de puces microscopiques qui portent des larves infectieuses. Les larves se développent et grandissent à l’intérieur du corps de la personne, avec des vers qui grandissent parfois à plus d’un mètre. Le ver s’insinue à travers le corps et, après un an, en sort lentement par une ampoule dans la peau dans une douleur agonisante. Il n’y a aucun remède. «Au début, ça a commencé comme une fièvre,» se rappelle M. Youl. «Après ça, mon corps a commencé à s’enfler. Puis, j’ai eu des douleurs autour des hanches et des jambes. Cela a pris environ un mois pour que toute la chose sorte». «La maladie du ver de guinée affecte les gens productifs. C’est très douloureux et les gens ne peuvent pas travailler. Alors, ça devient un hasard économique,» explique le docteur Emmanuel Baya, Officier de projet en résidence pour l’UNICEF à Malakal. «Les enfants sont cloués au lit. Si le reste de la famille est atteint par la maladie, il n’y a personne pour s’occuper d’eux. Alors, cela affecte toute la capacité productive de la communauté». Une campagne globale est en voie pour déraciner la maladie du ver de guinée (nom scientifique : dracunliasis) dès 2005. L’effort est mené par l’UNICEF, l’Organisation mondiale pour la santé (OMS), le Centre Carter (une organisation humanitaire fondée par l’ancien président Jimmy Carter) et d’autres partenaires. De grandes avances ont été faites : il y a eu une réduction de 98% dans les nouveaux cas à partir des 3,2 millions de cas en 1986. Il se peut que le ver de guinée et le polio soient les premières maladies depuis la variole à être effacées de la surface de la terre. Le Soudan est le plus grand réservoir mondial pour la maladie du ver de guinée, avec 70% des 35 000 cas provisoirement rapportés en 2003. Le Ghana et le Niger sont les prochains plus grands pays endémiques. Des croyances traditionnelles ont aussi maintenu la maladie. «Il y a deux croyances sur comment on peut la contracter,» dit M. Youl qui surveille le programme d’éradication du ver de guinée dans l’état de Jonglei, une des régions les plus affectées du Soudan. «La première, c’est que si quelqu’un l’a et vous marchez dans son urine, vous la contracterez. La seconde est que si quelqu’un a un ver de guinée et que vous le touchez, vous pouvez l’attraper.» M. Youl et des équipes de travailleurs pour la santé instruisent les villageois sur les vraies sources de la maladie. Ils enseignent aux gens comment utiliser des sources d’eau propre en toute sécurité, et distribuent de simples filtres – des tuyaux en glaise ou en métal avec un tamis en étoffe à un bout – pour filtrer les insectes porteurs de larves. Ils avertissent ceux qui sont atteints de la maladie de ne pas se baigner dans les sources d’eau communes pour ne pas répandre la maladie.
113
(17.4 page 2 de 2)
«Je vais aussi dans les écoles parler aux enfants au sujet du danger du ver de guinée, et je vais en parler aux gens dans les églises,» dit-il. «Au début, les gens ne me croient généralement pas. Mais après avoir vu comment les gens qui se servent du filtre ne sont pas affectés par la maladie, ils se mettent à poser des questions.»Le remède ultime pour la maladie du ver de guinée n’est ni une pilule ni un filtre. C’est la paix.«Dans l’État équatorial est [au Soudan] il y a un village où presque tout le monde avait le ver de guinée,» se rappelle-t-il. Durant une accalmie pendant la guerre, «l’UNICEF a creusé un trou de sondage qui a livré de l’eau propre à la communauté. En un an, tous les cas de ver de guinée étaient partis.» L’UNICEF a lié ses efforts d’éradication du ver de guinée au Soudan aux initiatives pour bâtir une paix locale. En 2001, l’organisme a aidé à forger un accord de paix dans les états de Jonglei et du Nil Supérieur entre deux groupes ethniques Nuer qui se faisaient la guerre depuis des années, au prix de milliers de vies. Les médiateurs ont offert aux deux parties guerrières un stimulant universellement attrayant pour faire la paix : la promesse de trous de sondage, ce qui voulait dire, entre autres, que la maladie du ver de guinée pourrait disparaître de leur région.Le pacte de paix fut signé en 2001, et le ver, John Jal Youl espère fervemment, «qu’il est en voie de disparition.»www.unicef.org
Bringing water, bringing life to people in the most remote areas of Turkmenistan
(17.5 page 1 of 2)
People in Turkmenistan equal water to something precious. “A drop of water is a grain of gold,” says the old Turkmen proverb. It is especially true for more than a million citizens of Dashoguz province in the north of the country which represents one fifth of Turkmenistan’s population. Dashoguz province is where people struggle ever day to have access to safe drinking water.
With the territory twice as big as Belgium, Dashoguz is located in the desert Kara Kum, which covers more than 80% of Turkmenistan’s territory. The shortage of water resources in this region is caused by the widespread desert landscapes and saline soils. The region is a big producer of wheat, rice, cotton and vegetables, thus, the situation with water resources is aggravated by high water intake for irrigation and soil leaching and low efficiency of irrigation systems.
An environment and people’s health in Dashoguz are also affected by the Aral Sea dry out. Once a glowing oasis, the Aral Sea territory is now occupied by vast amount of saline that is spread by the winds to the air and causes acute respiratory illnesses among children.
The only rescue is the Amu Darya river, the most vital water resource in the country. But Amu Darya is also saline because upstream countries discharge their drainage effluent into river systems. Water becomes successively more saline as it goes towards lower areas. And unfortunately, Turkmenistan is located much downstream.
Until 2000, families in Gurbansoltan Edje district (formerly Yylanly) in Dashoguz province had no choice but to drink saline, often bitter tasted unsafe water that served as a major cause of diarrhea and other waterborne diseases among children. Since UNICEF has established the desalinization plant in this district in 2000, people have better access to safe drinking water.
“The plant filters and chlorinates about 30-40 tonnes of water daily and that is enough for Gurbansoltan Edje district with population of more than 20,000. This year UNICEF has upgraded our plant and now the capacity has tripled, and we are able to produce up to 120-130 tonnes per day,” says Gochmuhammet Amanov, Director of the Desalinization Plant. “This will allow us to serve the drinking water needs and, thus, contribute to the improvement of health condition of thousands of people in our district as well inhabitants of neighbouring districts,” Mr. Amanov says in excitement.
Provision of safe water supply and sanitary facilities, particularly in schools, and promoting hygiene education in basic schools, health facilities and at the community level are the main focus of UNICEF’s Water and Sanitation programme in Turkmenistan.
115
(17.5 page 2 of 2)
In the sweaty summer season requirement for safe drinking water increases in many folds – exception is not in Dashoguz velayat. Citizens of Gurbansoltan Edje district have advantage
of using the desalinized safe water, but many more in the region suffer from inadequate provision of safe water. The next available desalinization plant is 130 km away from Gurbansoltan Edje district making it difficult for many families to have access to safe drinking water.
“We wish people in our districts also had an access to safe water,” voiced their concern the representatives of the Drinking Water Association of other districts. “Establishment of desalinization plants in our districts could dramatically improve the health of our people and we wish UNICEF to come forward to help us as well.”
www.unicef.org
116
L’EAU TRÈS SALÉE, APPORTER LA VIE AUX GENS DANS LES RÉGIONS LES PLUS ÉLOIGNÉES DU TURKMÉNISTAN
(17,5 page 1 de 2)
Les gens du Turkménistan équivalent l’eau à quelque chose de précieux. «Une goutte d’eau, c’est un grain d’or», selon un vieux proverbe turkmène. C’est surtout vrai pour plus d’un million de citoyens de la province de Dashoguz au nord du pays qui représente un cinquième de la population du Turkménistan. C’est dans la province de Dashoguz qu’on trouve des gens qui luttent chaque jour pour avoir accès à de l’eau potable sécuritaire.
Comprenant un territoire deux fois plus grand que la Belgique, Dashoguz est située dans le désert Kara Kum qui couvre plus de 80% du territoire du Turkménistan. La pénurie de ressources d’eau dans cette région est causée par des paysages désertiques répandus et des terres salines. La région est un grand producteur de blé, de riz, de coton et de légumes, donc l’état des ressources d’eau est aggravé par la prise d’eau élevée pour l’irrigation, ainsi que la dissolution du sol et le peu d’efficacité des systèmes d’irrigation.
L’environnement de Dashoguz et la santé des gens sont aussi affectés par le dessèchement de la mer Aral. Jadis un oasis luxuriant, le territoire de la mer Aral n’est plus qu’un vaste salinage qui se répand par le vent dans l’air et cause des maladies respiratoires aiguës chez les enfants.
La seule rescousse, c’est la rivière Amu Darva, la ressource d’eau la plus importante au pays. Mais l’Amu Darva est aussi saline parce que les pays en amont déchargent leurs effluents dans les systèmes de rivières. L’eau devient progressivement plus saline à mesure qu’elle descend vers les régions basses. Et malheureusement, le Turkménistan est situé loin en aval.
Jusqu’à l’an 2000, les familles dans la région Gurbansoltan Edie (autrefois Yylanly) de la province de Dashoguz étaient forcées de boire de l’eau saline amère, source de diarrhée et d’autres maladies portées par l’eau chez les enfants. Depuis que l’UNICEF a établi une installation de dessalage dans cette région en 2000, les gens ont un meilleur accès à une eau potable sécuritaire.
«L’installation filtre et javellise environ 30-40 tonnes d’eau chaque jour et ça suffit pour la région Gurbansoltan Edie avec une population de plus de 20 000. Cette année, l’UNICEF a amélioré l’installation et maintenant la capacité est triplée, et nous pouvons produire jusqu’à 120-130 tonnes par jour», dit Goshmuhammet Amanov, directeur de l’installation de dessalage. «Ceci nous permettra de remplir les besoins d’eau potable et ainsi de contribuer à l’amélioration des conditions de santé de milliers de personnes dans notre région ainsi que des habitants des régions avoisinantes», dit M. Amanov, tout excité.
La disposition d’un approvisionnement d’eau sécuritaire et de facilités sanitaires, surtout dans les écoles, et la promotion de l’éducation sur l’hygiène dans des écoles fondamentales
117
(17,5 page 2 de 2)et d’installations pour la santé au niveau communautaire forment la direction centrale du programme d’eau et d’installations sanitaires de l’UNICEF au Turkménistan.
Durant les étés chauds, les besoins d’une eau potable sécuritaire augmentent maintes fois – avec peu d’exceptions au Dashoguz. Les citoyens de la région de Gurbansoltan Edie ont l’avantage d’avoir de l’eau dessalée sécuritaire, mais il y en a bien d’autres dans la province qui souffrent d’un approvisionnement insuffisant d’eau sécuritaire. L’installation de dessalage la plus proche est à 130 km de la région de Gurbansoltan Edie, ce qui rend bien difficile à nombre de familles l’accès à une eau potable sécuritaire.
«Nous aimerions bien que les gens de notre région aussi aient accès à de l’eau sécuritaire», ont plaidé les représentants de l’Association d’eau potable d’autres régions. «L’établissement d’installations de dessalage dans nos régions pourrait améliorer dramatiquement la santé de notre peuple et nous aimerions que l’UNICEF vienne nous aider aussi.»www.unicef.org
Throughout the outlying area of Beira City in central Mozambique, young people are transforming dank and dirty schools into healthy, inviting places of learning. Children as young as seven are the messengers, educating their peers, their families and their communities about the importance of safe water, good hygiene and private, separate sanitation facilities.
In this peri-urban area there are 54 schools, serving 34,000 pupils. Because of classroom shortages, children go to school in shifts — normally from 6:30a.m. until 10:30a.m., 10:30a.m. until 1:30p.m. and 1:30p.m. until 5:30p.m. This schedule has left children with idle time without teacher supervision.
In 2000, a UNICEF study found that 80 per cent of all primary schools here had no toilets for boys or girls, and no hand-washing facilities. Few schools promoted hygiene and those that did focused on teacher lectures with no student participation. To rectify this situation, UNICEF supported the construction of latrines for boys, girls and teachers, and hand-washing facilities for hygiene practice. But the most potent tools in improving the school and community environment were the children themselves.
UNICEF initially trained 17- to 24-year-olds as facilitators to bring the message about children’s role in improving their school and community to primary school students. Child-to-child sanitation clubs sprang up in 15 primary schools with about 18,000 students.
"The benefits of child-to-child sanitation clubs combined with latrine construction and hand-washing facilities have exceeded all expectations."
These clubs promoted hygiene practices and healthy school environments. The young people pushed for central refuse collection spots so that they no longer had to share their play spaces with garbage. Through theatre, song, dance and games, the children warned of the dangers of unhygienic environments, especially for children. They emphasized how proper disposal of syringes and other medical material would help prevent the spread of HIV/AIDS.
Irene Luisa da Costa Tivane, a 10-year-old child-to-child club member, is certain that she is making a difference.
“Participating in hygiene promotional activities is fighting diarrhoeal diseases,” says Irene. “That is why everybody should drink chlorinated water and know how to use a latrine.”
Flávo Varela de Araújo, 14, is an active member of a child-to-child radio programme that supports the school sanitation clubs. He boasts about the transformation within the classroom walls.
119
(17.6 page 2 of 2)
“With the creation of the club the school environment is changing,” said Flávo. “And the students’ behaviour is changing too. We will continue supporting safe practices.”
These after-school clubs are instruments of learning for the adults in the community as well. The students’ exemplary behaviour is catching on.
“The process of adopting safer practices is slow,” says Flávo. “But we see positive steps in our communities as they implement our recommendations and advice.”
The parents are listening to their children and are practising hygienic behaviour at home. After witnessing the benefits of good hygiene and the necessary enabling environments, the adults have begun pressing local authorities to provide better hygiene education and services in all schools.
The success of the initial programmes has encouraged inter-school discussion in which teachers share with pride the accomplishments of their schools. Encouraged by the cost-effectiveness of these
programmes, three other municipalities have begun fund-raising so they too can bring this participatory methodology to their schools.
UNICEF is working closely with the Ministry of Education to see how this can be replicated in other communities. In its national reform of the curriculum, Mozambique has committed 20 per cent of the school term to reflect local issues. UNICEF is pressing for hygiene promotion activities to be part of that 20 per cent.
"For a relatively small investment in child-to-child clubs, the dividends have been great."
The benefits of child-to-child sanitation clubs combined with latrine construction and hand-washing facilities have exceeded all expectations. Not only have these initiatives provided safer, healthier learning environments, they have also encouraged girls’ education. Whereas older girls used to drop out of school for lack of privacy, they are now remaining in school to complete their basic schooling. The improved hygienic conditions have given girls back their books and their dignity.
For a relatively small investment in child-to-child clubs, the dividends have been great: healthy schools and communities, more girls remaining in schools and leadership skills for the next generation.
Partout dans la région environnant Beira City, en Mozambique centrale, des jeunes gens transforment des écoles humides et sales en lieux d’apprentissage sains et accueillants. Des enfants même au bas âge de sept ans en sont les messagers, instruisant leurs pairs, leurs familles et leurs communautés sur l’importance d’une eau saine, d’une bonne hygiène et de facilités sanitaires privées et séparées.
Dans cette région autour de la ville, il y a 54 écoles desservant 34 000 élèves. À cause du manque de salles de classe, les élèves doivent aller à l’école en rotation – généralement de 6h30 à 10h30, de 10h30 à 13h30 et de 13h30 à 17h30. Cet horaire donne aux élèves beaucoup de temps libre sans surveillance des professeurs.
En 2000, une étude de l’UNICEF a trouvé que 80% de toutes les écoles primaires n’avaient de toilettes ni pour les garçons ni pour les filles, et rien pour se laver les mains. Peu d’écoles encourageaient l’hygiène et celles qui le faisaient s’en tenaient à des conférences pour les professeurs sans la participation des élèves. Pour corriger cette situation, l’UNICEF a appuyé la construction de latrines pour les garçons, les filles et les professeurs, et des lavabos pour se laver les mains pour pratiquer l’hygiène. Mais l’outil le plus puissant dans l’amélioration de l’environnement scolaire et communautaire fut les enfants eux-mêmes.
L’ UNICEF a d’abord entraîné des jeunes de 17 à 24 ans comme agents pour porter le message sur le rôle des enfants dans l’amélioration de leur école et leur communauté aux élèves des écoles primaires. Des clubs d’amélioration de l’hygiène enfant à enfant ont commencé dans 15 écoles primaires avec environ 18 000 élèves.
«Les bienfaits des clubs d’amélioration de l’hygiène enfant à enfant combinés avec la construction de latrines et de lavabos ont dépassé toutes les attentes.»
Ces clubs encourageaient la pratique de l’hygiène et d’un environnement scolaire sain. Les jeunes gens ont fait pression pour qu’on désigne des endroits pour la collecte centrale des déchets, ainsi ils n’auraient plus à partager leurs terrains de jeu avec des ordures. Par le théâtre, la chanson, la danse et les jeux, les enfants ont averti les gens des dangers des environnements non-hygiéniques, surtout pour les enfants. Ils ont accentué qu’il est important de se débarrasser correctement des seringues et autre matériel médical pour empêcher la propagation du SIDA.
Irène Luisa da Costa Tivane, un membre du club enfant à enfant âgée de 10 ans, est sûre qu’elle fait une différence.
«Participer aux activités de la promotion hygiénique, c’est combattre les maladies associées à la diarrhée,» dit Irène. «Voilà pourquoi tout le monde devrait boire de l’eau javellisée et savoir utiliser les latrines.»
121
(17,6 page 2 de 3)
Flavo Varela de Araujo, 14 ans, est un membre actif d’un programme radiophonique enfant à enfant qui appuie les clubs d’amélioration de l’hygiène scolaires. Il se vante de la transformation dans la salle de classe.
«Avec la création du club, l’environnement scolaire est en train de changer,» dit Flavo. «Et le comportement des élèves change aussi. Nous allons continuer à appuyer les pratiques sécuritaires.»
Ces clubs para-scolaires sont des instruments d’apprentissage pour les adultes dans la communauté aussi. Ils pigent le comportement exemplaire des élèves.
«Le processus pour adopter des pratiques sécuritaires est lent,» dit Flavo. «Mais on peut voir des étapes positives dans nos communautés à mesure qu’elles adoptent nos recommandations et nos conseils.»
Les parents écoutent leurs enfants et pratiquent le comportement hygiénique à la maison. Après avoir été témoins de la bonne hygiène et des environnements nécessaires pour la soutenir, les adultes ont insisté auprès des autorités locales pour qu’on fournisse une meilleure éducation et de meilleurs services en hygiène dans toutes les écoles.
Le succès des programmes initiaux a encouragé une discussion entre les écoles où les professeurs partagent avec fierté les accomplissements de leurs écoles. Encouragées par l’efficacité à peu de frais de ces programmes, trois autres municipalités ont commencé un prélèvement de fonds pour pouvoir, elles aussi, apporter cette méthodologie participante à leurs écoles.
L’UNICEF travaille de très près avec le Ministère de l’éducation pour voir comment ceci peut être copié dans d’autres communautés. Dans sa réforme nationale du curriculum, la Mozambique a assigné 20% du trimestre scolaire à l’étude des questions locales. L’UNICEF insiste pour que les activités de promotion de l’hygiène fassent partie de ce 20%.
«Pour un investissement assez minime dans les clubs enfant à enfant, les dividendes ont été superbes.»
Les bienfaits des clubs d’amélioration d’hygiène enfant à enfant, combinés avec la construction de latrines et de lavabos, sont allés au-delà de toutes les attentes. Ces initiatives n’ont pas seulement fourni des environnements d’apprentissage plus sains et sécuritaires, ils ont aussi encouragé l’éducation des filles. Là où les filles plus vieilles quittaient l’école parce qu’il n’y avait pas de facilités privées, maintenant elles restent à l’école pour compléter leur éducation de base. Les conditions hygiéniques améliorées ont redonné aux filles leurs livres et leur dignité.
122
(17,6 page 3 de 3)
Pour un investissement assez minime dans les clubs enfant à enfant, les dividendes ont été superbes : des écoles et des communautés saines, plus de filles qui restent à l’école et des habiletés de leadership pour la prochaine génération.
Luanda, March 2005 - World Water day celebrations normally mean absolutely nothing to 38 year old Mariana Preciosa. Yet, this year, water day will become an unforgettable one. “The electricity has just come back after an entire month without it and they tell us we are going to have running water in our houses.” Some how skeptical, Mariana adds “I still fail to believe that we are going to open a tap in our houses and get water we can give our children.”
Mariana is mother to four children aged between 20 and 4. For the past two years she lives in Cabiri, a small rural community of 2,000 inhabitants located some 45 kilometres north of Angola’s capital, Luanda. The primary source of livelihood of Cabiri’s inhabitants is growing maize, sweet banana, mango and cassava as well as river fishing. For as long as Mariana recalls, running water has never been available in Cabiri. “During the rainy season we fill our buckets with rain water. In the dry season we need to walk over two kilometres to get to the river to find water, which we still have to boil before drinking,” she says.
Mariana’s daily struggle to secure the needed amount of water is well known across Angola. Only half of the 14 million inhabitants of the oil-rich country have access to safe drinking water. From the estimated 7 million persons that live in the rural areas barely 40% can claim access to potable water compared to 71% of the urban population. The result is an appalling child death rate with one in every 4 Angolan children dying before they reach their fifth birthday mainly due to water and sanitation related diseases like malaria and diarrhoea. As for Angolan girls, especially those living in remote locations, the laborious daily trek to find water leaves them little time to attend school.
But today, Mariana is optimistic. With the support of UNICEF, the Angolan National Directorate for Water has rebuilt and upgraded the old water supply system constructed in the early 60s to serve Cabiri and the neighbouring communities of Camuteba and Mbanza Kitele. The system constitutes pumping water from the nearby Bengo river into a water tank. After treatment, the water is channelled to the settlements through a distribution network. As UNICEF’s Assistant Officer for Water and Sanitation, Manuel Eduardo explains, “the system served its purpose for a few years but during the war both the tank and the pipelines were shelled several times, to the point where they were totally destroyed…Uncertainty about the course of the conflict contributed to just leaving things the way they were.”
The six kilometre-long brand new distribution network and the two huge reservoirs equipped with the latest technology to purify the water extracted from the river, will benefit 3,000 persons. Like Mariana, Cabiri’s inhabitants will have access to running water from the houses. In Camuteba and Mbanza Kitele, considerably less urbanised than Cabiri, the
124
(17.7 page 2 of 2)
population will collect their water from the newly installed stand posts located in the centre of the villages. With the establishment of a network of laundries in the settlements, women
will no longer need to wash the cloths in the river or the lagoon. “Even if it may seem inadequate to you, to us, having potable water so near our homes is almost a dream,” says Paulo Adao, an elderly community leader in Mbanza Kitele. “Since the end of the colonial period in 1975 we haven’t had water in this village. We get our water from an artificial lagoon across the road, the same place where our pigs go drink.”
Existent schools and health centres in the communities have also benefited from the reconstruction of the badly needed water supply system. “Every day in our health centre I see at least 25 children in a space of four hours badly ill with multiple diarrhoeal diseases, acute skin infections and typhoid fever, all due to the lack of safe water.” says Francisca Martinez, one of Cabiri’s nurses.
The race to decrease child mortality in Angola has made UNICEF boost its efforts to bring improved water supply facilities to rural areas. With the support of the Governments of Norway, Sweden, Netherlands, and the private sector including the Italian firm COOP, and the UNICEF National
Committees of Germany, the UK and Spain, the goal by 2008 is to increase rural and peri-urban water and sanitation coverage from 40% to 55% and from 25.5% to 36% respectively.
“An additional critical role that UNICEF plays in Angola is to ensure that the most vulnerable, the schools and the health centres are taken into account and not left aside from key ongoing government development plans,” says Dauda Wurie, Head of UNICEF´s Water and Sanitation section in Angola. “With some 44 million USD per year during the next decade, we believe that all of rural Angola could be served with safe water and sanitation facilities…this is by all means an achievable goal in this country.”
www.unicef.org
125
L’ANGOLA RURAL A UN BESOIN URGENT D’EAU PROPRE
(17,7 page 1 de 2)De Macarena Aguilar
Luanda, mars 2005 - Les célébrations de la journée mondiale de l’eau ne veulent absolument rien dire à Mariana Preciosa, 38 ans. Cependant, cette année, la journée de l’eau sera inoubliable. «L’électricité est revenue après l’absence d’un mois entier et l’on nous dit qu’on aura bientôt l’eau courante dans nos maisons.» Quoique douteuse, Mariana reprend, «Je ne peux pas croire qu’on pourra ouvrir un robinet dans nos maisons et recevoir de l’eau qu’on pourra donner à nos enfants.»
Mariana est mère de quatre enfants qui ont de 20 à 4 ans. Depuis deux ans, elle habite à Cabiri, une petite communauté rurale de 2000 habitants située à quelque 45 kilomètres au nord de la capitale d’Angola, Luanda. La source principale de subsistance des habitants de Cabiri est la culture du mais (2 dots on the i in mais), de la banane douce, de la mangue, du manioc, ainsi que de la pêche à la rivière. De toute la longue mémoire de Mariana, on n’a jamais eu d’eau courante à Cabiri. «Pendant la saison des pluies, nous remplissons nos seaux d’eau douce. Pendant la saison de sécheresse, il nous faut marcher deux kilomètres à la rivière pour trouver de l’eau, qu’il nous faut encore faire bouillir avant de la boire», dit-elle.
La lutte quotidienne de Mariana pour trouver le montant d’eau nécessaire est fort bien connue à travers l’Angola. Seulement la moitié des 14 millions d’habitants de ce pays riche en pétrole ont accès à de l’eau potable sécuritaire. Des environ 7 millions de personnes qui habitent les régions rurales, à peine 40% peuvent dire avoir accès à de l’eau potable comparé au 71% de la population urbaine. Résultat : un taux déplorable de mortalité enfantine où un sur quatre enfants angolais meurt avant d’avoir cinq ans surtout à cause de l’eau et des maladies rattachées aux facilités sanitaires, tels que le malaria et la diarrhée. Quant aux filles angolaises, surtout celles qui habitent dans des endroits éloignés, la marche laborieuse quotidienne pour trouver de l’eau leur laisse peu de temps pour assister à l’école.
Mais aujourd’hui Mariana est optimiste. Avec l’appui de l’UNICEF, le Directorat national angolais pour l’eau a reconstruit et amélioré le vieux système d’eau construit au début des années ’60 pour desservir Cabiri et les communautés avoisinantes de Cambuteba et Mbanza Kitele. Selon le système, on pompe de l’eau de la rivière Bengo tout près dans un réservoir. Après avoir été traitée, l’eau est canalisée aux agglomérations par un réseau de distribution. En tant qu’officier adjoint de l’UNICEF pour l’eau et les facilités sanitaires, Manuel Eduardo explique : «Le système a été utile pendant quelques années, mais pendant la guerre on a bombardé à maintes reprises le réservoir et les tuyaux, au point où ils ont été complètement détruits… L’incertitude rattachée au prolongement du conflit a contribué à laisser le tout exactement tel quel.»
Le tout nouveau réseau de distribution long de six kilomètres et les deux vastes réservoirs équipés de la plus récente technologie pour purifier l’eau tirée de la rivière seront salutaires pour trois mille personnes. Tout comme Mariana, les habitants de Cabiri auront accès à l’eau courante dans les maisons. À Cambuteba et à Mbanza Kitele, beaucoup moins urbanisés que
126
(Page 17,7 page 2 de 2)Cabiri, la population ira recueillir son eau à de nouveaux poteaux avec robinets situés au centre des villages. Avec l’établissement d’un réseau de buanderies dans les petites agglomérations, les femmes n’auront plus besoin de laver les vêtements dans la rivière ou dans la lagune. «Même si ça vous paraît insuffisant, pour nous, l’eau potable si près de nos maisons, c’est presque un rêve», dit Paulo Adao un leader communautaire d’un certain âge, à Mbanza Kitele. «Nous n’avons pas eu d’eau dans ce village depuis la fin de la période coloniale en 1975. Nous obtenons notre eau d’une lagune artificielle de l’autre côté du chemin, là où vont boire nos cochons.»
Les écoles et les centres de santé existant dans les communautés ont aussi profité de la reconstruction du système d’approvisionnement d’eau extrêmement nécessaire. «Chaque jour dans notre centre de santé, je vois au moins 25 enfants dans une période de quatre heures atteints de multiples maladies de diarrhée, d’infections aiguës de la peau et de la fièvre thyphoïde, tout cela dû au manque d’eau sécuritaire», dit Francisca Martinez, une des infirmières de Cabiri.
La course pour réduire le taux de mortalité enfantine en Angola a poussé l’UNICEF à augmenter ses efforts pour améliorer les établissements d’approvisionnement d’eau en région rurale. Avec l’appui des gouvernements de la Norvège, de la Suède, des Pays-Bas, et du secteur privé comprenant la compagnie italienne COOP, et les comités UNICEF nationaux d’Allemagne, du Royaume-Uni et de l’Espagne, le but est d’augmenter dès 2008 l’étendue rurale et péri-urbaine de l’eau et des facilités sanitaires de 40% à 55% et de 25,5% à 36% respectivement.
«Un rôle critique additionnel que joue l’UNICEF en Angola, c’est de s’assurer qu’on n’oublie pas les plus vulnérables, les écoles et les centres de santé dans les plus importants plans de développement gouvernementaux», dit Dauda Wurie, directeur de la section d’eau et de facilités sanitaires de l’UNICEF en Angola. Avec quelque 44 millions de dollars américains par année durant la prochaine décennie, nous croyons qu’on pourra desservir tout l’Angola rural avec de l’eau sécuritaire et des aménagements sanitaires …ceci est sûrement un but atteignable dans ce pays.»www.unicef.org
Aymuratov Uzak is 22. When he was a small boy, he visited the town of Myinak, the Aral Sea's principal resort and fishing town in the far north of Uzbekistan. He watched as Uzbek men competed in horse races in honour of a wedding. Such races had taken place since their Mongol ancestors rode across the central Asian lands and settled permanently to graze their animals.
Uzak saw the riders dash across the sands, their colourful pennants a splash of colour against the burnished sands and white skies and strange, decaying ships that were strung across the desert. Uzak asked a goatherd what the rusting hulks were doing there, stuck fast in a perpetual list as though they were forever trying to sink through the vast plates of hardened salt. "They were for the sea, but the sea has gone." Uzak: "We deceived nature"
"You see," says Uzak, referring to the drought that is consuming Central Asia. "We deceived nature, and now nature is deceiving us." When Uzak was eleven, his father died of kidney cancer (a disease attributed to a prevalence of salt in the drinking water). Six years later, his brother's 31 year-old wife died in her sleep, and doctors refused to perform an autopsy "because it was a waste of time, they said."
In despair, his brother committed suicide and Uzak was left at 17 to provide for his mother, two sisters, and two small nieces, in the Karl Marx collective farm that lies east of the Aral Sea in the district of Takhtakupir. He cannot attend college, and his youthful dreams seem to have disappeared. He hopes to marry, to be able to support the education of the children, to continue to provide for his mother, and to improve his skills on the dombra, a long-necked string instrument he plucks at while we talk.
We deceived nature
Most of Uzbekistan is lowland desert with little rainfall. The country relies for water on the snow-fed rivers of the Amu Dar'ya (the ancient Oxus) and the Syr Dar'ya flowing from their mountainous easterly neighbours Tajikistan and Kyrgyzstan. As late as the 1920's families of nomadic herdsmen roamed its sparsely vegetated lands in search of pasture for their animals.
The drying of the Aral sea began in the 1930's with the large-scale agricultural policies of Stalin's Soviet Union. Huge tracts of unsuitable land in Central Asia were turned over to agriculture, and sustained with massive irrigation schemes, forcible population transfers, and fertilizers and pesticides. Today's drained rivers, dried aquifers, poisoned water-tables, and large populations subsisting on exhausted lands, are the direct results of those policies. As are the mysterious illnesses, low life expectancy, and high infant mortality rates of a number of central Asian populations.
128
(17.8 page 2 of 2)As the unsustainable agricultural policies foundered, planners compensated with large scale chemical intervention and the sluicing of even greater quantities of water from the Aral's 'feed' rivers onto the land. They transformed a balanced pastoral and fishing paradise into an ecological disaster The fishing industry, once one of the world's most abundant, has completely disappeared, and the shore has receded up to 120 kilometers at some points. Communities which once lived just kilometres from its shores know of the Aral Sea only by hearsay (villagers we speak to have heard of, but have never seen the sea because it is "too far.").
As the sea receded, it exposed 27,000 square kilometres of dry seabed. The river basins began snaring up to 25 million tonnes of salt each year from their upper reaches that would once have been carried into the saline-balanced sea. Huge dust storms of salt and pesticide are now driven by prevailing winds hundreds of kilometres across the fields of Uzbekistan and Kazakhstan, further eroding the limited capacities of the soil, destroying forests, and poisoning the population.
The Aral Sea shores are home to 3.5 million people. In Uzbekistan's region of Karakalpakia there are high rates of child mortality, illness amongst women of child-bearing age, maternal mortality, anaemia, typhoid, respiratory and intestinal infections, cancer, hepatitis, DDT poisoning (especially notable in breast milk), and diminished life-expectancy. All drinking water is chemically contaminated to dangerous levels, and most bacteriologically, to levels characterized as "catastrophic." Malnutrition is commonplace
As the U.S.S.R. crumbled and constituent republics opted for independence, the social services in the cotton and wheat fields of the southern republics were withdrawn overnight. And this year, for the first time, the mighty Amu Dar'ya river withered a record 150 kilometers back from the Aral Sea, denied what water that escapes diversion by the failure of rain and snow in Tajikistan and Kyrgyzstan.
On the Karl Marx farm the people are in despair. On 13 June, their irrigation channels finally ran dry. They could only watch as their rice crop wilted, then shrivelled up completely. They have been confused by theories of unfriendly neighbouring countries denying them water, and terrorists destroying reservoirs and pumping facilities. The government has given them no explanations, no compensation, and no solutions, although they have been excused from paying their rice tax.
Uzak, who manages the government-owned store and can gauge the hunger and sense of urgency says: "there are many illnesses, headaches, as though something is always pressing on you. My skin always feels tight, and dry." Uzak has no alternative but to imbibe the same waters that probably killed his father. "When I travel to town and drink the water there, and return, I cannot drink our water for its salt." Life is hard, but it is set to get harder. "80 per cent of the people have used their reserves of food, and nobody has any money. There will be hunger this winter," he says. It is a chilling fact that life consumes the young quickly in this part of the world. Even quicker when there is no water. www.unicef.org
La sécheresse accable l’Usbequistan à mesure que la mer Aral se déssèche
(17.8 page 1 de 3)
Aymuratov Uzak a 22 ans. Quand il était jeune, il a visité la ville de Myinak, la station balnéaire et la ville de pêche la plus importante de la mer Aral dans le grand nord de l’Usbequistan. Il a observé des Usbèques qui concourraient dans des courses à cheval en honneur d’une noce. Ces courses ont lieu depuis que leurs ancêtres, les Mongols, se sont installés en permanence pour laisser paître leurs animaux.
Uzak a vu les cavaliers se lancer à travers les sables, leurs pennons coloriés vibrant de couleur contre les sables brunis et le ciel blanchi, ainsi que d’étranges vaisseaux pourrissants qui s’étalent à travers le désert. Uzak a demandé à un chevrier ce que ces vieux rafiots rouillés faisaient là, gelés dur dans leur inclination perpétuelle comme s’ils continuaient toujours à sombrer à travers les vastes plaques de sel durci. «Ils étaient pour la mer, mais la mer est partie, Uzak. Nous avons trompé la nature.»
«Vous voyez,» dit Uzak, se référant à la sécheresse qui consomme l’Asie centrale. «Nous avons trompé la nature, et maintenant la nature nous trompe.» Quand Uzak avait onze ans, son père est mort du cancer des reins (une maladie qu’on attribue à la présence forte de sel dans l’eau potable). Six ans plus tard, la femme de 31 ans de son frère est morte dans son sommeil, et les médecins ont refusé de faire une autopsie «parce que ça serait une perte de temps,» ont-ils dit.
Au désespoir, son frère s’est suicidé et cela a laissé Uzak, à 17 ans, à s’occuper de sa mère, de ses deux sœurs et de deux petites nièces, dans la ferme collective Karl Marx qui est située à l’est de la mer Aral dans la région de Takhtakupir. Il ne peut pas assister au collège, et ses rêves de jeunesse semblent avoir disparu. Il espère se marier, être capable de payer l’éducation de ses enfants, de pouvoir continuer à s’occuper de sa mère, et d’améliorer ses habiletés à la dombra, un instrument à cordes à long cou qu’il pince pendant que nous parlons.
Nous avons trompé la nature
La majorité de l’Usbequistan se compose de basses-terres désertiques avec très peu de pluie. Le pays compte pour son eau sur les rivières nourries de neige fondante, la Amu Dar’ya (l’ancienne Oxus) et la Syr Dar’ya qui coulent des montagnes de leurs voisins à l’est, le Tajiquistan et le Kyrgyzstan. Même encore dans les 1920, il y avait des familles de pâtres sans domiciles qui erraient dans ces terres peu couvertes de végétation à la recherche de pâturage pour leurs animaux.
Le dessèchement de la mer Aral a commencé dans les années 1930 avec les politiques agraires à grande échelle de l’Union soviétique de Staline. D’énormes étendues de terrain non approprié en Asie centrale furent données à l’agriculture, et soutenues par des plans
130
(17,8 page 2 de 3)
d’irrigation massive, des transferts de population forcés, des engrais et des pesticides. Ce qu’on voit aujourd’hui, les rivières drainées, les couches aquifères sèches, les tables d’eau empoisonnées et les grandes populations qui vivent sur des terres arides, sont les résultats directs de ces politiques. Ainsi que les maladies mystérieuses, la longueur de vie courte, les taux élevés de mortalité enfantine d’un grand nombre de populations en Asie centrale.
À mesure que les politiques agraires insoutenables s’écroulaient, les planificateurs ont compensé avec une intervention chimique à grande échelle et la canalisation d’une encore plus grande quantité d’eau sur les terres, tirée des rivières se jetant dans l’Aral. Ils ont transformé un paradis de pêche et de vie pastorale équilibré en un désastre écologique. L’industrie de pêche, autrefois une des plus abondantes au monde, a complètement disparu, et la côte a reculé jusqu’à 120 kilomètres à certains points. Certaines communautés qui se trouvaient à quelques kilomètres de la côte connaissent la mer Aral de nom seulement (les villageois à qui nous parlons en ont entendu parler, mais n’ont jamais vu la mer parce qu’elle est «trop loin».).
En reculant, la mer a exposé 27 000 kilomètres carrés de lit de mer sec. Les bassins de rivière ont commencé à attraper jusqu’à 25 millions de tonnes de sel de leurs régions en amont qui auraient autrefois été transportées dans la mer en salinité équilibrée. D’énormes tempêtes de poussière de sel et de pesticide sont maintenant poussées par les vents prédominants à des centaines de kilomètres à travers les champs de l’Usbequistan et du Kazakhstan, érodant davantage les capacités limitées du sol, détruisant les forêts, et empoisonnant la population.
Les côtes de la mer Aral sont le domicile de 3,5 millions de personnes. Dans la région d’Usbequistan de Karalpakia, il y a des taux très élevés de mortalité enfantine, de maladie parmi les femmes à l’âge d’avoir des enfants, de mortalité maternelle, d’anémie, de typhoïde, d’infections respiratoires et intestinales, de cancer, d’hépatite, d’empoisonnement par le DDT (surtout dans le lait maternel), et une réduction de la longueur de vie. Toute eau potable est contaminée chimiquement à des niveaux dangereux, et la plupart avec des bactéries, à des niveaux qu’on pourrait dire ‘catastrophiques’. La sous-alimentation est commune.
À mesure que l’U.R.S.S. s’écroulait et que les républiques qui la constituaient optaient pour l’indépendance, les services sociaux dans les champs de coton et de blé des républiques du sud furent retirés du jour au lendemain. Et cette fois, pour la première fois, la puissante rivière Amu Dar’ya s’est desséchée à un record de 150 kilomètres au loin de la mer Aral, refusant toute eau qui s’échappe de la canalisation grâce à l’absence de pluie et de neige au Tajiquistan et au Kyrgystan.
À la ferme Karl Marx, les gens sont au désespoir. Le 13 juin, leurs canaux d’irrigation se sont finalement asséchés. Ils n’ont pu qu’observer leur récolte de riz qui s’est fanée, puis
131
s’est ratatinée complètement. Ils sont confus par les théories de pays avoisinants qui leur refusent de l’eau, et par les terroristes qui détruisent les réservoirs et les installations de
(17,8 page 3 de 3)
pompage. Le gouvernement ne leur a donné aucune explication, aucune compensation, aucune solution, bien qu’on leur ait dispensé de payer la taxe sur le riz.
Uzak, qui gère le magasin qui appartient au gouvernement et qui peut jauger la faim et le sens d’urgence dit : «Il y a beaucoup de maladies, de maux de tête, comme s’il y avait toujours quelque chose qui pressait sur vous. Ma peau se sent toujours serrée et sèche.» Uzak n’a pas d’autre choix que de boire la même eau qui a probablement tué son père. «Quand je voyage en ville et que je bois l’eau là-bas, et que je reviens, je ne peux plus boire notre eau à cause du sel.» La vie est dure, mais elle promet d’être encore plus dure. «80% des gens ont déjà mangé leur réserve de nourriture, et personne n’a d’argent. Il y aura la famine cet hiver,» dit-il. C’est un fait qui fait frissonner que la vie consume la jeunesse rapidement dans cette partie du monde. Encore plus vite quand il n’y a pas d’eau. www.unicef.org
Zimbabwe: a new well allows Shupikai to return to school
(17.9)
Shupikai, a shy 11-year-old in Zimbabwe's impoverished Binga district, had no choice but to drop out of school when her mother fell sick with tuberculosis and persistent diarrhoea.
Her father was already ill from an unknown disease. Her younger sisters were just one and three years old, and had to be fed and cared for. Because her family did not have a latrine or refuse pit, everyone was at risk of contracting the disease that was causing her mother's diarrhoea unless Shupikai swept up and buried the faeces carefully. And because they did not have a well, several times a day Shupikai carried a huge 20-litre container to the bore-hole three kilometres away, pumped water with difficulty and then carried the heavy container on her head for the arduous 40-minute walk back home.
“If only water was close by, half my problems would be over.”
When Shupikai was asked what could be done to ease her problems, she immediately exclaimed, “Water, water! If only water was close by, half my problems would be over. And if we had a latrine, my mother would have easy access to it. It would be easier to take care of my parents and sisters."
As part of a UNICEF-sponsored Hygiene, Water and Sanitation Programme, the government of Zimbabwe, Shupikai's community and UNICEF worked together to build both a well and a household latrine for her family. Her father moulded bricks, dug the latrine pit and paid the builder in kind with goats and chickens.
The pressures on Shupikai were eased so much that within a few months she had resumed school.
www.unicef.org
133
Zimbabwe: un nouveau puits permet à Shupikai de retourner à l’école
(17.9)
Shupikai, une jeune fille gênée de 11 ans de la région appauvrie de Binga, au Zimbabwe, n’avait d’autre choix que de quitter l’école quand sa mère est devenue malade de la tuberculose et d’une diarrhée persistante.
Son père avait déjà contracté une maladie inconnue. Ses jeunes sœurs n’avaient qu’un an et trois ans, et il fallait qu’on les nourrisse et qu’on les soigne. Puisque sa famille n’avait pas de latrines ou de trou à déchets, tout le monde risquait de contracter la maladie qui causait la diarrhée de sa mère à moins que Shupikai ne balaie et n’enterre les fèces soigneusement. Et parce qu’ils n’avaient pas de puits, plusieurs fois par jour, Shupikai portait un énorme récipient de 20 litres au trou de sondage loin de trois kilomètres, y pompait de l’eau à grand effort et puis transportait le récipient lourd sur la tête pour la marche pénible de 40 minutes du retour à la maison.
«Si seulement l’eau était plus près, cela résoudrait la moitié de mes problèmes.»
Quand on a demandé à Shupikai ce qu’on pourrait faire pour alléger ses problèmes, elle s’est écriée immédiatement, «De l’eau, de l’eau! Si seulement l’eau était plus près, cela résoudrait la moitié de mes problèmes. Et si nous avions des latrines, ma mère pourrait facilement y avoir accès. Il serait plus facile de m’occuper de mes parents et de mes sœurs.»
Une partie du Programme d’hygiène, d’eau et d’aménagement sanitaire encouragé par l’UNICEF a vu le gouvernement du Zimbabwe, ainsi que la communauté de Shupikai et l’UNICEF travailler ensemble pour construire un puits et des latrines de ménage pour sa famille. Son père a moulé les briques, creusé les latrines et a payé le constructeur avec des chèvres et des poulets.
Les pressions sur Shupikai se sont tant allégées qu’après quelques mois elle a pu retourner à l’école.
www.unicef.org
134
Lesson 21Stage 1 – Desired Results
Established Goals:8-4-15 Explain how and why water may need to be treated for use by humans. Include filtration, settling, chlorination, fluoridation. GLO: B1, B3, D58-4-17 Identify substances that may pollute water, related environmental and societal impacts of pollution, and ways to reduce or eliminate effects of pollution. GLO: B2, B3, B5, D5Understandings:Students will understand that…Humans are the cause of the majority of the pollution found in Manitoba’s Red River.
Essential Questions:What are the various ways humans impact water and how do they attempt to fix the water they have damaged?
Students will know… That what they put down the drain doesn’t just disappear.
Students will be able to…Distinguish between dangerous water pollution and organic pollution.
Stage 2- Assessment EvidencePerformance Tasks:Participate in large group activityParticipate in class discussion
Other Evidence:Discuss strategies of other methods of waste disposal.
Materials RequiredWho Polluted the Red River StoryLarge glass aquariumMany (25-30 depending on class numbers) film canisters to hold contents (*you can get these free form local film developing locations)Label ContentsTrees Dry leavesConstruction Site Dry, clay soilPerson Fishing Fishing line/dental
flossFarmers Baking SodaGardeners Baking SodaBeach Party LitterFamily Picnic LitterSnack LitterBarnyard Water & instant
coffeeHog Plant Water & instant
coffeeWashing the Car Water & dish soapAntifreeze Water & blue &
green food colouring
Mystery Liquid Water & Red food colouring
Septic Tank Water & yellow food colouring & toilet paper
Coal Mine VinegarElectric Power Plant VinegarCommuters Vinegar & vegetable oilMotor Boat Vegetable OilHydro Dam Silverettes (cake
Stage 3 – Learning PlanTeacher preparation prior to day-fill & label containers with “pollution”Teacher preparation on day-half fill aquarium with clean water
Hand out film canisters to students with instructions that they are not to open them until they are called up in the story.Read Water Story (BLM #1)
135
- get students to come up and empty containers into aquarium at the required time for their objects
Discussion Questions
1. Who polluted the Red River?2. What effect did the increasing population have on the health of the River? (more people mean less wetlands, which filter water, more cars, less open space, etc.)
3. Can you think of any ways that population increases helped the river? (higher population densities led to more efficient use of resources, stronger environmental laws, public resources like sewage treatment plants, etc.)
4. Think about the pollution contained in your canister. Could something be done to prevent that type of thing from entering the water? How?
5. Challenge students to come up with ways to clean the water in the tank, after all, everything has to go somewhere. (example: strain out solids, use filters, etc.)
6. Once this type of pollution has entered the river, how can we get it out? How can we clean up the river? Do you think that it is easier to prevent pollution or to clean it up later?
7. What could each of us do to help improve the health of our river by preventing some of this pollution?
8. How does this relate to global water concerns?***Be sure to keep “polluted” water for next lesson…
* Adapted from The Population Educator-Spring 2003 edition, “Who Polluted the Potomac?” Used with permission.
136
Water Story (21.1)
For thousands of years, people have lived on the banks of the Red River. They hunted in the forests; harvested foods from wetlands, and caught fish in the river.
Imagine the tank of water in front of you was taken from the Red River by a Native Canadian about 500 years ago. How does it look to you? Would you drink this water? Eat fish that came from it? Swim in it?
One of the first explorers to visit the river kept a journal of his discoveries. He wrote about the Native Canadian villages, the tributaries of “sweet water” and seeing so many fish that he and his crew tried to scoop them out with a frying pan.
Some colonists began to arrive. They found fertile lands for farming, forests teeming with wildlife, and a river that produced ample food and water. It was an outstanding environment for settlement, and the colonists prospered.
How do you think the colonists used the river? Do we use our rivers in the same ways today?
The river has changed a lot since it was first explored. This is a story of those changes. Listen for the word printed on your canister. When you hear it, come up to the tank, open the canister and pour it’s contents into the river.
Years went by, and occasional storms drenched the area. High winds whipped thought the trees and blew the leaves into the water.
Gradually the city of Winnipeg grew on the banks of the Red River. Developers cleared wetlands and forests to build houses and businesses. Rain washed loose soil from construction sites into the river.
Is this water safe to drink? (If responses are “no”, ask if the river had leaves or soil in it when explorers first drank from it?) Would you swim in it? Is it safe for wildlife?
At first, the city was small. Upstream, farmers planted crops to feed the city’s growing population. Some of these crops grew right up against the banks of the river, and fertilizer washed off the land and into the water. Other farmers kept cows and other animals in their barnyards. As rainwater drained out of the barnyard, it carried some of the manure into a little creek behind the farm. The creek flows into the river.
Would you drink this water now? Would you swim in it? Go boating in it? Is it safe for wildlife?
Since the city was so close to Manitoba’s beautiful lakes, many people built cottages nearby. These cottages are not connected to the city sewer system. Wastewater from these houses flow into septic tanks under the ground. One
137
homeowner has not maintained the septic tank and poorly treated sewage seeped into the river and the nearby lake. At the beach at the nearby lake, teenagers are getting together to have a beach party. These teens are unaware that the wind has picked up and much of their waste has blown into the lake. Some of them take off on their personal water crafts to meet up with other friends.
To meet the electricity needs of the city, area officials decided that they would need to generate more power. Far upstream, a coalmine was dug. Rainwater drained down into the mineshaft and soaked the poles of wastes and scraps from mining. This made the rainwater become very acidic. Then the acid water trickled back out into the river.
To burn the coal and produce the power, an electric power plant was built along the river. Gasses coming out from the smokestacks combine with moisture in the air to form acids. The pollution falls back to Earth as acid rain or smog.
Another source of energy used in Manitoba are the hydroelectric dams. When damming the water, toxic mercury that has been stored under these waters is released, as land is flooded. (released by a type of bacteria that becomes prevalent when areas are flooded)
Would you drink this water now? Would you swim in it? Go boating? Could fish or water wildlife live in water that is acidic or poisoned with mercury?
Now Winnipeg is the largest metropolitan area in Manitoba. Traffic congestion is starting to become a problem for commuters who drive their cars to and from work everyday. Car exhaust fumes cause acid rain. If a car is not kept in good repair, it also might leak oil or other fluids, which will be washed off the pavement and into the river with the next rain.
And how do the residents of the city and its suburbs spend their time? In one neighbourhood, lots of gardeners are out working in their yards. Many of them are using weed killers and insect sprays to keep the lawns pretty. The next rain will wash these poisons into a little creek nearby, and then into the river.
One father is teaching his daughter how to change the antifreeze in their truck. They pour out the used antifreeze into the driveway. Antifreeze is sweet tasting and can poison animals that lick it. It can also get into the nearby creek and poison fish.
Nearby a boy washes the family car. The soapy water rushes down the driveway into the storm drain; the storm drain empties into the river. The grease and grime on a car contains asphalt from the roads, asbestos from the brakes, rubber particles from the tires, toxic metals, and rust. If the boy had gone to a local car wash, the water would have been treated before it returned to the river.
138
While the boy washes the car, his mother is cleaning out her medicine cabinet and discovers some expired medication. Instead of throwing it out into the garbage where children or animals may get to it, she decides to dump it down the toilet. (between 97 – 98% of water that is treated is cleaned… which still leaves 2-3% of contaminated water that is released back into the water system)
Next door, a family is cleaning out their garage. They find an old rusty can with a tattered skull and crossbones label still stuck on it. What could it be? It looks dangerous and they want to get rid of it before someone gets hurt. But how? Junior gets an idea: “let’s pour it down the drain by the curb!” So the mysterious liquid goes down the storm drain. The poison is out of sight – but is headed for the river. (depending on the area of Winnipeg, some water is sent to the treatment facility-older areas, while in newer areas the storm drains send the water directly back to the river or to storm retention ponds)
On nice days, many people head down to the river. Some zoom up and down the river in motorboats and don’t notice that a little engine oil leaks into the water. A group of friends have spread a blanket on the shore near the Forks for a snack. Lots of families are picnicking in the parks along the river, too. With the strong winds in Winnipeg, the trash will blow into the river. On the shore, a person fishing snags a hook on a log and breaks off the fishing line.At the water treatment facility in the North end of Winnipeg, a malfunction occurs and untreated wastewater 1 & 2 flows directly into the river. (This happened in Winnipeg in 2002).More recently, there have been big discussions in Winnipeg regarding the potential for a hog plant. Many are afraid that there may be runoff into our water system.
Discussion Questions
1. Who polluted the Red River?
2. What effect did the increasing population have on the health of the
River? (more people mean less wetlands, which filter water, more cars,
less open space, etc.)
3. Can you think of any ways that population increases helped the
river? (higher population densities led to more efficient use of
resources, stronger environmental laws, public resources like sewage
treatment plants, etc.)
139
4. Think about the pollution contained in your canister. Could
something be done to prevent that type of thing from entering the
water? How?
5. Challenge students to come up with ways to clean the water in the
tank, after all, everything has to go somewhere (example: strain out
solids, use filters, etc.).
6. Once this type of pollution has entered the river, how can we get it
out? How can we clean up the river? Do you think that it is easier to
prevent pollution or to clean it up later?
7. What could each of us do to help improve the health of our river by
preventing some of this pollution?
* Adapted from The Population Educator-Spring 2003 edition, “Who Polluted the Potomac?”
140
L’histoire de l’eau (21.1)
Depuis des milliers d’années, des humains vivent sur les rives de la rivière Rouge. Ils ont chassé dans les forêts, récolté de la nourriture dans les terres mouillées et pris des poissons dans la rivière.
Imaginez que le réservoir d’eau devant vous ait été tiré de la rivière Rouge par un autochtone canadien il y a environ 500 ans. Comment cette eau vous semble-t-elle? Est-ce que vous la boiriez? Mangeriez-vous des poissons tirés de là? Nageriez-vous dedans?
Un des premiers explorateurs à visiter la rivière a tenu un journal de ses découvertes. Il a écrit à propos des villages autochtones canadiens, des tributaires «d’eau douce» et de voir un si grand nombre de poissons que son équipage et lui ont essayé de les écoper avec une poêle à frire.
Les colons ont commencé à arriver. Ils ont trouvé des terres fertiles pour l’agriculture, des forêts pleines d’animaux et une rivière qui produisait amplement de nourriture et d’eau.C’était un environnement superbe pour une colonie, et les colons ont prospéré.
Comment pensez-vous que les colons ont utilisé la rivière? Est-ce qu’on utilise les rivières de la même façon aujourd’hui?
La rivière a beaucoup changé depuis les premières explorations. Voici l’histoire de ces changements. Écoutez pour entendre le mot imprimé sur votre boîte métallique. Quand vous l’entendrez, approchez-vous du réservoir, ouvrez votre boîte métallique et versez-en le contenu dans la rivière.
Au fil des années, des tempêtes occasionnelles ont trempé la région. De grands vents se sont déchaînés à travers les arbres et ont fait tomber des feuilles dans l’eau.
Graduellement, la ville de Winnipeg a grandi sur les rives de la rivière Rouge. Les développeurs ont déblayé les terres humides et les forêts pour y construire des maisons et des bâtiments pour les affaires. La pluie a emporté dans la rivière le sol friable des lieux de construction.
Peut-on boire cette eau en toute sécurité? Si la réponse est «non», demandez-vous si la rivière avait des feuilles et de la terre dedans quand les explorateurs en ont bu jadis. Nageriez-vous dedans? Est-elle saine pour les animaux?
Au début, la ville était petite. En amont, les fermiers ont planté des récoltes pour nourrir la population grandissante de la ville. Certaines de ces récoltes poussaient juste sur le bord des rives de la rivière et de l’engrais était emporté dans l’eau.
141
D’autres fermiers élevaient des cochons et d’autres animaux dans leurs basses-cours. Quand la pluie venait laver la basse-cour, elle emportait du fumier dans le petit ruisseau derrière la ferme. Le ruisseau coule dans la rivière.
- Pourriez-vous boire cette eau maintenant? Nageriez-vous dedans? Iriez-vous en bateau dessus? Est-elle saine pour les animaux sauvages?
Puisque la ville était si proche des beaux lacs manitobains, bien des gens se sont construit des chalets tout près. Ces chalets ne sont pas rattachés au système d’égouts de la ville. L’eau d’égout de ces maisons se déverse dans des réservoirs septiques sous terre. Un propriétaire n’a pas entretenu son réservoir septique et de l’eau d’égout mal traitée s’est infiltrée dans la rivière et le lac tout près.
Pour satisfaire les besoins d’électricité de la ville, les fonctionnaires de la région ont décidé qu’il faudrait générer plus de puissance électrique. Loin en amont, on a creusé une mine de charbon. L’eau de pluie s’est écoulée dans le puits de mine et a détrempé les tas de restes et de déchets de la mine. Cela a rendu l’eau de pluie très acide. Puis l’eau acide a dégoutté jusque dans la rivière. Pour brûler le charbon et produire du pouvoir, une installation à génération électrique fut construite le long de la rivière. Les gaz sortant des grandes cheminées se combinent avec l’humidité dans l’air pour former des acides. La pollution retombe sur la terre en pluie acide ou en brouillard fumeux.
Les barrages hydroélectriques sont une autre source d’énergie employée au Manitoba. Quand on retient l’eau avec un barrage, le mercure toxique qui s’est accumulé sous ces eaux est relâché à mesure que la terre est inondée. (relâché par un genre de bactérie qui se répand quand les régions sont inondées)
Boiriez-vous cette eau maintenant? Nageriez-vous dedans? Iriez-vous en bateau dessus? Est-ce que les poissons ou les animaux sauvages pourraient vivre dans l’eau qui est acide ou empoisonnée de mercure?
Maintenant Winnipeg est la plus grande région métropolitaine du Manitoba. La congestion véhiculaire devient un problème pour les navetteurs qui conduisent leurs voitures entre leurs domiciles et leur travail tous les jours. Les émanations des voitures causent la pluie acide. Si une voiture n’est pas gardée en bon état, il peut aussi y avoir des fuites d’huile ou d’autres liquides qui seront lavés de la chaussée et emportés par la prochaine pluie jusque dans la rivière.
Et comment les résidents de la ville et des banlieues passent-ils leur temps? Dans un voisinage, beaucoup de jardiniers travaillent dans leurs cours. Plusieurs d’entre eux utilisent des tueurs de mauvaises herbes et des insecticides pour que leurs pelouses soient belles. La prochaine pluie emportera ces poisons dans un petit ruisseau avoisinant, et puis dans la rivière.
Un père enseigne à sa fille à changer l’antigel dans leur camion. Ils versent l’antigel usagé dans leur entrée de voiture. L’antigel a un goût sucré et peut
142
empoisonner les animaux qui le lèchent. Il peut aussi se rendre jusqu’au ruisseau avoisinant et empoisonner les poissons.
Tout près, un garçon lave la voiture familiale. L’eau savonneuse coule en bas de l’entrée de voiture jusque dans le tuyau de drainage; celui-ci se déverse dans la rivière. La graisse et la saleté sur une voiture contiennent de l’asphalte des routes, de l’amiante des freins, des particules de caoutchouc des pneus, des métaux toxiques et de la rouille. Si le garçon était allé à un centre de lavage de voitures local, l’eau aurait été traitée avant d’être retournée à la rivière. Pendant que le garçon lave la voiture, sa mère nettoie son cabinet de médicaments et découvre des médicaments surannés. Au lieu de les jeter dans la poubelle où les enfants et les animaux pourraient les prendre, elle décide de les jeter dans la toilette. (entre 97 et 98% de l’eau traitée est propre … ce qui laisse 2 à 3% d’eau contaminée qui est relâchée dans le système d’eau)
À côté, une famille nettoie son garage. Ils trouvent un vieux bidon rouillé avec une étiquette déchiquetée encore collée dessus figurant un crâne et deux os croisés. Qu’est-ce que ça peut bien être? Ça a l’air dangereux et ils veulent s’en débarrasser avant que ça fasse mal à quelqu’un. Mais comment? Junior a une idée : «vidons-le dans le tuyau de drainage au bord de la rue». Alors le liquide mystérieux s’en va dans le tuyau de drainage. Le poison est perdu de vue – mais s’en va vers la rivière. (dépendant de la région de Winnipeg, une partie de l’eau est envoyée à une installation de traitement d’eau – les régions les plus anciennes, mais dans les régions plus nouvelles les tuyaux de drainage envoient l’eau directement dans la rivière ou dans des étangs de rétention d’eau)
Les beaux jours, beaucoup de monde se rend à la rivière. Quelques-uns sillonnent la rivière à grande vitesse dans leurs bateaux-moteurs et ne remarquent pas qu’il y a une petite fuite d’huile de moteur dans l’eau. Un groupe d’amis a étendu une couverture sur la rive près de la Fourche pour prendre un repas léger. Beaucoup de familles font aussi un pique-nique dans les parcs le long de la rivière. Avec les vents forts de Winnipeg, les déchets se retrouveront dans la rivière. Sur la rive, une personne qui fait de la pêche accroche son hameçon sur un tronc d’arbre et casse la ligne de pêche.
À l’installation de traitement d’eau d’égout dans le nord de Winnipeg, il y a un problème dans le fonctionnement et de l’eau d’égout non traitée coule directement dans la rivière. (Cela est arrivé à Winnipeg en 2002)
143
Questions à discuter
1. Qui a pollué la rivière Rouge?
2. Quel effet l’augmentation de la population a-t-elle eu sur la santé de
la rivière? (plus de gens veut dire moins de terres humides qui filtrent
l’eau, plus de voitures, moins d’espaces ouverts, etc.)
3. Pouvez-vous penser à des façons où l’augmentation de la population
a aidé la rivière? (une densité de population plus élevée a mené à un
meilleur emploi des ressources, à des lois environnementales plus
fortes, à des ressources publiques telles les installations de traitement
d’eau d’égout, etc.)
4. Réfléchissez à la pollution contenue dans votre boîte métallique. Est-
ce qu’on pourrait faire quelque chose pour empêcher ce genre de
chose d’entrer dans l’eau? Comment?
5. Lancez un défi aux élèves de trouver des façons de nettoyer l’eau
dans le réservoir, après tout, il faut que tout aille quelque part.
(exemple : enlever les solides avec une passoire, employer des filtres,
etc.)
6. Une fois que cette pollution est entrée dans la rivière, comment peut-
on l’en faire sortir? Comment peut-on nettoyer la rivière? Pensez-vous
qu’il est plus facile d’empêcher la pollution ou de la nettoyer plus tard?
7. Qu’est-ce que chacun de nous pourrait faire pour aider à améliorer la
santé de notre rivière en empêchant un peu de cette pollution?
* Adapté de The Population Educator – édition printemps 2003, «Who Polluted the Potomac?»
144
Lesson 22Stage 1 – Desired Results
Established Goals:8-4-15 Explain how and why water may need to be treated for use by humans. Include: filtration, settling, chlorination, fluoridation. GLO: B1, B3, D5Understandings:Students will understand that…There are marked differences between technological and educational advances between countries.There are global issues related to access to clean drinking water.
Essential Questions:What are the various ways humans impact the water and how do they attempt to fix the water they have damaged?
Students will know… That there are differences between countries around the world in regards to access to money, education and technology.
Students will be able to…Work together as a small group to created a water filterProblem solve if they do not have the resources to accomplish the goal of clean water
Stage 2- Assessment EvidencePerformance Tasks:Working as a small group to create a filterFollow instruction on handout
Other Evidence:Reflection questions and class discussion
Materials RequiredPotentially Per Group Other
1 2-litre pop bottle 1 1-litre pop bottle 1 500-ml plastic bottle 1 cut in half 500-ml plastic bottle 1 cup fine sand 1 cup coarse sand 1 cup fine gravel 1 cup coarse gravel 0.5 cup of activated charcoal – purchased
at aquarium stores (not really necessary, can crush a charcoal briquette or not include it in the lesson)
1 cotton ball 1 small piece (about 10 cm²) of cheese
cloth 1 rubber band Measuring cups to transport filter sand,
gravel and charcoal
Monopoly money ***Water from pervious lesson (Who
Polluted the Red River) or soil to make dirty water
Country profiles and instruction handouts (See attached BLMs)
Stage 3 – Learning PlanWater for the WorldWater Filter Activity(adapted from Engineers Without Borders Canada, used with permision)
Advance Preparation1. prepare materials cut off the bottom of the 2 litre bottles cut the cheese cloth into 10 cm² pieces prepare “dirty” water – add approximately 250 mls of “dirty” water from pervious activity (Who
Polluted the Red River) or, if unavailable, add approximately 2 tbs of soil to a 500 ml bottle
2. Assemble country packages Each country will receive a package that includes a country profile, instruction on how to a make
145
the filter, and the amount of monopoly money based on the table to right
Procedure1. Have all of the filter material in the “store” at the
front of the class and choose two students to be The World Bank (it is better to choose students who may not be as intimidated by others and is willing to be “tough” with the class).
2. Go through basics of the country profile (BLM#1) and explain what each heading means to the students if not understood.
3. Divide the students into country groups (4 per group). Distribute a country package to each group (contains: country profile, country instructions, cut up 2-litre, a 500 ml container half full of dirty water, a bucket to catch water from the cleaning and the cut up 500-ml bottle to test dirty water as it comes from the filter)
4. Explain to the students they are to make a water filter as outlined on the instruction sheet. They may purchase needed equipment from the “World Bank” with the money they have. If asked how they can get things (as a poorer country) let them know that they may have to do what they have to do…
5. After about 20 minutes have representatives from each group come up to the front of the room to demonstrate their country’s water filter – use approximately 500 ml of “solvent (clean water) for each filter to get rid of excessive dust form sand and gravel, and then get them to pour the dirty water (either “Red River” water of water with soil in it) through the filter.
6. Follow-up with discussion questions listed below. Have students reflect and write personal feelings before the class is opened up for discussion.
Reflection & Discussion Questions1. Did you feel that you began to take on the role of your country? Did do anything out of
desperation or use your position of power over another country?2. How did this activity make you feel?3. How does this activity simulate “real life”? How is it different?
Background Teacher’s NotesActivated charcoal (activated carbon) filters have been used in homes to remove taste and odor. Taste and odor, although undesirable, are generally not considered unhealthy. In recent years, however, activated charcoal filters have been used to remove some of the contaminants that have been discovered in water supplies.
Activated charcoal is most effective at removing organic compounds such as volatile organic compounds, pesticides and benzene. It can also remove some metals, chlorine and radon. As with any treatment system, it cannot remove all possible drinking water contaminants.
Because activated charcoal systems are limited in the types of compounds they can effectively remove, it is essential that the homeowner determine which water contaminants are present before purchasing such a system. Anyone who suspects they have a water quality problem should first have their water analyzed by their local health department or a reputable laboratory. These analyses are costly, but worth the expense since they are necessary to determine the appropriate home treatment system and how best to operate such a system. A state or local health official can interpret water analysis results. Some laboratories may also provide this service.
Note that home water treatment is considered only a temporary solution. The best solutions to a contaminated drinking water problem are to either end the practices causing the contamination or change water sources. Activated charcoal is a black solid substance resembling granular or powdered charcoal. It is extremely porous with a very large surface area. Certain contaminants accumulate on the surface of the
Country Monopoly Money
Sweden $1100United States $1000Canada $825Brazil $200Ghana $60Cameroon $50Sudan $50Uganda $40Ethiopia $20Afghanistan $18
146
activated charcoal in a process called adsorption. The two main reasons that chemicals adsorb onto activated charcoal are a "dislike" of the water, and attraction to the activated charcoal. Many organic compounds, such as chlorinated and non- chlorinated solvents, gasoline, pesticides and tri-halo-methane can be adsorbed by activated charcoal. Activated charcoal is effective in removing chlorine and moderately effective in removing some heavy metals. Activated charcoal will also remove metals that are bound to organic molecules. It is important to note that charcoal is not necessarily the same as activated charcoal. Activated charcoal removes vastly more contaminants from water than does ordinary charcoal.
Home activated charcoal treatment systems are quite simple. The activated charcoal is normally packaged in filter cartridges that are inserted into the purification device. Water needing treatment passes through the cartridge, contacting the activated charcoal on its way to the faucet. Activated charcoal filters eventually become fouled with contaminants and lose their ability to adsorb pollutants. At this time, they need to be replaced. Activated charcoal treatment systems are typically point of use installed where they typically treat water used for drinking and cooking only. Activated charcoal filters can be placed on the end of the faucet, on the countertop, or under the sink. Point of use systems often have a bypass so that water for purposes other than drinking and cooking can also be dispensed at the tap without being treated. This increases the life of the activated charcoal, reducing the time between filter replacements.
http://www.doityourself.com/stry/activatecharcoal
147
COUNTRY (OH 22.1)
GeneralArea: Main Language:
Population: Growth Rate:
Water ResourcesRainfall: Total waterwithdrawals: m³/cap/year
Total Water UseDomestic: %Industrial: %Agricultural: %
HealthLife Expectancy: yearsInfant Mortality rate: infant deaths/1000 live
births
LiteracyAdult Literacy: % of population age 15
and above
EconomyGDP per capita(PPP US$)
Overseas Development Assistance (Aid)% of GDP
148
PAYS (OH 22.1)
GénéralRégion: Langage principal:
Population: Taux de croissance:
Ressources d’eauPluie: Total de l’eau retirée : m³/cap/an
Emploi total de l’eauDomestique: %Industriel: %Agricole: %
SantéVie anticipée: yearsTaux de mortalité enfantine : enfants
morts/1000 nés vivants
AlphabétisationAlphabétisation adulte : % de la
population âgée de 15 ans et plus
ÉconomiePNB per capita(PPP US$) Assistance au développement outremer (Aide) % du PNB
149
AFGHANISTAN
GeneralArea: 652,090 km²
Official Languages: Pashto, Persian
Population: 29,863,000Urban: 20%Rural: 80%
Growth Rate: 3.95% per year
Water ResourcesRainfall: ›300 mm
Total waterwithdrawals: 980m³/cap/year
Total Water Use:
**The political instability prevailing in Afghanistan makes it extremely difficult to obtain reliable information on basic agricultural indicators. Most of the information presented below dates back to years prior to 1978.
Cost of MaterialsActivated Charcoal $50/0.5 cup Rubber Band $ 5 eachCheesecloth $ 5/square Sand, Coarse $20/cupCotton $5/ball Sand, Fine $20/cupGravel, Coarse $10/cup Water, Clean $50/litre Gravel, Fine $10/cup
151
AFGHANISTAN
GénéralRégion: 652,090 km²
Langues officielles : Pashto, Perse
Population: 29,863,000Urbaine: 20%Rurale: 80%
Taux de croissance : 3,95% par année
Ressources d’eauRainfall: ›300 mm
Eau retirée totale : 980m³/cap/an
Emploi total de l’eau :
**L’instabilité politique qui existe en Afghanistan nous permet difficilement d’obtenir des informations fiables sur les indicateurs agricoles de base. La plupart des informations présentées ci-dessous datent d’avant 1978.
AlphabétisationAlphabétisation adulte : 99% de la population âgée de 15 ans ou plus
Produit domestique en gros (PDG), 0.28%
160
Instructions - Canada
1. Mettez un bouchon en coton pas très serré dans le goulot d’une bouteille coupée en deux, puis recouvrez le goulot de la bouteille d’un morceau d’étamine attaché avec un élastique.
2. Versez une couche d’1-cm de sable fin sur le bouchon en coton, suivie de charbon de bois activé, d’1-cm de gros sable, de gravier fin et de gros gravier.
3. Nettoyez le filtre en versant lentement et soigneusement un litre d’eau propre à travers (au-dessus d’un seau).
4. Placez votre filtre au-dessus d’une tasse en plastique. Maintenant, mettez votre filtre à l’épreuve en versant la moitié de votre eau sale à travers le filtre.
Coût des matériaux Charbon de bois activé 50$/0.5tasse Élastique 5$ chacunÉtamine 5$/carré Sable, gros 20$/tasseCoton 5$/balle Sable, fin 20$/tasseGravier, gros 10$/tasse Eau, propre 50$/litre Gravier, fin 10$/tasse
AlphabétisationAlphabétisation adulte : 99.9% de la population âgée de 15 ans ou plus
Produit domestique en gros (PDG), 0.77 GDP
168
Instructions – la Suède
1. Mettez un bouchon en coton pas très serré dans le goulot d’une bouteille coupée en deux, puis recouvrez le goulot de la bouteille d’un morceau d’étamine attaché avec un élastique.
2. Versez une couche d’1-cm de sable fin sur le bouchon en coton, suivie de charbon de bois activé, d’1-cm de gros sable, de gravier fin et de gros gravier.
3. Nettoyez le filtre en versant lentement et soigneusement un litre d’eau propre à travers (au-dessus d’un seau).
4. Placez votre filtre au-dessus d’une tasse en plastique. Maintenant, mettez votre filtre à l’épreuve en versant la moitié de votre eau sale à travers le filtre.
Coût des matériaux Charbon de bois activé 50$/0.5tasse Élastique 5$ chacunÉtamine 5$/carré Sable, gros 20$/tasseCoton 5$/balle Sable, fin 20$/tasseGravier, gros 10$/tasse Eau, propre 50$/litre Gravier, fin 10$/tasse
AlphabétisationAlphabétisation adulte : 99% de la population âgée de 15 ans ou plus
Produit domestique en gros (PDG), 0.11%
172
Instructions – les Étas-Unis
1. Mettez un bouchon en coton pas très serré dans le goulot d’une bouteille coupée en deux, puis recouvrez le goulot de la bouteille d’un morceau d’étamine attaché avec un élastique.
2. Versez une couche d’1-cm de sable fin sur le bouchon en coton, suivie de charbon de bois activé, d’1-cm de gros sable, de gravier fin et de gros gravier.
3. Nettoyez le filtre en versant lentement et soigneusement un litre d’eau propre à travers (au-dessus d’un seau).
4. Placez votre filtre au-dessus d’une tasse en plastique. Maintenant, mettez votre filtre à l’épreuve en versant la moitié de votre eau sale à travers le filtre.
Coût des matériaux Charbon de bois activé 50$/0.5tasse Élastique 5$ chacunÉtamine 5$/carré Sable, gros 20$/tasseCoton 5$/balle Sable, fin 20$/tasseGravier, gros 10$/tasse Eau, propre 50$/litre Gravier, fin 10$/tasse
173
Lessons 23, 24Stage 1 – Desired Results
Established Goals:8-4-17 Identify substances that may pollute water, related environmental and societal impacts of pollution, and ways to reduce or eliminate effects of pollution. GLO: B2, B3, B5, D5Understandings:Students will understand that…Substances that they may use in their homes can be toxic.
Essential Question:What are the various ways humans impact water and how do they attempt to fix the water they have damaged?How do we learn about water from a sustainability focus?
Students will know… That there are alternatives to toxic substances.
Students will be able to…Identify substances and activities within a household that contribute to water pollutionIdentify safe cleaning alternatives for commercial cleaning products.
Stage 2- Assessment EvidencePerformance Tasks:Identify substances that contribute to water pollution.
Other Evidence:Work cooperatively in a group situation.
Materials RequiredSubstances found in a variety of areas from in and around the home (2 per group)Internet access
Stage 3 – Learning PlanBackground Information:Pollutants that come from homes often originate in the kitchen, bathroom, or garage. Some chemicals such as oil, paint thinner, and pesticides often find their way down the drain and into the water system. Household cleansers, such as drain cleaner, oven cleaner, and tarnish remover have caustic chemicals that lower water quality. These products have chemical ingredients that may not be removed during water treatment. A partial solution would be to avoid putting these chemicals directly into water in the first place. Hazardous household wastes can be taken to approved disposal sites. Fortunately, there are non-toxic alternatives that can be used instead of some household cleansers. Items such as baking soda and vinegar can be used in different combinations to clean different areas of the home. Baking soda can be used in place of a room deodorizer. Boiling water, vinegar, and baking soda can be used with a plunger to take the place of a toxic drain cleaner. Vinegar wiped with newspaper can be used as a window cleaner. Scouring powder can be replaced by baking soda and vinegar. Salt, baking soda, and a piece of aluminium foil in warm water can take the place of a tarnish remover.
Prior PreparationPrepare a copy of the “Household Contaminant Survey” sheet (BLM #1) and a copy of the “Alternative Cleaning Products” sheet for each student (BLM #2).
ProcedureSetting the stage
1. Divide class into six teams (approximately 4-5 per team). Have at least two products per team on hand. Have each student fill out one contaminant survey sheet using the two team products. Have the students work in teams to find the information.
2. Assign a different area of the house to each team: kitchen, garage, garden & yard, bathroom, basement, and laundry room.
3. Get students to create a diagram of a home to demonstrate how their cleaners may get into our water systems(i.e. flushed down the toilet, poured down the kitchen sink).
Activity1. Have each team fill in the remaining contaminant survey sheet with the products brainstormed for
their area of the house.
174
2. Have students collect data from their own homes. Explain that some products will not have an entry in each category.
3. Have the students meet in their teams and combine their lists into a master list for their area.4. Have the students use the “Alternative Cleaning Products” handout to fill in the “Household
Cleaners Survey” sheet for the cleaning products they found (BLM #2)Potential resources:http://es.epa.gov/techinfo/facts/safe-fs.htmlhttp://www.eartheasy.com/live_nontoxic_solutions.htmFollow-Up (next lesson)A. Review data with students:1. What products did they find?2. How do we use these products?3. How do these products affect water? (This may be on the label under the caution statement.)4. How can we relate this activity to Sustainable Development?
Homework Learning ActivitiesCollect data from homes as to toxic chemicals that are disposed of in waterDetermine safe alternatives to these cleaners (from internet or other sources)
Extension Learning ActivitiesExtensions
Have the students keep track of how many times they use alternative cleaning products. Let the students share this project with their families at home. Encourage them to show their
families their home surveys and the list of alternative products that could be used. Have the students watch television advertisements and check the products advertised for
environmental or physical safety. Have the students make their own handbooks to take home and refer to as needed. Encourage a group of students/class to make these non-toxic products and sell as a fundraiser
Alternative Cleaning Products (22.2)Product and what it does Safe Alternative Ingredients
178
Autres produits de nettoyage (22.2)Produit et ce qu’il fait Autres ingrédients sécuritaires
179
Lessons 25 and on…Stage 1 – Desired Results
Established Goals:8-4-18 Identify environmental, social and economic factors that should be considered in the management of water resources. Examples: ecosystem preservation, employment, recreation, industrial growth, water quality… GLO: B5, D58-4-19 Use the design process to develop a system to solve a water-related problem. GLO: B2, B3, C3, D5
Understandings:Students will understand that…They can apply knowledge that they have learned in the classroom setting to a real-life problem that interests them.They can make a difference.
Essential Question:How do we learn about water from a sustainability focus?
Students will know… That it is important to believe in something and take action.
Students will be able to…Take on a role as a local or global citizen.
Stage 2- Assessment EvidencePerformance Tasks:Students will design a group project that will affect water in some form or another – in the end, the group log and student self/teacher evaluation will be used as the assessment.
Other Evidence:Students working together to achieve a goal.
Materials RequiredInternet for a few classes to do researchAny additional information the teacher can supply
Stage 3 – Learning PlanThe final project – student-initiated local or global issue.
Student or teacher-determined groups of 4 As inspiration that they can make a difference, teacher to read with the class Ryan’s Well (BLM
#1) – but are reminded that they do not have to go as far as fundraise for a well, just make a difference. It doesn’t have to be globally – it can be locally (even better) to see work that they have achieved.
Each group will need to bring in a binder/folder right away to hold the group work – it should be left in the classroom in case the group member who is holding it is away
Each group will brainstorm about a water issue that they are interested in (see BLM #2) Each group will determine with whom they may need to team (see BLM#3) Each group will complete the proposal (see BLM #4) Students will need to keep track of their group work progressions (see BLM #5) at the end of
every class If a student requires an external source, it is recommended that they use the telephone etiquette
form (BLM #6) Students will then determine how they will share their project at the Showcase (hopefully in a
central place like the library on a specified day – March 22nd or close to it is best as it is World Water Day) see BLM #7
If the students want to work with a community agency, they can use BLM #8 to assist them in organization
Finally the individual evaluation for the project (out of 80 marks) will be completed by both the student and the teacher (see BLM #9)
And the group mark out of 20 (for a total of 100) will be completed by the teacher (see BLM #10)
Depending on what the students decide to pursue, they can follow either the design process prototype (ex.
180
creating a water filtration system to be used in a developing country) or design process consumer products (ex. if they are critiquing an existing product) related to their project.
Examples of Products**The key is that the ideas come from the students – it will be hard for them as they are used to being told what to do, but by grade 8 they can take some of the learning into their own hands.Dependant on the time of year, students could take it upon them selves to clean up a river bank, build duck nesting areas etc. contact Oak Hammock to help out in other ways. Students could decide to research how to promote water use reduction and do a local campaign either for the school, school division, or community homes.Some examples for teacher for fundraising ideas:1) Foster Parents PlanClean water for one child-$50.00Give a child clean water – Four children die every minute from water related illnesses or dehydration. Every year, 2.2 million children in developing countries die from diarrheal diseases, mainly caused by dirty drinking water. Your gift can provide clean water for a child. Without access to fresh water, nothing else matters. "I am so happy with the water tank I would like to sleep in it." ~ MariaShare in a community water system-$500.00Safe water for a community – Water, water everywhere! You can help supply an entire community with a water system, hand-pump or well. A community water system brings clean, fresh, safe water to thousands of people who don’t have clean water for drinking, bathing or cooking. More than 80% of all diseases in developing countries are caused by unclean drinking water and inadequate sanitation. Your gift of water frees children from walking long distances – as much as 10 kilometres – to isolated places where water can be found. Collecting water leads to chronic absenteeism from school, further limiting education, especially for girls. Your gift also provides training for members of the community to maintain wells, ensuring that your gift of clean water provides a healthy and sustainable supply for years to come.Share in a community well- $1,000.00Safe water for a community – Water, water everywhere! You can help supply an entire community with a water system, hand-pump or well. A community water system brings clean, fresh, safe water to thousands of people who don’t have clean water for drinking, bathing or cooking. More than 80% of all diseases in developing countries are caused by unclean drinking water and inadequate sanitation. Your gift of water frees children from walking long distances – as much as 10 kilometres – to isolated places where water can be found. Collecting water leads to chronic absenteeism from school, further limiting education, especially for girls. Your gift also provides training for members of the community to maintain wells, ensuring that your gift of clean water provides a healthy and sustainable supply for years to come.https://secure1.fosterparentsplan.ca/eDonations/GiftsofHope.aspx?Item=82
2) PlayPump International: PlayPumps International has identified 10 countries in sub-Saharan Africa as its focus countries through 2010, with the goal of providing approximately 10 million people with access to safe drinking water. The countries include: Ethiopia, Kenya, Lesotho, Malawi, Mozambique, South Africa, Swaziland, Tanzania, Uganda, and Zambia. How the PlayPump System Works
While children have fun spinning on the PlayPump merry-go-round (1), clean water is pumped (2) from underground (3) into a 2,500-liter tank (4), standing seven meters above the ground. A simple tap (5) makes it easy for women and children to draw water. Excess water is diverted from the storage tank back down into the borehole (6). The water storage tank (7) provides a rare opportunity to advertise in outlaying communities. All four sides of the tank are leased as billboards, with two sides for consumer advertising and the other two sides for health and educational messages. The revenue generated by this unique model pays for pump maintenance. The design of the PlayPump water system makes it highly effective, easy to operate and very economical, keeping costs and maintenance to an absolute minimum. Capable of producing up to 1,400 liters of water per hour at 16 rpm from a depth of 40 meters, it is effective up to a depth of 100 meters. A typical hand pump installation cannot compete with the PlayPump system's delivery rate, even with substantial effort.The cost of a PlayPump system for a school or community is approximately US$14,000.http://www.playpumps.org/ Diagram used by permission of PlayPumps
Homework Learning ActivitiesGroups are to work on the final project on their own time in addition to class time.
On learning that African children were dying for lack of clean water, the young Canadian decided to act
SIX-YEAR-OLD Ryan Hreljac sat in shock as he listened to his Grade 1 teacher, Nancy Prest, at Holy Cross Catholic School in Kemptville, Ont. Launching a school-wide campaign, she spoke that day of the sad plight of children living in impoverished, disease-stricken Africa, where there was little access to medicine, food or clean water. Ryan, a sensitive child with blond hair and blue eyes, winced when he heard that hundreds of thousands of African children die each year just from drinking contaminated water.
IT WAS January 1998, and Holy Cross was raising money for African relief. "Every penny helps," Prest told her class. She explained that a single penny would buy a pencil; 25 cents, 175 vitamins; 60 cents, a two-month supply of medicine for one child; "and $70 pays for a well."
WHEN RYAN'S mother, Susan, 40, a consultant at the Ontario Ministry of Citizenship, Culture and Recreation, and Mark, his police-officer father, got home later that day, Ryan rushed past his baby-sitter to greet them."Mom, Dad, I need $70 for a well in Africa!" he said excitedly.
"That's nice, Ryan," his mother replied distractedly as his younger brother, Keegan, three, clung to her.
Over dinner, Ryan tried again.
"Ryan, $70 is a lot of money," his mother said. "We can't afford that."
The next evening Ryan brought the subject up again. "You don't understand," he said, tears filling his eyes. "Children are dying because they don't have clean water!"
Susan exchanged a glance with Mark and sat Ryan down. "If you're really serious about raising $70, you can do extra chores around the house," she said, assuming he would quickly forget his project.
Ryan's face lit up. To encourage him, Susan drew a red thermometer on a piece of paper with 35 lines across it, each line representing $2. For every $2, Ryan could fill in a line and put his earnings into an old cookie tin. "But Ryan," Susan said, "you'll have to do extra chores, not just the ones you already do."
"Okay," he said.
183
His first job was to vacuum the house. While Keegan and Ryan's older brother, Jordan, played outside, Ryan cleaned for two hours. He got $2. A few days later, instead of watching a movie with the family, he washed windows. Another $2.
Hearing about his goal, Ryan's grandfather hired the three brothers to pick up pinecones for craft projects, earning $10 for each garbage bag they filled. When Ryan brought his spring report card home, his parents gave him a $5 reward for good grades. That, too, went into the tin.
By Easter, when the school's fund-raising campaign ended, Ryan's class had raised nearly $30 in pennies.
"I'm still collecting for the well," Ryan told his teacher. Chore by chore, loonie by loonie, he had by now amassed $35.
AS SUSAN left for work one morning, she glanced at the thermometer on the fridge. It was two thirds full. Who do you give $70 to to build a well in Africa? she wondered. She called the school, but they didn't know. Then Brenda Cameron Couch, a friend who worked at an international development organization, told her of WaterCan, a small nonprofit agency in Ottawa that funds and monitors well building in developing countries.
Couch called WaterCan and told them about Ryan. "Seventy dollars might not be a lot, but this kid has worked hard for it," she said. "I'd like him to give you his money in person."
On the day of the meeting in late April, Ryan, wearing a tie and dress pants, nervously handed his cookie tin to Nicole Bosley, WaterCan's then-executive director. "There's an extra $5 here," he said, lowering his voice. "You might want to buy some hot lunches for the people making the well."
"Thank you, Ryan," Bosley said, smiling. She began telling him about WaterCan's clean-water projects, explaining that while $70 would buy a hand pump, it actually cost closer to $2,000 to drill a well. Too young to appreciate such a large sum, Ryan replied, "I'll just do more chores, then."
The Canadian International Development Agency (CIDA) matches WaterCan's funds two for one, so Ryan would have to find almost $700 to build his well. That night Susan and Mark sat in bed discussing what to do. "He's come so far," Mark said. "We can't just tell him, 'Ryan, you tried, but you can't really make a difference.'" Yet how could a six-year-old raise $700 just by doing chores?
The following week Couch sent out an e-mail to family and friends telling them about Ryan's project. The next day her accountant cous-in, Blaine Cameron, e-mailed back. Touched by Ryan's actions, he wanted to send in a donation matching Ryan's. Others told Couch the story was so moving that she should try to publish it. A few months later, the Kemptville Advance -- circulation 5,500 -- ran the story, calling it "Making a Difference: Ryan's Well."
184
Summer came and Ryan, now seven, turned his attention from school to fun. Yet throughout the holidays he kept doing extra chores. Periodically, Susan forwarded his donations to WaterCan.
In early August Susan bumped into Derek Puddicombe, an old acquaintance and freelance journalist. When Susan told him about Ryan's efforts, Puddicombe's interest was tweaked. "What a fantastic story! I bet the Citizen would buy it."
Puddicombe interviewed Ryan and The Ottawa Citizen sent a photographer to take pictures. Every morning Ryan expectantly looked through the newspaper, but weeks passed and the story didn't show up. "Maybe they lost it," he said, disappointment on his face.
MEANWHILE, WaterCan called to say that donations for Ryan's Well had passed $700. He and Susan were invited to a September board meeting to hear Gizaw Shibru, director for Uganda at Canadian Physicians for Aid and Relief (CPAR). WaterCan funded well construction by giving money to CPAR-Uganda, which then partnered with local villagers and actually dug and maintained the wells.
When Shibru arrived, he gave Ryan a warm hug. "I understand you got us a well," he said. "Thank you."
Shibru had a list of locations in need of a well. With only 46 percent of Ugandans having access to safe water, the list was long. Ryan asked Shibru if his well could be near a school. Shibru scanned his notes and told Ryan that it could be built next to Angolo Primary School in Otwal subcounty of Northern Uganda.
Angolo Primary was in an area suffering from 13 years of rebel activity, several years of drought and the scourge of AIDS. The closest water source was a swamp five kilometres away. Many of the children had large, extended bellies from infestations of intestinal worms. At any given time, nearly a quarter of the students had diarrhea. Typhoid and other deadly water-borne diseases were also common. With no doctors in the area of 31,850 people, one in five children died before age five.
Ryan listened intently as Shibru explained the slow process of building a well with a hand auger -- a task requiring 20 people working for ten days or more. "Drilling equipment would allow us to make many more wells," he said. He already knew the type he wanted-a small drill that could be transported in the back of a truck. It would cost $25,000.
"I'll raise the money for that drill," Ryan said quietly. "I want everyone in Africa to have clean water."
Back home, Susan told Mark, "We're raising money for a $25,000 well drill now." Mark's face dropped. He believed they were setting Ryan up for failure.
185
SUSAN wrote to one of the Citizen's editors, telling him about Ryan's meeting with WaterCan and asking when Puddicombe's article would be published. The editor called her back. "It'll be in tomorrow's paper."
When it appeared next day, an Ottawa TV station called, wanting to interview Ryan. Newspapers across Canada reprinted the story.
A week later a letter arrived in the Hreljacs' mailbox, addressed "Ryan's Well, Kemptville, Ontario." Inside was a cheque for $25 and a note saying, "I wish I could do more."
Shortly after, another cheque came in, this time addressed to Ryan's Well, Holy Cross School. It was for $20. After seeing Ryan's story on television, a group of eastern Ontario well drillers gave Ryan $2,700 for his cause.
Within two months, the little boy had inspired $7,000 in donations.
By now Ryan's Grade 2 friends were clamouring to help. Their teacher, Lynn Dillabaugh, had never seen a child inspire others so much. I've got to foster this, she thought.
Dillabaugh informed parents that the class wished to raise money for another well and placed a watering can in the classroom for her students to drop coins in. She also asked WaterCan to help her start a pen-pal relationship with Angolo Primary. CPAR-Uganda offered to deliver the letters and pick up the Ugandan children's replies.
The first batch of letters went off in January 1999. Two months later a package from Angolo arrived with letters addressed to each student. Ryan was handed his, the large print filling the page:
Dear Ryan, my name is Akana Jimmy. I am 8 years old. I like soccer. Our house is made of grass. How is America? Your friend, Akana Jimmy.
With the letter was a photograph of Jimmy taken by CPAR. For weeks Ryan raved about his new pen pal. Could he meet him? he asked. Susan and Mark thought they might be able to afford a trip one day. Perhaps when Ryan was 12.
Ryan wrote back:
Dear Jimmy, It must be cool to have a house made out of grass. I am 8 now. Do you drink from my well every day? What is your favourite subject in school? I am going to Uganda when I am 12. My house is made out of bricks. Write back soon. Your friend, Ryan.
Backed now by the entire school, Ryan continued fund-raising. He spent hours hand-printing letters, asking organizations for money for his drill. When donations came in, he wrote thank-you notes. By November he had garnered enough for CPAR-Uganda to buy the new machinery.
186
SHORTLY before Christmas Bruce Paynter, the Hreljacs' neighbour, asked his wife what she wanted as a present. "I don't really need anything," Bev Paynter replied. "But I'd love for Ryan to be able to go see his well."
Soon after, Bruce, a frequent air traveller, presented Ryan and his parents with air miles to help get them to Uganda, and when The Ottawa Citizen published a request for more air-mile donations, the community quickly responded. WaterCan also donated to the family's airfare and other travel expenses.
ON THE HOT morning of July 27, 2000, a truck bearing Shibru, Ryan and his parents bumped its way down a Ugandan dirt road. As it neared Angolo, four tiny children spotted them and began jumping up and down excitedly. "Ryan! Ryan! Ryan!" they called.
"They know my name!" Ryan cried in surprise.
"Everybody for a hundred kilometres knows your name, Ryan," Shibru said.
Around a bend, a line of some 5,000 children from nearby schools stood waiting along the roadside. As the truck approached, they began clapping in a rhythmic beat.
"Let's get out," Shibru said. His head down, Ryan walked by the clapping children, waving bashfully. A band formed before them and, to music, led the procession to Angolo Primary School.
There, village elders greeted Ryan solemnly and took him to his well beside the school's vegetable garden. Adorned with flowers, the well had a message etched in the concrete base:Ryan's Well:Formed by Ryan HreljacFor Community of Angolo Primary School
Akana Jimmy, a tall, thin boy, much like Ryan, stood waiting by the well for his pen pal.
"Hello," Jimmy said shyly.
"Hi, Jimmy," Ryan replied. They stood together awkwardly, uncomfortable with the attention on them, then Jimmy grabbed Ryan's hand and led him to the well so that he could cut the ribbon. Later, with Ryan's parents, they walked to some chairs set up in a field.
An elder stood up. "Look around at our children," he said. "You can see they're healthy. This is because of Ryan and our friends in Canada. For us, water is life."
A high-pitched wail came from the crowd. The headmaster, holding a small goat, stepped out and placed the squealing animal next to Ryan. "A gift of appreciation from Angolo," he said, bowing. Ryan cupped his hands over his mouth in delight, while Susan and Mark were presented with gifts of wood carvings and pottery.
187
Two dozen boys erupted from the crowd and, in a circle, began performing a traditional hunting dance to the sound of drums. Ryan laughed excitedly as Jimmy took his hand and led him outside the circle. Then Jimmy jumped in, and as Ryan followed, everyone cheered.
After four hours of dancing and celebration, Susan got up to speak. "I just want to say," she said, tears in her eyes, "that this has been the happiest day of my life. It will live in my heart forever."
That night, noticing Ryan was very quiet, Susan asked how he was feeling. "I feel wonderful, Mom," he said. Susan gave her son a hug, and together they began to recite their bedtime ritual: "Star light, star bright, the first star I see tonight...." And then Ryan rounded off that unforgettable day with his nightly prayer: "I wish for everyone in Africa to have clean water."
Since Angolo Primary School and the community began using Ryan's well for their cooking and drinking water, the rates of diarrheal infections and water-borne disease have dropped. Ryan's fund-raising continues. At last count he had helped raise over $60,000 for new drilling and well-construction equipment in Uganda. With CIDA's contributions, the funds have built more than 30 wells.
UPDATE: To date (December 2006), Ryan has raised over 1.5 million dollars and Ryan's Well Foundation has built over 225 wells and provided over 375,000 families and entire communities with clean water.
188
Le puits de Ryan (25.1)
DE KATHY COOK
En apprenant que des enfants africains mouraient du manque d’eau propre, le jeune Canadien a décidé d’agir.
De Canadian Reader's Digest janvier 2001
Ryan Hreljac, un jeune de six ans, a été traumatisé en écoutant sa professeure de 1ère année, Nancy Prest, à l’école catholique Holy Cross de Kemptville, Ont. Elle lançait sa campagne dans toute l’école, et ce jour-là a parlé de la triste situation d’enfants vivant dans une Afrique appauvrie et frappée de maladies, où il y avait peu d’accès à des médicaments, à de la nourriture et à de l’eau propre. Ryan, un enfant sensible aux cheveux blonds et aux yeux bleus, a bronché en entendant parler des centaines de milliers d’enfants africains qui meurent chaque année à force de boire de l’eau contaminée.
Ça, c’était en janvier 1998, et Holy Cross faisait un prélèvement de fonds pour l’assistance africaine. «Chaque cent aide,» a dit Prest à sa classe. Elle a expliqué qu’un seul cent pouvait acheter un crayon; 25 cents, 174 vitamines; 60 cents, un approvisionnement de deux mois de médicaments pour un enfant; «et 70$ paie pour un puits.»
Quand la mère de Ryan, Susan, 40 ans, consultante au Ministère ontarien de la citoyenneté, de la culture et de la récréation, et Mark, son père agent de police, sont rentrés plus tard ce jour-là, Ryan a devancé sa gardienne pour les accueillir. «Maman, papa, il me faut 70$ pour un puits en Afrique!» s’est-il écrié tout excité.
«C’est bien, Ryan,» a répondu sa mère distraitement alors que son jeune frère, Keegan, trois ans, s’accrochait à elle.
Lors du dîner, Ryan a essayé encore.
«Ryan, 70$, c’est beaucoup d’argent,» a dit sa mère. «Ce n’est pas dans nos moyens.»
Le lendemain soir, Ryan a ramené le sujet. «Vous ne comprenez pas,» a-t-il dit, les larmes aux yeux. «Il y a des enfants qui meurent parce qu’ils n’ont pas d’eau propre!»
Susan et Mark ont échangé un regard et ont assis Ryan. «Si tu veux vraiment prélever 70$, tu peux faire du boulot supplémentaire autour de la maison,» a-t-elle dit, croyant qu’il oublierait vite son projet.
Le visage de Ryan s’est illuminé. Pour l’encourager, Susan a dessiné un thermomètre rouge sur du papier avec 35 lignes dessus, chaque ligne représentant 2$. Pour chaque 2$, Ryan pouvait remplir une ligne et mettre son salaire dans un vieux récipient de biscuits. «Mais
189
Ryan,» a dit Susan, «il faudra que ce soit un boulot supplémentaire, pas seulement ton boulot régulier.»
«D’accord,» a-t-il dit.
Son premier travail était de passer l’aspirateur dans toute la maison. Pendant que Keegan et Jordan, le frère aîné de Ryan, jouaient dehors, Ryan a nettoyé pendant deux heures. Il a reçu 2$. Quelques jours plus tard, au lieu de regarder un film avec la famille, il a lavé les fenêtres. Un autre 2$.
En entendant parler de son but, le grand-père de Ryan a embauché les trois frères à ramasser des pommes de pin pour des projets d’artisanat, gagnant 10$ pour chaque sac à ordures rempli. Quand Ryan a apporté son bulletin de notes à la maison au printemps, ses parents ont récompensé ses bonnes notes avec un 5$. Ça aussi, c’est allé dans le récipient de biscuits.
À Pâques, à la fin de la campagne de prélèvement de fonds de l’école, la classe de Ryan avait amassé presque 30$ en cents.
«Je n’ai pas fini ma collection pour le puits,» a dit Ryan à sa professeure. Boulot par boulot, dollar par dollar, il avait maintenant amassé 35$.
En partant pour son travail un matin, Susan a jeté un coup d’œil au thermomètre sur le frigo. Il était au deux tiers plein. Elle se demandait, «À qui est-ce qu’on donne 70$ pour construire un puits en Afrique?» Elle a téléphoné à l’école, mais ils ne le savaient pas. Alors Brenda Cameron Couch, une amie qui travaillait dans un organisme de développement international, lui a parlé de WaterCan, une petite agence à but non lucratif à Ottawa qui paie et surveille la construction de puits dans des pays en développement.
Couch a téléphoné à WaterCan et leur a parlé de Ryan. «Soixante-dix dollars, c’est peut-être peu, mais cet enfant a travaillé très fort pour cela,» a-t-elle dit. «J’aimerais qu’il vous donne cet argent en personne.»
Le jour de la rencontre en fin avril, Ryan, portant cravate et pantalon du dimanche, a nerveusement donné son récipient de biscuits à Nicole Bosley, qui était alors la directrice-exécutive de WaterCan. «Il y a un 5$ de plus ici,» a-t-il dit en baissant la voix. «Vous pourriez acheter des repas chauds pour les gens qui construisent le puits.»
«Merci, Ryan,» Bosley a dit en souriant. Elle s’est mise à lui parler des projets d’eau propre de WaterCan, expliquant que bien que 70$ servait à acheter une pompe manuelle, ça coûtait près de 2000$ pour forer un puits. Trop jeune pour comprendre l’énormité de la somme, Ryan a répondu, «Je ferai plus de besognes, alors.»
L’Agence canadienne de développement international (ACDI) donne à WaterCan des fonds dans la proportion de deux à un, alors Ryan devrait amasser une somme de près de 700$ pour construire son puits. Ce soir-là, Susan et Mark ont discuté ce qu’il fallait faire, assis dans leur lit. «Il est rendu si loin,» a dit Mark. «Nous ne pouvons pas simplement lui dire, ‘ Ryan, tu as
190
fait l’effort, mais tu ne peux pas vraiment faire une différence.’» Cependant, comment un enfant de six ans pourrait-il prélever 700$ en faisant seulement des besognes?
La semaine suivante, Couch a envoyé un courriel à sa famille et ses amis leur parlant du projet de Ryan. Le lendemain, son cousin comptable, Blaine Cameron, a répondu par courrier électronique. Touché par les actions de Ryan, il voulait envoyer un don qui égale celui de Ryan. D’autres ont dit à Couch que l’histoire était si touchante qu’elle devrait essayer de la faire publier. Quelques mois plus tard, le journal Advance de Kemptville – circulation 5 500 – a fait paraître l’histoire, l’intitulant «Faire une différence : le puits de Ryan.»
L’été est arrivé et Ryan, qui avait maintenant sept ans, a détourné son attention de l’école au plaisir. Cependant, à travers les vacances, il a continué à faire des besognes supplémentaires. De temps en temps, Susan envoyait ses dons à WaterCan.
Au début du mois d’août, Susan a rencontré Derek Puddicombe, vieil ami et journaliste à la pige. Quand Susan lui a parlé des efforts de Ryan, cela a piqué l’intérêt de Puddicombe. «Quelle histoire merveilleuse! Je parie que le Citizen l’achèterait.»
Puddicombe a interviewé Ryan et The Ottawa Citizen a envoyé un photographe pour prendre des photos. Chaque matin Ryan cherchait dans tout le journal avec espoir, mais les semaines ont passé et l’histoire n’a pas paru. «Peut-être qu’ils l’ont perdue,» a-t-il dit, le visage déçu.
Dans l’entre-temps, WaterCan a appelé pour dire que les dons pour le puits de Ryan avaient dépassé 700$. Susan et lui ont été invités à une réunion du conseil d’administration pour entendre parler Gizaw Shibru, directeur de l’Uganda pour Médecins canadiens pour aide et assistance (MCAA). WaterCan avançait des fonds pour la construction de puits en donnant l’argent à MCAA-Uganda, qui avait des partenariats avec des villageois locaux et de fait creusait et maintenait les puits.
Quand Shibru est arrivé, il a embrassé Ryan chaudement. «J’entends dire que tu nous as obtenu un puits,» dit-il. «Merci.»
Shibru avait une liste d’endroits où on avait besoin de puits. Avec seulement 46% des Ougandais ayant accès à de l’eau saine, la liste était longue. Ryan a demandé à Shibru si son puits pouvait être près d’une école. Shibru a vérifié ses notes et a dit à Ryan qu’il pouvait être foré près de l’école primaire Angolo, dans le sous-comté d’Otwal en Ouganda du Nord.
L’école primaire Angolo était dans une région qui souffrait de 13 ans d’activités par les rebelles, plusieurs années de sécheresse et le fléau du SIDA. La source d’eau la plus proche était un marécage à une distance de cinq kilomètres. Beaucoup des enfants avaient de gros ventres enflés par l’infestation de vers intestinaux. À n’importe quel moment, près d’un quart des élèves avaient la diarrhée. La typhoïde et d’autres maladies portées par l’eau étaient aussi communes. Sans aucun médecin dans une région de 31 850 personnes, un enfant sur cinq mourait avant l’âge de cinq ans.
191
Ryan a écouté attentivement alors que Shibru expliquait le procédé lent de la construction d’un puits avec une foreuse manuelle – une tâche qui nécessitait le travail de 20 personnes pendant 10 jours ou plus. «Un bon équipement de forage nous permettrait de creuser bien plus de puits,» a-t-il dit. Il savait déjà quel type il voulait – une petite foreuse mécanique qui pourrait être transportée sur le dos d’un camion. Elle coûterait 25 000$.
«Je vais prélever l’argent pour cette foreuse,» a dit Ryan doucement. «Je veux que tout le monde en Afrique ait de l’eau propre.»
De retour à la maison, Susan a dit à Mark, «Nous allons prélever des fonds pour une foreuse de
25 000$ maintenant. Mark est resté bouche bée. Il croyait que ce serait mener Ryan vers la faillite.
Susan a écrit à un des éditeurs du Citizen, lui racontant la réunion de Ryan avec WaterCan et lui demandant quand l’article de Puddicombe serait publié. L’éditeur l’a rappelée. «Elle sera dans le journal de demain.»
Quand il a paru le lendemain, un poste de télé d’Ottawa a appelé, désirant interviewer Ryan. Des journaux à travers le pays ont ré-imprimé l’histoire.
Une semaine plus tard, une lettre adressée à «Le puits de Ryan, Kemptville, Ontario» est arrivée dans la boîte aux lettres des Hreljac. Dedans se trouvait un chèque de 25$ et une note disant, «J’aimerais pouvoir en faire plus.»
Peu après, un autre chèque est arrivé, cette fois adressé au Puits de Ryan, école Holy Cross. C’était pour 20$. Après avoir vu l’histoire de Ryan à la télé, un groupe de foreurs de puits dans l’est de l’Ontario a donné 2 700$ pour le projet de Ryan.
Dans deux mois, le petit garçon avait inspiré des dons de 7 000$.
À ce moment-là, les amis de Ryan en 2e année voulaient fortement l’aider. Leur professeure, Lynn Dillabaugh, n’avait jamais vu un enfant en inspirer d’autres autant. Il faut que j’appuie ceci, a-t-elle pensé.
Dillabaugh a informé les parents que la classe voulait prélever des fonds pour un autre puits et a placé un arrosoir dans la salle de classe pour que les élèves puissent y déposer leurs pièces de monnaie. Elle a aussi demandé à WaterCan de l’aider à commencer une relation de correspondance avec l’école primaire Angolo. MCAA-Ouganda a offert de livrer les lettres et de ramasser les réponses des enfants ougandais.
Le premier paquet de lettres fut envoyé en janvier 1999. Deux mois plus tard, un paquet est arrivé d’Angolo avec des lettres adressées à chaque élève. Ryan a reçu la sienne; les gros caractères imprimés remplissaient la page :
192
Cher Ryan, mon nom est Akana Jimmy. J’ai 8 ans. J’aime le soccer. Notre maison est faite d’herbe. Comment est l’Amérique? Ton ami, Akana Jimmy.
Avec la lettre, il y avait une photo de Jimmy prise par MCAA. Pendant des semaines, Ryan n’en revenait pas de son nouveau correspondant. «Est-ce que je pourrais le rencontrer?» a-t-il demandé. Susan et Mark ont pensé qu’ils pourraient se payer ce voyage un jour. Peut-être quand Ryan aurait 12 ans.
Ryan a répondu dans une lettre:
Cher Jimmy, Ça doit être formidable d’avoir une maison faite d’herbe. J’ai 8 ans maintenant. Est-ce que tu bois de mon puits chaque jour? J’irai en Ouganda quand j’aurai 12 ans. Ma maison est faite de briques. Réponds-moi vite. Ton ami, Ryan.
Appuyé maintenant par l’école entière, Ryan a continué à prélever des fonds. Il a passé des heures à imprimer des lettres à la main, demandant à des organismes de l’argent pour sa foreuse. Quand il recevait des dons, il leur envoyait des lettres de remerciement. Rendu en novembre, il avait amassé assez d’argent pour que la MCAA-Ouganda achète le nouvel équipement.
Peu avant Noël, Bruce Paynter, voisin des Hreljac, a demandé à sa femme ce qu’elle voulait comme cadeau. «Je n’ai vraiment besoin de rien.» a-t-elle répondu. «Mais j’aimerais beaucoup que Ryan puisse aller voir son puits.»
Peu après, Bruce, un voyageur fréquent, a présenté assez de milles en l’air pour que Ryan et ses parents puissent aller jusqu’en Ouganda, et quand The Ottawa Citizen a fait paraître une requête pour des dons de milles en l’air, la communauté a vite répondu. WaterCan a aussi fourni des fonds pour l’envol de la famille et d’autres dépenses de voyage.
Le matin chaud du 27 juillet 2000, un camion portant Shibru, Ryan et ses parents est allé clopin-clopant le long d’un chemin de terre battue en Ouganda. Quand ils approchaient d’Angolo, quatre petits enfants les ont aperçus et ont commencé à sauter de joie, tout excités. Ils ont crié, «Ryan! Ryan! Ryan!»
«Ils connaissent mon nom!» s’est écrié Ryan de susprise.
«Tout le monde à cent kilomètres à la ronde connaît ton nom, Ryan,» a dit Shibru.
Autour d’un virage, une ligne formée de quelque 5 000 élèves des écoles environnantes attendait debout de long de la route. À mesure que le camion approchait, ils ont commencé à applaudir de façon rythmée.
«Descendons,» a dit Shibru. La tête baissée, Ryan est passé devant les enfants qui applaudissaient, faisant un petit signe de la main gêné. Un orchestre s’est formé devant eux et, en musique, les a menés en procession à l’école primaire Angolo.
193
Là, les aînés du village ont accueilli Ryan solennellement et l’ont conduit à son puits à côté du jardin maraîcher de l’école. Décoré de fleurs, le puits avait un message inscrit dans la fondation en béton :
Le puits de Ryan : Formé par Ryan Hreljac Pour la communauté de l’école primaire Angolo
Akana Jimmy, un grand garçon mince, comme Ryan, attendait son correspondant debout près du puits.
«Bonjour,» a dit Jimmy, très gêné.
«Salut, Jimmy,» a répondu Ryan. Ils se tenaient debout ensemble, mal à l’aise, peu confortables avec l’attention qu’on leur conférait, puis Jimmy a saisi la main de Ryan et l’a mené au puits pour qu’il puisse couper le ruban. Plus tard, avec les parents de Ryan, ils ont marché jusqu’à des chaises placées dans un champ.
Un aîné s’est mis debout. «Jetez un coup d’œil sur nos enfants,» a-t-il dit. Vous pouvez voir qu’ils sont en bonne santé. Tout ça est dû à Ryan et à nos amis du Canada. Pour nous, l’eau, c’est la vie.»
Un cri très aigu s’est élevé de la foule. Le directeur de l’école, portant une petite chèvre, s’est avancé et a placé le petit animal glapissant près de Ryan. «C’est un cadeau d’appréciation d’Angolo,» a-t-il dit en faisant une courbette. Ryan, ravi, a couvert sa bouche de ses mains, alors qu’on présentait des cadeaux de bois taillé et de poterie à Susan et à Mark.
Deux douzaines de garçons sont sortis en courant de la foule et, dans un cercle, se sont mis à danser une danse traditionnelle de la chasse au rythme des tamtams. Ryan a ri d’excitation quand Jimmy lui a pris la main et l’a conduit à l’extérieur du cercle. Quand Jimmy a sauté dans le cercle et que Ryan l’y a suivi, tout le monde a applaudi.
Après quatre heures de danse et de célébration, Susan s’est levée pour parler. «Je voulais seulement vous dire,» a-t-elle dit, les larmes aux yeux, «que ceci est le jour le plus heureux de ma vie. Il vivra dans mon cœur à jamais.»
Ce soir-là, s’apercevant que Ryan était très tranquille, Susan lui a demandé comment il se sentait. «Je me sens merveilleusement bien, Maman,» a-t-il dit. Susan a embrassé son fils, et ensemble ils ont commencé à réciter leur rituel du coucher : «Lumière d’étoile, étoile brillante, la première étoile que je vois ce soir …» Et puis Ryan a complété cette journée inoubliable avec sa prière du soir : «Je souhaite que tout le monde en Afrique ait de l’eau propre.»
Depuis que l’école primaire Angolo et la communauté ont commencé à utiliser le puits de Ryan pour leur cuisine et leur eau potable, les taux d’infections de diarrhée et de maladies portées par l ‘eau ont baissé. Le prélèvement de fonds de Ryan continue. Au dernier compte, il avait aidé à amasser plus de 60 000$ pour de nouveaux équipements de forage et de
194
construction de puits en Ouganda. Avec les contributions de MCAA, les fonds ont construit plus de 30 puits.
MISE À JOUR : En ce moment (décembre 2006), Ryan a prélevé plus d’1,5 millions de dollars, et la Fondation le puits de Ryan a construit plus de 225 puits et a fourni de l’eau propre à plus de 375000 familles et à des communautés entières.
195
Searching for Solutions (OH 25.2)
A solution improves a situation or solves
a problem.
A solution is agreeable to all people
involved.
Water is your concern.List as many potential issues you could tackle.
1.
2.
3.
4.
5.
6.
196
La recherche de solutions (OH 25.2)
Une solution améliore une situation ou
résout un problème.
Une solution est acceptable pour toutes
personnes impliquées.
L’eau est votre responsabilité.Faites une liste de tous les projets potentiels que vous
pourriez entreprendre.
1.
2.
3.
4.
5.
6.
197
Group Members:_____________
Teaming (25.3)
Brainstorm organizations in our community that might share our concern and be
willing to form a partnership with your group. You also need to determine what their
needs might be and how they relate to yours. Make a list below with as many
organizations you can think of that are related to your issue, and what their needs
are.
Organizations Needs
1. 1.
2.
3.
2. 1.
2.
3.
3. 1.
2.
3.
4. 1.
2.
3.
198
Membres du groupe:_______________________________________________________
La formation des équipes (25.3)
Faites un remue-méninges pour identifier les organismes dans notre communauté
qui pourraient partager nos soucis et seraient prêts à former un partenariat avec
votre groupe. Vous devez aussi déterminer quels sont leurs besoins possibles et
comment ils se rattachent aux vôtres. Faites une liste ci-dessous d’autant
d’organismes que vous pouvez déterminer qui se rattachent à votre projet, et quels
Comment nous vérifierons les résultats- l’évidence que nous recueillerons et comment nous l’utiliserons: _________________________________________________________
Activité Qui le fait? Pour quand? (date spécifique)
Signatures des élèves :_________________ __________________________________ _________________ Signature du professeur & commentaires (si nécessaires):_________________ _____________________________________________________________________________________________
207
Group Progress Log (25.5)Use this log to keep an accurate and complete record of your work. Names: ______________ _______________Use as many lines per day as necessary. You may have additional logs if needed ______________ _______________
Date Time Spent Work Done Teacher Comments
208
Journal de progrès du groupe (25.5)Servez-vous de ce journal pour garder un record précis et complet de votre travail. Noms: ______________ Remplissez autant de lignes que nécessaire chaque jour. Vous pouvez avoir d’autres cahiers de journal au besoin. ______________ _______________
Date Temps passé Travail accompli Commentaires du professeur
209
(contact name if you have one)
date of call name of student who called
where you called from agency name you contacted
contact person’s name agency’s telephone #
210
Telephone Etiquette Form (25.6)
_______________________ _______________________
_______________________ _______________________
_______________________ _______________________
----------------------------------------------------------------------------------------“Hello, may I please speak to __________________ or someone regarding _____________________?” “My name is __________________ and I am a grade 8 student from
_____________________ School.”
1. Purpose (why you are calling): I am calling because _________
“Thank you for your time. May I call you back if I have more
questions?” ____yes _____ no
add and attach additional sheets if necessary
date de l’appel Nom de l’élève qui a appelé
D’où vous avez appeléwhere you called from
Nom de l’agence que vous avez contactée
Nom de la personne contact
No. de téléphone de la
211
Formulaire d’étiquette au téléphone (25.6)
_______________________ _______________________
_______________________ _______________________
_______________________ _______________________
----------------------------------------------------------------------------------------“Bonjour, pourrais-je parler à (nom de la personne contact si) _________________ ou quelqu’un par rapport à _____________________?”“Je m’appelle __________________ et je suis élève en 8e année de
l’école_____________________ .”
3. But (raison de l’appel): J’appelle parce que _________
“Merci pour votre temps. Puis-je vous rappeler si j’ai plus de
questions?”____oui _____ non ajoutez et attachez des feuilles supplémentaires
si nécessaire
212
Project Title: ___________________
Group Members __________________________________________
Showcase Plan (25.7)
How will you share your change plan with others?1) Method of demonstration (ex. display board, video, skit, etc.): ________________________________________________________
2) Explain in greater detail how your demonstration will look. ________________________________________________________
5) Who is your targeted audience-who are you planning to present to and invite? _______________________________________________________
213
6) Who in your group will prepare what aspects for your showcase and by when?Who? What? When?
* add additional information below
214
Titre du project ___________________Membres du groupe _____________________
_____________________
Plan d’ensemble (25.7)
Comment partagerez-vous votre plan de changement avec d’autres?1) Méthode de démonstration (e.g. – babillard, vidéo, saynète, etc.): _______________________________________________________
2) Expliquez en plus grands détails l’apparence de votre démonstration. _______________________________________________________
5) Quel est votre auditoire-cible – À qui avez-vous l’intention de faire votre présentation? Qui inviterez-vous? _______________________________________________________
215
6) Dans votre groupe, quels aspects chacun préparera-t-il et pour quand?Qui? Quoi? Quand?
* ajoutez renseignements additionnels ci-dessous
216
Community Contact Information (25.8)
Names of students: _________________ ______________________________ _________________ _______________
Name of agency contacted:
___________________________Name of Contact Person: ____________________________
Student Total: _____/40 marksTeacher Total: _____/40 marks
Teacher/Student Final Evaluation (25.9)
Group PerformanceInteracts Constructively and Respectfully 4 3 2 1
you made an effort to get along with all group members you listened to other’s ideas you encouraged other group members to participate
Contributes to Group Goals 4 3 2 1 you provided real support in the way of ideas and discussion you did your fair share of he assignment
Observes Established Rules 4 3 2 1 you maintained appropriate classroom behaviour
Academic ContentProblem Solving 4 3 2 1
your proposal follows the criteria on the proposal page
Appropriate Framework 4 3 2 1 your project uses The Natural Step Framework and relates to Sustainable Development
Completeness 4 3 2 1 you included all of your sheets required to the group binder
Showcase 4 3 2 1 your presentation provides clear demonstration of your learning
Work HabitsManages Time Wisely 4 3 2 1
you helped to complete all phases of the project in the appropriate time allotted you remained engaged and on task during every class
Completes Assignment 4 3 2 1 the proposal was handed in on the assigned date
Approaches Work 4 3 2 1 you gave your best effort to make the group assignment a success
219
Group Project Rubric (25.10)
___/20Group Members:__________________ ________________________________________ ______________________Completeness:4 – All paperwork is included in the binder and is in appropriate order 3 – Majority of paperwork is included in an orderly fashion2 – Half of the paperwork is included1 – Very limited amount of paperwork is included Meeting the Need6 – The project directly met the need listed in project proposal4 – The project partially met the need listed 2 – The project did not match the need listed1 – The need was not clearly listed or metTeamwork6 – Every student participated in the group project and respected each other’s ideas4 – Every student participated but did not always cooperate well together2 – Limited student participation1 – Limited student participation and lack of respect within the groupShowcase4 – The showcase is creative and demonstrates learning3 – The showcase demonstrates learning2 – The showcase demonstrates the project, but lacks learning outcomes1 – The showcase is limited
Total des élèves: _____/40 pointsTotal du professeur: _____/40 points
Évaluation finale du professeur/de l’élève (25.9)
Fonctionnement du groupeInteractions constructives et respectueuses 4 3 2 1
Vous avez fait un effort pour vous accorder avec tous les membres du groupe Vous avez écouté les idées des autres Vous avez encouragé d’autres membres du groupe à participer
Contribue aux buts du groupe 4 3 2 1 Vous avez fourni un appui réel quant aux idées et à la discussion Vous avez fait votre part du projet de façon équitable
Se conforme aux règles établies 4 3 2 1 Vous avez maintenu un comportement de classe approprié
Contenu académiqueLa solution de problèmes 4 3 2 1
Votre proposition suit les critères de la page des propositionsCadrage approprié 4 3 2 1
Votre projet se sert du cadrage de l’étape naturelle et se rapporte au développement soutenable
Ensemble 4 3 2 1 Vous avez inclus toutes les feuilles exigées dans le cartable du groupe
Présentation 4 3 2 1 Votre présentation fournit une déclaration claire de votre apprentissage
Habitudes de travailOrganise son temps sagement 4 3 2 1
Vous avez aidé à finir toutes les phases du projet dans le temps alloué Vous êtes resté engagé et à la tâche pendant toutes les classes
Complète le devoir 4 3 2 1 Le devoir fut rendu à la date assignée
Approche au travail 4 3 2 1 Vous y avez mis votre meilleur effort pour que le projet du groupe soit un succès
221
Rubrique du projet de groupe (25.10)
___/20Membres du groupe:__________________ ________________________________________ ______________________Projet complété : 4 – Toute paperasse est incluse dans le cartable en bon ordre 3 – Presque toute la paperasse est incluse en bon ordre 2 – La moitié de la paperasse est incluse 1 – Un montant très limité de la paperasse est inclus Rencontre un besoin6 – Le projet a directement comblé un besoin identifié dans la liste des propositions de projets 4 – Le projet a partiellement comblé un besoin sur la liste 2 – Le projet n’était pas lié aux besoins de la liste 1 – Le besoin n’était ni clairement lié à la liste ni comblé Travail d’équipe6 – Chaque élève a participé au projet de groupe et a respecté les idées des autres 4 – Chaque élève a participé, mais ils n’ont pas toujours bien coopéré ensemble2 – Participation limitée des élèves 1 – Participation des élèves limitée et manque de respect dans le groupe Présentation4 – La présentation est créatrice et démontre de l’apprentissage 3 – La présentation démontre de l’apprentissage2 – La présentation démontre le projet, mais il y a un manque de résultats d’apprentissage1 – La présentation est limitée


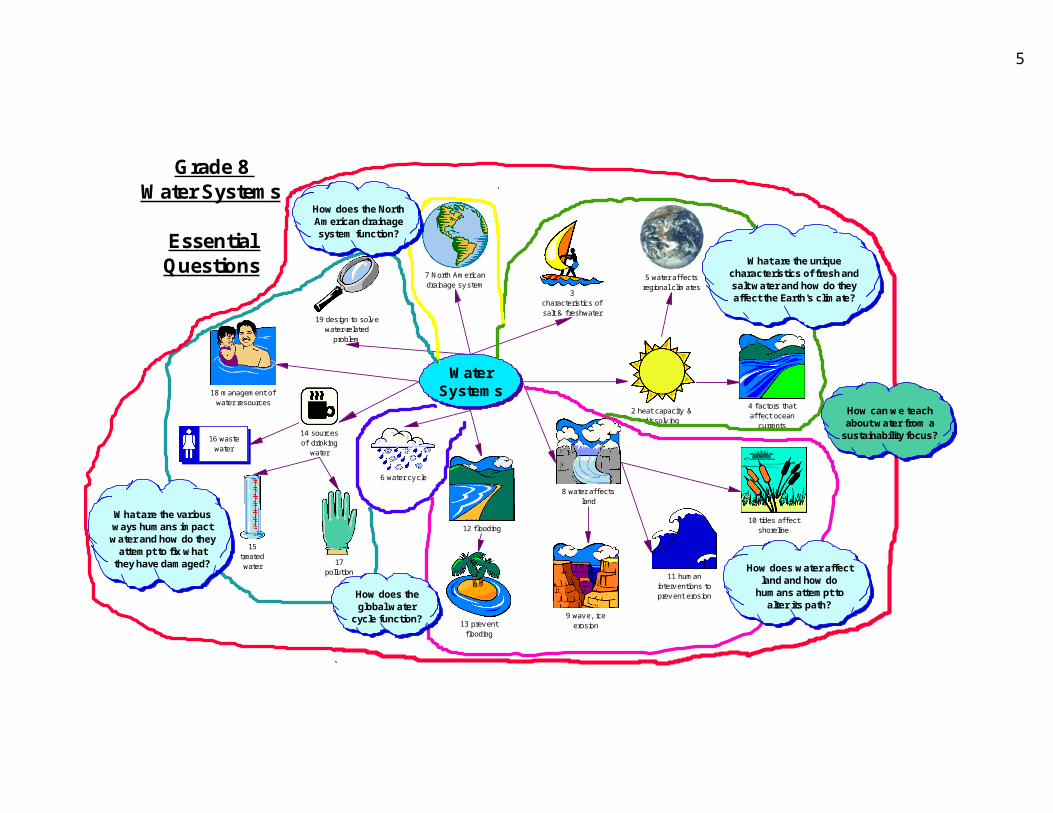
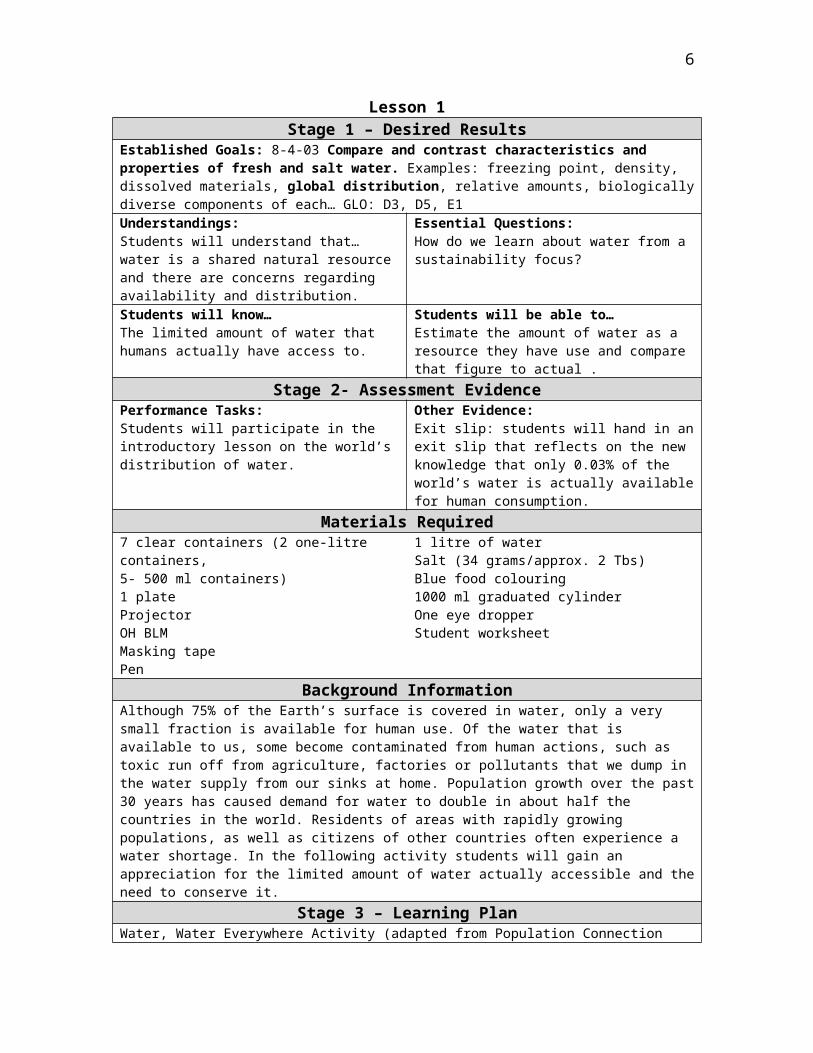
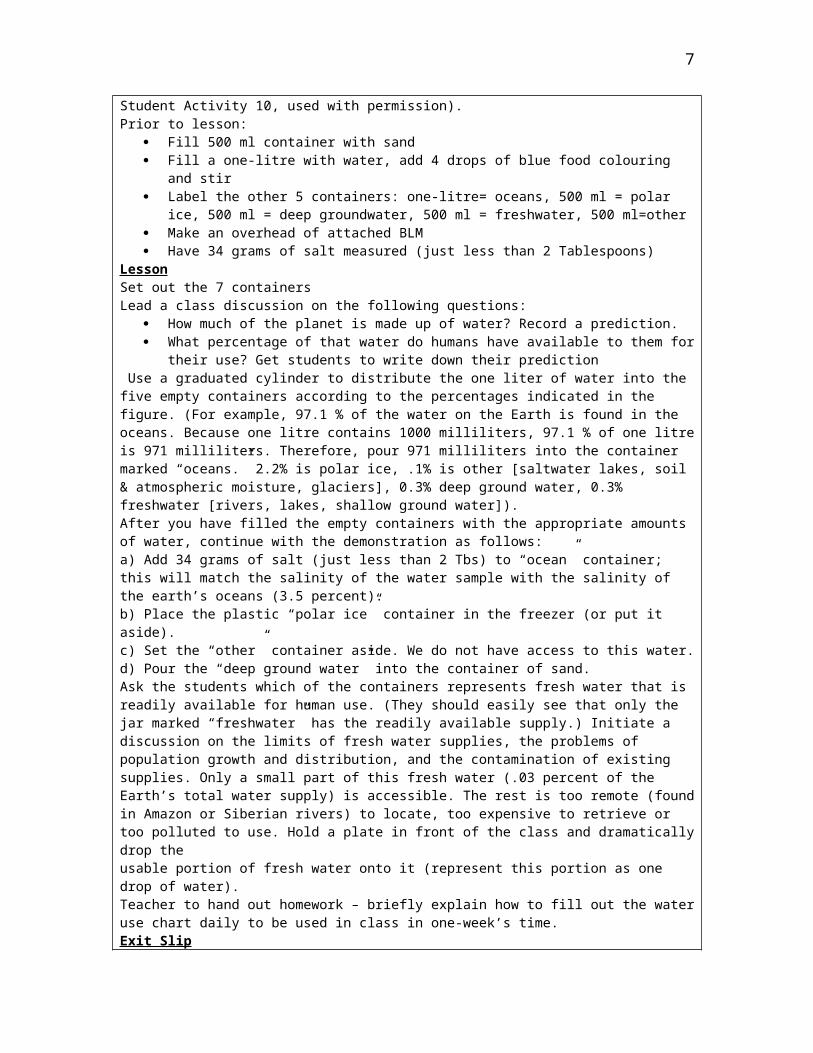
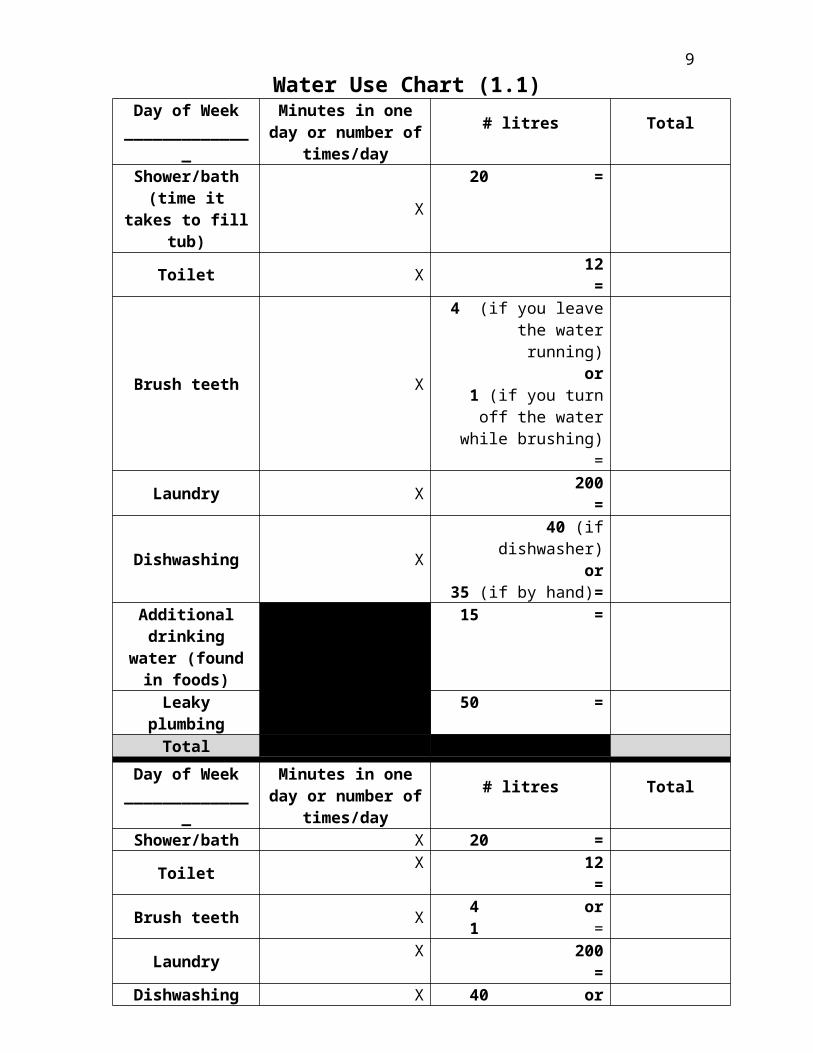
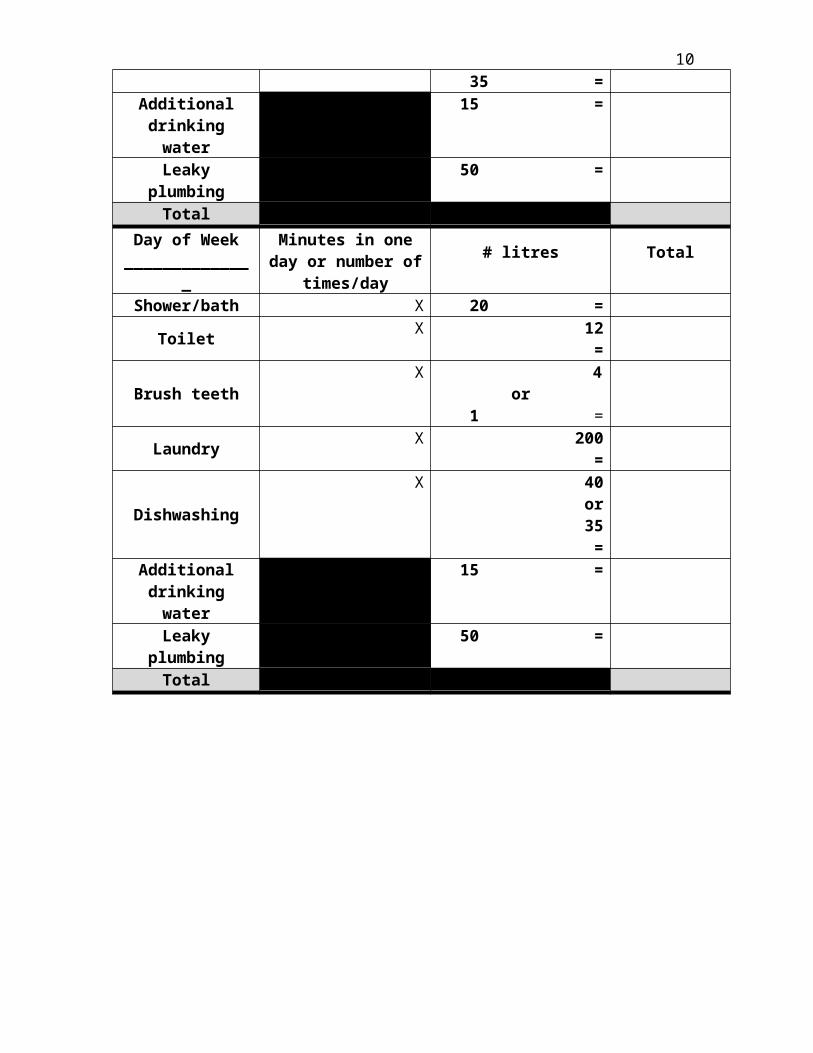
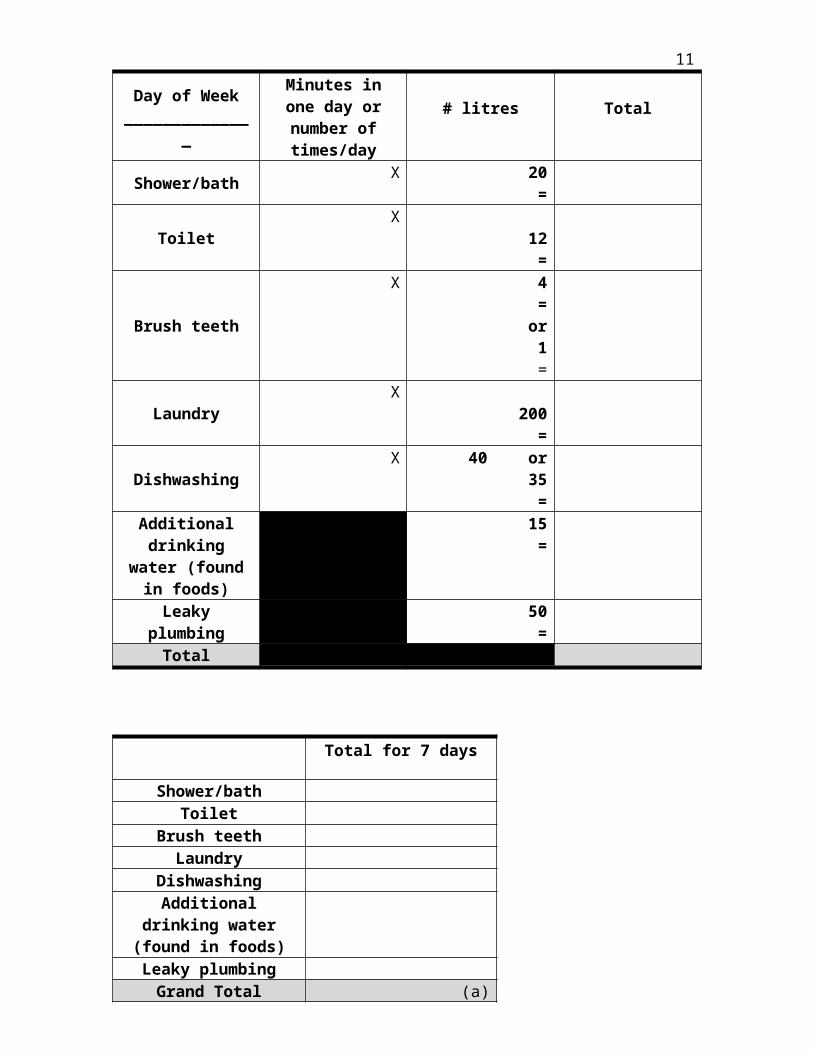
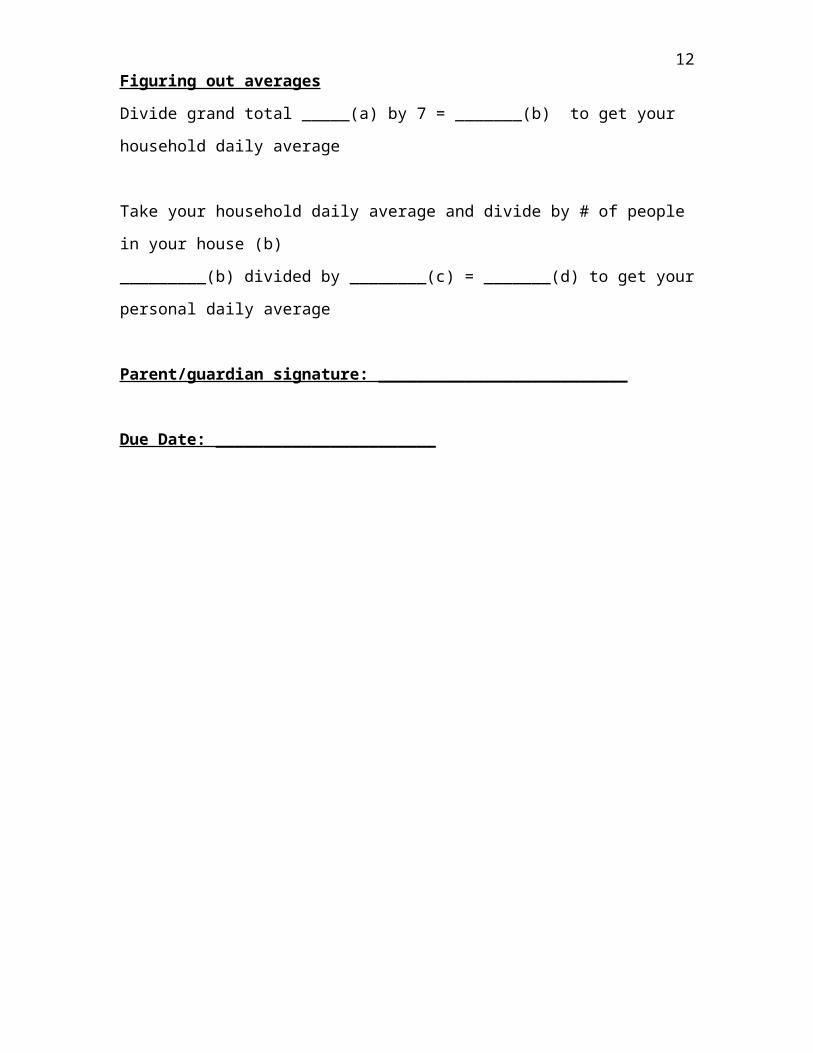
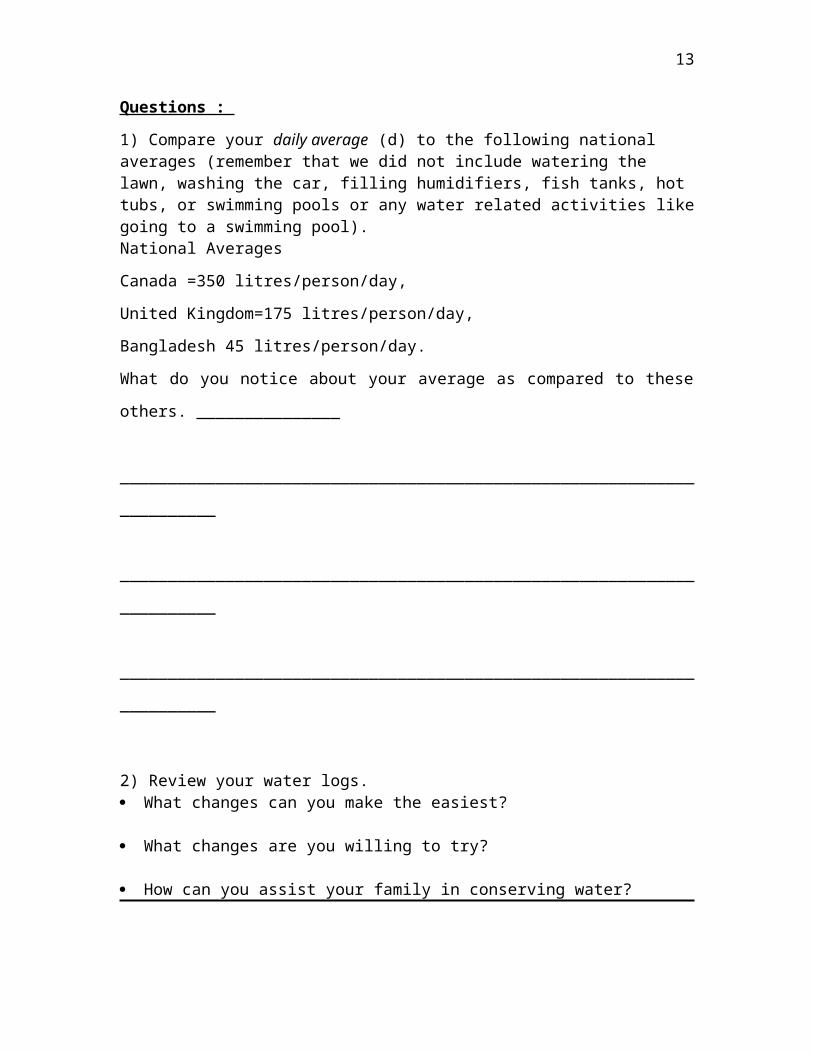

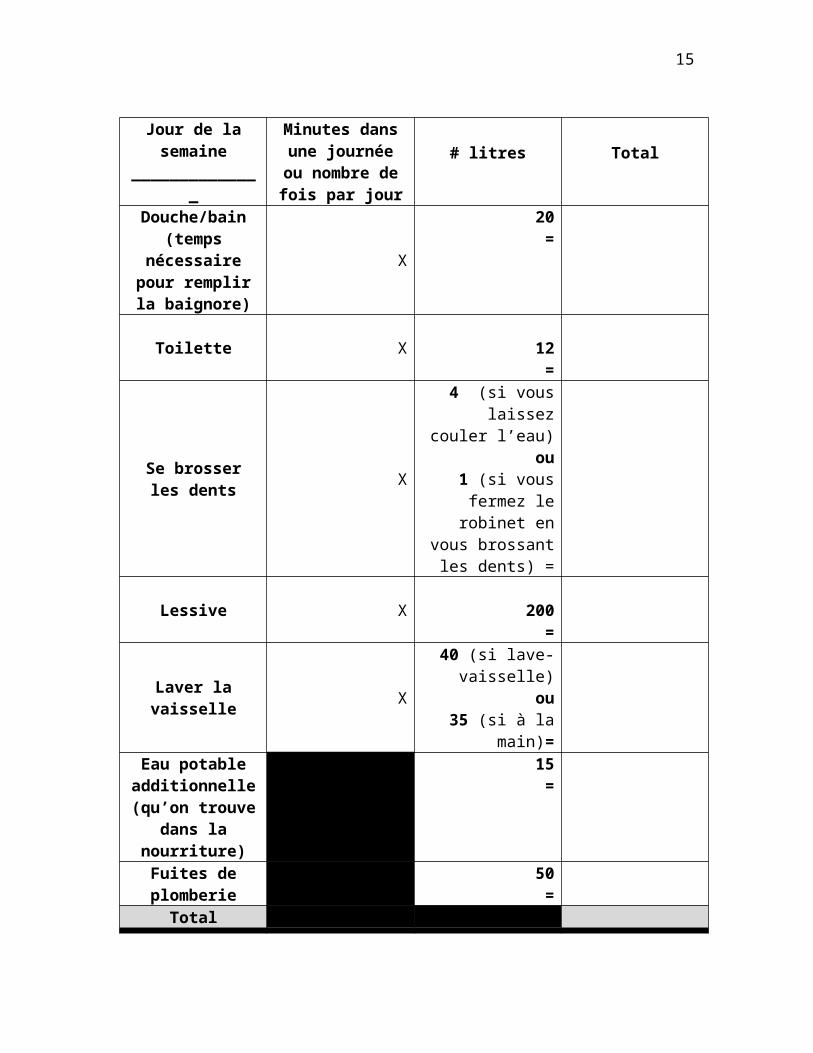
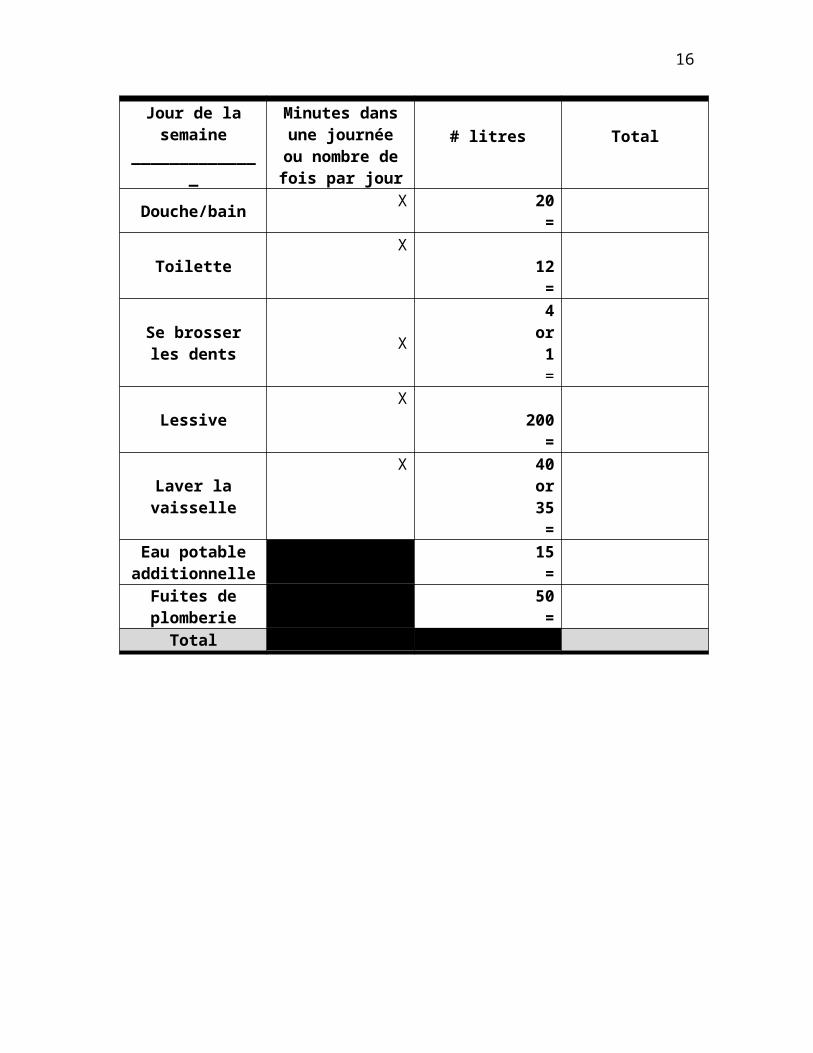


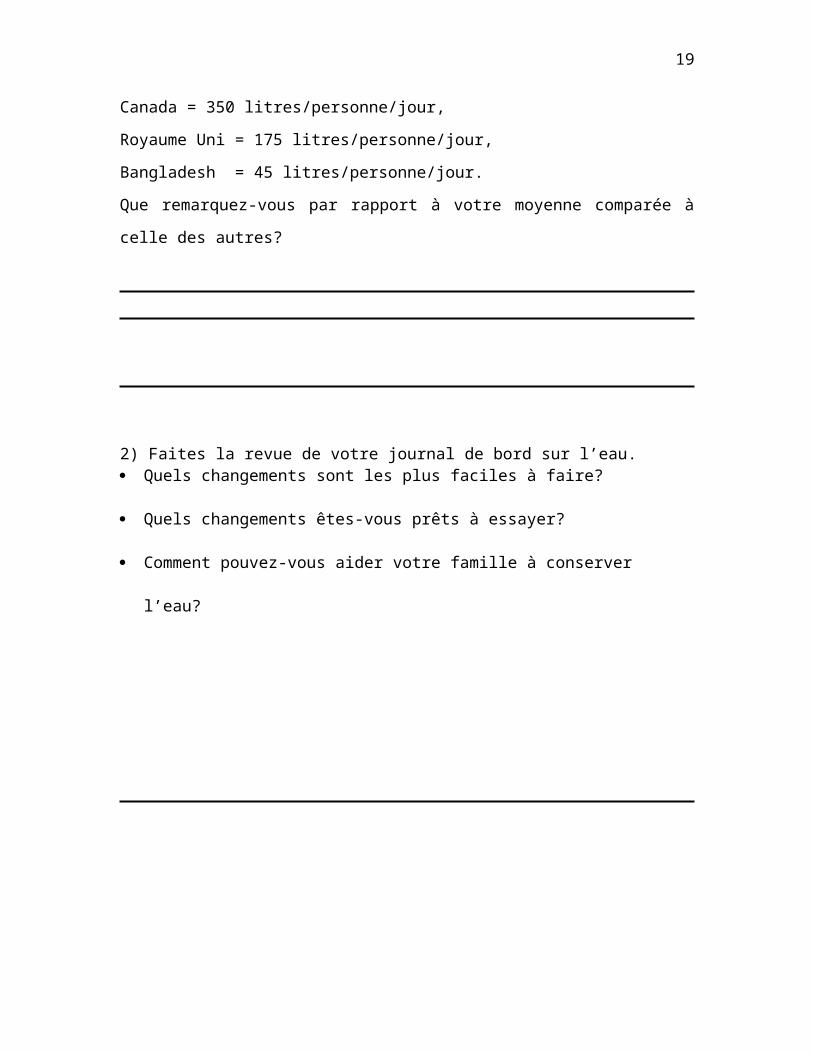
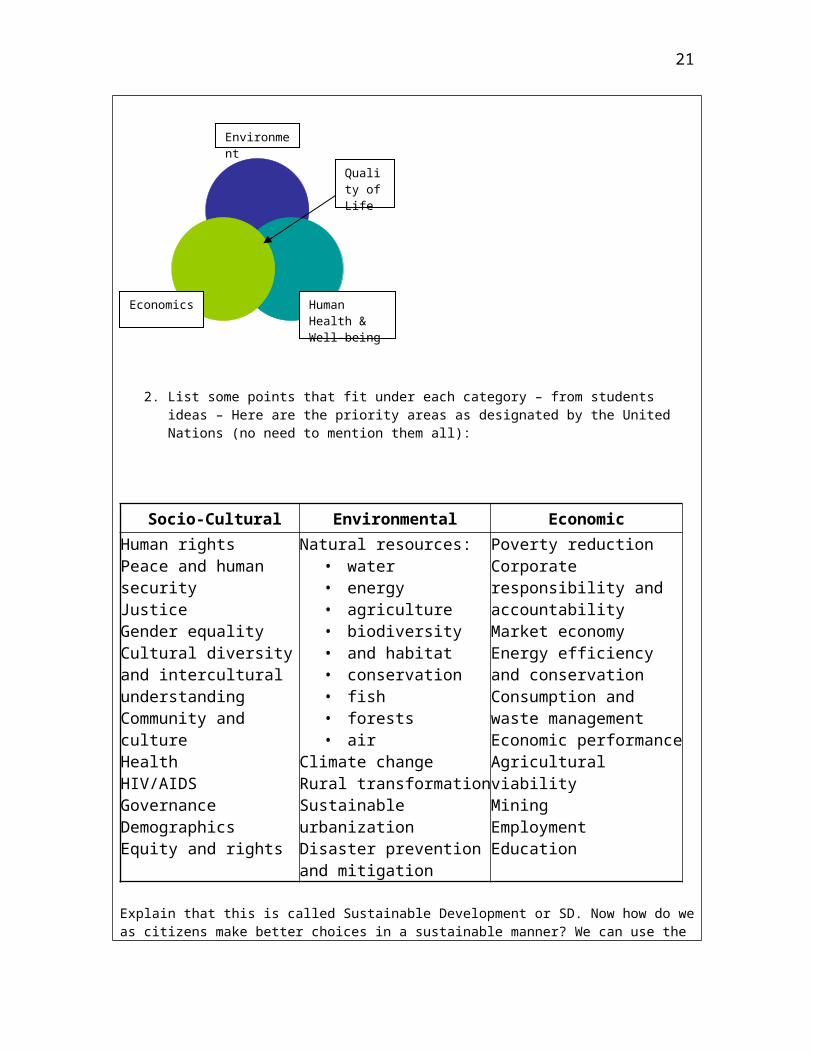

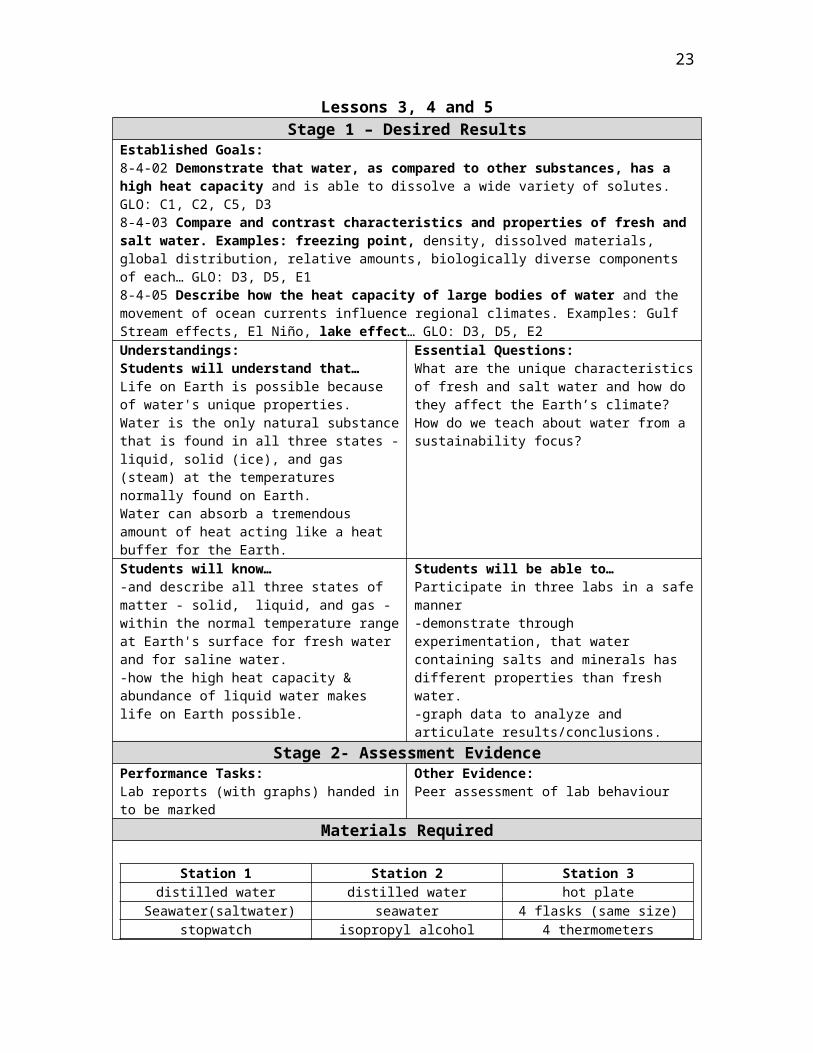


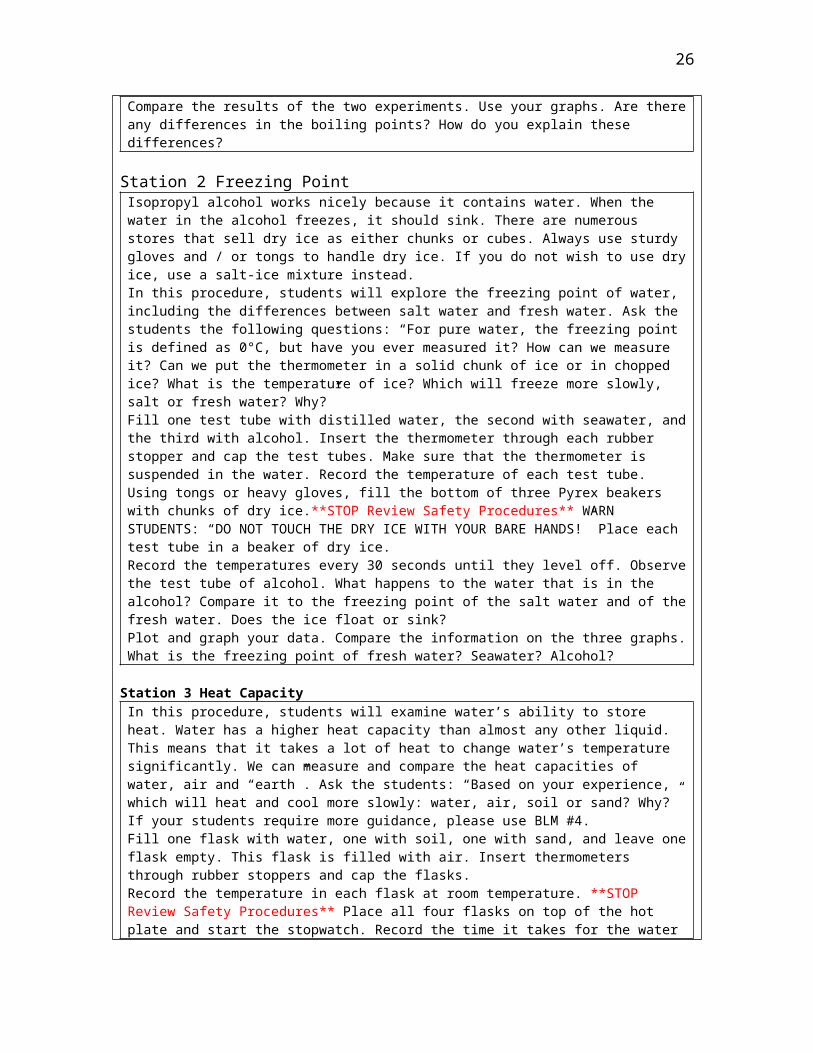

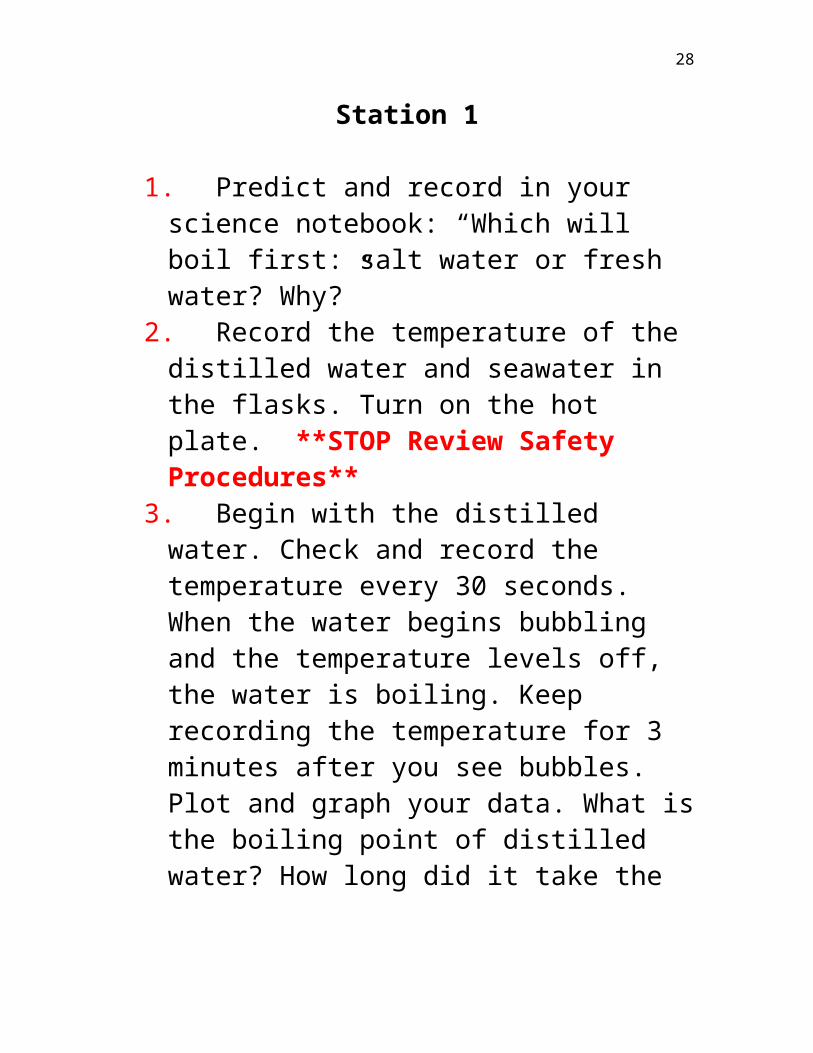
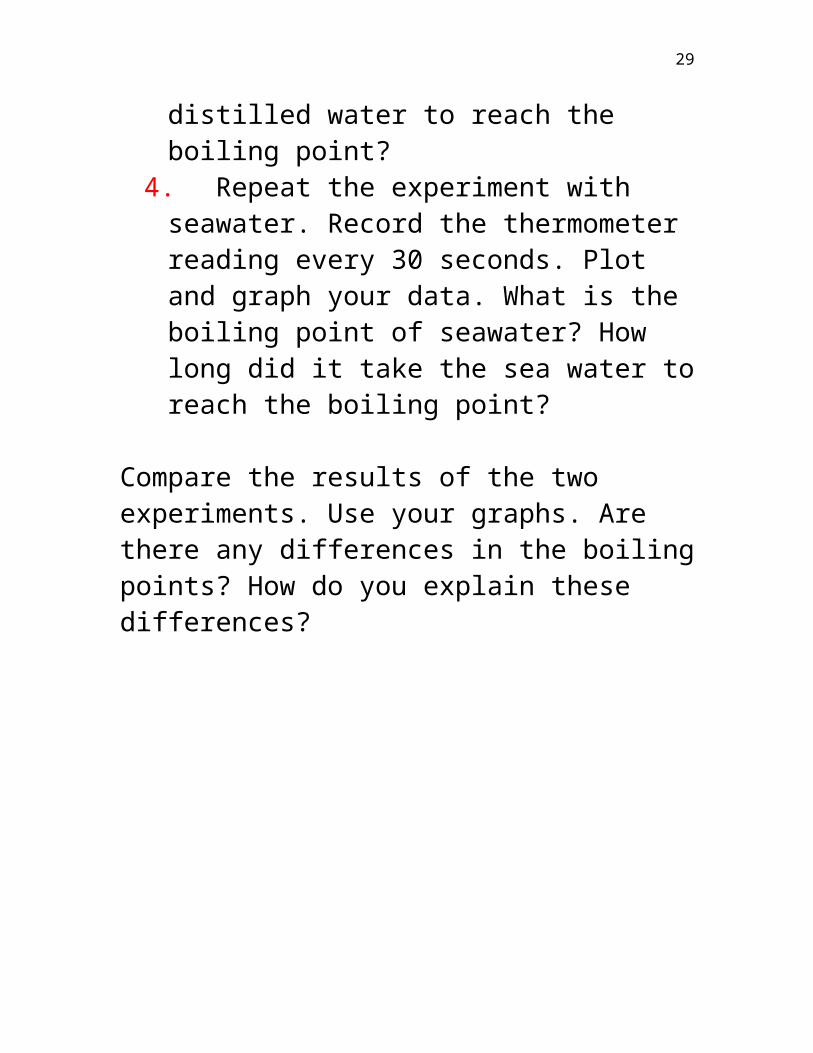

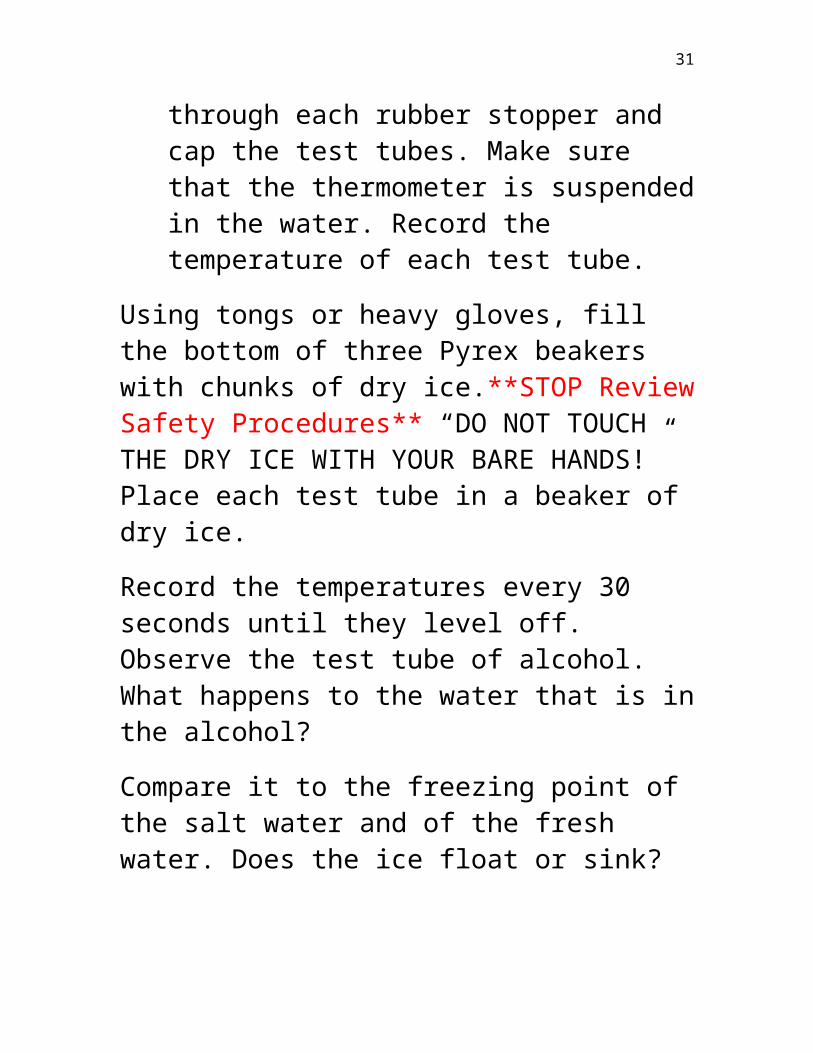
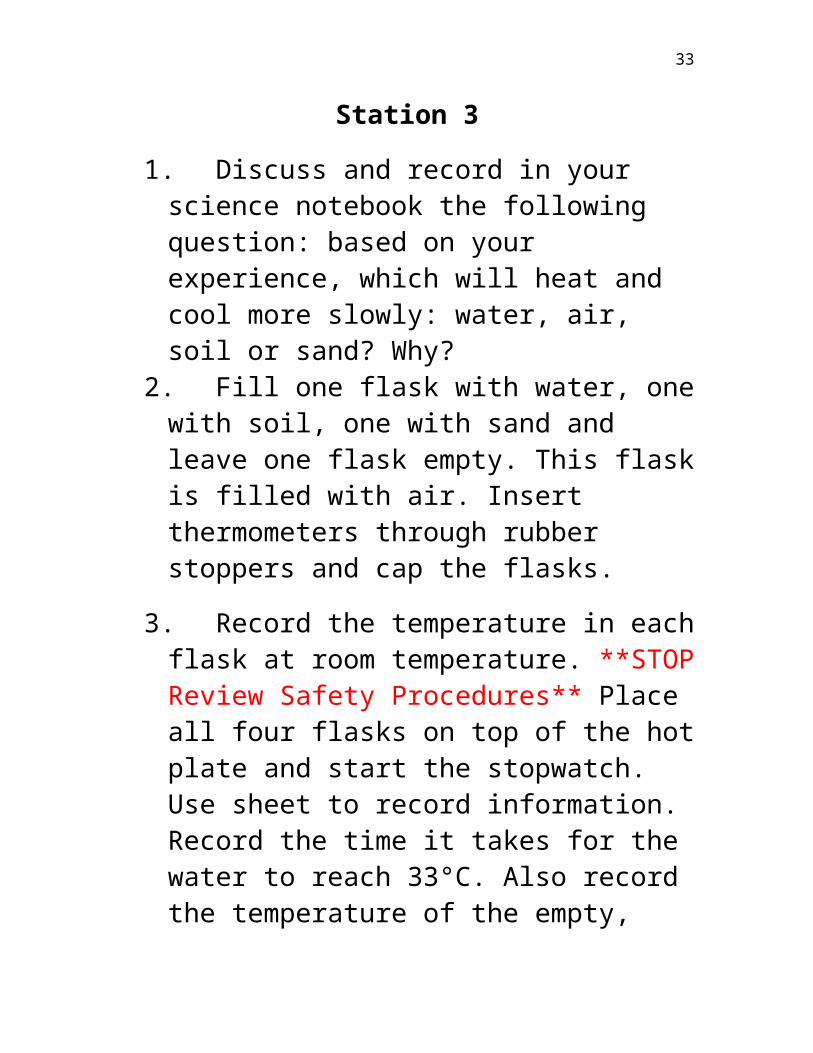
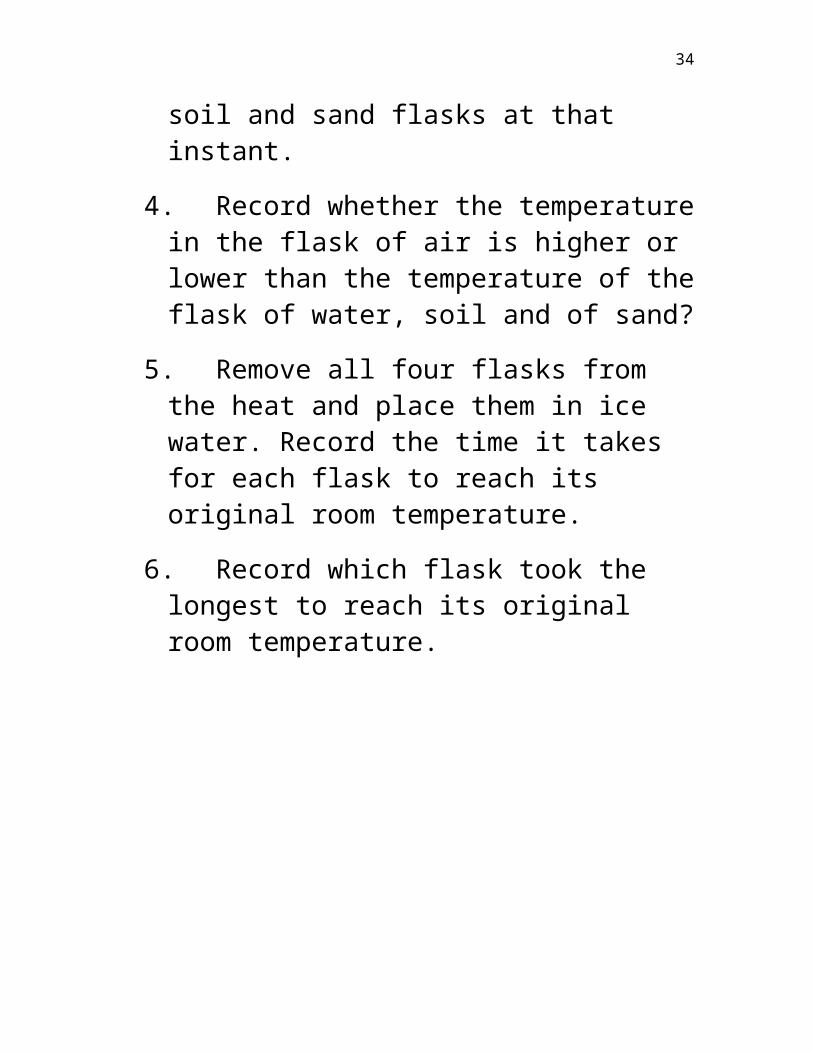
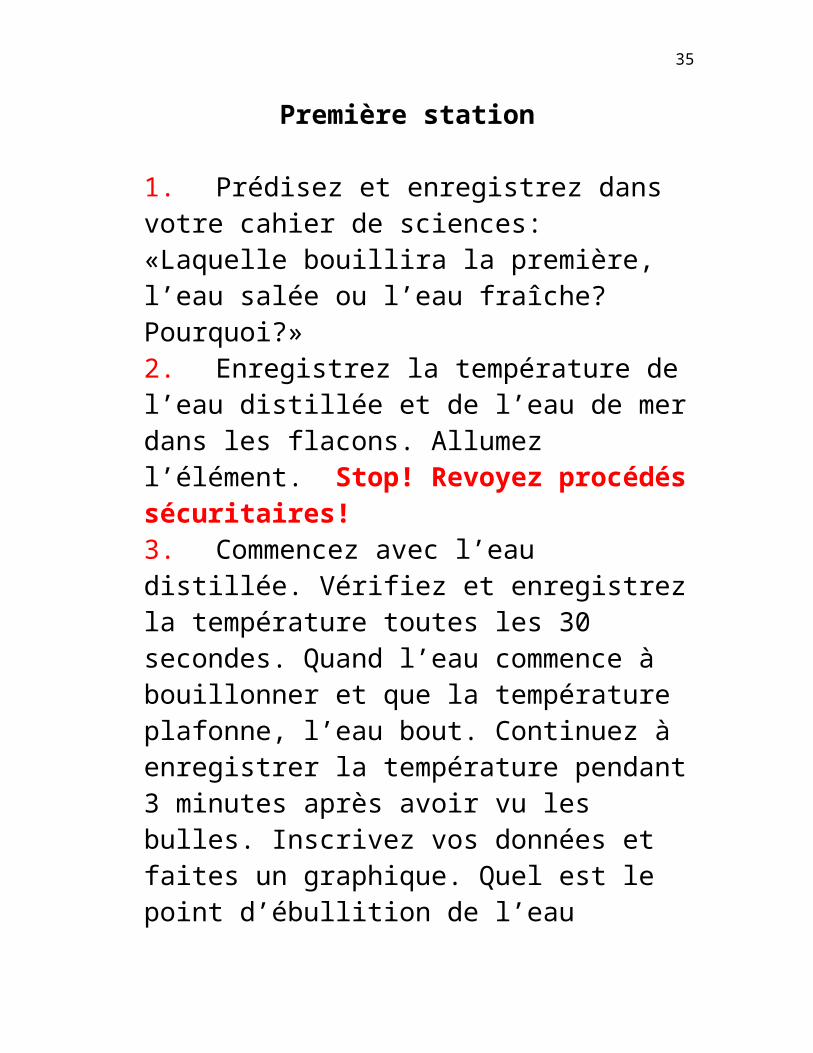


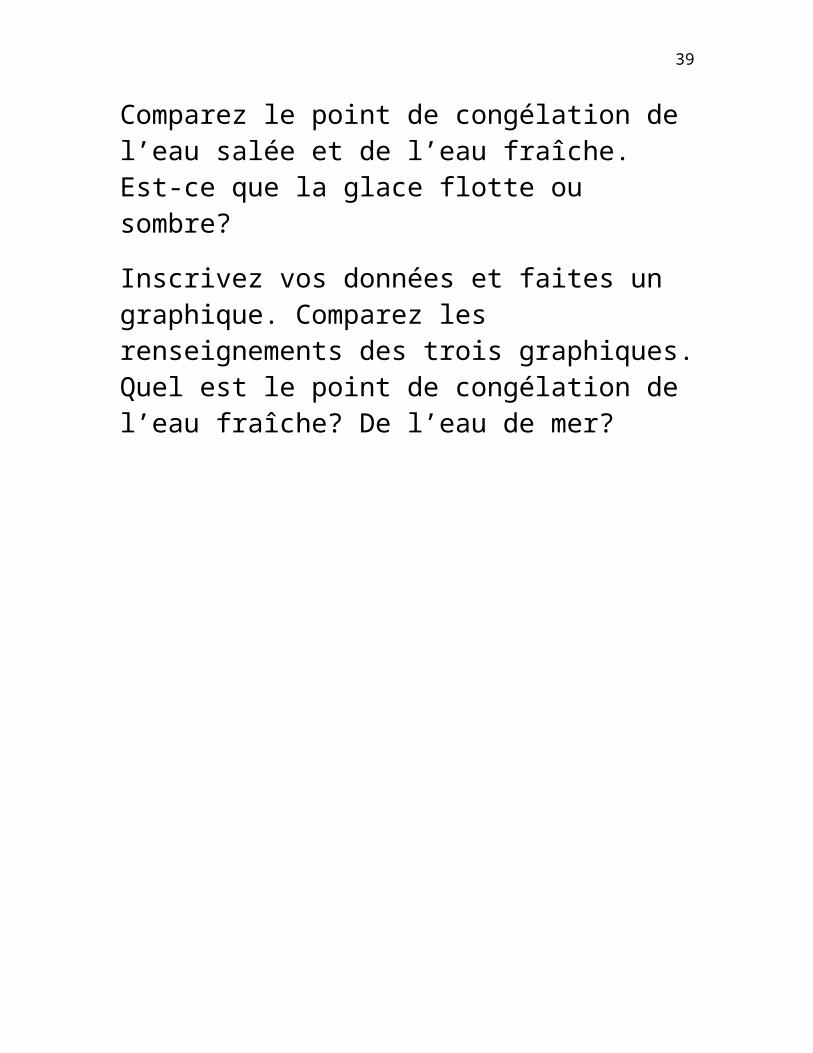


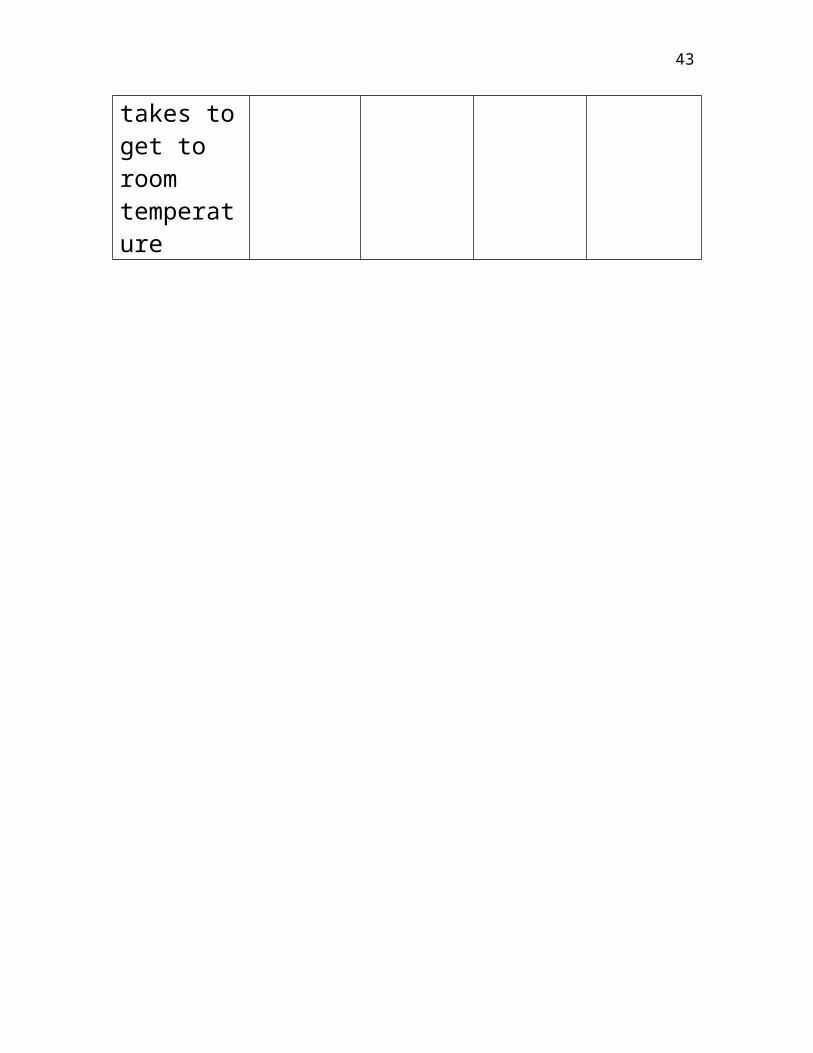

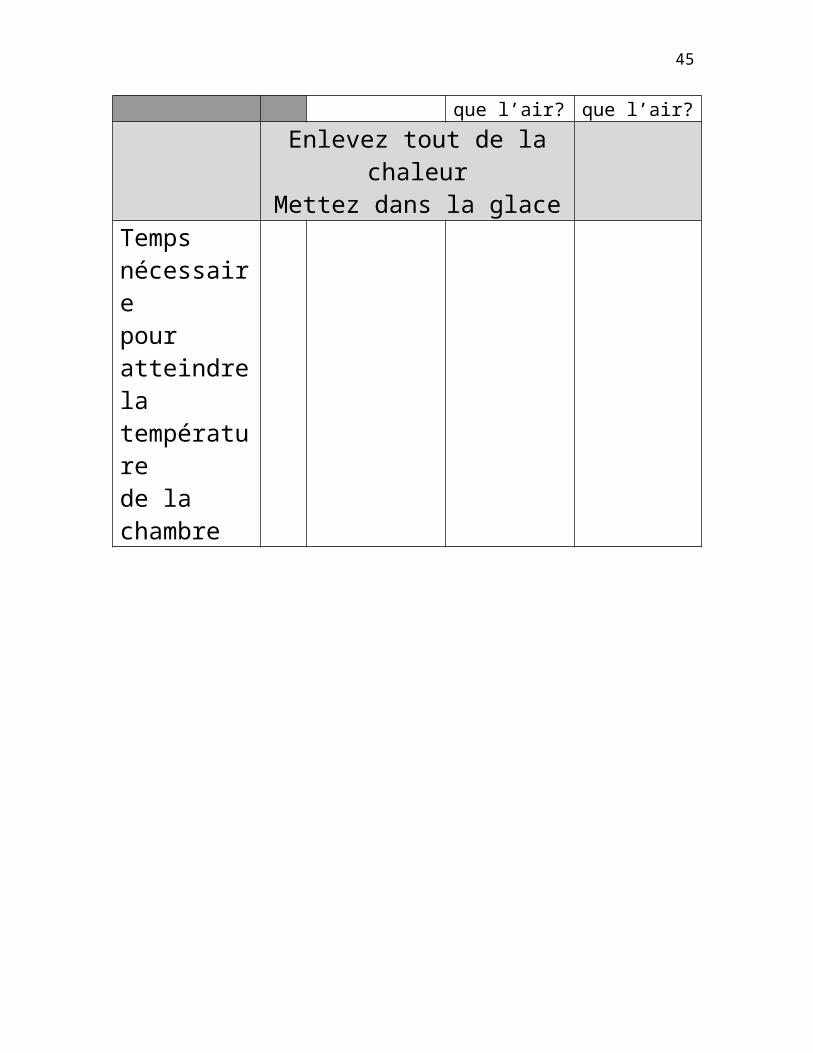
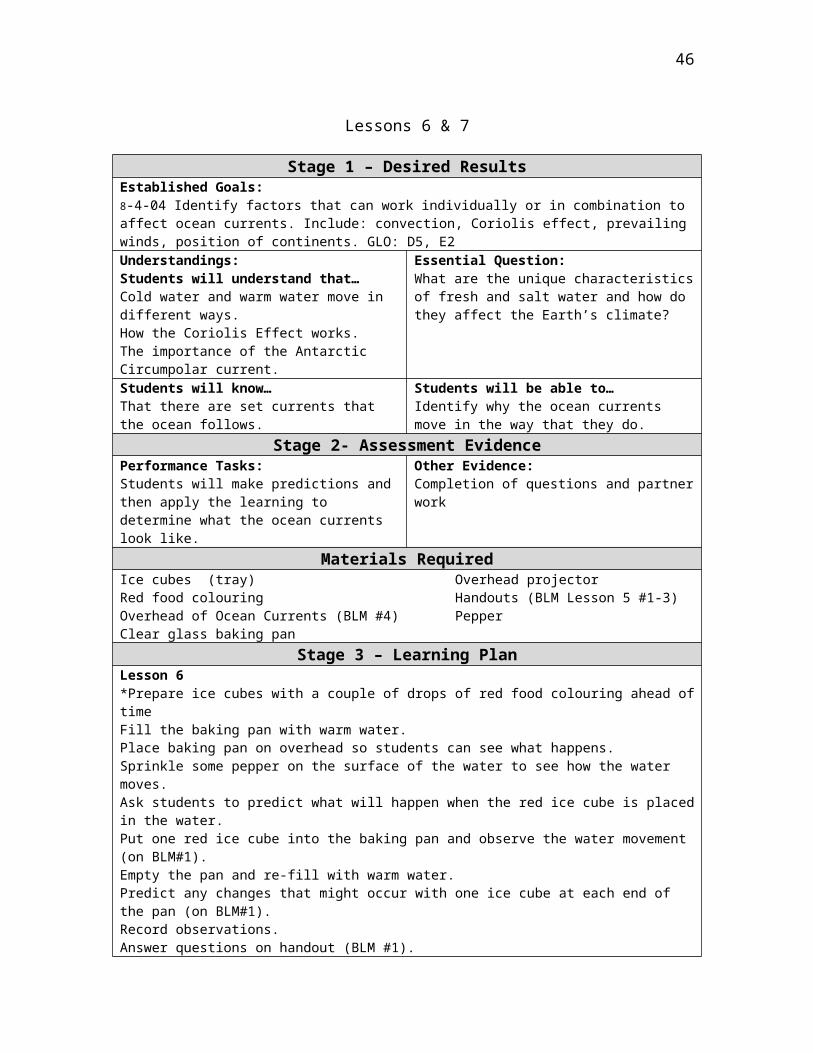

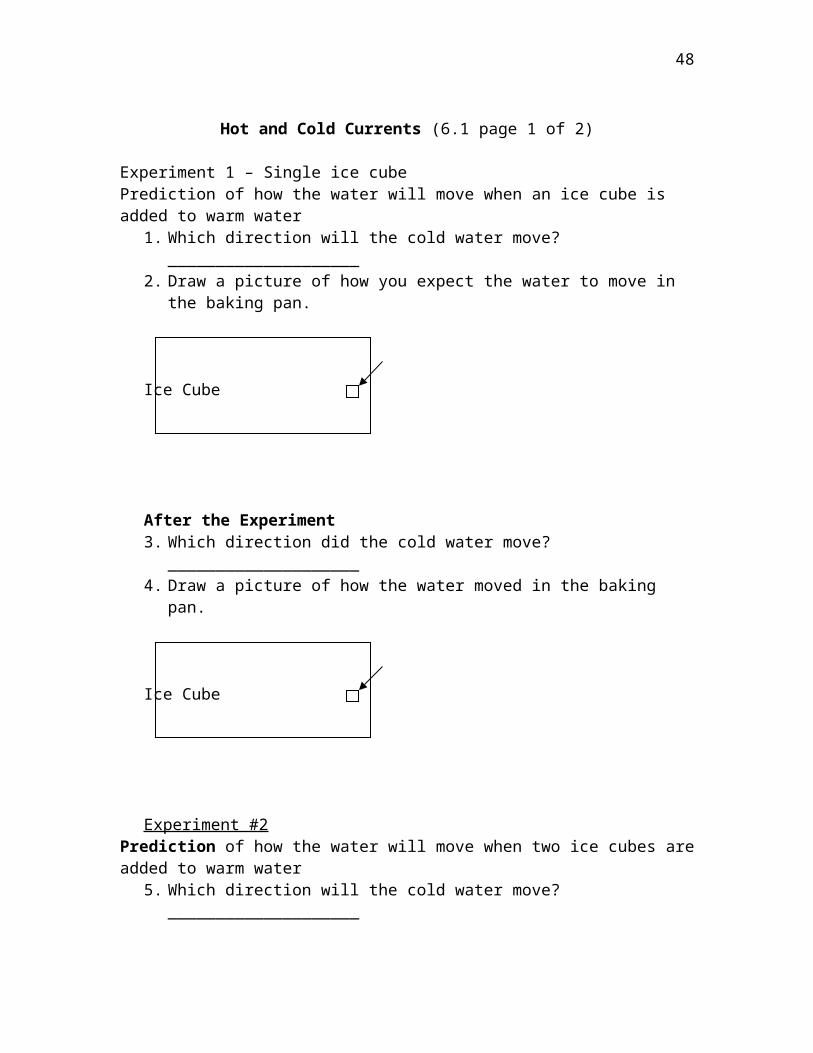

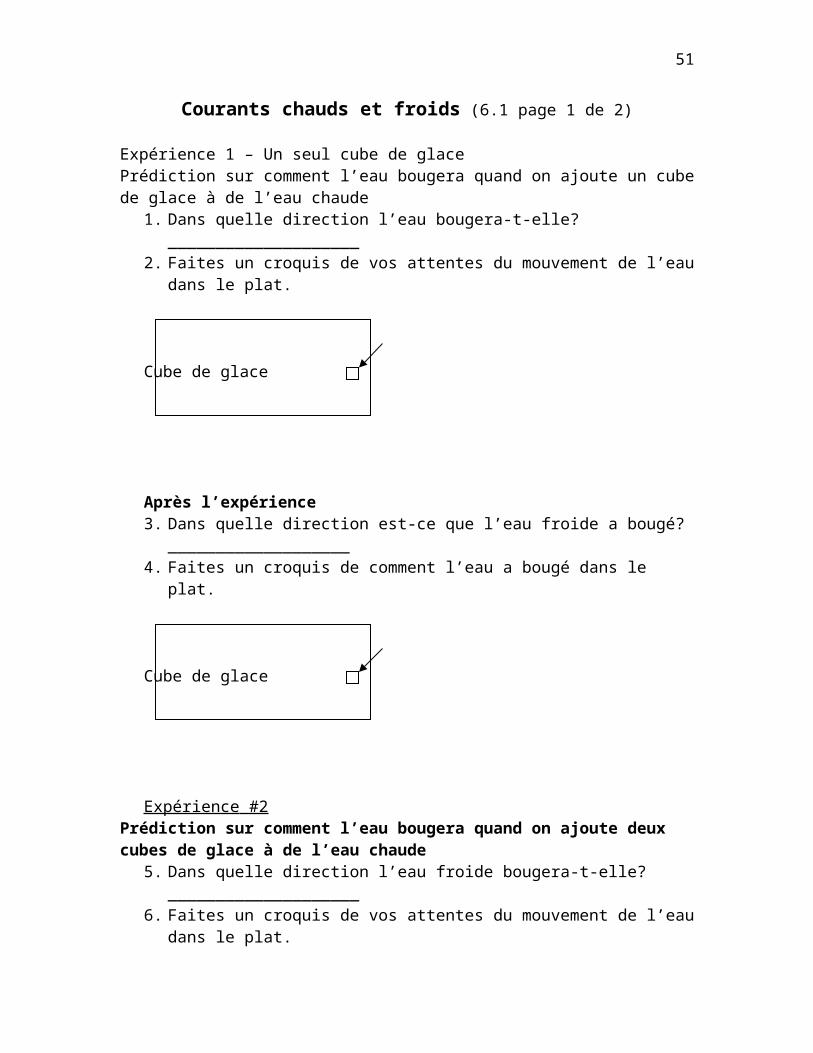


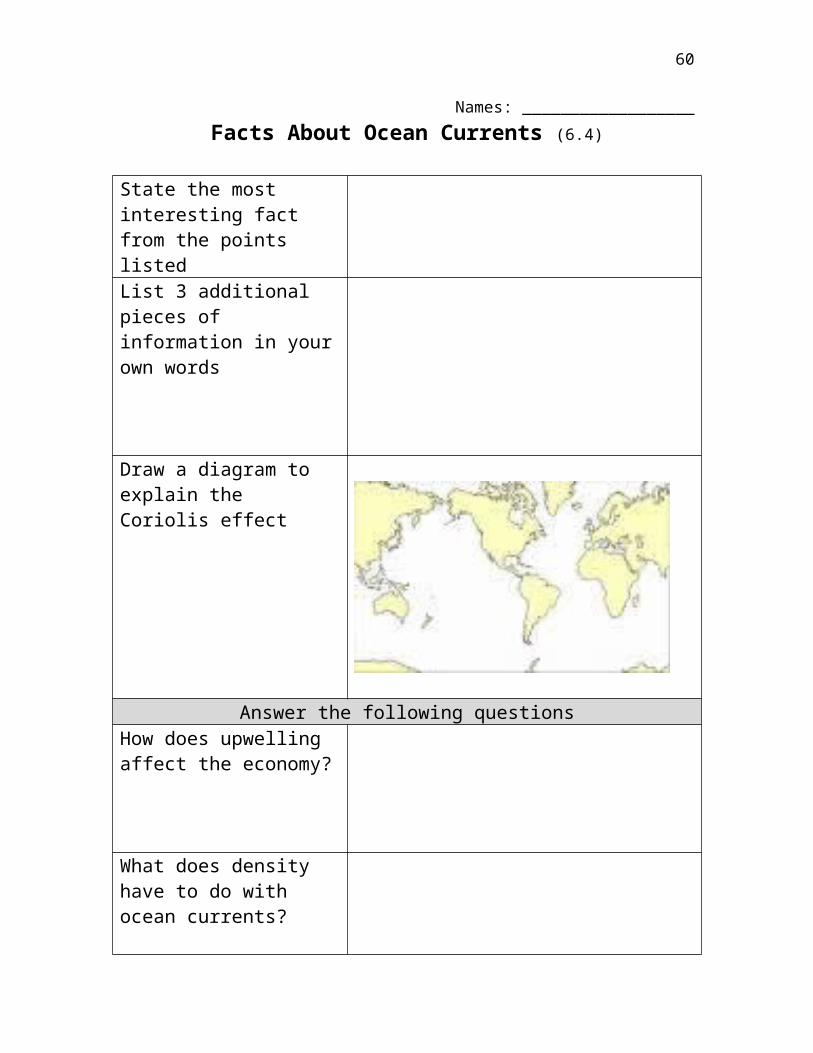
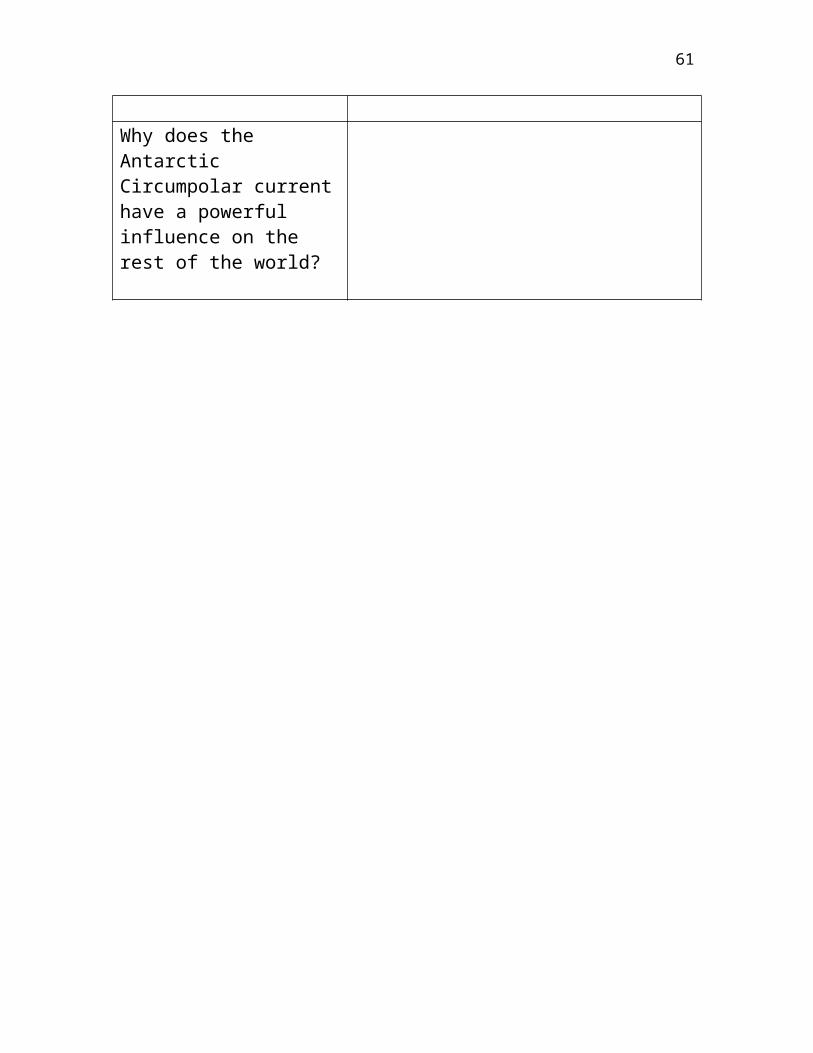


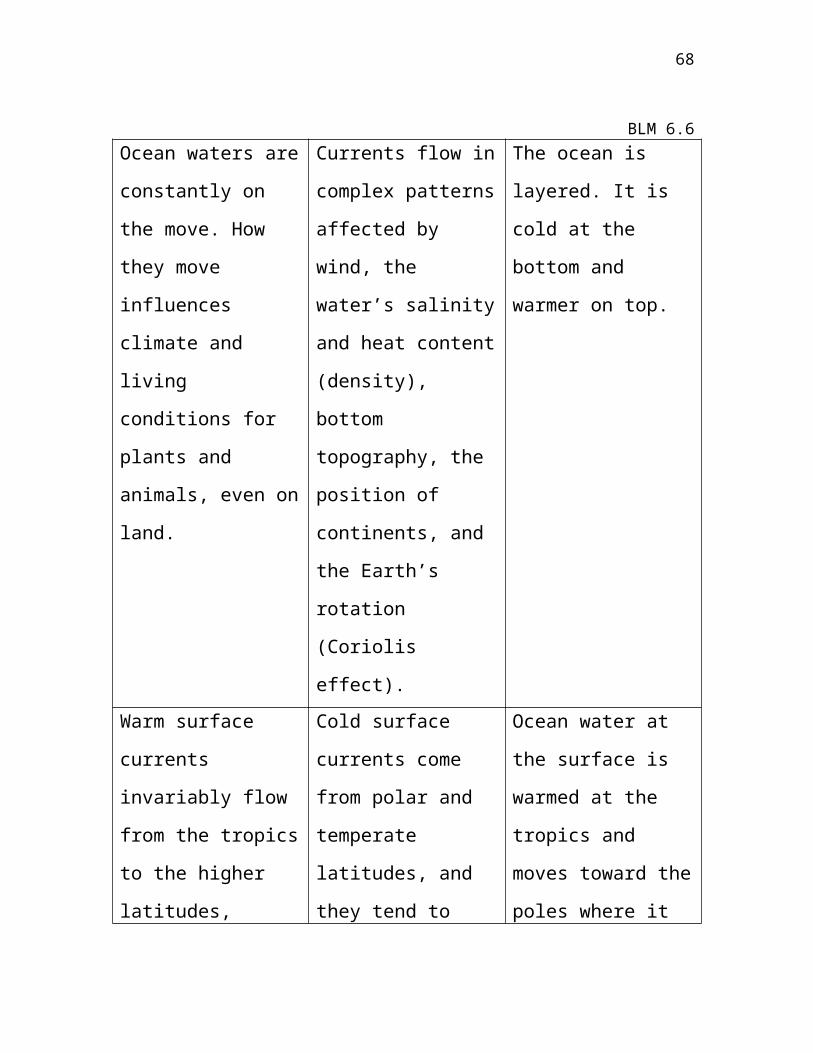
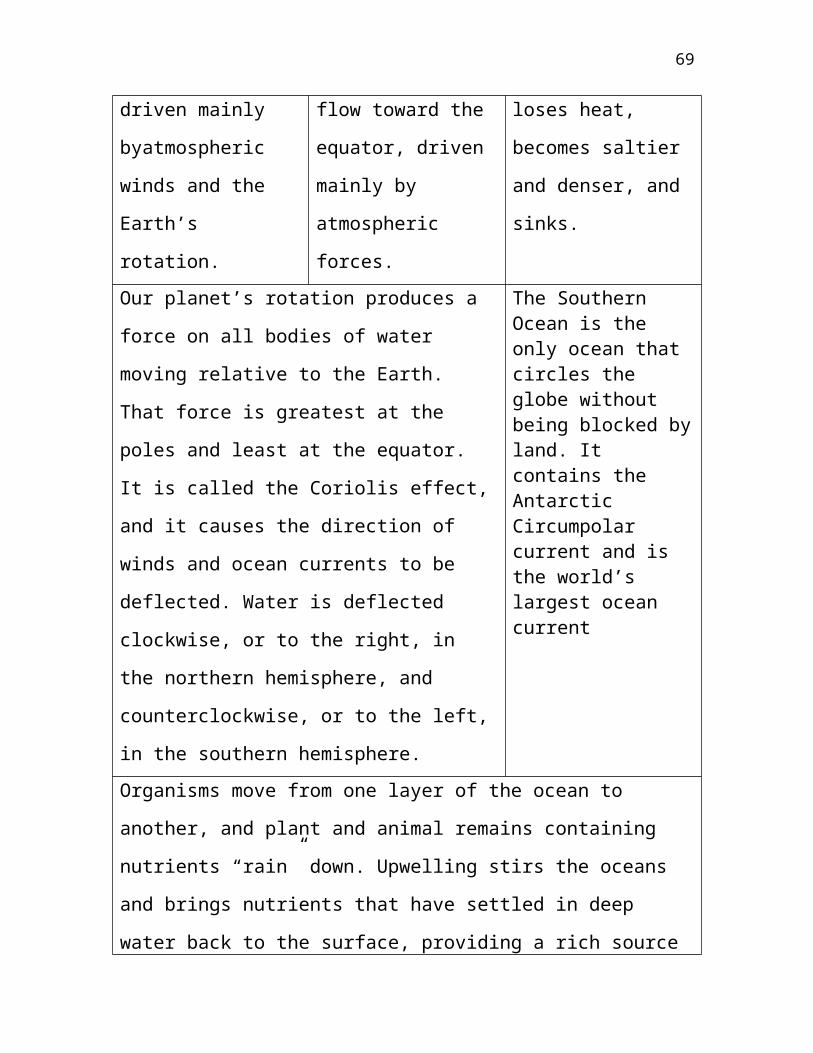
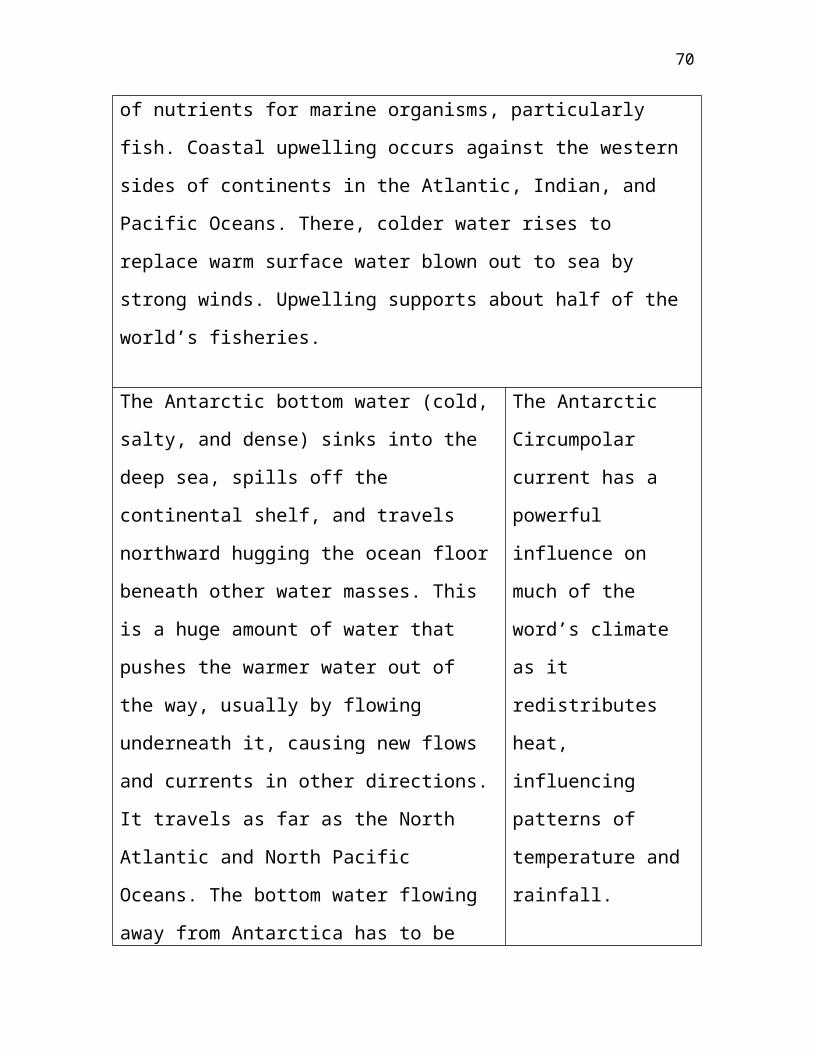


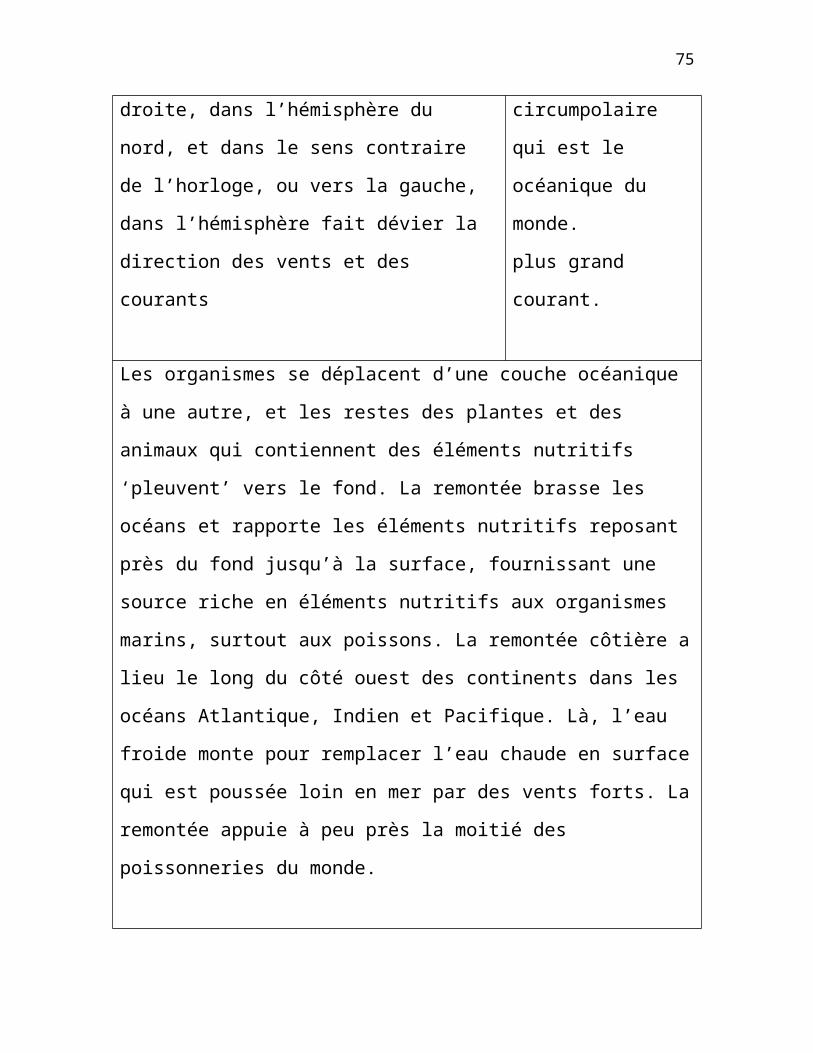


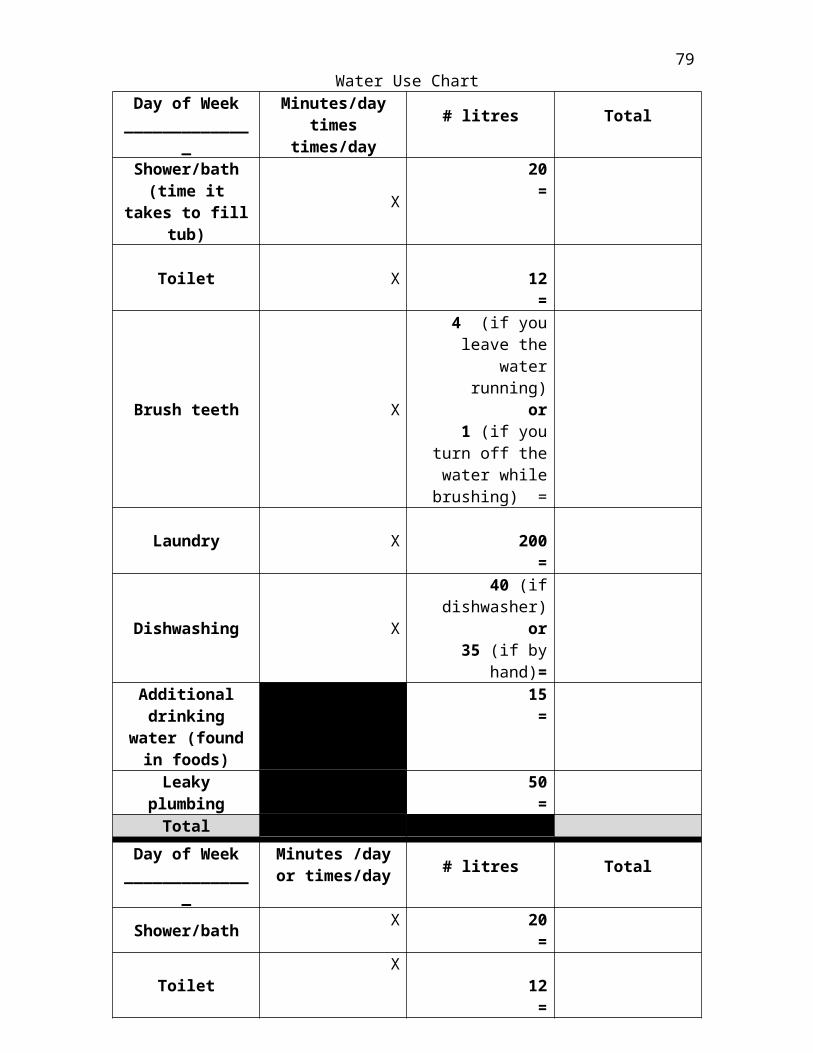


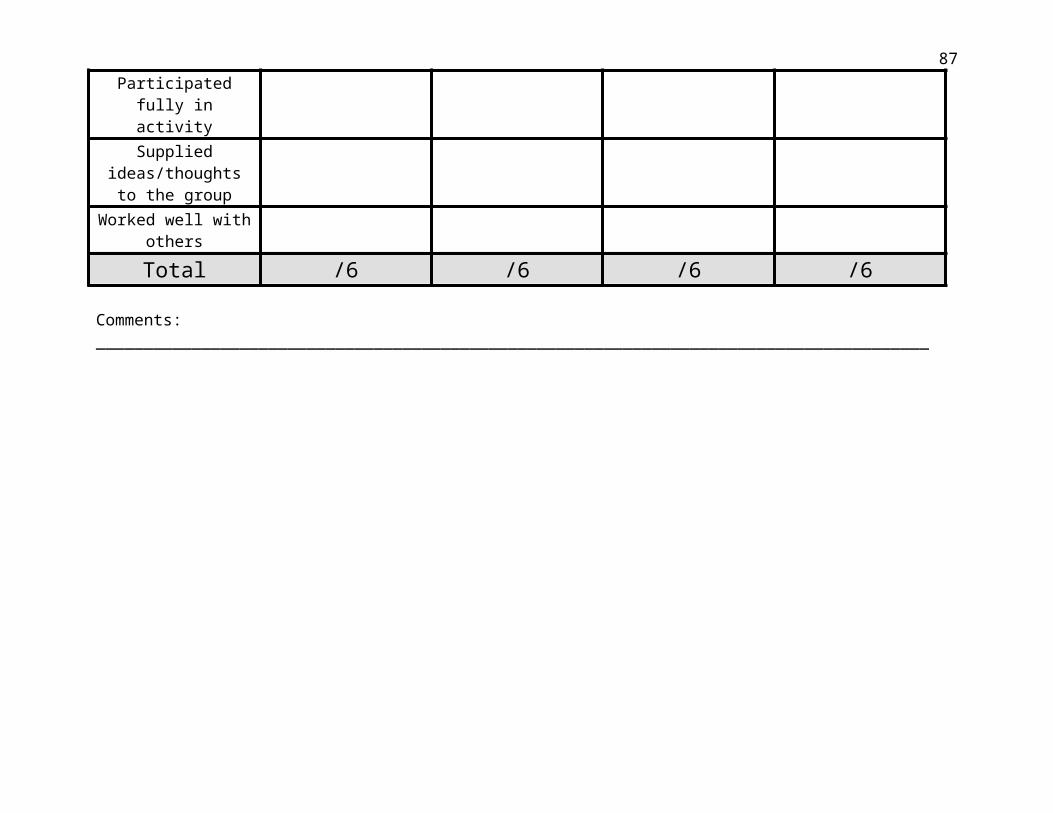


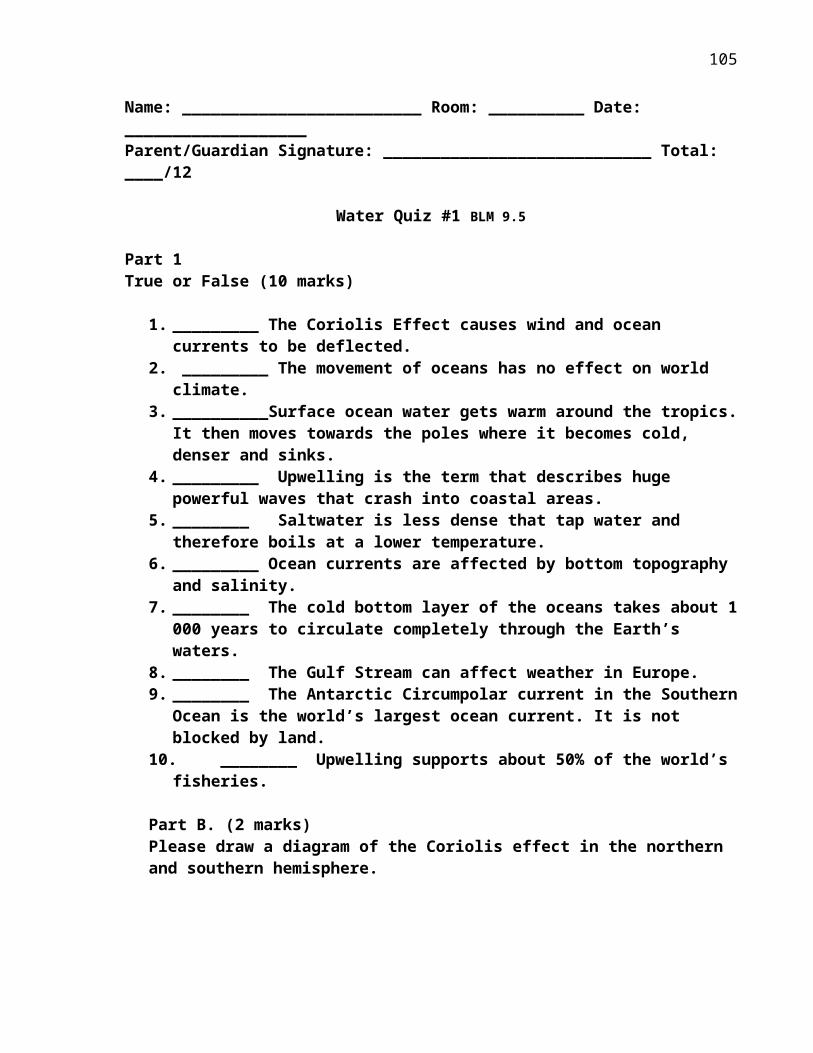

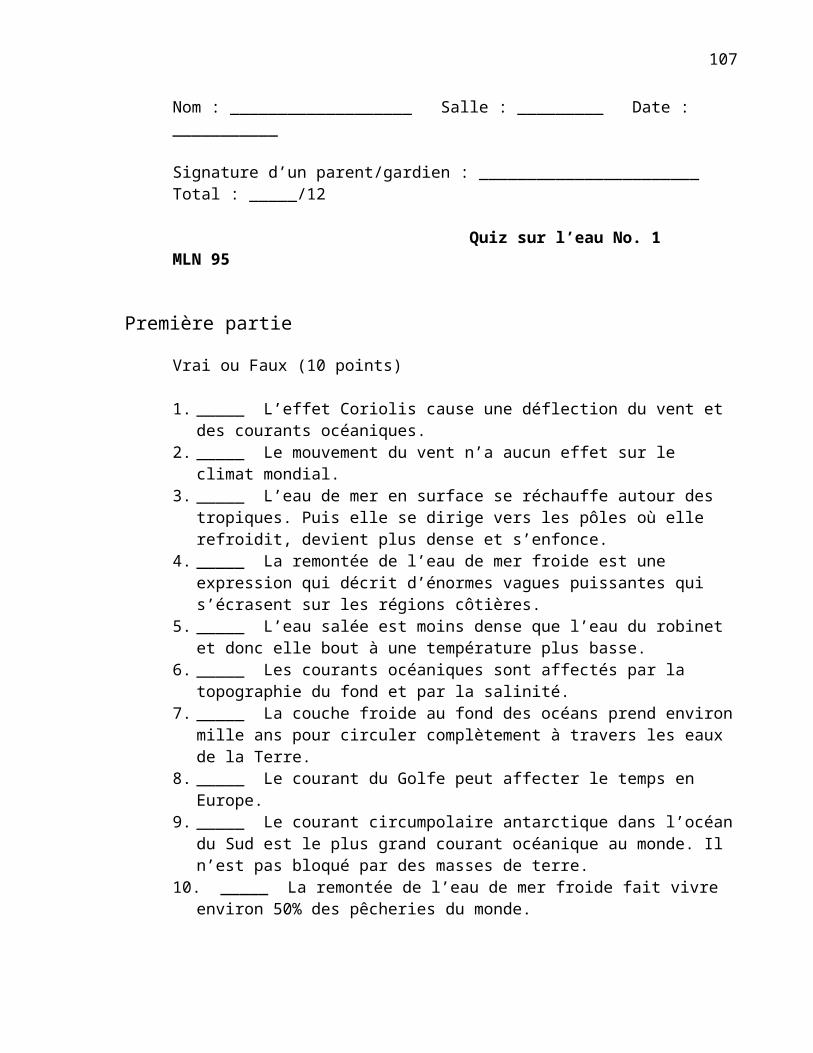
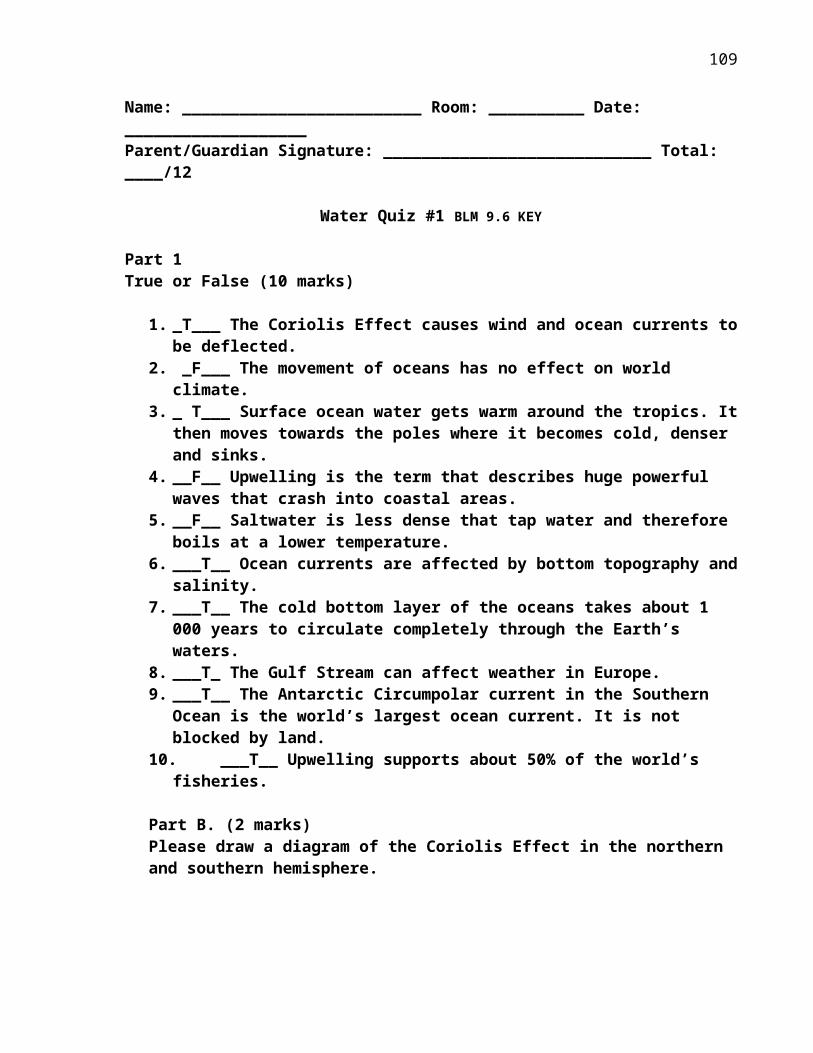
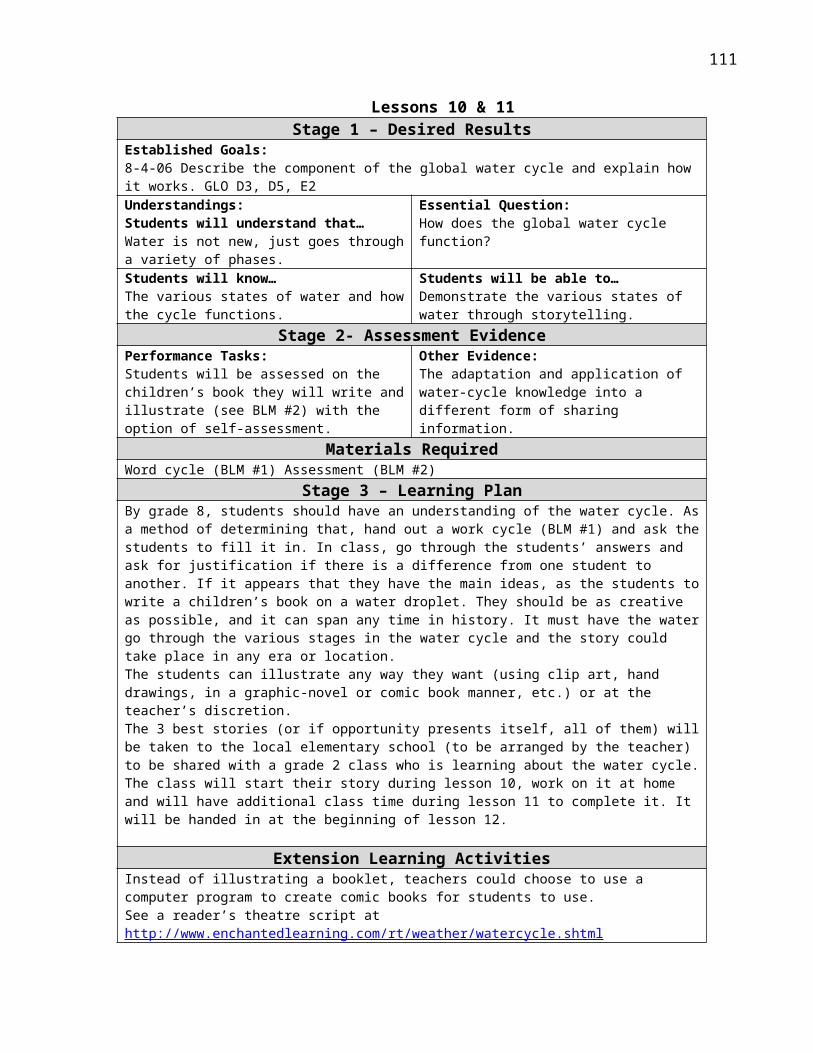
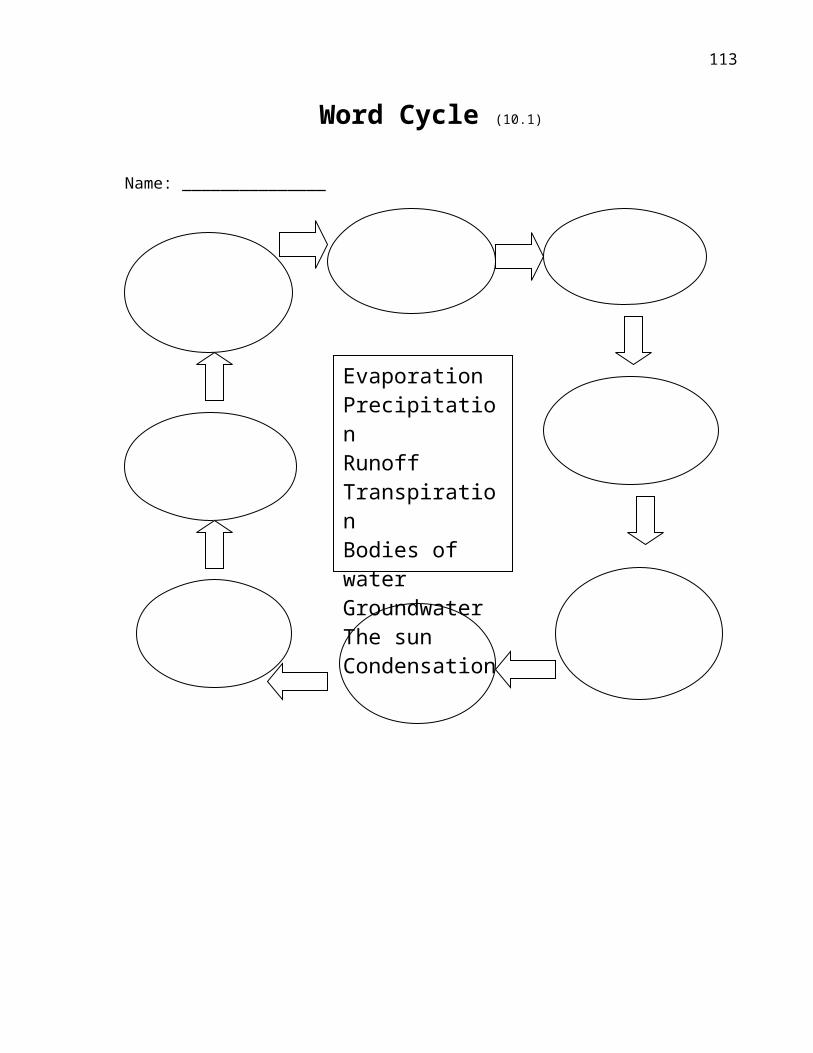
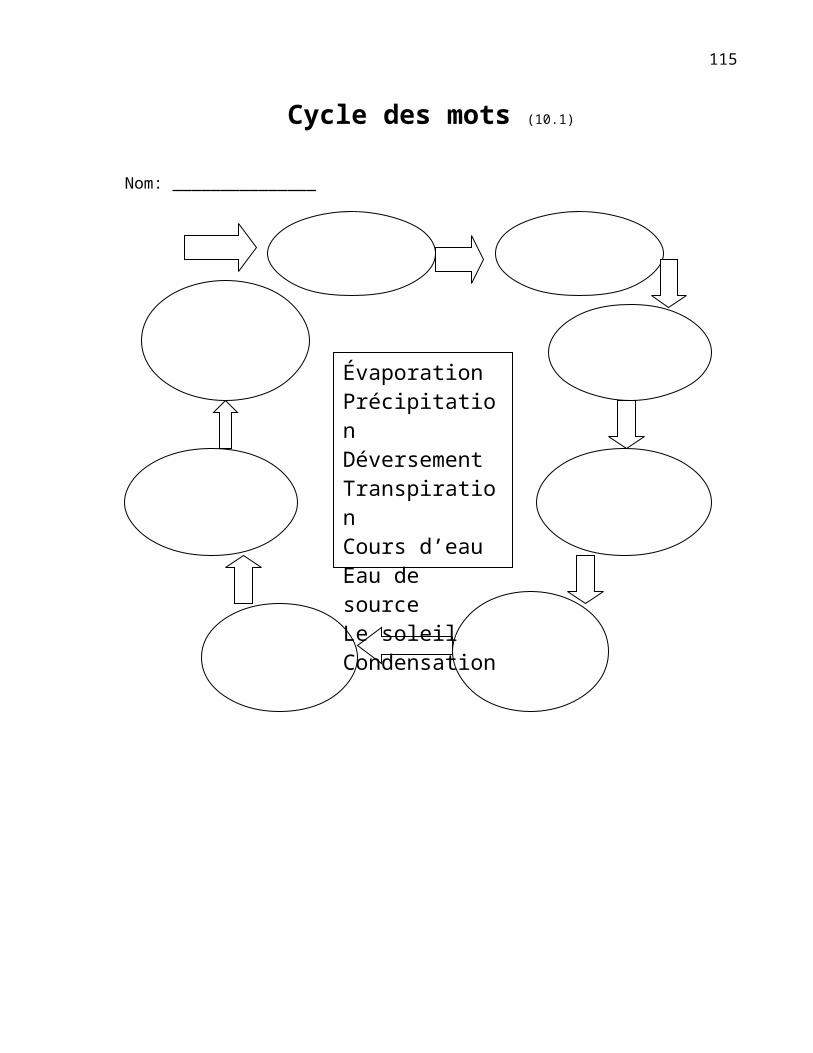


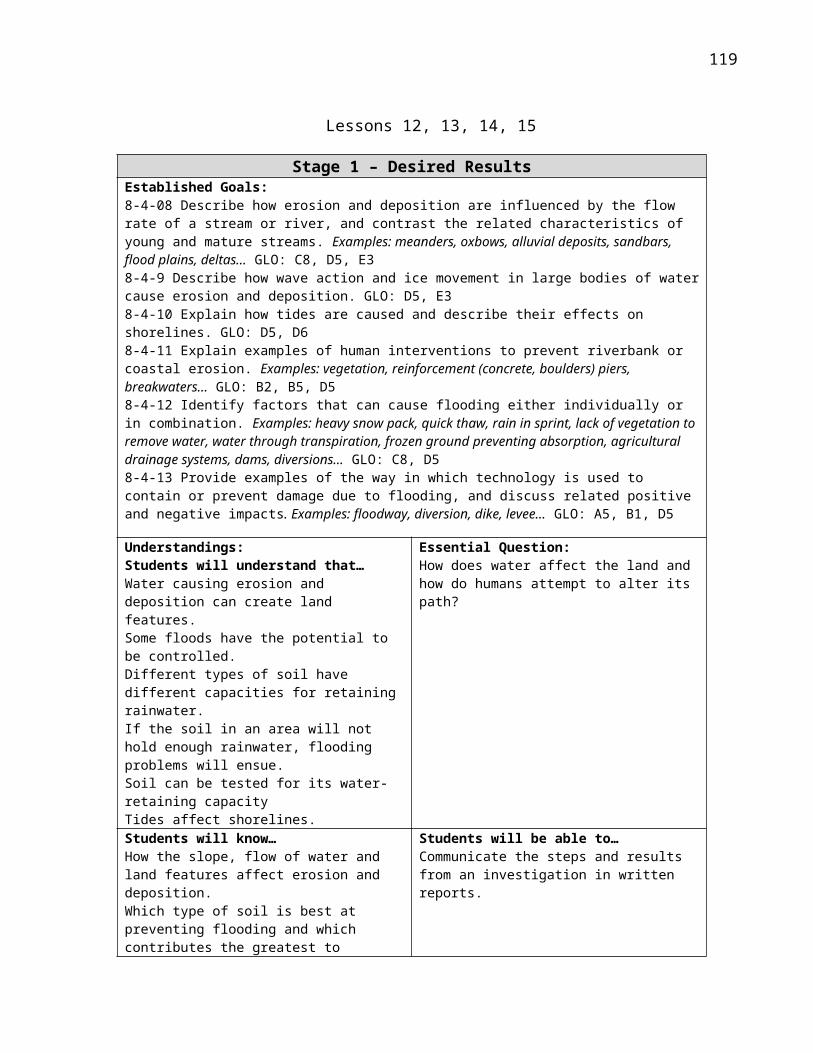

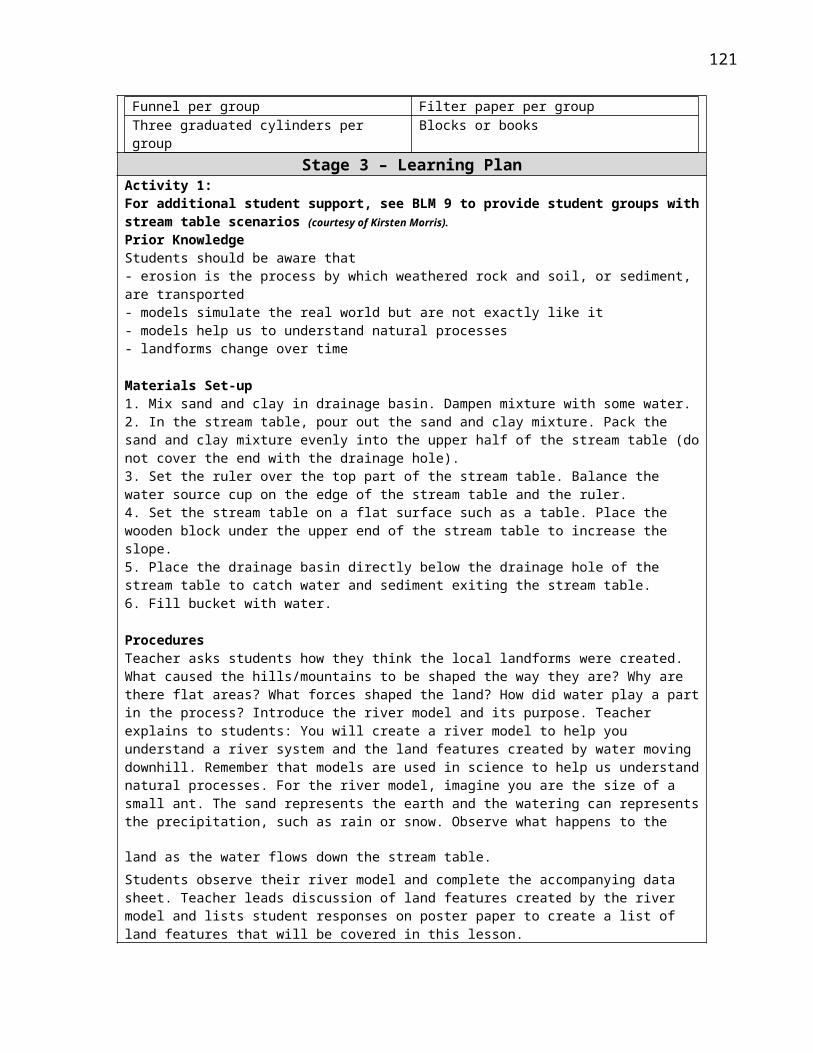


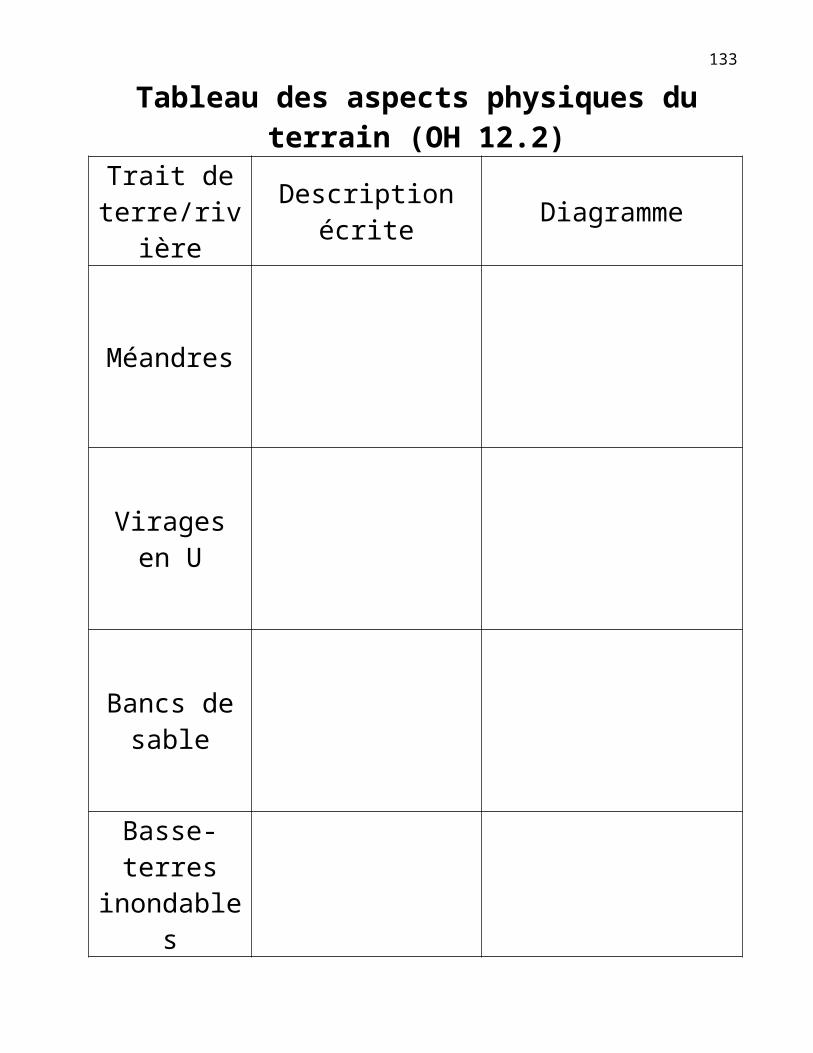

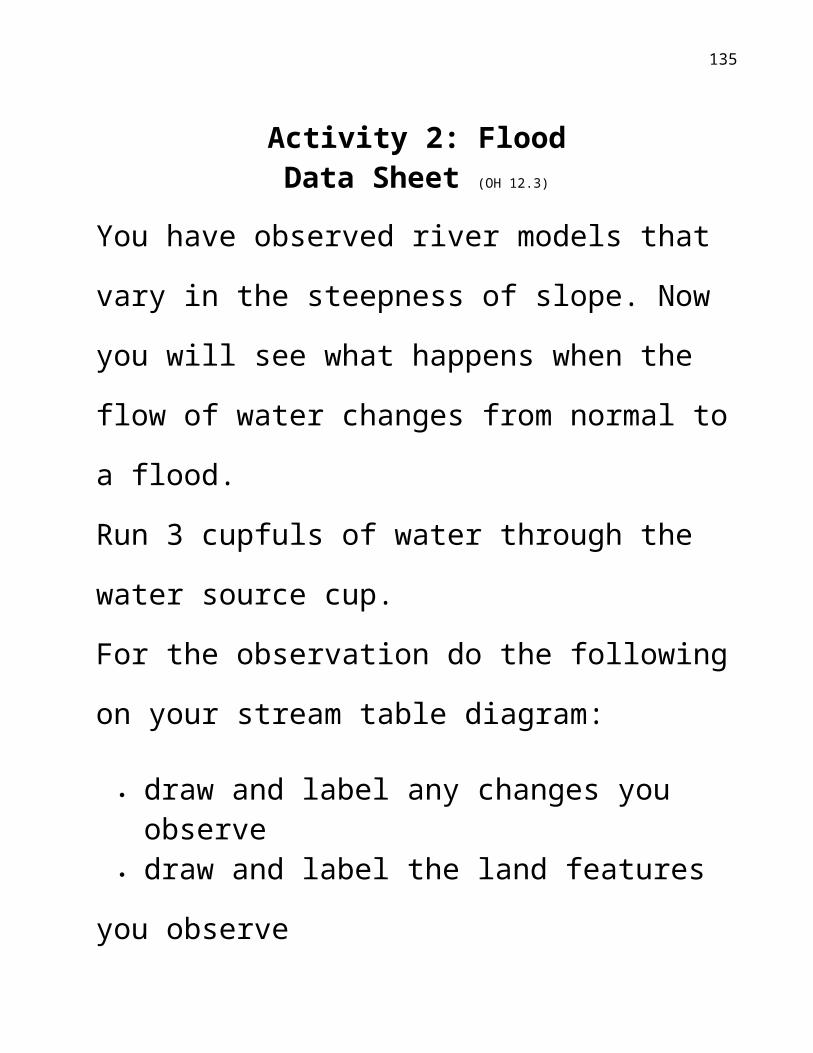


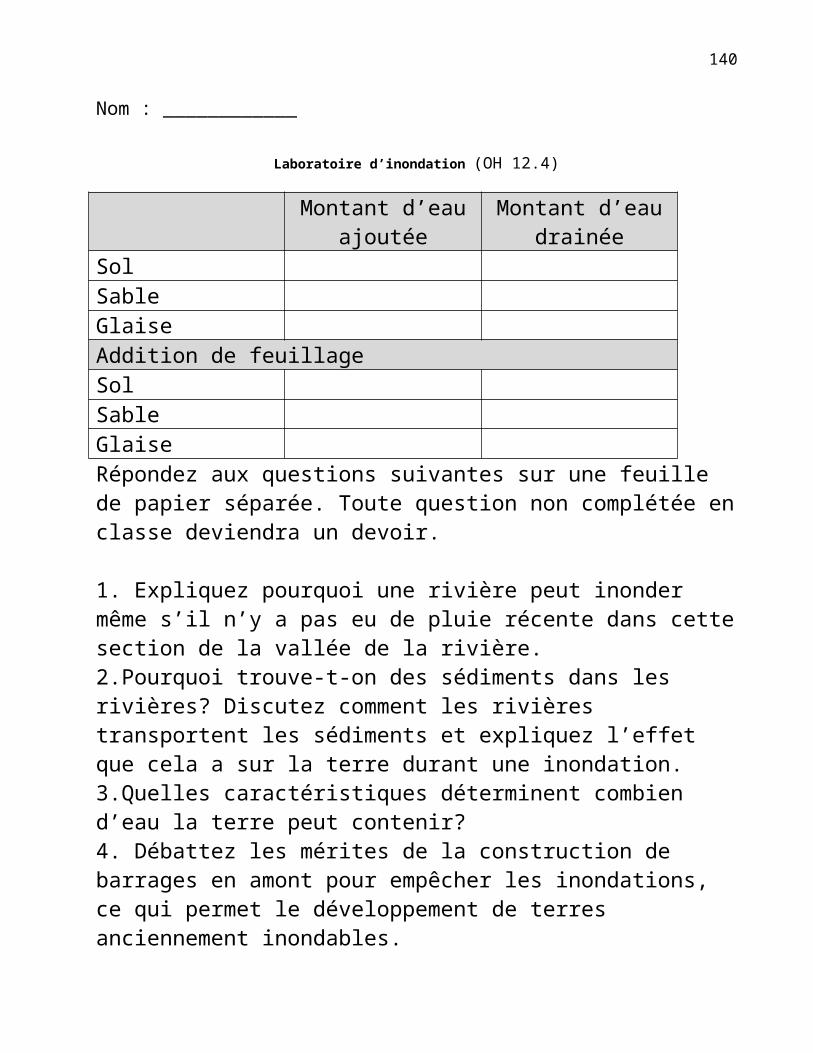


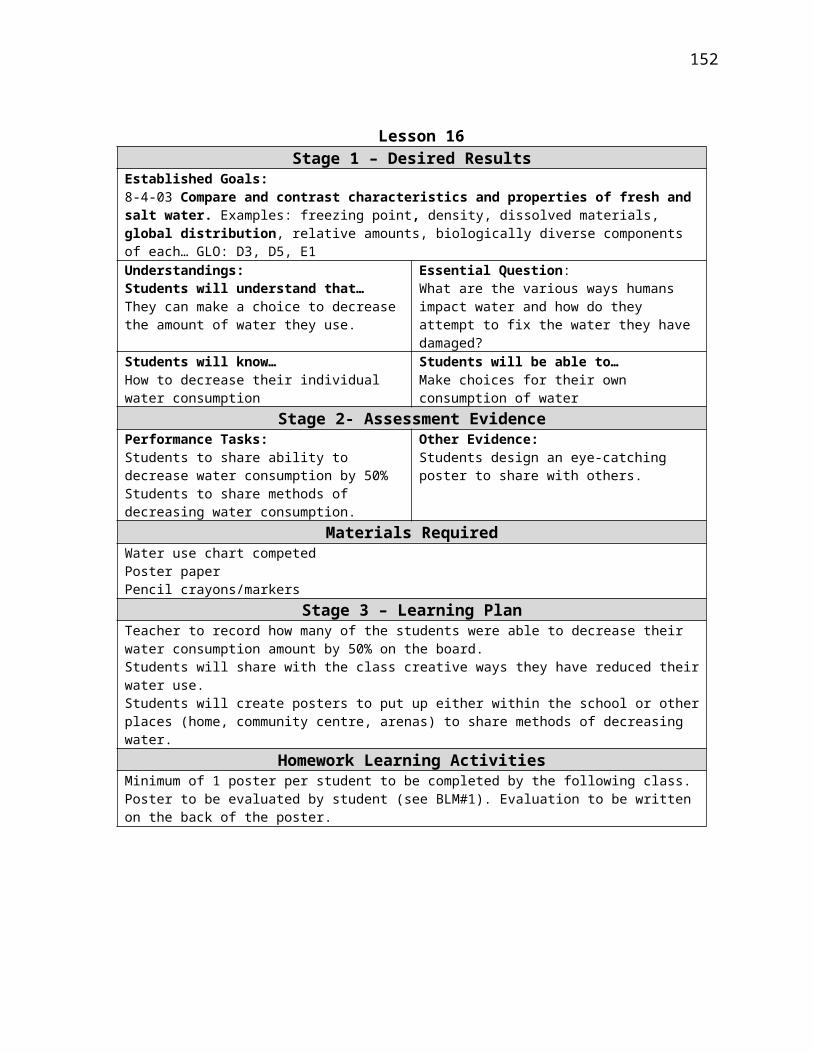
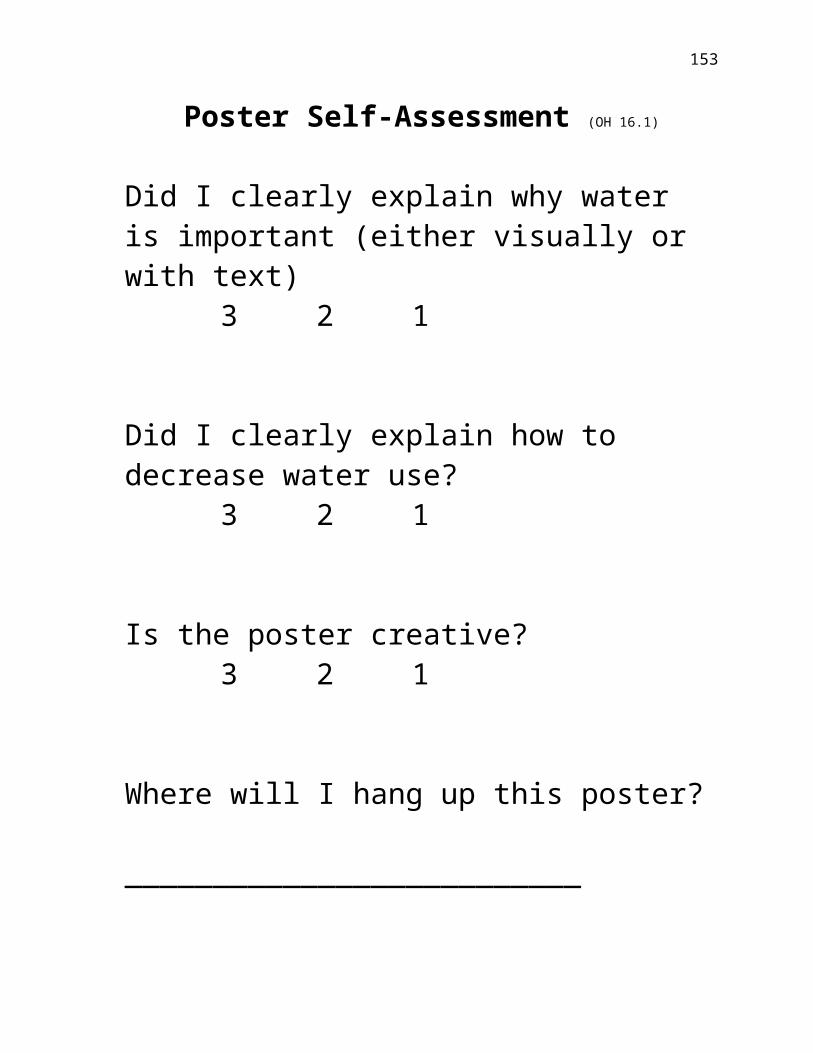

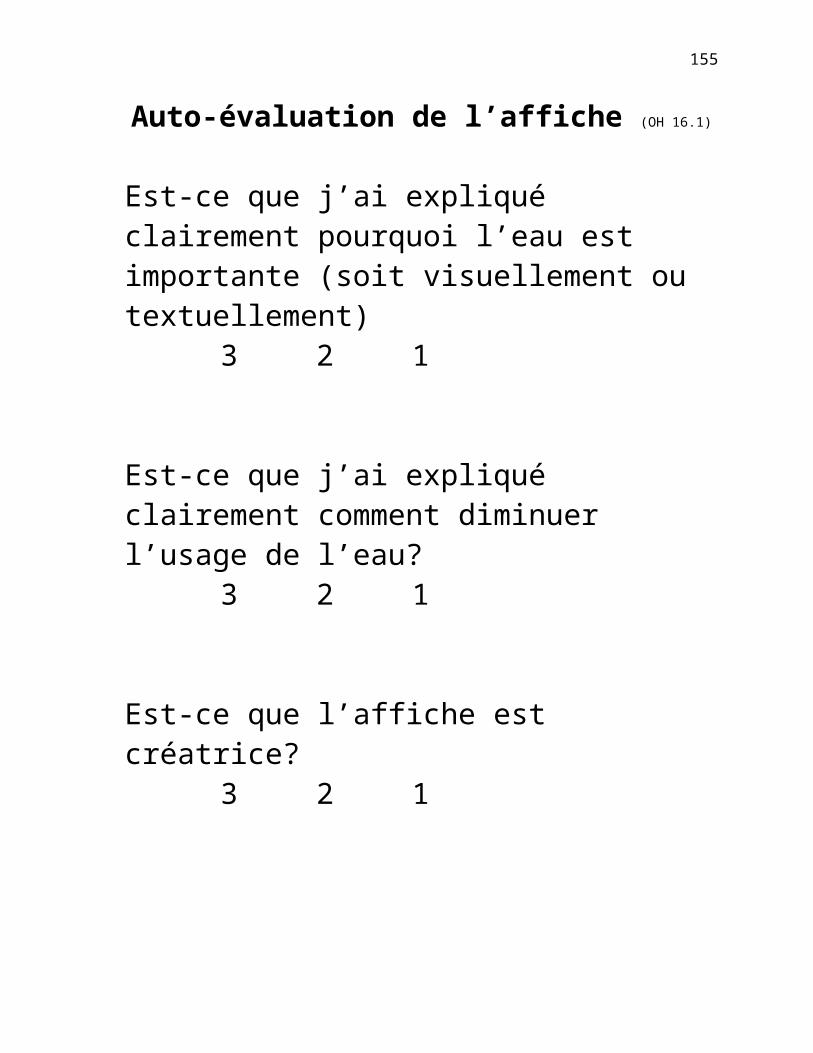
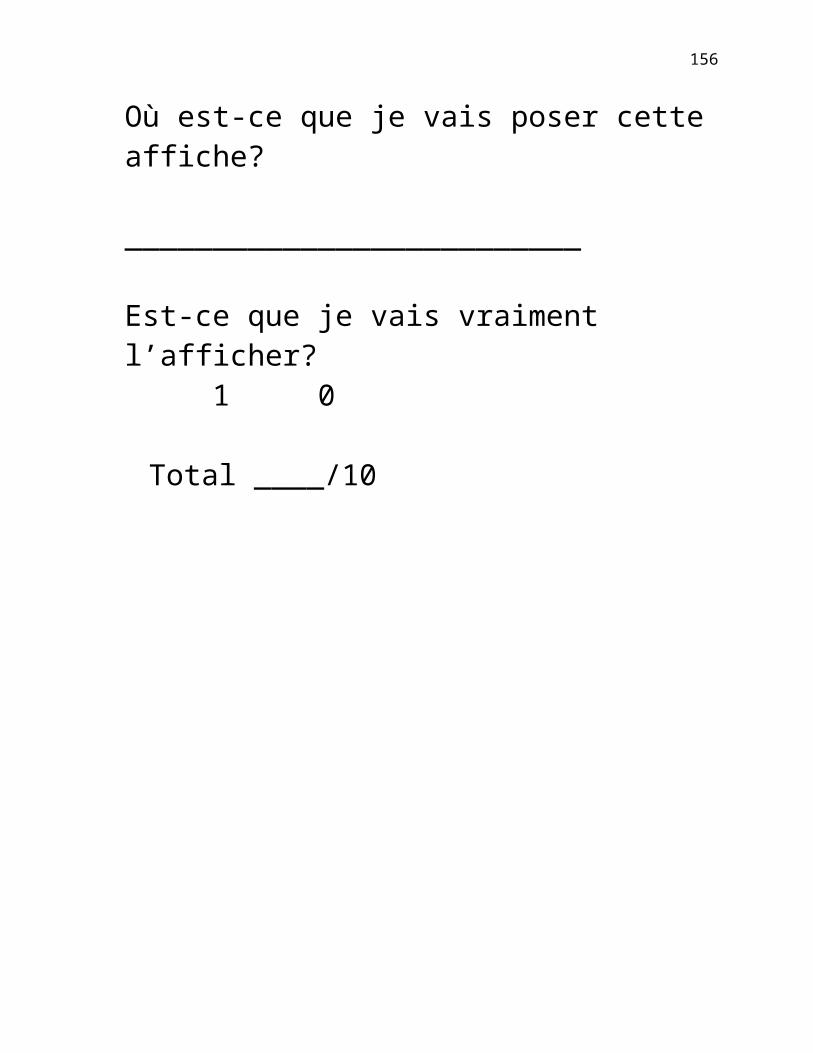
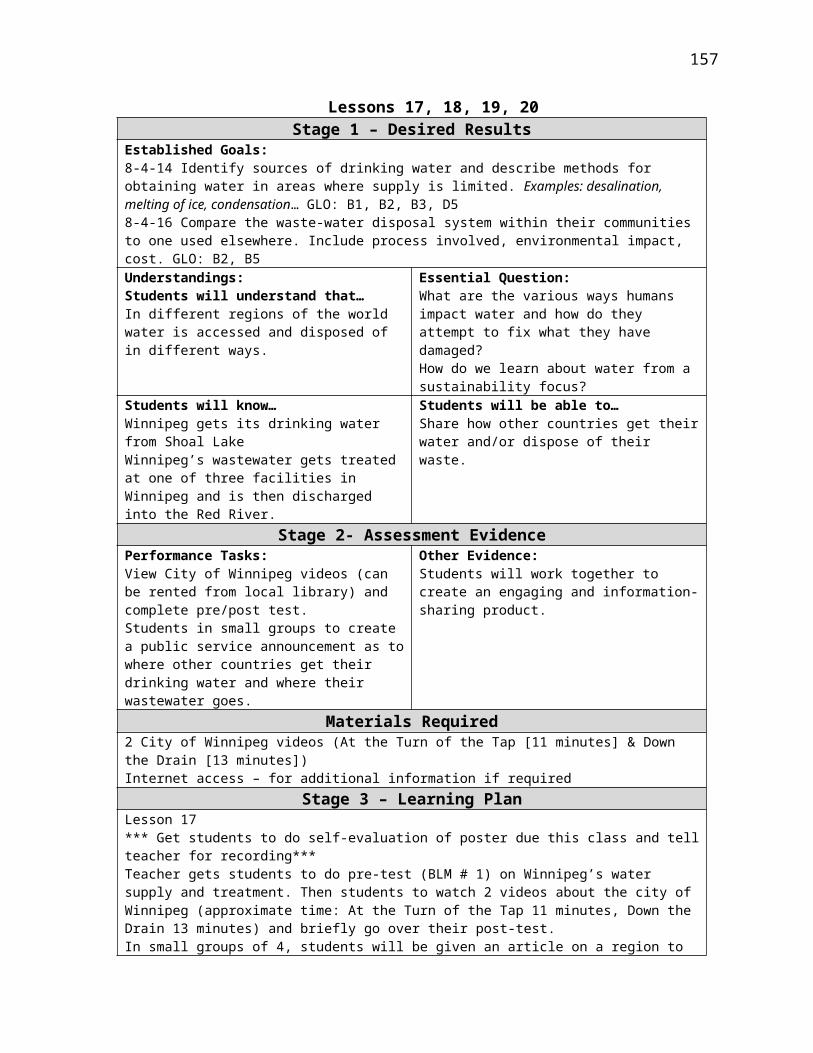
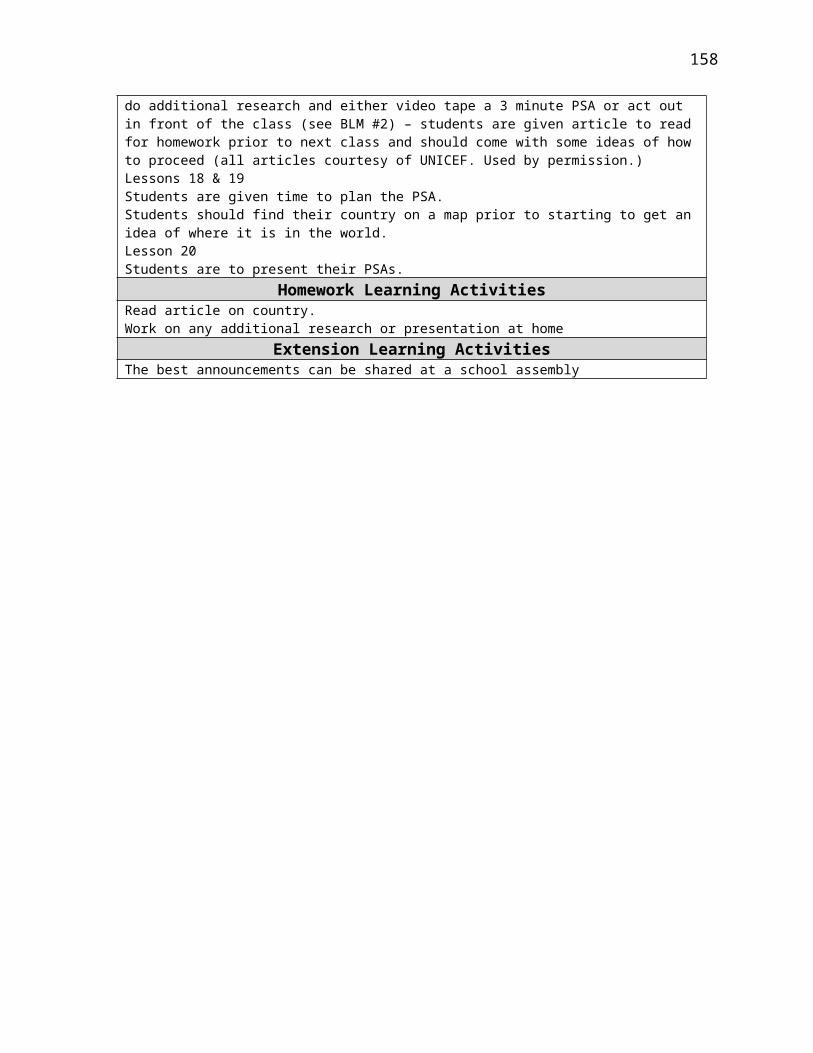


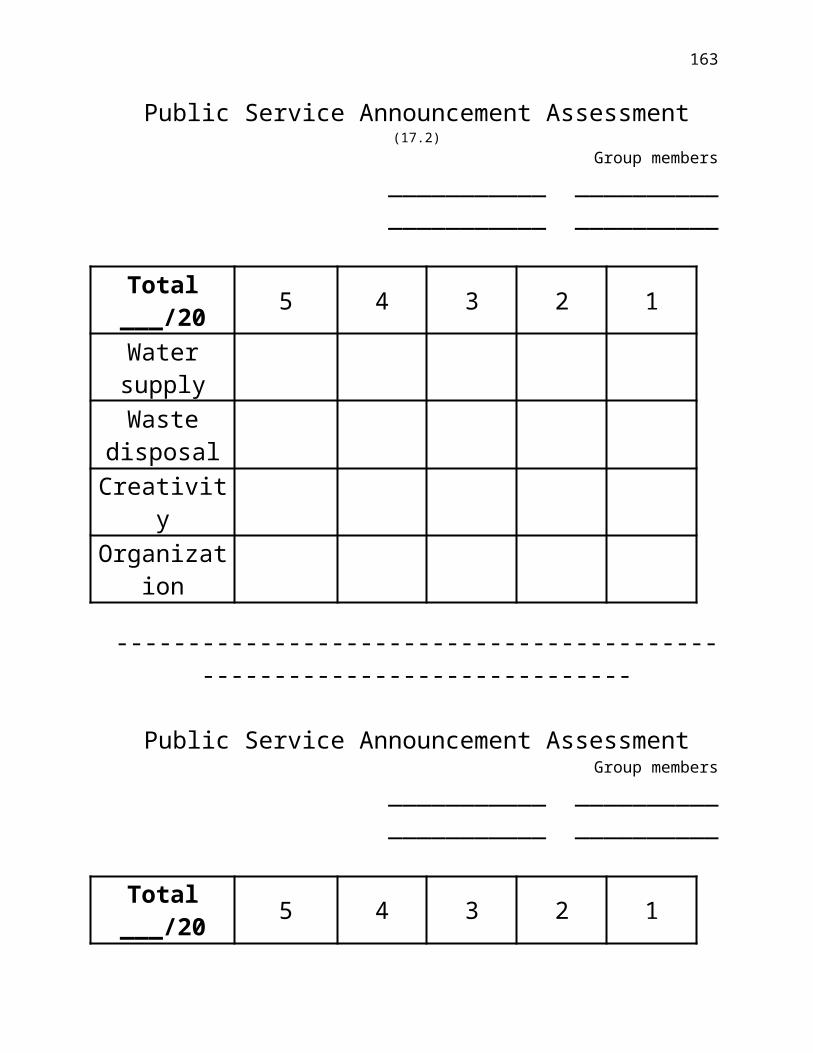
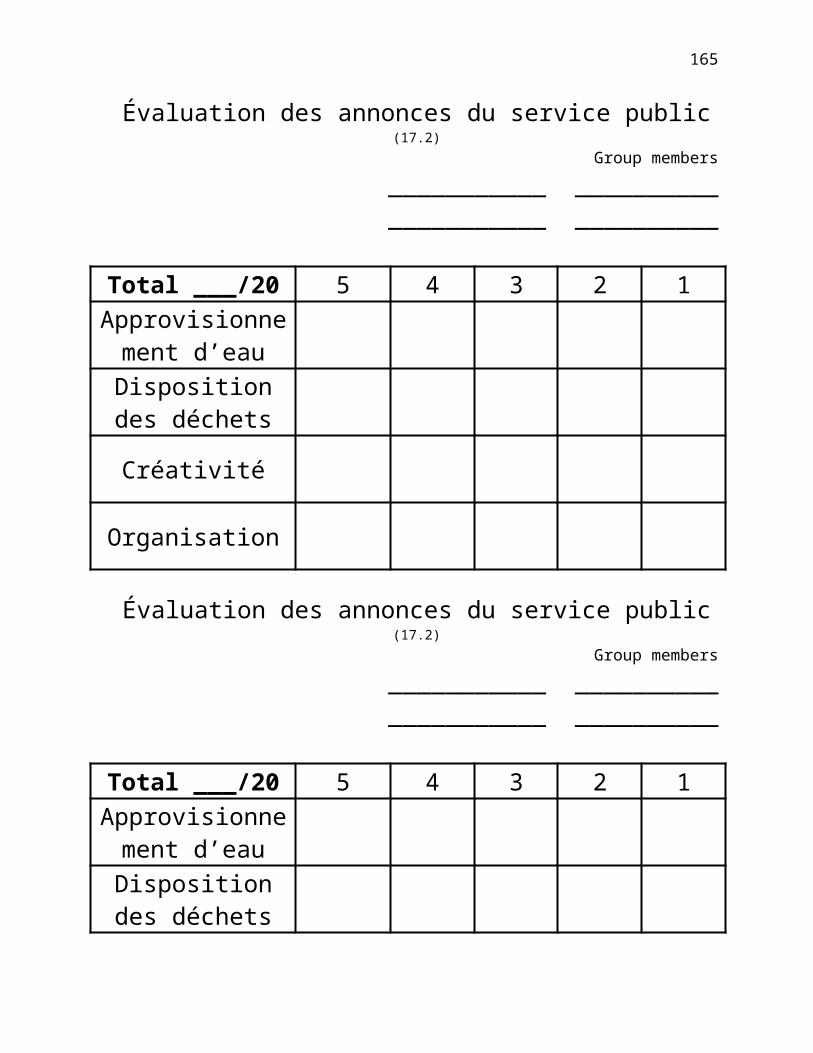


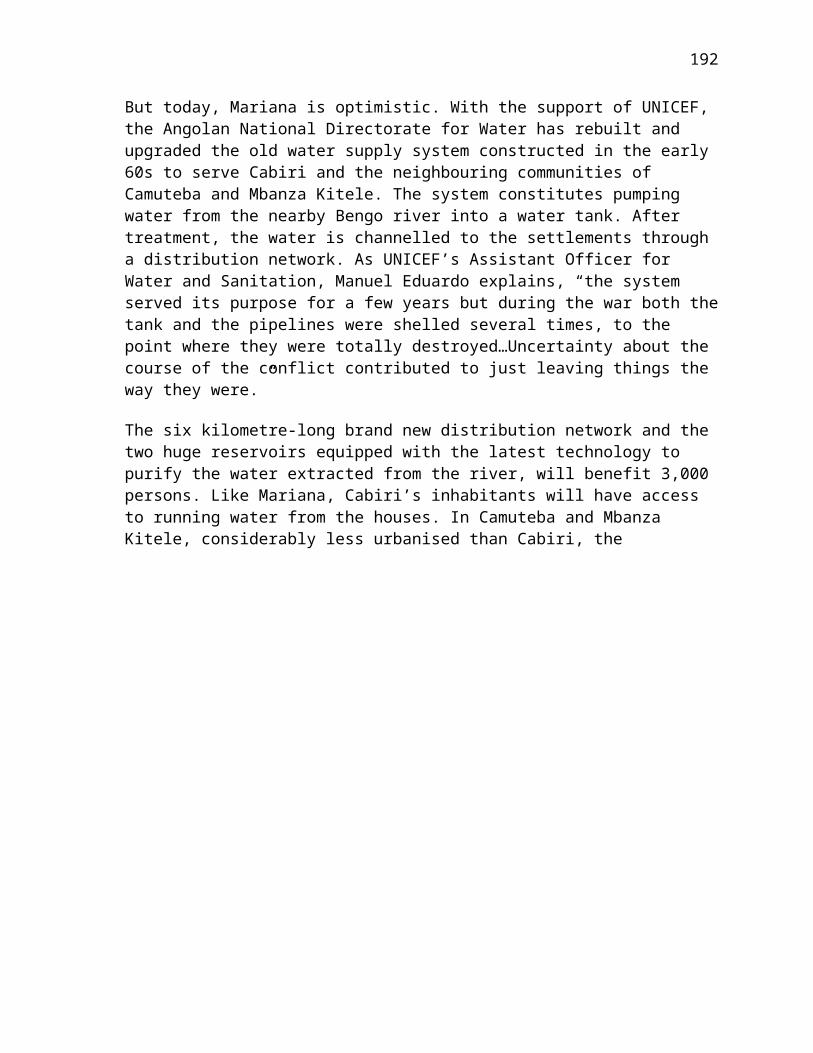
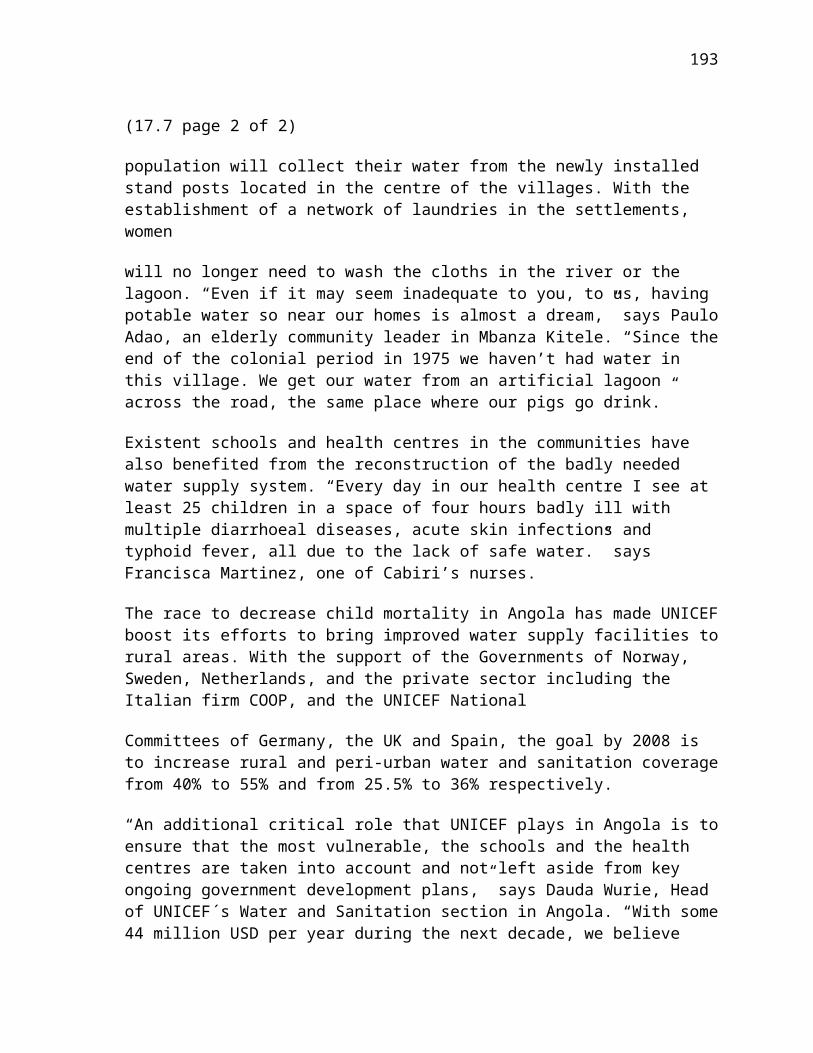


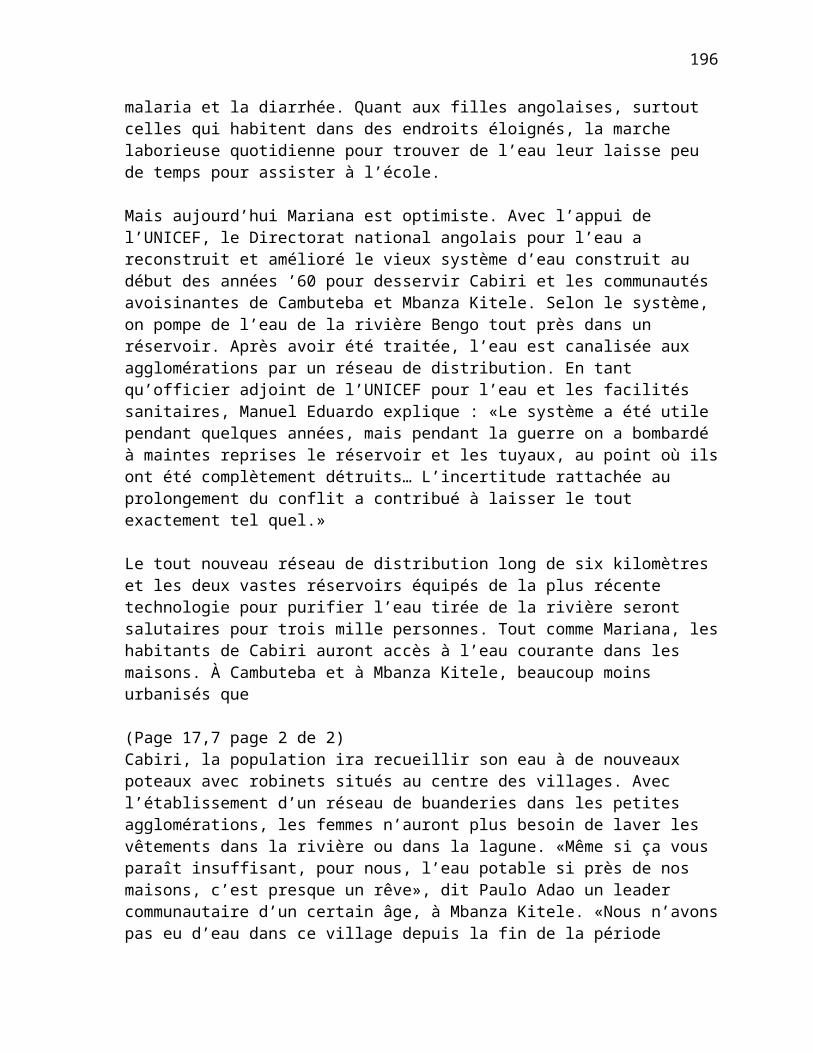

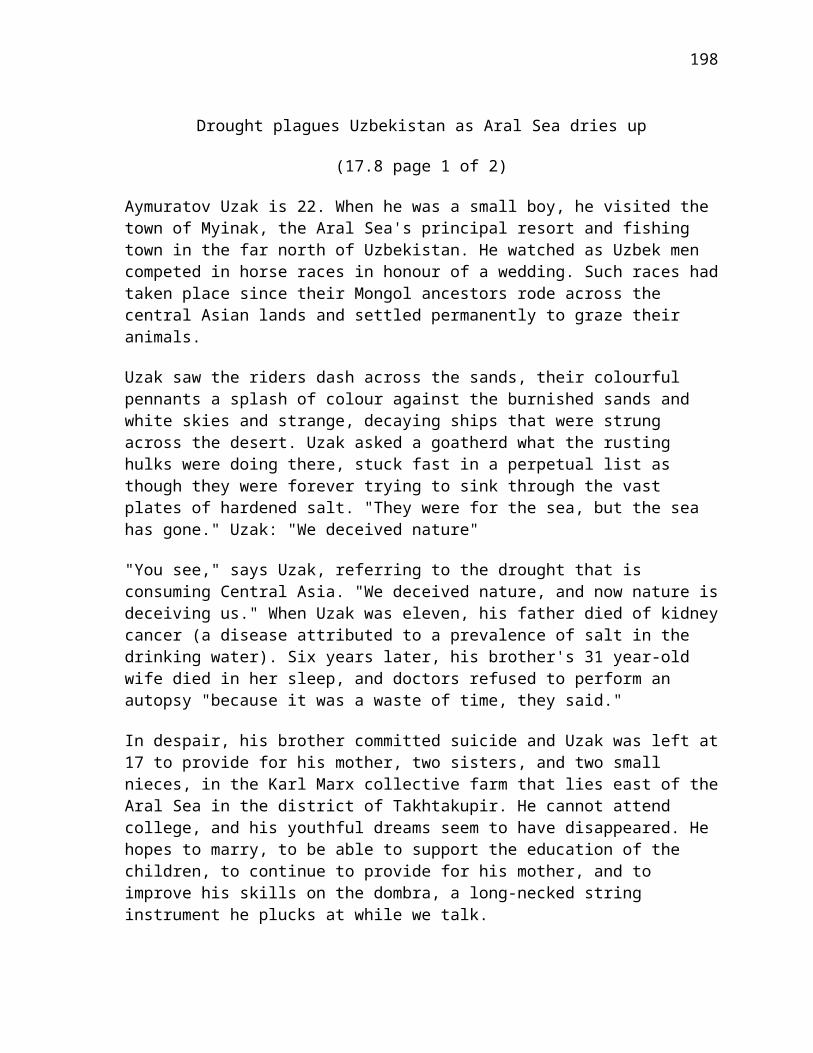

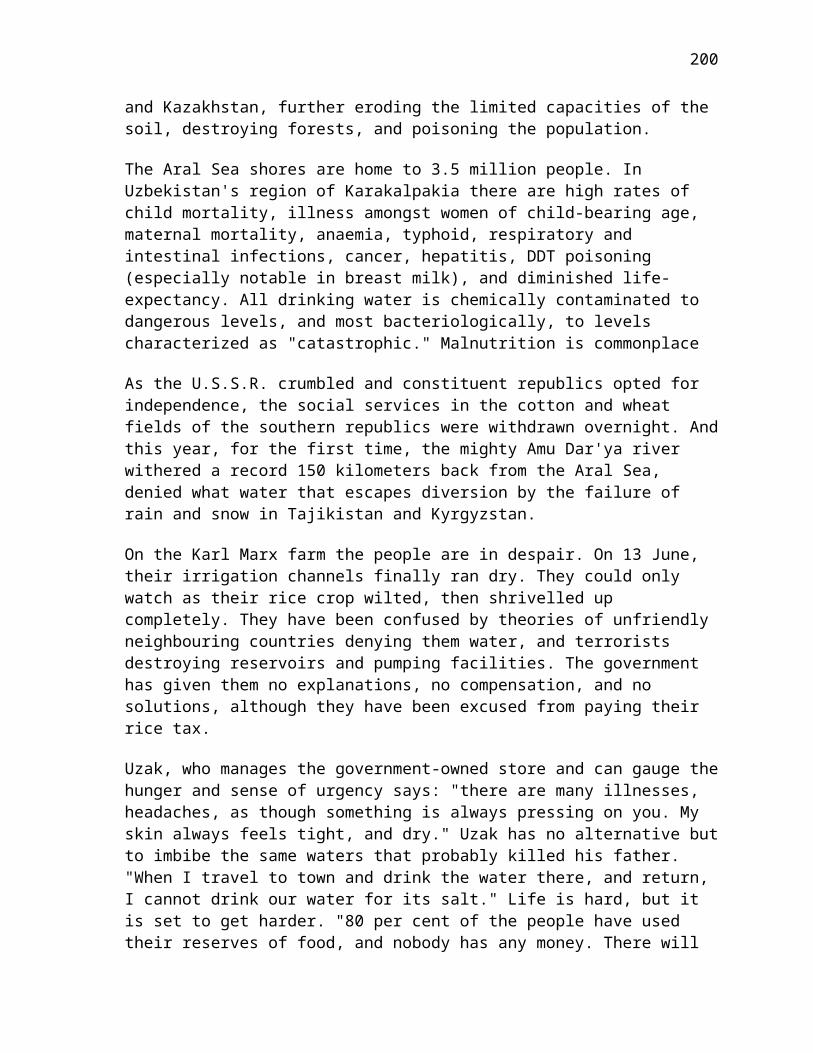


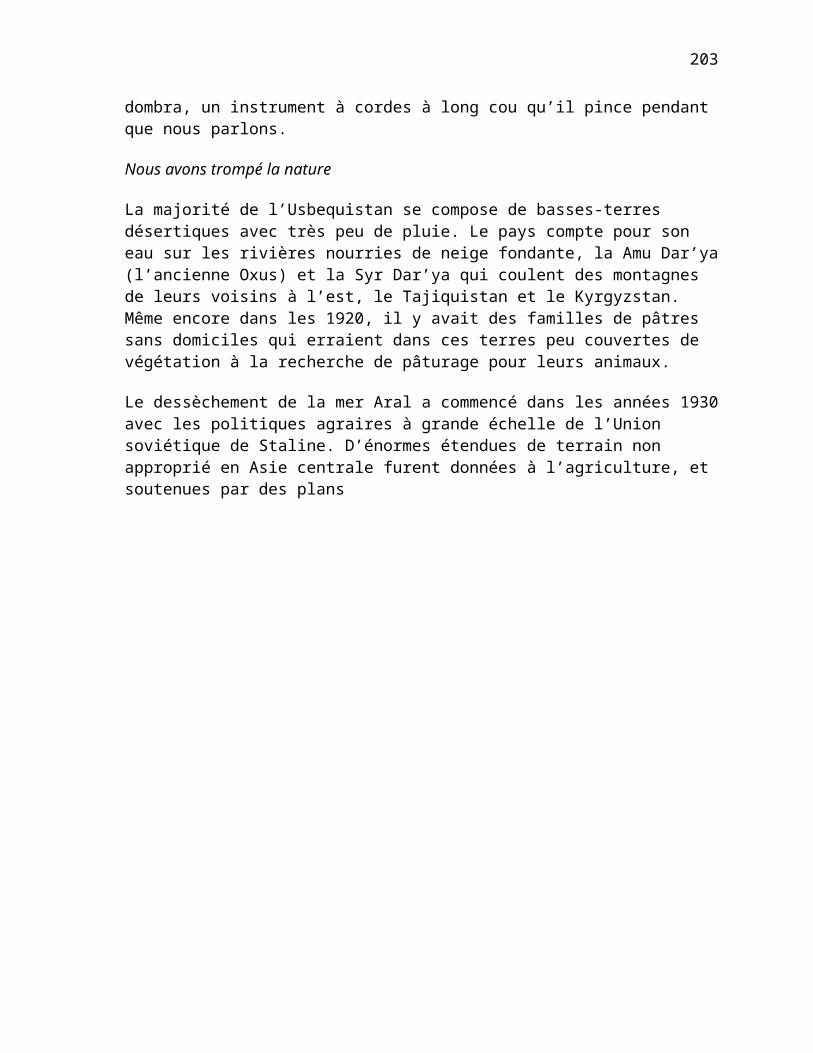
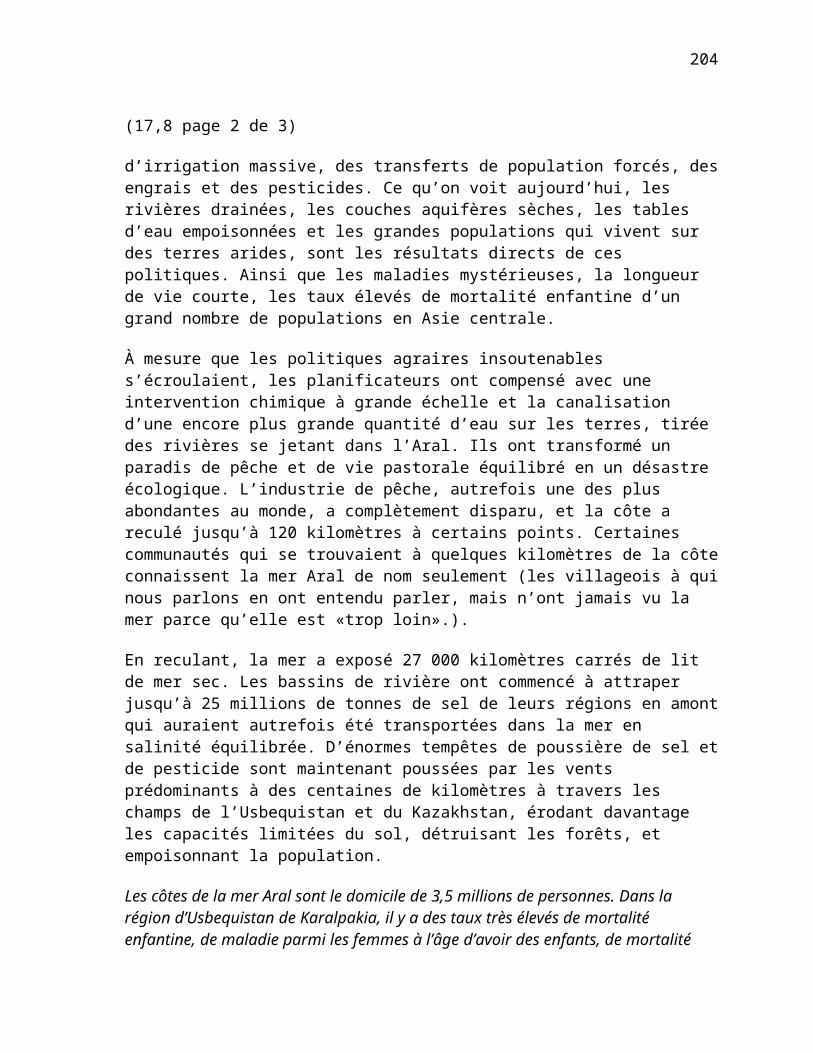
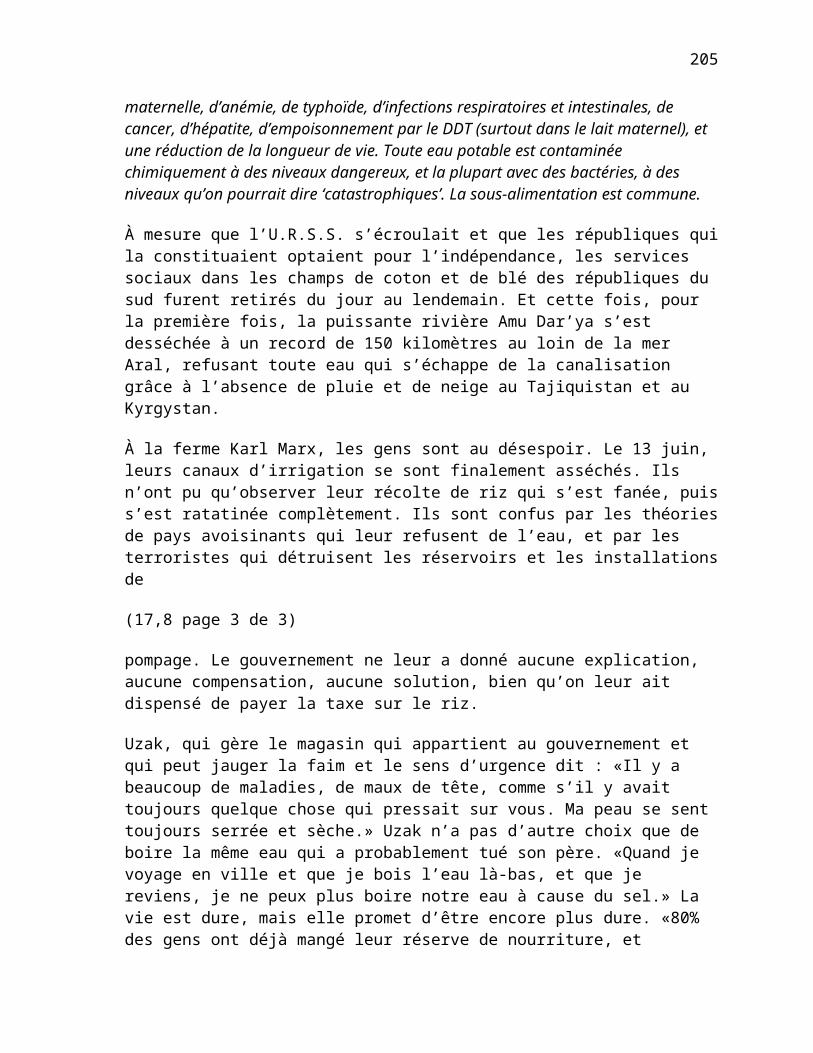


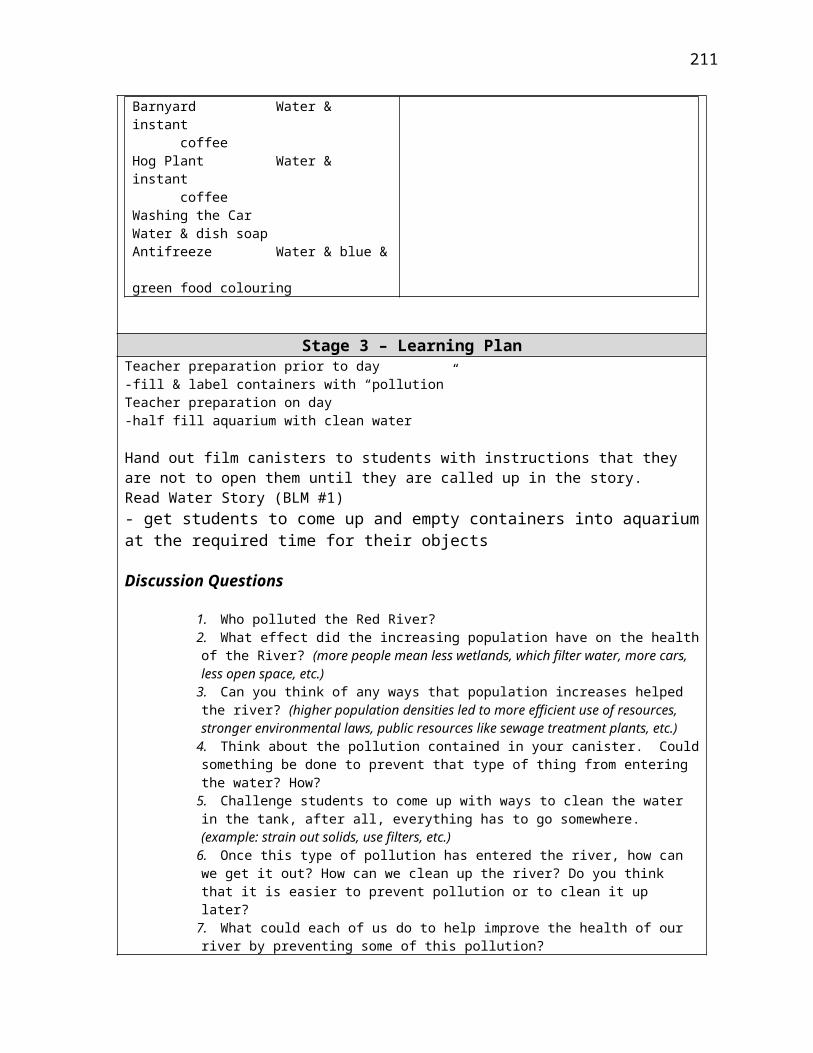


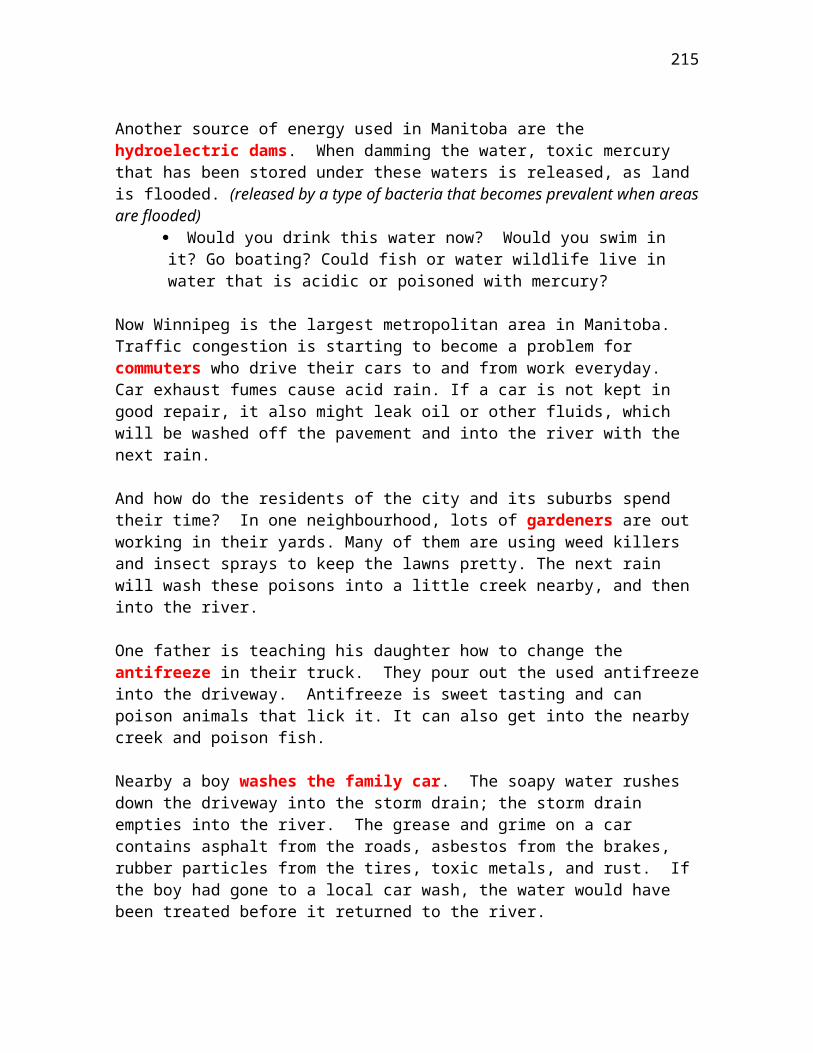


![The Physics of the Antarctic Circumpolar Currentklinck/Reprints/PDF/nowlinRevGeo1986.pdf · 2008. 2. 14. · The overall vorticity balance is still in doubt [Baker, 1982], although](https://static.documents.pub/doc/80x56/60d4663f74d5e7724678f283/the-physics-of-the-antarctic-circumpolar-klinckreprintspdfnowlinrevgeo1986pdf.jpg)


