Page 1
Feedback Report on Patient Safety Culture
Sample Medical Center
This Hospital Survey on Patient Safety™ 1.0 (HSOPS™) Feedback Report has been prepared specifically for:
Emergency Department
April 2021
REPORT DATE1/1/2021
Page 2
SURVEY DETAILSDetails about the current survey
Survey Name: Hospital Survey on Patient Safety™ 1.0 (HSOPS™)
Survey Developer: Agency for Healthcare Research and Quality (AHRQ)
The AHRQ main Compare Database for this survey includes data from 320 Facilities and 191,997 Respondents
Compare Database: 2020 AHRQ HSOPS™ 1.0 subgroup Emergency Department
Administered by: Center for Patient Safety (CPS)
Organization: Sample Medical Center
Department: Emergency Department
Historical data included: YesHistorical data is mapped from: Emergency Department
Distribution Method: Online, hyperlink distributionSurvey period: 04/01/2021 to 04/30/2021
Response Rate: 98% (54 out of 55)
YOUR NEXT STEPS
Congratulations! You've taken a great step toward improving the culture of safety at your
organization! This report reveals cultural strengths and priorities as perceived by the staff that
responded during this survey period. Culture changes can take a long time to implement, but
measuring the culture is the first step. With the survey completed, it's time to get to work. Review
the results, develop goals that align with your strategic objectives, mission and vision, and
implement action plans that will best facilitate culture change in needed areas.
Commend your staff for participating in the survey (anonymously) and thank them for their valuable feedback. STEP 1
Preview your report. Skim through the pages, looking at available benchmarks, trends, scores, etc. No matter the score, or how you compare to others, higher scoring areas are strengths that can be used to mitigate the risks associated with weaker areas.
STEP 2
Set aside time to review the report in depth. Plan at least 30 minutes of interrupted time for digesting the information, or plan for an hour if you are new to using the survey. Your employees took valuable time to respond to the survey, and now is the time for you to commit to listening to their feedback. When reviewing the information, remember to keep other measures in mind. Consider turnover rate, employee engagement scores, employee safety metrics, and other data that can fully describe the unit or organization. Identify components you want to share with staff. Identify causal factors that may have contributed to the scores. Are the causal factors organization-wide, or specific to a certain area or team?
STEP 3
Share highlights of the results with employees and ask them for feedback and ideas to improve. STEP 4
What are your next steps? Will you develop an action plan? Consider engaging a team to work on improvement initiatives. STEP 5
CENTER FOR PATIENT SAFETY | HOSPITAL SURVEY ON PATIENT SAFETY 1.0 2
Page 3
TABLE OF CONTENTSReport Components
GUIDANCE
RESOURCES
DID YOU KNOW
DASHBOARD
SAFETY GRADE & DEMOGRAPHICS
PRIORITY RANKINGS BY DIMENSION
RESULTS BY DIMENSION
PRIORITY RANKINGS BY QUESTION
PRIORITIES BY QUESTION (GRAPH)
RESULTS BY QUESTION
DETAILS BY QUESTION
COMMENTS
GUIDANCE
Consider starting at the back of the report, then work your way forward. Use the following as guidance:
While reviewing the report, look for the areas of lowest "positive score." These are areas in which staff responded mostly negative and will
require improvement planning. Also, while reviewing this report, look for the areas of highest "positive score." These are areas you will want
to celebrate. Moving scores closer to "100% positive" is always the goal.
Read the valuable feedback provided by your survey respondents. Look for themes and common concerns. Take note of any suggestions or other low-hanging fruit.
COMMENTS
Do you see some graphs with more red than others? Review the number of "neutral" responses which may lower your positive scores, but should not actually result in the question being considered negative.
DETAILS BY QUESTION
Did any questions improve over time? Any scores surprising? Any scores not surprising?RESULTS BY QUESTION
The lowest scoring questions are considered your "top priorities".PRIORITIES QUESTION
How do you score compared to others?RESULTS BY DIMENSION
Questions are rolled up into common themes, or dimensions. What trends are you seeing?PRIORITIES DIMENSION
Consider the demographic summary of those taking your survey. Were any areas represented more than others?DEMO-GRAPHICS
Use this as a snapshot to present to leaders, employees, or others as a high-level overview of your current culture's strengths and opportunities. Check out resources, made available based on your lowest scoring areas.
DASH-BOARD
CENTER FOR PATIENT SAFETY | HOSPITAL SURVEY ON PATIENT SAFETY 1.0 3
Page 4
RESOURCESResources and More Information
General Resourceshttps://forward.centerforpatientsafety.org/resources
Agency for Healthcare Research and Quality
www.ahrq.gov
Center for Patient Safetywww.centerforpatientsafety.org
DID YOU KNOW?
CENTER FOR PATIENT SAFETY
www.centerforpatientsafety.org
573.636.1014
If you have questions about this report, please contact the Center for Patient Safety.
Incomplete and Ineligible Survey DeterminationEach survey is examined for completeness and validity prior to inclusion in the final data set. Surveys are excluded if submitted blank, submitted with only background demographic questions answered, or submitted with less than 20% of the questions answered. Additionally, surveys are excluded when a respondent gives the exact same answer for all the questions in the survey (i.e. all 5's). Because the survey includes negatively worded items, respondents should use both the positive and negative ends of the response scales to provide consistent answers. If every answer is the same, the respondent did not give the survey his or her full attention and the responses are probably not valid.
Response Rate CalculationFinal response rates provided in the report are calculated following the removal of incomplete and ineligible surveys (see above) and only if original population sizes are received from organization.
Anonymity vs. IdentifiersThis survey was taken with complete anonymity. The Center for Patient Safety administered this survey and captured all responses directly from facility staff. The facility and its administrators do not have direct access to any of the individual respondent information. There were no individual respondent identification numbers or identifiers captured or associated with this survey. IP address is the only information captured by the Center for Patient Safety, however, this information is never released to the facility. Respondents were not asked to provide their name on the survey. Without tracking mechanisms, there is a small risk that an individual may have completed and returned more than one survey. The Center makes every effort to validate responses and reduce duplications or multiple entries by one individual. It is worth noting that the length of the survey, as well as reverse-worded questions, are deterrents to submitting more than one survey.
Validating and Cleaning the DataSurveys are coded automatically during the electronic submission process to reduce data entry errors. Manual data scrubbing is conducted before reports are prepared.
Frequencies of ResponsesThe two lowest response categories are combined (e.g. Strongly Disagree/Disagree or Never/Rarely) and the two highest response categories are combined (e.g. Strongly Agree/Agree or Most of the Time/Always) to make the results easier to view. "Neither" answers and missing responses are excluded from the overall percentage of positive/negative response. Negatively worded questions are reverse coded when calculating percent "positive."
CENTER FOR PATIENT SAFETY | HOSPITAL SURVEY ON PATIENT SAFETY 1.0 4
Page 5
DASHBOARDSAMPLE MEDICAL CENTER - EMERGENCY DEPARTMENTSurvey period: 04/01/2021 to 04/30/2021 2021 Responses: 54
2020 Responses: 45
2019 Responses: 40
2019 2020 ORG AHRQ AHRQ
% Pos. % Pos. % Pos. AHRQ %ile % Pos. 50th %ile 90th %ile
Average of All Twelve (12) Survey Dimensions 50.3% 73.1% 73.7% 75th 58.9% #N/A
2019 2020 ORG AHRQ AHRQ
% Pos. % Pos. % Pos. AHRQ %ile % Pos. 50th %ile 90th %ile
Handoffs & Transitions 38.6% 34.8% 46.2% 25th 50.0%
Non-punitive Response to Error 32.1% 65.9% 48.2% 50th 39.0%
Staffing 41.4% 72.9% 62.4% 75th 45.0%
OPPORTUNITIES BY QUESTION 2019 2020 ORG AHRQ AHRQ
*Staff worry that mistakes they make are kept in their personnel file. 26.3% 46.7% 15.4% 10th 31.2% 30.0% 52.0%
Staff feel free to question the decisions or actions of those with more authority. 23.1% 55.6% 24.5% <10th 39.4% 45.0% 67.0%
*Problems often occur in the exchange of information across hospital units. 27.0% 31.8% 36.0% 25th 35.4% 46.0% 73.0%
2019 2020 ORG AHRQ AHRQ
% Pos. % Pos. % Pos. AHRQ %ile % Pos. 50th %ile 90th %ile
Feedback & Communication About Error 49.6% 82.1% 89.2% 90th 63.0%
Supr/Mgr Expectations & Actions Promoting Patient Safety 66.7% 84.9% 87.4% 75th 77.0%
Management Support for Patient Safety 52.6% 83.3% 86.3% 90th 60.0%
STRENGTHS BY QUESTION 2019 2020 ORG AHRQ AHRQ
In this unit, we discuss ways to prevent errors from happening again. 65.8% 88.6% 96.0% 90th 86.2% 70.0% 90.0%
*My supv/mgr overlooks patient safety problems that happen over and over. 92.3% 95.6% 94.0% 90th 81.7% 77.0% 92.0%
Staff will freely speak up if they see something that may negatively affect patient
care.46.2% 77.8% 94.0% 90th 84.9% 74.0% 91.0%
2021OVERALL PERCENT POSITIVE (ALL DIMENSIONS)
2021
STRENGTHS BY DIMENSION
These are the dimensional areas (and specific questions) that staff have indicated as current strengths.
These are the dimensional areas (and specific questions) that staff have indicated as current weaknesses.
OPPORTUNITIES BY DIMENSION (TOP PRIORITIES)2021
2021
2021
46% 48%
62%
Handoffs & Transitions Non-punitive Response to Error Staffing
89% 87% 86%
Feedback & Communication About Error Supr/Mgr Expectations & Actions Promoting Patient Safety Management Support for Patient Safety
CENTER FOR PATIENT SAFETY | HOSPITAL SURVEY ON PATIENT SAFETY 1.0 5
Page 6
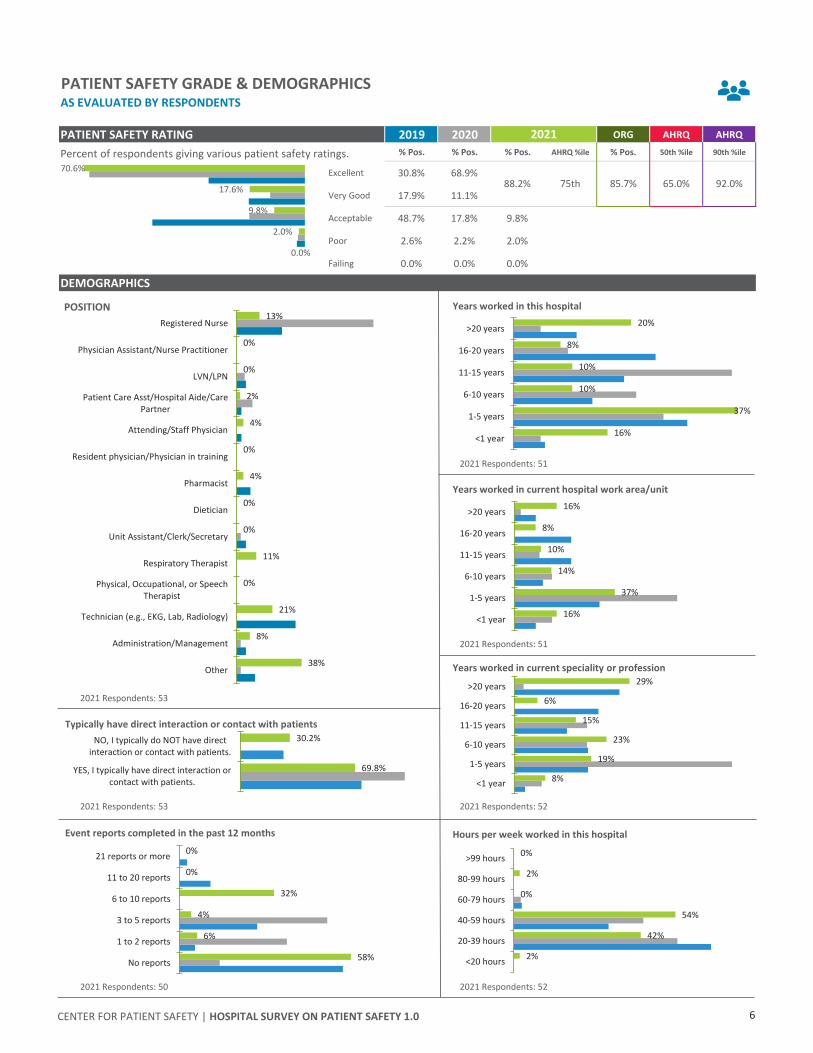
PATIENT SAFETY GRADE & DEMOGRAPHICSAS EVALUATED BY RESPONDENTS
PATIENT SAFETY RATING 2019 2020 ORG AHRQ AHRQ
% Pos. % Pos. % Pos. AHRQ %ile % Pos. 50th %ile 90th %ile
Excellent 30.8% 68.9%
Very Good 17.9% 11.1%
Acceptable 48.7% 17.8% 9.8%
Poor 2.6% 2.2% 2.0%
Failing 0.0% 0.0% 0.0%
DEMOGRAPHICS
2021 Respondents: 51
2021 Respondents: 51
2021 Respondents: 53
2021 Respondents: 53 2021 Respondents: 52
2021 Respondents: 50 2021 Respondents: 52
* *
Percent of respondents giving various patient safety ratings.
92.0%75th 65.0%
2021
85.7%88.2%
0.0%
2.0%
9.8%
17.6%
70.6%
16%
37%
10%
10%
8%
20%
<1 year
1-5 years
6-10 years
11-15 years
16-20 years
>20 years
Years worked in this hospital13%
0%
0%
2%
4%
0%
4%
0%
0%
11%
0%
21%
8%
38%
Registered Nurse
Physician Assistant/Nurse Practitioner
LVN/LPN
Patient Care Asst/Hospital Aide/CarePartner
Attending/Staff Physician
Resident physician/Physician in training
Pharmacist
Dietician
Unit Assistant/Clerk/Secretary
Respiratory Therapist
Physical, Occupational, or SpeechTherapist
Technician (e.g., EKG, Lab, Radiology)
Administration/Management
Other
POSITION
58%
6%
4%
32%
0%
0%
No reports
1 to 2 reports
3 to 5 reports
6 to 10 reports
11 to 20 reports
21 reports or more
Event reports completed in the past 12 months
16%
37%
14%
10%
8%
16%
<1 year
1-5 years
6-10 years
11-15 years
16-20 years
>20 years
Years worked in current hospital work area/unit
2%
42%
54%
0%
2%
0%
<20 hours
20-39 hours
40-59 hours
60-79 hours
80-99 hours
>99 hours
Hours per week worked in this hospital
8%
19%
23%
15%
6%
29%
<1 year
1-5 years
6-10 years
11-15 years
16-20 years
>20 years
Years worked in current speciality or profession
69.8%
30.2%
YES, I typically have direct interaction orcontact with patients.
NO, I typically do NOT have directinteraction or contact with patients.
Typically have direct interaction or contact with patients
CENTER FOR PATIENT SAFETY | HOSPITAL SURVEY ON PATIENT SAFETY 1.0 6
Page 7
PRIORITY RANKINGS FOR DIMENSIONSCURRENT RESULTS PRIORITIZED BY DIMENSION
2019 2020 ORG AHRQ AHRQ
% Pos. % Pos. % Pos. AHRQ %ile % Pos. 50th %ile 90th %ile
1st Handoffs & Transitions 38.6% 34.8% 46.2% 25th 50% 11.3%
2nd Non-punitive Response to Error 32.1% 65.9% 48.2% 50th 39% -17.7%
3rd Staffing 41.4% 72.9% 62.4% 75th 45% -10.5%
4th Communication Openness 45.3% 72.6% 65.5% 50th 61% -7.1%
5th Teamwork Across Units 41.9% 70.5% 70.5% 75th 48% 0.1%
6th Teamwork Within Units 61.3% 76.5% 74.4% 25th 81% -2.1%
7th Org Learning-Continuous Improvement 61.7% 82.2% 83.3% 90th 66% 1.1%
8th Overall Perceptions of Patient Safety 47.9% 74.4% 85.1% 90th 55% 10.7%
9th Frequency of Events Reported 64.0% 76.9% 86.0% 90th 62% 9.1%
10th Management Support for Patient Safety 52.6% 83.3% 86.3% 90th 60% 2.9%
11thSupr/Mgr Expectations & Actions Promoting
Patient Safety66.7% 84.9% 87.4% 75th 77% 2.4%
12th Feedback & Communication About Error 49.6% 82.1% 89.2% 90th 63% 7.1%
Dimensions are ranked in order of top priority. The highest ranked dimensions are also the highest scoring (% Pos.). These areas are considered
the most successful and should be celebrated. Lowest ranked questions (lowest scoring % Pos.) are noted in red and should be addressed
through action planning. Shifts in priorities over time can be expected. Note that a Percent Change of +/- 5.0% (or more) is statistically
significant.
Areas in which dimensional positive scores are greater than 80% are considered to have a consensus of excellence. The number of positive
responses for these areas represent the breadth and strength of the patient safety culture. It also reflects staff awareness and consistency in
the methods and processes for ensuring safe and high quality patient care. Areas of more than 80% positive will be highlighted below.
PERCENT
CHANGE
2021DIMENSION
46
.2%
48
.2%
62
.4%
65
.5%
70
.5%
74
.4%
83
.3%
85
.1%
86
.0%
86
.3%
87
.4%
89
.2%
Han
do
ffs
& T
ran
siti
on
s
No
n-p
un
itiv
e R
esp
on
seto
Err
or St
affi
ng
Co
mm
un
icat
ion
Op
enn
ess
Team
wo
rk A
cro
ss U
nit
s
Team
wo
rk W
ith
in U
nit
s
Org
Le
arn
ing-
Co
nti
nu
ou
sIm
pro
vem
ent
Ove
rall
Per
cep
tio
ns
of
Pat
ien
t Sa
fety
Freq
uen
cy o
f Ev
ents
Rep
ort
ed
Man
agem
ent
Sup
po
rtfo
r P
atie
nt
Safe
ty
Sup
r/M
gr E
xpec
tati
on
s&
Act
ion
s P
rom
oti
ng
Pat
ien
t Sa
fety
Feed
bac
k &
Co
mm
un
icat
ion
Ab
ou
tEr
ror
CENTER FOR PATIENT SAFETY | HOSPITAL SURVEY ON PATIENT SAFETY 1.0 7
Page 8
RESULTS BY DIMENSION-TABLECURRENT RESULTS COMPARED TO HISTORICAL
Re
spo
nse
s
Mis
sin
g
Ne
gati
ve
Ne
utr
al
Po
siti
ve
Re
spo
nse
s
Mis
sin
g
Ne
gati
ve
Ne
utr
al
Po
siti
ve
Re
spo
nse
s
Mis
sin
g
Ne
gati
ve
Ne
utr
al
Po
siti
ve
Trendline
Distribution:
Neg-Neu-Pos
6th Teamwork Within Units 40 0
31
.3%
7.5
%
61
.3%
45 0
10
.1%
13
.5%
76
.5%
53 1
7.1
%
18
.5%
74
.4%
11thSupr/Mgr Expectations & Actions Promoting Patient
Safety 39 1
14
.1%
19
.2%
66
.7%
45 0
6.1
%
9.0
%
84
.9%
50 5
5.5
%
7.1
%
87
.4%
7th Org Learning-Continuous Improvement 40 0
6.7
%
31
.7%
61
.7%
45 0
5.2
%
12
.6%
82
.2%
52 2
6.4
%
10
.3%
83
.3%
10th Management Support for Patient Safety 38 2
17
.5%
29
.8%
52
.6%
44 1
7.6
%
9.1
%
83
.3%
51 3
7.2
%
6.5
%
86
.3%
8th Overall Perceptions of Patient Safety 39 1
30
.3%
21
.8%
47
.9%
45 0
16
.7%
8.9
%
74
.4%
52 2
9.2
%
5.7
%
85
.1%
12th Feedback & Communication About Error 38 2
25
.2%
25
.1%
49
.6%
45 0
10
.4%
7.4
%
82
.1%
50 4
4.7
%
6.1
%
89
.2%
9th Frequency of Events Reported 37 3
6.3
%
29
.7%
64
.0%
45 0
3.7
%
19
.4%
76
.9%
50 4
4.0
%
10
.0%
86
.0%
4th Communication Openness 39 1
35
.9%
18
.8%
45
.3%
45 0
20
.0%
7.4
%
72
.6%
50 4
21
.7%
12
.8%
65
.5%
5th Teamwork Across Units 37 3
31
.8%
26
.4%
41
.9%
44 1
18
.8%
10
.8%
70
.5%
51 3
19
.6%
9.9
%
70
.5%
3rd Staffing 37 3
42
.1%
16
.5%
41
.4%
44 1
16
.9%
10
.2%
72
.9%
53 2
24
.7%
12
.9%
62
.4%
1st Handoffs & Transitions 35 5
16
.2%
45
.2%
38
.6%
43 2
30
.4%
34
.8%
34
.8%
50 4
21
.5%
32
.3%
46
.2%
2nd Non-punitive Response to Error 39 1
38
.2%
29
.7%
32
.1%
45 0
23
.0%
11
.1%
65
.9%
52 2
29
.4%
22
.4%
48
.2%
Positive scores closer to 100% are the desired outcome. Priority rankings are indicated before each dimension for the most recent survey
period. Dimensions that have significant increases over previous years should be assessed to identify the factors contributing to the success.
Dimensions that trend down from previous years should be evaluated for internal or external factors that may be impacting the location, unit,
or the entire organization.
Addressing more than one or two dimensions at a time can be overwhelming. Consider selecting dimensions that may have similar underlying
themes and can be addressed simultaneously. For example, the two dimensions, Feedback and Communication About Mistakes and
Organizational Learning, reflect how much the culture encourages reporting of errors in order to learn from mistakes. When selecting a
dimension(s) to build your improvement plan, consider the number of neutral responses within any dimension. Large numbers of neutral
responses can pull down the percent positive score. Neutral scores should still be addressed, but should not be considered negative indicators
of performance. Consider identifying why staff do not feel strongly one way or the other about the topic.
The number of high-scoring dimensions reflect the breadth of patient safety culture. A significant number of low-scoring dimensions may point
to inconsistent beliefs about the culture of the organization. Policies and processes regarding safe and high-quality patient care may not be
embedded in the organization.
20202019 2021
DIMENSION
CENTER FOR PATIENT SAFETY | HOSPITAL SURVEY ON PATIENT SAFETY 1.0 8
Page 9
PRIORITY RANKINGS FOR QUESTIONS, page 1 of 2CURRENT RESULTS COMPARED TO HISTORICAL
2019 2020 ORG AHRQ AHRQ
% Pos. % Pos. % Pos.AHRQ
%ile% Pos.
50th
%ile
90th
%ile
1stNon-punitive Response
to Error
*Staff worry that mistakes they make are kept in their
personnel file.26.3% 46.7% 15.4% 10th 31% 30% 52% -31.3%
2ndCommunication
Openness
Staff feel free to question the decisions or actions of those
with more authority.23.1% 55.6% 24.5% <10th 39% 45% 67% -31.1%
3rd Handoffs & Transitions*Problems often occur in the exchange of information across
hospital units.27.0% 31.8% 36.0% 25th 35% 46% 73% 4.2%
4th Handoffs & Transitions*Things "fall between the cracks" when transferring patients
from one unit to another.57.1% 43.9% 39.2% 25th 34% 43% 70% -4.7%
5th Handoffs & Transitions*Important patient care information is often lost during shift
changes.27.0% 20.5% 40.0% 10th 40% 59% 80% 19.5%
6th Teamwork Across Units*It is often unpleasant to work with staff from other hospital
units.35.1% 54.5% 45.1% 25th 56% 50% 79% -9.4%
7th Teamwork Within Units In this unit, people treat each other with respect. 50.0% 61.4% 47.2% <10th 76% 79% 100% -14.2%
8th Staffing*We work in "crisis mode" trying to do too much, too
quickly.35.9% 68.9% 50.0% 75th 45% 34% 67% -18.9%
9th Staffing We have enough staff to handle the workload. 32.5% 75.6% 50.9% 50th 45% 37% 70% -24.6%
10thNon-punitive Response
to Error
*When an event is reported, it feels like the person is being
written up, not the problem.20.0% 73.3% 55.8% 75th 51% 40% 62% -17.6%
11th Teamwork Within Units When one area in this unit gets really busy, others help out. 50.0% 62.2% 67.3% 25th 73% 70% 89% 5.1%
12th Teamwork Across Units *Hospital units do not coordinate well with each other. 32.4% 63.6% 68.6% 90th 53% 34% 67% 5.0%
13th Handoffs & Transitions *Shift changes are problematic for patients in this hospital. 43.2% 43.2% 69.4% 75th 51% 49% 75% 26.2%
14th Staffing*We use more agency/temporary staff than is best for
patient care.60.5% 73.3% 71.7% 50th 58% 63% 87% -1.6%
15thNon-punitive Response
to Error*Staff feel like their mistakes are held against them. 50.0% 77.8% 73.6% 90th 59% 44% 70% -4.2%
16thOrg Learning-Continuous
ImprovementMistakes have led to positive changes here. 42.5% 80.0% 75.0% 90th 69% 57% 73% -5.0%
17th Staffing*Staff in this unit work longer hours than is best for patient
care.36.7% 73.8% 76.9% 90th 51% 46% 68% 3.1%
18thCommunication
Openness
*Staff are afraid to ask questions when something does not
seem right.66.7% 84.4% 78.0% 75th 74% 64% 88% -6.4%
19th
Suprvsr/Manager
Expectations & Actions
Promoting Patient Safety
My supv/mgr says a good word when he/she sees a job done
according to established patient safety procedures.51.3% 77.8% 82.0% 50th 82% 76% 95% 4.2%
2021
Questions are ranked in order of top priority. The highest ranked questions are also the highest scoring (% Pos.). These areas are considered the
most successful and should be celebrated. Lowest ranked questions (lowest scoring % Pos.) are noted in red and should be addressed through
action planning. Shifts in priorities over time can be expected. Note that a Percent Change of +/- 5.0% (or more) is statistically significant.
Areas in which dimensional positive scores are greater than 80% are considered to have a consensus of excellence. The number of positive
responses for these areas represent the breadth and strength of the patient safety culture. It reflects staff awareness and consistency in the
methods and processes for ensuring safe and high-quality patient care. Areas of more than 80% positive will be highlighted below. *Question is
reverse-worded.
QUESTIONPERCENT
CHANGEDIMENSION
CENTER FOR PATIENT SAFETY | HOSPITAL SURVEY ON PATIENT SAFETY 1.0 9
Page 10
2019 2020 ORG AHRQ AHRQ
% Pos. % Pos. % Pos.AHRQ
%ile% Pos.
50th
%ile
90th
%ile
2021QUESTION
PERCENT
CHANGEDIMENSION
20thMgmt Support for
Patient Safety
*Hospital mgmt seems interested in patient safety only after
an adverse event happens.36.8% 75.0% 82.4% 90th 58% 46% 70% 7.4%
21stOverall Perceptions of
Patient Safety*We have patient safety problems in this unit. 39.5% 80.0% 82.7% 90th 71% 50% 77% 2.7%
22ndFeedback & Commun.
About Error
We are given feedback about changes put into place based
on event reports.41.0% 77.8% 83.7% 90th 66% 56% 78% 5.9%
23rdFrequency of Events
Reported
When a mistake is made, but is caught and corrected before
affecting the patient, how often is this reported?43.2% 68.9% 84.0% 90th 73% 56% 76% 15.1%
24th Teamwork Across UnitsHospital units work well together to provide the best care
for patients.64.9% 90.9% 84.0% 75th 74% 59% 88% -6.9%
25th Teamwork Across UnitsThere is good cooperation among hospital units that need to
work together.35.1% 72.7% 84.3% 90th 67% 47% 79% 11.6%
26thOverall Perceptions of
Patient Safety
Our procedures and systems are good at preventing errors
from happening.75.0% 86.7% 84.9% 75th 81% 67% 87% -1.8%
27th
Suprvsr/Manager
Expectations & Actions
Promoting Patient Safety
*Whenever pressure builds up, my supv/mgr wants us to
work faster, even if it means taking shortcuts.51.3% 80.0% 85.4% 50th 79% 75% 95% 5.4%
28thFrequency of Events
Reported
When a mistake is made, but has no potential to harm the
patient, how often is this reported?73.0% 80.0% 86.0% 90th 73% 58% 76% 6.0%
29thOverall Perceptions of
Patient Safety
*It is just by chance that more serious mistakes don't
happen around here.35.0% 71.1% 86.3% 90th 67% 51% 77% 15.2%
30thMgmt Support for
Patient Safety
Hospital mgmt provides a work climate that promotes
patient safety.73.7% 90.9% 86.3% 75th 81% 71% 92% -4.6%
31stOverall Perceptions of
Patient SafetyPatient safety is never sacrificed to get more work done. 42.1% 60.0% 86.5% 90th 67% 50% 74% 26.5%
32ndOrg Learning-Continuous
Improvement
After we make changes to improve patient safety, we
evaluate their effectiveness.67.5% 82.2% 86.5% 90th 73% 63% 83% 4.3%
33rdFrequency of Events
Reported
When a mistake is made that could harm the patient, but
does not, how often is this reported?75.7% 81.8% 88.0% 75th 80% 71% 89% 6.2%
34th
Suprvsr/Manager
Expectations & Actions
Promoting Patient Safety
My supv/mgr seriously considers staff suggestions for
improving patient safety.71.8% 86.4% 88.0% 75th 83% 77% 96% 1.6%
35thFeedback & Commun.
About ErrorWe are informed about errors that happen in this unit. 42.1% 80.0% 88.0% 90th 80% 64% 79% 8.0%
36thOrg Learning-Continuous
ImprovementWe are actively doing things to improve patient safety. 75.0% 84.4% 88.5% 75th 83% 77% 93% 4.0%
37thMgmt Support for
Patient Safety
The actions of hospital mgmt show that patient safety is a
top priority.47.4% 84.1% 90.2% 90th 77% 64% 88% 6.1%
38th Teamwork Within UnitsWhen a lot of work needs to be done quickly, we work
together as a team to get the work done.72.5% 88.9% 90.6% 50th 92% 88% 100% 1.7%
39th Teamwork Within Units People support one another in this unit. 72.5% 93.3% 92.5% 50th 89% 87% 100% -0.9%
40thCommunication
Openness
Staff will freely speak up if they see something that may
negatively affect patient care.46.2% 77.8% 94.0% 90th 85% 74% 91% 16.2%
41st
Suprvsr/Manager
Expectations & Actions
Promoting Patient Safety
*My supv/mgr overlooks patient safety problems that
happen over and over.92.3% 95.6% 94.0% 90th 82% 77% 92% -1.6%
42ndFeedback & Commun.
About Error
In this unit, we discuss ways to prevent errors from
happening again.65.8% 88.6% 96.0% 90th 86% 70% 90% 7.4%
CENTER FOR PATIENT SAFETY | HOSPITAL SURVEY ON PATIENT SAFETY 1.0 10
Page 11
RESULTS BY QUESTION-GRAPHCURRENT RESULTS GRAPHED IN ORDER OF PRIORITY
52
%
67
%
73
%
70
%
80
%
79
%
10
0%
67
%
70
%
62
%
89
%
67
%
75
%
87
%
70
%
73
%
68
%
88
%
95
%
70
%
77
%
78
%
76
%
88
%
79
%
87
%
95
%
76
%
77
%
92
%
74
%
83
%
89
%
96
%
79
%
93
%
88
%
10
0%
10
0%
91
%
92
%
90
%
30
%
45
%
46
%
43
%
59
%
50
%
79
%
34
%
37
%
40
%
70
%
34
%
49
%
63
%
44
%
57
%
46
%
64
%
76
%
46
%
50
%
56
%5
6%
59
%
47
%
67
%
75
%
58
%
51
%
71
%
50
%
63
%
71
%
77
%
64
%
77
%
64
%
88
%
87
%
74
%
77
%
70
%
15.4%
24.5%
36.0%
39.2%
40.0%
45.1%
47.2%
50.0%
50.9%
55.8%
67.3%
68.6%
69.4%
71.7%
73.6%
75.0%
76.9%
78.0%
82.0%
82.4%
82.7%
83.7%
84.0%
84.0%
84.3%
84.9%
85.4%
86.0%
86.3%
86.3%
86.5%
86.5%
88.0%
88.0%
88.0%
88.5%
90.2%
90.6%
92.5%
94.0%
94.0%
96.0%
0% 10% 20% 30% 40% 50% 60% 70% 80% 90% 100%
*Staff worry that mistakes they make are kept in their personnel file.
Staff feel free to question the decisions or actions of those with more authority.
*Problems often occur in the exchange of information across hospital units.
*Things "fall between the cracks" when transferring patients from one unit to…
*Important patient care information is often lost during shift changes.
*It is often unpleasant to work with staff from other hospital units.
In this unit, people treat each other with respect.
*We work in "crisis mode" trying to do too much, too quickly.
We have enough staff to handle the workload.
*When an event is reported, it feels like the person is being written up, not the…
When one area in this unit gets really busy, others help out.
*Hospital units do not coordinate well with each other.
*Shift changes are problematic for patients in this hospital.
*We use more agency/temporary staff than is best for patient care.
*Staff feel like their mistakes are held against them.
Mistakes have led to positive changes here.
*Staff in this unit work longer hours than is best for patient care.
*Staff are afraid to ask questions when something does not seem right.
My supv/mgr says a good word when he/she sees a job done according to…
*Hospital mgmt seems interested in patient safety only after an adverse event…
*We have patient safety problems in this unit.
We are given feedback about changes put into place based on event reports.
When a mistake is made, but is caught and corrected before affecting the patient,…
Hospital units work well together to provide the best care for patients.
There is good cooperation among hospital units that need to work together.
Our procedures and systems are good at preventing errors from happening.
*Whenever pressure builds up, my supv/mgr wants us to work faster, even if it…
When a mistake is made, but has no potential to harm the patient, how often is…
*It is just by chance that more serious mistakes don't happen around here.
Hospital mgmt provides a work climate that promotes patient safety.
Patient safety is never sacrificed to get more work done.
After we make changes to improve patient safety, we evaluate their effectiveness.
When a mistake is made that could harm the patient, but does not, how often is…
My supv/mgr seriously considers staff suggestions for improving patient safety.
We are informed about errors that happen in this unit.
We are actively doing things to improve patient safety.
The actions of hospital mgmt show that patient safety is a top priority.
When a lot of work needs to be done quickly, we work together as a team to get…
People support one another in this unit.
Staff will freely speak up if they see something that may negatively affect patient…
*My supv/mgr overlooks patient safety problems that happen over and over.
In this unit, we discuss ways to prevent errors from happening again.
AHRQ 50th %ile AHRQ 90th %ile ORG Emergency Department
CENTER FOR PATIENT SAFETY | HOSPITAL SURVEY ON PATIENT SAFETY 1.0 11
Page 12
RESULTS BY QUESTION-TABLE, page 1 of 2CURRENT RESULTS BY QUESTION
Res
po
nse
s
Mis
sin
g
Neg
ativ
e
Neu
tral
Po
siti
ve
Res
po
nse
s
Mis
sin
g
Neg
ativ
e
Neu
tral
Po
siti
ve
Res
po
nse
s
Mis
sin
g
Neg
ativ
e
Neu
tral
Po
siti
ve
Trendline
39th People support one another in this unit. 40 0
27
.5%
0.0
%
72
.5%
45 0
6.7
%
0.0
%
93
.3%
53 1
3.8
%
3.8
%
92
.5%
38thWhen a lot of work needs to be done quickly, we work together as
a team to get the work done.
40 0
25
.0%
2.5
%
72
.5%
45 0
6.7
%
4.4
%
88
.9%
53 1
5.7
%
3.8
%
90
.6%
7th In this unit, people treat each other with respect. 40 0
45
.0%
5.0
%
50
.0%
44 1
15
.9%
22
.7%
61
.4%
53 1
9.4
%
43
.4%
47
.2%
11th When one area in this unit gets really busy, others help out. 40 0
27
.5%
22
.5%
50
.0%
45 0
11
.1%
26
.7%
62
.2%
52 2
9.6
%
23
.1%
67
.3%
19thMy supv/mgr says a good word when he/she sees a job done
according to established patient safety procedures.
39 1
25
.6%
23
.1%
51
.3%
45 0
11
.1%
11
.1%
77
.8%
50 4
12
.0%
6.0
%
82
.0%
34thMy supv/mgr seriously considers staff suggestions for improving
patient safety.
39 1
2.6
%
25
.6%
71
.8%
44 1
2.3
%
11
.4%
86
.4%
50 4
8.0
%
4.0
%
88
.0%
27th*Whenever pressure builds up, my supv/mgr wants us to work
faster, even if it means taking shortcuts.3
9 1
23
.1%
25
.6%
51
.3%
45 0
8.9
%
11
.1%
80
.0%
48 6
0.0
%
14
.6%
85
.4%
41st*My supv/mgr overlooks patient safety problems that happen
over and over.
39 1
5.1
%
2.6
%
92
.3%
45 0
2.2
%
2.2
%
95
.6%
50 4
2.0
%
4.0
%
94
.0%
36th We are actively doing things to improve patient safety. 40 0
0.0
%
25
.0%
75
.0%
45 0
4.4
%
11
.1%
84
.4%
52 2
3.8
%
7.7
%
88
.5%
16th Mistakes have led to positive changes here. 40 0
20
.0%
37
.5%
42
.5%
45 0
8.9
%
11
.1%
80
.0%
52 2
9.6
%
15
.4%
75
.0%
32ndAfter we make changes to improve patient safety, we evaluate
their effectiveness.
40 0
0.0
%
32
.5%
67
.5%
45 0
2.2
%
15
.6%
82
.2%
52 2
5.8
%
7.7
%
86
.5%
30thHospital mgmt provides a work climate that promotes patient
safety.
38 2
23
.7%
2.6
%
73
.7%
44 1
6.8
%
2.3
%
90
.9%
51 3
7.8
%
5.9
%
86
.3%
37thThe actions of hospital mgmt show that patient safety is a top
priority.
38 2
0.0
%
52
.6%
47
.4%
44 1
2.3
%
13
.6%
84
.1%
51 3
2.0
%
7.8
%
90
.2%
20th*Hospital mgmt seems interested in patient safety only after an
adverse event happens.
38 2
28
.9%
34
.2%
36
.8%
44 1
13
.6%
11
.4%
75
.0%
51 3
11
.8%
5.9
%
82
.4%
29th*It is just by chance that more serious mistakes don't happen
around here.
40 0
25
.0%
40
.0%
35
.0%
45 0
17
.8%
11
.1%
71
.1%
51 3
11
.8%
2.0
%
86
.3%
31st Patient safety is never sacrificed to get more work done. 38 2
50
.0%
7.9
%
42
.1%
45 0
33
.3%
6.7
%
60
.0%
52 2
9.6
%
3.8
%
86
.5%
21st *We have patient safety problems in this unit. 38 2
26
.3%
34
.2%
39
.5%
45 0
8.9
%
11
.1%
80
.0%
52 2
7.7
%
9.6
%
82
.7%
26thOur procedures and systems are good at preventing errors from
happening.
40 0
20
.0%
5.0
%
75
.0%
45 0
6.7
%
6.7
%
86
.7%
53 1
7.5
%
7.5
%
84
.9%
22ndWe are given feedback about changes put into place based on
event reports.
39 1
23
.1%
35
.9%
41
.0%
45 0
13
.3%
8.9
%
77
.8%
49 5
8.2
%
8.2
%
83
.7%
35th We are informed about errors that happen in this unit. 38 2
23
.7%
34
.2%
42
.1%
45 0
8.9
%
11
.1%
80
.0%
50 4
6.0
%
6.0
%
88
.0%
42ndIn this unit, we discuss ways to prevent errors from happening
again.
38 2
28
.9%
5.3
%
65
.8%
44 1
9.1
%
2.3
%
88
.6%
50 4
0.0
%
4.0
%
96
.0%
Team
wo
rk W
ith
in U
nit
sSu
pr/
Mgr
Exp
ecta
tio
ns
& A
ctio
ns
Pro
mo
tin
g P
atie
nt
Safe
ty
Org
Lea
rnin
g-C
on
tin
uo
us
Imp
rove
men
t
Man
agem
ent
Sup
po
rt f
or
Pat
ien
t Sa
fety
Ove
rall
Per
cep
tio
ns
of
Pat
ien
t Sa
fety
Feed
bac
k &
Co
mm
un
icat
ion
Ab
ou
t Er
ror
2020Positive scores closer to 100% are the desired outcome. Priority rankings
are indicated before each question for the most recent survey period.
*Question is reverse-worded
2019 2021
CENTER FOR PATIENT SAFETY | HOSPITAL SURVEY ON PATIENT SAFETY 1.0 12
Page 13
RESULTS BY QUESTION-TABLE, page 2 of 2CURRENT RESULTS BY QUESTION
Res
po
nse
s
Mis
sin
g
Neg
ativ
e
Neu
tral
Po
siti
ve
Res
po
nse
s
Mis
sin
g
Neg
ativ
e
Neu
tral
Po
siti
ve
Res
po
nse
s
Mis
sin
g
Neg
ativ
e
Neu
tral
Po
siti
ve
Trendline
23rdWhen a mistake is made, but is caught and corrected before affecting the
patient, how often is this reported? 37 3
10
.8%
45
.9%
43
.2%
45 0
4.4
%
26
.7%
68
.9%
50 4
6.0
%
10
.0%
84
.0%
28thWhen a mistake is made, but has no potential to harm the patient, how
often is this reported? 37 3
5.4
%
21
.6%
73
.0%
45 0
4.4
%
15
.6%
80
.0%
50 4
2.0
%
12
.0%
86
.0%
33rdWhen a mistake is made that could harm the patient, but does not, how
often is this reported? 37 3
2.7
%
21
.6%
75
.7%
44 1
2.3
%
15
.9%
81
.8%
50 4
4.0
%
8.0
%
88
.0%
40thStaff will freely speak up if they see something that may negatively affect
patient care. 39 1
43
.6%
10
.3%
46
.2%
45 0
17
.8%
4.4
%
77
.8%
50 4
4.0
%
2.0
%
94
.0%
2ndStaff feel free to question the decisions or actions of those with more
authority. 39 1
61
.5%
15
.4%
23
.1%
45 0
42
.2%
2.2
%
55
.6%
49 5
53
.1%
22
.4%
24
.5%
18th *Staff are afraid to ask questions when something does not seem right. 39 1
2.6
%
30
.8%
66
.7%
45 0
0.0
%
15
.6%
84
.4%
50 4
8.0
%
14
.0%
78
.0%
12th *Hospital units do not coordinate well with each other. 37 3
56
.8%
10
.8%
32
.4%
44 1
31
.8%
4.5
%
63
.6%
51 3
19
.6%
11
.8%
68
.6%
25th There is good cooperation among hospital units that need to work together. 37 3
32
.4%
32
.4%
35
.1%
44 1
13
.6%
13
.6%
72
.7%
51 3
9.8
%
5.9
%
84
.3%
6th *It is often unpleasant to work with staff from other hospital units. 37 3
32
.4%
32
.4%
35
.1%
44 1
29
.5%
15
.9%
54
.5%
51 3
43
.1%
11
.8%
45
.1%
24th Hospital units work well together to provide the best care for patients. 37 3
5.4
%
29
.7%
64
.9%
44 1
0.0
%
9.1
%
90
.9%
50 4
6.0
%
10
.0%
84
.0%
9th We have enough staff to handle the workload. 40 0
60
.0%
7.5
%
32
.5%
45 0
22
.2%
2.2
%
75
.6%
53 1
43
.4%
5.7
%
50
.9%
17th *Staff in this unit work longer hours than is best for patient care. 30
10
46
.7%
16
.7%
36
.7%
42 3
16
.7%
9.5
%
73
.8%
52 2
15
.4%
7.7
%
76
.9%
14th *We use more agency/temporary staff than is best for patient care. 38 2
5.3
%
34
.2%
60
.5%
45 0
6.7
%
20
.0%
73
.3%
53 1
11
.3%
17
.0%
71
.7%
8th *We work in "crisis mode" trying to do too much, too quickly. 39 1
56
.4%
7.7
%
35
.9%
45 0
22
.2%
8.9
%
68
.9%
52 2
28
.8%
21
.2%
50
.0%
4th*Things "fall between the cracks" when transferring patients from one unit
to another. 28
12
10
.7%
32
.1%
57
.1%
41 4
17
.1%
39
.0%
43
.9%
51 3
9.8
%
51
.0%
39
.2%
5th *Important patient care information is often lost during shift changes. 37 3
10
.8%
62
.2%
27
.0%
44 1
47
.7%
31
.8%
20
.5%
50 4
50
.0%
10
.0%
40
.0%
3rd *Problems often occur in the exchange of information across hospital units. 37 3
8.1
%
64
.9%
27
.0%
44 1
11
.4%
56
.8%
31
.8%
50 4
12
.0%
52
.0%
36
.0%
13th *Shift changes are problematic for patients in this hospital. 37 3
35
.1%
21
.6%
43
.2%
44 1
45
.5%
11
.4%
43
.2%
49 5
14
.3%
16
.3%
69
.4%
15th *Staff feel like their mistakes are held against them. 40 0
35
.0%
15
.0%
50
.0%
45 0
17
.8%
4.4
%
77
.8%
53 1
17
.0%
9.4
%
73
.6%
10th*When an event is reported, it feels like the person is being written up, not
the problem. 40 0
40
.0%
40
.0%
20
.0%
45 0
11
.1%
15
.6%
73
.3%
52 2
19
.2%
25
.0%
55
.8%
1st *Staff worry that mistakes they make are kept in their personnel file. 38 2
39
.5%
34
.2%
26
.3%
45 0
40
.0%
13
.3%
46
.7%
52 2
51
.9%
32
.7%
15
.4%
No
n-p
un
itiv
e R
esp
on
se t
o
Erro
r
Freq
uen
cy o
f Ev
ents
Rep
ort
edC
om
mu
nic
atio
n O
pen
nes
sTe
amw
ork
Acr
oss
Un
its
Staf
fin
gH
and
off
s &
Tra
nsi
tio
ns
Positive scores closer to 100% are the desired outcome. Priority rankings
are indicated before each question for the most recent survey period.
*Question is reverse-worded
2019 2020 2021
CENTER FOR PATIENT SAFETY | HOSPITAL SURVEY ON PATIENT SAFETY 1.0 13
Page 14
DETAILS BY QUESTION, page 1 of 2CURRENT SURVEY DETAILS BY QUESTION
Res
po
nse
s
Mis
sin
g Strongly
Disagree/
Never
Disagree/
Rarely
Neither/
Sometimes
Agree/
Most of
the time
Strongly
Agree/
Always Distribution:
Neg-Neu-Pos
39th People support one another in this unit. 53 1 1.9% 1.9% 3.8% 26.4% 66.0%
38thWhen a lot of work needs to be done quickly, we work
together as a team to get the work done.
53 1 0.0% 5.7% 3.8% 22.6% 67.9%
7th In this unit, people treat each other with respect. 53 1 0.0% 9.4% 43.4% 17.0% 30.2%
11th When one area in this unit gets really busy, others help out. 52 2 1.9% 7.7% 23.1% 55.8% 11.5%
19thMy supv/mgr says a good word when he/she sees a job done
according to established patient safety procedures.
50 4 2.0% 10.0% 6.0% 52.0% 30.0%
34thMy supv/mgr seriously considers staff suggestions for
improving patient safety.
50 4 4.0% 4.0% 4.0% 24.0% 64.0%
27th*Whenever pressure builds up, my supv/mgr wants us to
work faster, even if it means taking shortcuts.
48 6 68.8% 16.7% 14.6% 0.0% 0.0%
41st*My supv/mgr overlooks patient safety problems that happen
over and over.
50 4 68.0% 26.0% 4.0% 0.0% 2.0%
36th We are actively doing things to improve patient safety. 52 2 1.9% 1.9% 7.7% 23.1% 65.4%
16th Mistakes have led to positive changes here. 52 2 3.8% 5.8% 15.4% 23.1% 51.9%
32ndAfter we make changes to improve patient safety, we
evaluate their effectiveness.
52 2 0.0% 5.8% 7.7% 25.0% 61.5%
30thHospital mgmt provides a work climate that promotes patient
safety.
51 3 2.0% 5.9% 5.9% 23.5% 62.7%
37thThe actions of hospital mgmt show that patient safety is a top
priority.
51 3 0.0% 2.0% 7.8% 21.6% 68.6%
20th*Hospital mgmt seems interested in patient safety only after
an adverse event happens.
51 3 43.1% 39.2% 5.9% 9.8% 2.0%
29th*It is just by chance that more serious mistakes don't happen
around here.
51 3 47.1% 39.2% 2.0% 9.8% 2.0%
31st Patient safety is never sacrificed to get more work done. 52 2 3.8% 5.8% 3.8% 23.1% 63.5%
21st *We have patient safety problems in this unit. 52 2 48.1% 34.6% 9.6% 5.8% 1.9%
26thOur procedures and systems are good at preventing errors
from happening.
53 1 0.0% 7.5% 7.5% 20.8% 64.2%
22ndWe are given feedback about changes put into place based on
event reports.
49 5 0.0% 8.2% 8.2% 53.1% 30.6%
35th We are informed about errors that happen in this unit. 50 4 4.0% 2.0% 6.0% 56.0% 32.0%
42ndIn this unit, we discuss ways to prevent errors from happening
again.
50 4 0.0% 0.0% 4.0% 16.0% 80.0%
2021Shaded blocks indicate the desired response to each question. Shaded
blocks are added together for "percent positive". Priority rankings are
indicated before each question for the most recent survey period.
*Question is reverse-worded
Team
wo
rk W
ith
in U
nit
sSu
pr/
Mgr
Exp
ecta
tio
ns
& A
ctio
ns
Pro
mo
tin
g P
atie
nt
Safe
ty
Org
Lea
rnin
g-C
on
tin
uo
us
Imp
rove
men
t
Man
agem
ent
Sup
po
rt f
or
Pat
ien
t Sa
fety
Ove
rall
Per
cep
tio
ns
of
Pat
ien
t Sa
fety
Feed
bac
k &
Co
mm
un
icat
ion
Ab
ou
t Er
ror
CENTER FOR PATIENT SAFETY | HOSPITAL SURVEY ON PATIENT SAFETY 1.0 14
Page 15
DETAILS BY QUESTION, page 2 of 2CURRENT SURVEY DETAILS BY QUESTION
Res
po
nse
s
Mis
sin
g Strongly
Disagree/
Never
Disagree/
Rarely
Neither/
Sometimes
Agree/
Most of
the time
Strongly
Agree/
Always Distribution
Neg-Neu-Pos
23rdWhen a mistake is made, but is caught and corrected before
affecting the patient, how often is this reported?
50 4 0.0% 6.0% 10.0% 48.0% 36.0%
28thWhen a mistake is made, but has no potential to harm the
patient, how often is this reported?
50 4 0.0% 2.0% 12.0% 10.0% 76.0%
33rdWhen a mistake is made that could harm the patient, but
does not, how often is this reported?
50 4 0.0% 4.0% 8.0% 8.0% 80.0%
40thStaff will freely speak up if they see something that may
negatively affect patient care.
50 4 0.0% 4.0% 2.0% 16.0% 78.0%
2ndStaff feel free to question the decisions or actions of those
with more authority.
49 5 6.1% 46.9% 22.4% 10.2% 14.3%
18th*Staff are afraid to ask questions when something does not
seem right.
50 4 38.0% 40.0% 14.0% 4.0% 4.0%
12th *Hospital units do not coordinate well with each other. 51 3 39.2% 29.4% 11.8% 17.6% 2.0%
25thThere is good cooperation among hospital units that need to
work together.
51 3 3.9% 5.9% 5.9% 31.4% 52.9%
6th*It is often unpleasant to work with staff from other hospital
units.
51 3 5.9% 39.2% 11.8% 5.9% 37.3%
24thHospital units work well together to provide the best care for
patients.
50 4 0.0% 6.0% 10.0% 38.0% 46.0%
9th We have enough staff to handle the workload. 53 1 13.2% 30.2% 5.7% 39.6% 11.3%
17th*Staff in this unit work longer hours than is best for patient
care.
52 2 42.3% 34.6% 7.7% 11.5% 3.8%
14th*We use more agency/temporary staff than is best for patient
care.
53 1 49.1% 22.6% 17.0% 9.4% 1.9%
8th *We work in "crisis mode" trying to do too much, too quickly. 52 2 42.3% 7.7% 21.2% 17.3% 11.5%
4th*Things "fall between the cracks" when transferring patients
from one unit to another.
51 3 2.0% 37.3% 51.0% 7.8% 2.0%
5th*Important patient care information is often lost during shift
changes.
50 4 6.0% 34.0% 10.0% 12.0% 38.0%
3rd*Problems often occur in the exchange of information across
hospital units.
50 4 4.0% 32.0% 52.0% 12.0% 0.0%
13th *Shift changes are problematic for patients in this hospital. 49 5 4.1% 65.3% 16.3% 8.2% 6.1%
15th *Staff feel like their mistakes are held against them. 53 1 41.5% 32.1% 9.4% 15.1% 1.9%
10th*When an event is reported, it feels like the person is being
written up, not the problem.
52 2 11.5% 44.2% 25.0% 11.5% 7.7%
1st*Staff worry that mistakes they make are kept in their
personnel file.
52 2 5.8% 9.6% 32.7% 48.1% 3.8%
2021
Staf
fin
gH
and
off
s &
Tra
nsi
tio
ns
No
n-p
un
itiv
e R
esp
on
se t
o
Erro
rC
om
mu
nic
atio
n O
pen
nes
sFr
equ
ency
of
Even
ts
Rep
ort
edTe
amw
ork
Acr
oss
Un
its
Shaded blocks indicate the desired response to each question. Shaded
blocks are added together for "percent positive". Priority rankings are
indicated before each question for the most recent survey period.
*Question is reverse-worded
CENTER FOR PATIENT SAFETY | HOSPITAL SURVEY ON PATIENT SAFETY 1.0 15
Page 16
CURRENT COMMENTSCURRENT SURVEY RESULTS
● Sample Medical Center takes patient safety very seriously.
● SMC could do better at prioritizing patient safety during patient transfers.
● My team at Sample works well together.
CENTER FOR PATIENT SAFETY | HOSPITAL SURVEY ON PATIENT SAFETY 1.0 16