Page 1
Netball in NSW
– Statewide Facilities
Strategy Review
Preliminary Findings Paper
This Paper presents a summary of
the key preliminary findings to come from Stages 1 – 8 of the Netball in NSW Statewide Facilities Strategy
project.
Page 2
Page | 2
Contents
Section 1 - Introduction
Page 4
Section 2 - Background
Page 10
Section 3 - Document Review (Strategic Context): Findings Summary
Page 13
Section 4 - NNSW Membership and Participation Analysis: Findings Summary
Page 48
Section 5 - NSW Population Analysis: Findings Summary
Page 54
Section 6 - NSW Netball Facility Hierarchy: Findings Summary
Page 59
Section 7 - NSW Netball Facility Situational and Supply Analysis: Findings Summary
Page 65
Section 8 - Netball in NSW Facility Needs and Demand Assessment: Preliminary Findings
Page 70
Section 10 - Where to from Here?
Page 77
Appendix A - List of Supporting Documents
Page 78
Appendix B - List of NNSW Associations who Completed Facilities Audit e-Surveys
Page 79
Page 3
Page | 3
Statement of Limitations
McLaughlin Sports Consultancy (MSC) has collected and analysed a wide range of preliminary evidence relating
to the development of a 2018-2028 - Netball in NSW Statewide Facilities Strategy (which incorporates a
review of the NNSW Competitions Framework).
MSC has completed Stages 1-9 of the project with the degree of skill, care and diligence always exercised while
performing services of this nature. All findings tabled within this Paper are based on the evidence collected
and analysed via the agreed project methodology, as outlined in Section 1 of this Paper.
As when undertaking any project of this nature, it is impossible to collect and analyse all potentially relevant
evidence, from all potentially relevant sources, whilst working within both the scope and budgetary
constraints of the project.
MSC takes no responsibility for the completeness or form of any subsequent copies of this Paper.
Mike McLaughlin
MBA (Sport Management)
Bachelor of Sports Science (Sports Studies)
Grad Dip (Sports Coaching)
Cert IV in Training and Assessment
Page 4
Page | 4
Section 1 – Introduction
This Paper summarises the key findings to come from Project Stages 1 - 9 of the 2018-2028 - Netball in NSW
Statewide Facilities Strategy project (which incorporates a review of the NNSW Competitions Framework),
as outlined below.
Project Methodology Outline
Phase 1 – Project Initiation
Stage 1: Project Owner Meeting (9th March 2017)
Teleconference with the project owner (e.g. NNSW CEO and General Manager Sport Development) to confirm
the project scope and methodology details, as well as to discuss the purpose and make-up of the Project
Reference Group (PRG).
Stage 2: Project Reference Group (PRG) Meeting #1 (26th March 2017)
Face-to-face PRG meeting in Sydney (Netball Central) to clarify the background and objectives of the project,
clarify the role of MSC and the PRG, confirm the project methodology and mindset, confirm the expectations
of the PRG members and for Mike McLaughlin to seek input / guidance in relation to specific project related
matters.
Phase 2 – Research
Stage 3: Document Review – Strategic Context (April 2017)
A broad suite of documents such as those listed below (and others as required) will be reviewed.
- Netball Australia Strategic Plan, Participation Plan, Facilities Policy and other relevant planning documents
- NNSW Strategic Plan, Participation Plan, High Performance Plan, etc.
- Regional Government Plans – i.e. the regional plans associated with the 10 x NSW Government Regions;
and a selection of LGA Sport and Recreation Plans
- Facility strategies / plans of other State Netball Associations
- Facility strategies / plans of other high performing netball nations
- Facility strategies / plans of other high performing State Sporting Associations
- National and NSW Sport and Recreation megatrends and participation trends (general and netball specific)
- Resources and information contained with the Clearinghouse for Sport – Sport Facility Planning and Use
Portal
Page 5
Page | 5
Stage 4: NNSW Membership and Participation Analysis (May 2017)
A broad suite of NNSW membership / participation data such as that listed below (and others as required) will
be reviewed.
- Historical data: total, per Region, per Association
- Current data: total, per Region, per Association
- Competition verses social / junior program participation data
- Netball Australia membership and participation growth targets
- NNSW membership and participation growth targets
- Play.Sport.Australia data
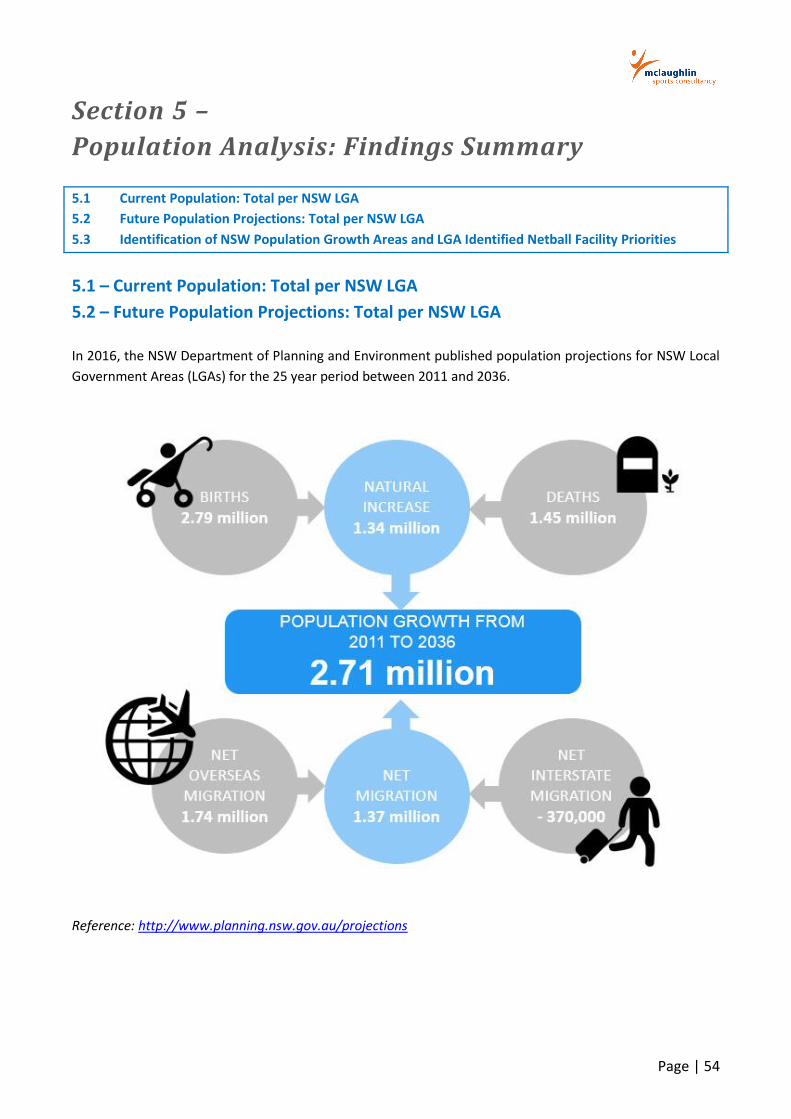
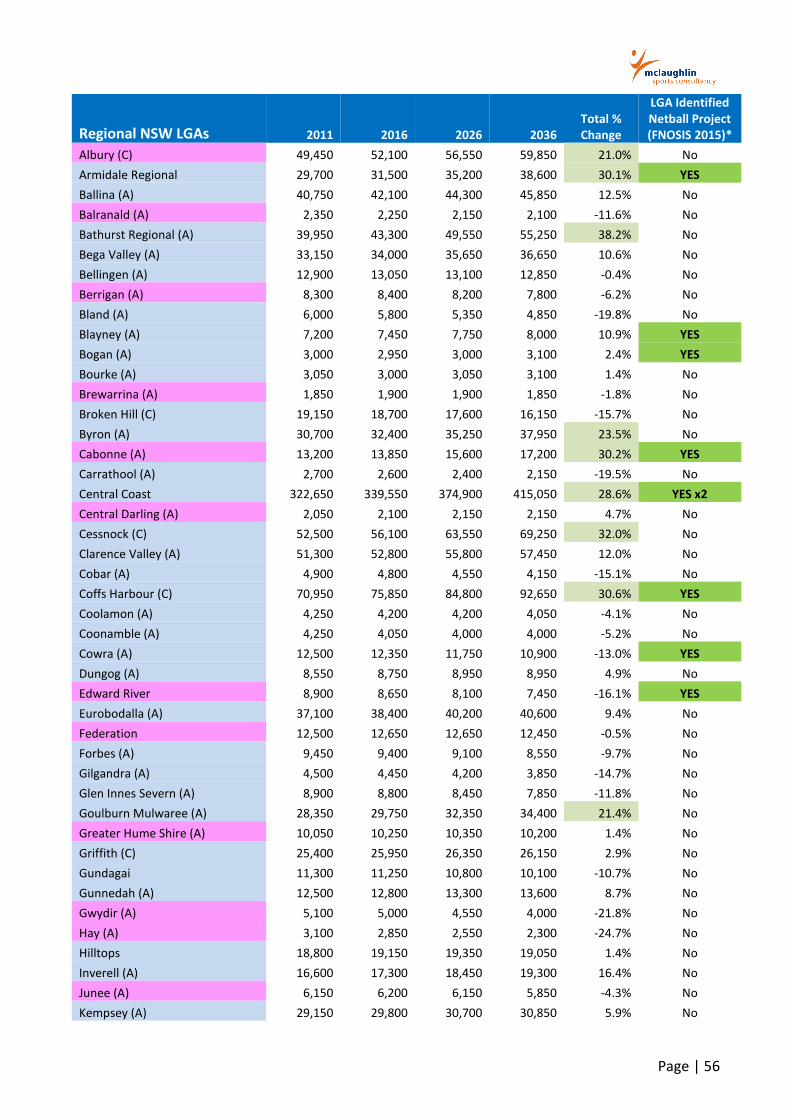
Stage 5: NSW Population Analysis (May 2017)
A broad suite of NSW population data such as that listed below (and others as required) will be reviewed and
analysed as it relates to this project – e.g.
- Current population: total and per LGA
- Future population projections: total and per LGA
- Identification of NSW population growth areas by LGA and planned netball facilities in these areas
Stage 6: NSW Netball Facility Hierarchy Development (May 2017)
In respect of all infrastructure for netball, it will be important to establish a hierarchy of facility provision
against which future infrastructure can be benchmarked and measured. To assist in planning for the population
growth and likely increase in demand for netball facilities in NSW over time, a facility classification and
hierarchy, with specific benchmarking criteria will be developed. This hierarchical classification will be
developed to allow The Strategy to clarify potential facility and investment requirements for the 2018-2028
period, in accordance with likely growth patterns of the sport.
The facilities hierarchy will provide guidance on facility requirements for the various levels of facility and
establish some standards, which should be referenced in the development of new infrastructure and/or the
modernisation or replacement of existing facilities.
Page 6
Page | 6
Stage 7: NSW Netball Facility Situational and Supply Analysis (May 2017)
Development, distribution and analysis of the evidence to come from of a series of specifically designed e-
Surveys to consult widely with all NNSW affiliated Regions, Associations, Clubs and other key groups (as guided
by the PRG). E-Surveys will be designed to collect information relating to the topics listed below (and others
as required).
Facility distribution, condition and utilisation:
By facility hierarchy
By NSW LGAs
By NNSW Region and Association
By non-traditional providers – e.g. schools / universities
Analysis criteria may include (but may not be limited to):
Number of courts
Number of members / participants
Members / participations per court
Number of courts by type (outdoor, indoor, grass, hard court – asphalt / flexipave / synthetic / timber,
netball specific, multi-use, etc.)
Condition of courts
Court construction date/s
Condition of court markings
Goal posts
Lighting
Ownership type (e.g. Federal / State / Local Government, NNSW, Association, Club, School, University,
other)
Seating capacity
Standard of lighting
Level of usage (e.g. days per week, weeks per year, teams per court, players per team, other usage)
Buildings and amenities (e.g. clubhouse, canteen, toilets, fencing, etc.)
Maintenance / upgrade costs
Planned facility improvements / developments
Stage 8: NSW Netball Facility Needs and Demand Assessment (June 2017)
Undertake a comparative / gap analysis of the current level of netball court provision in NSW with the
forecast number, type and quality of courts and amenities required (i.e. per facilities hierarchy category,
per NNSW Region and per NSW Government Region), based on future membership / participation
projections and objectives.
Page 7
Page | 7
Stage 9: NNSW Competition Framework Analysis – Document Review and e-Surveys (June 2017)
- Detailed review of the Netball Australia / NNSW player pathways documentation.
- Detailed review of all NNSW competition related documentation / information, including structures,
schedules, financials, statistics regarding participation, previous Competition Framework reviews,
competition frameworks in other Netball SSOs and in other sports, plus other in formation as required /
guided by the PRG.
- Development, distribution and analysis of a series of specifically designed e-Surveys (e.g. NNSW Member
Associations, Clubs, providers of non-affiliated competitions / events, coaches, umpires, players, parents
of junior players and others as required), relating specifically to the current design and delivery of the
NNSW Competition Framework.
Stage 10: Preliminary Findings and Opportunities Paper (4th July 2017)
Development of a detailed Preliminary Findings and Opportunities Paper based on evidence collected via
Stages 1-9 (above). Note: Preliminary Findings and Opportunities will be presented relating to all objectives
of the Strategy Project and the nature of the NNSW Competition Framework.
This Paper will assist MSC and the Project Reference Group when planning and implementing Project Phase
3 – Stakeholder Consultation.
Stage 11: Project Reference Group (PRG) Meeting #2 (11th July 2017)
This face-to-face meeting will allow the PRG and MSC to discuss the findings and opportunities identified via
Projects Stages 1-9 and how this may influence future stages of the project.
Phase 3 – Stakeholder Consultation
Stage 12: Face-to-Face Interviews and Focus Group Sessions (17th – 20th July 2017)
Preparation and facilitation of up to 30 x face-to-face interviews and 3 x face-to-face focus group sessions
at Netball Central, with representatives of key stakeholder groups (as guided by the PRG) - e.g. NSW State
Government, Local Government NSW, individual LGAs, NA staff, NNSW staff, NNSW Regions, Associations,
Clubs, competition / event managers, providers of social netball, schools currently offering netball as a sport
offering, Net-Set-Go providers, providers of non-affiliated competitions / events, coaches, umpires, players,
etc.
Note: Interview and focus group topics will include both Strategy-related and NNSW Competition Framework
related foci.
Page 8
Page | 8
Stage 13: Telephone Interviews (25th – 27th July 2017)
Facilitation of up to 30 x telephone interviews with representatives of key stakeholder groups (as guided by
the PRG) - e.g. NSW State Government, Local Government NSW, individual LGAs, NA staff, NNSW staff,
NNSW Regions, Associations, Clubs, competition / event managers, providers of social netball, schools
currently offering netball as a sport offering, Net-Set-Go providers, providers of non-affiliated competitions
/ events, coaches, umpires, players, etc.) Note: Interview topics will include both Strategy-related and NNSW
Competition Framework related foci.
Stage 14: Consultation Findings and Opportunities Summary Paper (4th August 2017)
Development of a Findings and Opportunities Summary Paper, based on the evidence collected and
analysed via the consultation phase of the project – i.e. interviews and focus group sessions. Note:
Findings and Opportunities presented will relate to all objectives of the Strategy Project, and the nature of
the NNSW Competition Framework.
Stage 15: Project Reference Group (PRG) Teleconference #3 (9th August 2017)
This teleconference meeting will allow the PRG and MSC to discuss the findings and opportunities identified
via the consultation phase of the project and how these may influence the design of The Strategy and the
NNSW Competition Framework Recommendations Report.
Phase 4 – Reporting
Stage 16: Draft “Netball in NSW” Statewide Facilities Strategy 2018-2028 (25th August 2017)
The development of a comprehensive, yet user-friendly draft “Netball in NSW” Statewide Facilities Strategy,
designed to strategically identify and advocate Netball New South Wales’ facility development priorities for
each LGA, Region and Zone in NSW to stimulate growth and promote sustainability throughout all levels of
netball. Depending on the outcomes of Project Stages 1 – 15 (above), the design of the plan may include
(but may not be limited to) key focus areas such as:
Purpose
Goals and objectives
Importance of Netball to NSW (Netball’s footprint, the impact netball has on community facility
provision, sport and recreation participation, economic impacts, social impacts, physical and mental
health impacts, etc.)
Current network of netball facilities in NSW (hierarchy, size, locations, type, age, quality, usage,
amenities, etc.)
Current and future demand for netball facilities in NSW
Gap analysis
Meeting future needs – recommendations
Future roadmap (implementation plan designed to allow the effective delivery of recommendations
contained within the Strategy)
Decision making framework (i.e. relating to all future facility investments)
Page 9
Page | 9
Stage 17: Draft NNSW Competitions Framework Recommendations Report (30th August 2017)
This report will ensure that the NNSW Competition Framework receives sufficient focus within the project,
allowing NNSW to identify and implement Competition Framework specific recommendations, which will
not be included as recommendations within the “Netball in NSW” Facilities Strategy.
Stage 18: Project Reference Group (PRG) Meeting #4 (12th September 2017)
This face-to-face meeting will allow the PRG and MSC to discuss the nature of both the draft Netball in NSW”
Facilities Strategy and the draft NNSW Competition Framework Recommendations Report. MSC will respond
to PRG questions relating to both documents and MSC will be able to identify any areas within each
document that may require alteration.
Stage 19: Working version of the “Netball in NSW” Facilities Strategy 2018-2028 (21st September 2017)
Stage 20: Final NNSW Competitions Framework Recommendations Report (21st September 2017)
Key Findings
Sections 3 - 9 within this Paper presents a summary of key findings to come from Stages 3 – 9 of the project.
Figure 1 – Preliminary Findings Areas
Section 3
Document Review (Strategic Context)
Section 4
NNSW Membership and Participation
Analysis
Section 5
NSW Population Analysis
Section 6
NSW Netball Facility Hierarchy
Section 7
NSW Netball Facility Situational and Supply
Analysis
Section 8
NSW Netball Facility Needs and Demand
Assessment
Section 9
NNSW Competition Framework Analysis
Page 10
Page | 10
Section 2 – Background
The Project
With over 114,000 members playing and enjoying netball at all levels of performance in cities, suburbs and
country towns throughout New South Wales, netball continues to grow both on and off the court. A current
snapshot of netball in NSW is provided below:
Facilities play a vital role in the vibrancy of community sport. Providing access to facilities that meet the needs
and demands of netball participation in NSW is a critical component of sustaining and growing participation,
as well as supporting the ongoing sustainability and relevance of Associations, clubs and leagues. Netball
facilities across New South Wales are owned and/or managed by a variety of organisations including local and
state governments, schools and universities, netball Associations and leagues, as well as individual clubs, all
of which need to be considered as part of a whole of sport Facilities Strategy for netball in NSW.
114,000 registered members and tens of thousands of participants whom are not
members of NNSW
8 Regions
One of Australia’s (and NSW’s) most popular
sports (by membership and participation)
The Diamonds are the current World and
Commonwealth champions
114 Affiliated Associations (90 Regional / 24 Metro)
New (2017) Suncorp Super Netball League, massively increased TV
ratings - The most exciting period in the
sports history in decades (if not ever!)
Over 800 clubs
Huge opportunities for growth in membership
and participation
Page 11
Page | 11
Project Purpose
Strategic Outcomes
Project Deliverables
To strategically identify and advocate Netball New South Wales’ facility development
priorities for each local government area to stimulate
growth and promote sustainability throughout all
levels of netball.
To scope the opportunities to improve the structure of the
NNSW Competition Framework (i.e. competitions owned and managed by NNSW) to ensure the greatest efficiencies, whilst
optimally supporting current and future members and the NNSW
player, coach and umpire development pathways.
Investigate current netball facility provision, distribution, quality and
sustainability.
Identify areas of population growth and establish a need for future netball
facility provision / enhancement.
Investigate current NNSW Competition Framework and
structure.
Facilitate growth in participation in netball through the enhancement and
development of facilities and optimised competition offerings.
The development of an evidence-based, user-friendly
“Netball in NSW” Statewide Facilities Strategy.
The development of a comprehensive, independent
NNSW Competitions Framework Findings and Recommendations
Report.
Page 12
Page | 12
Project alignment with the NNSW Strategic Plan
In February 2017, McLaughlin Sports Consultancy (MSC) was engaged by NNSW to develop a 2018-2028
Netball in NSW Facilities Strategy (inclusive of a NNSW Competition Framework Review). A Project
Reference Group (PRG) was established shortly thereafter to provide relevance and strategic insight
throughout all stages of the project lifecycle.
PRG members:
Name Position
Nikki Horton NNSW - General Manager Sport Development
Kristian Whitaker NNSW - Association Development Manager
Claire Dale
NNSW - Competitions Manager
Mardi Aplin NNSW - Regional Development & Pathways Unit Manager
Lauren Woods NNSW - General Manager Stakeholder Relations
Project Reference Group
OUR MISSION - Netball NSW will provide to the NSW community sporting leadership and
partnership through netball education and training programs, an extensive range of
competitions and national success.
Strategic Priorities:
- Drive capability and capacity for Associations to grow.
- Shape Netball NSW urbanisation footprint to build capacity.
- Showcase netball in bigger and bolder arenas globally.
PILLAR 1 – OUR COMMUNITY
Influence facility growth and improvement within local netball communities.
Page 13
Page | 13
Section 3 – Document Review (Strategic Context):
Findings Summary
3.1 Sport Participation Trends in Australia: The Big Picture
3.2 Netball Australia (NA): People, Planning and Participation
3.3 NNSW: People, Planning and Participation
3.4 NA Member Organisation Facility Strategies
3.5 Facility Strategies of other High Performing Netball Nations
3.6 Facility Strategies of other Sports
3.7 Other Sport Facility Planning Related Information
3.1 – Sports Participation Trends in Australia: The Big Picture
Megatrends for the Future of Australian Sport
The CSIRO has collaborated with the Australian Sports Commission to identify 6 megatrends likely to shape the
Australian sports sector over the next 30 years. A megatrend represents an important pattern of social,
economic or environmental change. Megatrends occur at the intersection of multiple trends and hold potential
implications for policy, investment and project / program choices being made by sporting groups, industry and
government.
The six megatrends in sport are likely to be:
1. A perfect fit – Individualised sport and fitness activities are on the rise. People are trying to fit fitness or
sport into their increasingly busy and time-fragmented lifestyles to achieve personal health objectives.
2. From extreme to mainstream – This megatrend captures the rise of lifestyle, adventure and alternative
sports which are particularly popular with younger generations. These sports typically involve complex,
advanced skills and have some element of inherent danger and/or thrill-seeking.
3. More than sport – The broader benefits of sport are being increasingly recognised by governments,
business and communities. Sport can help achieve mental and physical health, crime prevention, social
development and international cooperation objectives.
4. Everybody’s game – Australia and other countries of the Organisation for Economic Cooperation and
Development (OECD) face an ageing population. This will change the types of sports we play and how we
play them.
5. New wealth, new talent – Population and income growth throughout Asia will create tougher competition
and new opportunities for Australia both on the sports field and in the sports business environment.
6. Tracksuits to business suits – Market forces are likely to exert greater pressure on sport in the future.
Loosely organised community sports associations are likely to be replaced by organisations with corporate
structures and more formal governance systems in light of market pressures. The cost of participating in
sport is also rising and this is a participation barrier for many people.
Page 14
Page | 14
In order to reinvigorate engagement in sport amongst our communities (be that via membership,
participation, officiating, coaching or other forms of volunteering) and to regain our competitive edge, as a
nation we need to do things differently. We need to place a strategic focus on collaboration, reform and
investment across the entire sporting pathway – from the grassroots up.
Fundamental to this new approach is moving away from the divisive community versus elite sport debates of
the past and developing a collaborative, efficient and integrated national sports system focused both on
growing participation for the benefit of our community as well as the high performance system.
Commentary
As the nature of the broader Australian (and NSW) community changes, sport in this country (and
in NSW) will need to adapt what it does, how it does it; and whom it does it with, if it is to thrive.
This philosophy provides NNSW with an opportunity to look at new ways of attracting, training,
supporting and training its future membership / participation base, and in doing so, grow this
base significantly.
Obviously, if NNSW is successful in growing its community, suitable spaces and places for this
community to engage meaningfully and positively with the sport, will need be readily available.
The changing size and nature of the future NNSW community (age, gender, ethnicity,
participation motivations, etc.) should directly impact on the size and nature of future Netball
facility landscape in NSW – i.e. future facilities need to meet the needs of the future netball
community in NSW.
AusPlay Participation data for the sport sector (2016), Australian Sports Commission
Adults
While sport remains an important form of physical activity throughout life, non-sport related physical
activity becomes more important (i.e. in terms of frequency of participation) as we age. Overall, 87% of
adults participated in some form of sport or physical activity during the previous 12 months. Generally,
there is a decline in the sport participation rate in successive adult age-groups.
59% of adults participated in sport or non-sport related physical activity 3 or more times per week.
Australian adults tend to play sports for longer durations than non-sport related physical activities;
however they participate in non-sport related physical activities more frequently.
The top 5 reasons why adults choose to participate in sport are: (1) health or fitness; (2) enjoyment; (3)
social reasons; (4) psychological, mental health, or personal wellbeing benefits; and (5) to lose weight or
help manage body weight.
Women are more likely to participate in sport or physical activity for physical and mental health reasons
and to lose or maintain weight. Men are more motivated by fun / enjoyment and social reasons.
The top 5 barriers to participation are: (1) not enough time or too many other commitments; (2) poor
health or injury; (3) increasing age; (4) too lazy; and (5) don’t like sport of physical activity.
Page 15
Page | 15
Children
69% of children (i.e. under the age of 15) participated in some form of organised sport or physical activity
outside of school hours.
Only 19% of children are active at least 3 or more times per week in activities outside of school hours.
Participation rates for boys and girls were similar; however, girls in the 9-11 years age group were slightly
more likely to participate in sport or physical activity compared to their male peers.
The top 4 barriers to participation are: (1) wrong age fit to available sport or activities (this declines as an
important issue among older children); (2) not enough time or too many time commitments; (3) don’t like
sport or physical activity; and (4) can’t afford the cost of sport, or transportation issues.
Boys are more likely to participate in club sports than girls, among all age-groups.
Commentary
Understanding why males, females, adults and children participate in sport (specifically netball)
in NSW and how often they participate should impact on the future size and nature of the netball
facility landscape in NSW.
As NSW’s most popular sport for females, NNSW and the broader NSW netball community can
and should play a very significant role in increasing the number of children and adults currently
participating in organisation sport / recreation activities.
Page 16
Page | 16
Participant Market Segmentation (2013), Australian Sports Commission
Current Club Member Market Segments – Children (5-13 years of age) Social Loyalists
Social Loyalists make up a quarter of Australians aged 5 to 13 years. They are more likely to be male and
from higher income households (over $70k plus per annum). They are under-represented by culturally and
linguistically diverse (CALD) individuals.
Social Loyalists are highly engaged with sport and love being part of a sports team. They enjoy all facets of
sport, from the physical and mental to the social and competitive. Clubs are a big part of their lives and
identities, and they enjoy all aspects of club participation (physical, social and self-improvement).
Commentary
Although the cost of participating in club-based sport is less of a barrier for parents of this
segment, membership options which make it easier for the whole family to join will help to ensure
continued membership over time. The ability for netball clubs / associations to offer participation
opportunities for the whole family, at the same venue and at similar times could be considered,
to keep whole families engaged. This may have impacts on future facility design and use (e.g.
court size, lighting quality, netball being played at multi-sport venues, ancillary facilities such as
club-houses, playgrounds, etc.).
Sport Driven
The “Sport Driven” make up more than 1 in 10 Australians aged 5 to 13 years. They are more than likely to
be found in metropolitan Australia and are over-represented by culturally and linguistically diverse (CALD)
individuals (1 in 5 are CALD). The Sport Driven are highly engaged with sport and show a relatively high
interest in doing more sport if they have information on how to go about it. While they aren’t adverse to
competition, for them it‘s more about the sense of achievement through meeting personal goals and self-
improvement.
Commentary
Netball clubs / associations should focus on retaining these individuals through offerings that
allow them to achieve their personal fitness goals through sport in an inclusive environment.
Netball products and services should provide flexible opportunities to participate in a variety of
offerings designed to suit all levels. Reducing pressure to be involved in the club beyond ‘playing
the sport’ will encourage continued membership of this segment and their parents.
Page 17
Page | 17
Apathetic Clubbers
Apathetic Clubbers make up 1 in 6 Australians aged 5 to 13 years. They are slightly more likely to be from
higher income households (over $70k per annum). Despite their relatively active participation in sport
(recreational and competitive), only a small minority consider sport to be a main hobby or interest, reflecting
their apathetic attitudes to sport. This segment exhibits some negative perceptions of sport, suggesting poor
experiences with sport over time. They are less likely to see the benefits to sport participation compared to
other children and more likely to feel they don’t like sport or that it is too competitive and no longer fun.
Commentary
This segment would benefit from feeling less pressured to be good at the sport in order to
continue enjoying it. For Netball clubs / associations, there needs to be a focus on ease of ‘entry’
in terms of ensuring everyone feels they can join regardless of skill level or motivation. There
may be a need to promote the social and fun aspects of Netball to reinvigorate this segment,
who are at risk of dropping out if there is a change to their circumstances given their somewhat
apathetic attitude.
If more social, fast and low pressure forms of netball are offered at club / association venues
throughout NSW, this may have impacts on future facility design and use.
Non-Club Member Market Segments with High Potential for Acquisition – Children (5-13 years of age) Thrifty Enthusiasts The Thrifty Enthusiasts make up around 1 in 20 Australians aged 5 to 13 years and are the smallest of the
non-club member segments. They are very positive about physical activity and sport in terms of the physical,
mental, social and self-improvement benefits, and don’t personally have any barriers to sport participation.
While they don’t do physical activity with a club, most do organised physical activity through other
organisations, school or courses. They are also participating frequently — 5 times a week on average.
Similarly, parents of the Thrifty Enthusiasts are very positive towards clubs despite only 1 in 10 being current
members.
This segment has high acquisition potential, with 80% interested in future club membership (the same
number have been members in the past). There are few perceptual barriers to joining a club, however cost
of participating in club-based sport is a barrier.
Page 18
Page | 18
Commentary
To appeal to this segment, netball clubs / associations could consider making club-based sport
more accessible through flexible membership pricing options, 2-for-1 memberships and/or
providing value for money in terms of multiple program offerings for kids and the whole family.
More flexibility with participation times is also appealing for parents.
Children in this segment, as well as their parents, need to feel that clubs / associations are
inclusive and promote equality, regardless of skill level. If more inclusive (skill, ethnicity, gender,
etc.) forms of netball are offered at club / association venues throughout NSW, this may have
impacts on future facility design and use.
Ponderers
Ponderers make up 1 in 5 Australian children aged 5 to 13 years. They are less likely to come from higher
income households (mostly under $70k per annum) and are over-represented by the cultural and linguistically
diverse (CALD). Ponderers are generally less active in sport than other children, however most do participate
in physical activity for exercise or recreation. In general, Ponderers have relatively positive attitudes toward
sport, especially in terms of the fun and social elements of sport participation.
Commentary
Ponderers are a potential segment for acquisition, as they show a high interest in sport
involvement if they have information regarding how to go about it. For this segment, netball
clubs / associations will benefit from providing opportunities for fun and social participation
without overt competitiveness. They must also address practical concerns about cost and
commitment.
Current Club Member Market Segments – Adolescents & Adults (over 13yrs of age) Loyalists
Sport is their life. They enjoy all aspects of sport — including the competitive and social elements — and
derive confidence from participation. Loyalists are particularly motivated by competitive success and
participate regularly in a range of individual and team-based sports. As Loyalists live for sports, most view it
as an imperative to be part of a club. Members of this segment derive a strong sense of pride from belonging
to a club. They provide them with a platform for personal / competitive success, an overall sense of
achievement and a valued social network.
Page 19
Page | 19
Socially Engaged
The Socially Engaged enjoy all aspects of sport, especially the social aspect. They prefer to play sport with
others and — while not adverse to competition — are more interested in challenging themselves and having
fun. This is a very valuable segment as they are highly engaged with sport and clubs.
Promoting new or other sports/activities could provide higher involvement given their social nature and
status as influencers. While the social aspects of clubs are important, the competition element should not be
diminished.
Sport Driven
Sport Driven club members do a lot of physical activity, but keep their social activity within the club to a
minimum. This segment is often younger, wealthier urbanites, with a high proportion from culturally and
linguistically diverse (CALD) backgrounds.
Their motivation for participating in sport tends to be more personal and focused on self-improvement. The
club is a place for them to access facilities and participate, but they don’t necessarily want involvement
beyond this.
The Sport Driven consumer can be at a busy life stage, meaning they are often balancing membership with
family and work commitments. While they appreciate the camaraderie that clubs offer, it is the sport rather
than the social aspects of clubs that are paramount. Their relationship with clubs is less assured; they may
move to non-club segments so the challenge is to keep them engaged and help them to fit club membership
into their live.
Apathetic Clubbers
Despite being highly active in both sport and physical recreation, this segment is somewhat apathetic in their
attitudes towards sport and clubs. They do not like competition and are less likely than other club segments
to feel very positive toward sport or clubs, with some viewing sports as a chore.
Relative to other club member segments, Apathetic Clubbers tend to find value in clubs for their facilities
rather than the elements of competitiveness and socialising. Some feel pressure that you need to be good at
sport to be part of a club. While they initially enjoyed their membership, this appears to be waning.
Commentary
This segment find value in the “facilities” more than competition and socialising. Quality,
accessible facilities will be key for them.
Page 20
Page | 20
Non-Club Members with High potential for acquisition – Adolescents and Adults (over 13 years of age)
Sideline Sportsters
Sideline Sportsters are into sport and value the opportunity it provides to have some personal time, relax
and break up their routine. They particularly enjoy the camaraderie and friendships that come from being
part of a sports team. The competitive aspect is also a key component in their enjoyment.
They would be quite comfortable at sports clubs given their ability to hold their own in a sporting context.
Many would have been club members as children (even up to adulthood) and it would not necessarily have
been their choice to stop but rather their changed circumstances. They retain a positive perspective on clubs
and their benefits.
This group needs greater flexibility from clubs but doesn’t necessarily see this as the club’s responsibility.
They view their changed priorities as the reason they cannot commit as much time or money.
Commentary
This is a key target group for acquisition into netball as they have all the hallmarks of keen, but
lapsed, sports club members. Given their interest in sport overall, there may be opportunities to
attract this segment with products outside of the traditional netball offering, to address
concerns with time and cost commitments.
Club Wary
The Club Wary are very positive about sports, though they want to enjoy their sport at a slightly less serious
and competitive level. It is as much about challenging themselves and doing something active with friends.
Club Wary are not particularly critical of clubs but have some reservations given past experiences as
members. While they appreciate the social and emotional benefits that clubs can offer, they see clubs as
requiring significant commitment and lacking in flexibility. The Club Wary do not always feel they will fit in at
clubs and can be slightly self-conscious about playing sport with others.
This group is a realistic target for acquisition but clubs need to be proactive in their communication.
Commentary
To attract this segment, netball clubs / associations will need to avoid a sense of over-
commitment or competition when messaging and with the products offered.
Page 21
Page | 21
Ponderers
Often married with children at home, Ponderers are active people but commitments to work and family take
up much of their time. They fit in a reasonable amount of physical activity but this is mainly recreational and
focused on activities that can be done alone and around other commitments.
Typically, they were members of clubs into adulthood when for practical reasons they felt they had to give
up. They have a fairly positive view of clubs both socially and as a way to support health and fitness.
Though less competitive than many other segments, most show at least some interest in joining clubs.
Commentary
Netball clubs / associations could be seen as a way for this segment to escape their normal
routine, and membership should include flexible participation and cost options, whereby they
feel they can join without neglecting other commitments. To attract this segment, Netball clubs
/ associations will need to avoid a sense of over-commitment or competition when messaging
and with the products offered.
Commentary
The ASC research provides key insights regarding how sport participation (in all consumer
segments) is negatively impacted upon by the following participation barriers:
- Sport delivery that focuses on competition rather than fun and enjoyment;
- A lack of flexibility around the scheduling of sport in traditional sporting clubs;
- Organising individuals and teams according to talent, rather than retaining friendship
groups;
- Limited opportunities for people with limited sports competency to join sporting clubs;
and
- Self-consciousness amongst adolescents and embarrassment by their lack of sporting
ability.
For netball in NSW to grow, these factors will need to be addressed, as will ensuring the facility
element of the netball offering meets the needs of all current and future consumer groups.
Page 22
Page | 22
Barriers and Enablers to Women’s Participation in Sport Report (2013) - Qld Government: Sport and
Recreation Ministerial Advisory Committee.
Barrier About
Competing
priorities and
lack of time
Studies indicate that that this is a barrier for young women (18 - 40), mid age women
(40 - 65), and low SES women. Women perceive that they are time poor and research
has shown that women tend to take on the burden of domestic responsibilities
including housework and caring roles.
Lack of
appropriate and
affordable
Childcare
A lack of access to appropriate, regular and affordable childcare to enable participation
in community sport and recreation was reported consistently in the literature as a
barrier for young women (18 - 40).
Costs of
Participation
Studies indicate that the cost of participation, including associated costs such as
childcare and transport, is a barrier to participation for young women (18 - 40), older
women (65+), CALD women, disabled women, Low SES women and Aboriginal and
Torres Strait Islander women. Programs to reduce and help with the costs of activities
and associated costs, such as transport and child care are enablers to participation for
women.
Poor access to /
availability of
venues and
places to
participate and a
lack of
appropriate
facilities for
women
Studies indicate that poor access to venues, including venues with appropriate facilities,
is a barrier for young women (18 - 40), CALD women, disabled women, Low SES women,
Aboriginal and Torres Strait Islander women and rural women. Poor access can be
compounded by a lack of transport and a lack of information on available facilities. A
lack of physical access to premises and a lack of venues and facilities with suitable
equipment is a barrier for disabled women.
Research has found that providing safe comfortable and culturally appropriate facilities
and culturally targeted information about activities and facilities can enable
participation.
Poor access to
programs
Poor access to programs has been identified as a barrier. This is a barrier for rural
women due to a lack of people to run programs. It is also a barrier for women from
CALD backgrounds, Aboriginal and Torres Strait Islander women and disabled women
due to a lack of culturally appropriate programs and a lack of trained staff to run and
manage programs.
Providing culturally targeted information about activities and facilities is an enabler to
participation where facilities and people to run programs are available.
Partnering physical activity programs with existing community programs is also an
enabler.
Safety
Feeling unsafe while participating due to factors such as traffic, lighting, animals (dogs
and snakes) and gangs and suspicious individuals was identified as a barrier for young
women (18-40), CALD women, disabled women, Low SES women and Aboriginal and
Torres Strait Islander women.
Page 23
Page | 23
Barrier About
Climate
The weather was identified as a barrier for women’s participation. It was noted that
participation was impacted by hot, humid and wet in summers in northern Australia
and cold and dark in winters in southern states.
Lack of leisure
companions
Studies have found that not having anyone to participate with is a barrier for women,
particularly CALD women.
Cultural factors
and social norms
For some women, sport and recreation is not seen as a culturally appropriate way for
females to spend leisure time. Cultural factors can also exacerbate the experience of
other barriers such as competing priorities, lack of facilities, lack of access to programs,
and lack of leisure companions.
A lack of cultural awareness in the delivery of sport, recreation and physical activity
programs also limits women’s participation for CALD and Aboriginal and Torres Strait
Islander women.
It has been identified that social norms are a barrier to women from low SES areas
participating (Australian Government 2006).
Personal
perceptions and
motivation
Personal perceptions have been identified as barriers to women’s participation
including: low self-esteem and poor body image; lack of confidence a perception of
being too old a perception of not being the sporty type; and lack of motivation.
Injury and health
problems Injuries, health problems and the fear of injury or re-injury.
Competing
priorities
Competing priorities are reported as a barrier for girls in both early and late
adolescence. As girls move through adolescence, other activities are prioritised over
sport and recreation more often. Competing priorities include:
School work
Other leisure activities
After school jobs
Friends who do
not participate
Studies have shown that if girls belong to a friendship group that is perceived to be not
sporty, they are less likely to participate. Alternatively friends are also an enabler to
participation if the friendship group that girls belong to is “sporty”.
Perceptions
being feminie
The literature has identified that many girls did not see participation in sport and
recreation as being a “feminie” or “girly” pursuit and therefore do not participate.
Lack of Parental
Support
Parents negatively influence girls’ participation in sport and recreation by not providing
access / transport to opportunities, and by discouraging participation in sport and
recreation and encouraging participation in other activities, such as jobs, school work
and school subjects. Other parents positively influenced participation through
encouragement and by providing access / transport to opportunities.
Page 24
Page | 24
Barrier About
Competitiveness
Several studies have identified that girls reduce their participation in sport and
recreation due to a perception that the activities become less fun and more competitive
as they get older. It was noted that sport became more competitive during the
transition from primary school to high school and from junior to senior high school.
Studies found that highlighting the fun and social aspects of sports resulted in higher
motivations to participate and higher participation rates.
Body Image and
sports uniforms
Girls of all ages report that poor body image impacts upon their participation. Related
to body image concerns, issues with uniforms were noted, with uniforms reported as a
barrier for all girls.
Lack of facilities
A lack of community facilities to participate is noted as a barrier to physical activity.
Having facilities available for those activities that girls want to participate is noted as an
enabler to participation.
Boys
Participating with boys in PE classes and outside school sport was noted as a barrier for
some girls as they perceived that boys were too competitive and that boys did not
support them in participating (i.e. they did not throw the ball to them). This is also a
barrier to girls from culturally and linguistically diverse communities participating.
Lack of
confidence
Girls of all ages reported that they did not participate in sport and recreation due to a
perceived lack of ability.
Poor team
relationships Poor team relationships included factors such as conflict, bullying and being left out.
Negative
experiences
Studies found that if girls experienced negative experiences in either PE classes or
outside of school sport or recreation they were less likely to participate.
Commentary
The very clear opportunity exists for NNSW to view all of the barriers listed above, as possibilities
to provide solutions to! Once again, if NNSW effectively addresses these issues (including the
barriers specifically linked to facilities), Netball in NSW will need to ensure the facility element of
the netball offering meets the needs of all current and future consumer groups.
Page 25
Page | 25
3.2 – Netball Australia (NA): Participation, Planning and People
Participation
NA 2015 Annual Report
Record Netball NSW registration total of 114,872 across all Membership categories, including a record 28,656,
NetSetGO participants.
Page 26
Page | 26
Netball Australia Membership Analysis (2012/13)
NT 1,683
Netball Australia Membership Analysis (2007)
NSW 109,282
QLD 37,249
ACT 7,088
VIC 106,866
TAS 6,188
SA 23,135
WA 33,501
Commentary
There has been a slight increase in Netball membership over the past decade, both collectively
and in most states and territories.
AusPlay Data - 2016
Netball remains the top team sport for women and girls, according to the Australian Sports Commission’s
(ASC) AusPlay participation data. The ASC’s data revealed the first findings of the most comprehensive national
population tracking survey into sport and physical activity in Australia, with netball recorded as the highest
team participation sport for women and girls. Data was collected from October 2015 – September 2016,
showing 562,698 adult women participating in netball over the course of the year.
Page 27
Page | 27
For girls participating in organised out of school hours sport and recreation, netball was the most popular
team sport with 324,177 participants, second only to swimming overall.
188,077 children aged between 5 and 10 took part in ANZ NetSetGO around the country in 2015. This total
was a 29% increase – 42,427 overall – from the numbers that participated in 2014, which was the previous
record for Netball Australia’s official introductory program for netball. The number of centres offering ANZ
NetSetGO has also enjoyed another year of significant growth up 6% to 2,321.
Commentary
Encouragingly, both traditional and “new” netball product offerings (e.g. NetSetGO and Fast 5)
are increasing the overall netball community footprint nationally. This of course will have impacts
on the future netball facility landscape.
Planning
2016-2019 Netball in Australia Strategic Plan – Strategic Priorities
1. Position the sport so that it broadens the appeal and increases the engagement with Australia’s diverse
population.
2. Invest in partners with a footprint that helps to extend netball’s connection with communities.
3. Meet the demand for contemporary, consumable and convenient sport products.
4. Leverage the success of Netball World Cup 2015 and use the Commonwealth Games 2018 to increase the
profile of the sport to deliver a sustainable legacy for Australian netball.
Commentary
Potentially the most important enabler of the successful achievement of all 4 strategic priorities
will be a netball facilities footprint of sufficient size and suitability.
Netball in Australia Participation Strategy
Although it does not appear that NA has a National Participation Strategy / Plan in place, it does have detailed
annual operational plans, which focus heavily on participation growth. Participation related “strategies”
(which appear to be objectives, not strategies) contained within the 2017 Operational Plan Summary, include
(but are not limited to):
NetSetGO is the single authorised national introductory program for netball;
Netball is the sport of choice in school communities;
Fast5 is a social netball offering that attracts new participants to the game and gets more people playing
more often;
Recognise and promote Indoor Netball as a format of the game; and
Netball remains one of the top team participation sports in Australia.
Page 28
Page | 28
Commentary
Participation (not just membership) is a major focus for NA and NNSW and once again; if
successful, this growth will need access to suitable spaces to meaningfully and positively engage
with the sport.
The core focus of the Netball in NSW Facilities Strategy will be the provision of current and future
facilities to support the delivery of NNSW affiliated netball. Having said this, the “Netball in NSW”
participant base is larger than this – e.g. Indoor Netball NSW’s 32 x registered centres and over
48,000 participants. The non-affiliated netball community in NSW and the facilities they currently
access (and may need to access in the future), will also need to be considered as an element of
the Strategy.
Netball Australia National Facilities Policy (Version 2 – March 2016)
The National Facilities Policy was developed in consultation with key stakeholders including Member
Organisations, Associations, Leagues and Clubs as well as local and state governments.
The key objectives of the Policy are to:
Support participation growth and sustainability;
Provide key stakeholders with guidance in facility planning and development;
Provide a technical manual that can be applied nationally; and
Improve the overall consistency, quality and accessibility of netball facilities
Netball facility planning and development is to be focused on supporting the growth of the sport. In order to
do this, facilities will be planned and developed with consideration of the following guiding principles:
Strategic need, facility demand and participation growth opportunities;
Accessibility and inclusion, catering for multiple formats of the sport;
Maximising utilisation and improved programming;
Best practice technical and design standards; and
Alignment with the needs of key stakeholders and partners.
Page 29
Page | 29
Commentary
NA’s National Facilities Policy is a high quality publication, which addressed the following areas:
- Policy objectives and principles;
- National Netball Framework roles and responsibilities;
- Facility guidance;
- Facility development process; and
- Technical manual – The technical manual section of the policy is very comprehensive and has
been developed to help Clubs, Associations, local government, the education sector, contractors
and others in the netball community to understand better the technical aspects of netball court
design, construction and maintenance requirements.
The core role / responsibility of NA Member Organisations (MOs) listed within the policy is
“Undertake analysis of facility needs and develop specific plans and strategies to address these
needs. This includes facility audits, state wide master plans, preferred facility guidelines and
feasibility studies”. Clearly, NNSW is taking its role in the facility space very seriously, as is evident
via their development of the Netball in NSW Statewide Facilities Strategy.
People
NA staff positions with significant interplay within the area of facilities utilisation and planning include (but
may not be limited to):
Chief Executive Officer
Head of Community Strategy and Netball Development
Participation Manager
Head of Stakeholder Relations and Public Policy
General Manager – Community Engagement
Head of Events
Page 30
Page | 30
3.3 – NNSW: Participation, Planning and People
Participation
Note: A detailed analysis of NNSW membership and participation data is presented in Section 4 of this Paper.
Page 31
Page | 31
Commentary
Encouragingly, both traditional and “new” Netball product offerings (e.g. NetSetGO and Fast 5)
are increasing the overall Netball community footprint nationally. This of course will have impacts
on the future Netball facility landscape in NSW.
Currently, only 29% of the NNSW membership are senior members. In addition to the continued
growth of junior and NetSetGO membership numbers, senior memberships (via new and flexible
/ social offerings) presents as a significant future growth opportunity.
Note: Although potentially not endorsed / supported by NA, other MOs are active in the “flexible
netball offering” space – e.g. https://rockupnetball.com.au/ and NNSW may benefit from working
collaboratively with NA / other MOs in relation to similar initiatives.
Regions
There are 8 Netball NSW regions.
Associations
Currently, there are 114 x NNSW affiliated Associations within 8 Regions.
REGION NUMBER OF ASSOCIATIONS
REGION 1 – SYDNEY METROPOLITAN 24
REGION 2 – HUNTER 17
REGION 3 – WEST CENTRAL WEST 21
REGION 4 – FAR NORTH COAST 7
REGION 5 – SOUTH COAST 12
REGION 6 – NORTHERN INLAND 9
REGION 7 – NORTH COAST 8
REGION 8 – RIVERINA 16
Page 32
Page | 32
Commentary
Netball in NSW has a significant regional footprint, with 79% of NNSW affiliated associations
located outside of Region 1 (Metro). The nature of the future netball facility landscape in regional
NSW, will be an important element of the Netball in NSW Statewide Facility Strategy.
The precise nature of the membership / participation base per region will be investigated in future
sections of this project.
Non-Affiliated Netball in NSW
In addition to the affiliated membership of NNSW, there is an unknown number of unaffiliated netball
participants engaged in / consuming the sport throughout NSW. These may include, but are not limited to
indoor netball competitions (e.g. those administered under the auspice of Indoor Sports NSW), social
competitions, school competitions, university competitions, corporate competitions, unaffiliated clubs, etc.
This market segment presents as an opportunity for NNSW, in that they may be a market which could indeed
become an element of a flexible NNSW membership / participation model.
Commentary
It would be beneficial for NNSW to understand the size and nature of the unaffiliated netball
market and to understand the facilities currently being accessed by this collective and the future
facilities needs of this group.
Netball South Australia, whose current membership is approximately 35,000 conducted a “Non-
Affiliated Netball Research Project” in 2016, and some findings to come from this study include:
- There are currently 31,102 unaffiliated participants.
- There are currently 58 unaffiliated competitions.
Non-Affiliated Netball
Page 33
Page | 33
Planning
NNSW Strategic Plan 2017-2020
The Netball in NSW Statewide Facilities Strategy project aligns with the NNSW Strategic Plan, as a key enabler,
in many areas, including (but not limited to):
OUR MISSION - Netball NSW will provide to the NSW community sporting leadership and partnership
through netball education and training programs, an extensive range of competitions and national success.
Strategic Priorities:
- Drive capability and capacity for Associations to grow.
- Shape Netball NSW urbanisation footprint to build capacity.
- Showcase netball in bigger and bolder arenas globally.
PILLAR 1 – OUR COMMUNITY
Influence facility growth and improvement within local netball communities.
Commentary
The importance of the Netball in NSW Statewide Facilities Strategy is evident via linkages to the
NA and NNSW Strategic Plans.
NNSW Participation Growth Strategy
There does not appear to be a single, NNSW Participation Strategy / Plan in place.
Commentary
Although a single, integrated Participation Growth Strategy for Netball in NSW does not appear
to be in existence (and this no doubt presents as an opportunity for NNSW to explore), NNSW is
extremely proactive in this space, as is evident via its delivery of numerous participation related
programs and initiatives, e.g.
- Sporting Schools Program;
- Community delivered NetSetGO;
- Various inclusion programs;
- Gala days;
- Workforce development initiatives; and
- Club development initiatives
Page 34
Page | 34
People
NNSW staff positions with significant interplay with the area of facilities utilisation and planning include (but
may not be limited to):
Chief Executive Officer
General Manager – Sport Development
General Manager – Stakeholder Relations
Association Development Manager
Competitions Manager
Regional Development & Pathways Unit Manager
Community Engagement Manager
Commentary
Depending on the nature of the Facilities Strategy, once developed, NNSW may need to consider
the most appropriate staff allocation relating to the Strategy’s effective implementation.
E.G. various prominent NSW State Sporting Organisations who are active / dominant in the
facilities space, allocate one or more positions to the area of facilities.
3.4 – NA Member Organisation Facility Strategies
Netball Queensland (NQ)
Although a Netball in Queensland Statewide Facilities Strategy does not appear to be in existence, NQ has
developed a “Facilities Development Plan Template” for use by its member clubs and associations. Having
reviewed the template, it is in essence a user-friendly and effective “Facilities Audit Tool”, as opposed to a
Facilities Development Plan tool, however, if used effectively, it would provide clubs and associations (and
NQ) with detailed and accurate facility situation analysis information.
Netball Victoria (NV)
Although a Netball in Victoria Statewide Facilities Strategy is mentioned in the NV Facilities Manual (refer
below) it has not been located for review. However, NV does provide its affiliated associations and clubs with
a suite of excellent resources designed for them to undertake local facility planning and development.
Resource includes:
Support letter
Facilities manual
Compliance fact sheet
NA National Facilities Policy
Universal design principles – Design for Everyone Guide
Netball lighting guide 2011 and 2012
Facility audit template
Links to netball facility development consultants in Victoria
Page 35
Page | 35
Netball Tasmania (NT)
A Netball in Tasmania Statewide Facilities Strategy does not appear to be in existence. The only reference to
facilities in the 2015-2020 NT Strategic Plan is within the Community Strategic Priority Area – i.e. “Netball
infrastructure in Tasmania aligned with national model”.
Netball South Australia (NSA)
A Netball South Australia Statewide Facilities Audit and Master Plan (2014) is in existence. Having said this, it
appears as though the operational / practical impact this document has had on Netball facility provision /
improvement in South Australia may be somewhat limited. This is evidenced by there being a strategic
initiative / project within the NSA Strategic Plan (identified for completion in 2020) – i.e. “develop a statewide
facilities plan”.
Netball Western Australia (NWA)
A Joint Netball WA and Basketball WA Strategic Facilities Plan (2015) is in place. The plan outlines the likely
population growth patterns within WA over the coming years and identifies the future requirements for
further facilities to accommodate this growth. The document also contains the framework to indicate how
Netball WA is able to provide support and guidance to its key stakeholders as well as information on the
following:
A 3 level hierarchy of facilities – State, Regional and District.
Further detail on recommendations for facilities in each region as per the Department of Sport and
Recreation Regional Boundaries, accompanied with priority levels and timeframes.
The plan is a comprehensive resource for NWA Regions, Associations, Local Government, other government
departments and developers.
Netball Northern Territory (NNT)
The opening of the new world class Alice Springs Netball Centre in 2016 was a massive boost for the sport in
the NT. However, although it is apparent that the lack of quality facilities (especially indoor facilities in Darwin
and facilities in rural and remote NT) is a major factor limiting the sports future prosperity, a Netball in NT
Facilities Strategy does not appear to be in existence. The 2 references to facilities in the 2016-2020 Netball
NT Strategic Plan are listed below. How Netball NT plans to achieve these strategic objectives is unknown.
Facilities and assets are managed to support the growth of netball.
Continued investment in new and upgraded netball facilities.
Netball ACT (NACT)
A Netball in the ACT Facilities Strategy does not appear to be in existence. The only reference to facilities in
the 2015-2018 NACT Strategic Plan is listed below.
Have all ACT Netball facilities meeting a national standard with a comprehensive facility management
and maintenance plan.
Page 36
Page | 36
Commentary
The NA National Facilities Policy provides excellent guidance to its MOs relating to the future
provision of quality netball facilities. The policy states that it is the MO’s role to drive the
development and implementation of state / territory Facilities Strategies.
There are various high quality resources to support clubs and associations in the area of facility
provision (e.g. the Netball Victoria and Netball Queensland resources mentioned previously). An
opportunity exists for these resources to be promoted to and used by the broader Australian
netball community.
Of the 8 x NA State and Territory MOs, Facilities Strategies are in place in 3 of these catchments
(i.e. WA, SA and Victoria – although the Facilities Strategy for Victoria has not been located for
review). As all 8 MOs have participation growth as a priority within their strategic plans, the
development and implementation of facilities strategies is all states and territories is an
opportunity which should be aggressively engaged with by Netball Australia and those MOs
currently without such a Strategy.
3.5 – Facility Strategies of other High Performing Netball Nations
Netball New Zealand (NNZ)
A NNZ Facilities Strategy was developed in 2011. The strategy (albeit brief in nature) clearly highlights current
and estimated population and netball participation rates, prioritised netball facility / infrastructure needs (no
timelines attached) and outlines how these priorities may be delivered.
NNZ also has a Facilities Specifications document (2009) which provides minimum facility related requirements
for hosting:
International matches
NZ Championships
NZ Secondary School Championships
NZ Age Group Netball Championships
England Netball (EN)
The following EN resources are in place:
Netball design guidelines (Community, Club, Premier and International) and support resources
Performance Requirements for Netball Surfaces
It is also apparent that a number of County Netball Associations have developed their own facility strategies,
which EN supports the implementation of.
Page 37
Page | 37
Jamaica, South Africa and Malawi Netball Federations
These 4th, 5th and 6th ranked netballing nations do not appear to have specific Facility Strategies in place,
however they do have Facilities as a strategic focus area within their respective strategic plans (or equivalent).
Commentary
Netball NSW has the opportunity to be “world-leading” in relation to how it plans for the provision
of facilities to allow the sport to continue to thrive, even in challenging times for sport
participation (such as now). The development of a comprehensive, contextually relevant and user-
friendly Netball in NSW Facilities Strategy (2018-2028), will also be able to be used as a case study
of excellent practice by NA, to assist other MOs to develop / enhance their own strategies to
ensure facilities are a key pillar of the sport’s growth, nationally for many years to come.
3.6 – Facility Strategies of Other Sports
As part of a sport sector wide environmental scan, a range of non-netball related facility strategies and
associated support resources have been reviewed. The lessons learnt from this analysis will prove useful in
the development of a sector leading Facilities Strategy for Netball in NSW. Information reviewed includes (but
is not be limited to):
Cricket Australia (CA)
The National Facilities Audit 2016/17 (the first national audit of Australian cricket infrastructure)
Community Cricket Facilities Guidelines
Bowls Australia (BA)
National Facilities and Retirement / Lifestyle Villages Strategy
Football NSW
Football NSW Facilities Strategic Plan 2014-2024
Meeting the Future Needs of Football in NSW: A Partnership Approach (2015) - A REPORT TO THE NSW
GOVERNMENT OUTLINING A FACILITIES INFRASTRUCTURE SOLUTION FOR FOOTBALL
Hockey NSW
Hockey facility guides and templates
Hockey WA
2009-2015 Strategic Facilities Plan
Gymnastics NSW
Facility Strategy (2014)
Page 38
Page | 38
Tennis Australia (TA)
Tennis 2020 Facility development and management framework for Australian tennis
Baseball NSW
Facilities Progress and Future Road Map
Sport New Zealand
National facilities strategy for indoor sports
Commentary
Many sports (at the national and state / territory level) have, or are currently undertaking, some
type of facilities planning, designed to ensure their sport can be sustainable and/or grow into the
future. Having said this, it is apparent that although the majority of these plans / strategies do
focus on the need for sport to partner with various levels of government (largely for funding and
planning matters) in order to enhance and/or grow their facilities footprint, very few focus on the
potential opportunities associated with enhanced partnerships / collaboration with a broader
network of partners (e.g. other sports, schools, universities, TAFE colleges, community /
commercial sport and recreation facilities, etc.) This presents as an opportunity for consideration
when developing the Netball in NSW Facilities Strategy.
3.7 – Other Sport Facility Planning Related Information
NSW Government – Premier’s Priorities
The NSW Government is working to achieve 12 Premier's priorities to grow the economy, deliver
infrastructure, protect the vulnerable, and improve health, education and public services across NSW. These
are:
1. Building infrastructure
2. Tackling childhood obesity
3. Improving education results
4. Protecting our kids
5. Reducing domestic violence
6. Reducing youth homelessness
7. Keeping our environment clean
8. Creating jobs
9. Improving government services
10. Driving public sector diversity
11. Faster housing approvals
12. Improving service levels in hospitals
Page 39
Page | 39
NSW 2021
NSW 2021 - “A plan to make NSW number one” is the state government’s 10-year plan to rebuild the
economy, provide quality services, renovate infrastructure and strengthen the local environment and
communities. NSW 2021 is a plan for change with 32 goals and 180 targets, and the government is working
with community and business to respond to the challenges and opportunities faced, and to achieve the goals
that have been set.
The plan includes 4 strategic priority areas and various objectives (refer below):
PRIORITY AREA OBJECTIVE
HEALTH - Improve outcomes for mental health.
- Keeping people healthy and out of hospital.
- Reduce overweight and obesity rates.
COMMUNITIES - Enhance cultural, creative, sporting and recreational opportunities.
- Make it easier for people to be involved in their communities.
POLICE AND
JUSTICE
- Prevent and reduce the level of crime.
- Pre and reduce the level of re-offending.
EDUCATION - Improve education and learning outcomes for all students.
Commentary
Netball’s appeal as the most popular female sport in NSW makes it a vehicle to support the
development of healthy, safe and inclusive communities, providing improved social, health,
educational and cultural outcomes for all.
The Netball in NSW Facilities Strategy can and should provide Netball in NSW with the opportunity
to align its growth related activities with those of the State Government, enhancing the
achievement of aligned goals in a number of key areas.
Using netball as a key enabler for the achievement of aligned NNSW and state government goals,
will also help justify state government and LGA involvement in the future provision / enhancement
of Netball facilities throughout NSW.
NA and its MOs are already very active in many of the “NSW 2021” focus areas listed above (e.g.
the NA partnership with Our Watch to help drive nation-wide change in the culture, behaviours
and attitudes amongst our sporting communities that lead to violence against women and their
children, the Confident Girls Foundation, One Netball inclusion initiatives, and many others), and
these aligned areas of mutual interest and benefit should be proactively promoted as often as
possible (including within the Netball in NSW Facilities Strategy) to demonstrate whole of
community benefits delivered via the delivery netball in all its forms in NSW.
Page 40
Page | 40
Greater Sydney Commission - District Plans
District Plans are a fundamental way to manage Sydney’s smart growth. They are the link between the State
Government’s Greater Sydney Region Plan – A Plan for Growing Sydney – and councils’ Local Environmental
Plans.
The Greater Sydney Commission has put on public exhibition the first ever 20 year draft District Plans, one for
each of Greater Sydney’s six Districts. The goal of these Plans is to have well‐coordinated, integrated and
effective planning for land use, transport and infrastructure.
The draft District Plans set out the opportunities, priorities and actions and provide the means by which the
Greater Sydney Region Plan, A Plan for Growing Sydney can be put into action at a local level.
NSW Regional Plans There are 10 regional governmental areas across NSW with plans in various stages of development. Regional
plans are being developed to plan for future population of NSW needs for housing, jobs, infrastructure and a
healthy environment.
Commentary
The Greater Sydney Commissions District Plans provides a fantastic opportunity to align
metropolitan population growth planning for NSW with the planning for netball’s growth in
metropolitan NSW (i.e. as it relates to land use and infrastructure).
The 6 Sydney districts all sit within Region 1 within the NNSW boundary structure.
The NNSW delivery and governance structure incorporates 7 non-metropolitan regions (in
addition to Sydney Metropolitan region), whereas there are 10 regional areas identified by the
NSW government (refer below). A strategic and operational alignment between NSW government
regional boundaries and NNSW regional boundaries, within the Netball in NSW Facilities Strategy,
may be beneficial and will be investigated in future stages of the project.
NSW Government Regions NNSW Regions
- Central Coast - Hunter
- Central West and Orana - West Central West
- Far West - West Central West
- Hunter - Hunter
- Illawarra-Shoalhaven - South Coast
- Metropolitan Sydney - Sydney Metropolitan
- New England North West - Northern Inland
- North Coast - North Coast & Far North Coast
- Riverina-Murray - Riverina
- South East and Tablelands - South Coast
Page 41
Page | 41
NSW Government – Future Needs of Sport Infrastructure Study (2015/16)
The Future Needs of Sport Infrastructure Study (FNOSIS) provides a framework for future NSW Government
investment and policy decisions in relation to community sport and active recreation infrastructure. FNOSIS is
an ongoing study that includes data from State Sporting Organisations and Councils regarding their sporting
facility priorities. It also includes information from State Sporting Organisations regarding their facilities used
for competition purposes.
A core objective of the study, was (and continues to be) to identify areas of common need / interest between
State Sporting Organisations and LGAs (i.e. in the case of netball, where NNSW and LGAs both identified facility
development / improvement projects in specific catchments).
Existing Facilities
In 2015, NNSW identified 119 existing competition venues for the sport of Netball in NSW.
27 of these facilities are in the Sydney metropolitan region, of which 13 are located in Greater Western
Sydney.
92 of these facilities are located in Regional areas of NSW.
In 2015, NNSW only identified 1 competition venue as being able to host competitions at a higher level
than local – this venue being Coronation Park in Campbelltown. The highest level of competition possible
at the remaining 118 venues at the time, was identified as “Local”.
NSW Councils which listed Netball projects for FNOSIS 2015/16
1. Armidale Dumaresq – lighting, additional seats, clubhouse extensions - Lynches Road Netball Courts
2. Blayney – Stillingfleet netball facility – new playing surface for 3 netball courts and lighting upgrade
3. Blue Mountains – upgrade Lapstone Netball Courts
4. Bogan – upgrades and improvements to Larkin Oval
5. Cabonne – installation of a multipurpose sports surface in Molong
6. Camden – Narellan Sports Hub, including netball
7. Campbelltown – indoor/outdoor sports precinct
8. Coffs Harbour – floodlighting at Vost Park
9. Conargo – upgrade power, replace cool room, upgrade toilets and change rooms, resurface courts at
Blighty Recreation Reserve (Note: Conargo and Deniliquin Councils have amalgamated to form the
new Edward River Council)
10. Cowra – Col Stinson Park – pave courts and canteen awning
11. Gosford – Adcock Park – construct one multipurpose building
12. Greater Taree – upgrade floodlights at Old Bar
13. Hills Shire – construction of indoor Netball facility at Commercial Road Netball Complex, Rouse Hill; improve
car access, car parking and court surface
14. Hunters Hill – resurface Netball courts at Boronia Park, improve lighting
Page 42
Page | 42
15. Hurstville – Penshurst Park and Jubilee Park
16. Jerilderie – replacement of two Netball courts, upgrade lighting, fencing at Monash Oval
17. Kyogle – construct indoor sports complex
18. Lachlan – Lake Cargelligo foreshore irrigation
19. Lake Macquarie – two new Netball courts at Jack Stewart Netball Courts; new Netball courts at Gibson
Field Netball Courts; new Netball courts and amenities at Cameron Park
20. Leichhardt – for new Netball courts and amenities (Note: Leichhardt, Ashfield and Marrickville Councils
have amalgamated to form the new Inner West Council)
21. Lockhart – lights and change rooms at Lockhart Recreation Ground; interchange shelters and BBQ facilities
at The Rock Recreation Ground; resurface Netball courts at Osborne Recreation Ground
22. Maitland – resurface Netball courts; construction of amenities at Maitland Park
23. Nambucca – establish two multiuse courts
24. Narrandera – seating and shelters for outdoor courts at Barellan and Narrandera
25. Penrith – Gipps Street Community Park, Claremont Meadows
26. Penrith – installation of four floodlit Netball courts at Jamison Park
27. Richmond Valley – construction of a multi-purpose indoor sports stadium at Colley Park
28. Shoalhaven – construction of indoor sports centre
29. Uralla – construct new clubhouse and lighting at Uralla Sporting Complex
30. Waverley – improve courts at Dickson Park
31. Willoughby – Gore Hill Indoor Sports Centre, Willoughby Leisure Centre
32. Wyong – indoor facility at Tuggerah Regional Sporting Complex, Tunkawallin Netball Courts (two
multipurpose courts to be built)
Facility projects identified by NNSW within FNOSIS 2015/16
Project Project Description Priorit
y Total Project
Cost LGA Classification
BLACKTOWN NETBALL
ASSOCIATION –
NEW VENUE
Relocate the Blacktown Netball Association to Reserve
980 within the Schofields precinct of the Northwest
Growth Centre.
1 $0 Blacktown Metropolitan
Small Single Sport
NORTHERN SUBURBS NETBALL
ASSOCIATION –
INDOOR COURTS
A new multi-purpose facility to house a number of sports
including netball in the Gore Hill park area at Willoughby
City Council.
This facility is proposed to be an extension to the Gore Hill
Oval and will offer a significantly spatial indoor
venue for a number of sports.
1 $30,600,000 Willoughby Metropolitan
Multi-Sport
Page 43
Page | 43
Project Project Description Priority Total Project
Cost
LGA Classification
MAITLAND NETBALL
ASSOCIATION –
CONSTRUCTION OF NEW
MULTIPURPOSE AMENITY BUILDING
The project involves the construction of a new amenity building for Maitland District Netball Association. The new
building will incorporate:
- Male, female & accessible toilets; - Kiosk;
- Change rooms; - Storage areas;
- Community meeting area and office area;
- First aid room; - Umpires Room;
- Undercover outdoor area.
1 $1,600,000 Maitland Regional
Small Single Sport
NEWCASTLE NETBALL
ASSOCIATION –
NEW INDOOR VENUE
A new indoor netball facility to incorporate the following
infrastructure; 2 international size indoor timber
floor netball courts, toilet facilities for male, female and
disabled persons, amenities area and tiered aluminium seating for
560 spectators.
The proposal is for a 2 court indoor facility on the grounds of Newcastle High School which is adjacent to the National Park
netball courts. The facility would be governed by a deed of
agreement between the Dept. of Education and Newcastle Netball
Association Inc. The Hunter Academy of Sport also has its
offices adjacent to the courts on National Park.
2 $1,640,100 Newcastle Regional
Significant Single Sport
KIAMA NETBALL
ASSOCIATION –
COURTS
This project proposes to demolish and fully reconstruct
the existing sub-standard playing surface on Kiama's 7
outdoor netball courts with resolution
of drainage issue. This includes supply of new
asphalt, installation of the Netball Australia
approved plexipave surface, netball posts and line marking.
2 $747,090 Kiama Regional
Small Single Sport
Page 44
Page | 44
Commentary
Only 2 of the 32 netball facility projects identified by NSW Councils within FNOSIS 2015 align with
facility projects identified by NNSW within FNOSIS 2015 – i.e:
- Maitland – resurface Netball courts; construction of amenities at Maitland Park; and
- Willoughby – Gore Hill Indoor Sports Centre, Willoughby Leisure Centre.
Of the 5 infrastructure projects identified by NNSW within FNOSIS 2015, 4 were single use facilities
and 1 was a multi-sport facility.
The process used by NNSW to identify and prioritise its facility related projects within FNOSIS 2015
and the level of interaction NNSW has with LGAs in the facility space is unknown and these
matters will be investigated in future stages of this project.
It is understood that the NSW Office of Sport and Recreation is working with SSOs and LGAs in
relation to ongoing FNOSIS data and will do so on an annual basis to ensure currency of
information and priorities. The provision of 2017 data and priorities from SSOs and LGAs to the
NSW government, was due by 31 April 2017. At the time of writing, it is understood that NNSW
is yet to provide this information to State Government, however, the NSW Office of Sport and
Recreation has provided NNSW with an extension, in order to allow the full Netball in NSW
Facilities Strategy to be provided to State Government once completed.
It is understood that the NNSW & LGA identified clubhouse facility for the Maitland Netball
Association was completed in 2016; however it also seems the court resurfacing project identified
by the Maitland LGA, for Maitland Netball Association, is yet to be completed. This will be
confirmed in future stages of the project.
Page 45
Page | 45
Sport Facility Data and Spatial Mapping
At present, in Australia there is no national central database where information about sporting facilities is
captured. The Australian Bureau of Statistics does provide some information about sports facility usage, but
not enough is known about the location, age, maintenance status, and usage pattern of facilities to underpin
a comprehensive National Sports Facility Planning Strategy. Having comprehensive data on the capacity,
location, age, state of repair, and function of Australia’s sporting facilities would be an advantage in planning
for current demand and future needs. Such data could be used at all levels of government, by sporting and
community organisations, and by private enterprise.
Knowing the long-term growth potential for participation in key sports is an essential element in planning for
future needs. Data being gathered by the Australian Bureau of Statistics, the Australian Sports Commission,
and academic institutions regarding participation rates, and more importantly participation trends, shape our
estimates of future demands for facilities. However, the nature of sport participation in Australia (as in many
countries) is changing. New sports are emerging and some established sports are declining in popularity. Our
definition of sport is becoming broader and the distinction between ‘organised’ and ‘social sport’ is becoming
less clear.
It is impossible to predict exactly how sports (overall) will change to meet future challenges, and this makes
national cross-sport facility planning difficult.
Commentary
Although the aforementioned is the case, great work is being done by the Australian Sports
Commission, various State Departments of Sport and Recreation, universities, sporting
organisations and other agencies in the space – e.g. the geographic information system (GIS)
data, the Sport and Recreation Spatial project operating in Victoria and NSW Globe (refer below).
Sport Geographic Information System
The geographic information system (GIS) data presented in the Clearinghouse for Sport includes locations and
descriptions of sports facilities within the state of Victoria. This coverage will be progressively expanded over
time to include all jurisdictions across Australia. Coverage will also include other sport related data-sets, such
as population and sports participation data, to assist in developing further insights about sport in Australia.
The GIS data allows the end-user to filter by sport and to drill down to see where facilities are located, who
owns the facility, what type of facilities are on site, who uses the facilities, contact details, etc.
Source:
https://www.clearinghouseforsport.gov
.au/knowledge_base/gis_sports_data
Page 46
Page | 46
An example of the information presented for each “pinned” netball facility in Victoria, is presented below:
Tarwin Lower Recreation Reserve
LGA Name - South Gippsland Shire Council
Street Name - Walkerville
Street Type - Road
Suburb - Tarwin lower
Postcode - 3956
VicRoads Ref - 102 G5
Facility Ownership - State Government Owned
Facility Category - A local facility that serves a small rural locality, township, neighbourhood or
suburb
Sports
Australian Rules
Equestrian
Netball
Netball
Number fields courts - 2
Field surface type- Asphalt
Age of facility- 6 - 10 years
Condition of facility - Average
Facility features
Canteen / kiosk
Community meeting area
Cricket practise nets
Flood lighting (50 - 99 lux)
Liquor license / bar
Sports pavilion / clubrooms
Toilets (outdoor - public)
Toilets (within sports pavilion / clubrooms)
Sport and Recreation Spatial
Sport and Recreation Spatial is a joint project by Victoria University (Institute of Sport, Exercise and Active
Living – ISEAL), Federation University, VicHealth, Victorian Government (Department of Community
Development and Planning), VicSport, the Australian Sports Commission, and several Victorian State Sporting
Organisations (including Netball Victoria). Sport and Recreation Spatial integrates data about sport and
recreation participation, population demographics, and population health from multiple data sources and
overlays this data with sport and recreation facility information for Victoria.
Page 47
Page | 47
Sport and Recreation Spatial allows sport and recreation delivery agencies to make evidence based decisions
relating to future facility provision and sport delivery activities, in real time and on multiple layers. Visit the
links below to view 2 short video presentations demonstrating the functionality of the system.
Sport and Recreation Spatial Documentary
Sport participation data demonstration
NSW Globe
NSW Globe is a free and easy way to view NSW Government spatial data. Using Google's familiar search and
mapping functionality, you can navigate through medium to high-resolution imagery and elevation data, and
imagery datasets covering past and present emergency events for flood and fire. Data / information to come
from FNOSIS 2015 / 16 (and ensuing years), is embedded in NSW Globe.
Commentary
The information available to sporting organisations, government agencies and others, in relation
to sport and recreation participation patterns in specific areas and activities (and by age,
socioeconomic status, gender, ethnicity, etc.) is extremely impressive and will allow funding
agencies, facility developers and sporting organisations to work collaboratively, based on
evidence, to ensure facility availability meets future sport and recreation growth targets.
Following this Netball in NSW Facilities Strategy project, opportunities to update the Sport
Geographic Information System on the Clearing House for Sport to include “Netball in NSW”, to
extend the reach of the Sport and Recreation Spatial project to include “Netball in NSW” and/or
to work with relevant NSW agencies to develop a NSW equivalent of Sport and Recreation Spatial,
are all opportunities to be explored.
Page 48
Page | 48
Section 4 – NNSW Membership and Participation
Analysis: Findings Summary
4.1 NNSW Membership and Participation Data: Total per Region
4.3 Netball Australia Membership and Participation Growth Targets
4.4 NNSW Membership and Participation Growth Targets
4.1 – NNSW Membership and Participation Data: Total per Region
105856105360
106165
109151
111474112401 112260
113030
114872114088
100000
102000
104000
106000
108000
110000
112000
114000
116000
2007 2008 2009 2010 2011 2012 2013 2014 2015 2016
NNSW Overall Membership Growth10 years (2007-2016)
2728228504 29629
3124632496 32767 32380 32349
33700 33004
0
5000
10000
15000
20000
25000
30000
35000
40000
2007 2008 2009 2010 2011 2012 2013 2014 2015 2016
NNSW Senior Player Membership Growth10 years (2007-2016)
Page 49
Page | 49
0
10000
20000
30000
40000
50000
60000
70000
80000
2007 2008 2009 2010 2011 2012 2013 2014 2015 2016
NNSW Junior Player Membership Growth10 years (2007-2016)
Junior* NetSetGO*
58845
17567
7830
2930
7233
3209
4039
8185
53608
16872
6432
2905
6956
3521
3647
6847
0 10000 20000 30000 40000 50000 60000 70000
Sydney Metro
Hunter
West / Central West
Far North Coast
South Coast
Northern Inland
North Coast
Riverina
NNSW Total Playing Membership by Region10 Years (2007 - 2016)
Total Playing Membership 2007 Total Playing Membership 2016
Page 50
Page | 50
Commentary
There has been a slight increase in overall and senior membership over the past decade, and
junior membership (or equivalent) has remained static. Note: Between 2007 and 2016 the total
NSW population increased by approximately 800,000, from 6.89 million to 7.7 million (i.e. an 11%
increase). NNSW total membership increased from approximately 106,000 in 2007 to 114,000 in
2016. This equates to a 7.5% increase in membership over this period.
Although NNSW total membership has grown slightly less than the increase in NSW population
over the past decade, as a sport, Netball in NSW is in a somewhat envious position in comparison
to many other sports. This position presents as a great foundation from which to significantly
increased membership / participation in netball throughout NSW over the coming decade.
Total membership between 2007 and 2016 has only decreased in 1 region (i.e. Northern Inland).
Prior to 2013, Junior and NetSetGo participant numbers were combined under “Junior”.
Commentary
All abilities netball (i.e. netball for people with a disability) presents as an amazing growth
opportunity for NNSW to explore. Note: Any growth in the market segment may have implications
for future facility planning and development which should be considered within the Netball in
NSW Facilities Strategy.
143
106 110
166 166 160172
193 195
212
0
50
100
150
200
250
2007 2008 2009 2010 2011 2012 2013 2014 2015 2016
NNSW Players with Disabilities / All Abilities Membership Growth 10 years (2007-2016)
Page 51
Page | 51
Commentary
If the NNSW membership / participation base is to grow over the coming decade, this will require
the size and nature of the non-playing membership (largely coaches and umpires) to grow in
alignment with the growth in players. This will be a matter for consideration within future NNSW
Game Development planning.
50394954
5095
5207
55295579 5592
56845632 5597
4400
4600
4800
5000
5200
5400
5600
5800
2007 2008 2009 2010 2011 2012 2013 2014 2015 2016
NNSW Non-Player Membership Growth10 years (2007-2016)
Page 52
Page | 52
4.3 – Netball Australia Membership and Participation Growth Targets
The summary of the NA 2016-2019 Strategic Plan reviewed as part of this project does not include any
quantitative membership / participation growth targets.
4.4 – NNSW Membership and Participation Growth Targets
The current NNSW strategic summary reviewed as part of this project does not include any quantitative
membership / participation growth targets. As already noted within this Paper, a single, integrated
Participation Growth Strategy for Netball in NSW does not appear to be in existence (and this no doubt
presents as an opportunity for NNSW to explore). As such, quantitative membership / participation growth
targets have not been identified at this stage of the project.
Commentary
If NA and/or NNSW have quantitative membership / participation growth targets between 2018
and 2028 (i.e. the projected lifecycle of the Netball in NSW Facilities Strategy) these will need to
be investigated in future stages of the project. This information is critically important, due to the
importance of understanding how much both organisations plan to increase their membership /
participation numbers over the coming decade and the impact this would have on the size and
nature of the netball facilities footprint in NSW if these targets are achieved.
4.5 – AUSPLAY Results
Page 53
Page | 53
Commentary
Netball is identified as the 6th most popular organised sport or physical activity for children in
Australia. This is a very positive result, however, as always, the opportunity exists for the sport to
climb up this list.
Page 54
Page | 54
Section 5 –
Population Analysis: Findings Summary
5.1 Current Population: Total per NSW LGA
5.2 Future Population Projections: Total per NSW LGA
5.3 Identification of NSW Population Growth Areas and LGA Identified Netball Facility Priorities
5.1 – Current Population: Total per NSW LGA
5.2 – Future Population Projections: Total per NSW LGA
In 2016, the NSW Department of Planning and Environment published population projections for NSW Local
Government Areas (LGAs) for the 25 year period between 2011 and 2036.
Reference: http://www.planning.nsw.gov.au/projections
Page 55
Page | 55
In the course of assessing NSW LGA population data and projected population growth areas, MSC has used
the following websites to map NSW Government LGAs to NNSW affiliated Associations.
http://nsw.netball.com.au/inside-netball-nsw/associations/
http://www.olg.nsw.gov.au/find-my-council
Where an LGA in the following table is shaded blue, NNSW has a currently affiliated association in the LGA
area. Where an LGA is shaded pink, NNSW does not have a currently affiliated association in place.
Table 5.1 – Projected Population Growth (2011 – 2036)
Sydney Metropolitan LGAs 2011 2016 2026 2036 Total % Change
LGA Identified Netball Project (FNOSIS 2015)*
Blacktown (C) 312,350 349,050 433,500 521,450 66.9% No
Blue Mountains (C) 78,550 82,000 84,700 90,400 15.1% YES
Botany Bay (C) 41,500 48,450 65,000 72,700 75.2% No
Burwood (A) 34,200 38,850 49,150 57,500 68.3% No
Camden (A) 58,450 80,900 147,850 224,550 284.2% YES
Campbelltown (C) 151,150 164,400 197,000 233,150 54.2% YES
Canada Bay (A) 80,050 90,850 103,900 122,900 53.5% No
Canterbury-Bankstown 335,950 360,350 426,900 502,850 49.7% No
Cumberland 203,050 217,450 254,350 292,450 44.0% No
Fairfield (C) 196,500 206,250 216,800 226,700 15.4% No
Georges River 141,750 151,300 167,450 182,100 28.5% YES
Hawkesbury (C) 64,350 67,800 74,800 85,050 32.2% No
Hornsby 143,350 149,650 164,650 178,100 24.3% No
Hunters Hill (A) 13,900 14,500 14,800 15,750 13.2% YES
Inner West 180,300 190,500 210,700 232,100 28.7% YES
Ku-ring-gai (A) 114,600 123,500 138,200 154,500 34.8% No
Lane Cove (A) 33,250 37,350 43,750 52,300 57.4% No
Liverpool (C) 188,100 214,100 274,800 331,000 76.0% No
Mosman (A) 29,350 30,350 31,150 32,250 9.9% No
North Sydney (A) 66,750 72,150 81,600 91,650 37.3% No
Northern Beaches 251,700 263,700 278,000 297,950 18.4% No
Parramatta 203,100 238,850 338,000 416,750 105.2% No
Penrith (C) 184,600 205,150 237,500 270,750 46.7% YES x 2
Randwick (C) 137,800 146,250 155,350 180,150 30.7% No
Rockdale (C) 103,500 114,450 135,200 155,450 50.2% No
Ryde (C) 108,700 119,950 148,750 171,650 57.9% No
Strathfield (A) 37,250 41,250 55,900 64,900 74.2% No
Sutherland Shire (A) 220,250 229,500 243,550 260,400 18.2% No
Sydney (C) 183,300 212,550 267,500 315,200 72.0% No
The Hills 147,950 165,550 225,150 290,900 96.6% YES
Waverley (A) 68,700 72,250 75,350 77,300 12.5% YES
Willoughby (C) 71,150 75,450 80,700 88,650 24.6% YES
Wollondilly (A) 44,600 49,350 57,350 72,600 62.8% No
Woollahra (A) 56,300 57,800 58,450 59,850 6.3% No
Page 56
Page | 56
Regional NSW LGAs 2011 2016 2026 2036 Total % Change
LGA Identified Netball Project (FNOSIS 2015)*
Albury (C) 49,450 52,100 56,550 59,850 21.0% No
Armidale Regional 29,700 31,500 35,200 38,600 30.1% YES
Ballina (A) 40,750 42,100 44,300 45,850 12.5% No
Balranald (A) 2,350 2,250 2,150 2,100 -11.6% No
Bathurst Regional (A) 39,950 43,300 49,550 55,250 38.2% No
Bega Valley (A) 33,150 34,000 35,650 36,650 10.6% No
Bellingen (A) 12,900 13,050 13,100 12,850 -0.4% No
Berrigan (A) 8,300 8,400 8,200 7,800 -6.2% No
Bland (A) 6,000 5,800 5,350 4,850 -19.8% No
Blayney (A) 7,200 7,450 7,750 8,000 10.9% YES
Bogan (A) 3,000 2,950 3,000 3,100 2.4% YES
Bourke (A) 3,050 3,000 3,050 3,100 1.4% No
Brewarrina (A) 1,850 1,900 1,900 1,850 -1.8% No
Broken Hill (C) 19,150 18,700 17,600 16,150 -15.7% No
Byron (A) 30,700 32,400 35,250 37,950 23.5% No
Cabonne (A) 13,200 13,850 15,600 17,200 30.2% YES
Carrathool (A) 2,700 2,600 2,400 2,150 -19.5% No
Central Coast 322,650 339,550 374,900 415,050 28.6% YES x2
Central Darling (A) 2,050 2,100 2,150 2,150 4.7% No
Cessnock (C) 52,500 56,100 63,550 69,250 32.0% No
Clarence Valley (A) 51,300 52,800 55,800 57,450 12.0% No
Cobar (A) 4,900 4,800 4,550 4,150 -15.1% No
Coffs Harbour (C) 70,950 75,850 84,800 92,650 30.6% YES
Coolamon (A) 4,250 4,200 4,200 4,050 -4.1% No
Coonamble (A) 4,250 4,050 4,000 4,000 -5.2% No
Cowra (A) 12,500 12,350 11,750 10,900 -13.0% YES
Dungog (A) 8,550 8,750 8,950 8,950 4.9% No
Edward River 8,900 8,650 8,100 7,450 -16.1% YES
Eurobodalla (A) 37,100 38,400 40,200 40,600 9.4% No
Federation 12,500 12,650 12,650 12,450 -0.5% No
Forbes (A) 9,450 9,400 9,100 8,550 -9.7% No
Gilgandra (A) 4,500 4,450 4,200 3,850 -14.7% No
Glen Innes Severn (A) 8,900 8,800 8,450 7,850 -11.8% No
Goulburn Mulwaree (A) 28,350 29,750 32,350 34,400 21.4% No
Greater Hume Shire (A) 10,050 10,250 10,350 10,200 1.4% No
Griffith (C) 25,400 25,950 26,350 26,150 2.9% No
Gundagai 11,300 11,250 10,800 10,100 -10.7% No
Gunnedah (A) 12,500 12,800 13,300 13,600 8.7% No
Gwydir (A) 5,100 5,000 4,550 4,000 -21.8% No
Hay (A) 3,100 2,850 2,550 2,300 -24.7% No
Hilltops 18,800 19,150 19,350 19,050 1.4% No
Inverell (A) 16,600 17,300 18,450 19,300 16.4% No
Junee (A) 6,150 6,200 6,150 5,850 -4.3% No
Kempsey (A) 29,150 29,800 30,700 30,850 5.9% No
Page 57
Page | 57
Regional NSW LGAs (cont) 2011 2016 2026 2036 Total % Change
LGA Identified Netball Project (FNOSIS 2015)*
Kiama (A) 20,800 22,150 24,700 27,100 30.3% No
Kyogle (A) 9,550 9,600 9,650 9,550 0.1% YES
Lachlan (A) 6,700 6,450 5,850 5,150 -22.9% YES
Lake Macquarie (C) 196,800 202,350 214,800 226,800 15.2% YES
Leeton (A) 11,400 11,750 11,900 11,700 2.5% No
Lismore (C) 44,350 46,200 49,350 51,750 16.7% No
Lithgow (C) 20,850 21,100 21,100 20,450 -2.0% No
Liverpool Plains (A) 7,750 7,800 7,950 7,900 1.8% No
Lockhart (A) 3,100 3,000 2,800 2,550 -17.6% YES
Maitland (C) 69,900 78,200 93,500 104,850 50.0% YES
Mid-Coast 88,800 91,250 94,850 96,250 8.4% YES
Mid-Western Regional (A) 23,000 24,050 25,250 26,000 12.8% No
Moree Plains (A) 14,050 13,750 12,650 11,100 -20.9% No
Murray River 11,250 11,550 12,100 12,400 10.2% No
Murrumbidgee 3,900 3,700 3,400 3,150 -18.7% YES
Muswellbrook (A) 16,350 17,150 18,800 20,300 24.4% No
Nambucca (A) 19,250 19,800 20,550 20,850 8.5% YES
Narrabri (A) 13,450 13,400 13,100 12,400 -7.6% No
Narrandera (A) 6,100 5,950 5,450 4,800 -21.8% YES
Narromine (A) 6,850 6,800 6,600 6,200 -9.6% No
Newcastle (C) 155,550 165,050 183,450 198,350 27.5% No
Oberon (A) 5,200 5,250 5,150 4,900 -5.6% No
Orange (C) 39,400 41,600 45,450 48,750 23.7% No
Parkes (A) 15,100 15,250 15,600 15,700 4.2% No
Port Macquarie-Hastings (A) 75,250 79,650 87,900 94,700 25.9% No
Port Stephens (A) 67,200 74,100 84,950 92,650 37.9% No
Queanbeyan-Palerang Regional 54,850 61,150 73,550 86,200 57.2% No
Richmond Valley (A) 22,700 23,550 24,850 25,650 12.9% YES
Shellharbour (C) 66,200 71,150 81,100 90,500 36.6% No
Shoalhaven (C) 96,200 99,600 105,550 109,700 14.0% YES
Singleton (A) 23,500 24,700 26,800 28,600 21.6% No
Snowy Monaro Regional 20,400 20,750 21,300 21,550 5.7% No
Snowy Valleys 14,750 14,600 14,150 13,400 -9.1% No
Tamworth Regional (A) 58,250 61,400 66,700 71,050 22.0% No
Temora (A) 5,950 5,850 5,550 5,100 -14.5% No
Tenterfield (A) 7,000 7,150 7,250 7,150 2.3% No
Tweed (A) 88,450 94,450 105,450 115,350 30.4% No
Upper Hunter Shire (A) 14,200 14,700 15,600 16,200 13.9% No
Upper Lachlan Shire (A) 7,400 7,500 7,500 7,400 -0.2% No
Uralla (A) 6,250 6,350 6,500 6,550 5.1% YES
Wagga Wagga (C) 61,800 65,850 72,650 77,950 26.2% No
Walcha (A) 3,100 3,050 2,850 2,600 -16.2% No
Walgett (A) 6,800 6,650 6,200 5,500 -19.1% No
Warren (A) 2,850 2,800 2,700 2,650 -8.1% No
Page 58
Page | 58
Regional NSW LGAs (cont) 2011 2016 2026 2036 Total % Change
LGA Identified Netball Project (FNOSIS 2015)*
Warrumbungle Shire (A) 9,900 9,750 9,300 8,650 -12.5% No
Weddin (A) 3,750 3,600 3,350 3,050 -18.5% No
Wentworth (A) 6,850 6,900 6,850 6,600 -3.4% No
Western Plains Regional 49,100 51,050 54,300 56,600 15.4% No
Wingecarribee (A) 46,150 47,750 50,300 51,800 12.3% No
Wollongong (C) 202,050 211,750 229,250 244,400 20.9% No
Yass Valley (A) 15,600 17,150 20,300 23,400 49.8% No
Unincorporated NSW 1,100 1,150 1,250 1,250 13.2% No
NEW SOUTH WALES TOTAL: 7,218,550 7,748,000 8,844,700 9,925,550 37.5%
Commentary
There are 36 LGAs in which NNSW does not have a currently affiliated association in place. One
element of the NNSW growth mix is the current and future number and location of associations.
This presents as a potential opportunity for NNSW to consider.
*The following section (5.3 – Identification of NSW population growth areas and planned
netball facilities in these areas) provides detail as to the far right hand column in the table above.
5.3 – Identification of NSW population growth areas and planned netball facilities in
these areas
As outlined in Section 3.7 – Other Sport Facility Planning Related Information in this Paper, FNOSIS relates to
the NSW Government’s ongoing Future Needs of Sport Infrastructure Study. 2015 FNOSIS data highlighted 32
x netball related projects, identified as a priority by LGAs at the time. These netball facility priority areas, are
indicated in the table above via the far right-hand column.
MSC will need to check the status of these LGA identified projects, in order to determine where they currently
stand, in future stages of this project.
It is important to note, that since FNOSIS data was collected in 2015, there has been a restructuring of a
number of regional and metropolitan NSW Local Government areas. As required, LGA identified netball facility
priorities have been recorded against the new LGA. Again, the status of these identified projects will need to
be determined in future stages of the project.
Local Government Projects
Page 59
Page | 59
Section 6 –
NSW Netball Facility Hierarchy Development
The purpose of creating a facility hierarchy within the Netball in NSW Facilities Strategy is to provide a guide
for the type of facility needed to meet the needs of the catchment; and to assist in creating an approach to
guide effective facility maintenance of current netball facilities, as well as the development of appropriate
new facilities. The classification of facilities within the Strategy will limit facility duplication, inform the criteria
and partnerships required to develop / re-develop a successful and sustainable facility, as well as influencing
the maintenance, design, cost and service mix.
The Netball in NSW facility hierarchy classification will be used within the Netball in NSW Facilities Strategy to
clarify future facility and investment requirements for the next decade +, in accordance with likely growth
patterns of the sport. It has been developed for the purposes of providing guidance on facility requirements
for the various levels of facility and as a means to establish some standards. These standards should be
referenced in the development of new infrastructure and/or the modernisation or replacement of existing
facilities.
Facility Classification NOT included in the proposed NNSW Facilities Hierarchy
Neighbourhood Facilities – i.e. those facilities such as a full / half court with netball post and ring that are
developed in parks. The purpose of these facilities is to provide opportunities for local people wanting to play
a social / unorganised, small sided game. These types of facilities should always be planned for in active
recreation areas of parks. It is highly unlikely local government and/or state government will contact NNSW
or associations seeking their endorsement for the development of a neighbourhood level netball facility.
International Facilities (including facilities which host Suncorp Super Netball fixtures in NSW – e.g. Sydney
Olympic Park Sports Centre and Qudos Bank Arena) are not a classification within the NNSW Facilities
Hierarchy. Facilities at which international (and the majority of Super Netball) matches are played in NSW may
vary over time and are not likely to be dedicated netball venues and as such may not be managed by NNSW.
The major reason international (and the majority of Super Netball) matches are played at these facilities is
because “state / national” level facilities will not have the seating capacity to cater for the anticipated
spectator demand. These facilities should be multi-use and designed to cater for higher yielding activities, yet
remain affordable for NNSW / NA to hire and should not be reliant upon netball use to support their business
plans. Netball in NSW is also well positioned in relation to access to international standard facilities.
The facility hierarchy to be contained within the Netball in NSW Facilities Strategy may not specify court
numbers, as there may be situations where “local” facilities have 10+ courts, yet “district” or “regional”
facilities have less than this. In the case of new courts (of any classification), the number of courts to be
developed should be based on a needs assessment, feasibility study and business case, regardless of hierarchy
classification.
Page 60
Page | 60
In broad terms, the proposed Netball in NSW facility hierarchy classifications are below.
Table 6.1 – Netball in NSW facility hierarchy classifications
Classification Netball Activities Guide
Local
(e.g. 1-4 outdoor
courts - TBC)
Provides a focus for club training (and sometimes competition), as well as servicing a
local catchment (e.g. a suburb within a single LGA area) to provide a mix of recreational
/ social participation opportunities.
Club training
Inter-club competition if home and away competitions are in place within the
association (which is rare in NSW)
Delivery of modified participation products e.g. NetSetGO, Fast5 netball,
corporate / lunch time / social competitions, others
Delivery of Netball NSW community programs and holiday programs
Local school training / competitions
Community mixed recreational use
District
(e.g. 5-20 outdoor
courts - TBC)
Provides for association competition and training for participants / clubs across a local
geographic catchment, often (but not always) within a single LGA area.
As per Local Facility +
Association championships
District schools championships
NNSW School Cup – local stage
Association representative team training
Regional
(e.g. Over 20
outdoor courts +
at least 3 indoor
courts - TBC)
Provides for association / regional competition and training for a large number of
participants across local and regional geographic catchments, often beyond a single
LGA area.
Regional facilities are best provided at high profile sites in accessible locations with
links to transport modes and/or commercial / community centres and services.
As per District Facility +
District / regional schools championships
NNSW state age championships
NNSW School Cup – regional stage
NNSW State Championships
NNSW Regional League
Regional / state representative team training
State / National
(e.g. At least 4
indoor courts + 1
show court - TBC)
Facilities that have all required facility components and seating capacity to support
State (and identified National) netball competitions or programs.
As per Regional Facility +
Metro League
Premier League
Night Inter-District
National championships (i.e. under 17, 19 and 21)
Australian Netball League
Page 61
Page | 61
Table 6.2 – NNSW facilities composition related to hierarchy (a preliminary guide)
Item Local Facility District Facility Regional Facility State / National Facility Comments
Court Areas Number of courts 1-4 outdoor
5-20 Outdoor Over 20 outdoor courts + at
least 3 indoor courts
At least 4 indoor courts + 1
show court
Court dimensions Compliant Compliant Compliant Compliant Refer section 2.2 – NA
Facilities Policy – Technical
Manual
Run-off dimensions Compliant Compliant Compliant Compliant As above
Court Surface Acrylic, asphalt (outdoor), sprung timber (indoor)
Acrylic, asphalt (outdoor),
sprung timber (indoor)
Acrylic, asphalt (outdoor),
sprung timber (indoor)
Sprung timber (indoor) Double sprung timber floors for National Titles, ANL and
other key events.
Court condition Compliant Compliant Compliant Compliant Refer section 2.2 – NA
Facilities Policy – Technical
Manual
Goal Posts Compliant
Note: NetSetGo adjusted to
2.4m height
Compliant
Compliant Compliant As above
Rings Compliant Compliant Compliant Compliant As above
Goal post padding Compliant Compliant Compliant Compliant As above
Lighting Outdoor - Class 3: 100
average lux: Low
Level/Training. 200 average
lux: Regional/Club/Local
Comp.
Indoor - Class 3 : 300
average lux: Low
level/Training, Class 2 : 500
average lux:
Regional/Club/Local Comp.
Outdoor - Class 3: 100
average lux: Low
Level/Training. 200 average
lux: Regional/Club/Local
Comp.
Indoor - Class 3 : 300
average lux: Low
level/Training, Class 2 : 500
average lux:
Regional/Club/Local Comp.
Outdoor - Class 3: 100
average lux: Low
Level/Training. 200 average
lux: Regional/Club/Local
Comp.
Indoor - Class 3 : 300
average lux: Low
level/Training, Class 2 : 500
average lux:
Regional/Club/Local Comp.
Indoor Lux: 750 Refer section 2.2 and
section 9 – NA Facilities
Policy – Technical Manual.
Multi-lined Yes Yes Yes No Certain competitions may
have rules which restrict
multi-line court use which
will need to be checked.
Page 62
Page | 62
Item Local Facility District Facility Regional Facility State / National Facility Comments
Court Areas Team seating / shelters Required - Minimum
preferred is 20 seats per
court (based on 10 seats per
team).
For outdoor courts 2
covered shelters per court
should be provided
(minimum 2 x 4.5m each)
As per local facility. As per local facility. 2 benches per team to
accommodate 15 people per
bench.
Officials bench 1 bench per court to
accommodate at least 2
people.
Recommend min. 1.2m length bench plus
0.915m for a
wheelchair/standing area.
As per local facility. As per local facility. 1 bench per court to
accommodate at least 5
people.
Recommend min. 3m length plus space for
a wheelchair/standing area (0.915m width x
*1.525m depth m
Officials shelter (outdoor
only)
1 per court preferred As per local facility. As per local facility. - For courts at Local, District and Regional Facilities,
official’s shelters can be combined with team and
spectator shelters to provide one large
multipurpose shelter.
Refer section 9.9 – NA
Facilities Policy – Technical
Manual.
Court fencing If required If required If required N/A Refer section 9.8 – NA
Facilities Policy – Technical
Manual.
Scoring system Outdoor - Flip score boards
to be provided as a
minimum
As per local facility As per local facility. Indoor -
Available on each court.
Needs to be visible to
players and spectators on
the court.
Indoor - Available on each
court. Needs to be visible to
players and spectators on
the court.
Page 63
Page | 63
Item Local Facility District Facility Regional Facility State / National Facility Comments
Amenities and Supporting Infrastructure Player change rooms and
amenities
Minimum 2 rooms – each 20m2 Minimum 2 rooms – each
20m2
Minimum 2 rooms – each
25m2
Minimum 2 rooms – each
30m2
If more than 14 (local and
district) and 20 (regional)
will regularly use the rooms
the size of the rooms may
need to be increased.
Change rooms in regional
and state / national
facilities to ensure home
and away teams are
separated.
Umpire change rooms and
amenities
Minimum 1 x unisex rooms.
1 shower, 1WC and 1 HB in each
room.
Minimum 2 x unisex
rooms.
1 shower, 1WC and 1 HB in
each room.
As per district facility. Minimum 2 x unisex
rooms.
1 shower, 2WC and 1 HB in
each room.
Public Toilets Guide: 2 rooms, min 15m2 each room. Min 2WCs, 2HBs in each
room. Note – require separate disabled
/ parent pubic toilet and male public toilet areas.
Guide: 2 rooms, min 15m2
each room. Min 3WCs,
3HBs in each room.
Note – require separate disabled / parent pubic
toilet and male public toilet areas.
As per district facility.
Change rooms to ensure
home and away teams are
separated.
As per regional facility. Number of change rooms
and toilets will be
dependent on facility size
and as per LGA planning
requirements.
First aid room 1 room - designed to allow for
easy access by ambulance
personnel and equipment i.e.
stretchers
As per local facility. As per local facility. 2 rooms - designed to
allow for easy access by
ambulance personnel and
equipment i.e. stretchers.
Umpire duty room 1 room – minimum 15m2. 1 room – minimum20. 1 room – minimum 25m2. 1 room – minimum 25m2.
Administration office 1 room – minimum 15m2. As per local facility. 1 room – minimum 20m2. As per regional.
Storage Indoor / Outdoor – guide:
minimum 20m2
As per local facility. As per local facility. As per local facility. Size of storage area to be
determined by operational
requirements.
Page 64
Page | 64
Item Local Facility District Facility Regional Facility State / National Facility Comments
Amenities and Supporting Infrastructure Multi-purpose area Recommended minimum area -
50m2. Uses for the space could
include (but may not be limited
to:
- Common/Social/Function
Area
- Education Area for
workshops
- Hospitality area for
members, spectators,
sponsors, etc.
Recommended minimum area
- 100m2. Uses for the space
could include (but may not be
limited to:
- Common/Social/Function
Area
- Education Area for
workshops
Hospitality area for members,
spectators, sponsors, etc.
As per district facility. As per district facility.
Drug testing room N/A N/A Optional - Can be a multi-
purpose area.
Required - Minimum Size
15m2. Can be a multi-
purpose area.
Café/Kiosk/Canteen/
Kitchen
1 room – recommended
minimum 15m2.
As per local facility. As per local facility. As per local facility. Size and nature of the
space to be determined by
operational requirements.
Public address system Access to Public Address System.
Central timekeeping system may
be operated
Permanent installed system.
Central timekeeping system
may be operated
Timekeeping system
should allow each court to
be operated separately.
As per regional facility.
Spectator seating - Preferred minimum seating
spaces for 200 spectators
Preferred minimum
seating spaces for 500
spectators
Preferred minimum
seating spaces for 1000
spectators
Parking As per LGA requirements. As per local facility. As per local facility. As per local facility.
Page 65
Page | 65
Section 7 – NSW Netball Facility Situational and
Supply Analysis
7.1 – Facility distribution, condition and utilisation: By NNSW Region and Association
Facilities Audit e-Surveys were distributed to all 114 NNSW affiliated associations. In total, 78 x Facilities Audit
e-Surveys were completed (i.e. a 68.4% completion rate). Note: Refer to Appendix B for a list of Associations
who completed the NNSW Facilities Audit.
Important Note: The data collected via Facilities Audit e-Surveys was very extensive. It is only feasible to include
essential data in this Preliminary Findings and Opportunities paper, however ALL RAW DATA will be considered
during the course of this project and then made available to NNSW, for future reference / use, as required.
68.4% completion rate
Sydney Metro, 19.2%
Hunter, 20.5%
West / Central West, 12.8%
Far North Coast, 7.7%
South Coast, 12.8%
Northern Inland, 10.3%
North Coast, 10.3%
Riverina, 6.4%
e-Survey Respondents by NNSW Region
Page 66
Page | 66
Commentary
An e-Survey completion rate of almost 70% is very positive, especially due to the extensive nature
of the survey and the time it took respondents to complete it. It is also pleasing to note that
associations from all NNSW regions completed the survey.
As approximately 30% of NNSW associations did not complete the survey, how NNSW goes about
collecting this important information should be addressed in recommendations / actions within
the Netball in NSW Facilities Strategy.
Question – Does your Association have a single venue / facility it uses for all of its NNSW affiliated activities
(i.e. competitions, carnivals, programs, etc)?
Response Percent
Response Count
Yes - One venue / facility is used for our Association's NNSW affiliated activities
82.1% 64
No - In addition to our primary venue, we also regularly access one or more secondary venues for NNSW affiliated activities
12.8% 10
No - In addition to our primary venue, we also occasionally access one or more secondary venues for NNSW affiliated activities
5.1% 4
answered question 78
skipped question 0
Commentary
10 respondents (12.8%) stated their association operates from more than one facility. Detailed
data relating to these secondary / supportive venues has not been collected at this stage. This
issue will be addressed in recommendations / actions within the Netball in NSW Facilities
Strategy.
0 5 10 15 20 25 30
Sydney Metro
Hunter
West / Central West
Far North Coast
South Coast
Northern Inland
North Coast
Riverina
e-Survey Completion Rates within NNSW Regions
Facilities Audit Completed No Response
Page 67
Page | 67
Quick Stats …
Only 18% of respondents (14) were able to confirm their
Association has a documented / formalised annual budget
allocation for facility maintenance & upgrade;
32.5% of respondents (25) confirmed their Association has a
current strategic plan and all but 1 of these associations
confirmed their plan includes “Facilities” and “Membership /
Participation Growth” as strategic priority areas.
80% of respondents feel their Association’s relationship
with their Local Government Authority is either “strong” or
“moderate” ... another 18% feel they have at least some
relationship with their LGA.
Question – Has your Association formally requested NNSW or Government assistance / involvement
relating to a facilities improvement / development initiative at any stage over the past 5 years?
Answer Choice Response
No 27.63% 21
Yes - NNSW assistance requested and supported 7.89% 6
Yes - NNSW assistance requested, but unsuccessful 5.26% 4
Yes - Local Government assistance requested and supported 46.05% 35
Yes - Local Government assistance requested, but unsuccessful 18.42% 14
Yes - State Government assistance requested and supported 22.37% 17
Yes - State Government assistance requested, but unsuccessful 7.89% 6
Yes - Other assistance requested, but unsuccessful 5.26% 4
Yes - Other assistance requested, but unsuccessful 2.63% 2
Total Respondents: 76
Page 68
Page | 68
Commentary
35 respondents (46%) who completed this question, stated that they have requested LGA
assistance in relation to facility improvement / development in the past 5 years and were
successful, whilst 14 respondents (18%) who sought LGA assistance were unsuccessful. This
result should encourage associations to seek LGA support and the development of the Netball in
NSW Facilities Strategy should be a key enabler of this process.
35% of respondents (27) have formalised plans in place to improve
their primary facility over the next 3 years; and
21% of respondents (16) have formalised plans in place to develop
new facilities over the next 3 years.
Question – Is your Association's primary facility accessed for non-NNSW affiliated netball activities?
No, never Yes, occasionally Yes, regularly Unsure Total Respondents
Primary School Sports Carnivals / Gala Days / Training / etc.
6.85% 5
45.21% 33
47.95% 35
0.00% 0
73
High School Sports Carnivals / Gala Days / Training / etc.
10.00% 7
55.71% 39
32.86% 23
1.43% 1
70
University Sports Carnivals / Gala Days / Training / etc.
79.31% 46
5.17% 3
8.62% 5
6.90% 4
58
Non-affiliated Social Competitions / Carnivals
55.74% 34
24.59% 15
13.11% 8
6.56% 4
61
Non-affiliated Competitive Events (i.e. Masters Games)
89.09% 49
5.45% 3
7.27% 4
0.00% 0
55
Other non-affiliated netball activity
53.70% 29
24.07% 13
11.11% 6
11.11% 6
54
Commentary
The use of association facilities for non-affiliated netball activity is relatively low. Associations
looking to maximise the use of their facilities in “off-peak” times, presents as an opportunity for
associations to demonstrate to state and local government (and to NNSW) the need for their
facilities to be enhanced / expanded. Without high level facility usage, the need for new /
additional / enhanced facilities will be limited. This type of activity also presents as an
opportunity for associations to increase their linkages with their local community and in-turn,
increase visibility, participation / membership, revenues, relevance and viability.
Page 69
Page | 69
Question – Which of the following netball activities does your Association deliver and where?
Our Assn's primary facility
Our Assn's secondary facility / facilities
Indoor Sports Centre
School/s Local University
Other venue N/A Total Respondents
NNSW Affiliated Junior Competitions
93.15% 68
6.85% 5
2.74% 2
2.74% 2
0.00% 0
4.11% 3
2.74% 2
73
NNSW Affiliated Senior Competitions
90.14% 64
4.23% 3
7.04% 5
2.82% 2
0.00% 0
4.23% 3
2.82% 2
71
NNSW Affiliated Masters Competitions
11.76% 4
0.00% 0
0.00% 0
0.00% 0
0.00% 0
0.00% 0
88.24% 30
34
NetSetGo 95.89% 70
9.59% 7
0.00% 0
2.74% 2
0.00% 0
1.37% 1
0.00% 0
73
Fast 5 20.00% 7
0.00% 0
0.00% 0
0.00% 0
0.00% 0
0.00% 0
80.00% 28
35
All Abilities Netball
39.47% 15
0.00% 0
0.00% 0
0.00% 0
0.00% 0
0.00% 0
60.53% 23
38
Other NNSW Affiliated Competitions / Events
73.47% 36
6.12% 3
0.00% 0
0.00% 0
0.00% 0
2.04% 1
20.41% 10
49
Non-Affiliated Social Competitions
12.12% 4
0.00% 0
3.03% 1
3.03% 1
0.00% 0
0.00% 0
81.82% 27
33
Non-Affiliated School Competitions
65.22% 30
4.35% 2
2.17% 1
2.17% 1
0.00% 0
0.00% 0
28.26% 13
46
Other Non-Affiliated Netball Activities
25.81% 8
3.23% 1
3.23% 1
0.00% 0
0.00% 0
0.00% 0
67.74% 21
31
Commentary
Association’s use of netball facilities other than their own facility (primary of secondary) is very
low. This may demonstrate a lack of need for many associations to increase their facilities
footprint in their local area. For example, if an association were “bursting at the seams” in terms
of participation and available court space, one might assume that they would be looking to
access “other” facilities, such as universities, schools, indoor centres, etc, in order to service this
demand.
Stronger linkages between Associations and other community netball facilities should be an
element of the overall netball facilities mix in NSW, and should be an element of the NNSW
Statewide Facilities Strategy.
Page 70
Page | 70
Section 8 – Netball in NSW Facility Needs and
Demand Assessment – Preliminary Findings
8.1 Facility Gap Analysis: by NNSW Region and Association
8.2 Facility Gap Analysis: by Local Government Area
The information contained in this Section is based on the evidence collected and
analysed via Project Stages 1-8. Future stages of the project will also gather and
analyse evidence relating to future facilities demand; and this evidence will also
be used to shape the development of the Netball in NSW Facilities Strategy.
8.1 – Facility Gap Analysis: By NNSW Region and Association
The following criteria have been used for the preliminary Facilities Needs and Demands Assessment:
Association Playing Membership by Current Court Quantity
LGA Projected Population Growth 2016-2031 (including age demographic considerations)
Association Self-Assessment (via NNSW 2017 Facilities Audit e-Survey)
- Court condition
- Lighting
- Facility usage (Winter)
- Facility usage (Summer)
- Formalised facility planning in place
FNOSIS 2015/16
- LGA identified netball facility need
- NNSW identified netball facility need
The Netball in NSW Facilities Needs and Demands Assessment – Preliminary Findings Matrix (as listed in
Appendix A of this Paper) uses a red and amber traffic light system to flag potential areas for facility need and
demand consideration – RED identifying high priority status; and AMBER identifying moderate priority
status. As previously stated, these are preliminary assessments, which may alter following the consultation
with key stakeholders conducted in future stages of the project.
Preliminary Findings
Page 71
Page | 71
Association Playing Membership by Current Court Quantity
Data collected via the NNSW Facilities Audit e-Survey (May 2017) included (among many things) the total
number of netball courts at each association’s primary netball facility. These court numbers were divided by
each Association’s 2016 Total Playing Membership figures to determine a “Total Playing Membership by
Number of Courts” figure.
AMBER FLAG – A figure of 85-99 Playing Membership by Number of Courts
RED FLAG – A figure of 100+ Playing Membership by Number of Courts
Note: The survey also requested the number of secondary facilities being used by each association (where
relevant). Detail regarding the number (and condition) of courts and ancillary facilities at secondary facilities
will need to be addressed in recommendations / actions within the Netball in NSW Facilities Strategy.
However, the preliminary Facilities Needs and Demands Assessment has taken secondary facility usage into
consideration – Associations with a Playing Membership by Number of Courts ratio of 100+, who have indicated
they use secondary facilities, have received an amber flag, rather than a red flag for this criteria. This is due to
the fact that the Playing Membership by Number of Courts ratio is based on primary facility court numbers
only. Further investigations will need to be made to determine the feasibility of establishing ratios for each
facility, in the small number of cases where associations have secondary facilities.
LGA Projected Population Growth 2016-2031
NSW Department of Planning and Environment population data (current and projected) for NSW Local
Government Areas (LGAs) was used to determine LGA areas with high population growth expectations
between 2016 and 2031. This data was incorporated into the Netball in NSW Facilities Needs and Demands
Assessment – Preliminary Findings Matrix and mapped to the corresponding NNSW affiliated associations.
AMBER FLAG – Associations where the LGA area has projected growth between 20%-30%
RED FLAG – Associations where the LGA area has projected growth above 30%
Additional age demographic considerations will be taken into account in future stages of the Facilities Strategy
project, for the associations highlighted in the Preliminary Findings Matrix, to identify instances where LGA
areas may have, for example, a higher than average increase in the 65+ age bracket.
Page 72
Page | 72
Association Self-Assessment (via NNSW 2017 Facilities Audit e-Survey)
Data collected via the NNSW Facilities Audit e-Survey (May 2017) included (among many things) a rating of
court condition by type; and details regarding the number of lit courts. Note: All information provided relates
to the association’s primary facility.
- Court Condition: This is a subjective criteria, however the information provided via e-Surveys was used
to identify potential AMBER and RED flags in relation to court condition.
- Lighting: A ratio of lit courts to total number of courts was used for this criteria.
AMBER FLAG – 25%-49% of courts have lighting
RED FLAG – Less than 25% of courts have lighting
- Facility Usage Winter: In the NNSW Facilities Audit e-Survey (May 2017), associations were asked to
determine when their courts were in use in winter and what percentage of courts were being used at
this time of year. MSC was able to use this data to analyse the number of “session times” (i.e. Monday
Day; Monday Night; Saturday Morning; Saturday afternoon, etc.) an association identified their courts as
being at or near capacity (i.e. courts 80%-100% in use). The data also showed where an association
deemed the reason for their courts not being at full / near capacity, was due to a lack of court lighting.
AMBER FLAG – Court usage deemed at / near capacity* for 5-6 sessions per week (total number of
potential sessions = 14)
RED FLAG – Court usage deemed at / near capacity* for 7+ sessions per week (total number of
potential sessions = 14)
* A session was also deemed to be at / near capacity, if the reason the courts weren’t at 80%-100% usage
was due to a lack of court lighting.
- Facility Usage Summer: As per winter facility usage assessment. Note: None of the 78 associations who
completed Facilities Audit e-Surveys were deemed to require an amber or red flag for their summer
facilities usage.
- Formalised Facility Planning in Place: A number of assessment criteria were used to determine whether
an association has adequate facility planning in place. All information was gained from association
responses to the following questions within the NNSW Facilities Audit e-Survey (May 2017):
1. Response to Question 23 – Does your Association have a documented / formalised annual budget
allocation for facility maintenance & upgrade?
2. Response to Question 23 – If your Association has a current strategic plan, is "Facilities" a strategic
priority area?
3. Response to Question 27 – Rate your Association's existing relationship with your Local Government
Authority.
Page 73
Page | 73
4. Response to Question 28 – Has your Association formally requested NNSW or Government assistance
/ involvement relating to a facilities improvement / development initiative at any stage over the past
5 years? Note: Multiple points were available for this criteria, depending on how many (unsuccessful)
formal requests submitted (i.e. Local / State Government, NNSW, Other).
5. Response to Question 29 – Does your Association have formalised plans in place to improve your
primary facility over the next 3 years?
6. Response to Question 29 – Does your Association have formalised plans in place to develop
new facilities over the next 3 years?
AMBER FLAG – Associations who received 4 points from the above criteria, as well as associations
who received 3 Points, IF they have a current Strategic Plan in place with Facilities as a Strategic
Priority Area + a planned facilities project
RED FLAG – Associations who received 5-7 points from the above criteria
Future Needs of Sport Infrastructure Study (FNOSIS) 2015 Data
As outlined in Section 3.7 – Other Sport Facility Planning Related Information in this Paper, FNOSIS relates to
the NSW Government’s ongoing Future Needs of Sport Infrastructure Study. 2015 FNOSIS data highlighted 32
x netball related projects, identified as a priority by LGAs at the time. It also highlighted 4 x NNSW identified
facilities projects.
All associations with a proposed netball-related facilities project, identified by either their LGA or NNSW in
2015 have been given a RED FLAG for further investigation in future project stages. Note: The exception to this
is the NNSW identified Maitland Netball Association project (i.e. construction of a new multi-purpose amenity
building), given this project has been confirmed as complete.
Netball in NSW Facilities Needs and Demand Assessment Matrix
A preliminary rankings excerpt from the Netball in NSW Facilities Needs and Demands Assessment –
Preliminary Findings Matrix (refer Appendix A) is provided below, which highlights the 13 NNSW Associations
identified at this stage of the project, as the highest priorities in relation to future facility needs / demand.
Scoring
To allocate an overall “score” to each association, 2 points were allocated where a criteria was assessed as a
RED FLAG and 1 point where a criteria was assessed as an AMBER FLAG. In total, 9 criteria were used to assess
each association’s facility needs and demand, therefore the highest score an association could receive was 18.
Page 74
Page | 74
Extract from the Netball in NSW Facilities Needs and Demands Assessment – Preliminary Findings Matrix (as at 30 June 2017)
NNSW LGA Data Association's Self-Assessment FNOSIS 2015
NNSW Region NNSW Association Corresponding
LGA
M’Ship by
Current Court
Quantity
Projected Population Growth by
LGA Court
Condition Lighting
Facility Usage Winter
Facility Usage
Summer
Facility Planning in Place
LGA Identified
Facility Need
NNSW Identified
Facility Need
TALLY
Sydney Metro Baulkham Hills Shire Netball Association
The Hills 2 2 2 2 2 10
Hunter Newcastle Netball Association
Newcastle 2 1 2 2 2 9
Sydney Metro Blacktown City Netball Assn Inc
Blacktown 2 2 2 1 2 9
Hunter Maitland Netball Association
Maitland 1 2 1 1 2 Project Complete
7
Sydney Metro Northern Suburbs Netball Association
Willoughby 1 2 2 2 7
Sydney Metro Penrith District Netball Association
Penrith 2 1 2 2 7
Northern Inland
Armidale District Netball Association
Armidale Regional 1 2 1 2 6
South Coast Shoalhaven Netball Association
Shoalhaven 1 2 1 2 6
Sydney Metro Wollondilly Netball Association
Wollondilly 2 2 2 6
South Coast Kiama Netball Association
Kiama 1 2 2 5
Sydney Metro Hills District Netball Association
Hornsby 2 2 1 5
Sydney Metro Ku-ring-gai Netball Association
Ku-ring-gai 1 2 2 5
Sydney Metro Mount Druitt Netball Association
Blacktown 2 1 2 5
Page 75
Page | 75
Commentary
Of the top 13 prioritised associations relating to future facility needs / demand, 8 are within the
Metro Region and 5 in regional areas.
The LGA and NNSW facility project priorities identified in FNOSIS 2015 information has been used
as 2 criteria within the facility needs / demand assessment process and as such, the currency of
this information will be checked in future stages of the project to ensure accuracy of assessment?
8.2 – Facility Gap Analysis: By Local Government Area
Where an LGA was able to be mapped to a NNSW association, the LGA data has been included in the NSW
Facilities Needs and Demands Assessment – Preliminary Findings Matrix (refer Section 8.1). As previously
identified in Table 5.1 in Section 5 of the Paper, there are also a number of LGAs who were not able to be
mapped to NNSW Associations. This LGA data is included in the following tables.
Table 8.1 – Sydney Metropolitan LGAs with no NNSW Associations
LGA Data FNOSIS 2015
Sydney Metropolitan LGAs
2016 Population by
LGA
2031 Projected Population
(LGA)
Projected % Increase
LGA Identified Facility Need
Burwood (A) 38,850 53,500 37.71% Cumberland 217,450 273,900 25.96% Georges River 151,300 174,900 15.60% YES*
Hunters Hill (A) 14,500 15,150 4.48% YES
Lane Cove (A) 37,350 48,100 28.78% Mosman (A) 30,350 31,650 4.28% North Sydney (A) 72,150 86,850 20.37% Strathfield (A) 41,250 60,200 45.94% Sydney (C) 212,550 292,350 37.54% Waverley (A) 72,250 76,450 5.81% YES
Woollahra (A) 57,800 59,200 2.42%
Page 76
Page | 76
Table 8.2 – Regional NSW LGAs with no NNSW Associations
LGA Data FNOSIS 2015
Regional NSW LGAs
2016 Population by
LGA
2031 Projected Population
(LGA)
Projected % Increase
LGA Identified Facility Need
Albury (C) 52,100 58,350 12.00% Balranald (A) 2,250 2,100 -6.67% Berrigan (A) 8,400 8,000 -4.76% Brewarrina (A) 1,900 1,900 0.00% Cabonne (A) 13,850 16,400 18.41% YES
Central Darling (A) 2,100 2,150 2.38% Edward River 8,650 7,800 -9.83% YES*
Federation 12,650 12,600 -0.40% Greater Hume Shire (A) 10,250 10,300 0.49% Gwydir (A) 5,000 4,300 -14.00% Hay (A) 2,850 2,400 -15.79% Junee (A) 6,200 6,050 -2.42% Murray River 11,550 12,300 6.49% Murrumbidgee 3,700 3,300 -10.81% YES*
Narromine (A) 6,800 6,400 -5.88% Oberon (A) 5,250 5,050 -3.81% Shellharbour (C) 71,150 85,850 20.66% Tweed (A) 94,450 110,600 17.10% Upper Lachlan Shire (A) 7,500 7,500 0.00% Uralla (A) 6,350 6,550 3.15% YES
Walcha (A) 3,050 2,750 -9.84% Walgett (A) 6,650 5,850 -12.03% Weddin (A) 3,600 3,200 -11.11% Wentworth (A) 6,900 6,750 -2.17% Unincorporated NSW 1,150 1,250 8.70%
Page 77
Page | 77
Section 10 – Where to From Here?
The next stage of this project (refer to Stage 11 of the project methodology flowchart on Page 4 of this Paper)
is for MSC to facilitate a face-to-face meeting with the Project Reference Group to discuss the information
contained within this Paper. This meeting is scheduled for 11th July 2017.
Project Stages 12 – 20 will follow, with the project due for completion on 21st September 2017.
Mike McLaughlin
MBA (Sport Management)
Bachelor of Sports Science (Sports Studies)
Grad Dip (Sports Coaching)
Cert IV in Training and Assessment
Page 78
Page | 78
Appendix A – List of Supporting Documents
The following documents have been referred to by the MSC Project Team during the preliminary stages of this
Review. They will be made available to NNSW and should be referred to, as required.
NNSW Membership Data 2007-2016 - by Association & Region
NSW Population Projections LGAs (2011-2036)
Netball in NSW Facilities Needs and Demands Assessment – Preliminary Findings Matrix
NNSW Facilities Audit - SurveySummary_Facilities_RawDataALL
Page 79
Page | 79
Appendix B – List of NNSW Associations who
Completed Facilities Audit e-Surveys
1 Glen Innes Netball Association 47 Queanbeyan Netball Association
2 Great Lakes 48 Woy Woy Peninsula Netball Association
3 Mount Druitt 49 Kurri Kurri
4 Shoalhaven 50 Nelson Bay Netball
5 Northern Suburbs Netball Association 51 Bathurst
6 Maitland 52 Casino
7 Penrith 53 Blacktown City Netball Assoc
8 Baulkham Hills Netball Association 54 Nambucca Valley Netball Association
9 Taree and District 55 warren junior netball
10 Mudgee District Netball Association 56 Baradine Netball Club
11 Eurobodalla Netball Association 57 MANLY WARRINGAH
12 Cessnock District Netball Association 58 Ulladulla & Districts Netball Association Inc.
13 St George District Netball Association 59 Ballina Netball Association
14 Dubbo 60 Sutherland
15 CAMPBELLTOWN 61 Armidale District Netball Association
16 Orange 62 TUMUT
17 Bankstown 63 Cobar
18 Port Stephens Netball 64 Southern Highlands Netball association
19 Singleton netball association 65 Parkes & District Netball Association
20 Wyong 66 Muswellbrook
21 Wagga Wagga 67 Lakeside
22 Moree & District Netball Association 68 Dungog & District
23 PARRAMATTA AUBURN NETBALL ASOCIATION 69 Wollondilly
24 Griffith Netball Association 70 Gosford Netball Association
25 Ku-ring-Gai 71 Grafton
26 Gunnedah Netball Association 72 Nyngan netball association
27 Charlestown Netball Association 73 Tenterfield
28 Lismore 74 Young & District Netball Association Inc.
29 Newcastle 75 Scone & District
30 Sapphire Coast Netball Association 76 City of Sydney
31 Lower Clarence 77 AFL Riverina
32 Westlakes District 78 Inverell Netball Association
33 Narrabri Netball Association
34 Goulburn District Netball Association
35 Netball
36 Bellingen
37 Hastings Valley
38 Kiama Netball Association
39 Cowra Netball Association
40 Woolgoolga
41 Quirindi
42 Inner Western Suburbs Netball Association
43 Hills District
44 Brunswick Byron
45 Macleay Netball Association
46 Illawarra District