51
| Date post: | 17-Apr-2018 |
| Category: |
Documents |
| Upload: | hoangtuyen |
| View: | 217 times |
| Download: | 4 times |


This presentation contains certain information that may constitute forward-looking information under applicable U.S.
securities legislation, including but not limited to information about costs applicable to sales, general and
administrative expenses; production volumes; current expectations on the timing, extent and success of
exploration; development and metallurgical sampling activities, the timing and success of mining operations and the
optimization of mine plans. This forward-looking information entails various risks and uncertainties that are based
on current expectations, and actual results may differ materially from those contained within said information. These
uncertainties and risks include, but are not limited to, the strength of the global economy, the price of commodities;
operational, funding and liquidity risks; the degree to which mineral resource estimates are reflective of actual
mineral resources; the degree to which factors which would make a mineral deposit commercially viable are
present, and other risks and hazards associated with mining operations. Risks and uncertainties about the
Company’s business are more fully discussed in the BVN’s form 20-F filed with the Securities and Exchange
Commission in the U.S. and available at www.sec.gov . Readers are urged to read these materials. Buenaventura
assumes no obligation to update any forward-looking information or to update the reasons why actual results could
differ from such information unless required by law.

Board Members and Management Team / Peruvian Political and Economic Outlook
I.
Company OverviewII.
OperationsIII.
ProjectsIV.
Financial ResultsV.
Closing Remarks and Q&AVI.

Roque BenavidesChairman of the Board
Civil Engineer Corporate Governance
Felipe Ortiz de ZeballosDirector
Industrial Engineer Audit Committee Founder of the consultant Company
APOYO
José Miguel MoralesDirector
Lawyer Corporate Governance
Germán SuárezDirector
Economist Audit Committee Former President of the Central
Bank of Peru
William H. ChampionDirector
Chemical Engineer Technical Operating Affairs President of the Phelps Dodge Chile
Diego De La TorreDirector
Business Administrator Corporate Governance President of the United Nations
Global Pact in Peru
Nicole BernexDirector
Geographist Social/ Environmental Affairs

Victor GobitzChief Executive Officer
Mining Engineer MBA
Leandro GarcíaChief Financial Officer
Business Administrator MBA
Gonzalo EyzaguirreChief Operating Officer
Mining Engineer MBA
Alejandro HermozaVP of Labor, Social & Environmental Affairs
Mechanical Engineer MBA
Raúl BenavidesVP of Business Development
Mining Engineer MBA

BBB+
A3
BBB+
1.6, 6.1
3.6, 4.12.0, 4.2
4.9, 3.13.0, 3.2
2.0
4.0
6.0
8.0
1.0 2.0 3.0 4.0 5.0 6.0
2008 – 2017 Average
Real GDP Average ’08 – ’17 (%)
Infl
atio
n A
vera
ge
’08
–’1
7 (
%)
Growing Economy with Low Inflation Rates Peru Investment Grade
In 2018, Peru´s economy is expected to grow more than any other Latin
American or Caribbean country, according to Alejandro Werner, Director of the
Western Hemisphere Department of the International Monetary Fund (IMF).

2. Company Overview

Business Overview
BVN is engaged in the mining, processing, development and exploration of gold, silver and other metals via wholly-owned mines and through its participation in joint exploration projects.
Extensive experience in the mining sector with over 65 years of operation.
Based in Peru, a country situated in one of the world’s most prolific polymetallic belts.
2018E Revenue Breakdown(1)(2)
Notes: (1) Consolidated(2) Consider the following prices: Au: $1,300 US$/Oz, Ag: $17 US$/Oz, Pb: 2,250 US$/MT, Cu: 6,000 US$/MT and Zn: 2,750 US$/MT
Source: Company filings
9301,069
1,274
1,400 -1,500
2015 2016 2017 2018E
Revenues(1)(2)
100
334 372
430 - 51011%
31% 28%30-34%
2015 2016 2017 2018E
Corporate Structure
Julcani,Orcopampa, Uchucchacua, Mallay,
Tambomayo
19.58%
Condesa Coimolache ConenhuaLa Zanja
Huanza
100%
100%
45.95% 95.55%
58.25%
53.06% 40.1% 100%
100%
Colquijirca
4.45%
EBITDA and EBITDA Margin(1)(2)
US$ in millions US$ in millions
3.18%
Gold36%
Silver26%
Copper16%
Zinc10%
Lead6%
Others6%

Odría(1948 – 1956)
Prado y Ugarteche(1956 – 1962)
Belaunde(1963 – 1968)
Velasco(1968 – 1975)
Morales Bermúdez
(1975 – 1980)
Belaunde(1980 – 1985)
García(1985 – 1990)
Fujimori(1990 – 2000)
Toledo(2001 – 2006)
García(2006 – 2011)
Humala(2011 – 2016)
Kuczynski(2016 – present)

Notes: (1) All values as of December 31st, 2017(2) Includes 100% of Buenaventura (Julcani, Mallay, Tambomayo, Orcopampa, Uchucchacua, Projects), La Zanja, El Brocal, Huanza, BISA, Contacto, Condesa, other small business of the Group(3) Includes 1 + 40.1% of Coimolache, 19.58% of Cerro Verde and 43.65% of Yanacocha
Sup
po
rts
OPERATIONS
PROJECTS
Drivers
Safety
Human Resources
Social Management
Environmental Management
Technology and Innovation
Energy
Communications
Head Office
TambomayoOrcopampa
CoimolacheLa Zanja
Yanacocha
Gold
Base Metals
Silver
Gold
Silver
Base Metals
UchucchacuaMallay
Julcani
Quecher MainSan Gabriel
Yumpaq
Marcapunta Norte-SurYanacocha’s Sulfides
Coimolache’s SulfidesEl Faique
TrapicheSan Gregorio
El BrocalCerro Verde
AISC
FY17: 856 US$/Au Oz
4Q17: 876 US$/Au Oz
EBITDA (Direct Operations) 2
FY17: US$ 372.2 M
4Q17: US$ 116.6 M
EBITDA (Including Associates) 3
FY17: US$ 714.4 M
4Q17: US$ 245.4 M
Net Debt / EBITDA: 1.4x
(Rolling 12 months)
Debt Rating
- Moody’s: Ba2
- Fitch: BBB-
Financial Results FY17(1)

1
2
3
4
5
Diversified Portfolio
Partner of Choice in Peru
More Than Six Decades Replenishing Reserves –
Long Term Business Plan with Focus on Sound Capital
Deployment
Track Record Creating Value Through Organic Growth
Based in Peru - Extensively Mineralized Country with
Strong Macroeconomic Fundamentals

Sources: BVN and other companies filingsNotes: (1) Calculation considers the Adjusted EBITDA (including the associated companies)
1
Regional Clusters Leverage ImportantSynergies for BVN
A Diversified Revenue Base Reduces PricesVolatility Risk
ProjectP
Operation
CoimolacheSulfides
P
La Zanja
Yanacocha
P
QuecherMain
P
Yumpaq
Mallay
Uchucchacua
Julcani P
Orcopampa
Tambomayo
San Gabriel
Cerro Verde
P
El Faique
P
Trapiche
San Gregorio
Tajo Norte
P
Marcapunta
P
YanacochaSulfides
Coimolache
P
P
P
P
P
P
P
P
2017 EBITDA Including Affiliates Breakdown by Metal (1)
+
Gold30%
Silver8%
Base Metals
53%
Others9%
US$M 714
Gold
Base Metals
Silver
Others
Tambomayo
Orcopampa
Coimolache *
La Zanja
Yanacocha *
Uchucchacua
Mallay
Julcani
El Brocal
Cerro Verde *
Huanza, Rio Seco, Contacto, BISA
Other adjustments
* Affiliates
BVN’s Direct Operations are focused on precious metals, with a well diversified portfolio through its participation in joint ventures.

2
Yanacocha –La Zanja
Cerro Verde
Coimolache

Notes: (1) As of December 31st, 2017(2) Includes 256,000 Au Oz from purchases (Gold Fields)
3
Mineral Reserves 2017 Variation(1)A Consistent Replenishing Reserves Culture Since 1953
2,645 2,524216 61
654
Dec-16 Explo. Reinterp. Prod. Dec-17
Gold Equivalent
84.6 87.8
18.45.8
20.9
Dec-16 Explo. Reinterp. Prod. Dec-17
Silver Equivalent
In 000 AuOz
In M AgOz
Orcopampa
Tambomayo
La Zanja
Coimolache
Uchucchacua
Julcani
Mallay
Julcani
Uchucchacua
Orcopampa
+ 65 years
+ 51 years
+ 43 years
4
(2)

5
BBB+
A3
BBB+
Sources: Bloomberg and Ministry of Economy and Finance of PeruNotes: (1) As of 2017
1.6, 6.1
3.6, 4.12.0, 4.2
4.9, 3.13.0, 3.2
2.0
4.0
6.0
8.0
1.0 2.0 3.0 4.0 5.0 6.0
2008 – 2017 Average
Real GDP Average ’08 – ’17 (%)
Infl
atio
n A
vera
ge
’08
–’1
7 (
%)
4%
18%
10% 12%7%
6° 2° 2° 2° 4°
Gold Silver Copper Zinc Lead
% of WorldReserves
GlobalProductionRanking
Peru: Global Leader in the Mining Industry(1)
Growing Economy with Low Inflation Rates Peru Investment Grade
In 2018, Peru´s economy is
expected to grow more
than any other Latin
American or Caribbean
country, according to
Alejandro Werner, Director of
the Western Hemisphere
Department of the
International Monetary Fund
(IMF).

3. Operations

Go
ldB
ase
Met
als
Silv
er
Tambomayo 100.00% U/G
Orcopampa 100.00% U/G
Coimolache 40.10% O/P
La Zanja 53.06% O/P
Yanacocha 45.95% O/P
Uchucchacua 100.00% U/G
Mallay 100.00% U/G
Julcani 100.00% U/G
Tajo Norte 61.43% O/P
Marcapunta 61.43% U/G
Cerro Verde 19.58% O/P
1
2
3
4
5
6
7
8
9
10
11
Our Operations(1)Mining method
Stake owned(2)Name
By product
9 of 11mining units operated by
BVN1
Precious Metal focused
Base Metals
Long-term potential
111
2
8
6
79
10
54
3
Arequipa
Lima
Huancavelica
Pasco
Cajamarca
Notes: (1) Affiliates are Coimolache, Yanacocha and Cerro Verde. BVN is in charge of the operation of Coimolache despite having less than 50% share
(2) As of February, 2018
L
L
L
GoldSilverCopper
ZincLead
U/G: UndergroundO/P: Open Pit
Z
L
Z
Z
L
BVN’s operationspresence
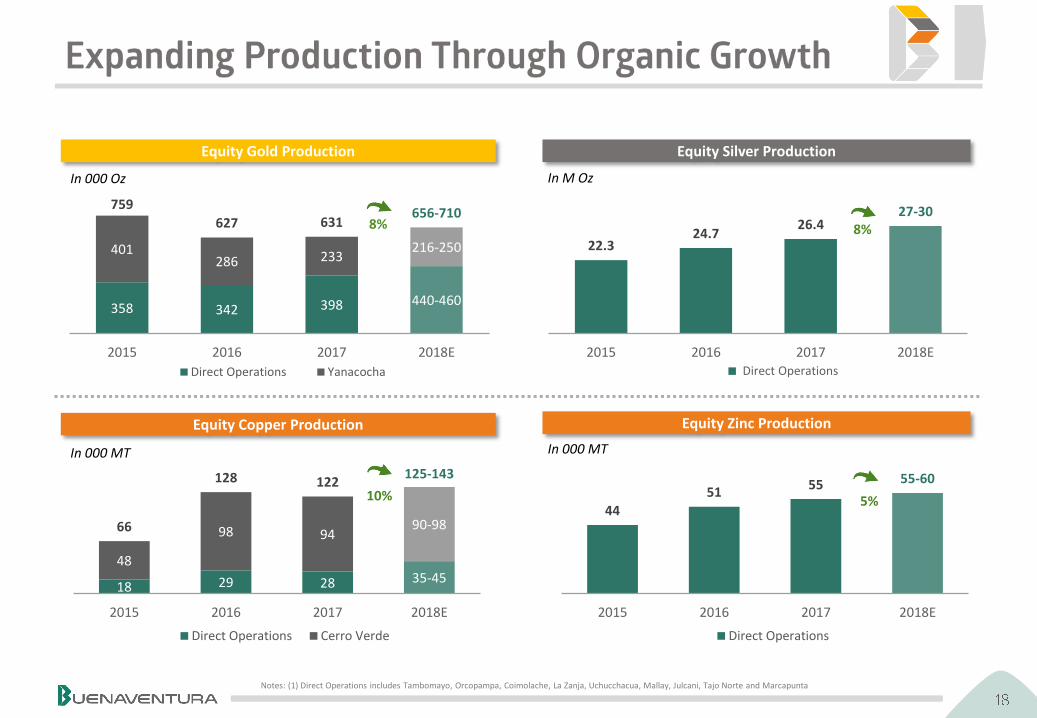
Notes: (1) Direct Operations includes Tambomayo, Orcopampa, Coimolache, La Zanja, Uchucchacua, Mallay, Julcani, Tajo Norte and Marcapunta
44
5155 55-60
2015 2016 2017 2018E
Direct Operations
5%
Equity Gold Production Equity Silver Production
Equity Copper Production Equity Zinc Production
In 000 Oz In M Oz
In 000 MT In 000 MT
358 342 398 440-460
401286 233
216-250
759
627 631656-710
2015 2016 2017 2018E
Direct Operations Yanacocha
8%
18 29 28 35-4548
98 9490-9866
128 122125-143
2015 2016 2017 2018E
Direct Operations Cerro Verde
10%
22.324.7
26.427-30
2015 2016 2017 2018E
8%
Direct Operations

0.770.84
0.97
0.59-0.77
2015 2016 2017 2018E
Direct Operations
-30%
720683
759 675-750
2015 2016 2017 2018E
-6%
2.40
2.102.30
1.90-2.10
2015 2016 2017 2018E
CAS Variation
-13%
13.42
11.34 11.289.5-10.5
2015 2016 2017 2018E
-11%
Gold Costs Silver Costs
Copper Costs Zinc Costs
CAS
CAS CAS
CASIn US$/Oz In US$/Oz
In US$/Cu Lb In US$/Zn Lb

Commercial production began in August, 2017.
2017: focus on fine tuning the processing plant.
2018: the focus will be on exploration.
2018 production guidance:
o Au: 110k – 130k ozo Ag: 3.0 M – 3.5 M oz
Design backfill system in 2018
2018 Exploration Program:
o Drift/Tunnels: 8,200m (+112% YoY)o Diamond Drilling: 50,200m (+69% YoY)
Notes: (1) As of December 31, 2017(2) Resources includes measured and indicated
64
110 - 130
2017 2018E
671500 -550
2017 2018E
-22%
CAS
Costs
Gold (K Au Oz)
(US$/Au Oz)
In 000 Au Oz
R&R (1) (2)
Key Points
Product- Dore bars- Pb/Ag concentrate- Zn/Ag concentrate
LocationArequipa (4,800 MASL)
Plant capacity 1,500 TPD
Production
Results and GuidanceHighlights
929 834
95
Dec-16 Exploration &Reinterp.
FY17Production
Dec-17
Reserves VariationIn 000 Au-Eq Oz
597 535
141 126
738661
2016 2017
Reserves
Resources
88%

2018: focus on improving ventilation and hoisting infrastructure.
Cost reduction and further exploration expected with benefit of the de-bottlenecking program.
2018 Exploration Program:
o Drift/Tunnels: 14,400m (+15% YoY)o Diamond Drilling: 78,970m (+16% YoY)
205
191 191
190 - 210
2015 2016 2017 2018E
678704
743 700-750
2015 2016 2017 2018E
CAS
Costs
Gold (K Au Oz)
(US$/Au Oz)
361 391
154 76
515 467
2016 2017
Reserves
Resources
In 000 Au Oz
Key Points
ProductDore bars
LocationArequipa (3,800 MASL)
Plant capacity1,500 TPD
Production initiated in 1967
Production
Results and GuidanceHighlights
372 404
210
178
Dec-16 Exploration &Reinterp.
FY17Production
Dec-17
Reserves VariationIn 000 Au-Eq Oz
R&R (1) (2)
Notes: (1) As of December 31, 2017(2) Resources includes measured and indicated
5%
-2%

More production contribution coming from the Cienaga Norte area.
Agreement with Goldfields to purchase oxides material
High grade, located within 18 kilometers
2018: further sulfide explorations
2018 Exploration Program:
o Diamond Drilling: 12,200m (+38% YoY)
Notes: (1) As of December 31, 2017(2) Resources includes measured and indicated(3) Includes 256,000 Au Oz from purchases (Gold Fields)
145151 151
160 - 180
2015 2016 2017 2018E
335
492 517
600-650
2015 2016 2017 2018E
CAS
Costs
Gold (K Au Oz)
(US$/Au Oz)
Production
Results and GuidanceHighlights
1,023
465 439
1,488 1,521
2016 2017
Reserves
Resources
256
826
In 000 Au Oz
Key Points
ProductDore bars
LocationCajamarca (3,800 MASL)
Production initiated in 2011. More than 0.8M Au Oz were produced to date
Reserves VariationIn 000 Au-Eq Oz
1,076
860
7
209
256
Dec-16 Exploration &Reinterp.
FY17Production
Dec-17
(3)
R&R (1) (2)
13%
21%

Production plan has been modified in order to produce until 2019.
Current cash position fully funds the closure plan.
Potential sulfides copper resources:
o Encouraging Intercepts Emperatriz
Exploration Program 2018:
o Diamond Drilling (Oxides): 2,000mo Diamond Drilling (Sulfides): 8,000m
Notes: (1) As of December 31, 2017(2) Resources includes measured and indicated
141 140127
70 - 80
2015 2016 2017 2018E
753
607
789
900 - 1,000
2015 2016 2017 2018E
CAS
Costs
Gold (K Au Oz)
(US$/Au Oz)
253 166
164111
417277
2016 2017
Reserves
Resources
In 000 Au Oz
Key Points
Production
Results and GuidanceHighlights
268
170
75
172
Dec-16 Exploration &Reinterp.
FY17Production
Dec-17
Reserves VariationIn 000 Au-Eq Oz
ProductDore bars
LocationCajamarca (3,500 MASL)
Production initiated in 2010: more than 0.9M Au Oz were produced to date
R&R (1) (2)
20%
-41%

In 2017, Yanacocha purchased IFC´s 5% equity stake for US$48 M.
In 2018, BVN´s equity stake in Yanacocha increased from 43.65% to 45.95% due to a capital reduction in Yanacocha.
Projects
Quecher Main
o Project has been approved in October 2017
Yanacocha Sulfides (O/P):
o Studies will take 2.5 – 3 more yearso More drilling and mining exploration
expected at Chaquicocha (U/G)
Notes: (1) As of December 31, 2017(2) Resources includes measured and indicated(3) Resources includes 17.5 M Au Oz from Conga
918
655535 470 - 545
2015 2016 2017 2018E
621
841956 900- 1,000
2015 2016 2017 2018E
CAS
Costs
Gold (K Au Oz)
(US$/Au Oz)
In 000 Au Oz
Key Points
Production
Results and GuidanceHighlights
ProductDore bars
LocationCajamarca (3,800 MASL)
Production initiated in 1993: More than 36.7M Au Oz were produced to date
4.4 3.8
26.7 27.3
31 31
2016 2017
Reserves
Resources
R&R (1) (2)
-5%
-1%

Yanacocha Area
Sulfides

Since June 2017: Uchucchacuaunderground production increased, to be treated at Mallay’s processing plant (+ 4k MTD).
Encouraging exploration results at Cachipampa area.
Yumpaq could become part of the future expanded mining plan (12 kilometers distance from Uchuccacua’s processing plant).
2018 Exploration Program:
o Drift/Tunnels: 15,000m (+8% YoY)o Diamond Drilling: 89,400m (+25% YoY)
Notes: (1) As of December 31, 2017(2) Resources includes measured and indicated
13.9
16.2 16.6
17.2 –18.6
2015 2016 2017 2018E
CAS
Costs
Silver (M Ag Oz)
(US$/Ag Oz)
66,170 64,640
34,443 48,489
100,613113,128
2016 2017
Reserves
Resources
In 000 Ag Oz
Key Points
Production
Results and GuidanceHighlights
74.3 77.719.9
16.5
Dec-16 Exploration &Reinterp.
FY17Production
Dec-17
Reserves VariationIn M Ag-Eq Oz
Product- Silver bars- Pb/Ag concentrate- Zn/Ag concentrate
LocationLima (4,500 MASL)
Plant capacity 4,000 TPD
13.9
11.0 10.69.0 – 10.0
2015 2016 2017 2018E
R&R (1) (2)
8%
-10%

Take advantage of Mallayprocessing plant to treat Uchucchacua’s ore (more profitable)
60 kilometers distance from Uchucchacua mine
Update the hydrogeological study to determine future direction
Notes: (1) As of December 31, 2017(2) Resources includes measured and indicated
1.3
1.6
1.1
0.4 – 0.5
2015 2016 2017 2018E
CAS
Costs
Silver (M Ag Oz)
(US$/Ag Oz)
1,492 1,244
1,629
3,121
1,294
2016 2017
Reserves
Resources
In 000 Ag Oz
Key Points
Production
Results and GuidanceHighlights
3.4 4.0
2.9
2.3
Dec-16 Exploration &Reinterp.
FY17Production
Dec-17
Reserves VariationIn M Ag-Eq Oz
Product- Pb/Ag concentrate- Zn/Ag concentrate
LocationLima (4,250 MASL)
Plant capacity 600 TPD
12.512.8
13.312.0 – 13.0
2015 2016 2017 2018E
R&R (1) (2)
-6%
-59%

Mining procedures strengthened to improve safety.
The underground production was reduced to 400 TPD from 600 TPD, centralizing activities in two areas.
Investing in mining infrastructure.
Production:
o Reducing volume but focusing in areas with higher ore grade
2018 Exploration Program:
o Drift/Tunnels: 9,000m (-15% YoY)o Diamond Drilling: 25,200m (-30% YoY)
Notes: (1) As of December 31, 2017(2) Resources includes measured and indicated
3.3 3.3
2.2 2.1 – 2.4
2015 2016 2017 2018E
CAS
Costs
Silver (M Ag Oz)
(US$/Ag Oz)
6,1825,380
1,3121,597
7,493 6,977
2016 2017
Reserves
Resources
In 000 Ag Oz
Key Points
Production
Results and GuidanceHighlights
6.9 6.1
1.4
2.2
Dec-16 Exploration &Reinterp.
FY17Production
Dec-17
Reserves VariationIn M Ag-Eq Oz
Product- Pb/Ag concentrate
LocationHuancavelica (4,250 MASL)
Plant capacity 600 TPD
12.311.6
17.1
14.0 – 15.0
2015 2016 2017 2018E
R&R (1) (2)
-15%
2%

1.6
1.3
1.5 1.4 – 1.5
2015 2016 2017 2018E
360k TPD plant throughput (largest concentrating facility):
o Concentrator # 1: 120K TPDo Concentrator # 2: 240k TPD
Copper production distribution:
o Cu Concentrate: 90%o Cu Cathodes: 10%
Syndicate Loan: Cerro Verde repaid US$220 M (US$ 1.3 B outstanding)
Dividends policy to be discussed at the coming AGM (March 23rd)
Notes: (1) As of December 31, 2017(2) Resources includes measured and indicated
247
502 482 460 - 500
2015 2016 2017 2018E
Cash Cost
Costs
Copper (K Cu MT)
(US$/Cu Lb)
In K Cu MT
Key Points
Production
Results and GuidanceHighlights
Product- Cu concentrate- Cu cathodes- Mo concentrate
LocationArequipa (2,600 MASL)
Plant capacity: 360K TPD
13,535 13,155
2016 2017
Reserves
R&R (1) (2)
-3%
0%

5,322
4,651
5,119 4,400 – 4,600
2015 2016 2017 2018E
Marcapunta
Focused on “Project 13K” to duplicate the copper production (Marcapunta mine) and reach a total processing capacity of 21K TPD: Cu(13K) + Pb/Zn(8K)
Improved commercial terms of copper complex concentrates (nine contracts)
2018 Exploration Program:
o Diamond Drilling: 27,000m (+206% YoY)
Notes: (1) As of December 31, 2017(2) Resources includes measured and indicated
32
4945
61 - 71
2015 2016 2017 2018E
CAS
Costs
Copper (K Cu MT)
(US$/Cu MT)
299 253
1,383 1,381
1,682 1,634
2016 2017
Reserves
Resources
In K Cu MT
Key Points
Production
Results and GuidanceHighlights
Plant #1: 7k 10K TPD (100% Cu)
Plant #2: 11k TPD (Flexible Cu / Zn-Pb)
ProductCu concentrate
LocationPasco (4,250 MASL)
1,123.1 1,056.1
67.0
Dec-16 Exploration &Reinterp.
FY17Production
Dec-17
Reserves VariationIn K Cu-Eq MT
R&R (1) (2)
-12%
47%

1,601 1,808
1,915
1,300 – 1,500
2015 2016 2017 2018E
Along 2018 zinc production will be reduced in order to increase copper production.
During 2017, the administrative synergies process was successfully completed.
Notes: (1) As of December 31, 2017(2) Resources includes measured and indicated
5357
52 43 - 50
2015 2016 2017 2018E
CAS
Costs
Zinc (K Zn MT)
(US$/Zn MT)
702 601
366337
1,068938
2016 2017
Reserves
Resources
(LOM)
In K Zn MT
Key Points
Production
Results and GuidanceHighlights
Plant #1: 7k 10K TPD (100% Cu)
Plant #2: 11k TPD (Flexible Cu / Zn-Pb)
Product- Pb/Ag concentrate- Zn/Ag concentrate
Location: Pasco (4,250 MASL)
1,013.8866.3
147.5
Dec-16 Exploration &Reinterp.
FY17Production
Dec-17
Reserves VariationIn K Zn-Eq MT
R&R (1) (2)
-11%
-27%

Buenaventura will deliver US$ 120-150 M of EBITDA with a total Capex of US$ 35-45 M between 2018 - 2020
9 - 10
Capex
Tambomayo
3 – 5
Capex
Orcopampa
7 - 8
Capex
Uchucchacua Marcapunta
5 - 6
Capex
Back-fill SystemDilution Control
Process PlantDifferential Cut-off
Integrated Mining Contract
Hoist System (Naz/Prom)Ventilation
Dilution ControlDifferential Cut-off
Integrated Mining Contract
Hoist System (Luz/Master)Ventilation
Dilution ControlDifferential Cut-off
Integrated Mining Contract
Esperanza Tunnel ConnectionBack-fill / Mining Method13K Copper Production
Process Plant
Process Efficiency
* Does not includes 13K project
2018 Plan
Moving to paste backfill using tailings as a part of the mix instead of a conventional backfill with ore waste.
Re-focusing mining plans on “highest-margin” areas.
Increasing mine development to improve mining flexibility – allowing for more underground reserves to be developed ahead of timing.
Optimizing at processing facilities to improve recoveries.
Management Efficiency

4. Projects

Legend
Gold projects
Silver projects
Base Metal projects
Operated byNewmont
To implement a disciplined processand increase value through our diversified portfolio of projects
Disciplined process
Focus on implementing project management best practices
5 – 10+years
1 – 5 years
In preparation to Ramp-up
Marcapunta13K
(expansion)
San Gregorio(Zn/Pb/Ag)
YanacochaSulphides(Cu/Au)
El Faique(Zn/Pb/Cu)
CoimolacheSulphides(Cu/Au)
Rio Seco(Cu/As)
Trapiche(Cu)
San Gabriel
QuecherMain
Increase Value
Focus on optimized capital allocation
Yumpaq(Phase I)
Rio Seco Expansion
(Mn)

Nota: (1) Based on the methodology of the book: “Project Management for Mining” (Hickson & Owen, 2015)
Gold Silver Base Metals Associates Owned
QuecherMain
Rio Seco
Trapiche
San Gabriel
CoimolacheSulfides
Yumpaq
San Gregorio
El Faique
YanacochaSulfides
Scoping Prefeasibility Feasibility Development Construction Startup
DrillingResource
Delineation

Nota: (1) Based on the methodology of the book: “Project Management for Mining” (Hickson & Owen, 2015)
(1) Geology
(2) Mine
(3) Plant
(4) Tailings/Dumps
(5) Energy
(6) Water
(7) Infrastructure
(8) Lands
(9) Permits
(10) Security
(11) People
(12) Communities
Project 1 – Development Phase
Scoping Prefeasibility Feasibility Development Construction Startup
Project 1
Current: Identify gap with pre-feasibility study
Plan: Complete missing studies (EPCM – Phase I) to
achieve pre-feasibility level Presentation to committee and approval Develop feasibility study under new set limits
(ECPM – Phase II)
Project Status
PF
F
D
S
E
E – Exploration S – Scoping PF – Pre feasibilityF – Feasibility D - Development
Low Risk Medium Risk High Risk

GEOLOGY MINE PLANT FACILITIES
E Resource delineation E Surface/Underground defined E Preliminary site arrangement E Approximate locations
S Inferred mostly S Mining method / Cut-off preliminary S 1-2% Total engineering S Some optimization w/locations
PF Indicated mostly PF Production schedule from pushbacks PF 5-12% Total engineering PF Optimal locations selected
F 80% measured/indicated F Mine services – Fully outlined F 12-30% Total engineering F Basic engineering > 80%
D 100% measured/indicated D Mine services – Firm design basis D 60-80% Total engineering D Detailed engineering > 80%
ENERGY WATER LAND INFRAESTRUCTURE
E Overview of power availability E Water sources identified E Property lease desirable E General overview provided
S Electrical loads estimated S Water demand estimated SProperty under temporary lease
SCritical facilities identified and locations postulated
PFPower source identified, distribution to site addressed, loads estimated
PF Water source defined PF Property under lease PFLikely facilities location set, all facilities identified
F Distribution to site engineered F Critical design concluded F Property titles controlled FAll support facilities listed and locations established
DSpecific power source contracted, distribution to site established
D All water design concluded D Claim management D Final facilities location set and detailed
SOCIAL WORKFORCE SECURITY PERMITS
E Social base line gathered E Baseline of local workforce E Non applicable E EID presented
S Social acceptance diagnostic S Local work force identified (fieldwork) S First HIRA draft (Field work) S EID approved
PF Social agreement outlined PF Local work force trained (fieldwork) PF HIRA approved (Field work) PF Environmental base-line completed
F Public Audience FLocal work force identified (construction)
F First HIRA draft (Construction) F EIS presented
D Social acceptance reached DLocal work force trained (construction)
DFirst approved (Construction)
D Construction/Mine permit issued

(U/G – 100%)
QuecherMain
(O/P– 45.95%)
San Gabriel(U/G – 100%)
Trapiche(O/P – 100%)
HighlightsGeneral Information(1)
Main Mineral: Gold and Silver Location: Moquegua (4,800 MASL) Resources
o Measured and Indicated 7.7 M MT @ 5.7 g/t Au (1.4 M Au Oz), @ 0.23 Oz/t Ag (1.7 M Ag Oz)
o Inferred 5.3 M MT @ 4.6 g/t Au (0.8 M Au Oz), @ 0.23 Oz/t Ag (1.2 M Ag Oz)
Environmental Impact Assessment (EIA) approved on March 31, 2017
Prefeasibility studies underway
Key aspects under analysis:
Complementary geomechanicaltestwork studies to optimize mining methods
Main Mineral: Copper deposit Location: Apurimac (4,250 MASL) Resources
o Total Measured 722.6 M MT @ 0.42% (3.0 M MT Cu), @ 0.01% (0.08 M MT Mo)
o Mineral Leachable (included in measured resources) 230.0 M MT @ 0.57% (1.3 M MT Cu)
Copper studies for leachable copper underway
Leachable resource of 230 M MT at 0.57% copper
Working on the prefeasibility study, expected in 2018
Strengthening relations with Mollebamba rural community (Apurimac)
Project has been approved and currently is in Execution Stage
Production expected in 2019
The project has a Positive FCF
Estimated annual production of 200k Au Oz between 2020 - 2025
CAPEX: $250- $300 million
CAS: 750 – 850 US$/AuOz

5. Financial Results

930
1,069
1,274
1,400 – 1,500
2015 2016 2017 2018E
Notes: (1) 2016 Net Income includes Yanacocha’s impairment of US$ 388.2 M(2) Estimates based on BVN’s Budget 2018
In US$ millions In US$ millions
In US$ millions In US$ millions
Total Revenues EBITDA Direct Operations
Net Income(2) EBITDA Including Affiliates
100
334 372
430 – 510
2015 2016 2017 2018E
(317) (323)
61
150 - 250
2015 2016 2017 2018E
372
646 714
700 – 800
2015 2016 2017 2018E
(1)
14%
26%
228%
5%

25%
17%58%
< 1 año
< 1 & 2 años>
<2 & 5 años>
Net Debt / EBITDA
Notes: (1) Consolidated debt includes: 100% BVN, 100% La Zanja, 100% El Brocal and 100% Huanza(2) Huanza’s debt is non recourse to BVN
5.3x
4.0x
2.5x
2.0x1.7x 1.7x
1.9x
1.5x1.4x
<1.0x
4Q15 1Q16 2Q16 3Q16 4Q16 1Q17 2Q17 3Q17 4Q17 2018
Total Debt:US$ 729M
BBB-(STABLE)
Ba2(STABLE)
Liquidity ratio
Debt ratio
Debt Profile (1) (2)
2017 Ratios Debt Ratings
1.13x
1.35x
2016
2017
0.29x
0.29x
2016
2017

Source: Bloomberg and Buenaventura’s filingsNotes: (1) Considers 100% from BVN, 53.06% from La Zanja and 40.095% from Coimolache
(2) Estimates based on BVN’s Budget 2018(3) BVN’s Peers includes Gold Fields, Anglogold, Yamana, Kinross, Newcrest, Agnico, Newmont, Barrick and Goldcorp
706
856 700-800
922
2016 2017 2018E 2017 BVN's Peers
All-in Sustaining Cost (1)
(2) (3)
In US$/ Au Oz
-14%

Notes: (1) Consolidated Capex includes 100% BVN, 100% La Zanja and 100% El Brocal.(2) Considers the de-bottlenecking program
Consolidated Capex (1) (2) 2018E Consolidated Capex by Asset
117 120-140
143 60 - 80
260
180 - 220
2017 2018E
Sustaining Growing
Uchucchacua15%
Tambomayo10%
Orcopampa12%
La Zanja6%
El Brocal28%
Projects25%
Others3%
US$ M180 – 220
In US$ millions
-23%

Implementing de-bottlenecking program in our operations to increase its profitability
Committed to generating value for our stake holders (employees, shareholders, rural communities, country)
BVN 100% based in Peru, one of the most prolific mineral countries in the world
Establishing best practices for Project management
Long tradition of ore reserves replenishment
I.
II.
III.
IV.
V.
Sup
po
rt
OPERATIONS
PROJECTS
Drivers
Safety
Human Resources
Social Management
Environmental Management
Technology and Innovation
Energy
Communications
Head Office
TambomayoOrcopampa
CoimolacheLa Zanja
Yanacocha
Gold
Base Metals
Silver
Gold
Silver
Base Metals
Uchucchacua- MallayJulcani
San GabrielQuecher Main
Yumpaq
El Faique Trapiche
San GregorioMarcapunta Norte-Sur
Yanacocha’s SulfidesCoimolache’s Sulfides
El BrocalCerro Verde


2,6452,524
1,111 913
216 61
654
286292
Dec-16 Explo. Reinterp. Prod. Dec-17 Resources16'
Resources17'
In 000 AuOz
Mineral Reserves – Consolidated (oz Au-Eq)
Orcopampa, La Zanja, Tambomayo, Tantahuatay
2,3772,354
872 753
176 27
482
219 248
Dec-16 Explo. Reinterp. Prod. Dec-17 Resources16'
Resources17'
85 88
33 58
18.4 5.8
20.9
19.3
60.4
26.9
31.4
Dec-16 Explo. Reinterp. Prod. Dec-17 Resources16'
Resources17'
Uchucchacua, Mallay, Julcani
In 000 AuOz
In M AgOz
Mineral Reserves – Consolidated (oz Au-Eq)
Orcopampa, Tambomayo, Tantahuatay
Mineral Reserves – Consolidated (oz Ag-Eq)
Yumpaq
Notes: (1) Includes 256 more from Gold Fields Reserves
(1)
+3.5yrs
+4.5yrs
+4.0yrs

372404
15879
125
85
178
4278
Dec-16 Explo. Reinterp. Prod. Dec-17 Resources16'
Resources17'
929 834
225 213
95
157 160
Dec-16 Explo. Reinterp. Prod. Dec-17 Resources16'
Resources17'
In 000 oz Au-Eq
Mineral Reserves – Orcopampa Mineral Reserves – Tambomayo
1,076 1,116
825 750
51 58
20996
103
Dec-16 Explo. Reinterp. Prod. Dec-17 Resources16'
Resources17'
256
268
170
239 160
4035
172
67
44
Dec-16 Explo. Reinterp. Prod. Dec-17 Resources16'
Resources17'
Mineral Reserves – Coimolache Mineral Reserves – La Zanja
In 000 oz Au-Eq
In 000 oz Au-Eq In 000 oz Au-Eq
+2.0yrs
+5.0yrs +1.0
yrs
+6.0yrs

74.377.7
3056
15.04.9
16.5
16
54
26.9
31.4
Dec-16 Explo. Reinterp. Prod. Dec-17 Resources16'
Resources17'
6.96.1
1.3 1.8
2.0 0.6
2.2
2.3 2.1
Dec-16 Explo. Reinterp. Prod. Dec-17 Resources16'
Resources17'
In M oz Ag-Eq
Mineral Reserves – Uchucchacua Mineral Reserves – Julcani
3.44.0
1.7
0.1
1.3
1.6
2.3
0.54.6
Dec-16 Explo. Reinterp. Prod. Dec-17 Resources16'
Resources17'
Mineral Reserves – Mallay
In M oz Ag-Eq
In M oz Ag-Eq
Yumpaq
+4.5yrs
+2.5yrs
+7.0yrs

1,1231,056
825 750
67 96103
Dec-16 Explo. Reinterp. Prod. Dec-17 Resources16'
Resources17'
1,014
866
422 435
148
Dec-16 Explo. Reinterp. Prod. Dec-17 Resources16'
Resources17'
Tajo Norte
In 000 MT In 000 MT
Mineral Reserves – El Brocal (MT Cu-Eq)
Smelter, Marcapunta
Mineral Reserves – El Brocal (MT Zn-Eq)
+14.5yrs
+12.0yrs

www.buenaventura.com
Investor Relations Contact:Rodrigo Echecopar, (511) 419-2591 – [email protected]


