22
1

1

This presentation discusses Microsoft® System Center 2012 - Operations Manager, the new features being delivered, and how they will be used to monitor and manage your infrastructure and applications. Operations Manager is a component of the full System Center 2012 product. The focus for Operations Manager is infrastructure management and tying applications to the supporting infrastructure.
2

The goal is to reduce the mean time to resolution for problems that you are seeing within your environments and with the applications that rely on those environments. Microsoft is expanding the focus the IT pro has on the infrastructure they are managing so that they are able to dig deeper into their environments and pull out more information, more quickly. That helps to get the application teams as well as the networking teams and the infrastructure teams working together to solve problems.
The shift from Microsoft Operations Manager in 2005 to System Center Operations Manager 2007 moved from server management to application management. Operations Manager 2007 introduced templates to work with applications and other objects, and had more of a modeling approach to working with the environment. Operations Manager 2007 R2 introduced cross-platform support, bringing in UNIX and Linux servers, and extended the scope of what you can do with Operations Manager.
System Center 2012 – Operations Manager added several major improvements, including the networking layer, and more support for Microsoft .NET applications and Java applications.
3

This discussion covers the main areas of the 2012 version of Operations Manager, including network device monitoring, .NET application monitoring, Java application monitoring, UNIX and Linux support, and the new visualizations that you can do through dashboards as well as Microsoft SharePoint® integration.
It is now easier to roll out Operations Manager, extend the scale of the Operations Manager infrastructure, and scale out the overall capacity of the system.
4

Customer feedback indicated that the Root Management Server (RMS) was the main bottleneck. It was handling a lot of load and it was the single point of failure. If the RMS went down, the entire management group could go down. That made the management group very difficult to manage, and introduced problems in planning and deploying Operations Manager properly.
For the 2012 version of Operations Manager, Microsoft removed the RMS role and confederated the configuration services, spreading the load that the RMS used to handle across multiple management servers, which simplifies deployment.
When considering scale, it always came down to a case of how many management servers were needed now, and how to add more later. Resource pools let you add new management servers easily without having to manually balance the roles and agentless workflows.
5
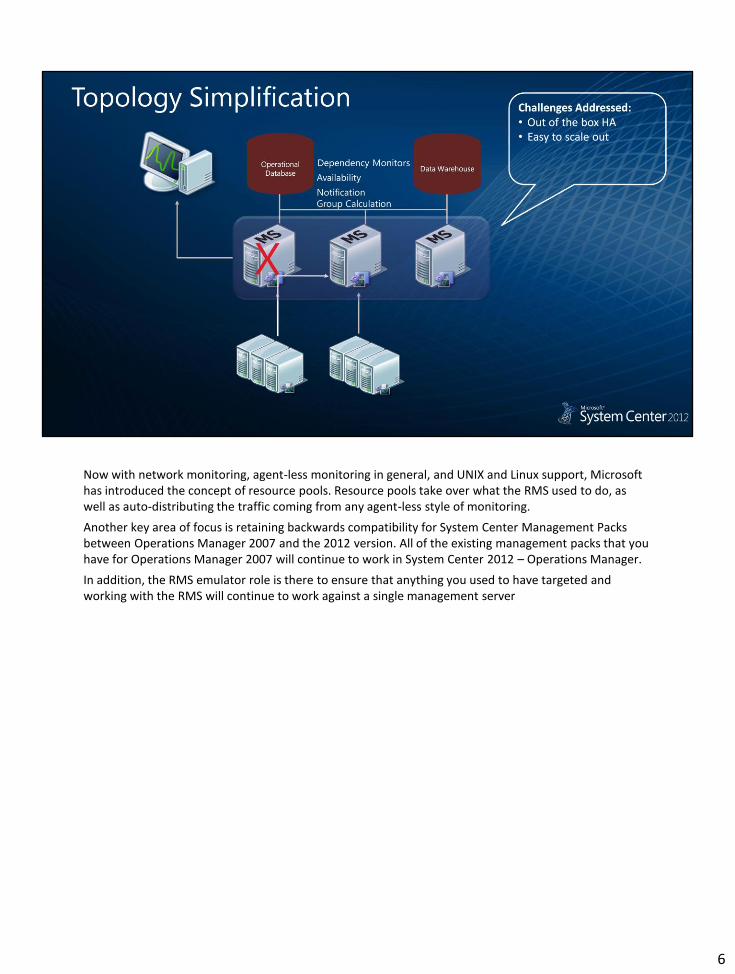
Now with network monitoring, agent-less monitoring in general, and UNIX and Linux support, Microsoft has introduced the concept of resource pools. Resource pools take over what the RMS used to do, as well as auto-distributing the traffic coming from any agent-less style of monitoring.
Another key area of focus is retaining backwards compatibility for System Center Management Packs between Operations Manager 2007 and the 2012 version. All of the existing management packs that you have for Operations Manager 2007 will continue to work in System Center 2012 – Operations Manager.
In addition, the RMS emulator role is there to ensure that anything you used to have targeted and working with the RMS will continue to work against a single management server
6

Looking at the topology in a small environment, you could have several agents that are all talking to each other through a single management server. You could have some UNIX and Linux servers talking to Operations Manager as well as to network devices. With this small pool, you want to be able to scale it out, and you want to be sure that it is very easy to do, which is where resource pools come in.
Looking at a management server running standard rules, the dependency monitors rollups, the notification service, and group calculations are all working out of the single management server. These are all talking to the two databases: the operational database and the data warehouse.
As you decide to expand the capacity, you will add additional servers into the management pool group. You roll out another management server that will be in the same pool. As soon as you do this, some of the roles that were running on the first management server automatically get balanced to the new management server. This takes the load off the first server, and spreads it out around the pool. As you add additional management servers, the roles will further balance. Therefore, the pool will take care of making sure that you have enough resources and you are doing everything you can to spread out across the various management servers. In addition, if one goes down, the role that would be running on that server will automatically fail over to the other management server. Everything is balanced across the pool.
There is no auto-balancing for agents. They still follow the Operations Manager 2007 flow of having specified primary and secondary management servers that they report to.
7

Here’s a breakdown of a single management server, and how the devices are going to work.
Anything agent-less, anything coming from a network device, or UNIX or Linux servers, now target pools. Instead
of targeting at a single server, all of these workflows are going to target the pool, and they don’t know which
server they’re going to be running against. If one of those servers goes down, the workflows automatically
failover to another management server, and that server takes on monitoring those devices without you noticing
any downtime.
Microsoft has invested in network device monitoring, based on input from customers that requested the ability
to see what’s going on at the network layer. Frequently, when network administrators hear of an issue with an
application, they have a tendency to say they don’t have any proof that there’s a problem, and request proof
before they will look into it. Operators need insight into the network layer. Microsoft is not trying to replace the
existing network monitoring tools, but simply to provide a view on the network to verify if there are problems.
An operator needs to gain insight and get to a root cause quickly. Operations Manager gives this insight and that
reduces the back and forth between the application and network administrators trying to figure out what going
on.
8
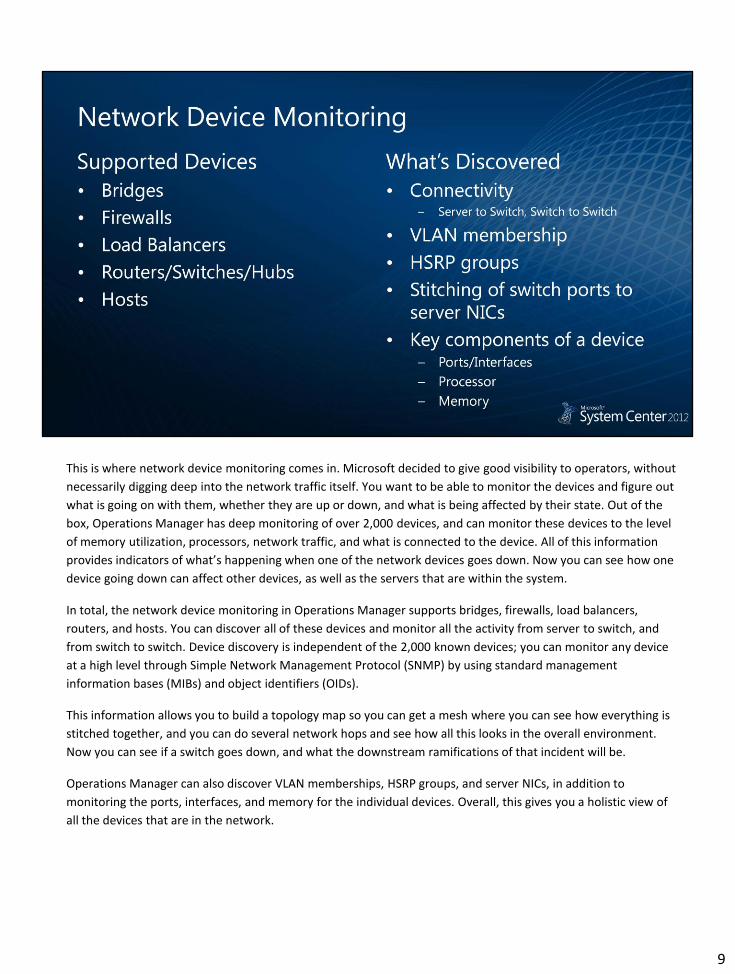
This is where network device monitoring comes in. Microsoft decided to give good visibility to operators, without
necessarily digging deep into the network traffic itself. You want to be able to monitor the devices and figure out
what is going on with them, whether they are up or down, and what is being affected by their state. Out of the
box, Operations Manager has deep monitoring of over 2,000 devices, and can monitor these devices to the level
of memory utilization, processors, network traffic, and what is connected to the device. All of this information
provides indicators of what’s happening when one of the network devices goes down. Now you can see how one
device going down can affect other devices, as well as the servers that are within the system.
In total, the network device monitoring in Operations Manager supports bridges, firewalls, load balancers,
routers, and hosts. You can discover all of these devices and monitor all the activity from server to switch, and
from switch to switch. Device discovery is independent of the 2,000 known devices; you can monitor any device
at a high level through Simple Network Management Protocol (SNMP) by using standard management
information bases (MIBs) and object identifiers (OIDs).
This information allows you to build a topology map so you can get a mesh where you can see how everything is
stitched together, and you can do several network hops and see how all this looks in the overall environment.
Now you can see if a switch goes down, and what the downstream ramifications of that incident will be.
Operations Manager can also discover VLAN memberships, HSRP groups, and server NICs, in addition to
monitoring the ports, interfaces, and memory for the individual devices. Overall, this gives you a holistic view of
all the devices that are in the network.
9

Operations Manager monitors if ports are up or down, and the operational as well as the administration
status of the individual ports. Similarly, Operations Manager measures volume; specifically, the inbound
and outbound traffic on the ports, and the utilization rate. It can monitor the ports very closely so you
can tell when problems may be arising.
When the device is fully monitored, Operations Manager also handles processor and memory metrics. It
can determine how heavily a device is being used, and whether you need to roll out additional devices
into the environment in order to handle the load that is flowing through the network.
10

By using Operations Manager, a lot of new information from the network devices is available to the
operations team that wasn’t necessarily there before. Microsoft has done a lot of work on dashboards to
make sure you can visualize this information in a very easy and consumable way.
This slide shows an example of the network vicinity dashboard view, where you can see the actual
network node. From the node in the middle, you have a one-hop set, and you can see what it is
connected to. It shows that it is connected to multiple switches and routers, and there are Windows
servers connected to the switches.
You can also see what’s going on from a key performance indicator (KPI) perspective, such as availability:
you can show if this device has been up continuously, and if you have 100 percent availability. Similarly,
you can see what the availability has been like for the past week, or for the last 30 days, for example. You
can see service level agreements (SLAs) for this individual device easily and quickly, and can tell if this is a
problem you’re seeing for the first time, or a recurring issue.
11
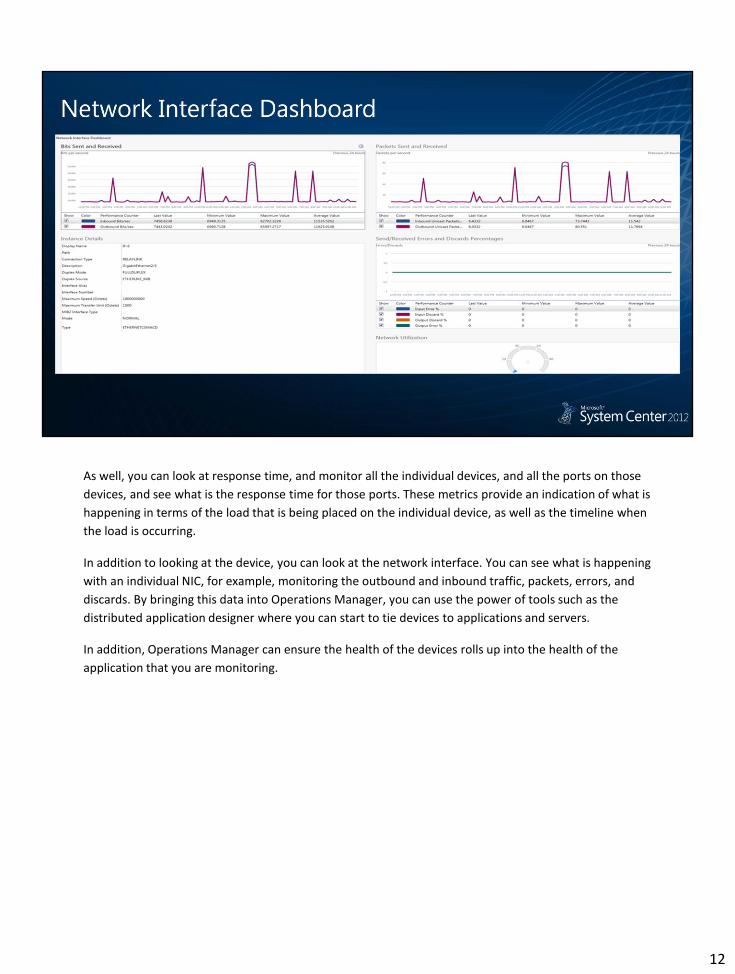
As well, you can look at response time, and monitor all the individual devices, and all the ports on those
devices, and see what is the response time for those ports. These metrics provide an indication of what is
happening in terms of the load that is being placed on the individual device, as well as the timeline when
the load is occurring.
In addition to looking at the device, you can look at the network interface. You can see what is happening
with an individual NIC, for example, monitoring the outbound and inbound traffic, packets, errors, and
discards. By bringing this data into Operations Manager, you can use the power of tools such as the
distributed application designer where you can start to tie devices to applications and servers.
In addition, Operations Manager can ensure the health of the devices rolls up into the health of the
application that you are monitoring.
12

With application monitoring, you are able to monitor .NET applications. Operations Manager 2007 had the ability to monitor applications if they were Windows® NT services or processes. Operations Manager 2007 also had synthetic transactions that could monitor web applications. However, customers requested that Microsoft provide more information related to application availability; to deliver on this, Operations Manager now provides deeper application insight. Microsoft has integrated AVIcode technology directly into Operations Manager, allowing you to dig deep into any .NET web application.
Today, most of the applications that are managed are poorly instrumented to start with. The developers are typically under time pressure to simply finish the application, and cannot spend a lot of time making it manageable. Thus, you have to make sure that you have tools that allow you to manage the application.
By hooking into the .NET Framework as a profiler, Operations Manager can attach to any application and generate KPIs. Management packs are required for Operations Manager to attach to an application. This is done in a generic manner for any .NET web application.
This method can be used in production as it is a lightweight profiler, avoiding the need to profile every single call that goes through the application. It uses entry points of common ways that applications will be called, ProcessRequest(), or Invoke() for a service, and monitors from that point on only. This method keeps the footprint of the profiler down, and allows you to work in production and ensure no load is put on the application you are monitoring.
13
Follow along as this demo shows a customer’s ordering experience on Dinner Now’s website.
In this example, while doing a search for breakfast, a performance problem is encountered once the Find button is clicked. During the order process, the customer can’t order a desired item, a muffin, due to an error on the page. After choosing waffles instead of a muffin, the page is working, and the customer can proceed to checkout. By clicking “Bring me my meal” the customer can complete the order, but because the customer could not order what they wanted, they want to go back to the cart. This leads to additional errors within the application. These are errors that may or may not result in a call from an end user reporting them to the support team.
This is where Operations Manager comes in. These errors can be pulled into Operations Manager and made available to you through alerts within Operations Manager or the two new consoles of Application Advisor and Diagnostics.
Start by looking at the shopping cart failure. This is an exception showing that you cannot order some type of food, and you can see what occurred, and the error, with a snippet of the code where the problem is coming from. As an operator you might not know what this means, but you have proof that you can send to an application team that there are customers having issues and that you have a bug in the code.
So you can capture the error. As an operator, you need to make sure the site is up and running for your customers. You will probably do a rollback, because this is related to a recent configuration change when you rolled out a new version, and you had a special going on that is affecting the site. Therefore, the developers might not necessarily know how to fix it unless you capture this information. So this is captured, and you can copy or export the information directly to a developer.
Search
Another typical end-user experience issue that you would try to solve is slow performance of the search function. Solving this problem utilizes the browser, which you can inject with Javascript automatically after monitoring is configured. Operators can monitor factors such as the time-to-first byte, or how long it takes for a page to load and be usable. You can use the technology to determine how much time is spent on the server side, which is a key point to discover. In the example given, looking at the exception that was received, the total time was 7 seconds, and of this, 6.5 were spent on the server side.
Distributed chains
Distributed chains link together events that occur through a full user transaction. Through them, you can see the client side and the server side search, as well as drilling deeper, you can see where the end users end up in the process. The information produced gives clues to the root cause of the problem.
In the event properties, you can see the resource group view and what is happening on the server side. From the ASP page, you can see the SQL and WPF calls and where the latency may be that is causing the problem. From the distributed chain, you can drill into individual WCF calls for example, and see that going from the client page to the server, and to the business layer, the root cause of the problem is a SQL query. The SQL calls are taking too long to return. This is what you send to the application team so they can diagnose why this query is so slow. They can likely fix the problem by adding an index.
This illustrates the type of information you can get in Operations Manager, allowing you to react to problems very quickly.
Application Advisor
Additionally, the Application Advisor tool lets you be very proactive in managing problems before they happen, rather than waiting for the alerts to come in to act on them. This allows you to build reporting around all of the information that is pulled into Operations Manager.
For example, consider the Problems Distribution Analysis report, which looks at all data sources and applications. This will create a chart, which will show what applications are causing the problems on a percentage basis. From this example, you can see it is the business layer and the front end that are causing all the problems. The chart will show the failures and the performance problems.
Looking at the service, you can see it is the database and web service calls causing the problems. This will list the SQL queries that are being done, so you can evaluate which one is the problem.
Another option in working with alerts is to look at application diagnostics. With this console, you can see every event that has come into the system. As you roll out applications, you can use monitors over alerts to be proactive in finding performance issues, which avoids getting an alert for every event. For example, in the application diagnostics you can see the events being stored and group them by problem. This allows you to reduce the event count substantially, and highlights the core problems such as exceptions and slow calls, and non-critical exceptions. This chart will show the repeat counts, so you can see what is happening frequently that you should be aware of, and thus prioritize what you should fix.
14
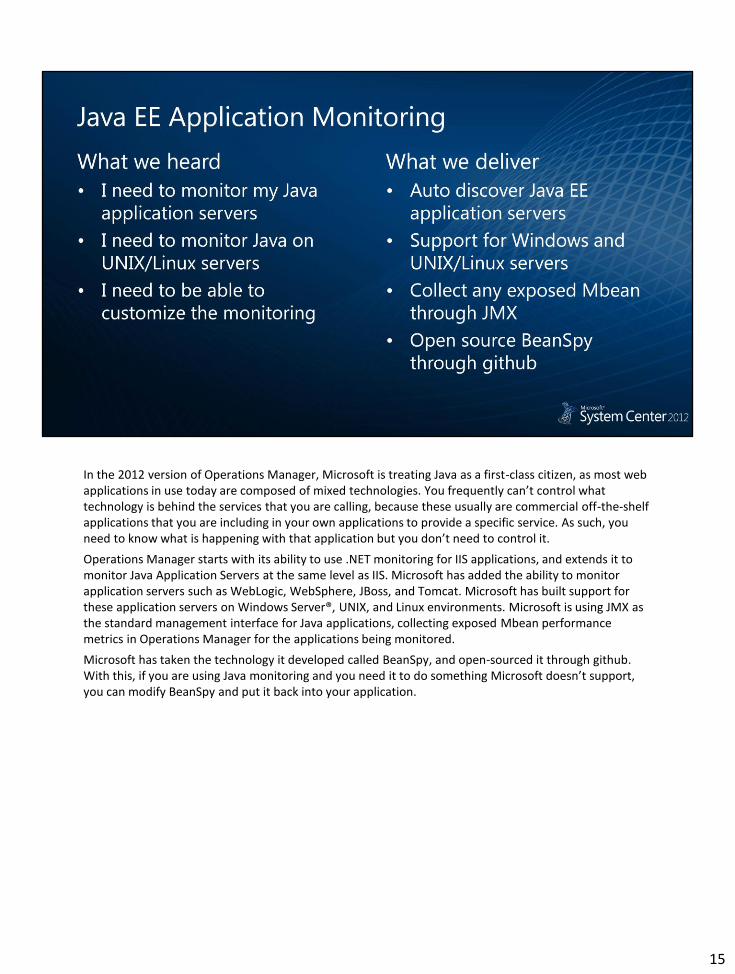
In the 2012 version of Operations Manager, Microsoft is treating Java as a first-class citizen, as most web applications in use today are composed of mixed technologies. You frequently can’t control what technology is behind the services that you are calling, because these usually are commercial off-the-shelf applications that you are including in your own applications to provide a specific service. As such, you need to know what is happening with that application but you don’t need to control it.
Operations Manager starts with its ability to use .NET monitoring for IIS applications, and extends it to monitor Java Application Servers at the same level as IIS. Microsoft has added the ability to monitor application servers such as WebLogic, WebSphere, JBoss, and Tomcat. Microsoft has built support for these application servers on Windows Server®, UNIX, and Linux environments. Microsoft is using JMX as the standard management interface for Java applications, collecting exposed Mbean performance metrics in Operations Manager for the applications being monitored.
Microsoft has taken the technology it developed called BeanSpy, and open-sourced it through github. With this, if you are using Java monitoring and you need it to do something Microsoft doesn’t support, you can modify BeanSpy and put it back into your application.
15

Microsoft supports these operating systems for Java:
Tomcat for Linux and Windows.
JBoss for Linux and Windows.
WebSphere for Linux, Windows, and AIX.
WebLogic for Linux, Windows, and Solaris.
16

Microsoft has made investments in supporting UNIX and Linux operating systems. Microsoft is answering one of the biggest concerns with UNIX and Linux users, which is root access for monitoring the environment. This is achieved through adding support for SSH keys and Sudo elevation. Administrators can use these techniques to get workflows to run the way they want, such as agent deployment and setup.
Operations Manager is increasing high availability in UNIX and Linux environments:
In previous versions of Operations Manager, information would be pulled in from the UNIX and Linux systems through the CIM server into the management server, which was not efficient and was time consuming.
Now with management pools, Microsoft has extended these capabilities to UNIX and Linux as the CIM servers do not need to target an individual management server, but rather a management pool.
Thus, if a management server in the pool is running the workflows for a UNIX or Linux server, and goes down, the workflows will automatically failover to another management server. This provides high availability for UNIX and Linux monitoring.
A new shell command collection rule in Operations Manager allows you to extend what you can use to output data, and pull it into Operations Manager and consume it as performance data. For example, the number of connected users could execute through an Operations Manager workflow and show how many users are connected to your system at any given time. These features give you many options in working with UNIX and Linux support environments.
17

Most everything in Operations Manager is managed through templates. For example with .NET, you just need to use the Add Monitoring wizards to specify what you want to monitor, such as the applications. The wizards in Operations Manager greatly simplify configuring monitoring on the .NET side.
With Java, Microsoft utilizes the same approach as with .NET applications, using templates to set up availability and performance monitoring of Java applications. Java templates are included in the product for availability monitoring. An MBean browser has been added to the template wizard to speed setup and configuring monitoring. Filtering is included in the search capability to assist finding MBean names.
You can look at a thread count to show health, and specify the alerts that you can give. Through the monitoring pane, you can see the Tomcat operating systems that can be discovered, along with availability, health, state, and performance monitoring.
Discovery of servers
Operations Manager includes a wizard to easily discover the UNIX and Linux servers. You can discover these through IP addresses or DNS names. This is a secure process that can be controlled through using different security credentials and policies for each group of servers. Through the administration space, options are presented for what you can do with UNIX and Linux systems, such as changing resource pools.
Shell commands
Rule creation for shell commands has been streamlined, and can be done with the new wizard. Using the wizard makes it easier to create rules that can be used on the UNIX and Linux servers and have the data input to Operations Manager
18

Users need a way to push different data to different people. Operations Manager provides IT pro dashboards with generic widgets. Dashboards help to monitor Operations Manager itself, showing information such as agent health and management pool roles. Dashboards can be presented through thick clients, the web console, and SharePoint.
A Microsoft Visio® plug-in works with SharePoint to present the dashboards and the data. The Operations Manager web part can expose dashboards and create mashups and pages in SharePoint.
Service level dashboards have been improved by having them integrated directly into Operations Manager. There are templates for dashboards to avoid having to manually create them.
19
To create a new dashboard in Operations Manager, you can use the wizard that has default layouts. This offers a consistent view for Microsoft Exchange, Microsoft SQL Server® database software, and Microsoft Internet Information Services (IIS). Any of these products can create management packs with a consistent view across the product that makes it easier for IT pros to consume the data.
Health, state, and performance views are all included with layout, and no longer need to be configured individually. You can customize the views to add in additional data objects from web servers and the like. The alert and state views in Operations Manager have improved over previous versions by allowing you to add multiple objects to the views.
Service-level dashboards are now included in Operations Manager and can include objects and SLAs in them.
Visio integration
The diagram view shows the application all-up, which can be exported to Visio, and can get health status in real time. This can be modified according to your needs, including changing the color of the icons and objects depending on the level of health in Operations Manager. You can link the health state of the application components shown in the Visio diagram to the Operations Manager data.
You can export the Visio diagram to a SharePoint site and have it updating in real time. You can also link SharePoint sites to Operations Manager dashboards. Now end users can consume all the data they need, through SharePoint. You can also create mash-ups, using different data sources on one single SharePoint page.
20

Microsoft has made the upgrade from Operations Manager 2007 to the 2012 version seamless and efficient. To ensure you don’t lose anything in the translation, features such as Audit Collection Services (ACS) continue to work, and are backwards compatible, preserving any previous investment you have made. Agentless Exception Monitoring (AEM) will also work and is backward compatible as well.
Distributed Application Designer (DAD) has been improved with the addition of .NET three-tier applications, allowing you to roll up availability, performance, security, and health state to the DAD itself. Overall performance for DAD has been improved as well, by decreasing the load time.
Reporting and data warehouse performance in Operations Manager has been increased as well, and new cmdlets have been added to PowerShell.
The ability to manage the importing of management packs has been improved, to allow accurate importing of these from Operations Manager 2007 to the 2012 version. Management packs are compatible across both versions of Operations Manager.
21

22


