140
United States International Trade Commission Recent Trends in U.S. Services Trade: 2018 Annual Report June 2018 Publication Number: 4789 Investigation Number: 332-345

United States International Trade Commission
Recent Trends in U.S. Services Trade: 2018 Annual Report
June 2018 Publication Number: 4789 Investigation Number: 332-345

United States International Trade Commission
Commissioners Rhonda K. Schmidtlein, Chairman
David S. Johanson, Vice Chairman
Irving A. Williamson
Meredith M. Broadbent
Jason E. Kearns
Catherine DeFilippo Director, Office of Operations
Jonathan Coleman Director, Office of Industries
Address all communications to Secretary to the Commission
United States International Trade Commission Washington, DC 20436
Recent Trends in U.S. Services Trade: 2018 Annual Report
June 2018 Publication Number: 4789 Investigation Number: 332-345

This report was prepared principally by:
Project Leaders Jeremy Streatfeild [email protected]
Isaac Wohl [email protected]
Principal Authors Chapter 1 Art Chambers [email protected]
Cynthia Payne [email protected]
Chapter 2 Art Chambers [email protected] Jeremy Streatfeild [email protected]
Isaac Wohl [email protected]
Chapter 3 Erick Oh [email protected] George Serletis [email protected]
Isaac Wohl [email protected]
Chapter 4 Sharon Ford [email protected] Sarah Oliver [email protected]
Chapter 5 Eric Forden [email protected]
Chapter 6 Jennifer Powell [email protected]
Content Reviewers Gregory Taylor and Mihir Torsekar
Office of Analysis and Research Services
Judy Edelhoff Peg Hausman
Maureen Letostak Jeremy Wise
Administrative Support
Gwenetta Duvall, Deion McNair, and Monica Sanders
Under the direction of Martha Lawless, Chief
Services Division Office of Industries
U.S. International Trade Commission | 1
Preface This report is the 22nd in a series of annual reports on recent trends in U.S. services trade that the U.S. International Trade Commission (Commission or USITC) has published. The Commission also publishes an annual companion report on U.S. trade in goods, Shifts in U.S. Merchandise Trade. These recurring reports are the products of an investigation instituted by the Commission in 1993 under section 332(b) of the Tariff Act of 1930.1 This report is one of the regular publications by the Commission that presents expert analysis of trade in services industries, drawing on fieldwork as well as published sources to apprise the Commission’s customers and the public of global industry trends, regional developments, and competitiveness issues.2
1 On August 27, 1993, acting on its own motion under section 332(b) of the Tariff Act of 1930 (19 U.S.C. 1332(b)), the USITC instituted investigation no. 332-345, Annual Reports on U.S. Trade Shifts in Selected Industries. On December 20, 1994, the USITC on its own motion expanded the scope of this report to include more detailed coverage of services industries. Under the expanded scope, the USITC publishes two annual reports, Shifts in U.S. Merchandise Trade and Recent Trends in U.S. Services Trade. The USITC’s current report format provides a systematic means of examining and assessing major trade developments with leading U.S. trading partners in the services, agriculture, and manufacturing sectors. Beginning in 2013, Recent Trends has rotated its coverage between professional services, electronic services, distribution services, and financial services. The 2017 Recent Trends report focused on professional services. The previous report covering electronic services was published in 2014. 2 Commissioner Jason E. Kearns did not participate in this annual report.

2 | www.usitc.gov

U.S. International Trade Commission | 3
Abstract Recent Trends in U.S. Services Trade: 2018 Annual Report focuses on U.S. exports and imports of electronic services, particularly audiovisual, computer and data processing, and telecommunications services, as well as sales of these services by foreign affiliates of U.S. firms and purchases from U.S. affiliates of foreign firms. In 2016, the United States exported $93.4 billion in cross-border electronic services and imported $54.3 billion, resulting in a trade surplus of $39.1 billion. In 2015, sales by foreign affiliates of U.S. electronic services firms totaled $270.1 billion, and purchases from U.S. affiliates of foreign electronic services firms totaled $132.7 billion. U.S. electronic services contributed $989.0 billion to U.S. gross domestic product (GDP) in 2016, or 6.9 percent of total U.S. private sector GDP. Electronic services employed over 3.7 million full-time equivalent employees in 2016, representing 3.3 percent of U.S. total private-sector employment. Electronic services workers earned an average wage of $106,052 in 2016 (compared to $59,485 in the private sector overall).
Electronic services are supplied on increasingly fast and pervasive telecommunications networks that give a rising number of people access to high-bandwidth internet connections. As a result, cloud-based application platforms can now offer cheaper data storage and processing power for a range of computer services. Consumers benefit from faster internet speeds and cloud storage to access data-intensive content on their smartphones as well as on their computers. Demand for electronic services is expected to grow steadily in the coming years as firms offer new services in new ways to a growing number of customers.

4 | www.usitc.gov
U.S. International Trade Commission | 5
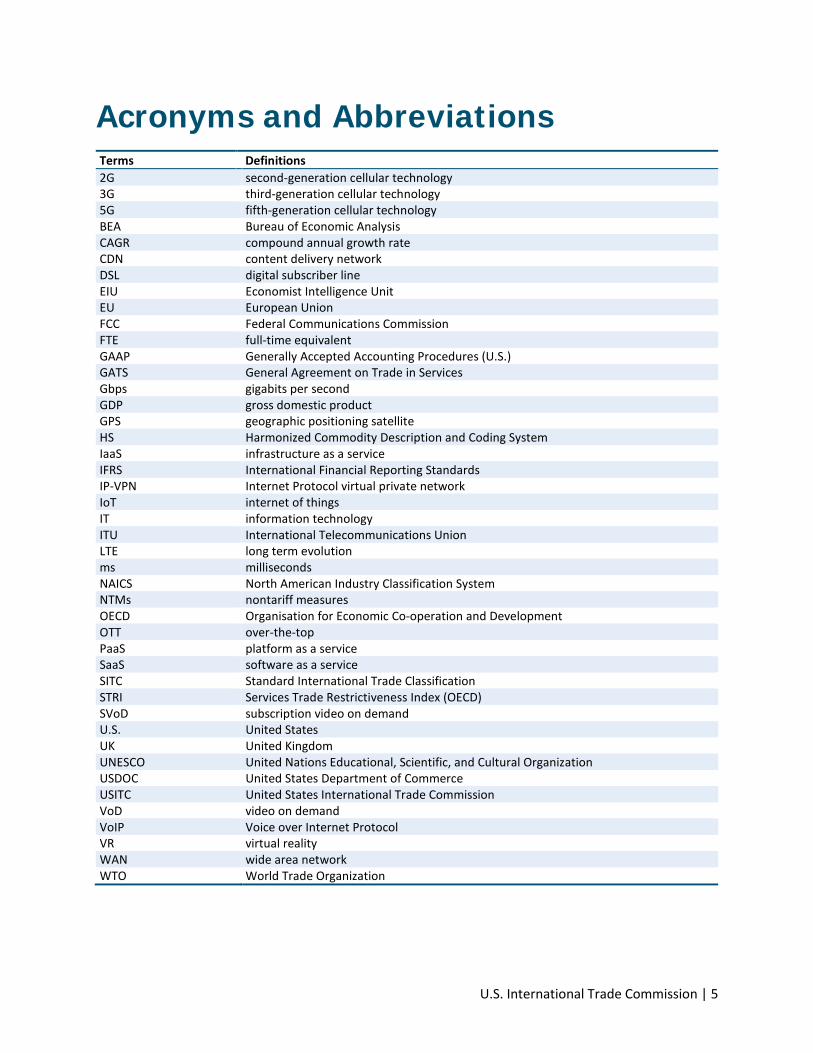
Acronyms and Abbreviations Terms Definitions 2G second-generation cellular technology 3G third-generation cellular technology 5G fifth-generation cellular technology BEA Bureau of Economic Analysis CAGR compound annual growth rate CDN content delivery network DSL digital subscriber line EIU Economist Intelligence Unit EU European Union FCC Federal Communications Commission FTE full-time equivalent GAAP Generally Accepted Accounting Procedures (U.S.) GATS General Agreement on Trade in Services Gbps gigabits per second GDP gross domestic product GPS geographic positioning satellite HS Harmonized Commodity Description and Coding System IaaS infrastructure as a service IFRS International Financial Reporting Standards IP-VPN Internet Protocol virtual private network IoT internet of things IT information technology ITU International Telecommunications Union LTE long term evolution ms milliseconds NAICS North American Industry Classification System NTMs nontariff measures OECD Organisation for Economic Co-operation and Development OTT over-the-top PaaS platform as a service SaaS software as a service SITC Standard International Trade Classification STRI Services Trade Restrictiveness Index (OECD) SVoD subscription video on demand U.S. United States UK United Kingdom UNESCO United Nations Educational, Scientific, and Cultural Organization USDOC United States Department of Commerce USITC United States International Trade Commission VoD video on demand VoIP Voice over Internet Protocol VR virtual reality WAN wide area network WTO World Trade Organization

6 | www.usitc.gov

U.S. International Trade Commission | 7
Table of Contents Preface ............................................................................................................... 1 Abstract .............................................................................................................. 3 Acronyms and Abbreviations .............................................................................. 5 Executive Summary .......................................................................................... 11 Chapter 1 Introduction ...................................................................................... 17
Data and Organization .............................................................................................................. 18 The U.S. Services Sector ............................................................................................................ 19 Global Services Trade ................................................................................................................ 19 Cross-border Services Trade, 2016–17 ..................................................................................... 23 Affiliate Transactions, 2015 ...................................................................................................... 28 GDP, Employment, Labor Productivity, and Salaries ................................................................ 31 Bibliography .............................................................................................................................. 33
Chapter 2 Electronic Services ............................................................................ 37
Overview ................................................................................................................................... 37 Data Sources ............................................................................................................................. 38 Shifts in Electronic Services ...................................................................................................... 38 U.S. Trade in Electronic Services ............................................................................................... 40 GDP, Employment, Labor Productivity, and Salaries in Electronic Services ............................. 43 Bibliography .............................................................................................................................. 46
Chapter 3 Audiovisual Services ......................................................................... 51
Summary ................................................................................................................................... 51 Introduction .............................................................................................................................. 52 Market Conditions .................................................................................................................... 53 Supply and Demand Factors ..................................................................................................... 58
Growth of Streaming Services .............................................................................................. 58 China’s Film Market and Its Growing Ties with Hollywood .................................................. 59
Trade Trends ............................................................................................................................. 61
Cross-border Trade ............................................................................................................... 61
Affiliate Transactions ................................................................................................................ 64 Outlook ..................................................................................................................................... 66 Bibliography .............................................................................................................................. 67
Chapter 4 Computer and Data Processing Services............................................ 71
Summary ................................................................................................................................... 71 Introduction .............................................................................................................................. 72 Market Conditions .................................................................................................................... 74 Supply and Demand Factors ..................................................................................................... 77
Software Services and “Leapfrogging” in Emerging Markets ............................................... 79
Recent Trends in U.S. Services Trade: 2018 Annual Report
8 | www.usitc.gov
The Digitization of Manufacturing ........................................................................................ 83
Trade Trends ............................................................................................................................. 85
Cross-border Trade ............................................................................................................... 85 Affiliate Transactions ............................................................................................................ 87
Outlook ..................................................................................................................................... 90 Bibliography .............................................................................................................................. 92
Chapter 5 Telecommunications Services ........................................................... 97
Summary ................................................................................................................................... 97 Introduction .............................................................................................................................. 97 Market Conditions .................................................................................................................... 98 Supply and Demand Factors ................................................................................................... 101
Network Infrastructure and New Devices .......................................................................... 101 Carriers Enter Complementary Content and Advertising Markets .................................... 104 Data Centers and Interconnection Capacity ....................................................................... 105
Trade Trends ........................................................................................................................... 106
Cross-Border Trade ............................................................................................................. 106 Affiliate Transactions .......................................................................................................... 109
Outlook ................................................................................................................................... 110 Bibliography ............................................................................................................................ 111
Chapter 6 Services Roundtable ....................................................................... 117
The Relationship between Goods and Services Trade ........................................................... 117 Developments in the Tradability of Services .......................................................................... 118
Appendix A Summary of Selected Services Research ....................................... 121 Appendix B Data Tables for Figures ................................................................. 129
Boxes Box 1.1: Services Trade “Modes of Supply” under the World Trade Organization's General Agreement on Trade in Services (GATS) ....................................................................................... 22 Box 2.1: Artificial Intelligence in Electronic Services .................................................................... 39 Box 3.1: Understanding Data on Cross-Border Trade and Affiliate Transactions in Audiovisual Services ......................................................................................................................................... 65 Box 4.1: Latency and Demand for Computer Services ................................................................. 78 Box 4.2: Understanding Data on Cross-border Trade and Affiliate Transactions in Computer Services ......................................................................................................................................... 89 Box 5.1: Understanding BEA Data on Cross-Border Trade and Affiliate Transactions in Telecommunications Services ..................................................................................................... 106 Box 5.2: U.S. Telecom Carriers in the Global Market ................................................................. 109

Table of Contents
U.S. International Trade Commission | 9
Figures Figure 1.1: Global services: Cross-border exports and imports of commercial services, 2016 ... 21 Figure 1.2: U.S. services: Cross-border trade by services industry, 2016 .................................... 24 Figure 1.3: U.S. services: Cross-border services trade and sales and purchases of services through affiliates, 2008—16 ......................................................................................................... 25 Figure 1.4: U.S. services: Affiliate sales and affiliate purchases by industry, 2015 ...................... 30 Figure 2.1: U.S. electronic services: Exports and imports by industry, 2016 ............................... 42 Figure 2.2: U.S. electronic services: Affiliate sales and affiliate purchases by industry, 2015 ..... 43 Figure 3.1: Audiovisual services: U.S. cross-border trade, 2011–16 ............................................ 62 Figure 3.2: Audiovisual services: U.S. cross-border exports and imports by country, 2016 ........ 63 Figure 3.3: Audiovisual services: Affiliate sales by country, 2015 ............................................... 65 Figure 4.1: Computer and data processing services: Mobile phone subscriptions per 100 people, 2008–16 ........................................................................................................................... 80 Figure 4.2: Computer and data processing services: Credit card use, mobile payment use, and GDP per capita in emerging markets, 2014 .................................................................................. 82 Figure 4.3: Computer and data processing services: U.S. cross-border trade, 2011–16 ............. 85 Figure 4.4: Computer and data processing services: Cross-border trade by country, 2016 ........ 86 Figure 4.5: Computer and data processing services: Net U.S. cross-border trade by country, 2016 .............................................................................................................................................. 87 Figure 4.6: Computer and data processing services: U.S. affiliate sales by country, 2015 .......... 88 Figure 4.7: Computer and data processing services: U.S. affiliate sales and purchases, 2011–15 .................................................................................................................................................. 89 Figure 5.1: Telecommunications services: U.S. cross-border trade, 2011–16 ........................... 107 Figure 5.2: Telecommunications services: U.S. cross-border trade by country, 2016 ............... 108
Tables Table 3.1: Audiovisual services: Top 10 countries by estimated global box office revenue and market share, 2016 ....................................................................................................................... 54 Table 3.2: Audiovisual services: Top 10 markets by estimated cinema admissions and global share, 2016 .................................................................................................................................... 55 Table 3.3: Audiovisual services: Top 10 countries, by estimated global feature film production and global share, 2016 .................................................................................................................. 56 Table 3.4: Audiovisual services: Leading movie studios by estimated U.S. revenue, 2017 ......... 57 Table 3.5: Audiovisual services: Top 10 films by estimated North American (NA) and international (INT) box office (BO) revenue, 2016 ....................................................................... 57 Table 4.1: Computer and data processing services: Total global revenue of computer services by type of service and region, 2016 (billion $) ............................................................................ 74 Table 5.1: Telecommunications services: Top 10 global telecommunications services firms by revenue, 2015 ............................................................................................................................... 99
Recent Trends in U.S. Services Trade: 2018 Annual Report
10 | www.usitc.gov
Table B.1: Global services: Cross-border trade of exports and imports of commercial services, 2016 ............................................................................................................................................ 131 Table B.2: U.S. services: Cross-border trade by services industry, 2016 ................................... 131 Table B.3: U.S. services: Cross-border services trade and sales and purchases of services through affiliates, 2008–16 ......................................................................................................... 132 Table B.4: U.S. services: Affiliate sales and affiliate purchases by sector, 2015 ........................ 132 Table B.5: U.S. electronic services: Cross-border trade by industry, 2016 ................................ 132 Table B.6: U.S. electronic services: Affiliate sales and affiliate purchases by industry, 2015 .... 133 Table B.7: Audiovisual services: U.S. cross-border trade, 2011–16 ........................................... 133 Table B.8: Audiovisual services: U.S. cross-border trade by country, 2016 ............................... 133 Table B.9: Audiovisual services: U.S. affiliate sales by country, 2015 ........................................ 134 Table B.10: Computer and data processing services: Mobile cellular subscriptions per 100 people, 2008–16 ......................................................................................................................... 134 Table B.11: Computer and data processing services: U.S. cross-border trade, 2011–16 .......... 134 Table B.12: Computer and data processing services: U.S. cross-border trade by country, 2016 ............................................................................................................................................ 135 Table B.13: Computer and data processing services: net U.S. cross-border trade by country, 2016 ............................................................................................................................................ 135 Table B.14: Computer and data processing services: U.S. affiliate sales by country, 2015 ....... 135 Table B.15: Computer and data processing services: Affiliate sales and purchases, 2011–15.. 136 Table B.16: Telecommunications services: U.S. cross-border trade, 2011–16 .......................... 136 Table B.17: Telecommunications services: U.S. cross-border trade by country, 2016 .............. 136

U.S. International Trade Commission | 11
Highlights by Sector
Audiovisual services are growing rapidly worldwide. The Chinese market is of growing interest to U.S. filmmakers, though state censorship and foreign film quotas limit market access.
In emerging markets, computer services are becoming widely available via mobile devices. Goods manufacturers are increasingly building computer-enabled services into their production processes.
U.S. telecommunications carriers are investing in network infrastructure, connecting a growing array of devices to the internet, and entering content and advertising markets.
Executive Summary
The United States remained the world’s largest cross-border services exporter and importer in 2016.3 U.S. cross-border services exports totaled $733.6 billion in 2016, and imports totaled $483.1 billion. Although U.S. cross-border services exports grew by only 0.2 percent in 2016, the United States remained highly competitive in the global services market; its share of global exports was more than double that of the United Kingdom (UK), the next-largest single-country exporter in 2016.
Preliminary data show that cross-border services exports grew by 3.8 percent to $761.7 billion in 2017, while imports grew by 6.8 percent, to $516.0 billion.
Sales by foreign affiliates of U.S. services firms totaled $1.4 trillion in 2015, while purchases from U.S. affiliates of foreign services firms totaled $952.5 billion.
3 This report uses the latest available data. Industry-level analyses may cover slightly different years depending on the source, but U.S. services trade data will largely be consistent throughout the report. As of the date of publication, World Trade Organization data were available through 2016. Annual data on cross-
border trade from the Bureau of Economic Analysis (BEA) of the U.S. Department of Commerce were available through 2016 (with preliminary data available for 2017), and BEA data on affiliate transactions were available through 2015. For details on the different modes of services trade, see box 1.1.
Recent Trends in U.S. Services Trade: 2018 Annual Report
12 | www.usitc.gov
Key Findings The United States Remained the Leading Global Exporter and Importer of Services in 2016 The top 10 exporting countries together accounted for 53.5 percent of global cross-border exports of private services4 in 2016, with the United States accounting for the largest share (15.2 percent). U.S. cross-border services exports totaled $733.6 billion, while U.S. imports totaled $483.1 billion. This resulted in a trade surplus in services of $250.4 billion. Leading export markets were the UK, China, Canada, Ireland, and Japan, which together accounted for 35.8 percent of U.S. cross-border services exports in 2016. Similarly, the UK, Germany, Japan, Canada, and India supplied the largest single-country shares of U.S. services imports, and collectively accounted for 33.5 percent of such imports. As in previous years, travel services and passenger fares accounted for the largest sectoral share of U.S. cross-border services trade, together representing 33.4 percent of U.S. services exports ($244.7 billion) and 33.3 percent of imports ($160.8 billion).
Services supplied in foreign markets by local affiliates of U.S. multinational firms (i.e., U.S.-owned foreign affiliates) totaled $1.4 trillion in 2015.5 The largest markets for sales of services by U.S.-owned foreign affiliates were the UK (15.8 percent), Canada (8.3 percent), and Ireland (7.9 percent). Purchases from affiliates of foreign firms located in the United States (i.e., foreign-owned U.S. affiliates) totaled $952.5 billion in 2015. The largest shares of purchases were from firms based in Japan (16.0 percent), the UK (14.1 percent), and Germany (13.9 percent).
Electronic Services Accounted for 12.7 Percent of U.S. Cross-border Services Exports and 11.2 Percent of Imports in 2016 Electronic services, the focus of this report, use computer-based technologies to develop, process, package, and deliver data and audiovisual content over telecommunications networks.
4 Exports and imports of private services exclude government transactions, which primarily consist of services supplied in support of operations by the U.S. military and embassies abroad. 5 “Affiliate firms” includes both firms outside the United States that are owned by U.S. companies, and firms located in the United States that are owned by foreign companies. Publication of data on affiliate transactions lags publication of data on cross-border services trade by one year. This report compares affiliate transactions in 2015 with trends in such transactions from 2011 through 2014. Statistics on cross-border services trade are collected differently from statistics on services supplied through affiliates, so data on these two types of trade are not directly comparable (see chapter 1).

Executive Summary
U.S. International Trade Commission | 13
This report includes chapters on audiovisual services, computer services, and telecommunications services. Additional services, such as information services (including news agency services, database services, and internet search portals) and charges for the use of intellectual property related to software, are included in the overall definition of electronic services used to calculate industry-related statistics in this report.
In 2016, electronic services accounted for 12.7 percent ($93.4 billion) of total U.S. cross-border services exports and 11.2 percent ($54.3 billion) of imports, resulting in a surplus of $39.1 billion. The top markets for U.S. cross-border electronic services exports were the UK, Canada, and Germany for audiovisual services; the UK, Canada, and India for computer services; and Brazil, Argentina, and the UK for telecommunications services. The top sources for U.S. electronic services imports were the UK, Brazil, and Mexico for audiovisual services; India, Canada, and Ireland for computer services; and the UK, Mexico, and India for telecommunications services.
Foreign affiliates of U.S. electronic services firms represented 18.5 percent ($270.1 billion) of sales by U.S.-owned foreign affiliates in all industries in 2015, while U.S. affiliates of foreign electronic services firms represented 13.9 percent ($132.7 billion) of purchases from foreign-owned U.S. affiliates in all industries.
In 2016, value added contribution to private sector gross domestic product (GDP) by the U.S. electronic services sector grew by 6.0 percent to $989.0 billion, and the sector accounted for 6.9 percent of U.S GDP.6 Broadcasting and telecommunications services accounted for $449.8 billion of value added, while data processing, internet publishing, and other information services registered rapid growth of 9.3 percent during 2015–16. Electronic services firms are making significant investments in artificial intelligence, a technology that attracted $39 billion in global investments in 2016.
Electronic services accounted for a small share of total U.S. private sector employment in 2016, with 3.7 million full-time equivalent employees (3.2 percent of total private sector employment). The computer systems design and related services industry accounted for 1.9 million of those employees.
Electronic services workers earned an average wage of $106,052 in 2016, well above wages in the services sector as a whole. However, wages varied from an average of $77,839 in motion picture and sound recording services to an average of $135,114 in data processing, internet
6 Categories used in cross-border services trade statistics do not correspond exactly to categories used in GDP or employment statistics.
Recent Trends in U.S. Services Trade: 2018 Annual Report
14 | www.usitc.gov
publishing, and other information services. Wage growth in electronic services was 2.4 percent in 2016, lower than the 3.5 percent average growth rate recorded in the sector during 2011–15.
Labor productivity in electronic services grew by 3.1 percent in 2016, and the sector had average output per worker of $265,717 in 2016. This indicator of labor productivity varied widely among industries, from $426,755 in broadcasting and television to $153,858 in computer systems design and related services.
The United States Was the World’s Largest Market for Audiovisual Services in 2016 Audiovisual and related services include movies and television programming, books and sound recordings, and broadcasting and recording of live events. This report's focus is on the movie industry, which is heavily concentrated. The top two markets—the United States and China—together accounted for 47.9 percent of global box office revenues, which reached $38.6 billion in 2016. The United States was the largest market by box office revenue with $10.3 billion, though India and China produced more movies (1,903 and 944, respectively, compared to 789 in the United States) and had more cinema admissions (2 billion and 1.4 billion, respectively). The top seven U.S.-based movie studios accounted for 59 percent of global box office receipts.
Advances in digital technology are letting consumer’s access content on a variety of devices, and streaming services are accounting for a growing share of audiovisual services revenue. China’s rapid cinema construction and growing theater attendance has attracted attention from U.S. filmmakers, and major Chinese companies are investing in Hollywood studios and films. However, market access restrictions in China, including foreign film quotas and state censorship, remain substantial concerns for U.S. firms.
U.S. audiovisual services exports continued to exceed imports in 2016. However, cross-border exports fell by 5 percent to $20.4 billion, and cross-border imports rose by 25 percent to $10.0 billion. The UK remained the largest market for U.S. exports, though the Asia-Pacific region increased its share. The UK, Brazil, and Mexico were the largest sources of U.S. audiovisual services imports.
Most of the World's Leading Computer and Data Processing Services Firms Are U.S.-based The global computer and data processing services industry grew rapidly during the past decade, and most of the industry’s leading firms are headquartered in the United States. In 2016, information technology services earned $585.3 billion in worldwide revenue, while the global

Executive Summary
U.S. International Trade Commission | 15
cloud services market earned $89.3 billion and the global software market earned $335.2 billion. Mobile phone-based software provides services to growing numbers of customers in emerging markets who do not have broadband subscriptions, and goods manufacturers are incorporating increasing amounts of computer-enabled services in their production processes.
U.S. cross-border exports of computer and data processing services totaled $17.3 billion in 2016 (a 9.2 percent increase over 2015), while imports were $29.0 billion (a 5.4 percent increase). The United States had a trade deficit in computer and data processing services since 2011 to 2016, but U.S. exports of computer and data processing services grew more quickly than imports from 2011 to 2015. The UK and Canada were the largest markets for U.S. computer and data processing services exports, and India accounted for almost half of U.S. imports.
Computer and data processing services sales through foreign affiliates of U.S. firms tend to be larger than U.S. cross-border exports: such sales totaled $111.0 billion in 2015, a 6.7 percent decrease from 2014. Purchases from foreign-owned U.S. affiliates in the computer and data processing services industry totaled $29.4 billion in 2015, roughly the same level as in 2014.
The United States Was the World’s Largest Market for Telecommunications Services in 2016 In 2016, the U.S. telecommunications (telecom) services market was valued at roughly $338.0 billion, or 22.8 percent of the global market, making it the largest national market for such services. The top U.S. telecom carriers were AT&T and Verizon, which earned $147 billion and $132 billion in 2016 revenues, respectively. U.S. telecom carriers are investing heavily in network infrastructure, connecting a growing array of devices to the internet, entering complementary content and advertising markets, and placing more emphasis on offering wide area networking services to enterprises.
In 2016, U.S. cross-border exports of telecom services totaled $12.2 billion, while imports totaled $5.5 billion, yielding a trade surplus of $6.7 billion. U.S. exports of telecom services experienced essentially no growth during 2011–15 and fell by 3 percent in 2016, while imports fell by 11 percent from 2011 through 2015, and by another 13 percent in 2016. U.S. carriers primarily offer telecom services to customers in foreign countries through local affiliates, and 2015 sales by such affiliates in the wired and wireless carrier segments were $26.5 billion and $5.5 billion, respectively (roughly 5 percent lower than in 2014). Telecom services purchased from U.S.-based affiliates of foreign telecom services companies totaled $75.6 billion, 13 percent higher than in 2014. A large portion of U.S. carrier sales abroad are enterprise services sold to multinational corporations.

Recent Trends in U.S. Services Trade: 2018 Annual Report
16 | www.usitc.gov
USITC Services Roundtable The Commission hosted its 11th annual Services Roundtable on October 25, 2017, with Commissioner Meredith Broadbent chairing the first session and Chairman Rhonda Schmidtlein chairing the second session. These roundtable discussions are held regularly to encourage dialogue among individuals from government, industry, and academia about issues affecting trade in services. This year’s event focused on two themes: the relationship between goods and services trade, and recent developments in the tradability of services. The roundtable also discussed current trade data limitations and considered whether including services as manufacturing inputs could be a new approach to calculating services trade.

U.S. International Trade Commission | 17
Chapter 1 Introduction Services continue to be a large and growing sector of the U.S. economy. The United States remains the world’s top exporter and importer of private services, and services accounted for over three-fourths of U.S. private sector gross domestic product (GDP) and employment in 2016.7 The United States posted the world’s largest services trade surplus in 2016 ($250.6 billion), followed by the United Kingdom (UK) ($129.1 billion). In 2016, electronic services employed 3.7 million people (a 6.0 percent increase in employment from 2015) and accounted for 6.9 percent of U.S. GDP. By contrast, professional services, the largest services category, employed 29.7 million people and accounted for 18.6 percent of U.S. GDP.
The Recent Trends report by the U.S. International Trade Commission (Commission or USITC) annually examines U.S. services trade (both in the aggregate and in selected industries), identifies important U.S. trading partners, and analyzes global market conditions in selected industries. This year, Recent Trends covers electronic services, a category created for the purpose of these reports, which includes information and communications technology (ICT) services as well as charges for the use of intellectual property related to audiovisual services and computer software. Chapter 2 discusses electronic services in detail, while later chapters focus on three specific industries: audiovisual services, computer and data processing services, and telecommunications services. Two other data categories in the electronic services industry8—information services and charges for the use of software-related intellectual property—are included in the statistics for the total “electronic services” category as presented in this report.9
Electronic services are supplied on increasingly fast and pervasive telecommunications networks that give a rising number of people access to high-bandwidth internet connections. As a result, cloud-based application platforms can now offer cheaper data storage and processing power for a range of computer services. Consumers benefit from faster internet speeds and cloud storage to access data-intensive content on their smartphones as well as on their
7 WTO, Statistics Database, Time Series on International Trade, “Trade in Commercial Services, 2005–onward” (accessed November 12, 2017). 8 See Chapter 2 for an additional discussion of these data. 9 Since 2013, Recent Trends in Services Trade has rotated every four years between professional services, electronic services, distribution services, and financial services. For more on information services, see USITC, Global Digital Trade 1.
Recent Trends in U.S. Services Trade: 2018 Annual Report
18 | www.usitc.gov
computers. Demand for electronic services is expected to grow steadily in the coming years as firms offer new services in new ways to a growing number of customers.
Data and Organization Most of the services trade data used in this report are from the Bureau of Economic Analysis (BEA) at the U.S. Department of Commerce (USDOC). The BEA collects services trade data through surveys that generally require respondents with more than $2 million in exports or $1 million in imports to report their international services transactions. The BEA estimates trade flows using these survey results.10
This chapter examines the U.S. overall services sector, global trade in services, and U.S. trade in services. It reviews cross-border trade in services during 2011–16, as well as sales by foreign affiliates of U.S. services firms abroad and purchases from U.S.-located affiliates of foreign services firms during 2011–15, comparing services trade flows in recent years with earlier data.11 Chapter 2 gives an overview of electronic services; identifies key trends affecting the sector; and examines the sector’s contribution to U.S. economic output, employment, labor productivity, and trade. Chapters 3, 4, and 5 focus respectively on audiovisual services, computer and data processing services, and telecommunications services. These chapters provide an overview of market conditions, emerging demand and supply factors, and recent trends in U.S. cross-border trade and affiliate transactions in these industries.
Chapter 6 summarizes the information presented and the views expressed at the 11th annual USITC services trade roundtable, hosted by the Commission on October 25, 2017. Appendix A gives a snapshot of recent services research conducted by Commission staff. Appendix B includes data tables that correspond to the pie charts presented in this report. This report is
10 For more information on the BEA’s data collection methodology, see USDOC, BEA, Survey of Current Business, October 2015, 26. In this report, the USITC supplements the BEA data with information from other sources, including individual firms, trade associations, academic journals, industry reports, international organizations, and other government agencies. The BEA updates its international trade statistics for prior years when additional data become available, and occasionally revises the methodology and presentation of its statistics in order to improve their quality and comply with new international standards. For these reasons, care should be taken when comparing statistics in previous Recent Trends in Services Trade reports to current statistics. For more information, see USDOC, BEA, “The Comprehensive Restructuring,” March 2014; USDOC, BEA, “Comprehensive Restructuring and Annual Revision,” July 2014, 1–3. 11 “Affiliate firms” includes both firms outside the United States that are owned by U.S. companies, and firms located within the United States that are owned by foreign companies. Publication of data on affiliate transactions lags publication of data on cross-border services trade. This report compares affiliate transactions in 2015 with trends from 2011 through 2014.

Chapter 1: Introduction
U.S. International Trade Commission | 19
also accompanied by web-based interactive charts, which allow users to explore trends in U.S. services exports and imports over time and for selected industries and countries.12
The U.S. Services Sector Services industries account for the majority of U.S. production and employment. In 2016, U.S. services industries accounted for 78.6 percent (or $11.3 trillion) of U.S. private sector GDP and 82.0 percent (or 93.7 million) of U.S. private sector full-time equivalent employees, compared to 21.4 percent and 18.0 percent, respectively, for the goods-producing sector.13 Growth in services employment and wage rates slightly outpaced growth in employment and wage rates in the goods sector during 2011–15. Both sectors saw similar growth in value added over that period, and labor productivity was unchanged.14
Global Services Trade The United States remains highly competitive in the global services market. As the world’s top exporter of services, the United States accounted for $732.6 billion, or 15.2 percent, of global cross-border commercial services exports in 2016 (figure 1.1).15 Other top exporters included the UK ($323.7 billion; 6.7 percent), Germany ($267.8 billion; 5.6 percent), France ($235.6 billion; 4.9 percent), and China ($207.3 billion; 4.3 percent). As in the past years, most of the world’s top 10 services exporters were developed countries. However, two developing countries have ranked among the top 10 for several years: China (currently the 5th-largest services exporter) has been in the top 10 since at least 2005, and India (currently the 8th-largest services exporter) entered the top 10 in 2006. Overall, the top 10 exporting countries
12 See : https://www.usitc.gov/publications/industry_econ_analysis_332/2018/recent_trends_us_services_trade_2018_annual_report.htm. 13 The goods-producing sector includes agriculture, construction, fishing, forestry, and manufacturing. Some aspects of mining are also included in the goods-producing sector, although drilling, exploration, and other related services are included in the services sector. USDOC, BEA, “Frequently Asked Questions,” March 10, 2006; USDOC, BEA representative, email message to USITC staff, March 7, 2017. 14 USDOC, BEA, “Real Value Added by Industry,” November 2, 2017; USDOC, BEA, “Full-Time Equivalent Employees by Industry,” August 3, 2017; USDOC, BEA, “Wages and Salaries by Industry,” August 3, 2017. “Value added” is a measure of an industry’s contribution to gross domestic product (GDP); it is the difference between the value of an industry’s gross output and the cost of its inputs. Full-time equivalent employees (FTEs) are the number of employees on full-time schedules plus the number of employees on part-time schedules converted to a full-time basis. The number of FTEs in each industry is the product of the total number of employees and the ratio of average weekly hours per employee to average weekly hours per employee on full-time schedules. Labor productivity is calculated as a sector’s value-added GDP divided by number of employees, so this measure fluctuates with changes in both output and employment. 15 This discussion draws on WTO trade data. The term “commercial services,” used by the WTO, is roughly equivalent to the term “private services” used by the BEA.

Recent Trends in U.S. Services Trade: 2018 Annual Report
20 | www.usitc.gov
together accounted for 53.5 percent of global cross-border services exports in 2016.16 The United States also remains the world’s largest importer of services ($482.0 billion; 10.3 percent), followed by China ($449.8 billion; 9.6 percent), Germany ($310.6 billion; 6.6 percent), France ($235.7 billion; 5.0 percent), and the UK ($194.6 billion; 4.1 percent).17
The BEA publishes annual data on both U.S. cross-border trade and affiliate transactions in services, which together account for a substantial portion of the services provided through all four “modes of supply” specified in the General Agreement on Trade in Services (GATS) of the World Trade Organization (WTO) (box 1.1). The BEA publishes these data broken down by country and by industry, at the highest level of detail that its surveys and confidentiality policies allow. The BEA also publishes quarterly cross-border trade data in highly aggregated form.18
According to the BEA, “cross-border trade” occurs when suppliers in one country sell services to consumers in another country, with people, information, or money crossing national borders.19 Such transactions appear as exports and imports in a country’s balance of payments. Firms also provide services to foreign consumers through affiliates established in host (i.e., foreign) countries. The income generated through “affiliate transactions” may appear as direct investment income in the balance of payments.20 Note that BEA statistics on cross-border services trade are collected and published by type of service, while statistics on services supplied through affiliates are collected and published based on the affiliate’s primary industry.21
16 WTO, Statistics Database, Time Series on International Trade, “Trade in Commercial Services, 2005–onward” (accessed November 12, 2017). 17 WTO, Statistics Database, Time Series on International Trade, “Trade in Commercial Services, 2005–onward” (accessed November 12, 2017). 18 Quarterly data on U.S. services trade can be found at USDOC, BEA, table 1.1, “U.S. International Transactions.” (accessed March 21, 2018). The BEA will suppress data for certain countries or sectors in its publications if that data could potentially reveal confidential information about individual respondents. 19 This definition is generally consistent with the WTO’s GATS definitions of mode 1, mode 2, and part of mode 4, as described in box 1.1. 20 Income generated through affiliate transactions appears as direct investment income in the balance of payments once it has been repatriated to the United States. 21 See chapter 2 for a further discussion of services trade data classification.

Chapter 1: Introduction
U.S. International Trade Commission | 21
Figure 1.1: Global services: Cross-border exports and imports of commercial services, 2016
Source: WTO, Statistics Database, Time Series on International Trade, “Trade in Commercial Services, 2005–onward” (accessed November 12, 2017). Notes: The value of global exports and the value of global imports differ due to several factors, including time lags, differences in collection methodology, and other measurement errors. Excludes public-sector transactions (see appendix table B.1).
United States 15%
United Kingdom 7%
Germany 6%
France 5%
China 4%
Netherlands 4%Japan 3%
India 3%Singapore 3%Ireland 3%
All other 47%
ExportsTotal: $4.8 trillion
United States 10%
China 10%
Germany 7%
France 5%
United Kingdom 4%
Ireland 4%Japan 4%
Netherlands 4%Singapore 3%India 3%
All other 47%
ImportsTotal: $4.7 trillion

Recent Trends in U.S. Services Trade: 2018 Annual Report
22 | www.usitc.gov
Box 1.1: Services Trade “Modes of Supply” under the World Trade Organization's General Agreement on Trade in Services (GATS)
The GATS identifies four “modes of supply” for services trade, or four ways that services can be traded:
Mode 1 is cross-border supply. In this mode, a service is supplied by an individual or firm in one country to an individual or firm in another (i.e., the service crosses national borders). An example would be a digital file of an architecture design emailed (i.e., exported) to a foreign client. Mode 1 is not identical to the cross-border trade category used by BEA in classifying its data (see explanation below).
Mode 2 is consumption abroad. In this mode, an individual from one country travels to another country and consumes a service in that country. An example of a U.S. export of travel services via mode 2 would be a foreign tourist staying in hotels and eating at restaurants while vacationing in the United States.
Mode 3 is commercial presence. In this mode, a firm based in one country establishes a local affiliate in another country and supplies services through that affiliate. An example would be a U.S.-based law firm providing legal services in a foreign country from an affiliated office located in that country.
Mode 4 is the temporary presence of natural persons. In this mode, an individual service supplier from one country travels to another country on a short-term basis to supply a service—for instance, as a consultant, contract employee, or intracompany transferee at an affiliate.a An example would be a U.S.-based engineer traveling to a foreign country to help local staff on a construction project.
The Bureau of Economic Analysis (BEA) categories for services trade—cross-border trade and affiliate transactions—do not correspond exactly to the channels of service delivery described in GATS.b Mode 1 and mode 2 transactions, as well as some mode 4 transactions, generally are grouped together in the BEA’s data on cross-border trade, while mode 3 transactions are included, with some exceptions, in the BEA’s affiliate transactions data.c
a USDOC, BEA, Survey of Current Business, October 2009, 40–43, tables 1 and 2. For more information on the four modes of supply under the GATS, see WTO, “Basic Purpose and Concepts” (accessed July 19, 2016).
b The BEA includes only affiliate transactions between residents and nonresidents, while certain transactions that fall under mode 3 of the GATS could involve only residents of the host country. Some statistics on services supplied through mode 4 may also be commingled with statistics on compensation of employees. USDOC, BEA, U.S. International Economic Accounts: Concepts and Methods, September 2014.
c The channel of delivery that service providers use is primarily determined by the nature of the service. For example, legal and accounting services are generally supplied through affiliates, while audiovisual services are generally supplied across borders. Sales of services by foreign affiliates of U.S. firms tend to exceed U.S. cross-border exports in value.

Chapter 1: Introduction
U.S. International Trade Commission | 23
Cross-border Services Trade, 2016–17 U.S. cross-border exports of private services totaled $733.6 billion in 2016 (the latest year for which detailed data are available), while U.S. imports totaled $483.1 billion, resulting in a trade surplus of $250.4 billion (figure 1.2).22 As in previous years, travel services and passenger fares accounted for the largest share of U.S. services trade, representing 33.4 percent of U.S. services exports and 33.3 percent of imports, while professional services were the second-largest category. Electronic services accounted for 12.7 percent and 11.2 percent of U.S. services exports and imports, respectively. Cross-border trade in electronic services resulted in a surplus of $39.1 billion in 2016 (figure 1.3).
In 2016, U.S. cross-border services exports grew by only 0.2 percent, significantly below the 4.9 percent average annual growth rate during 2011–15. This slow growth stemmed from declines in several industries, including travel services, financial services, electronic services, and distribution services. However, growth in professional services such as business and management consulting services was strong: total professional services exports rose by 7.1 percent in 2016 compared to an average annual growth rate of 6.1 percent during 2011–15.23 Additionally, charges for the use of intellectual property rose by 1.8 percent in 2016 after declining in 2015.24 U.S. services imports grew by 2.8 percent to $483.1 billion in 2016, a slightly slower pace than the 3.8 percent growth recorded during 2011–15. In 2016, import growth was highest for charges for intellectual property (7.5 percent), followed by travel services (7.1 percent) and electronic services (6.3 percent). Imports of distribution services declined in 2016, reflecting decreases in imports of air freight services.
22 Cross-border services trade, as reported by the BEA, includes both private and public sector transactions. The latter principally reflect operations of the U.S. military and embassies abroad. However, because public sector transactions are not considered to reflect U.S. services industries’ competitiveness and may introduce anomalies resulting from events like international peacekeeping missions, this report focuses solely on private sector transactions, except as noted. 23 For more information on U.S. trade in professional services, see USITC, Recent Trends in U.S. Services Trade, May 2017. In this study, all multiyear growth rates are calculated as compound annual growth rates (CAGRs) unless otherwise specified. 24 Charges for the use of intellectual property fell by 0.6 percent during 2011–15, the only sector highlighted in figure 1.2 to experience a decrease in exports over the period. USDOC, BEA, table 2.2, “U.S. International Trade in Services,” October 24, 2017.

Recent Trends in U.S. Services Trade: 2018 Annual Report
24 | www.usitc.gov
Figure 1.2: U.S. services: Cross-border trade by services industry, 2016
Source: USDOC, BEA, table 2.1, “U.S. Trade in Services, by Type of Service,” October 24, 2017. (See appendix table B.2.) Notes: Excludes public-sector transactions. Total exports and imports by sector are based on the latest BEA data for which all sectors are available. N.i.e= not included elsewhere.
Distribution 6%
Electronic 13%
Financial 16%
Travel and passenger fares
33%
Charges for the use of intellectual property n.i.e.
9%
Professional 21%
All other (includes suppressed data)
2%
ExportsTotal = $733.6 billion
Distribution 13%
Electronic 11%
Financial 15%
Travel and passenger fares
33%
Charges for the use of intellectual property n.i.e.
6%
Professional 19%
All other (includes suppressed data)
3%
ImportsTotal $483.1 billion

Chapter 1: Introduction
U.S. International Trade Commission | 25
Figure 1.3: U.S. services: Cross-border services trade and sales and purchases of services through affiliates, 2008—16
Sources: USDOC, BEA, table 2.1, “U.S. Trade in Services, by Type of Service,” October 24, 2017; table 4.1: “Services Supplied to Foreign Persons by U.S. MNEs through Their MOFAs, by Industry of Affiliate and by Country of Affiliate,” October 24, 2017; table 5.1, “Services Supplied to U.S. Persons by Foreign MNEs through Their MOUSA, by Industry of Affiliate and by Country of UBO,” Interactive tables: International Data, International Services, October 24, 2017. (See appendix table B.3.) Note: The difference between foreign affiliate transactions recorded in 2014 and those in both 2013 and 2015 is largely attributable to an increased number of reporting enterprises on the BEA’s 2014 Benchmark Survey of U.S. Direct Investment Abroad. As a result, these figures do not necessarily reflect an actual increase in the amount of services supplied. For more information see USDOC, BEA, U.S. International Services, December 2016, 21.
As in previous years, most U.S. services industries registered cross-border trade surpluses in 2016. The largest trade surplus was in travel services ($83.9 billion), followed by professional services ($59.3 billion), financial services ($40.8 billion), and charges for the use of intellectual property ($40.5 billion). Distribution services was the only category to register a cross-border trade deficit in 2016 ($14.1 billion), although several individual industries also recorded trade
$1,464 billion
$734 billion
0
200
400
600
800
1,000
1,200
1,400
1,600
1,800
2008 2009 2010 2011 2012 2013 2014 2015 2016
Billi
on $
U.S. international services supplied
Services supplied by U.S. firms’ foreign affiliates
U.S. cross-border exports of private services
$952 billion
$483 billion
0
200
400
600
800
1,000
1,200
2008 2009 2010 2011 2012 2013 2014 2015 2016
Billi
on $
U.S. international services received
Services supplied by U.S. affiliates of foreign firms’
U.S. cross-border imports of private services
Recent Trends in U.S. Services Trade: 2018 Annual Report
26 | www.usitc.gov
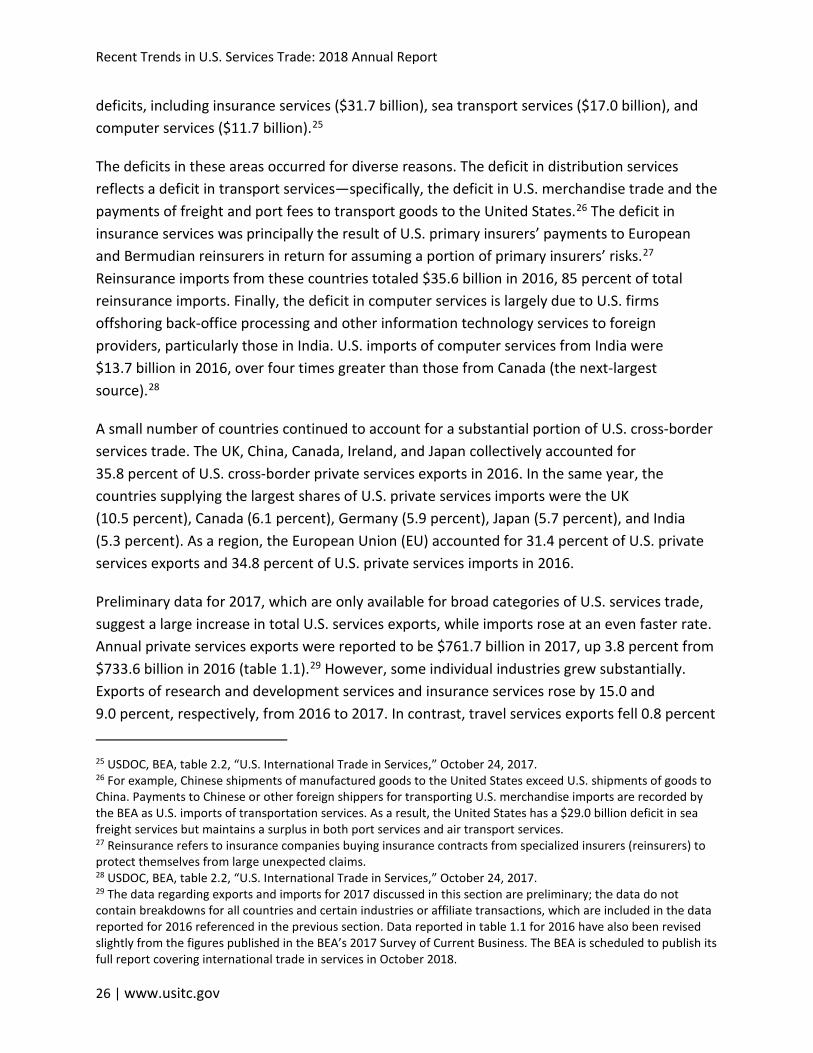
deficits, including insurance services ($31.7 billion), sea transport services ($17.0 billion), and computer services ($11.7 billion).25
The deficits in these areas occurred for diverse reasons. The deficit in distribution services reflects a deficit in transport services—specifically, the deficit in U.S. merchandise trade and the payments of freight and port fees to transport goods to the United States.26 The deficit in insurance services was principally the result of U.S. primary insurers’ payments to European and Bermudian reinsurers in return for assuming a portion of primary insurers’ risks.27 Reinsurance imports from these countries totaled $35.6 billion in 2016, 85 percent of total reinsurance imports. Finally, the deficit in computer services is largely due to U.S. firms offshoring back-office processing and other information technology services to foreign providers, particularly those in India. U.S. imports of computer services from India were $13.7 billion in 2016, over four times greater than those from Canada (the next-largest source).28
A small number of countries continued to account for a substantial portion of U.S. cross-border services trade. The UK, China, Canada, Ireland, and Japan collectively accounted for 35.8 percent of U.S. cross-border private services exports in 2016. In the same year, the countries supplying the largest shares of U.S. private services imports were the UK (10.5 percent), Canada (6.1 percent), Germany (5.9 percent), Japan (5.7 percent), and India (5.3 percent). As a region, the European Union (EU) accounted for 31.4 percent of U.S. private services exports and 34.8 percent of U.S. private services imports in 2016.
Preliminary data for 2017, which are only available for broad categories of U.S. services trade, suggest a large increase in total U.S. services exports, while imports rose at an even faster rate. Annual private services exports were reported to be $761.7 billion in 2017, up 3.8 percent from $733.6 billion in 2016 (table 1.1).29 However, some individual industries grew substantially. Exports of research and development services and insurance services rose by 15.0 and 9.0 percent, respectively, from 2016 to 2017. In contrast, travel services exports fell 0.8 percent 25 USDOC, BEA, table 2.2, “U.S. International Trade in Services,” October 24, 2017. 26 For example, Chinese shipments of manufactured goods to the United States exceed U.S. shipments of goods to China. Payments to Chinese or other foreign shippers for transporting U.S. merchandise imports are recorded by the BEA as U.S. imports of transportation services. As a result, the United States has a $29.0 billion deficit in sea freight services but maintains a surplus in both port services and air transport services. 27 Reinsurance refers to insurance companies buying insurance contracts from specialized insurers (reinsurers) to protect themselves from large unexpected claims. 28 USDOC, BEA, table 2.2, “U.S. International Trade in Services,” October 24, 2017. 29 The data regarding exports and imports for 2017 discussed in this section are preliminary; the data do not contain breakdowns for all countries and certain industries or affiliate transactions, which are included in the data reported for 2016 referenced in the previous section. Data reported in table 1.1 for 2016 have also been revised slightly from the figures published in the BEA’s 2017 Survey of Current Business. The BEA is scheduled to publish its full report covering international trade in services in October 2018.

Chapter 1: Introduction
U.S. International Trade Commission | 27
over the same period. Exports of telecommunications, computer, and information services (a broad category used by the BEA for these preliminary data) rose 6.8 percent in 2017, somewhat slower than growth in imports of these services (9.1 percent).
Overall, total services imports in 2017 exceeded those in 2016 by 6.8 percent, or $32.9 billion. As a result, the United States recorded a services trade surplus of $245.7 billion, though this represents a decline of $4.7 billion from the previous year.30 Initial data indicate that the UK, Canada, and China were the largest recipients of U.S. cross-border services exports in 2017, while the UK, Germany, and Canada were the largest sources of U.S. services imports.31
Table 1.1: U.S. private services exports and imports to the world, by category, 2016–17 Service industry
2016 (billion $)
2017 (billion $)
% change, 2016–17
Exports
Travel and passenger fares 244.7 242.8 -0.8 Charges for the use of intellectual property n.i.e.a 124.5 127.9 2.8 Financial services 98.2 106.4 8.4 Professional and management consulting services 74.0 78.7 6.4 Research and development services 37.2 42.8 15.0 Telecommunications, computer, and information services 36.5 38.9 6.8 Technical, trade-related, and other business servicesb 31.0 33.0 6.2 Maintenance and repair services, n.i.e. 25.6 25.9 1.1 Air transport (excludes passenger fares) 22.8 24.1 5.6 Insurance services 16.3 17.8 9.0 Other 22.8 23.4 2.7
Total 733.6 761.7 3.8 Imports
Travel and passenger fares 160.8 173.8 8.1 Insurance services 48.1 49.7 3.4 Charges for the use of intellectual property n.i.e.a 44.4 48.4 8.9 Professional and management consulting services 40.2 42.9 6.8 Telecommunications, computer, and information services 36.9 40.2 9.1 Sea transport 35.1 37.1 5.7 Research and development services 34.2 34.9 2.0 Computer services 29.0 31.6 9.2 Financial services 25.6 28.0 9.2 Technical, trade-related and other business servicesb 24.5 26.9 9.9 Other 4.4 2.4 -44.5
Total 483.1 516.0 6.8 Source: USDOC, BEA, International Transactions table 3.1, “U.S. International Trade in Services,” March 21, 2018. Notes: Data for 2017 are preliminary. N.i.e. = not included elsewhere. Excludes public-sector transactions.
a Charges for the use of intellectual property, n.i.e. (formally classified as royalties and licenses fees), includes industrial processes, computer software, trademarks, franchise fees, audiovisual and related products, and other intellectual property.
b The category of technical, trade-related, and other business services includes construction, architecture and engineering services, waste treatment, operational leasing, trade-related, and other business services.
30 USDOC, BEA, table 3.1, “U.S. International Trade in Services,” March 21, 2018. 31 Ibid.
Recent Trends in U.S. Services Trade: 2018 Annual Report
28 | www.usitc.gov
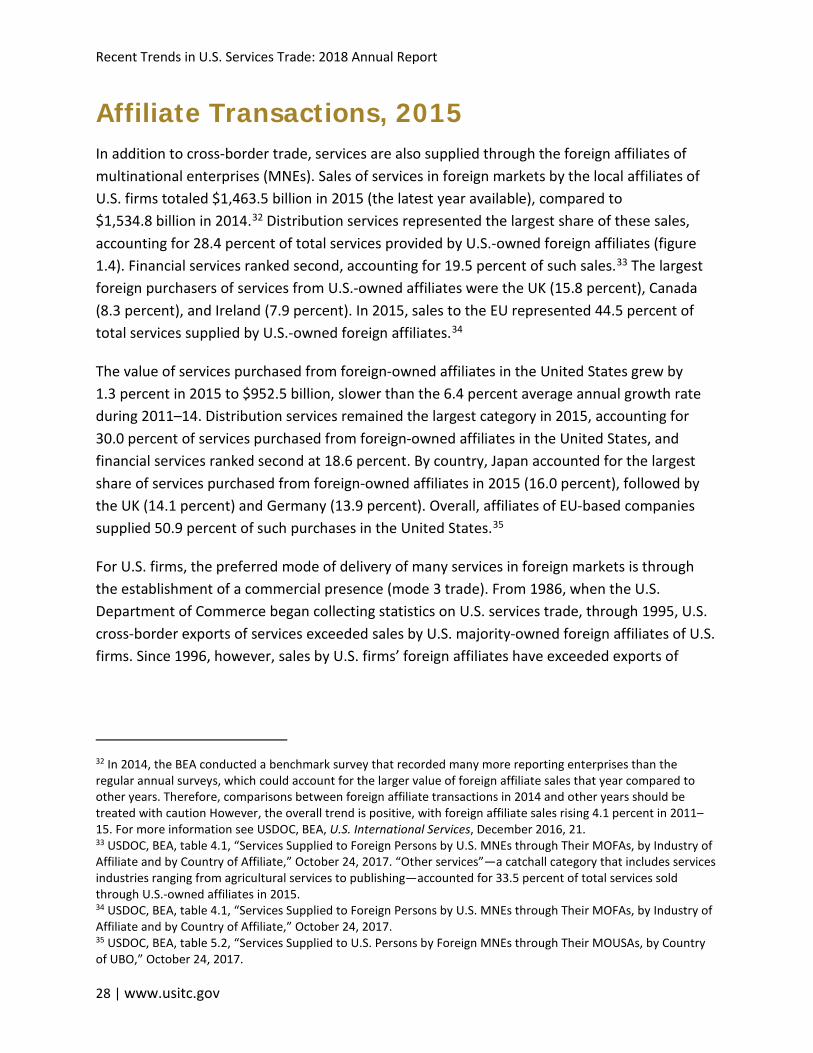
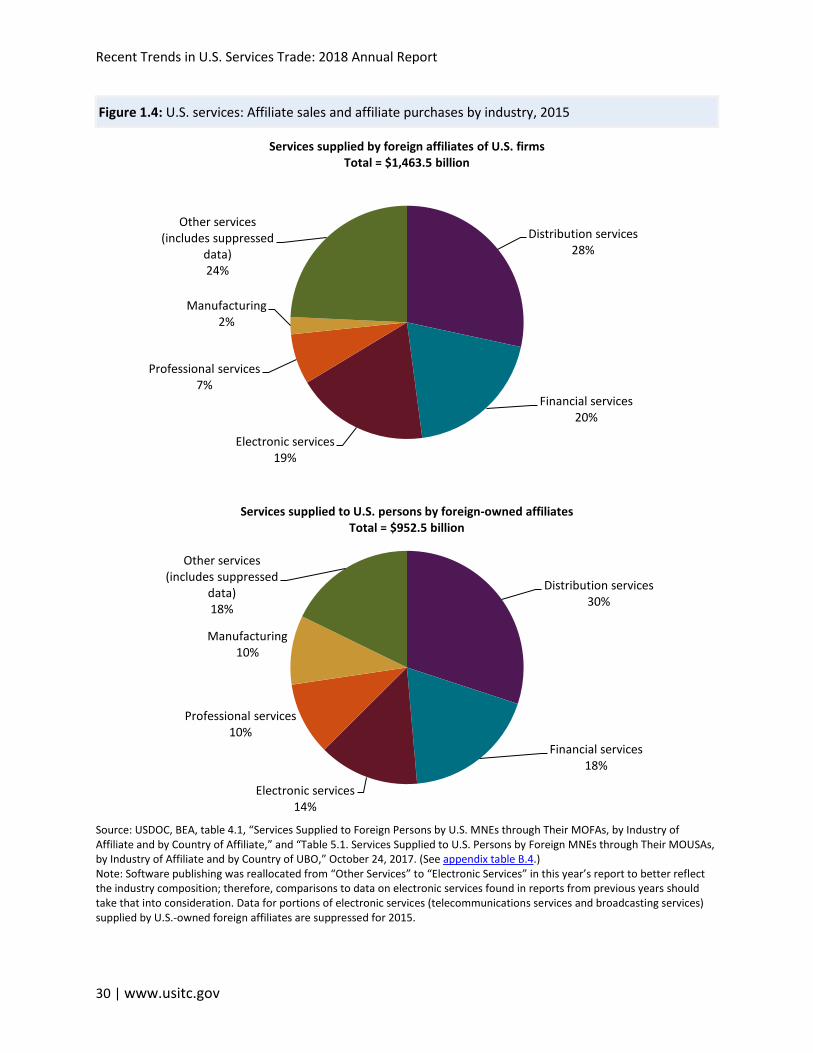
Affiliate Transactions, 2015 In addition to cross-border trade, services are also supplied through the foreign affiliates of multinational enterprises (MNEs). Sales of services in foreign markets by the local affiliates of U.S. firms totaled $1,463.5 billion in 2015 (the latest year available), compared to $1,534.8 billion in 2014.32 Distribution services represented the largest share of these sales, accounting for 28.4 percent of total services provided by U.S.-owned foreign affiliates (figure 1.4). Financial services ranked second, accounting for 19.5 percent of such sales.33 The largest foreign purchasers of services from U.S.-owned affiliates were the UK (15.8 percent), Canada (8.3 percent), and Ireland (7.9 percent). In 2015, sales to the EU represented 44.5 percent of total services supplied by U.S.-owned foreign affiliates.34
The value of services purchased from foreign-owned affiliates in the United States grew by 1.3 percent in 2015 to $952.5 billion, slower than the 6.4 percent average annual growth rate during 2011–14. Distribution services remained the largest category in 2015, accounting for 30.0 percent of services purchased from foreign-owned affiliates in the United States, and financial services ranked second at 18.6 percent. By country, Japan accounted for the largest share of services purchased from foreign-owned affiliates in 2015 (16.0 percent), followed by the UK (14.1 percent) and Germany (13.9 percent). Overall, affiliates of EU-based companies supplied 50.9 percent of such purchases in the United States.35
For U.S. firms, the preferred mode of delivery of many services in foreign markets is through the establishment of a commercial presence (mode 3 trade). From 1986, when the U.S. Department of Commerce began collecting statistics on U.S. services trade, through 1995, U.S. cross-border exports of services exceeded sales by U.S. majority-owned foreign affiliates of U.S. firms. Since 1996, however, sales by U.S. firms’ foreign affiliates have exceeded exports of
32 In 2014, the BEA conducted a benchmark survey that recorded many more reporting enterprises than the regular annual surveys, which could account for the larger value of foreign affiliate sales that year compared to other years. Therefore, comparisons between foreign affiliate transactions in 2014 and other years should be treated with caution However, the overall trend is positive, with foreign affiliate sales rising 4.1 percent in 2011–15. For more information see USDOC, BEA, U.S. International Services, December 2016, 21. 33 USDOC, BEA, table 4.1, “Services Supplied to Foreign Persons by U.S. MNEs through Their MOFAs, by Industry of Affiliate and by Country of Affiliate,” October 24, 2017. “Other services”—a catchall category that includes services industries ranging from agricultural services to publishing—accounted for 33.5 percent of total services sold through U.S.-owned affiliates in 2015. 34 USDOC, BEA, table 4.1, “Services Supplied to Foreign Persons by U.S. MNEs through Their MOFAs, by Industry of Affiliate and by Country of Affiliate,” October 24, 2017. 35 USDOC, BEA, table 5.2, “Services Supplied to U.S. Persons by Foreign MNEs through Their MOUSAs, by Country of UBO,” October 24, 2017.
Chapter 1: Introduction
U.S. International Trade Commission | 29
cross-border services.36 However, in certain industries, such as transportation or charges for the use of intellectual property, the majority of trade continues to occur through cross-border supply (mode 1). Other countries may exhibit different patterns of trade: around 80 percent of New Zealand’s services exports to the world occurred via mode 3, compared to only 14 percent of India’s services exports.37
36 USDOC, BEA, table 4.1, “Services Supplied to Foreign Persons by U.S. MNEs through Their MOFAs, by Industry of Affiliate and by Country of Affiliate,” October 24, 2017; USDOC, BEA, table 5.2, “Services Supplied to U.S. Persons by Foreign MNEs through Their MOUSAs, by Country of UBO,” October 24, 2017. 37 Some U.S. services industries supply a substantial portion of their exports through mode 4 (presence of natural persons): about half of computer services exports are delivered in this way, while one-third of both architecture and engineering services exports and professional and management consulting services exports are via mode 4. Mann, “Exploratory Estimates of U.S. International Services by Mode of Supply,” May 8, 2017.
Recent Trends in U.S. Services Trade: 2018 Annual Report
30 | www.usitc.gov
Figure 1.4: U.S. services: Affiliate sales and affiliate purchases by industry, 2015
Source: USDOC, BEA, table 4.1, “Services Supplied to Foreign Persons by U.S. MNEs through Their MOFAs, by Industry of Affiliate and by Country of Affiliate,” and “Table 5.1. Services Supplied to U.S. Persons by Foreign MNEs through Their MOUSAs, by Industry of Affiliate and by Country of UBO,” October 24, 2017. (See appendix table B.4.) Note: Software publishing was reallocated from “Other Services” to “Electronic Services” in this year’s report to better reflect the industry composition; therefore, comparisons to data on electronic services found in reports from previous years should take that into consideration. Data for portions of electronic services (telecommunications services and broadcasting services) supplied by U.S.-owned foreign affiliates are suppressed for 2015.
Distribution services28%
Financial services20%
Electronic services19%
Professional services7%
Manufacturing2%
Other services (includes suppressed
data)24%
Services supplied by foreign affiliates of U.S. firmsTotal = $1,463.5 billion
Distribution services30%
Financial services18%
Electronic services14%
Professional services10%
Manufacturing10%
Other services (includes suppressed
data)18%
Services supplied to U.S. persons by foreign-owned affiliatesTotal = $952.5 billion

Chapter 1: Introduction
U.S. International Trade Commission | 31
GDP, Employment, Labor Productivity, and Salaries In 2016, U.S. private services accounted for 78.6 percent of U.S. private sector GDP, and the value added by services grew by 2.0 percent to $11.3 trillion. By comparison, the value added by the production of goods declined by 0.2 percent, to $3.1 trillion in 2016 (table 1.2).38 Within the category, professional services was the largest sector (accounting for 23.7 percent of value added by private services, or $2.7 trillion). At the same time, the electronic services sector registered the fastest growth during 2015–16: it grew by 6.0 percent, slightly faster than the 5.4 percent average annual growth from 2011–15.
Private services also represented a large majority (82.0 percent) of total U.S. private sector employment in 2016, with 93.7 million full-time equivalent (FTE) employees compared to 20.5 million FTEs in goods. Distribution services accounted for just over a quarter (25.9 percent) of private services employment, while electronic services had the fastest employment growth during 2015–16. Average wages and labor productivity in the services sector were both slightly below the average in the private sector overall. On the other hand, electronic services had the highest average wages and labor productivity of any sector—goods or services—followed by financial services.
Table 1.2 United States: GDP, FTEs, wage and salary accruals, and labor productivity, by industry (goods and services), 2011, 2015–16
2011 2015 2016 CAGR
2011–15 % change 2015–16
GDPa (billion $) Private sector 12,872 14,202 14,420 2.5 1.5
Goods 2,796 3,085 3,079 2.5 -0.2 Manufacturing 1,823 1,910 1,920 1.2 0.5 Nonmanufacturing 973 1,175 1,159 4.8 -1.3
Services 10,076 11,117 11,341 2.5 2.0 Distribution services 2,170 2,411 2,456 2.7 1.9 Electronic services 757 933 989 5.4 6.0 Financial services 1,143 1,269 1,258 2.7 -0.9 Professional services 2,392 2,633 2,685 2.4 2.0 Other services 3,614 3,871 3,953 1.7 2.1
38 Private sector GDP excludes the value of goods and services produced by the government at the federal, state, and local levels (such as defense and government enterprises). This is similar to exports and imports of private services, a category that excludes international government transactions involving foreign military bases and U.S. embassies abroad. The share of electronic services in total services contribution to GDP (8.7 percent) is similar to the sector’s share of total services exports (7.7 percent). This similarity indicates that the export intensity of electronic services is in line with its overall level of production, while other sectors—such as distribution services—are more domestically focused.

Recent Trends in U.S. Services Trade: 2018 Annual Report
32 | www.usitc.gov
2011 2015 2016 CAGR
2011–15 % change 2015–16
FTEs (thousands) Private sector 101,851 112,335 114,221 2.5 1.7
Goods 18,688 20,422 20,522 2.2 0.5 Manufacturing 11,451 12,075 12,046 1.3 -0.2 Nonmanufacturing 7,237 8,347 8,476 3.6 1.5
Services 83,164 91,913 93,699 2.5 1.9 Distribution services 22,040 23,945 24,246 2.1 1.3 Electronic services 3,226 3,620 3,722 2.9 2.8 Financial services 6,071 6,424 6,509 1.4 1.3 Professional services 26,080 28,988 29,674 2.7 2.4 Other services 25,746 28,936 29,548 3.0 2.1
Wages and salary accruals ($ per FTE)b Private sector 53,475 58,708 59,458 2.4 1.3
Goods 58,905 64,080 64,869 2.1 1.2 Manufacturing 61,716 66,819 67,609 2.0 1.2 Nonmanufacturing 54,457 60,118 60,975 2.5 1.4
Services 52,254 57,515 58,272 2.4 1.3 Distribution services 45,076 49,279 49,776 2.3 1.0 Electronic services 90,188 103,560 106,052 3.5 2.4 Financial services 88,634 99,733 100,687 3.0 1.0 Professional services 60,455 65,758 66,302 2.1 0.8 Other services 36,762 40,939 41,820 2.7 2.2
Labor productivity ($ per FTE)c Private sector 126,381 126,425 126,246 0.0 -0.1
Goods 149,615 151,063 150,034 0.2 -0.7 Manufacturing 159,200 158,178 159,389 -0.2 0.8 Nonmanufacturing 134,448 140,769 136,739 1.2 -2.9
Services 121,158 120,951 121,037 0.0 0.1 Distribution services 98,457 100,689 101,295 0.6 0.6 Electronic services 234,656 257,735 265,717 2.4 3.1 Financial services 188,272 197,540 193,271 1.2 -2.2 Professional services 91,718 90,831 90,483 -0.2 -0.4 Other services 140,371 133,778 133,782 -1.2 0.0
Source: USITC staff calculations, USDOC, BEA, “Real Value Added by Industry,” November 2, 2017; USDOC, BEA, table 6.5D, “Full-Time Equivalent Employees by Industry,” August 3, 2017; USDOC, BEA, table 6.3D, “Wage and Salary Accruals per Full Time Equivalent Employee by Industry,” August 3, 2017. Note: CAGR = compound annual growth rate.
a Real valued added by industry using 2009 chained dollars (a method of adjusting real dollar amounts for inflation over time, to facilitate comparison of values from different years).
b Average wages are calculated by industry group, not by occupation. Wage and employment data presented in table 2.1 for the goods sector cover all workers employed in that sector, including those in both production and services work. USDOC, BEA representative, email message to USITC staff, May 3, 2017.
c Labor productivity, as calculated by USITC, is value added by industry divided by the number of FTEs.
Chapter 1: Introduction
U.S. International Trade Commission | 33
Bibliography Mann, Michael. “Exploratory Estimates of U.S. International Services by Mode of Supply.” U.S.
Department of Commerce (USDOC). Bureau of Economic Analysis (BEA), May 8, 2017. https://www.bea.gov/papers/pdf/Exploratory-estimates-of-trade-in-services-by-mode-of-supply.pdf.
U.S. Department of Commerce (USDOC). Bureau of Economic Analysis (BEA). “The Comprehensive Restructuring of International Economic Accounts.” Survey of Current Business, March 2014. https://www.bea.gov/scb/pdf/2014/03%20March/0314_restructuring_the_international_economic_accounts.pdf.
U.S. Department of Commerce (USDOC). Bureau of Economic Analysis (BEA). “The Comprehensive Restructuring of International Economic Accounts: Changes in Definitions, Classifications, and Presentations.” Survey of Current Business, July 2014.
U.S. Department of Commerce (USDOC). Bureau of Economic Analysis (BEA). “U.S. International Services: Trade in Services in 2014 and Services Supplied Through Affiliates in 2013.” Survey of Current Business, October 2015. https://bea.gov/scb/pdf/2015/10%20October/1015_international_services.pdf.
U.S. Department of Commerce (USDOC). Bureau of Economic Analysis (BEA). Table 1.1, “U.S. International Transactions,” March 21, 2018. https://www.bea.gov/iTable/iTable.cfm?ReqID=62&step=1#reqid=62&step=6&isuri=1&6210=1&6200=1.
U.S. Department of Commerce (USDOC). Bureau of Economic Analysis (BEA). “Frequently Asked Questions: Which Industries Are Included among the Goods-Producing Industries and the Services-Producing Industries?” March 10, 2006. https://www.bea.gov/faq/index.cfm?faq_id=182.
U.S. Department of Commerce (USDOC). Bureau of Economic Analysis (BEA). Table 2.1, “U.S. Trade in Services, by Type of Service.” Interactive tables: International Data, International Services, October 24, 2017. https://www.bea.gov/iTable/iTable.cfm?ReqID=62&step=1#reqid=62&step=6&isuri=1&6210=4&6200=245.
U.S. Department of Commerce (USDOC). Bureau of Economic Analysis (BEA). Table 2.2, “U.S. Trade in Services, by Type of Service and by Country or Affiliation.” Interactive tables:
Recent Trends in U.S. Services Trade: 2018 Annual Report
34 | www.usitc.gov
International Data, International Services, October 24, 2017. https://www.bea.gov/iTable/iTable.cfm?ReqID=62&step=1#reqid=62&step=7&isuri=1&6210=4&6200=246&6211=247.
U.S. Department of Commerce (USDOC). Bureau of Economic Analysis (BEA). Table 4.1, “Services Supplied to Foreign Persons by U.S. MNEs through Their MOFA, by Industry of Affiliate and by Country of Affiliate.” Interactive tables: International Data, International Services, October 24, 2017. https://www.bea.gov/iTable/iTable.cfm?ReqID=62&step=1#reqid=62&step=6&isuri=1&6210=4&6200=363.
U.S. Department of Commerce (USDOC). Bureau of Economic Analysis (BEA). Table 4.2, “Services Supplied to Foreign Persons by U.S. MNE’s through Their MOFAs, by Industry of Affiliate and Destination.” Interactive tables: International Data, International Services, October 24, 2017. https://www.bea.gov/iTable/iTable.cfm?ReqID=62&step=1#reqid=62&step=6&isuri=1&6210=4&6200=364.
U.S. Department of Commerce (USDOC). Bureau of Economic Analysis (BEA). Table 5.1, “Services Supplied to U.S. Persons by Foreign MNEs through Their MOUSAs, by Industry of Affiliate and by Country of UBO.” Interactive tables: International Data, International Services, October 24, 2017. https://www.bea.gov/iTable/iTable.cfm?ReqID=62&step=1#reqid=62&step=6&isuri=1&6210=4&6200=369.
U.S. Department of Commerce (USDOC). Bureau of Economic Analysis (BEA). Table 5.2, “Services Supplied to U.S. Persons by Foreign MNEs through Their MOUSAs, by Country of UBO.” Interactive tables: International Data, International Services, October 24, 2017. https://www.bea.gov/iTable/iTable.cfm?ReqID=62&step=1#reqid=62&step=6&isuri=1&6210=4&6200=370.
U.S. Department of Commerce (USDOC). Bureau of Economic Analysis (BEA). “International Economic Accounts: Concepts and Methods,” September 2014. https://www.bea.gov/international/concepts_methods.htm.
U.S. Department of Commerce (USDOC). Bureau of Economic Analysis (BEA). Table 6.3D. “Wage and Salary Accruals per Full Time Equivalent Employee by Industry.” Interactive Tables: National Data, GDP and Personal Income, August 3, 2017. https://www.bea.gov/iTable/iTable.cfm?reqid=19&step=2#reqid=19&step=2&isuri=1&1
Chapter 1: Introduction
U.S. International Trade Commission | 35
921=surveyhttps://www.bea.gov/iTable/iTable.cfm?ReqID=9&step=1#reqid=9&step=3&isuri=1&903=197.
U.S. Department of Commerce (USDOC). Bureau of Economic Analysis (BEA). Table 6.5D. “Full-time Equivalent Employees by Industry.” Interactive Tables: National Data, GDP and Personal Income, August 3, 2017. https://www.bea.gov/iTable/iTable.cfm?reqid=19&step=2#reqid=19&step=2&isuri=1&1921=surveyhttps://www.bea.gov/iTable/iTable.cfm?ReqID=9&step=1#reqid=9&step=3&isuri=1&903=197.
U.S. Department of Commerce (USDOC). Bureau of Economic Analysis (BEA). “Real Value Added by Industry.” Interactive Tables: GDP by Industry, Industry Data, Real Value Added by Industry (A) (Q), November 2, 2017. https://www.bea.gov/iTable/iTable.cfm?reqid=19&step=2#reqid=19&step=2&isuri=1&1921=surveyhttps://www.bea.gov/iTable/iTable.cfm?ReqID=51&step=1#reqid=51&step=51&isuri=1&5114=a&5102=10.
U.S. Department of Commerce (USDOC). Bureau of Economic Analysis (BEA). Table 6.6D. “Wages and Salaries per Full-time Equivalent Employee.” Interactive Tables: National Data, NIPA Tables, August 3, 2017. https://www.bea.gov/iTable/iTable.cfm?reqid=19&step=2#reqid=19&step=2&isuri=1&1921=survey. https://www.bea.gov/iTable/iTable.cfm?ReqID=9&step=1#reqid=9&step=3&isuri=1&903=201.
World Trade Organization (WTO). “Basic Purpose and Concepts.” Chap. 1 in GATS Training Module. https://www.wto.org/english/tratop_e/serv_e/cbt_course_e/c1s4p1_e.htm (accessed July 19, 2016).
World Trade Organization (WTO). Statistics Database. Time Series on International Trade, “Trade in Commercial Services, 2005 onward (BPM6).” http://stat.wto.org/StatisticalProgram/WSDBStatProgramSeries.aspx?Language=E (accessed November 12, 2017).

Recent Trends in U.S. Services Trade: 2018 Annual Report
36 | www.usitc.gov

U.S. International Trade Commission | 37
Chapter 2 Electronic Services Overview For the purposes of this report, “electronic services” data comprise audiovisual, computer and data processing, information services, and telecommunications services, as well as computer software. These components of electronic services, as well as their sub-components, are highly interdependent: for example, computer services are essential parts of the telecommunications sector, while telecommunications networks enable trade in audiovisual content. Electronic services also increase productivity and enable trade in other industries, such as education, finance, healthcare, and logistics. But they are traded electronically themselves as well—for example, when data processing services are offered by a supplier in one country to a consumer in another. U.S. electronic services industries are highly competitive, and U.S. firms are among the global leaders in technology adoption and in research and development. By facilitating data and information flows, electronic services firms provide critical infrastructure to the U.S. and global economies.
Individual chapters in this report focus on audiovisual services (chapter 3), computer and data processing services (chapter 4), and telecommunications services (chapter 5). When calculating statistics for total electronic services, this chapter uses data for the above industries combined with data for two additional categories: information services and computer software.39 Two important issues affect these industry statistics. The first is that cross-border services trade data are classified by the type of service, while services supplied through foreign affiliate transactions and data on domestic services industries40 are classified by industry, using the North American Industry Classification System (NAICS) and this can affect the comparability of services data. The second issue is that in a number of cases, the Bureau of Economic Analysis (BEA) of the U.S. Department of Commerce suppresses certain statistics to avoid disclosing proprietary information of individual companies.
39 Computer software and audiovisual services are both sub-components of the BEA category “Charges for the use of intellectual property” while telecommunications services, computer and data processing services, and information services are all part of the “Telecommunications, computer, and information services” category. 40 This report highlights the services components of gross domestic product, full-time equivalent employees, wages, and labor productivity data.

Recent Trends in U.S. Services Trade: 2018 Annual Report
38 | www.usitc.gov
Data Sources Data on cross-border trade in electronic services include five BEA categories: audiovisual services, computer and data processing services, telecommunications services, computer software, and information services. Audiovisual services41 are receipts and payments for rights to display, reproduce, distribute, or broadcast copyrighted material and other intellectual property related to movies and television programming, books, and sound recordings. Computer and data processing services are hardware- and software-related services, including software downloaded or provided through the cloud.42 Telecommunications services are the broadcast or transmission of sound, images, data, or other information by electronic means (including traditional telephone calls as well as internet access services).43 Computer software is defined as receipts and payments for rights to distribute and reproduce general use software. Information services are news agency services, database services, and internet search portals.44
Data on affiliate transactions by electronic services firms include seven BEA categories: motion picture and sound recording industries; computer systems design and related services; data processing, hosting, and related services; telecommunications; broadcasting; other information services; and software publishing. The services industry categories used by the BEA in statistics on value added GDP, full-time equivalent (FTE) employees, wages, and labor productivity45 are slightly different in that they exclude “other information services” and “software publishing” from those data but include five industries: motion picture and sound recording; telecommunications; broadcasting; data processing, hosting, and related services; and computer systems design and related services.46
Shifts in Electronic Services These services are increasingly supplied through a fast and pervasive internet. The percentage of the global population with internet access almost doubled from 2013 to 2016, increasing
41 Audiovisual services, as defined by the BEA, include three subsectors: movies and television programming; books and sound recording; and broadcasting and recording of live events. 42 USDOC, BEA, “Form BE-125,” November, 2016. For computer software products, licenses for use are included in computer services, while licenses for reproduction and distribution are included in the computer software category. 43 USDOC, BEA, “U.S. International Economic Accounts: Concepts and Methods,” June 30, 2014. 44 USDOC, BEA, “U.S. International Economic Accounts: Concepts and Methods,” June 30, 2014. 45 Wages and labor productivity are calculated by USITC staff using BEA data. 46 NAICS category 51919 (other information services) is not broken out separately in the datasets used for the presentation of domestic services statistics; for this reason it is excluded from the calculation of value added, FTEs, wages and labor productivity. Broadcasting and telecommunications categories are combined into a single category for BEA statistics on value added, FTE employees, wages, and labor productivity. Software publishing is also not broken out separately for this data.
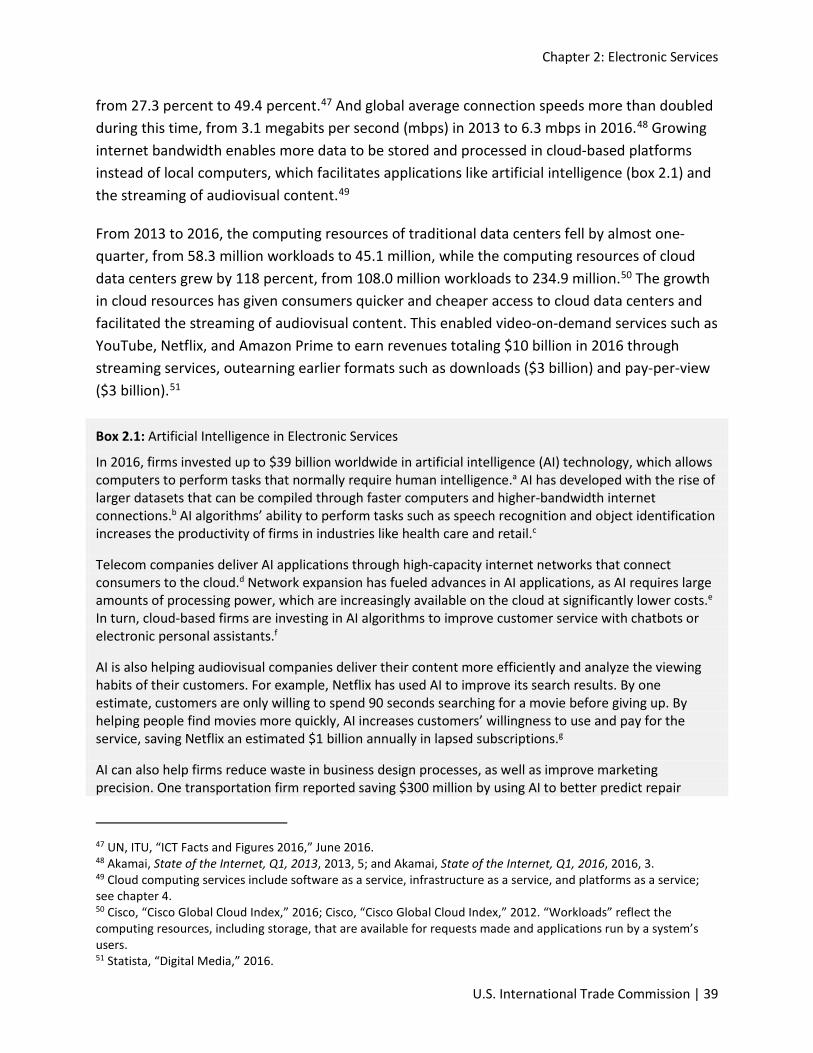
Chapter 2: Electronic Services
U.S. International Trade Commission | 39
from 27.3 percent to 49.4 percent.47 And global average connection speeds more than doubled during this time, from 3.1 megabits per second (mbps) in 2013 to 6.3 mbps in 2016.48 Growing internet bandwidth enables more data to be stored and processed in cloud-based platforms instead of local computers, which facilitates applications like artificial intelligence (box 2.1) and the streaming of audiovisual content.49
From 2013 to 2016, the computing resources of traditional data centers fell by almost one-quarter, from 58.3 million workloads to 45.1 million, while the computing resources of cloud data centers grew by 118 percent, from 108.0 million workloads to 234.9 million.50 The growth in cloud resources has given consumers quicker and cheaper access to cloud data centers and facilitated the streaming of audiovisual content. This enabled video-on-demand services such as YouTube, Netflix, and Amazon Prime to earn revenues totaling $10 billion in 2016 through streaming services, outearning earlier formats such as downloads ($3 billion) and pay-per-view ($3 billion).51
Box 2.1: Artificial Intelligence in Electronic Services
In 2016, firms invested up to $39 billion worldwide in artificial intelligence (AI) technology, which allows computers to perform tasks that normally require human intelligence.a AI has developed with the rise of larger datasets that can be compiled through faster computers and higher-bandwidth internet connections.b AI algorithms’ ability to perform tasks such as speech recognition and object identification increases the productivity of firms in industries like health care and retail.c
Telecom companies deliver AI applications through high-capacity internet networks that connect consumers to the cloud.d Network expansion has fueled advances in AI applications, as AI requires large amounts of processing power, which are increasingly available on the cloud at significantly lower costs.e In turn, cloud-based firms are investing in AI algorithms to improve customer service with chatbots or electronic personal assistants.f
AI is also helping audiovisual companies deliver their content more efficiently and analyze the viewing habits of their customers. For example, Netflix has used AI to improve its search results. By one estimate, customers are only willing to spend 90 seconds searching for a movie before giving up. By helping people find movies more quickly, AI increases customers’ willingness to use and pay for the service, saving Netflix an estimated $1 billion annually in lapsed subscriptions.g
AI can also help firms reduce waste in business design processes, as well as improve marketing precision. One transportation firm reported saving $300 million by using AI to better predict repair
47 UN, ITU, “ICT Facts and Figures 2016,” June 2016. 48 Akamai, State of the Internet, Q1, 2013, 2013, 5; and Akamai, State of the Internet, Q1, 2016, 2016, 3. 49 Cloud computing services include software as a service, infrastructure as a service, and platforms as a service; see chapter 4. 50 Cisco, “Cisco Global Cloud Index,” 2016; Cisco, “Cisco Global Cloud Index,” 2012. “Workloads” reflect the computing resources, including storage, that are available for requests made and applications run by a system’s users. 51 Statista, “Digital Media,” 2016.
Recent Trends in U.S. Services Trade: 2018 Annual Report
40 | www.usitc.gov
needs for its fleet.h Additionally, some retail firms are using AI to predict customer demand and reduce errors when automating operations.i
While U.S. firms are global leaders in developing and adopting AI, Chinese firms are catching up quickly through both private and public sector investments. In 2017, China’s Ministry of Finance invested $1 billion in applying AI to a range of projects, from oil to microchip production,j while the e-commerce firm Alibaba—the world’s sixth-largest company by revenue—is developing AI algorithms to improve its forecasts of customer purchases.k Additionally, Baidu’s Institute of Deep Learning is researching the use of AI in driverless cars, search engine technology, and speech and voice recognition.l
a Bughin et al., Artificial Intelligence, June 2017, 9.
b Bughin et al., Artificial Intelligence, June 2017, 9.
c Otto, a German retailer, has reached 90 percent accuracy in its sales forecasts for a 30-day period; Toyota expects to invest $1 billion in a research institute to develop robotics and driverless cars; and Google’s open source TensorFlow can help customers with their online purchases or target specific ads to them. Bughin et al., Artificial Intelligence, June 2017; Metz, “Google Is Already Late to China’s AI Revolution,” June 2, 2017.
d Giokas, “How Telecom Operators Could Capture Business,” 2016; Gurnaney, “Why Telcos Will Soon Be Betting on Artificial Intelligence,” 2017.
e Linthicum, “The Cloud Is Finally Making Machine Learning Practical,” 2015.
f Janakiram, “5 Ways Machine Learning Has Influenced the Modern Cloud,” 2017.
g McAlone, “Why Netflix Thinks Its Personalized Recommendation Engine,” June 14, 2016.
h Bughin et al., Artificial Intelligence, June 2017, 28.
i Bughin et al., Artificial Intelligence, June 2017.
j Wang, “Will the Future of Artificial Intelligence Look Chinese?” November 6, 2017.
k Dasgupta, “Big Data Gives China’s Top 3 Internet Firms Big Leverage,” June 14, 2017.
l Metz, “Google Is Already Late to China’s AI Revolution,” June 2, 2017.
U.S. Trade in Electronic Services Electronic services accounted for 12.7 percent of total U.S. cross-border services exports and 11.2 percent of U.S. cross-border services imports in 2016.52 That year, the United States exported $93.4 billion and imported $54.3 billion in electronic services, resulting in a surplus of $39.1 billion. Between 2011 and 2015, exports of electronic services grew at an annual rate of 2.1 percent, compared to a slight decline of 0.4 percent in 2015–16.53 Exports of audiovisual services have made up the largest share of electronic services exports since 2007. In 2016, audiovisual services accounted for 21.8 percent of total electronic services exports, followed by computer services (18.5 percent) and telecommunications services (13.1 percent) (figure 2.1). By contrast, computer services represented the majority (53.4 percent) of total electronic services imports in 2016, with imports of $29.0 billion.
In 2016, the UK was the largest destination for U.S. exports of both audiovisual services (21.9 percent) and computer services (13.1 percent). Canada and Germany were the second- and third-largest export markets for audiovisual services, whereas Canada and Switzerland were the second- and third-largest export markets for computer services. U.S.
52 USDOC, BEA, table 2.1, “U.S. Trade in Services, by Type of Service,” October 24, 2017. 53 USDOC, BEA, table 2.1, “U.S. Trade in Services, by Type of Service,” October 24, 2017.
Chapter 2: Electronic Services
U.S. International Trade Commission | 41
telecommunications services exports in 2016 primarily went to Central and South America, with Brazil accounting for the largest share (27.2 percent or $3.3 billion), followed by Argentina (11.8 percent or $1.5 billion).54 Ireland was the largest export market for services involving the use of intellectual property related to computer software (24.5 percent).
Most U.S. trade in electronic services occurs through affiliates (GATS mode 3; see box 1.1). In 2015, electronic services accounted for 18.5 percent, or $270.1 billion, of total services supplied by U.S.-owned foreign affiliates abroad. This value was down slightly from 2014. Sales by foreign affiliates of U.S. computer system design firms represented 34.7 percent ($93.8 billion) of this total, followed by sales by foreign affiliates of software publishing firms, which represented 26.6 percent ($71.8 billion) (figure 2.2).55 The same year, the value of electronic services purchased from foreign-owned U.S. affiliates totaled $132.7 billion, an increase of 6.4 percent over the previous year. Telecommunications services firms accounted for most of these purchases (57.0 percent), followed by computer system design firms (21.4 percent).56
54 USDOC, BEA, table 2.2, “U.S. Trade in Services, by Country and Affiliation,” October 24, 2017. 55 Data for telecommunications services and broadcasting services supplied by U.S.-owned foreign affiliates are unavailable for 2015. Data on telecommunications services data have been suppressed since 2012, and data on broadcasting services (except internet) have been suppressed since 2014. 56 USDOC, BEA, table 4.1, “Services Supplied to Foreign Persons by U.S. MNEs through Their MOFAs, by Industry of Affiliate and by Country of Affiliate,” October 24, 2017.

Recent Trends in U.S. Services Trade: 2018 Annual Report
42 | www.usitc.gov
Figure 2.1: U.S. electronic services: Exports and imports by industry, 2016
Source: USDOC, BEA, table 2.1, “U.S. Trade in Services, by Type of Service,” October 24, 2017. (See appendix table B.5.) Notes: Excludes public-sector transactions.
Audiovisual services22%
Telecommunications services
13%
Computer services18%
Information services7%
Computer software39%
Exports Total = $93.4 billion
Audiovisual services18%
Telecommunications services
10%
Computer services53%
Information services4%
Computer software14%
ImportsTotal = $54.3 billion

Chapter 2: Electronic Services
U.S. International Trade Commission | 43
Figure 2.2: U.S. electronic services: Affiliate sales and affiliate purchases by industry, 2015
Sources: USDOC, BEA, table 4.1, “Services Supplied to Foreign Persons by U.S. MNEs through Their MOFAs, by Industry of Affiliate and by Country of Affiliate,” and table 5.1, “Services Supplied to U.S. Persons by Foreign MNEs through Their MOUSAs, by Industry of Affiliate and by Country of UBO,” October 24, 2017. (See appendix table B.6.)
a The total value of services supplied by foreign affiliates of U.S. telecommunications firms and broadcasting firms is not available due to suppression of data for Africa. However, services supplied by U.S. firms to all other regions of the world totaled $40.2 billion for telecommunications services and $18.5 billion for broadcasting services.
b Establishments that broadcast exclusively on the Internet are included in subsector 519, "other information services." c Other information services corresponds to NAICS code 5191 (which includes internet entertainment, game and sports sites,
internet publishing and/or broadcasting, and web search portals and additional internet services).
GDP, Employment, Labor Productivity, and Salaries in Electronic Services Value added in the U.S. electronic services sector grew from $933 billion in 2015 to $989 billion in 2016 (an increase of 6.0 percent), and the sector accounted for 6.9 percent of the total U.S. private sector GDP in 2016 (table 2.1).57 Within that category, broadcasting and telecommunications was the largest contributor (accounting for 45.5 percent of value added in the electronic services sector, or $450 billion). However, during 2015–16, data processing, internet publishing, and other information services registered the fastest growth at 9.3 percent, slightly slower than the 12.5 percent average annual growth recorded in this segment for 2011–15. Value added in the computer systems design and related services segment rose 6.4 percent 57 Private sector GDP excludes the value of goods and services produced by the government at the federal, state, and local levels (such as defense and government enterprises). This is similar to exports and imports of private services, a category that excludes international government transactions involving foreign military bases and U.S. embassies abroad. The share of electronic services in total services' contribution to GDP (8.7 percent) is similar to the sector’s share of total services exports (7.7 percent). The similarity indicates that the export intensity of electronic services is in line with its overall level of production, while other sectors such as distribution services are more domestically focused.
0102030405060708090
100
Billi
on $
U.S.-owned foreign affiliate sales Foreign-owned U.S. affiliate purchases

Recent Trends in U.S. Services Trade: 2018 Annual Report
44 | www.usitc.gov
in 2016, while motion picture and sound recording industries’ value added increased by only 1.8 percent.
In 2016, electronic services accounted for a small share of total U.S. private sector employment, with 3.7 million FTE employees (or around 3.2 percent of total private sector employment).58 That year, FTEs in electronic services grew by 2.8 percent, in line with the 2.9 percent compounded annual growth recorded in this segment during 2011–15. The computer systems design and related services industry accounted for just over half (50.8 percent) of electronic services employment, followed by broadcasting and telecommunications (28.3 percent). Broadcasting and telecommunications was the only electronic services industry to see a decrease in employment in 2016, falling 0.9 percent from 2015.
Electronic services workers earned an average wage of $106,052.59 Average wages in electronic services were far above those of the services sector as a whole ($58,272), but varied substantially by industry, ranging from an average of $77,839 in motion picture and sound recording services to an average of $135,114 in data processing, internet publishing, and other information services. In 2016, wage growth in the electronic services industry was 2.4 percent, lower than the 3.5 percent average growth rate recorded during 2011–15.
Labor productivity in electronic services (measured as output in dollars per FTE) grew by 3.1 percent in 2016, as the value of output rose slightly faster than employment. This was greater than during 2011–15, when productivity rose 2.4 percent. Electronic services had an average output per worker of $265,717 in 2016, substantially higher than the average for the services sector as a whole ($121,037). Labor productivity varied widely among electronic services industries, from $426,755 per worker in broadcasting and telecommunications to $153,858 in computer systems design and related services. Broadcasting and telecommunications saw the fastest growth in labor productivity in 2016, rising 6.9 percent, while motion picture and sound recording was the only industry to see a fall in labor productivity (-6.2 percent).
58 The BEA defines full-time equivalent employees as the number of employees on full-time schedules, plus the number of part-time employees that would have been needed to complete all the hours of full-time work reported in a given dataset. 59 Wages are defined as monetary remuneration for employees, including tips, commissions, overtime, bonuses, and subsidies (such as for housing). Wages do not include benefits such as employer-sponsored health insurance or retirement contributions. USDOC, BEA, “Concepts and Methods,” February 2014.
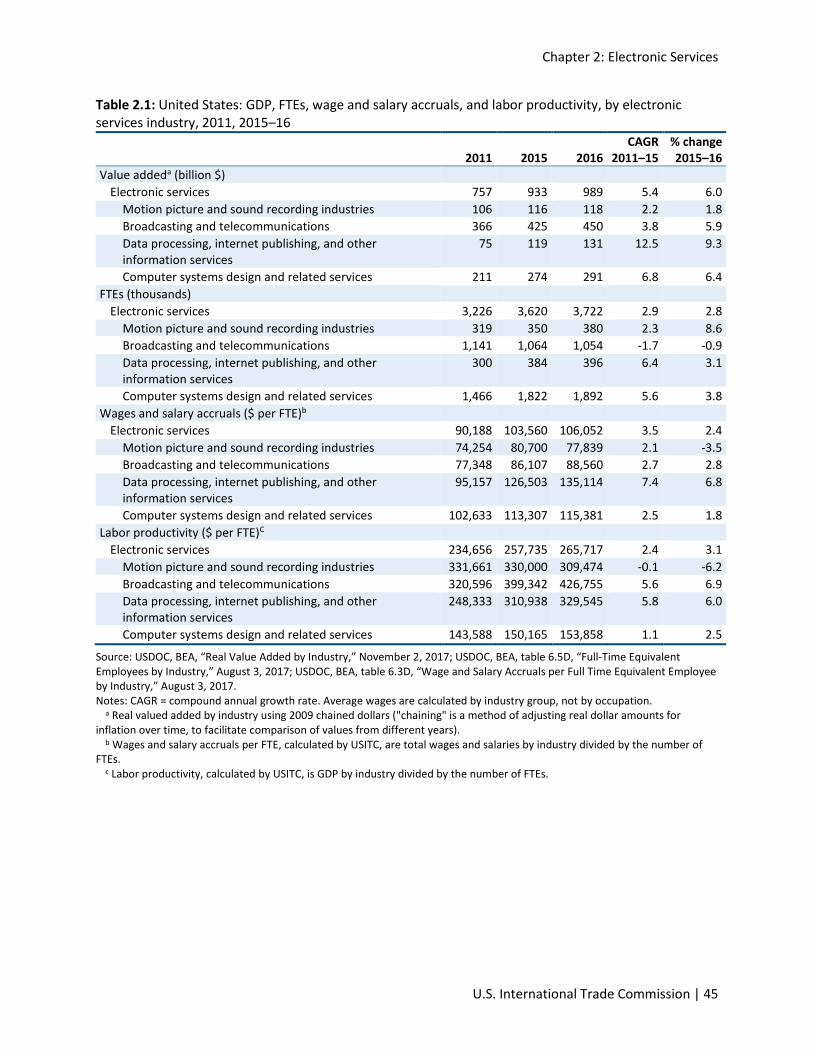
Chapter 2: Electronic Services
U.S. International Trade Commission | 45
Table 2.1: United States: GDP, FTEs, wage and salary accruals, and labor productivity, by electronic services industry, 2011, 2015–16
2011 2015 2016 CAGR
2011–15 % change 2015–16
Value addeda (billion $) Electronic services 757 933 989 5.4 6.0
Motion picture and sound recording industries 106 116 118 2.2 1.8 Broadcasting and telecommunications 366 425 450 3.8 5.9 Data processing, internet publishing, and other information services
75 119 131 12.5 9.3
Computer systems design and related services 211 274 291 6.8 6.4 FTEs (thousands)
Electronic services 3,226 3,620 3,722 2.9 2.8 Motion picture and sound recording industries 319 350 380 2.3 8.6 Broadcasting and telecommunications 1,141 1,064 1,054 -1.7 -0.9 Data processing, internet publishing, and other information services
300 384 396 6.4 3.1
Computer systems design and related services 1,466 1,822 1,892 5.6 3.8 Wages and salary accruals ($ per FTE)b
Electronic services 90,188 103,560 106,052 3.5 2.4 Motion picture and sound recording industries 74,254 80,700 77,839 2.1 -3.5 Broadcasting and telecommunications 77,348 86,107 88,560 2.7 2.8 Data processing, internet publishing, and other information services
95,157 126,503 135,114 7.4 6.8
Computer systems design and related services 102,633 113,307 115,381 2.5 1.8 Labor productivity ($ per FTE)C
Electronic services 234,656 257,735 265,717 2.4 3.1 Motion picture and sound recording industries 331,661 330,000 309,474 -0.1 -6.2 Broadcasting and telecommunications 320,596 399,342 426,755 5.6 6.9 Data processing, internet publishing, and other information services
248,333 310,938 329,545 5.8 6.0
Computer systems design and related services 143,588 150,165 153,858 1.1 2.5
Source: USDOC, BEA, “Real Value Added by Industry,” November 2, 2017; USDOC, BEA, table 6.5D, “Full-Time Equivalent Employees by Industry,” August 3, 2017; USDOC, BEA, table 6.3D, “Wage and Salary Accruals per Full Time Equivalent Employee by Industry,” August 3, 2017. Notes: CAGR = compound annual growth rate. Average wages are calculated by industry group, not by occupation.
a Real valued added by industry using 2009 chained dollars ("chaining" is a method of adjusting real dollar amounts for inflation over time, to facilitate comparison of values from different years).
b Wages and salary accruals per FTE, calculated by USITC, are total wages and salaries by industry divided by the number of FTEs.
c Labor productivity, calculated by USITC, is GDP by industry divided by the number of FTEs.

Recent Trends in U.S. Services Trade: 2018 Annual Report
46 | www.usitc.gov
Bibliography Akamai Technologies. Akamai: The State of the Internet, First Quarter, 2013 Report 6, no. 1,
2013. https://www.akamai.com/cn/zh/multimedia/documents/state-of-the-internet/akamai-q1-2013-state-of-the-internet-connectivity-report.pdf.
Akamai Technologies. Akamai: The State of the Internet, First Quarter, 2016 Report 9, no. 1, 2016. https://www.akamai.com/kr/ko/multimedia/documents/state-of-the-internet/akamai-state-of-the-internet-report-q1-2016.pdf.
Bughin, Jacques, Eric Hazan, Sree Ramaswamy, Michael Chui, Teral Allas, Peter Dahlström, Nicolaus Henke, and Monica Tranch. Artificial Intelligence: The Next Digital Frontier? McKinsey Global Institute, Discussion Paper, June 2017. https://www.mckinsey.com/~/media/McKinsey/Industries/Advanced%20Electronics/Our%20Insights/How%20artificial%20intelligence%20can%20deliver%20real%20value%20to%20companies/MGI-Artificial-Intelligence-Discussion-paper.ashx.
Ciocca, Sophia. “Spotify’s Discover Weekly: How Machine Learning Finds Your New Music.” Hacker Noon (blog). AMI Publications, October 10, 2017. https://hackernoon.com/spotifys-discover-weekly-how-machine-learning-finds-your-new-music-19a41ab76efe.
Cisco. “Cisco Global Cloud Index: Forecast and Methodology, 2011–2016,” October 23, 2012. http://www.webtorials.com/main/resource/papers/cisco/paper228/Cloud_Index.pdf.
Cisco. “Cisco Global Cloud Index: Forecasts and Methodology, 2015–2020.” White paper, November 15, 2016. http://www.cisco.com/c/dam/en/us/solutions/collateral/service-provider/global-cloud-index-gci/white-paper-c11-738085.pdf.
Dasgupta, Saibal. “Big Data Gives China’s Top 3 Internet Firms Big Leverage.” Voice of America, June 14, 2017. https://www.voanews.com/a/big-data-gives-internet-big-leverage/3899830.html.
Gaurav, Sakshi. “Machine Learning’s Impact on Cloud Computing.” Botmetric (blog), August 23, 2017. https://www.botmetric.com/blog/machine-learning-impact-on-cloud-computing/.
Gerbert, Philipp, Jan Justus, and Martin Hecker. “Competing in the Age of Artificial Intelligence.” BCG Henderson Institute, Boston Consulting Group (BCG), January 16, 2017. https://www.bcg.com/publications/2017/competing-in-age-artificial-intelligence.aspx.
Giokas, Yiannis. “How Telecom Operators Could Capture Business in the Cloud Market.” Huffington Post, November 10, 2016. https://www.huffingtonpost.com/young-entrepreneur-council/how-telecom-operators-cou_b_12861004.html.
Gurnaney, Tina. “Why Telcos Will Soon Be Betting on Artificial Intelligence to Build Their Networks.” ET Telecom, Times Internet (India), November 7, 2017.
Chapter 2: Electronic Services
U.S. International Trade Commission | 47
https://telecom.economictimes.indiatimes.com/news/why-telcos-will-soon-be-betting-on-artificial-intelligence-to-build-their-networks/61531211.
Helft, Miguel. “A Peek at Google’s M&A Ambitions.” Fortune, February 12, 2014. http://fortune.com/2014/02/12/a-peek-at-googles-ma-ambitions/.
Janakiram, MSV. “5 Ways Machine Learning Has Influenced the Modern Cloud.” Forbes, April 3, 2017. https://www.forbes.com/sites/janakirammsv/2017/04/03/5-ways-machine-learning-has-influenced-the-modern-cloud/.
Kamdar, Adi, Daniel Nazer, and Vera Ranieri. Defend Innovation: How to Fix Our Broken Patent System. Electronic Frontier Foundation, February 2015. https://www.eff.org/document/defend-innovation-how-fix-our-broken-patent-system.
Licuia, Jeff, and Amanda McPherson. A $5 Billion Value: Estimating the Total Development Cost of Linux Foundation’s Collaborative Projects. Linux Foundation, September 2015. https://www.linux.com/publications/estimating-total-development-cost-linux-foundations-collaborative-projects.
Linthicum, David. “The Cloud Is Finally Making Machine Learning Practical.” InfoWorld, April 21, 2015. https://www.infoworld.com/article/2911946/machine-learning/the-cloud-is-finally-making-machine-learning-practical.html.
McAlone, Nathan. “Why Netflix Thinks Its Personalized Recommendation Engine is Worth $1 Billion Per Year.” Business Insider, June 14, 2016. http://www.businessinsider.com/netflix-recommendation-engine-worth-1-billion-per-year-2016-6.
Metz, Cade. “Google Is Already Late to China’s AI Revolution.” Wired, June 2, 2017. https://www.wired.com/2017/06/ai-revolution-bigger-google-facebook-microsoft/.
Mortimer, Julie Holland, Chris Nosko, and Alan Sorensen. “Supply Responses to Digital Distribution: Recorded Music and Live Performances.” NBER Working Paper 16507, October 2010. http://www.nber.org/papers/w16507.
Page, Larry. “Supercharging Android: Google to Acquire Motorola Mobility.” Google Official Blog. Google, August 15, 2011. https://googleblog.blogspot.com/2011/08/supercharging-android-google-to-acquire.html.
Statista. “Digital Media: Video on Demand,” 2016. http://www.statista.com/outlook/201/100/ video_on_demand/worldwide (fee required).
U.S. Census Bureau (U.S. Census). “2017 NAICS Definition: 512 Motion Picture and Sound Recording Industries.” https://www.census.gov/cgi-bin/sssd/naics/naicsrch?code=512&search=2017%20NAICS%20Search.
Recent Trends in U.S. Services Trade: 2018 Annual Report
48 | www.usitc.gov
U.S. Census Bureau (U.S. Census). “2017 NAICS Definition: 515 Broadcasting (except Internet).” https://www.census.gov/cgi-bin/sssd/naics/naicsrch?code=515&search=2017%20NAICS%20Search.
U.S. Census Bureau (U.S. Census). “2017 NAICS Definition: 517 Telecommunications.” https://www.census.gov/cgi-bin/sssd/naics/naicsrch?code=517&search=2017%20NAICS%20Search.
U.S. Census Bureau (U.S. Census). “2017 NAICS Definition: 518 Data Processing, Hosting, and Related Services.” https://www.census.gov/cgi-bin/sssd/naics/naicsrch?code=518&search=2017%20NAICS%20Search.
U.S. Census Bureau (U.S. Census). “2017 NAICS Definition: 51919 All Other Information Services.” https://www.census.gov/cgi-bin/sssd/naics/naicsrch?code=51919&search=2017%20NAICS%20Search.
U.S. Census Bureau (U.S. Census). “2017 NAICS Definition: 5415 Computer Systems Design and Related Services.” https://www.census.gov/cgi-bin/sssd/naics/naicsrch?code=5415&search=2017%20NAICS%20Search.
U.S. Department of Commerce (USDOC). Bureau of Economic Analysis (BEA). Concepts and Methods of the U.S. National Income and Product Accounts (NIPA Handbook), February 2014. http://www.bea.gov/national/pdf/allchapters.pdf.
U.S. Department of Commerce (USDOC). Bureau of Economic Analysis (BEA). Table 6.5D. “Full-time Equivalent Employees by Industry.” Interactive Tables: National Data, GDP and Personal Income, August 3, 2017. https://www.bea.gov/iTable/iTable.cfm?reqid=19&step=2#reqid=19&step=2&isuri=1&1921=survey.
U.S. Department of Commerce (USDOC). Bureau of Economic Analysis (BEA). “Real Value Added by Industry.” Interactive Tables: GDP by Industry, Industry Data, Real Value Added by Industry (A) (Q), November 2, 2017. https://www.bea.gov/iTable/iTable.cfm ?reqid=19&step=2#reqid=19&step=2&isuri=1&1921=survey.
U.S. Department of Commerce (USDOC). Bureau of Economic Analysis (BEA). Table 6.6D. “Wages and Salaries per Full-time Equivalent Employee.” Interactive Tables: National Data, NIPA Tables, August 3, 2017. https://www.bea.gov/iTable/iTable.cfm ?reqid=19&step=2#reqid=19&step=2&isuri=1&1921=survey.
U.S. Department of Commerce (USDOC). Bureau of Economic Analysis (BEA). Table 2.1, “U.S. Trade in Services, by Type of Service.” Interactive tables: International Data, International Services, October 24, 2017. https://www.bea.gov/iTable/iTable.cfm ?ReqID=62&step=1#reqid=62&step=6&isuri=1&6210=4&6200=245.
U.S. Department of Commerce (USDOC). Bureau of Economic Analysis (BEA). Table 2.2, “U.S. Trade in Services, Country and Affiliation,” October 24, 2017. Interactive tables:

Chapter 2: Electronic Services
U.S. International Trade Commission | 49
International Data, International Services, October 24, 2017. https://www.bea.gov/iTable/iTable.cfm?ReqID=62&step=1#reqid=62&step=6&isuri=1&6210=4&6200=245.
U.S. Department of Commerce (USDOC). Bureau of Economic Analysis (BEA). Table 4.1, “Services Supplied to Foreign Persons by U.S. MNEs through Their MOFA, by Industry of Affiliate and by Country of Affiliate.” Interactive tables: International Data, International Services, October 24, 2017. https://www.bea.gov/iTable/iTable.cfm ?ReqID=62&step=1#reqid=62&step=6&isuri=1&6210=4&6200=363.
U.S. Department of Commerce (USDOC). Bureau of Economic Analysis (BEA). “U.S. International Economic Accounts: Concepts and Methods,.” June 30, 2014. https://www.bea.gov/international/concepts_methods.htm#completedownload.
U.S. Department of Commerce (USDOC). Bureau of Economic Analysis (BEA). “Form BE-125,” November 2016. https://www.bea.gov/surveys/pdf/be125.pdf.
U.S. Department of Commerce (USDOC). Bureau of Economic Analysis (BEA). Table 5.1, “Services Supplied to U.S. Persons by Foreign MNEs through Their MOUSAs, by Industry of Affiliate and by Country of UBO.” Interactive tables: International Data, International Services, October 24, 2017. https://www.bea.gov/iTable/iTable.cfm?ReqID=62&step= 1#reqid=62&step=6&isuri=1&6210=4&6200=369.
U.S. Department of Commerce (USDOC). Bureau of Economic Analysis (BEA). “U.S. International Economic Accounts: Concepts and Methods,” June 30, 2014. https://www.bea.gov/international/concepts_methods.htm#completedownload.
U.S. Department of Commerce (USDOC). Bureau of Economic Analysis (BEA). “Form BE-125.” November 2016. https://www.bea.gov/surveys/pdf/be125.pdf.
U.S. International Trade Commission (USITC). Global Digital Trade 1: Market Opportunities and Key Foreign Trade Restrictions. USITC Publication 4716. Washington, DC: USITC, August 2017. https://www.usitc.gov/sites/default/files/publications/332/pub4716_0.pdf.
United Nations (UN). International Telecommunication Union (ITU). Telecommunication Development Bureau. ICT Data and Statistics Division. “ICT Facts and Figures 2016,” June 2016. https://www.itu.int/en/ITUD/Statistics/Documents/facts/ICTFactsFigures2016.pdf.
Wang, Yue. “Will the Future of Artificial Intelligence Look Chinese?” Forbes, November 6, 2017. https://www.forbes.com/sites/ywang/2017/11/06/will-the-future-of-artificial-intelligence-look-chinese/#4073ec107fdc.

Recent Trends in U.S. Services Trade: 2018 Annual Report
50 | www.usitc.gov

U.S. International Trade Commission | 51
Chapter 3 Audiovisual Services Summary Audiovisual services include movies and television programs, books and sound recordings, and broadcasts and recordings of live events.60 The following discussions of market conditions and supply and demand factors focus on the motion picture and television industries, while the trade trends section covers the broader audiovisual services sector.61
Motion picture and television services are distributed to consumers through projection in theaters, commercial airline flights, and other public venues; rental or sale of prerecorded works as DVDs and Blu-ray discs; and dissemination via broadcast, cable, and satellite television (including video on demand) and, increasingly, via streaming and on-demand services. The sector remains heavily concentrated, with a few countries accounting for the majority of box office revenues and film/television productions worldwide. Global box office revenues have climbed steadily in recent years as consumers have shifted a growing share of their audiovisual expenditures to streaming services. Major U.S.-based film studios continue to account for the majority of global revenues; they tend to attract larger audiences and to offer more downstream revenue opportunities (such as streaming and television licensing rights) than overseas competitors.
Overseas box office revenues, particularly in developing markets like China, are growing rapidly and becoming even more crucial for U.S. studios and films than before. Streaming and video on demand (VoD) channels are increasingly important to consumers in these markets, who can
60 USDOC, BEA, International Data, International Services, “Table 2.2. U.S. Trade in Services, by Type of Services and Country or Affiliation” (accessed November 17, 2017). 61 See box 3.1 for the definition of audiovisual services and a discussion of U.S. cross-border and affiliate trade in these services. In terms of trade data, while the “books and sound recordings” and the “broadcasting and recording of live events” industries also fall under the audiovisual services category (as defined by BEA), they have been excluded from this year’s market conditions and supply and demand factors discussions, since most of their official trade data have previously been either unavailable or have been suppressed to avoid disclosing the data of individual companies. Audiovisual services was last covered in the 2014 Recent Trends report where the latest trade data was from 2012 (when much of the previously noted audiovisual services trade data categories were not available). Since trade data availability has changed significantly from this chapter’s last iteration, the market analysis in this chapter focuses on “movies and television programming” for the sake of consistency. Overall, the value of U.S. exports of “movies and television programming” is seven to eight times greater than the value of U.S. exports of “books and sound recordings” or the “broadcasting and recording of live events.” Video games are also excluded from the discussion due to lack of official trade data. However, the lines between the motion picture/television and gaming industries are increasingly blurring.
Recent Trends in U.S. Services Trade: 2018 Annual Report
52 | www.usitc.gov
access vast amounts of audiovisual content on a variety of digital devices, including internet-connected TVs, smartphones, and tablets. Further, China’s rapid cinema construction and growing theater attendance has been attracting more attention from U.S. filmmakers, while major Chinese companies have been investing in Hollywood studios and films. Nonetheless, China’s persistent foreign film quota system and growing state censorship continue to challenge U.S. firms.
U.S. audiovisual services exports continued to exceed imports in 2016. While cross-border exports fell slightly to $20.4 billion, cross-border imports rose significantly to $10.0 billion. The United Kingdom (UK) remained the largest market for U.S. exports, though the Asia-Pacific region increased its share. The UK, Brazil, and Mexico were the largest sources of U.S. audiovisual services imports.
Introduction Producers of audiovisual services collect receipts and payments for rights associated with movies and television programming, books and sound recordings, and broadcasting and recording of live events. The U.S. motion picture industry is the leading global producer of videos, television programs, and movies, and the United States is home to the world’s leading providers of streaming content, such as Netflix, Amazon Prime Video, and YouTube.62
Internationally, the movie industry is heavily regulated. Some governments censor or limit the distribution of certain audiovisual products, impede foreign productions or co-productions, or require local content. The goals of such regulations can include curtailing the dissemination of disfavored cultural values, restricting illicit content, protecting intellectual property rights, and bolstering national identity and pride. Governments also provide investment and tax incentives for their domestic audiovisual companies.63 The largest developed-country producers of audiovisual services have made some market access commitments under the World Trade Organization (WTO) in this sector, though commitments more typically apply to movie-related services than to TV- and radio-related services. Moreover, audiovisual services are among the services sectors with the fewest WTO commitments.64
Digital technology is changing audiovisual services by lowering the costs of production and distribution, and its widespread use is one of the most important trends affecting film and TV
62 The estimated global combined streaming revenue for Netflix, Amazon Prime Video, and YouTube was about $8.7 billion in 2016 (by comparison, U.S. exports of electronic services in 2016 were $56.8 billion). Arthofer et al., “The Future of Television,” September 20, 2016. 63 WTO, “Audiovisual Services: Background Note,” January 12, 2010, 1. 64 There are 30 total country commitments in audiovisual sectors according to the WTO. WTO, “Audiovisual Services” January 12, 2010, 17-18.

Chapter 3: Audiovisual Services
U.S. International Trade Commission | 53
markets.65 Online streaming services now provide vast amounts of audiovisual content, competing with traditional providers such as movie theater owners, television and cable broadcasters, and DVD and Blu-ray sellers.66 Faster internet speeds and accessibility, and lower costs of cloud computing and storage, have promoted the shift in consumption from traditional cinemas to a variety of fixed and mobile devices (see chapters 4 and 5). This has also created new opportunities for audiovisual content producers, who benefit from lower input costs and more outlets for content delivery. To compete with VoD and online options, traditional theaters have invested heavily in enhanced amenities such as 3D screens, improved seating (including power reclining seats and stadium seating), and a greater variety of higher-quality concessions.67 Digital technologies, however, also facilitate copyright infringement. In particular, infringement is enabled by devices preloaded with software that allows users to stream movies and television programs, as well as camcording in theatres (with digital copies uploaded to the internet for global distribution), and websites and other digital tools.68
Market Conditions Global box office revenue for films was $38.6 billion in 2016, up modestly from $34.6 billion in 2012; growth was 11.6 percent during 2012–16. Growth of box office revenue in the United States was relatively stable during the same period, averaging about 5 percent annually, with a 2 percent increase from 2015 to 2016.69 Several reasons underlie this increase, including rising ticket prices from 3D movies. Growth was tempered, however, by lower theater attendance as consumers took advantage of increasing content streaming options and less expensive online leisure options available from home. The exception was China, which has shown exponential growth in box-office revenue over the last few years.
The industry remained concentrated, with the leading 10 markets accounting for 78 percent of global box office revenues (table 3.1). In 2016, the United States was the largest market, by revenue, with $10.3 billion, although its 27 percent share of the global market was down slightly from 2012. China’s box office revenue was second at $8.2 billion—a 300 percent increase from 2012—and accounted for 21 percent of the global market, up from 8 percent in 2012. By one estimate, China is projected to surpass U.S. box office revenue by 2020: its
65 Precise cost savings are difficult to gauge, since they vary greatly by production budget/studio. However, general opinion points to the rise of digital technology and the subsequent increase in the number of independent or smaller budget studios/creators being able to produce better content and distribute it to wider audiences as a clear sign that production and distribution costs, once nearly prohibitive, have fallen. Leigh, “Celluloid Is Strictly for Nostalgists,” July 7, 2016. 66 SNL Kagan, “U.S. Availability of Film and TV Titles,” March 2016. 67 IBISWorld, Global Movie Production and Distribution, August 2017. 68 IBISWorld, Global Movie Production and Distribution, August 2017, 6; USITC, Digital Trade in the U.S. and Global Economies, July 2013, 5-15; and USITC, Global Digital Trade 1, August 2017, 293–94. 69 Statistics in this sentence include Canada; MPAA, “Theatrical Statistics, 2016,” 2016.
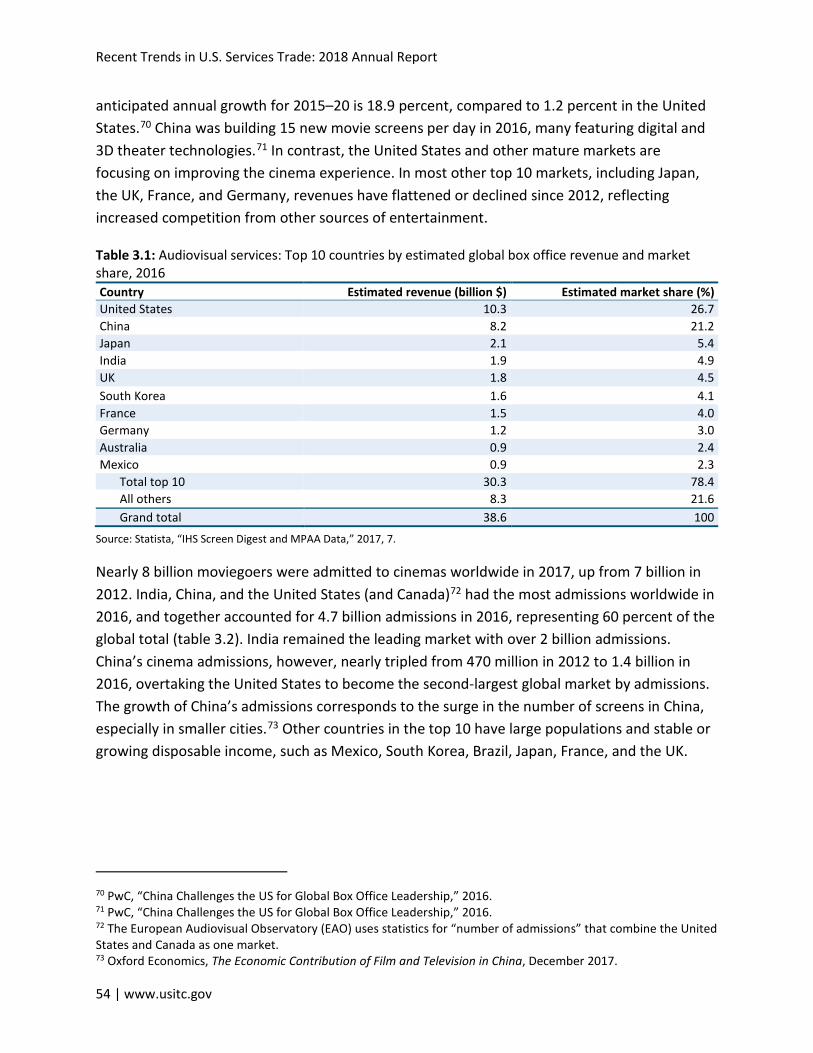
Recent Trends in U.S. Services Trade: 2018 Annual Report
54 | www.usitc.gov
anticipated annual growth for 2015–20 is 18.9 percent, compared to 1.2 percent in the United States.70 China was building 15 new movie screens per day in 2016, many featuring digital and 3D theater technologies.71 In contrast, the United States and other mature markets are focusing on improving the cinema experience. In most other top 10 markets, including Japan, the UK, France, and Germany, revenues have flattened or declined since 2012, reflecting increased competition from other sources of entertainment.
Table 3.1: Audiovisual services: Top 10 countries by estimated global box office revenue and market share, 2016 Country Estimated revenue (billion $) Estimated market share (%) United States 10.3 26.7 China 8.2 21.2 Japan 2.1 5.4 India 1.9 4.9 UK 1.8 4.5 South Korea 1.6 4.1 France 1.5 4.0 Germany 1.2 3.0 Australia 0.9 2.4 Mexico 0.9 2.3
Total top 10 30.3 78.4 All others 8.3 21.6 Grand total 38.6 100
Source: Statista, “IHS Screen Digest and MPAA Data,” 2017, 7.
Nearly 8 billion moviegoers were admitted to cinemas worldwide in 2017, up from 7 billion in 2012. India, China, and the United States (and Canada)72 had the most admissions worldwide in 2016, and together accounted for 4.7 billion admissions in 2016, representing 60 percent of the global total (table 3.2). India remained the leading market with over 2 billion admissions. China’s cinema admissions, however, nearly tripled from 470 million in 2012 to 1.4 billion in 2016, overtaking the United States to become the second-largest global market by admissions. The growth of China’s admissions corresponds to the surge in the number of screens in China, especially in smaller cities.73 Other countries in the top 10 have large populations and stable or growing disposable income, such as Mexico, South Korea, Brazil, Japan, France, and the UK.
70 PwC, “China Challenges the US for Global Box Office Leadership,” 2016. 71 PwC, “China Challenges the US for Global Box Office Leadership,” 2016. 72 The European Audiovisual Observatory (EAO) uses statistics for “number of admissions” that combine the United States and Canada as one market. 73 Oxford Economics, The Economic Contribution of Film and Television in China, December 2017.
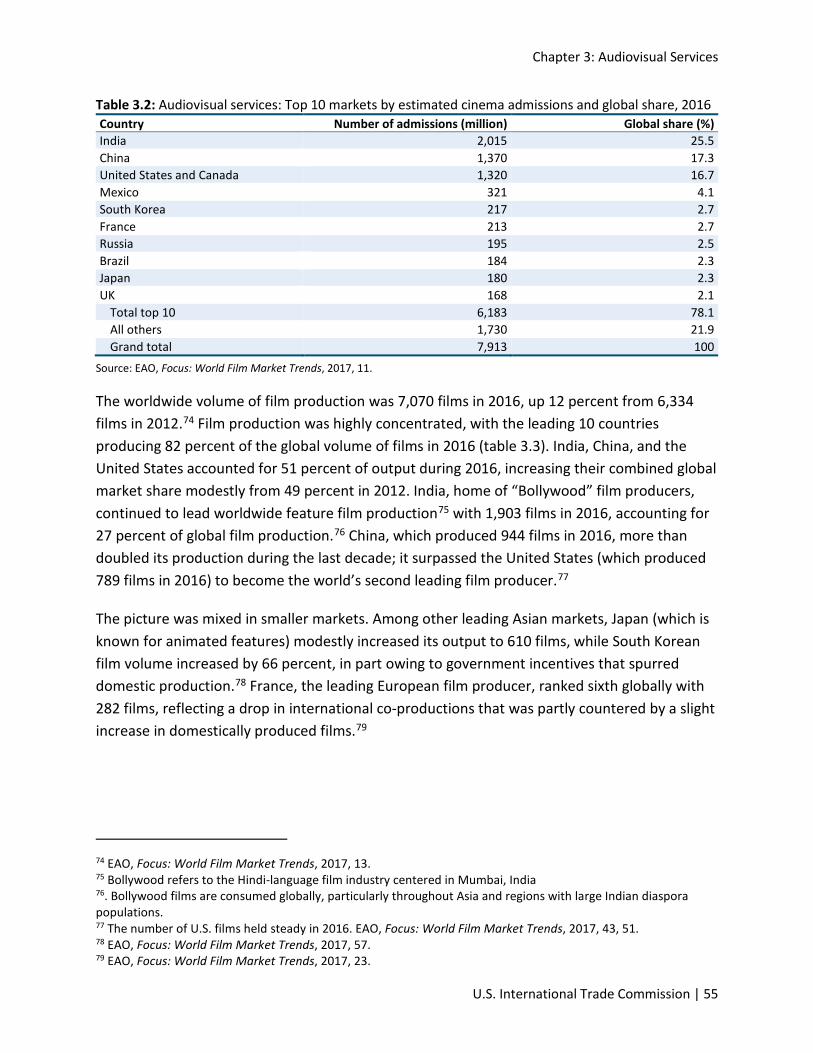
Chapter 3: Audiovisual Services
U.S. International Trade Commission | 55
Table 3.2: Audiovisual services: Top 10 markets by estimated cinema admissions and global share, 2016 Country Number of admissions (million) Global share (%) India 2,015 25.5 China 1,370 17.3 United States and Canada 1,320 16.7 Mexico 321 4.1 South Korea 217 2.7 France 213 2.7 Russia 195 2.5 Brazil 184 2.3 Japan 180 2.3 UK 168 2.1
Total top 10 6,183 78.1 All others 1,730 21.9 Grand total 7,913 100
Source: EAO, Focus: World Film Market Trends, 2017, 11.
The worldwide volume of film production was 7,070 films in 2016, up 12 percent from 6,334 films in 2012.74 Film production was highly concentrated, with the leading 10 countries producing 82 percent of the global volume of films in 2016 (table 3.3). India, China, and the United States accounted for 51 percent of output during 2016, increasing their combined global market share modestly from 49 percent in 2012. India, home of “Bollywood” film producers, continued to lead worldwide feature film production75 with 1,903 films in 2016, accounting for 27 percent of global film production.76 China, which produced 944 films in 2016, more than doubled its production during the last decade; it surpassed the United States (which produced 789 films in 2016) to become the world’s second leading film producer.77
The picture was mixed in smaller markets. Among other leading Asian markets, Japan (which is known for animated features) modestly increased its output to 610 films, while South Korean film volume increased by 66 percent, in part owing to government incentives that spurred domestic production.78 France, the leading European film producer, ranked sixth globally with 282 films, reflecting a drop in international co-productions that was partly countered by a slight increase in domestically produced films.79
74 EAO, Focus: World Film Market Trends, 2017, 13. 75 Bollywood refers to the Hindi-language film industry centered in Mumbai, India 76. Bollywood films are consumed globally, particularly throughout Asia and regions with large Indian diaspora populations. 77 The number of U.S. films held steady in 2016. EAO, Focus: World Film Market Trends, 2017, 43, 51. 78 EAO, Focus: World Film Market Trends, 2017, 57. 79 EAO, Focus: World Film Market Trends, 2017, 23.
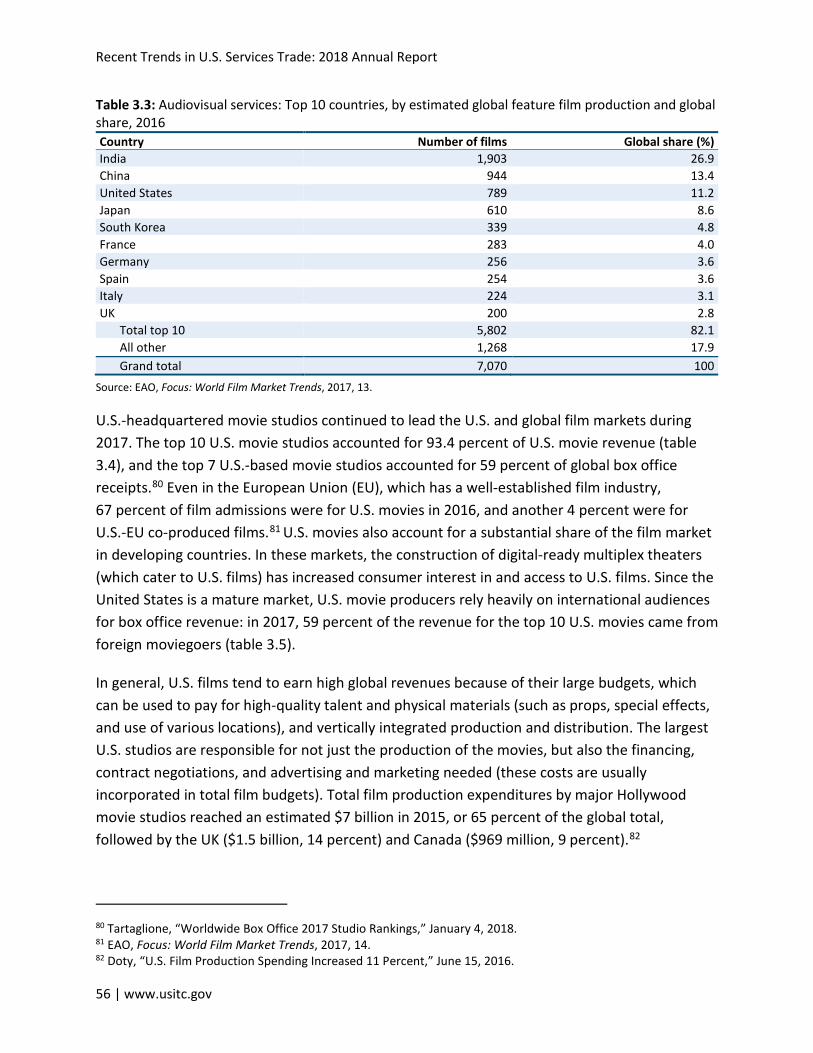
Recent Trends in U.S. Services Trade: 2018 Annual Report
56 | www.usitc.gov
Table 3.3: Audiovisual services: Top 10 countries, by estimated global feature film production and global share, 2016 Country Number of films Global share (%) India 1,903 26.9 China 944 13.4 United States 789 11.2 Japan 610 8.6 South Korea 339 4.8 France 283 4.0 Germany 256 3.6 Spain 254 3.6 Italy 224 3.1 UK 200 2.8
Total top 10 5,802 82.1 All other 1,268 17.9 Grand total 7,070 100
Source: EAO, Focus: World Film Market Trends, 2017, 13.
U.S.-headquartered movie studios continued to lead the U.S. and global film markets during 2017. The top 10 U.S. movie studios accounted for 93.4 percent of U.S. movie revenue (table 3.4), and the top 7 U.S.-based movie studios accounted for 59 percent of global box office receipts.80 Even in the European Union (EU), which has a well-established film industry, 67 percent of film admissions were for U.S. movies in 2016, and another 4 percent were for U.S.-EU co-produced films.81 U.S. movies also account for a substantial share of the film market in developing countries. In these markets, the construction of digital-ready multiplex theaters (which cater to U.S. films) has increased consumer interest in and access to U.S. films. Since the United States is a mature market, U.S. movie producers rely heavily on international audiences for box office revenue: in 2017, 59 percent of the revenue for the top 10 U.S. movies came from foreign moviegoers (table 3.5).
In general, U.S. films tend to earn high global revenues because of their large budgets, which can be used to pay for high-quality talent and physical materials (such as props, special effects, and use of various locations), and vertically integrated production and distribution. The largest U.S. studios are responsible for not just the production of the movies, but also the financing, contract negotiations, and advertising and marketing needed (these costs are usually incorporated in total film budgets). Total film production expenditures by major Hollywood movie studios reached an estimated $7 billion in 2015, or 65 percent of the global total, followed by the UK ($1.5 billion, 14 percent) and Canada ($969 million, 9 percent).82
80 Tartaglione, “Worldwide Box Office 2017 Studio Rankings,” January 4, 2018. 81 EAO, Focus: World Film Market Trends, 2017, 14. 82 Doty, “U.S. Film Production Spending Increased 11 Percent,” June 15, 2016.
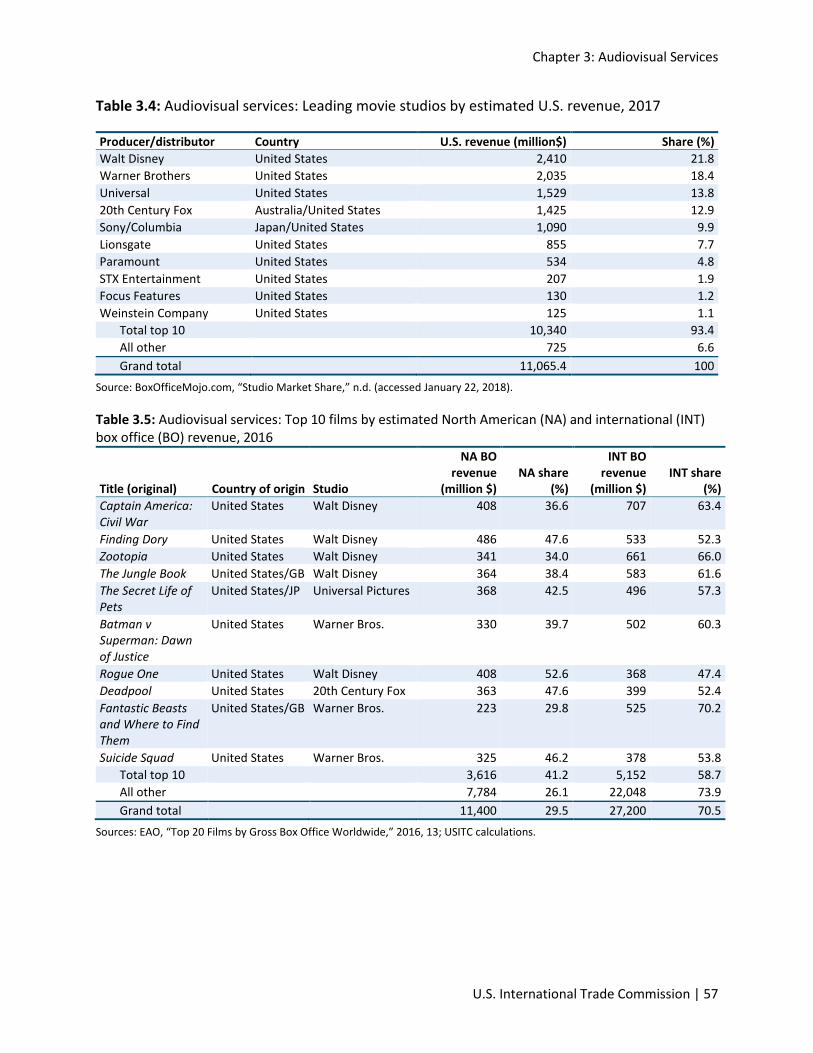
Chapter 3: Audiovisual Services
U.S. International Trade Commission | 57
Table 3.4: Audiovisual services: Leading movie studios by estimated U.S. revenue, 2017
Producer/distributor Country U.S. revenue (million$) Share (%) Walt Disney United States 2,410 21.8 Warner Brothers United States 2,035 18.4 Universal United States 1,529 13.8 20th Century Fox Australia/United States 1,425 12.9 Sony/Columbia Japan/United States 1,090 9.9 Lionsgate United States 855 7.7 Paramount United States 534 4.8 STX Entertainment United States 207 1.9 Focus Features United States 130 1.2 Weinstein Company United States 125 1.1
Total top 10 10,340 93.4 All other 725 6.6 Grand total 11,065.4 100
Source: BoxOfficeMojo.com, “Studio Market Share,” n.d. (accessed January 22, 2018).
Table 3.5: Audiovisual services: Top 10 films by estimated North American (NA) and international (INT) box office (BO) revenue, 2016
Title (original) Country of origin Studio
NA BO revenue
(million $) NA share
(%)
INT BO revenue
(million $) INT share
(%) Captain America: Civil War
United States Walt Disney 408 36.6 707 63.4
Finding Dory United States Walt Disney 486 47.6 533 52.3 Zootopia United States Walt Disney 341 34.0 661 66.0 The Jungle Book United States/GB Walt Disney 364 38.4 583 61.6 The Secret Life of Pets
United States/JP Universal Pictures 368 42.5 496 57.3
Batman v Superman: Dawn of Justice
United States Warner Bros. 330 39.7 502 60.3
Rogue One United States Walt Disney 408 52.6 368 47.4 Deadpool United States 20th Century Fox 363 47.6 399 52.4 Fantastic Beasts and Where to Find Them
United States/GB Warner Bros. 223 29.8 525 70.2
Suicide Squad United States Warner Bros. 325 46.2 378 53.8 Total top 10 3,616 41.2 5,152 58.7 All other 7,784 26.1 22,048 73.9 Grand total 11,400 29.5 27,200 70.5
Sources: EAO, “Top 20 Films by Gross Box Office Worldwide,” 2016, 13; USITC calculations.

Recent Trends in U.S. Services Trade: 2018 Annual Report
58 | www.usitc.gov
Supply and Demand Factors Growth of Streaming Services Advances in digital technology, including broadband proliferation, are joining with declining prices for cloud computing and the adoption of smartphones and tablets to transform the audiovisual services industry by making it easier to consume film and television content online.83 According to one report, consumers of audiovisual services are “increasingly agnostic as to the size of the screen on which they view films.”84 Streaming services providers, such as U.S.-based Netflix and Amazon Prime Video, are making vast libraries of content available through video on demand (VoD) and subscription video on demand (SVoD) services. This both creates opportunities and increases competition for established U.S. content producers, as streaming service providers are producing more original content.85 Streaming video consumption is also causing the sales of physical DVDs and Blu-ray discs to decline rapidly.
In response, many U.S. studios are releasing films through VoD and streaming services sooner after theatrical screening than in the past.86 U.S. studios are also licensing more of their content to streaming providers, and are forming their own streaming services ventures.
Video streaming services are the fastest-growing segment of the global audiovisual services industry. SVoD penetration is projected to increase from 1.6 percent of global households in 2010 to 13.4 percent in 2020, while global SVoD revenues are projected to grow from $11.0 billion in 2016 to $18.7 billion by 2022.87 The global footprint of Netflix, the largest provider, is projected to grow from less than 20 million households in 2010 to 115 million by 2020. Amazon Prime Video, the second-largest global supplier, is projected to increase its subscriptions outside the United States from 9.3 million in 2017 to 17.8 million in 2020, with much of this growth coming from Europe and Asia.88 The U.S. market for SVoD is relatively mature; as a result, firms that provide SVoD increasingly rely on foreign markets for subscriber
83 Global average connection speeds were 3.1 megabits per second (Mbps) at the beginning of 2013 and reached 7.2 Mbps in the first quarter of 2017. Akamai, Akamai’s State of the Internet, 2013 and 2017. Internet access increased from 36.9 percent of the global population in 2013 to 45.9 percent in 2016; World Bank, DataBank (accessed January 20, 2017). Cloud data center workloads increased by nearly 800 percent during 2011–16, from 21.3 million workloads to 189.8 million in 2016. USITC, Global Digital Trade 1, 2017, appendix table G.1. 84 PWC, “Perspectives from the Global Entertainment and Media Outlook on Business Models,” 2017, 22. 85 USITC, Global Digital Trade 1, 2017. 86 PwC, “Perspectives from the Global Entertainment and Media Outlook,” 2017. 87 Statista, “Number of Subscription Video on Demand (SVoD) Households Worldwide from 2018 to 2022 (in millions),” 2018; Statista, “Digital Markets Outlook, 2016,” 2018. 88 Statista, “Number of Amazon Prime Video Subscribers Worldwide,” 2018.

Chapter 3: Audiovisual Services
U.S. International Trade Commission | 59
and revenue growth. In 2016, Netflix earned $3.2 billion in revenue from international sources, which accounted for 60 percent of the firm’s total revenue that year.89
Although Netflix and Amazon Prime Video hold large worldwide market shares, they face strong competition from an expanding number of local service providers.90 For example, while the leading provider to India’s market of 160 million digital video viewers is Amazon Prime Video, which streams content in Hindi, Tamil, Telugu, and other local languages (as well as English), Indian firms like Hotstar are drawing customers by providing original and local content.91 In Europe, Netflix and Amazon Prime Video compete with two types of providers. Pan-European SVoD providers such as the UK’s Sky Now TV and Sky Online/Ticket offer services in the UK, Germany, Italy, and Austria, while some national providers are owned and operated by domestic broadcasters, telecom providers, or internet service providers, such as the UK’s BBC iPlayer.92
China’s Film Market and Its Growing Ties with Hollywood The Chinese film industry is increasingly prolific, in terms of both production (see table 3.3) and consumption, and it is estimated that China will soon overtake the United States as the world’s biggest film market in terms of revenue.93 Several factors have contributed to the industry’s accelerated growth, including rapid cinema construction, a growing middle class eager to consume more audiovisual content, and increasing investments by Chinese companies in U.S. movie/TV studios and films. However, continuing issues such as intellectual property infringement, film quotas, redistribution of box office earnings, and state censorship continue to dampen the expansion of the Chinese market for U.S. movies.94
China had 1.4 billion cinema admissions in 2016, a 600 percent increase over 2009.95 The number of cinema screens in China is estimated to reach 50,000 by 2020 (there were 41,179 screens in 2016), and much of this expanded capacity will be in rural areas where demand is growing. In comparison, there are about 40,000 cinema screens in the United States today, a number that has remained steady over the past five years.96 While more mature markets like
89 According to the Netflix 10-K filing, 40 percent of its revenue came from U.S. sources. Netflix, “Form 10-K,” December 31, 2016. 90 Mishra and Sharma, “The Race Is On,” November 22, 2017. 91 Baxi, “India’s Video Streaming Market Is Bigger Than Ever,” September 30, 2017. 92 USITC, Global Digital Trade 1, 2017, 425. 93 PwC, Global Entertainment and Media Outlook 2016–2020: Cinema, 2016. 94 PwC, Global Entertainment and Media Outlook 2016–2020: Cinema, 2016. 95 Oxford Economics, The Economic Contribution of Film and Television in China, December 2017, 9. 96 PwC, Global Entertainment and Media Outlook 2016–2020: Cinema, 2016.

Recent Trends in U.S. Services Trade: 2018 Annual Report
60 | www.usitc.gov
the United States are relying to a greater extent on rising ticket prices (particularly for 3D films) for revenue growth, China also benefits from its rapidly growing rate of admissions.97Although China’s box office growth slowed in 2016, increasing by only about 4 percent from the previous year—likely due to a general economic slowdown in the country, among other factors—total private movie consumption has risen by 90 percent since 2009.98
Chinese films continue to account for the majority of the country’s film market: about 58 percent of Chinese box office receipts in 2016 went to domestically produced movies.99 But U.S. movie studios increasingly rely on the Chinese market to bolster their own film revenues. For instance, the movie adaptation of the video game Warcraft (2016), which underperformed in the U.S. market by earning less than $25 million on its opening weekend, earned $156 million in its first five days in Chinese theaters, due in part to the popularity of video gaming in China.100 In many cases, China’s box office size is affecting the kind of films Hollywood produces; according to some observers, U.S. movies are incorporating more of the action plotlines that draw Chinese audiences101 and including more Chinese actors and locations.102
Chinese companies are also increasingly investing in Hollywood. At the end of 2016, the Chinese real estate and entertainment conglomerate Dalian Wanda Group announced that it would acquire Legendary Entertainment—a U.S. studio that produced blockbusters such as Jurassic World (2015)—for $3.5 billion.103 Wanda’s founder Wang Jianlin, China’s wealthiest person as of 2017, also made deals with Sony Pictures to finance films, and acquired Dick Clark Productions, a major U.S. TV production company that produces awards shows and music entertainment programs, for $1 billion.104 (Sony Pictures is a U.S. subsidiary of Sony Entertainment, which is itself a subsidiary of Japan’s Sony Corporation.) Moreover, Chinese e-
97 PwC, Global Entertainment and Media Outlook 2016–2020: Cinema, 2016. 98 Oxford Economics, The Economic Contribution of Film and Television in China, December 2017, 9; EAO, Focus: World Film Market Trends, 2017, 51; Beech, “How China Is Remaking the Global Film Industry,” January 26, 2017. 99 EAO, Focus: World Film Market Trends, 2017, 51. 100 Beech, “How China Is Remaking the Global Film Industry,” January 26, 2017. With the recent slowdown in Chinese box office revenues, there has been an increased push to produce more domestic blockbuster movie franchises. For example, the Chinese action thriller Wolf Warrior II (2017) grossed $810 million in box office revenue in its first five weeks of release (dwarfing the $88 million total made by the movie’s first installment in 2015). It became China’s highest-grossing movie of all time and the second highest earning title in history for a single region (behind Rogue One: A Star Wars Story (2016) for North America). This level of box office earnings for a largely domestically made movie (with some Western consultants) indicates how well-crafted Chinese movie productions have become, and how attuned they are to Chinese movie going audiences. Wolf Warrior II has sparked interest as a guideline for Hollywood studios seeking to attract Chinese viewers. Frater, “Wolf Warrior II’s’ Massive Success Forces Studios to Rethink,” August 31, 2017. 101 Comedic taste and romantic boundaries often vary more across cultures than simpler action-themed plotlines. Follows, “How Important Is International Box Office?” May 15, 2017. 102 Beech, “How China Is Remaking the Global Film Industry,” January 26, 2017. 103 Beech, “How China Is Remaking the Global Film Industry,” January 26, 2017. 104 Beech, “How China Is Remaking the Global Film Industry,” January 26, 2017.
Chapter 3: Audiovisual Services
U.S. International Trade Commission | 61
commerce leader Alibaba and online gaming company Tencent have invested in smaller Hollywood studios and provided funding for major U.S. films such as Mission: Impossible—Rogue Nation (2015) and Star Trek Beyond (2016). Further, in 2016 Alibaba and director Steven Spielberg announced a partnership to produce, distribute, and finance films globally.105
However, China’s longstanding import quota for films and its increasingly stringent state censorship pose challenges for the growing ties between U.S. and Chinese investors and filmmakers. The Chinese government has long maintained an import quota of 34 big-budget feature films per year for the United States, though the quota rose in 2016 to 39 movies in an effort to offset the box office slowdown and to meet the terms of a 2012 memorandum of understanding to import and distribute more foreign films in the Chinese market.106 (Some analysts expect the quota to be maintained at this level going forward.)107 Furthermore, only 25 percent of Chinese box office revenues are shared with U.S. movie distributors (compared to the international average of 40 percent),108 and many U.S. distributors report lengthy payment delays.109 China reportedly has become more restrictive in censoring content, as China’s President Xi Jinping has expressed an intention to refocus on “core socialist values” and avoid “overt admiration for Western lifestyles.”110
Trade Trends Cross-border Trade The Bureau of Economic Analysis (BEA) publishes data on audiovisual services, which is defined to include movies and television programming, books and sound recordings, and broadcasting and recording of live events.111 According to these data, U.S. exports continue to exceed imports of audiovisual services (box 3.1) (figure 3.1). In 2016, U.S. cross-border exports of audiovisual services were $20.4 billion, a slight decline from $21.4 billion in 2015, following average annual growth of 4.6 percent from 2011 to 2015. The UK remained the largest single U.S. export market for audiovisual services, accounting for $4.5 billion (22 percent). Other
105 Beech, “How China Is Remaking the Global Film Industry,” January 26, 2017. 106 USTR, 2018 National Trade Estimate Report on Foreign Trade Barriers, 2018, 101–2. 107 Brzeski, “China’s Quota on Hollywood Film Imports,” February 9, 2017. 108 Brzeski, “China’s Quota on Hollywood Film Imports,” February 9, 2017. 109 EAO, Focus: World Film Market Trends, 2017, 51. 110 Beech, “How China Is Remaking the Global Film Industry,” January 26, 2017. For example, one draft film law demands “excellence in both professional skills and moral integrity” from those in the Chinese movie business. Beech, “China’s Morality Censors Take Aim,” August 30, 2016. 111 USDOC, BEA, table 2.1, “U.S. Trade in Services, by Type of Service,” October 24, 2017.
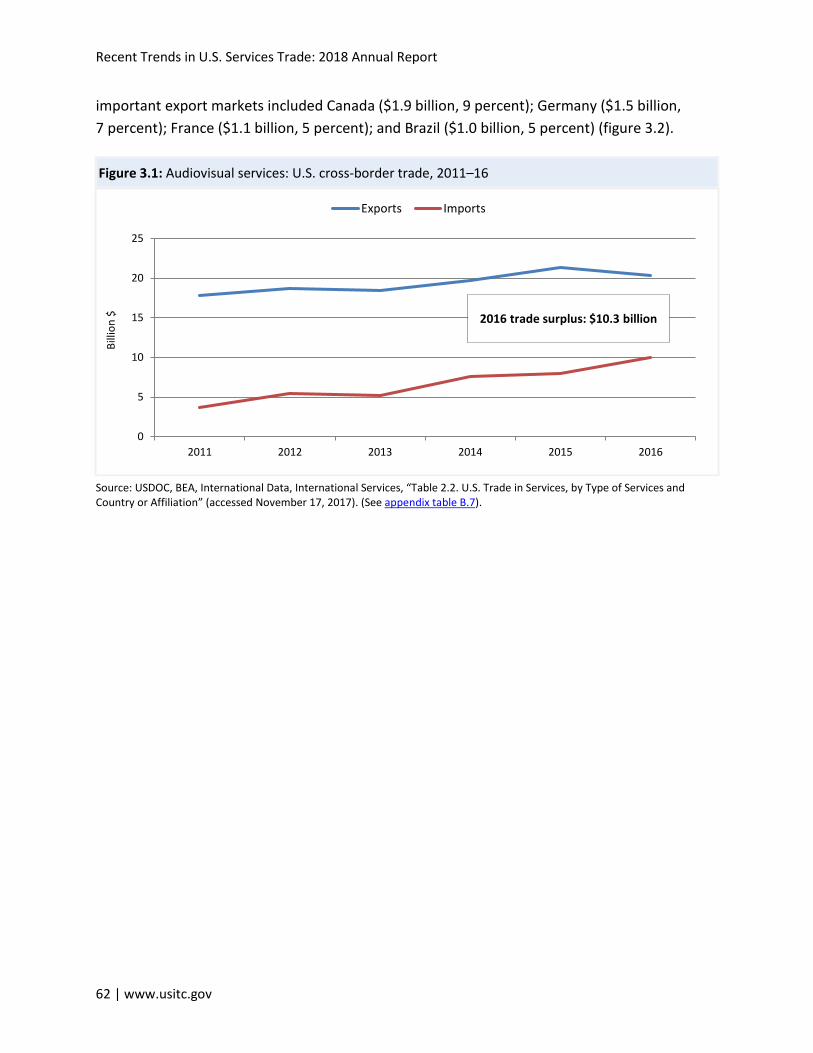
Recent Trends in U.S. Services Trade: 2018 Annual Report
62 | www.usitc.gov
important export markets included Canada ($1.9 billion, 9 percent); Germany ($1.5 billion, 7 percent); France ($1.1 billion, 5 percent); and Brazil ($1.0 billion, 5 percent) (figure 3.2).
Figure 3.1: Audiovisual services: U.S. cross-border trade, 2011–16
Source: USDOC, BEA, International Data, International Services, “Table 2.2. U.S. Trade in Services, by Type of Services and Country or Affiliation” (accessed November 17, 2017). (See appendix table B.7).
0
5
10
15
20
25
2011 2012 2013 2014 2015 2016
Billi
on $
Exports Imports
2016 trade surplus: $10.3 billion
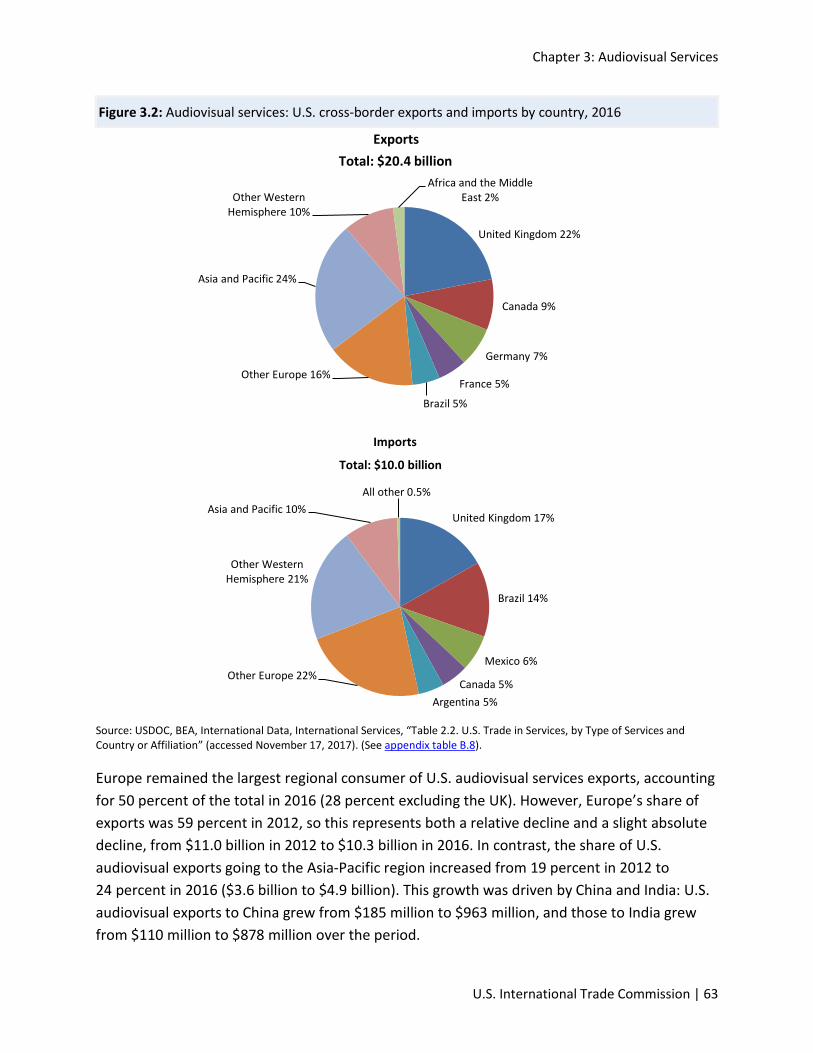
Chapter 3: Audiovisual Services
U.S. International Trade Commission | 63
Figure 3.2: Audiovisual services: U.S. cross-border exports and imports by country, 2016
Source: USDOC, BEA, International Data, International Services, “Table 2.2. U.S. Trade in Services, by Type of Services and Country or Affiliation” (accessed November 17, 2017). (See appendix table B.8).
Europe remained the largest regional consumer of U.S. audiovisual services exports, accounting for 50 percent of the total in 2016 (28 percent excluding the UK). However, Europe’s share of exports was 59 percent in 2012, so this represents both a relative decline and a slight absolute decline, from $11.0 billion in 2012 to $10.3 billion in 2016. In contrast, the share of U.S. audiovisual exports going to the Asia-Pacific region increased from 19 percent in 2012 to 24 percent in 2016 ($3.6 billion to $4.9 billion). This growth was driven by China and India: U.S. audiovisual exports to China grew from $185 million to $963 million, and those to India grew from $110 million to $878 million over the period.
United Kingdom 22%
Canada 9%
Germany 7%
France 5%
Brazil 5%
Other Europe 16%
Asia and Pacific 24%
Other Western Hemisphere 10%
Africa and the Middle East 2%
ExportsTotal: $20.4 billion
United Kingdom 17%
Brazil 14%
Mexico 6%
Canada 5%Argentina 5%
Other Europe 22%
Other Western Hemisphere 21%
Asia and Pacific 10%All other 0.5%
Imports
Total: $10.0 billion
Recent Trends in U.S. Services Trade: 2018 Annual Report
64 | www.usitc.gov
U.S. cross-border imports of audiovisual services in 2016 totaled $10.0 billion, a 25 percent increase from the previous year. This was a slight increase from the steady 22 percent growth rate for imports from 2011 to 2015. The UK was the largest source of U.S. audiovisual imports in 2016, accounting for $1.7 billion (or 17 percent of total imports). The UK was followed by Brazil ($1.4 billion, or 14 percent), Mexico ($661 million, or 7 percent), Canada ($498 million, or 5 percent), and Argentina ($468 million, or 5 percent).
Latin America continues to supply a large amount (46 percent) of U.S. audiovisual imports, and Brazil accounts for the largest country share within Latin America. The United States imported $1.4 billion in audiovisual services from Brazil in 2016, almost all either movies or television programming. Brazil’s Globo is the world’s second-largest commercial TV network by revenue and the world’s largest producer of telenovelas.112 At the same time, the Asia-Pacific region accounts for a growing share of U.S. audiovisual imports—5 percent in 2012 and 10 percent in 2016. However, imports from Europe recorded the largest increase, from 31 percent in 2012 to 39 percent in 2016 ($1.7 billion to $3.9 billion). Countries other than the UK accounted for a substantial share of this increase: imports from non-UK Europe increased from $722 million in 2012 to $2.3 billion in 2016. Imports of movies and television programming from Europe grew from $504 million to $1.2 billion, while imports of books and sound recordings grew from $982 million to $2.2 billion.
Affiliate Transactions Sales by foreign affiliates of U.S. audiovisual firms (including firms in the motion picture, video, and sound recording industries) totaled $12.3 billion in 2015. This was a 14 percent decrease from 2014, and a 27 percent decrease from its peak in 2008. The largest markets for such sales were the UK ($2.0 billion), France ($1.3 billion), and the Netherlands ($1.2 billion) (figure 3.3). Purchases from U.S. affiliates of foreign audiovisual firms were $4.9 billion in 2015, a 7 percent increase from 2014. The BEA suppresses most country-specific data on these purchases (box 3.1).
112 Telenovelas (which originated in Latin America), are melodramatic television series with a limited number of episodes that are performed in Spanish or Portuguese, typically shown during prime time on multiple days of the week over the course of several months. There are telenovelas aimed at children, teenagers, or mature audiences. Telenovela Studies, “What is a Telenovela,” n.d. (accessed March 27, 2018).
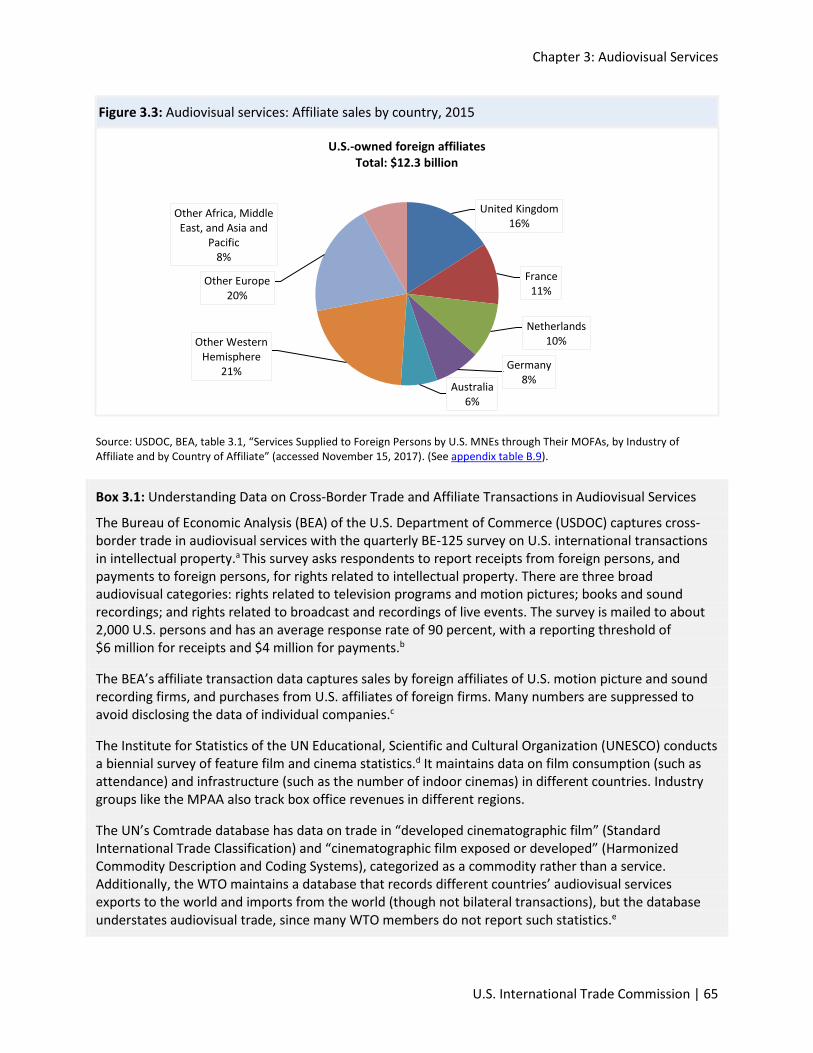
Chapter 3: Audiovisual Services
U.S. International Trade Commission | 65
Figure 3.3: Audiovisual services: Affiliate sales by country, 2015
Source: USDOC, BEA, table 3.1, “Services Supplied to Foreign Persons by U.S. MNEs through Their MOFAs, by Industry of Affiliate and by Country of Affiliate” (accessed November 15, 2017). (See appendix table B.9).
Box 3.1: Understanding Data on Cross-Border Trade and Affiliate Transactions in Audiovisual Services
The Bureau of Economic Analysis (BEA) of the U.S. Department of Commerce (USDOC) captures cross-border trade in audiovisual services with the quarterly BE-125 survey on U.S. international transactions in intellectual property.a This survey asks respondents to report receipts from foreign persons, and payments to foreign persons, for rights related to intellectual property. There are three broad audiovisual categories: rights related to television programs and motion pictures; books and sound recordings; and rights related to broadcast and recordings of live events. The survey is mailed to about 2,000 U.S. persons and has an average response rate of 90 percent, with a reporting threshold of $6 million for receipts and $4 million for payments.b
The BEA’s affiliate transaction data captures sales by foreign affiliates of U.S. motion picture and sound recording firms, and purchases from U.S. affiliates of foreign firms. Many numbers are suppressed to avoid disclosing the data of individual companies.c
The Institute for Statistics of the UN Educational, Scientific and Cultural Organization (UNESCO) conducts a biennial survey of feature film and cinema statistics.d It maintains data on film consumption (such as attendance) and infrastructure (such as the number of indoor cinemas) in different countries. Industry groups like the MPAA also track box office revenues in different regions.
The UN’s Comtrade database has data on trade in “developed cinematographic film” (Standard International Trade Classification) and “cinematographic film exposed or developed” (Harmonized Commodity Description and Coding Systems), categorized as a commodity rather than a service. Additionally, the WTO maintains a database that records different countries’ audiovisual services exports to the world and imports from the world (though not bilateral transactions), but the database understates audiovisual trade, since many WTO members do not report such statistics.e
United Kingdom16%
France11%
Netherlands10%
Germany8%Australia
6%
Other Western Hemisphere
21%
Other Europe20%
Other Africa, Middle East, and Asia and
Pacific8%
U.S.-owned foreign affiliatesTotal: $12.3 billion

Recent Trends in U.S. Services Trade: 2018 Annual Report
66 | www.usitc.gov
a BEA describes this sector as “film and television tape distribution.” USDOC, BEA, Survey of Current Business, October 2013, 26–28, 32.
b USDOC, BEA, Survey of Current Business, October 2013, 26–28, 32. c Hanson and Xiang, “International Trade in Motion Picture Services,” January 2008, 3–9. d UNESCO, Institute for Statistics, Feature Films and Cinema Data (accessed December 21, 2017). e WTO, “Audiovisual Services: Background Note,” January 12, 2010, 4.
Outlook Global box office revenues are expected to be modest in the coming years, but they will vary by region. Revenues are expected to shift from mature markets like the United States and Europe to the Asia-Pacific region, particularly China, where disposable incomes are expected to rise.113 By 2020, the Asia-Pacific region is expected to account for about half of global box office revenue.114 Although China will likely surpass the United States in box office revenue within the next few years (and has already surpassed total annual U.S. cinema admissions), it remains unclear how U.S.-China audiovisual services trade will develop due to import quota, remuneration, and censorship issues.115
Consumers worldwide are expected to continue to shift consumption to streaming services and other online formats because of the convenience and wide selection of online content. This global expansion of streaming services will benefit U.S. firms as the leading global providers.116 Such services will likely further erode film studios’ revenues from theatrical screening and physical home video products (such as DVDs and Blu-ray discs), though box office revenues will likely continue to grow as ticket prices rise worldwide.
The growth of streaming services will also bolster licensing revenues from streaming platforms.117 The online distribution of audiovisual content will likely continue to pose challenges to the enforcement of intellectual property rights.118
113 PwC, “Perspectives from the Global Entertainment and Media Outlook,” 2017. 114 PwC, “China Challenges the US,” 2016, 2. 115 Dresden, “What Does the Chinese Film Industry Get?” December 11, 2017; IBISWorld, Global Movie Production and Distribution, August 2017, 6-7. 116 IBISWorld, Global Movie Production and Distribution, August 2017, 7. 117 PwC, “Perspectives from the Global Entertainment and Media Outlook,” 2017. 118 IBISWorld, Global Movie Production and Distribution, August 2017, 7. Intellectual property rights issues traditionally have included transferring digital files and selling bootleg DVDs. However, in some recent cases people have gained access to pre-release films or television programs, and demanded ransoms from Hollywood studios in exchange for not releasing digital copies of the films or programs before their official release dates. Economist, “Film Piracy Is Changing. Pirates Now Want Ransoms,” June 1, 2017.
Chapter 3: Audiovisual Services
U.S. International Trade Commission | 67
Bibliography Akamai. Akamai’s State of the Internet, 2013 and 2017.
https://www.akamai.com/us/en/about/our-thinking/state-of-the-internet-report/global-state-of-the-internet-connectivity-reports.jsp (accessed January 20, 2018).
Arthofer, Frank, Áki Hardarson, Martin Kon, Eric Lee, and John Rose. “The Future of Television: The Impact of OTT on Video Production around the World.” BCG, September 20, 2016. https://www.bcg.com/publications/2016/media-entertainment-technology-digital-future-television-impact-ott-video-production.aspx.
Baxi, Abhishek. “India’s Video Streaming Market Is Bigger than Ever.” Forbes, September 30, 2017. https://www.forbes.com/sites/baxiabhishek/2017/09/30/indias-video-streaming-market-is-bigger-than-ever-and-heres-who-you-should-watch/#ffe7b2e7cda9.
Beech, Hannah. “How China Is Remaking the Global Film Industry.” Time.com, January 26, 2017. http://time.com/4649913/china-remaking-global-film-industry/.
Box Office Mojo.com. “Studio Market Share: 2017,” n.d. http://www.boxofficemojo.com/studio/?view=company&view2=yearly&yr=2017&p=.htm (accessed January 22, 2018).
Brzeski, Patrick. “China’s Quota on Hollywood Film Imports Set to Expand.” Hollywood Reporter, February 9, 2017. https://www.hollywoodreporter.com/news/chinas-state-media-says-quota-hollywood-film-imports-will-expand-974224.
Doty, Meriah. “US Film Production Spending Increased 11 Percent to $7 Billion in 2015.” The Wrap.com, June 15, 2016. https://www.thewrap.com/us-film-production-spending-increased-11-percent-to-7-billion-in-2015-study/.
Dresden, Matthew. “What Does the Chinese Film Industry Get from Hollywood?” China Law Blog. Harris Bricken, December 11, 2017. https://www.chinalawblog.com/2017/12/what-does-the-chinese-film-industry-get-from-hollywood.html.
Economist. “Film Piracy Is Changing. Pirates Now Want Ransoms,” June 1, 2017. https://www.economist.com/news/business/21722878-netflix-and-disney-are-among-victims-film-piracy-changing-pirates-now-want-ransoms.
European Audiovisual Observatory (EAO). Focus: World Film Market Trends, 2017. http://shop.obs.coe.int/en/focus/63-focus-2017-world-film-market-trends.html (paid).
Recent Trends in U.S. Services Trade: 2018 Annual Report
68 | www.usitc.gov
Follows, Stephen. “How Important Is International Box Office to Hollywood?” Film Data Blog, May 15, 2017. https://stephenfollows.com/important-international-box-office-hollywood/.
Frater, Patrick. “‘Wolf Warrior II’s’ Massive Success Forces Studios to Rethink China Approach.” Variety, August 31, 2017. http://variety.com/2017/biz/news/china-wolf-warrior-ii-1202543266/.
Hanson, Gordon H., and Chong Xiang. “International Trade in Motion Picture Services.” University of California, San Diego, January 2008. https://gps.ucsd.edu/_files/faculty/hanson/hanson_publication_it_international-trade.pdf.
IBISWorld. Global Movie Production and Distribution: Industry Report, August 2017. https://www.ibisworld.com/industry-trends/global-industry-reports/other-community-social-personal-service-activities/movie-production-distribution.html (paid).
Leigh, Danny. “Celluloid Is Strictly for Nostalgists. Digital Technology Saved a Dying Medium.” Film Blog. Guardian, July 7, 2016. https://www.theguardian.com/film/filmblog/2016/jul/07/how-digital-technology-saved-a-dying-medium.
Mishra, Tmanna, and Spandan Sharma. “The Race in On—Will Netflix Maintain the Pole Position?” YourStory.com, November 22, 2017. https://yourstory.com/2017/11/subscription-video-streaming-netflix/.
Motion Picture Association of America (MPAA). Theatrical Market Statistics 2016, 2017. https://www.mpaa.org/wp-content/uploads/2017/03/MPAA-Theatrical-Market-Statistics-2016_Final-1.pdf.
Netflix. “Netflix: Form 10-K (2016). ” Registration statement for U.S. Securities and Exchange Commission, December 31, 2016. https://ir.netflix.com/node/27296/html.
Oxford Economics. The Economic Contribution of Film and Television in China in 2016, December 2017. https://www.mpaa.org/wp-content/uploads/2017/12/MPAA_China_2016_WEB-2.pdf.
PwC. “Cinema: China Challenges the US for Global Box Office Leadership,” 2016. https://www.pwc.com/gx/en/entertainment-media/pdf/outlook-cinema-article-2016.pdf.

Chapter 3: Audiovisual Services
U.S. International Trade Commission | 69
PwC. Global Entertainment and Media Outlook: 2016–2020: Cinema, 2016. http://pwc.blogs.com/files/em_outlook_080615.pdf.
PwC. Perspectives from the Global Entertainment and Media Outlook 2017–2021, 2017. https://www.pwc.com/gx/en/entertainment-media/pdf/outlook-2017-curtain-up.pdf.
SNL Kagan. “U.S. Availability of Film and TV Titles in the Digital Age,” March 2016. https://marketintelligence.spglobal.com/documents/marketo/us-availability-of-film-and-tv-titles-in-the-digital-age.pdf.
Statista. “Digital Markets Outlook, 2016,” 2018. https://www.statista.com/outlook/200/100/digital-media/worldwide# (fee required).
Statista. “IHS Screen Digest and MPAA Data,” 2017. https://www.statista.com/study/45979/the-us-box-office/ (fee required).
Statista. “Number of Amazon Prime Video Subscribers Worldwide,” 2018. https://www.statista.com/statistics/693936/global-number-of-amazon-prime-video-subscribers-region/ (fee required).
Statista. “Number of Households Subscribing to Netflix Worldwide from 2010 to 2020,” 2018. https://www.statista.com/statistics/273885/quarterly-subscriber-numbers-of-netflix/ (fee required).
Statista. “Number of Subscription Video on Demand (SVoD) Households Worldwide from 2018 to 2022 (in millions).” 2018. https://www.statista.com/statistics/322737/svod-households-worldwide/ (fee required).
Statista. “Subscription Video on Demand (SVoD) Penetration Rate Worldwide in 2010, 2014 and 2020.” Data from Digital TV Research, 2018. https://www.statista.com/statistics/322752/svod-penetration/ (fee required).
Tartaglione, Nancy. “Worldwide Box Office 2017 Studio Rankings.” Deadline.com, January 4, 2018. http://deadline.com/2018/01/highest-grossing-movie-studios-of-2017-record-international-box-office-chart-1202234746/.
Telenovela Studies (blog). “What Is a Telenovela?” https://telenovelastudies.wordpress.com/what-is-a-telenovela/ (accessed March 27, 2018).

Recent Trends in U.S. Services Trade: 2018 Annual Report
70 | www.usitc.gov
U.S. Department of Commerce (USDOC). Bureau of Economic Analysis (BEA). International Data, International Services. “Table 2.2. U.S. Trade in Services, by Type of Services and Country or Affiliation” (accessed November 17, 2017).
U.S. Department of Commerce (USDOC). Bureau of Economic Analysis (BEA). Survey of Current Business, October 2013.
U.S. International Trade Commission (USITC). Digital Trade in the U.S. and Global Economies, Part 1. USITC Publication 4415. Washington, DC: USITC, July 2013.
U.S. International Trade Commission (USITC). Global Digital Trade 1: Market Opportunities and Key Foreign Trade Restrictions. USITC Publication 4716. Washington, DC: USITC, August 2017. https://www.usitc.gov/publications/332/pub4716.pdf.
U.S. Trade Representatives (USTR). 2018 National Trade Estimate Report on Foreign Trade Barriers. Washington, DC: USTR, 2018. https://ustr.gov/sites/default/files/press/Reports/2018%20National%20Trade%20Estimate%20Report.pdf.
United Nations Educational, Scientific, and Cultural Organization (UNESCO). Institute for Statistics. Feature Films and Cinema Data, 2017. http://uis.unesco.org/en/topic/feature-films-and-cinema-data (accessed December 21, 2017).
World Bank. DataBank: World Development Indicators. http://databank.worldbank.org/data/reports.aspx?source=world-development-indicators (accessed January 20, 2017).
World Trade Organization (WTO). “Audiovisual Services: Background Note,” January 12, 2010. http://www.oecd.org/tad/services-trade/47559464.pdf.
World Trade Organization (WTO). “Audiovisual Services.” Services by Sector, n.d. https://www.wto.org/english/tratop_e/serv_e/audiovisual_e/audiovisual_e.htm (accessed January 12, 2017).

U.S. International Trade Commission | 71
Chapter 4 Computer and Data Processing Services Summary The global computer and data processing services industry—encompassing information technology (IT) services, cloud computing, and software—grew rapidly during the past decade, and this strong growth will likely continue in the coming years. Computer services increasingly enable the integration of services and manufactured goods, with more and more services embedded in manufactured products.119
Demand remained highest in North America, where most of the industry’s leading firms are headquartered. At the same time, Indian computer service companies have begun supplying higher-value services, while Chinese firms have become prominent players in the sector. In emerging markets, computer services firms have used mobile applications reach new consumers. The growth in mobile phone subscriptions and cloud-based application hosting platforms has increased access to computer services in these markets.
The U.S. trade deficit in computer and data processing services grew during 2011–16, totaling $11.7 billion at the end of the period.120 India remained the largest supplier of U.S. imports of computer and data processing services, accounting for 47 percent of such imports in 2016. Sales by U.S.-owned foreign affiliates whose primary industry was computer and data processing services totaled $111 billion in 2015. These sales were more than five times the value of U.S. cross-border exports of such services in that year and far exceeded purchases from U.S. affiliates of foreign computer and data processing services firms, which totaled
119 As an example, one forecast predicts that by 2021, 98 percent of new cars sold in the United States and Europe will be electronically connected to the car manufacturer. Firms report that they will use the data to better understand buyers, improve production and performance, and enhance vehicle safety. Holley, “Big Brother on Wheels,” January 17, 2018, 17. 120 U.S. exports of computer services grew more quickly than imports from 2011 to 2015.

Recent Trends in U.S. Service Trade: 2018 Annual Report
72 | www.usitc.gov
$29.4 billion that year. Countries have increasingly introduced non-tariff measures to digital trade, such as data localization requirements, which may undermine global provisions of computer services.
Introduction The computer and data processing services industry can be divided into two broad categories: IT services and software services. While IT services tend to be sold to businesses, software targets both businesses (with offerings like marketing software) and consumers (through mobile phone applications). A third category of computer services, cloud computing, overlaps with both of these categories but is often discussed separately.
IT services range widely. They include hardware and software consultancy, installation, and maintenance services, including installation of mainframes and central computing units; data recovery services; analysis, design, and programming of ready-to-use systems (including webpage development and design); data processing and hosting services (cloud services), such as data entry, tabulation, and processing on a time-sharing basis; webpage hosting services; and provision of applications, hosting clients’ applications, and computer facilities management services.121 IT services also encompass software-dependent services such as financial statement preparation, payroll preparation, tax return preparation, industrial design, and interior design.122
Software services are likewise diverse and include different categories of services depending on whether the software is mass produced (like Microsoft Office), or created for a specific client (custom software). For mass produced software, computer services include software downloaded or otherwise electronically delivered (including applications downloaded to smartphones), and can be purchased through a single payment, subscription, or through licensing agreements. Custom software includes development, production, supply, documentation, and sale of software, including operating systems, made to order for specific
121 These activities fall under the “computer and data processing services” category of the BEA survey of cross-border services trade and correspond to codes 5415 and 5182 of the North American Industry Classification System (NAICS). USDOC, BEA, Quarterly Survey of Transactions in Selected Services and Intellectual Property with Foreign Persons, Form BE-125, September 2016. 122 These services are additional categories that fall under NAICS code 5415, which includes “Businesses engaged in providing services in the field of information technologies through one or more of the following activities: (1) writing, modifying, testing, and supporting software to meet the needs of a particular customer; (2) planning and designing computer systems that integrate computer hardware, software, and communication technologies; (3) on-site management and operation of clients’ computer systems and/or data processing facilities; and (4) other professional and technical computer-related advice and services.” USDOC, BEA, Guide to Industry Classifications for International Surveys, 2012, 43.

Chapter 4: Computer and Data Processing Services
U.S. International Trade Commission | 73
users (however delivered). Additionally, sales of original copies and ownership rights of software are included in this category. However, this definition excludes non-customized computer software on physical media (considered goods trade) and licenses to reproduce or distribute software (considered intellectual property).123
A third segment of the market—cloud computing—allows firms to host computer-based services on networks of servers accessed via the internet.124 Cloud services are frequently embedded in IT and software services, but are often reported as a separate segment of the industry. Cloud computing offers users “ubiquitous, convenient, on-demand network access to a shared pool of configurable computing resources (e.g., networks, servers, storage applications, and services);” and quick access to the resources, via the internet, requires little effort from either the resource manager or the service provider.125 Cloud computing has three basic service models. Software as a service (SaaS) offers software and applications that are hosted on cloud datacenter networks and accessed by customers via the internet. Platform as a service (PaaS) offers tools for development, testing, hosting and maintenance of software and applications. Infrastructure as a service (IaaS) provides data processing and storage services for both firms and individuals.126
This chapter considers all of the services described above. In recent years, the computer and data processing services industry has continued to grow in many countries, including in the United States. Between 2011 and 2016, the share of U.S. economic output accounted for by computer and data processing services rose from 1.8 percent to 2.2 percent.127
123 Again, these services correspond to NAICS codes 5415 and 5182. USDOC, BEA, Guide to Industry Classifications for International Surveys, 2012, 39, 43. 124 In the BEA definition of computer services, cloud computing falls under "data processing and hosting services." USDOC, BEA, Quarterly Survey of Transactions in Selected Services and Intellectual Property with Foreign Persons, Form BE-125, September 2016. 125 USDOC, NIST, The NIST Definition of Cloud Computing, September 2011, 2–3. 126 USITC, Global Digital Trade 1, August 2017, 58. 127 USDOC, BEA, “Value Added by Industry,” November 2, 2017. The shares of output correspond to value added as a percentage of gross domestic product (GDP).
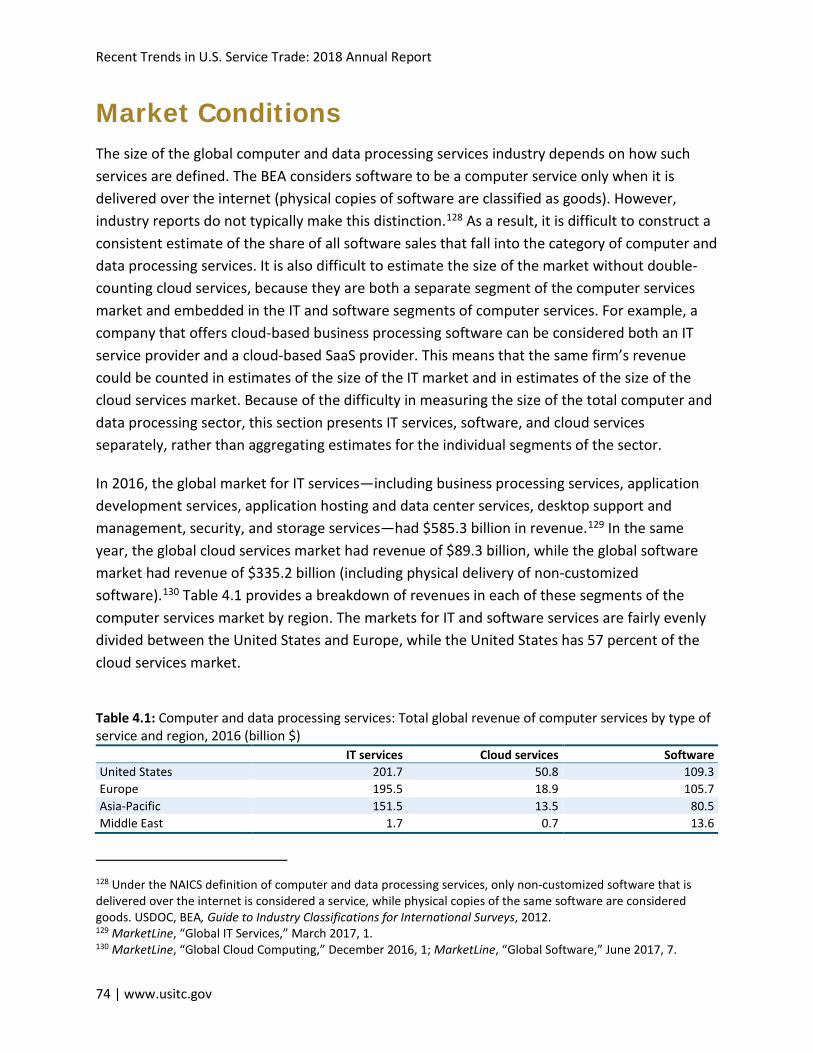
Recent Trends in U.S. Service Trade: 2018 Annual Report
74 | www.usitc.gov
Market Conditions The size of the global computer and data processing services industry depends on how such services are defined. The BEA considers software to be a computer service only when it is delivered over the internet (physical copies of software are classified as goods). However, industry reports do not typically make this distinction.128 As a result, it is difficult to construct a consistent estimate of the share of all software sales that fall into the category of computer and data processing services. It is also difficult to estimate the size of the market without double-counting cloud services, because they are both a separate segment of the computer services market and embedded in the IT and software segments of computer services. For example, a company that offers cloud-based business processing software can be considered both an IT service provider and a cloud-based SaaS provider. This means that the same firm’s revenue could be counted in estimates of the size of the IT market and in estimates of the size of the cloud services market. Because of the difficulty in measuring the size of the total computer and data processing sector, this section presents IT services, software, and cloud services separately, rather than aggregating estimates for the individual segments of the sector.
In 2016, the global market for IT services—including business processing services, application development services, application hosting and data center services, desktop support and management, security, and storage services—had $585.3 billion in revenue.129 In the same year, the global cloud services market had revenue of $89.3 billion, while the global software market had revenue of $335.2 billion (including physical delivery of non-customized software).130 Table 4.1 provides a breakdown of revenues in each of these segments of the computer services market by region. The markets for IT and software services are fairly evenly divided between the United States and Europe, while the United States has 57 percent of the cloud services market.
Table 4.1: Computer and data processing services: Total global revenue of computer services by type of service and region, 2016 (billion $) IT services Cloud services Software United States 201.7 50.8 109.3 Europe 195.5 18.9 105.7 Asia-Pacific 151.5 13.5 80.5 Middle East 1.7 0.7 13.6
128 Under the NAICS definition of computer and data processing services, only non-customized software that is delivered over the internet is considered a service, while physical copies of the same software are considered goods. USDOC, BEA, Guide to Industry Classifications for International Surveys, 2012. 129 MarketLine, “Global IT Services,” March 2017, 1. 130 MarketLine, “Global Cloud Computing,” December 2016, 1; MarketLine, “Global Software,” June 2017, 7.
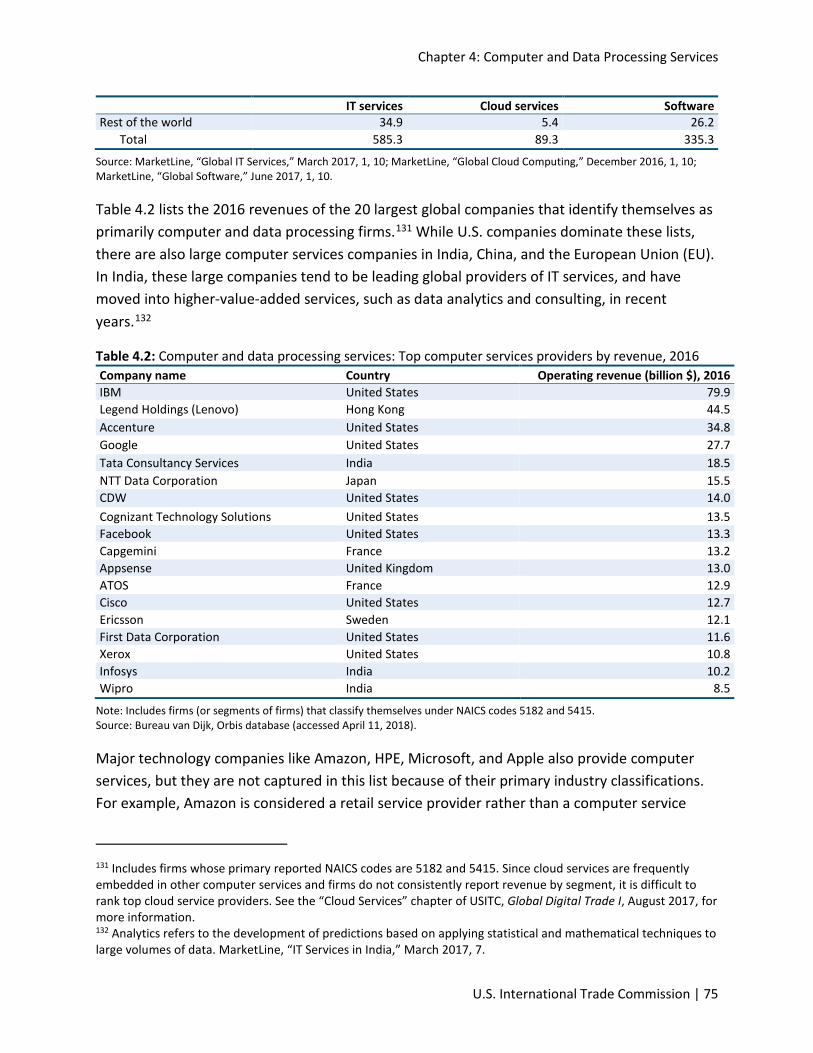
Chapter 4: Computer and Data Processing Services
U.S. International Trade Commission | 75
IT services Cloud services Software Rest of the world 34.9 5.4 26.2
Total 585.3 89.3 335.3
Source: MarketLine, “Global IT Services,” March 2017, 1, 10; MarketLine, “Global Cloud Computing,” December 2016, 1, 10; MarketLine, “Global Software,” June 2017, 1, 10.
Table 4.2 lists the 2016 revenues of the 20 largest global companies that identify themselves as primarily computer and data processing firms.131 While U.S. companies dominate these lists, there are also large computer services companies in India, China, and the European Union (EU). In India, these large companies tend to be leading global providers of IT services, and have moved into higher-value-added services, such as data analytics and consulting, in recent years.132
Table 4.2: Computer and data processing services: Top computer services providers by revenue, 2016 Company name Country Operating revenue (billion $), 2016 IBM United States 79.9 Legend Holdings (Lenovo) Hong Kong 44.5 Accenture United States 34.8 Google United States 27.7 Tata Consultancy Services India 18.5 NTT Data Corporation Japan 15.5 CDW United States 14.0 Cognizant Technology Solutions United States 13.5 Facebook United States 13.3 Capgemini France 13.2 Appsense United Kingdom 13.0 ATOS France 12.9 Cisco United States 12.7 Ericsson Sweden 12.1 First Data Corporation United States 11.6 Xerox United States 10.8 Infosys India 10.2 Wipro India 8.5
Note: Includes firms (or segments of firms) that classify themselves under NAICS codes 5182 and 5415. Source: Bureau van Dijk, Orbis database (accessed April 11, 2018).
Major technology companies like Amazon, HPE, Microsoft, and Apple also provide computer services, but they are not captured in this list because of their primary industry classifications. For example, Amazon is considered a retail service provider rather than a computer service
131 Includes firms whose primary reported NAICS codes are 5182 and 5415. Since cloud services are frequently embedded in other computer services and firms do not consistently report revenue by segment, it is difficult to rank top cloud service providers. See the “Cloud Services” chapter of USITC, Global Digital Trade I, August 2017, for more information. 132 Analytics refers to the development of predictions based on applying statistical and mathematical techniques to large volumes of data. MarketLine, “IT Services in India,” March 2017, 7.
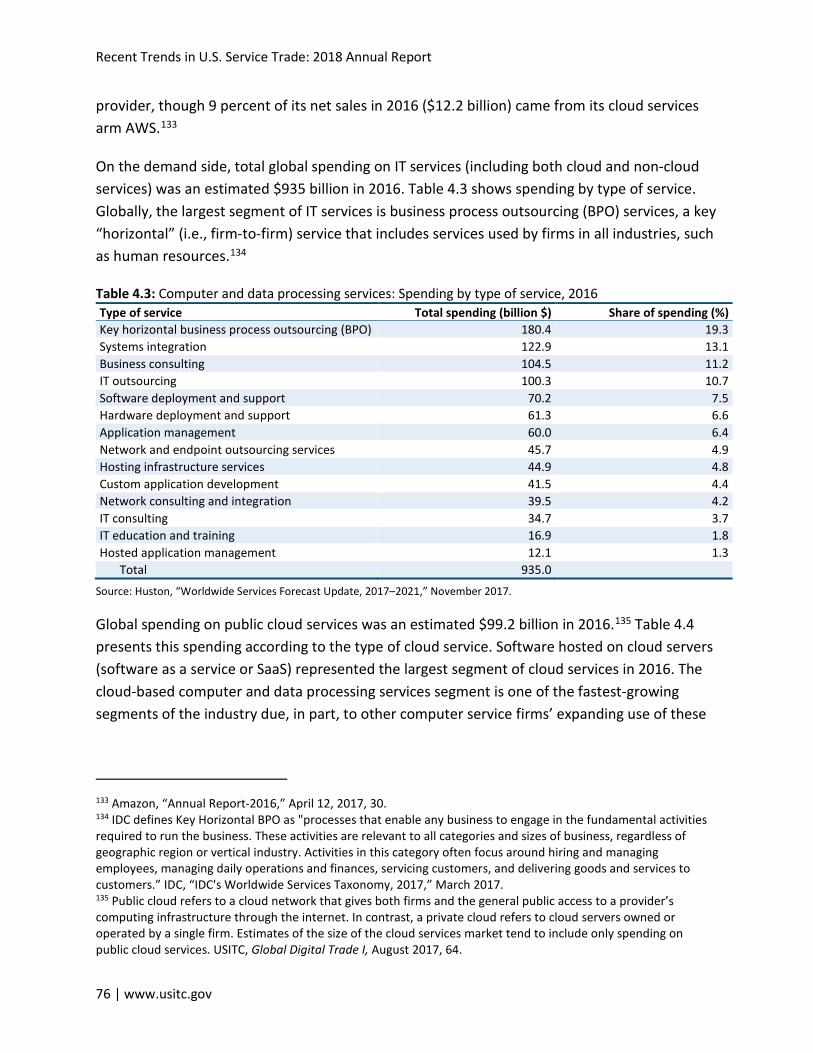
Recent Trends in U.S. Service Trade: 2018 Annual Report
76 | www.usitc.gov
provider, though 9 percent of its net sales in 2016 ($12.2 billion) came from its cloud services arm AWS.133
On the demand side, total global spending on IT services (including both cloud and non-cloud services) was an estimated $935 billion in 2016. Table 4.3 shows spending by type of service. Globally, the largest segment of IT services is business process outsourcing (BPO) services, a key “horizontal” (i.e., firm-to-firm) service that includes services used by firms in all industries, such as human resources.134
Table 4.3: Computer and data processing services: Spending by type of service, 2016 Type of service Total spending (billion $) Share of spending (%) Key horizontal business process outsourcing (BPO) 180.4 19.3 Systems integration 122.9 13.1 Business consulting 104.5 11.2 IT outsourcing 100.3 10.7 Software deployment and support 70.2 7.5 Hardware deployment and support 61.3 6.6 Application management 60.0 6.4 Network and endpoint outsourcing services 45.7 4.9 Hosting infrastructure services 44.9 4.8 Custom application development 41.5 4.4 Network consulting and integration 39.5 4.2 IT consulting 34.7 3.7 IT education and training 16.9 1.8 Hosted application management 12.1 1.3
Total 935.0
Source: Huston, “Worldwide Services Forecast Update, 2017–2021,” November 2017.
Global spending on public cloud services was an estimated $99.2 billion in 2016.135 Table 4.4 presents this spending according to the type of cloud service. Software hosted on cloud servers (software as a service or SaaS) represented the largest segment of cloud services in 2016. The cloud-based computer and data processing services segment is one of the fastest-growing segments of the industry due, in part, to other computer service firms’ expanding use of these
133 Amazon, “Annual Report-2016,” April 12, 2017, 30. 134 IDC defines Key Horizontal BPO as "processes that enable any business to engage in the fundamental activities required to run the business. These activities are relevant to all categories and sizes of business, regardless of geographic region or vertical industry. Activities in this category often focus around hiring and managing employees, managing daily operations and finances, servicing customers, and delivering goods and services to customers.” IDC, “IDC's Worldwide Services Taxonomy, 2017,” March 2017. 135 Public cloud refers to a cloud network that gives both firms and the general public access to a provider’s computing infrastructure through the internet. In contrast, a private cloud refers to cloud servers owned or operated by a single firm. Estimates of the size of the cloud services market tend to include only spending on public cloud services. USITC, Global Digital Trade I, August 2017, 64.
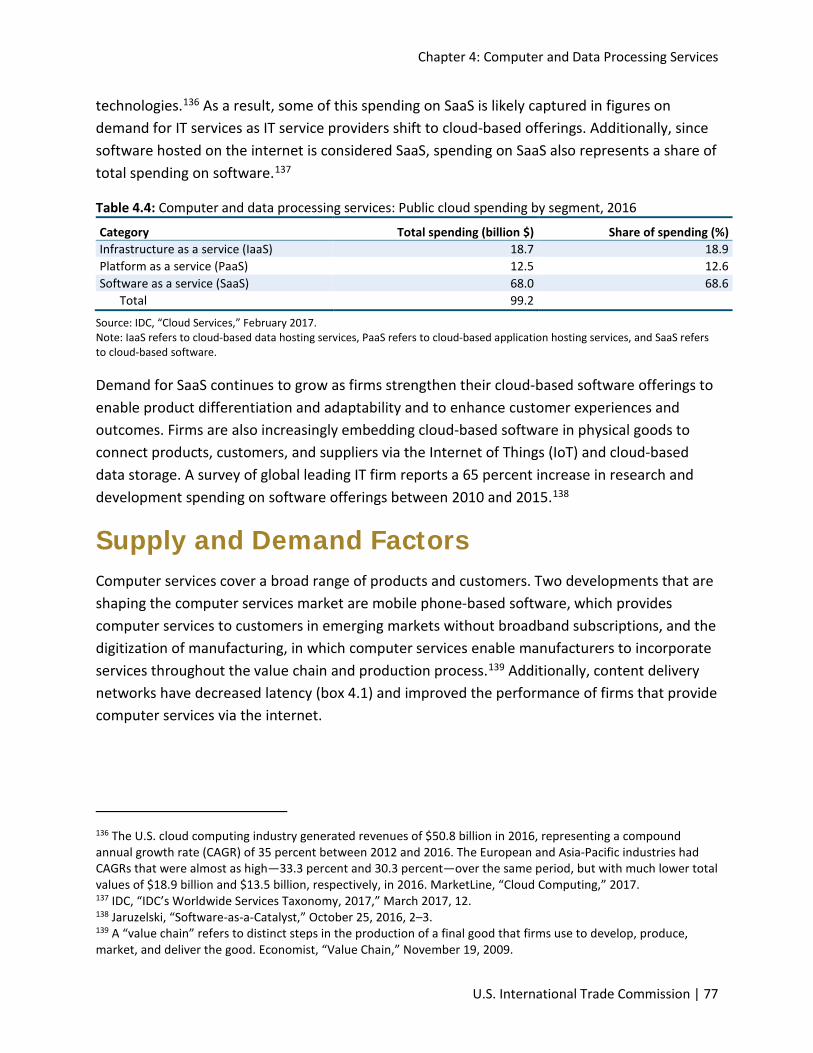
Chapter 4: Computer and Data Processing Services
U.S. International Trade Commission | 77
technologies.136 As a result, some of this spending on SaaS is likely captured in figures on demand for IT services as IT service providers shift to cloud-based offerings. Additionally, since software hosted on the internet is considered SaaS, spending on SaaS also represents a share of total spending on software.137
Table 4.4: Computer and data processing services: Public cloud spending by segment, 2016
Category Total spending (billion $) Share of spending (%) Infrastructure as a service (IaaS) 18.7 18.9 Platform as a service (PaaS) 12.5 12.6 Software as a service (SaaS) 68.0 68.6
Total 99.2
Source: IDC, “Cloud Services,” February 2017. Note: IaaS refers to cloud-based data hosting services, PaaS refers to cloud-based application hosting services, and SaaS refers to cloud-based software.
Demand for SaaS continues to grow as firms strengthen their cloud-based software offerings to enable product differentiation and adaptability and to enhance customer experiences and outcomes. Firms are also increasingly embedding cloud-based software in physical goods to connect products, customers, and suppliers via the Internet of Things (IoT) and cloud-based data storage. A survey of global leading IT firm reports a 65 percent increase in research and development spending on software offerings between 2010 and 2015.138
Supply and Demand Factors Computer services cover a broad range of products and customers. Two developments that are shaping the computer services market are mobile phone-based software, which provides computer services to customers in emerging markets without broadband subscriptions, and the digitization of manufacturing, in which computer services enable manufacturers to incorporate services throughout the value chain and production process.139 Additionally, content delivery networks have decreased latency (box 4.1) and improved the performance of firms that provide computer services via the internet.
136 The U.S. cloud computing industry generated revenues of $50.8 billion in 2016, representing a compound annual growth rate (CAGR) of 35 percent between 2012 and 2016. The European and Asia-Pacific industries had CAGRs that were almost as high—33.3 percent and 30.3 percent—over the same period, but with much lower total values of $18.9 billion and $13.5 billion, respectively, in 2016. MarketLine, “Cloud Computing,” 2017. 137 IDC, “IDC’s Worldwide Services Taxonomy, 2017,” March 2017, 12. 138 Jaruzelski, “Software-as-a-Catalyst,” October 25, 2016, 2–3. 139 A “value chain” refers to distinct steps in the production of a final good that firms use to develop, produce, market, and deliver the good. Economist, “Value Chain,” November 19, 2009.
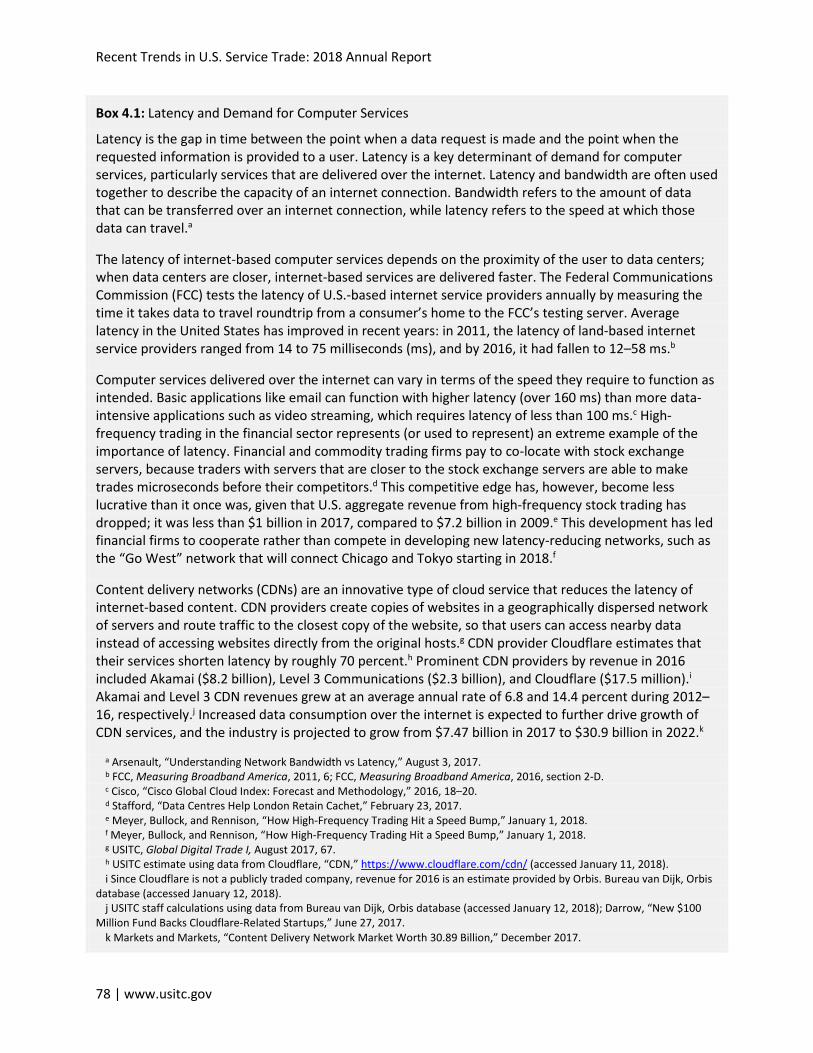
Recent Trends in U.S. Service Trade: 2018 Annual Report
78 | www.usitc.gov
Box 4.1: Latency and Demand for Computer Services
Latency is the gap in time between the point when a data request is made and the point when the requested information is provided to a user. Latency is a key determinant of demand for computer services, particularly services that are delivered over the internet. Latency and bandwidth are often used together to describe the capacity of an internet connection. Bandwidth refers to the amount of data that can be transferred over an internet connection, while latency refers to the speed at which those data can travel.a
The latency of internet-based computer services depends on the proximity of the user to data centers; when data centers are closer, internet-based services are delivered faster. The Federal Communications Commission (FCC) tests the latency of U.S.-based internet service providers annually by measuring the time it takes data to travel roundtrip from a consumer’s home to the FCC’s testing server. Average latency in the United States has improved in recent years: in 2011, the latency of land-based internet service providers ranged from 14 to 75 milliseconds (ms), and by 2016, it had fallen to 12–58 ms.b
Computer services delivered over the internet can vary in terms of the speed they require to function as intended. Basic applications like email can function with higher latency (over 160 ms) than more data-intensive applications such as video streaming, which requires latency of less than 100 ms.c High-frequency trading in the financial sector represents (or used to represent) an extreme example of the importance of latency. Financial and commodity trading firms pay to co-locate with stock exchange servers, because traders with servers that are closer to the stock exchange servers are able to make trades microseconds before their competitors.d This competitive edge has, however, become less lucrative than it once was, given that U.S. aggregate revenue from high-frequency stock trading has dropped; it was less than $1 billion in 2017, compared to $7.2 billion in 2009.e This development has led financial firms to cooperate rather than compete in developing new latency-reducing networks, such as the “Go West” network that will connect Chicago and Tokyo starting in 2018.f
Content delivery networks (CDNs) are an innovative type of cloud service that reduces the latency of internet-based content. CDN providers create copies of websites in a geographically dispersed network of servers and route traffic to the closest copy of the website, so that users can access nearby data instead of accessing websites directly from the original hosts.g CDN provider Cloudflare estimates that their services shorten latency by roughly 70 percent.h Prominent CDN providers by revenue in 2016 included Akamai ($8.2 billion), Level 3 Communications ($2.3 billion), and Cloudflare ($17.5 million).i
Akamai and Level 3 CDN revenues grew at an average annual rate of 6.8 and 14.4 percent during 2012–16, respectively.j Increased data consumption over the internet is expected to further drive growth of CDN services, and the industry is projected to grow from $7.47 billion in 2017 to $30.9 billion in 2022.k
a Arsenault, “Understanding Network Bandwidth vs Latency,” August 3, 2017. b FCC, Measuring Broadband America, 2011, 6; FCC, Measuring Broadband America, 2016, section 2-D. c Cisco, “Cisco Global Cloud Index: Forecast and Methodology,” 2016, 18–20. d Stafford, “Data Centres Help London Retain Cachet,” February 23, 2017. e Meyer, Bullock, and Rennison, “How High-Frequency Trading Hit a Speed Bump,” January 1, 2018. f Meyer, Bullock, and Rennison, “How High-Frequency Trading Hit a Speed Bump,” January 1, 2018. g USITC, Global Digital Trade I, August 2017, 67. h USITC estimate using data from Cloudflare, “CDN,” https://www.cloudflare.com/cdn/ (accessed January 11, 2018). i Since Cloudflare is not a publicly traded company, revenue for 2016 is an estimate provided by Orbis. Bureau van Dijk, Orbis
database (accessed January 12, 2018). j USITC staff calculations using data from Bureau van Dijk, Orbis database (accessed January 12, 2018); Darrow, “New $100
Million Fund Backs Cloudflare-Related Startups,” June 27, 2017. k Markets and Markets, “Content Delivery Network Market Worth 30.89 Billion,” December 2017.

Chapter 4: Computer and Data Processing Services
U.S. International Trade Commission | 79
Software Services and “Leapfrogging” in Emerging Markets Telecommunications infrastructure has enabled consumers in emerging markets to access the internet via mobile phones without ever having used computers or fixed broadband subscriptions, a trend referred to as technology “leapfrogging.”140 The shift from physical software to software delivered over the internet (i.e., cloud-based software) has facilitated this transition, as consumers can access software (such as crop monitoring applications) without purchasing physical infrastructure other than mobile phones.141 This shift to internet-based software has also made leapfrogging possible in other sectors. In the financial sector, consumers in emerging markets have bypassed traditional cashless payment systems, such as credit cards, in favor of mobile payment applications.
Figure 4.1 illustrates the growth in cellular phone subscriptions in low- and middle-income countries.142 In both groups, the number of cellphone subscriptions per 100 people has increased by about 40 percentage points since 2008; in middle-income countries, penetration has actually exceeded 100 percent.
140 Economist, “The Limits of Leapfrogging,” February 7, 2008. For more information on telecommunications services, see chapter 5. 141 This chapter includes a discussion of smartphones because they are essentially handheld computers; like desktop and laptop computers, they contain a central processing unit (CPU), memory, and display functionality, and use an operating system that provides computer services via cloud-hosted program applications (apps). 142 Low-income countries were defined as having a gross national income (GNI) per capita of less than $1,025 in 2015. Middle-income countries were defined as having a GNI per capita of $1,026–12,475 in 2015. World Bank, World Development Indicators (accessed January 12, 2018).
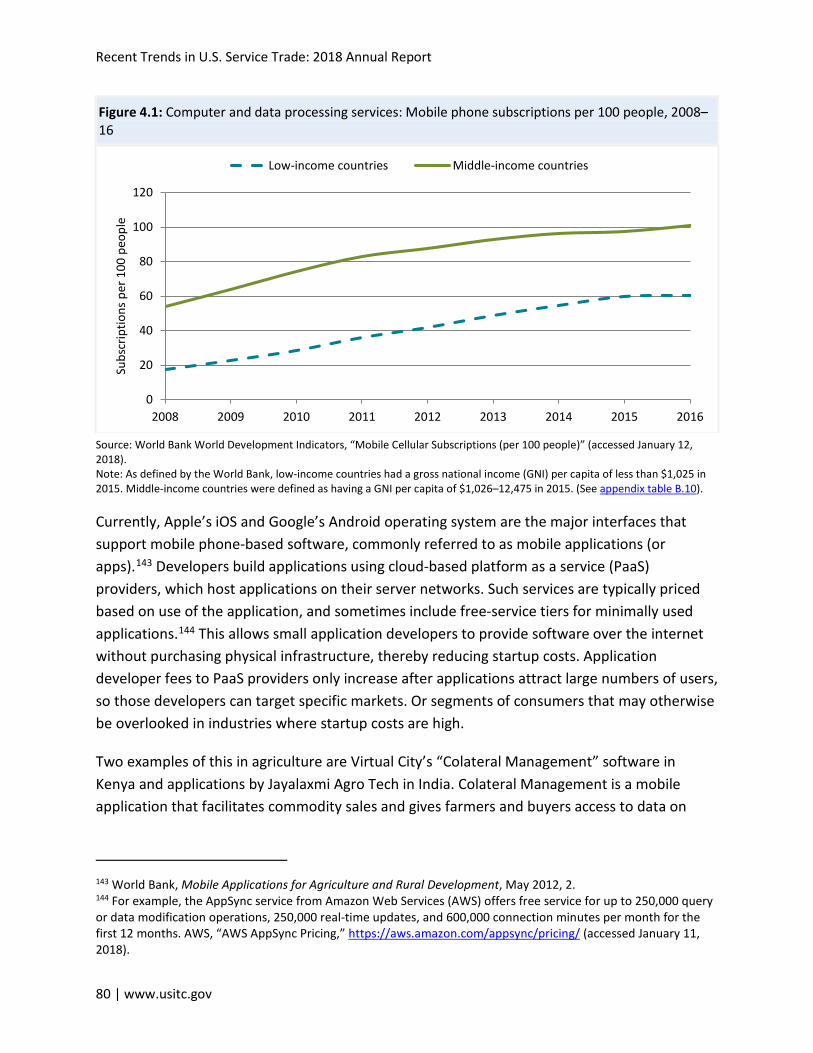
Recent Trends in U.S. Service Trade: 2018 Annual Report
80 | www.usitc.gov
Figure 4.1: Computer and data processing services: Mobile phone subscriptions per 100 people, 2008–16
Source: World Bank World Development Indicators, “Mobile Cellular Subscriptions (per 100 people)” (accessed January 12, 2018). Note: As defined by the World Bank, low-income countries had a gross national income (GNI) per capita of less than $1,025 in 2015. Middle-income countries were defined as having a GNI per capita of $1,026–12,475 in 2015. (See appendix table B.10).
Currently, Apple’s iOS and Google’s Android operating system are the major interfaces that support mobile phone-based software, commonly referred to as mobile applications (or apps).143 Developers build applications using cloud-based platform as a service (PaaS) providers, which host applications on their server networks. Such services are typically priced based on use of the application, and sometimes include free-service tiers for minimally used applications.144 This allows small application developers to provide software over the internet without purchasing physical infrastructure, thereby reducing startup costs. Application developer fees to PaaS providers only increase after applications attract large numbers of users, so those developers can target specific markets. Or segments of consumers that may otherwise be overlooked in industries where startup costs are high.
Two examples of this in agriculture are Virtual City’s “Colateral Management” software in Kenya and applications by Jayalaxmi Agro Tech in India. Colateral Management is a mobile application that facilitates commodity sales and gives farmers and buyers access to data on
143 World Bank, Mobile Applications for Agriculture and Rural Development, May 2012, 2. 144 For example, the AppSync service from Amazon Web Services (AWS) offers free service for up to 250,000 query or data modification operations, 250,000 real-time updates, and 600,000 connection minutes per month for the first 12 months. AWS, “AWS AppSync Pricing,” https://aws.amazon.com/appsync/pricing/ (accessed January 11, 2018).
0
20
40
60
80
100
120
2008 2009 2010 2011 2012 2013 2014 2015 2016
Subs
crip
tions
per
100
peo
ple
Low-income countries Middle-income countries

Chapter 4: Computer and Data Processing Services
U.S. International Trade Commission | 81
production and prices, thereby increasing market transparency.145 The World Bank estimates that use of Virtual City’s software cut farmers’ average transaction time at the Kenya Tea Production Authority from 3 minutes to 22 seconds, generating an additional $300 in income per year for the average tea farmer.146 In India, Jayalaxmi Agro Tech makes a number of applications providing market information on specific crops. Their audiovisual instructions and picture-based interface make the apps usable by illiterate farmers.147 By targeting small farmers, Jayalaxmi's products can increase the efficiency of farming and crop sales in places where mobile phones are used instead of traditional computer infrastructure.
The ubiquity of mobile phone subscriptions in emerging markets, along with the well-developed mobile application infrastructure in many places, also lets consumers bypass credit cards in favor of mobile phone-based payment applications. According to previous USITC research, 79 percent of sub-Saharan African countries have at least one mobile phone-based payment service provider, and there are roughly 200 million registered mobile payment accounts in the region.148 In China, Alibaba’s mobile payment application Alipay alone has 520 million users.149
Figure 4.2 illustrates this leapfrogging by comparing both the share of the adult population that has a credit card and the share of the adult population that uses mobile payment systems to GDP per capita, using a sample of 84 developing countries in 2014. In the case of credit cards (upper graph), there is a strong correlation between countries with higher GDP per capita and their share of credit card users.150 In contrast, in 2014 the share of the population that had a mobile payment account was not correlated with GDP per capita (lower graph).151 This suggests that people in countries with lower average incomes are able to access cashless payment systems sooner using mobile applications than through the traditional banking sector.
145 Virtual City, “Colateral Management,” http://www.virtualcity.co.ke/solutions/colateral-management/ (accessed January 12, 2018). 146 World Bank, Mobile Applications for Agriculture and Rural Development, May 2012, 16. 147 Jayalaxmi Agro Tech, “Our Products,” http://www.jayalaxmiagrotech.com/ (accessed January 12, 2018). 148 Powell, Sub-Saharan African Services Economy, July 2017, 67. 149 Alipay, https://intl.alipay.com/ (accessed November 30, 2017). 150 The correlation between credit card usage and GDP per capita is significant at the 99 percent level. 151 USITC calculations using data from World Bank, World Development Indicators (accessed November 15, 2017); World Bank, Global Financial Inclusion database (accessed November 15, 2017).
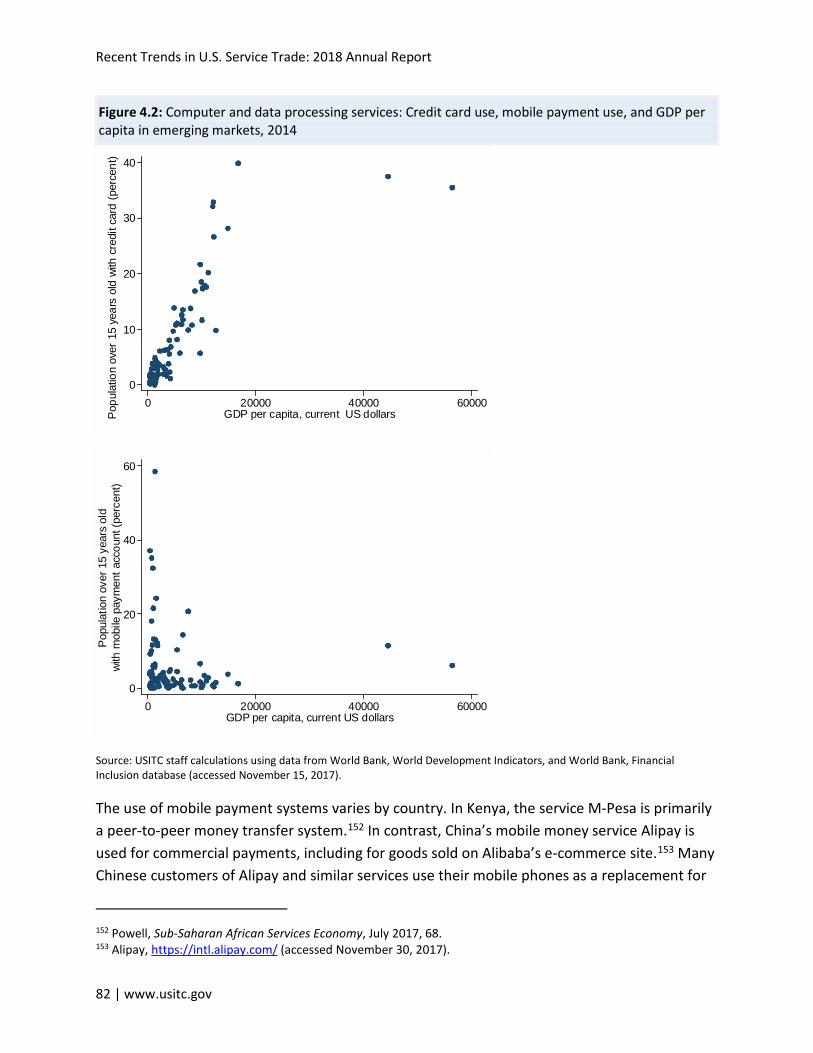
Recent Trends in U.S. Service Trade: 2018 Annual Report
82 | www.usitc.gov
Figure 4.2: Computer and data processing services: Credit card use, mobile payment use, and GDP per capita in emerging markets, 2014
Source: USITC staff calculations using data from World Bank, World Development Indicators, and World Bank, Financial Inclusion database (accessed November 15, 2017).
The use of mobile payment systems varies by country. In Kenya, the service M-Pesa is primarily a peer-to-peer money transfer system.152 In contrast, China’s mobile money service Alipay is used for commercial payments, including for goods sold on Alibaba’s e-commerce site.153 Many Chinese customers of Alipay and similar services use their mobile phones as a replacement for
152 Powell, Sub-Saharan African Services Economy, July 2017, 68. 153 Alipay, https://intl.alipay.com/ (accessed November 30, 2017).
0
10
20
30
40
Popu
latio
n ov
er 1
5 ye
ars
old
with
cre
dit c
ard
(per
cent
)
0 20000 40000 60000GDP per capita, current US dollars
0
20
40
60
Popu
latio
n ov
er 1
5 ye
ars
old
0 20000 40000 60000GDP per capita, current US dollars
with
mob
ile p
aym
ent a
ccou
nt (p
erce
nt)

Chapter 4: Computer and Data Processing Services
U.S. International Trade Commission | 83
cash or credit cards.154 These mobile payment systems connect consumers who do not have easy access to traditional computer hardware or brick-and-mortar banks to the formal financial sector, and give computer services firms access to new consumers.
The Digitization of Manufacturing Computer and data processing services are increasingly necessary for, and complementary to, manufacturing and other industry processes. Computer and data processing technologies such as big data analytics, cloud computing, and the Internet of Things (IoT) have been incorporated into and facilitated global value chains, improved production efficiency, reduced costs, and increased innovation. They have also yielded additive (3-D) manufacturing and artificial intelligence, which are further driving up manufacturing productivity.155 For example, Joy Global, a manufacturer of mining machinery, began using IBM’s advanced predictive analytics software and optimization solutions in 2014 to improve machine performance, minimize downtime, and reduce operating costs.156 Ford Motor Company reports that one of the reasons it is investing more than $200 million in a new data center in Flat Rock, Michigan, is to address the data deluge it anticipates with the growth of connected autonomous vehicles.157
Manufacturers are increasingly bundling computer and data processing services with traditional consumer goods and with industrial goods. Smartphones, for example, not only transmit voices between two distant parties, but let users create, view, and distribute photos and videos; tap real-time translation services; track fitness; and access Global Positioning System (GPS) satellite navigation from nearly anywhere on earth.158 Manufacturers in heavy industry are also bundling digital services. GE Aviation, an operating unit of General Electric Company, bundles sensors and software in commercial and military jet engines in partnership with Tableau Software. The software analyzes sensor-captured data ranging from engine diagnostics and maintenance requirements to flight patterns and fuel usage. Airlines use Tableau’s visual analytics platform to further analyze data from a variety of industry sources, as well as GE
154 Industry representative, interview by USITC staff, March 28, 2017. 155 For example, General Electric changed its business model from being a product and component supplier to being a power and propulsion provider, which leases equipment on a “power by the hour” basis. Industry representative, interview by USITC staff, January 4, 2018. 156 Lee, “Does Implementation of Big Data Analytics Improve?” 2017, 9. In April 2017, Komatsu America Corp., a subsidiary of Komatsu Ltd., acquired Joy Global, Inc., and renamed it Komatsu Mining Corp. 157 Donoghue, “Supercomputers in the Cloud,” October 26, 2017. 158 Apple’s iPod is a well-known example of a manufactured good for which the majority of the value added comes from services produced in the United States.

Recent Trends in U.S. Service Trade: 2018 Annual Report
84 | www.usitc.gov
Aviation’s fleet of 35,000 engines—which produces more than 100 million flight records each year—in order to increase safety and efficiency. 159
As computer and data processing services have become more integrated with manufacturing, the boundaries between services and manufacturing have blurred.160 For example, search engines and cloud computing are energy-intensive activities which, like factories, require high levels of fixed assets, such as server farms and cooling systems.161 In 2015, Amazon, Microsoft, and Alphabet (Google) together had nearly $26 billion in capital expenditures.162 The workforce composition of manufacturing firms and services firms is also becoming increasingly similar, with growing proportions of full time service workers in manufacturing firms. From 2002 to 2012, services occupations in two fields—apparel, leather, and associated products, and computer and electronic products—increased 8.4 percent and 7.7 percent, respectively.163 In 2016, for example, Google hired approximately 2,000 phone engineers from Taiwan-based HTC to create Pixel smartphones, speakers, headphones, cameras, and high-end laptops.164
The digitization of manufacturing and the bundling of services with products have strengthened demand for computer and data processing services. Increasingly sophisticated information and communication technologies, such as big data, cloud computing, and the IoT, have become integral to the development, production, and after-sale use of goods.165 Indeed, the boundaries between the manufacturing and services sectors have blurred and the processes of both have fragmented.166 Cyber-physical systems which can constantly communicate with each other, the goods they produce, and the people who operate them, are likely to drive further demand for computer and data processing services.
159 GE Press Center, “GE Aviation and Tableau Partner,” November 8, 2017. 160 IBM adapted its products to users’ needs and, although it produces IT infrastructure, it is now predominantly a service supplier. Lanz and Maurer, “Services and Global Value Chains,” March 2, 2015, 13. 161 Computer and data processing services firms have always used some physical inputs, but the proportion is rapidly growing; Bernard and Teresa, “Factoryless Goods Producers in the U.S.,” May 10, 2016. 162 The entire sum did not go to data center build-out, but all three companies have described the cloud as a major area of current and future investment. Gallagher, “Why Cloud Scale Is Worth the Price,” March 15, 2016. 163 USDOL, BLS, Occupational Employment Statistics (accessed June 20, 2013); USITC calculations. 164 Bohn, “Google Hardware Is No Longer a Hobby,” October 4, 2017. 165 Computer and data processing services add value to manufacturing global value chains. 166 Both manufacturing and computer and data processing are increasingly fragmented, with frequent outsourcing and offshoring of discrete tasks through global value chains. In 1995, domestic services accounted for 23.1 percent of value added in manufactured exports, while foreign services accounted for 10.8 percent; by 2011, the share of domestic services had dropped to 20.5 percent, while that of foreign services had risen to 14.5 percent. Bamber et al., Global Value Chains and Economic Development, September 2017, 30.
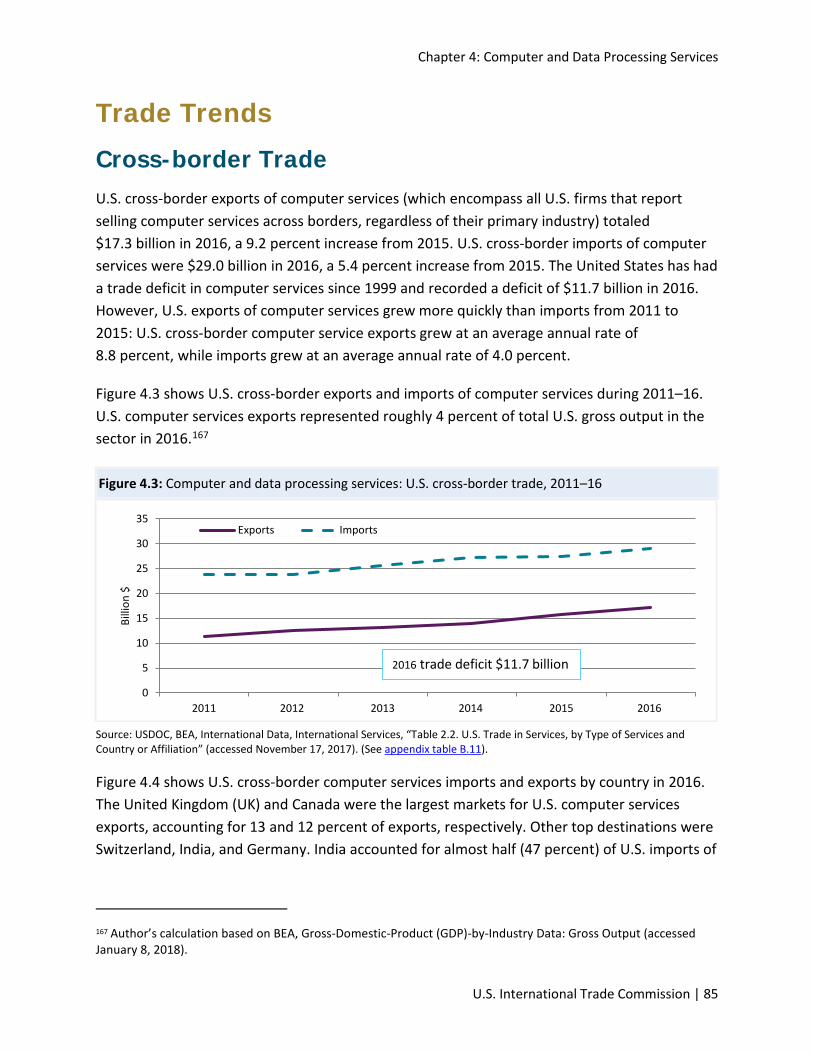
Chapter 4: Computer and Data Processing Services
U.S. International Trade Commission | 85
Trade Trends Cross-border Trade U.S. cross-border exports of computer services (which encompass all U.S. firms that report selling computer services across borders, regardless of their primary industry) totaled $17.3 billion in 2016, a 9.2 percent increase from 2015. U.S. cross-border imports of computer services were $29.0 billion in 2016, a 5.4 percent increase from 2015. The United States has had a trade deficit in computer services since 1999 and recorded a deficit of $11.7 billion in 2016. However, U.S. exports of computer services grew more quickly than imports from 2011 to 2015: U.S. cross-border computer service exports grew at an average annual rate of 8.8 percent, while imports grew at an average annual rate of 4.0 percent.
Figure 4.3 shows U.S. cross-border exports and imports of computer services during 2011–16. U.S. computer services exports represented roughly 4 percent of total U.S. gross output in the sector in 2016.167
Figure 4.3: Computer and data processing services: U.S. cross-border trade, 2011–16
Source: USDOC, BEA, International Data, International Services, “Table 2.2. U.S. Trade in Services, by Type of Services and Country or Affiliation” (accessed November 17, 2017). (See appendix table B.11).
Figure 4.4 shows U.S. cross-border computer services imports and exports by country in 2016. The United Kingdom (UK) and Canada were the largest markets for U.S. computer services exports, accounting for 13 and 12 percent of exports, respectively. Other top destinations were Switzerland, India, and Germany. India accounted for almost half (47 percent) of U.S. imports of
167 Author’s calculation based on BEA, Gross-Domestic-Product (GDP)-by-Industry Data: Gross Output (accessed January 8, 2018).
0
5
10
15
20
25
30
35
2011 2012 201
2016 trade deficit $11.7 billion
3 2014 2015 2016
Billi
on $
Exports Imports

Recent Trends in U.S. Service Trade: 2018 Annual Report
86 | www.usitc.gov
computer services in 2016, followed by Canada (11 percent), Ireland (9 percent), and the UK (5 percent).
Figure 4.4: Computer and data processing services: Cross-border trade by country, 2016
Source: USDOC, BEA, International Data, International Services, “Table 2.2. U.S. Trade in Services, by Type of Services and Country or Affiliation” (accessed November 17, 2017). (See appendix table B.12).
United Kingdom13%
Canada12%
Switzerland9%
India5%
Germany5%
Other Europe17%
Other Asia-Pacific20%
Other Western Hemisphere
14%
Africa and the Middle East
5%
U.S. exportsTotal = $17.3 billion
India47%
Canada11%
Ireland9%
United Kingdom5%
Germany3%
Other Europe8%
Other Asia-Pacific9%
Western Hemisphere5%
Africa and the Middle East
3%
Chart TitleU.S. importsTotal = $29.0 billion
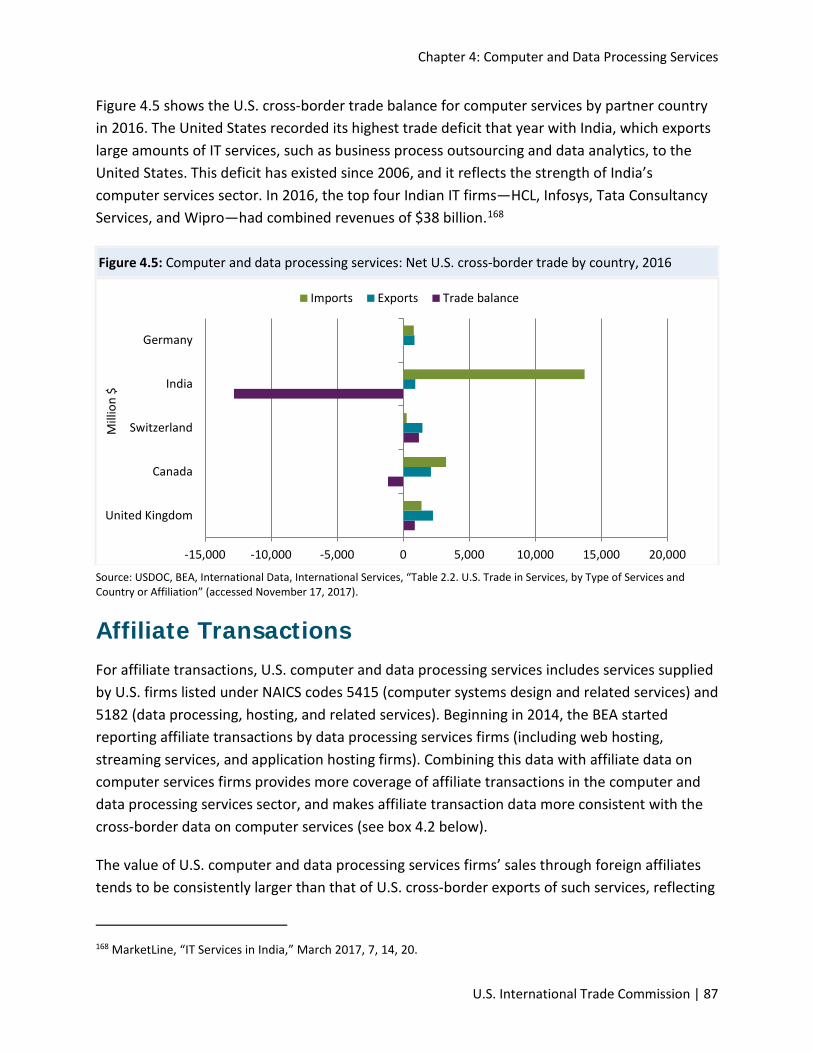
Chapter 4: Computer and Data Processing Services
U.S. International Trade Commission | 87
Figure 4.5 shows the U.S. cross-border trade balance for computer services by partner country in 2016. The United States recorded its highest trade deficit that year with India, which exports large amounts of IT services, such as business process outsourcing and data analytics, to the United States. This deficit has existed since 2006, and it reflects the strength of India’s computer services sector. In 2016, the top four Indian IT firms—HCL, Infosys, Tata Consultancy Services, and Wipro—had combined revenues of $38 billion.168
Figure 4.5: Computer and data processing services: Net U.S. cross-border trade by country, 2016
Source: USDOC, BEA, International Data, International Services, “Table 2.2. U.S. Trade in Services, by Type of Services and Country or Affiliation” (accessed November 17, 2017).
Affiliate Transactions For affiliate transactions, U.S. computer and data processing services includes services supplied by U.S. firms listed under NAICS codes 5415 (computer systems design and related services) and 5182 (data processing, hosting, and related services). Beginning in 2014, the BEA started reporting affiliate transactions by data processing services firms (including web hosting, streaming services, and application hosting firms). Combining this data with affiliate data on computer services firms provides more coverage of affiliate transactions in the computer and data processing services sector, and makes affiliate transaction data more consistent with the cross-border data on computer services (see box 4.2 below).
The value of U.S. computer and data processing services firms’ sales through foreign affiliates tends to be consistently larger than that of U.S. cross-border exports of such services, reflecting
168 MarketLine, “IT Services in India,” March 2017, 7, 14, 20.
-15,000 -10,000 -5,000 0 5,000 10,000 15,000 20,000
United Kingdom
Canada
Switzerland
India
Germany
Mill
ion
$
Imports Exports Trade balance
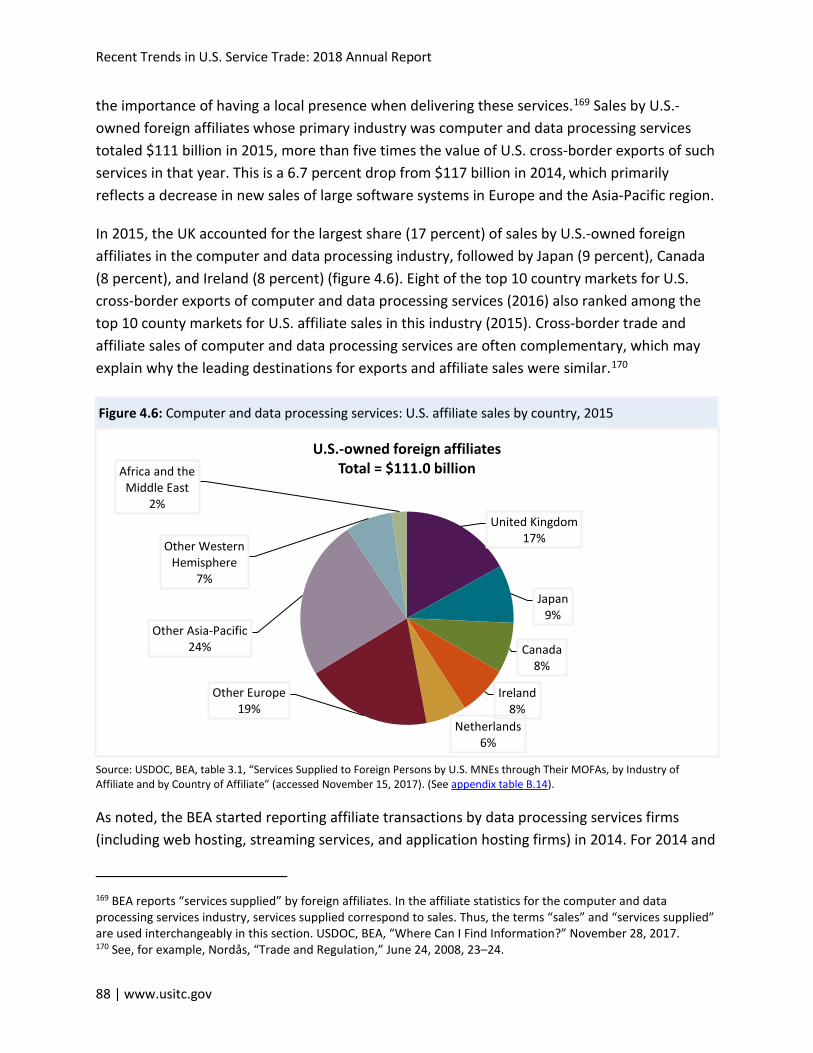
Recent Trends in U.S. Service Trade: 2018 Annual Report
88 | www.usitc.gov
the importance of having a local presence when delivering these services.169 Sales by U.S.-owned foreign affiliates whose primary industry was computer and data processing services totaled $111 billion in 2015, more than five times the value of U.S. cross-border exports of such services in that year. This is a 6.7 percent drop from $117 billion in 2014, which primarily reflects a decrease in new sales of large software systems in Europe and the Asia-Pacific region.
In 2015, the UK accounted for the largest share (17 percent) of sales by U.S.-owned foreign affiliates in the computer and data processing industry, followed by Japan (9 percent), Canada (8 percent), and Ireland (8 percent) (figure 4.6). Eight of the top 10 country markets for U.S. cross-border exports of computer and data processing services (2016) also ranked among the top 10 county markets for U.S. affiliate sales in this industry (2015). Cross-border trade and affiliate sales of computer and data processing services are often complementary, which may explain why the leading destinations for exports and affiliate sales were similar.170
Figure 4.6: Computer and data processing services: U.S. affiliate sales by country, 2015
Source: USDOC, BEA, table 3.1, “Services Supplied to Foreign Persons by U.S. MNEs through Their MOFAs, by Industry of Affiliate and by Country of Affiliate” (accessed November 15, 2017). (See appendix table B.14).
As noted, the BEA started reporting affiliate transactions by data processing services firms (including web hosting, streaming services, and application hosting firms) in 2014. For 2014 and
169 BEA reports “services supplied” by foreign affiliates. In the affiliate statistics for the computer and data processing services industry, services supplied correspond to sales. Thus, the terms “sales” and “services supplied” are used interchangeably in this section. USDOC, BEA, “Where Can I Find Information?” November 28, 2017. 170 See, for example, Nordås, “Trade and Regulation,” June 24, 2008, 23–24.
United Kingdom17%
Japan9%
Canada8%
Ireland8%
Netherlands6%
Other Europe19%
Other Asia-Pacific24%
Other Western Hemisphere
7%
Africa and the Middle East
2%
U.S.-owned foreign affiliatesTotal = $111.0 billion

Chapter 4: Computer and Data Processing Services
U.S. International Trade Commission | 89
2015, figure 4.7 shows foreign affiliate transactions by data processing services firms as darker-colored sections of the bars representing affiliate sales and purchases (box 4.2).
Purchases from foreign-owned U.S. affiliates in the computer and data processing services industry totaled $29.4 billion in 2015, roughly the same level as in 2014 (figure 4.7). Top sources for purchases from foreign-owned U.S. affiliates in 2015 were the UK ($2.6 billion), Canada ($1.6 billion), and Japan ($1.3 billion).171
Figure 4.7: Computer and data processing services: U.S. affiliate sales and purchases, 2011–15
Source: USDOC, BEA, table 3.1, “Services Supplied to Foreign Persons by U.S. MNEs through Their MOFAs, by Industry of Affiliate and by Country of Affiliate,” and table 4.1, “Services Supplied to U.S. Persons by Foreign MNEs through Their MOUSA, by Industry of Affiliate and by Country of UBO” (accessed November 15, 2017). Note: Data processing services firms are shown as darker-colored sections of the bars. (See appendix table B.15).
Box 4.2: Understanding Data on Cross-border Trade and Affiliate Transactions in Computer Services
The Bureau of Economic Analysis (BEA) at the U.S. Department of Commerce (USDOC) measures both cross-border trade and foreign affiliate transactions for computer services. The BEA collects data through two surveys that differ in their methodologies. First, the BEA’s cross-border surveys ask companies to report sales by type of activity. Computer services activities include electronically delivered software, hardware and software installation, computer maintenance, data processing and hosting services, and webpage development and hosting. As noted, they do not include physical shipments of packaged computer software. The analysis presented in this chapter excludes cross-border
171 USDOC, BEA, table 4.1, “Services Supplied to U.S. Persons by Foreign MNEs through Their MOUSA, by Industry of Affiliate and by Country of UBO” (accessed November 15, 2017).
0
20
40
60
80
100
120
140
2011 2012 2013 2014 2015
Billi
on $
U.S.-owned foreign affiliates-computer systems U.S.-owned foreign affiliates-data processing
Foreign-owned U.S. affiliates-computer systems Foreign-owned U.S. affiliates-data processing

Recent Trends in U.S. Service Trade: 2018 Annual Report
90 | www.usitc.gov
trade in the intellectual property associated with these services, which the BEA considers separately, as a subset of the “intellectual property not included elsewhere” category.a
The BEA categorizes data on affiliate transactions according to the industry classification of the parent or affiliate under the North American Industry Classification System (NAICS), rather than the type of service provided. Since this measure focuses on the industry of the firm, rather than the types of services provided, figures for foreign affiliate sales are not necessarily comparable with those for cross-border trade. For computer and data processing services, foreign affiliate transactions data include two NAICS codes: 5415 (computer systems design and related services) and 5182 (data processing, hosting, and related services). Computer systems design includes developing customized software, designing and maintaining computer systems, and providing technical and professional computer-related advice. Data processing includes providing infrastructure for hosting or data processing (such as web hosting, streaming services, or application hosting), and data processing services.b This chapter does not include software licensing as part of the “affiliate transactions” computer services aggregate.
Previous Recent Trends reports have covered only affiliate trade in computer systems design. However, in 2014, the BEA started reporting statistics for affiliate transactions by data processing services firms.c Since cross-border trade in computer services includes data processing services, this addition makes the two types of data more comparable.
a USDOC, BEA, Quarterly Survey of Transactions in Selected Services and Intellectual Property with Foreign Persons, Form BE- 125, September 2016, 3, 19–20.
b A third NAICS code, 5191 (other information services), includes computer services such as web searches, but also includes non-computer services such as libraries, and as a result is not included in the computer services aggregate. USDOC, BEA, Guide to Industry Classifications for International Surveys, 2012, 39, 43.
c When the BEA conducted its benchmark survey for affiliate transaction data in 2014, it increased the number of firms responding to the survey. This change partially contributed to an apparent 24 percent rise in total U.S. services supplied through foreign affiliates. For more information, see USDOC, BEA, “U.S. International Services: Trade in Services in 2015 and Services Supplied through Affiliates in 2014,” December 2016, 24; BEA representative, email message to USITC staff, November 29, 2016, and telephone interview by USITC staff, December 2, 2016. However, this aggregate is still incomplete, as companies like Google fall under NAICS code 5191 (other information services) rather than 5415 or 5182. See previous note.
Outlook Demand for computer and data processing services is expected to continue to grow in the coming years. One source forecasts an annual growth rate in worldwide computer services spending from 2016 to 2020 of approximately 3.8 percent.172 Another predicts that the size of the public cloud services market will grow by 19 percent annually from 2015 to 2020, due to increasing interest from business consumers, a sharp rise in supply, more offerings, and lower prices.173
Data protection and data localization measures, such as the European Union’s General Data Protection Regulation and China’s Cybersecurity Law, may affect growth in the global computer services sector if they raise the costs of complying with different standards in different
172 IDC, “Worldwide Services Spending Snapshot, 2017,” March 2017. 173 Gartner, Inc., “Worldwide Public Cloud Services Revenue Forecast,” January 25, 2016.

Chapter 4: Computer and Data Processing Services
U.S. International Trade Commission | 91
markets.174 Firms may respond to the higher costs of doing business in these markets by reducing their offerings or by investing in other, less regulated markets. The 2017 Services Trade Restrictiveness Index (STRI) finds that 13 countries have become more restrictive in their computer services regulations since 2014, while 12 have become more liberal and 19 were unchanged.175 Several of the major U.S. export markets for computer services are becoming more open. For example, the UK (which is the largest U.S. export market) reduced its trade restrictiveness score by two basis points, from 0.22 to 0.20—more than any other leading market for U.S. exports of computer services. Canada, Switzerland, India, and Germany also reduced their restrictiveness, though to a lesser degree.176
174 USITC, Global Digital Trade I, August 2017, 277. 175 The STRI index uses values between zero and 1, 1 being the most restrictive; the 2017 computer services scores range between 0.10 and 0.46, with an average of 0.24. OECD, “STRI Sector Brief: Computer Services,” December 2017, 1. 176 Compiled by the Organisation for Economic Co-operation and Development (OECD), the STRI considers five policy areas that affect computer services—restrictions on foreign investing, restrictions on movement of people, barriers to cross-border trade, regulatory transparency, and other discriminatory measures—for the 35 OECD countries as well as Brazil, China, Colombia, Costa Rica, India, Indonesia, Lithuania, Russia, and South Africa. OECD, STRI Sector Brief, 2017.
Recent Trends in U.S. Service Trade: 2018 Annual Report
92 | www.usitc.gov
Bibliography Amazon. “Annual Report-2016,” April 12, 2017. http://phx.corporate-
ir.net/phoenix.zhtml?c=97664&p=irol-reportsannual.
Arsenault, Cody. “Understanding Network Bandwidth vs Latency.” KeyCDN Blog. Key CDN, August 3, 2017. https://www.keycdn.com/blog/network-bandwidth/.
Bamber, Penny, Lukas Brun, Stacey Frederick, and Gary Gereffi. Global Value Chains and Economic Development. Duke University Value Chains Center, September 2017. https://gvcc.duke.edu/wp-content/uploads/Duke_KIET_GVCs-Economic_Development)CH_1-2.pdf (fee required).
Bohn, Dieter. “Google Hardware Is No Longer a Hobby.” The Verge, October 4, 2017. https://www.theverge.com/2017/10/4/16405184/rick-osterloh-interview-new-google-hardware-vision-htc-deal.
Bresnahan, Timothy, and Manuel Trajtenberg. “General Purpose Technologies: ‘Engines of Growth’?” Journal of Econometrics 65, no. 1 (1995): 83–108. https://EconPapers.repec.org/RePEc:eee:econom:v:65:y:1995:i:1:p:83-108.
Bureau van Dijk. Orbis database. https://orbis4.bvdinfo.com (accessed January 12, 2018) (fee required).
Cisco. Cisco Global Cloud Index: Forecast and Methodology 2015–2020. White paper, 2016. http://www.cisco.com/c/dam/en/us/solutions/collateral/service-provider/global-cloud-index-gci/white-paper-c11-738085.pdf.
Darrow, Barb. “New $100 Million Fund Backs Cloudflare-Related Startups.” Fortune, June 27, 2017. http://fortune.com/2017/06/27/100-million-cloudflare-fund/.
Donoghue, Andrew. “Supercomputers in the Cloud Erode Another Case for Owning Datacenters.” Datacenter Knowledge, October 26, 2017. http://www.datacenterknowledge.com/supercomputers/supercomputers-cloud-erode-another-case-owning-data-centers.
Economist. “The Limits of Leapfrogging.” February 7, 2008. http://www.economist.com/node/10650775.
Economist. “Value Chain." November 19, 2009. https://www.economist.com/node/14301710.

Chapter 4: Computer and Data Processing Services
U.S. International Trade Commission | 93
Federal Communications Commission (FCC). Measuring Broadband America: A Report on Consumer Wireline Broadband Performance in the U.S., 2011. https://www.fcc.gov/reports-research/reports/measuring-broadband-america/measuring-broadband-america-august-2011#block-menu-block-4.
Federal Communications Commission (FCC). Measuring Broadband America: A Report on Consumer Wireline Broadband Performance in the U.S., 2016. https://www.fcc.gov/reports-research/reports/measuring-broadband-america/measuring-fixed-broadband-report-2016#_Toc458762531.
Fontagne, Lionel, and Ann Harrison. The Factory-Free Economy, May 10, 2016. https://faculty.wharton.upenn.edu/wp-content/uploads/2016/05/FFE_final_OUP.pdf.
Gallagher, Dan. “Why Cloud Scale Is Worth the Price for Amazon, Google and Microsoft.” Wall Street Journal, March 15, 2016. https://www.wsj.com/articles/why-cloud-scale-is-worth-the-price-for-amazon-google-and-microsoft-1458060378.
Gartner, Inc. “Gartner IT Glossary.” https://www.gartner.com/it-glossary (accessed February 28, 2018).
Gartner, Inc. “Worldwide Public Cloud Services Forecast,” January 25, 2016, https://www.gartner.com/newsroom/id/3188817.
GE Press Center. “GE Aviation and Tableau Partner,” November 8, 2017. https://www.geaviation.com/press-release/digital-solutions/ge-aviation-and-tableau-partner-better-serve-airline-industry-data.
Holley, Peter. “Big Brother on wheels: Why your car company may know more about you than your spouse.” Washington Post, January 15, 2018. https://www.washingtonpost.com/news/innovations/wp/2018/01/15/big-brother-on-wheels-why-your-car-company-may-know-more-about-you-than-your-spouse/?htm_term=.4eb2ff4acd00.
Huston, Chad. “Worldwide Services Forecast Update, 2017–2021.” International Data Corporation, November 2017 (fee required).
International Data Corporation (IDC). “IDC’s Worldwide Services Taxonomy, 2017,” March 2017 (fee required).
International Data Corporation (IDC). “IDC 2016 Version 4—Cloud Services.” In Worldwide Black Book, March 2017 (fee required).
Recent Trends in U.S. Service Trade: 2018 Annual Report
94 | www.usitc.gov
International Data Corporation (IDC). “Worldwide Services Spending Snapshot, 2017.” In Worldwide Services Forecast Update, March 2017 (fee required).
Jaruzelski, Barry, Voker Staack, and Aritomo Shinozaki. “Software-as-a-Catalyst.” Strategy and Business, October 25, 2016. https://www.strategy-business.com/feature/Software-as-a-Catalyst.
Lanz, Rainer, and Andreas Maurer. “Services and Global Value Chains: Some Evidence on Servicification of Manufacturing and Services Networks.” World Trade Organization working paper, March 2015. https://www.wto.org/english/res_e/reser_e/ersd201503_e.pdf.
Lee, Hansol, Eunkyung Kweon, Minkyun Kim, and Sangmi Chai. “Does Implementation of Big Data Analytics Improve Firms’ Market Value?” Sustainability 9, no. 6 (2017): 1–17. http://www.mdpi.com/2071-1050/9/6/978.
MarketLine. “Global Cloud Computing.” Industry profile, December 2016. https://store.marketline.com/report/ohme8236--global-cloud-computing/ (fee required).
MarketLine. “Global IT Services.” Industry Profile, March 2017. https://store.marketline.com/report/ohme9392--global-it-services/ (fee required).
MarketLine. “Global Software.” Industry Profile, June 2017. https://store.marketline.com/report/ohmf0181--global-software/ (fee required).
Markets and Markets. “Content Delivery Network Market Worth 30.89 Billion USD by 2022.” News release, December 2017. https://www.marketsandmarkets.com/PressReleases/cdn.asp.
Meyer, Gregory, Nicole Bullock, and Joe Rennison. “How High-Frequency Trading Hit a Speed Bump.” Financial Times, January 1, 2018. https://www.ft.com/content/d81f96ea-d43c-11e7-a303-9060cb1e5f44.
Nordås, Hildegunn Kyvik. Trade and Regulation: Computer Services and Other Business Services. Organisation for Economic Co-operation and Development, June 24, 2008. https://www.oecd.org/site/tadstri/40822843.pdf.
Organisation for Economic Co-operation and Development (OECD). “Computer Services.” STRI Sector Brief, 2017. http://www.oecd.org/tad/services-trade/STRI_computer_services.pdf.
Chapter 4: Computer and Data Processing Services
U.S. International Trade Commission | 95
Powell, Jennifer. Sub-Saharan African Services Economy: Insights and Trends. U.S. International Trade Commission. USITC Office of Industries Staff Study ID-046, July 2017. https://www.usitc.gov/sites/default/files/publications/332/sub-saharan_african_id-17-046_final_071217sae.pdf.
Stoller, Kristin. “The World’s Largest Tech Companies 2017.” Forbes, May 24, 2017.https://www.forbes.com/sites/kristinstoller/2017/05/24/the-worlds-largest-tech- companies-2017-apple-and-samsung-lead-facebook-rises/.
Stafford, Philip. “Data Centres Help London Retain Cachet.” Financial Times, February 23, 2017. https://www.ft.com/content/1486e886-f9af-11e6-bd4e-68d53499ed71.
Statista. “Fixed Broadband Revenue in Selected Countries from 2006 to 2015 (in Billion GBP),” 2016. https://www.statista.com/statistics/256393/fixed-broadband-revenue-by-country/ (fee required).”
U.S. Department of Commerce (USDOC). Bureau of Economic Analysis (BEA). Guide to Industry Classifications for International Surveys, 2012, 2012. https://www.bea.gov/naics2012/.
U.S. Department of Commerce (USDOC). Bureau of Economic Analysis (BEA). Interactive data. International Services tables 2.2 and 4.1. http://bea.gov/iTable/index_ita.cfm (accessed November 17, 2017).
U.S. Department of Commerce (USDOC). Bureau of Economic Analysis (BEA). “Gross Domestic Product (GDP) by Industry Data: Gross Output.” https://www.bea.gov/industry/gdpbyind_data.htm (accessed January 8, 2018).
U.S. Department of Commerce (USDOC). Bureau of Economic Analysis (BEA). Quarterly Survey of Transactions in Selected Services and Intellectual Property with Foreign Persons, Form BE-125 (September 2016). https://www.bea.gov/surveys/pdf/be125_web.pdf.
U.S. Department of Commerce (USDOC). Bureau of Economic Analysis (BEA). “U.S. International Services: Trade in Services in 2015 and Services Supplied through Affiliates in 2014.” Survey of Current Business, December 2016. https://www.bea.gov/scb/pdf/2016/12%20December/1216_international_services.pdf.
U.S. Department of Commerce (USDOC). National Institute of Standards and Technology (NIST). The NIST Definition of Cloud Computing: Recommendations of the National Institute of Standards and Technology, by Peter Mell and Timothy Grance, September 2011. http://dx.doi.org/10.6028/NIST.SP.800-145.
Recent Trends in U.S. Service Trade: 2018 Annual Report
96 | www.usitc.gov
U.S. International Trade Commission (USITC). Global Digital Trade I: Market Opportunities and Key Foreign Trade Restrictions. USITC Publication 4716, Washington, DC: USITC, August 2017. https://www.usitc.gov/sites/default/files/publications/332/pub4716_0.pdf.
World Bank. Global Financial Inclusion (Global Findex) database. http://databank.worldbank.org/data/reports.aspx?source=1228 (accessed November 15, 2017).
World Bank. “GDP per Capita, Current US Dollars.” World Development Indicators database. http://databank.worldbank.org/data/reports.aspx?source=world-development-indicators (accessed November 15, 2017).
World Bank. “Mobile Cellular Subscriptions (per 100 People).” World Development Indicators database. http://databank.worldbank.org/data/reports.aspx?source=world-development-indicators (accessed January 12, 2018).
World Bank. Mobile Applications for Agriculture and Rural Development, by Christine Zhenwei Qiang, Siou Chew Kuek, Andrew Dymond, and Steve Esselaar. World Bank ICT Sector Unit Staff Report, May 2012. http://siteresources.worldbank.org/INFORMATIONANDCOMMUNICATIONANDTECHNOLOGIES/Resources/Mobile_Applications_for_ARDv8.pdf.

U.S. International Trade Commission | 97
Chapter 5 Telecommunications Services Summary Telecommunications (telecom) services comprise the transmission of voice, data, text, sound, and video using wired and wireless telecommunications networks. Over the last five years, the global telecom market has expanded at an average annual rate of less than 2 percent. Globally, the United States is the largest telecom services market, with other large markets including China, Japan, Brazil, and the United Kingdom (UK). The top companies in the U.S. market are well-known telecom carriers and cable television companies, although a growing number of firms that provide over-the-top (OTT) software applications are competing successfully in the voice and messaging markets.
The core telecom services segments—fixed-line voice, mobile services, and internet services—have evolved into mature markets. In an effort to address flat or declining revenue growth, U.S. telecom carriers are bolstering network infrastructure, connecting a growing array of Internet of Things (IoT) devices, entering content and advertising markets, and refocusing business services on wide area networking services for data centers. With only a few exceptions, U.S. telecom carriers do not offer telecom services to consumers in foreign markets, preferring instead to focus on offering business services to large, multinational companies.
In 2016, U.S. cross-border exports of telecom services exceeded imports by a wide margin: exports totaled $12.2 billion, while imports totaled $5.5 billion. The leading export markets were Brazil, Argentina, and the UK, and the top sources of imports were the UK, Mexico, and India. Affiliate transactions remained the predominant mode of trade in telecom services, with the value of services supplied by U.S.-owned foreign affiliates estimated to be more than twice that of U.S. cross-border exports.
Introduction Telecom services encompass both basic and value-added services. Basic services involve the end-to-end transmission of voice or data information from senders to receivers. The most widely used basic services are traditional telephone calls (both landline and mobile), short message services (i.e., text messaging services), and internet access services. Other basic
Recent Trends in U.S. Service Trade: 2018 Annual Report
98 | www.usitc.gov
services include Voice-over-Internet Protocol (VoIP)177 services, fax services, and business services.178 Value-added telecom services, by contrast, typically complement or supplement basic services, with examples including voice mail, email, and data storage and processing services.179 Value-added services are increasingly important, as operators are moving into data storage and cloud computing services, internet advertising and content, and television services. Operators are also moving into “smart home” and IoT services, providing internet connectivity for a growing array of devices, and processing and analyzing the data they collect.
Market Conditions The global telecom services market, measured by spending on voice and data services (both fixed and mobile),180 was estimated to be $1.5 trillion in 2016. Overall, the global market grew by 1.8 percent during 2016, slightly faster than the 1.2 percent compound annual growth rate (CAGR) recorded during 2012–15. Slowing global revenue growth is attributed to contraction in both the fixed voice and wireless voice markets, which declined by 5 percent and 3 percent, respectively, in 2016. The fixed and wireless voice services segment is a mature market in many countries, and is subject to increasing competition from voice and text message applications (see “Trade Trends” later in this chapter). In 2016, the U.S. telecom services market was valued at roughly $338.0 billion, or 22.8 percent of the global market, making it the largest country market for such services. Other large markets included China ($228.5 billion; 15.4 percent), Japan ($95.2 billion; 6.4 percent), Brazil ($66.3 billion; 4.5 percent), and the UK ($48.3 billion; 3.3 percent).181
The top U.S. telecom carriers, measured by 2016 revenues, are AT&T and Verizon, both of which offer a full suite of fixed-line and mobile services (including voice, internet access, data, and pay-TV) (table 5.1). Other leading providers include CenturyLink and Frontier (which focus mainly on fixed-line services), as well as Sprint and T-Mobile (which focus mainly on mobile services). Over the past decade, cable TV providers have also started to offer telecom services,
177 VoIP technologies enable telephone calls to be transmitted over the Internet, rather than traditional circuit-switched networks, by breaking the conversation into Internet Protocol packets. 178 Business services encompass not only landline and mobile voice services, text messaging, and internet access services but also wide area network services like Internet Protocol-virtual private network (IP-VPN), business Ethernet, data center, cloud computing, and network security. 179 WTO, “Coverage of Basic Telecommunications and Value-added Services,” n.d. (accessed December 27, 2017). 180 The global market is defined as spending by both consumers and businesses on fixed-voice services (both traditional fixed-line and IP-based services, including line and access costs), fixed data services (including broadband services based on digital subscriber line [DSL], cable, and fiber), IP-VPN services, Ethernet line and Ethernet local area network services, frame relay and asynchronous transfer mode services, leased-line services, and internet access services. IDC, Worldwide Telecom Services Database (accessed January 30, 2018). 181 IDC, Worldwide Telecom Services Database (accessed January 30, 2018).
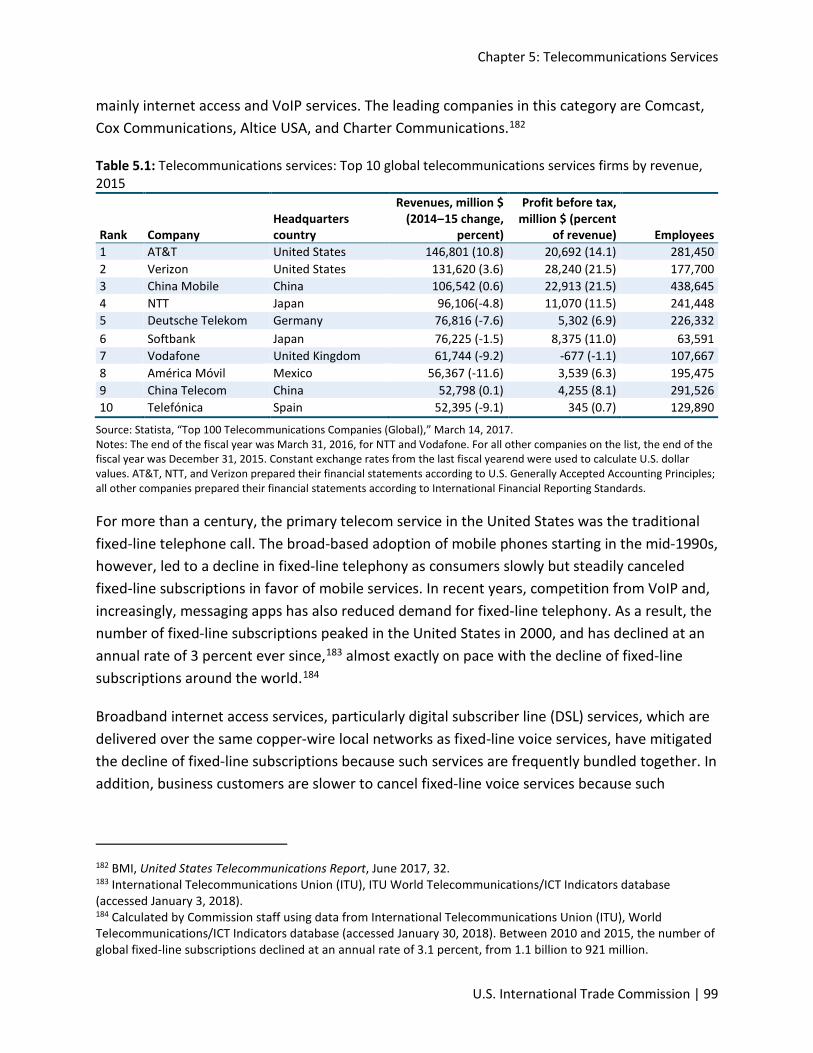
Chapter 5: Telecommunications Services
U.S. International Trade Commission | 99
mainly internet access and VoIP services. The leading companies in this category are Comcast, Cox Communications, Altice USA, and Charter Communications.182
Table 5.1: Telecommunications services: Top 10 global telecommunications services firms by revenue, 2015
Rank Company Headquarters country
Revenues, million $ (2014–15 change,
percent)
Profit before tax, million $ (percent
of revenue) Employees 1 AT&T United States 146,801 (10.8) 20,692 (14.1) 281,450 2 Verizon United States 131,620 (3.6) 28,240 (21.5) 177,700 3 China Mobile China 106,542 (0.6) 22,913 (21.5) 438,645 4 NTT Japan 96,106(-4.8) 11,070 (11.5) 241,448 5 Deutsche Telekom Germany 76,816 (-7.6) 5,302 (6.9) 226,332 6 Softbank Japan 76,225 (-1.5) 8,375 (11.0) 63,591 7 Vodafone United Kingdom 61,744 (-9.2) -677 (-1.1) 107,667 8 América Móvil Mexico 56,367 (-11.6) 3,539 (6.3) 195,475 9 China Telecom China 52,798 (0.1) 4,255 (8.1) 291,526 10 Telefónica Spain 52,395 (-9.1) 345 (0.7) 129,890
Source: Statista, “Top 100 Telecommunications Companies (Global),” March 14, 2017. Notes: The end of the fiscal year was March 31, 2016, for NTT and Vodafone. For all other companies on the list, the end of the fiscal year was December 31, 2015. Constant exchange rates from the last fiscal yearend were used to calculate U.S. dollar values. AT&T, NTT, and Verizon prepared their financial statements according to U.S. Generally Accepted Accounting Principles; all other companies prepared their financial statements according to International Financial Reporting Standards.
For more than a century, the primary telecom service in the United States was the traditional fixed-line telephone call. The broad-based adoption of mobile phones starting in the mid-1990s, however, led to a decline in fixed-line telephony as consumers slowly but steadily canceled fixed-line subscriptions in favor of mobile services. In recent years, competition from VoIP and, increasingly, messaging apps has also reduced demand for fixed-line telephony. As a result, the number of fixed-line subscriptions peaked in the United States in 2000, and has declined at an annual rate of 3 percent ever since,183 almost exactly on pace with the decline of fixed-line subscriptions around the world.184
Broadband internet access services, particularly digital subscriber line (DSL) services, which are delivered over the same copper-wire local networks as fixed-line voice services, have mitigated the decline of fixed-line subscriptions because such services are frequently bundled together. In addition, business customers are slower to cancel fixed-line voice services because such
182 BMI, United States Telecommunications Report, June 2017, 32. 183 International Telecommunications Union (ITU), ITU World Telecommunications/ICT Indicators database (accessed January 3, 2018). 184 Calculated by Commission staff using data from International Telecommunications Union (ITU), World Telecommunications/ICT Indicators database (accessed January 30, 2018). Between 2010 and 2015, the number of global fixed-line subscriptions declined at an annual rate of 3.1 percent, from 1.1 billion to 921 million.
Recent Trends in U.S. Service Trade: 2018 Annual Report
100 | www.usitc.gov
services are more reliable and secure than mobile voice services.185 Nonetheless, fixed-line subscriptions in the United States are forecast to decline at an average annual rate of 1.7 percent during 2018–20.186 Revenues in the fixed-line segment fell at an annual rate of 5.9 percent from 2012 to 2017, and are forecast to decline at annual rate of 4.1 percent during 2018–22.187
Mobile services, which first emerged as a commercially viable service in the mid-1990s, have grown rapidly over the past 20 years. From 1996 through 2016, the number of mobile subscribers in the United States grew at an average annual rate of 12 percent, from 44 million to 417 million, resulting in a mobile penetration rate188 of 127 percent.189 In 2017, the number of mobile subscriptions is expected to have increased to 433 million, representing a penetration rate of 133 percent.190 Despite the high mobile penetration rate in the United States—which stems from the fact that many people own more than one phone—the market is expected to continue to grow during the next three years, albeit at a lower annual rate of 2.7 percent due to market saturation.191 Globally, more than 120 countries have mobile penetration rates that exceed 100 percent.192
Until 2000, telephone calls were the sole mobile service. After the rollout of second-generation cellular technology (2G) networks in the early 2000s, text messaging surged in popularity. In 2007, the simultaneous rollout of the first third-generation cellular technology (3G) network (by AT&T) and Apple’s iPhone (available only through AT&T for the first few years) revolutionized the mobile services industry. The subsequent demand for smartphones and data has greatly benefited the industry, with wireless revenues among the four largest providers—AT&T, Sprint, T-Mobile, and Verizon—growing in every year between 2007 and 2015. In 2016, however, the revenue of these providers contracted, largely due to the ongoing shift to contract-free service plans and phone-leasing programs. In 2017, too, revenue growth is expected to stagnate.193
Internet access service was widely adopted in the United States starting in the late 1990s and has grown steadily ever since. Fixed broadband services like cable modem, DSL, and fiber optic services represent the vast majority of internet access subscriptions. Between 2006 and 2016, the number of fixed broadband subscriptions in the United States grew at an average annual
185 Longo, Wired Telecommunications Carriers in the United States, April 2017, 7. 186 Economist Intelligence Unit (EIU), Telecommunications: United States of America, Q4 2017, 2. 187 Zino, Industry Surveys: Telecommunications, January 2017, 13. 188 The mobile penetration rate is defined as the number of mobile subscribers per 100 people. 189 ITU, ITU World Telecommunications/ICT Indicators (WTI) database (accessed January 3, 2018). 190 EIU, Telecommunications: United States of America, Q4 2017, 2. 191 EIU, Telecommunications: United States of America, Q4 2017, 2. 192 ITU, World Telecommunications/ICT Indicators Database (accessed January 30, 2018). 193 Zino, Industry Surveys: Telecommunications, January 2017, 13.
Chapter 5: Telecommunications Services
U.S. International Trade Commission | 101
rate of 4.4 percent, from 60.2 million to 106.1 million, resulting in a broadband internet penetration rate of 32.3 percent.194 In 2016, there were roughly 247 million internet users in the United States, or approximately 76 percent of the population.195 Over the past 10 years, cable modem service has consistently gained market share in the United States, whereas fiber optic broadband has grown more slowly. In 2016, fiber subscriptions accounted for only 11 percent of broadband subscriptions in the United States, significantly lower than the Organization for Economic Co-operation and Development average of 21 percent. By contrast, fiber subscriptions in Japan and South Korea represented 75 percent and 74 percent of the market, respectively.196 In 2015, spending on fixed broadband internet services in the United States totaled $51 billion, an increase of 11.8 percent from the previous year.197
Supply and Demand Factors In an effort to address flat or declining revenues, U.S. telecom carriers are focusing on opportunities that make use of their existing network infrastructure and core connectivity services, which represent more than 90 percent of total revenues for many companies. Such strategies include bolstering network infrastructure, connecting a growing array of devices, entering complementary markets, and reconfiguring their business services offerings.
Network Infrastructure and New Devices Smartphones are becoming the primary means by which many consumers access the internet. The spread of unlimited data plans and the growth of video content (including an increasing amount of high-definition video) are causing demand for mobile data to surge, making network congestion an ongoing issue for mobile carriers in the United States and requiring them to continually invest in network upgrades.198 Over the next few years, network construction efforts will also be driven by the rollout of fifth-generation cellular technology (5G) networks. These networks will connect a host of new devices (ranging from watches to home thermostats to cars) to the internet, a market that is increasingly referred to as the Internet of Things (IoT).
Driven by such factors, U.S. carriers are frequently announcing the completion of network upgrades as well as future network plans. For example, in November 2017, T-Mobile
194 ITU, ITU World Telecommunications/ICT Indicators (WTI) database (accessed January 5, 2018). 195 EIU, Telecommunications: United States of America, Q4 2017, 6. 196 Ibid. 197 Statista, “Fixed Broadband Revenue in Selected Countries,” 2016. 198 Chatterjee, “Top 3 Mobile Data Trends to Watch For in 2018,” January 26, 2018.

Recent Trends in U.S. Service Trade: 2018 Annual Report
102 | www.usitc.gov
announced the activation of LTE-Advanced199 networks—an upgrade of its Long-Term Evolution (LTE) networks—in more than 920 markets around the United States. In 430 of those markets, it has activated even higher-speed networks based on Gigabit Class LTE technologies. Going forward, T-Mobile plans to launch networks using LTE-Licensed Enabled Access technologies, which boost network capacity by deploying small cells operating on unlicensed spectrum.200
Further, AT&T plans to activate networks based on the new 5G New Radio guidelines in a dozen U.S. markets by the end of 2018. In addition, AT&T plans to expand its current LTE network, including its upgraded 4G LTE network, dubbed 5G Evolution (despite offering sub-5G speeds). Verizon is planning to launch 5G service in five cities by the end of 2018, Sprint intends to activate a 5G network in 2019, and T-Mobile has announced plans to roll out nationwide 5G network coverage by the end of 2020.201 Such network construction requires enormous amounts of capital. T-Mobile, for example, is expected to spend roughly $5 billion on its mobile network infrastructure in 2017.202 Over the next seven years, U.S. carriers are expected to spend an estimated $275 billion on 5G infrastructure, including more than $100 billion on the construction of new 5G antenna sites.203
At the same time, U.S. carriers have been making efforts to increase the number of devices connected to their networks. In March 2017, Verizon launched its Cat M1 IoT infrastructure, a specialized low-power wide area network designed for IoT devices. Verizon is also developing ThingSpace, a web-based platform for managing IoT deployments. So far, Verizon has 14,000 developers registered on the ThingSpace platform.204 In Columbus, Ohio, Verizon Share software (which connects to ThingSpace) lets taxi drivers use an app to locate, reserve, and rent the closest YellowCab car for the purpose of offering taxi services. In Sacramento, California, Verizon offers free Wi-Fi in public parks via 15 kiosks around city, and is installing intelligent software and systems in more than a dozen stoplights in an effort to help the city better manage traffic flows.205
199 Long Term Evolution-Advanced technologies offer higher transmission capacity than previous LTE network configurations. 200 TeleGeography, “T-Mobile US Extends LTE-A to 920 Markets,” November 10, 2017. Unlicensed spectrum is a frequency band allocated for use by the public and, therefore, does not require a license. 201 Gartenburg, “AT&T Announces Plans to Roll Out a True 5G Network,” January 4, 2018; Gartenburg, “AT&T Announces It Will Build a Fake 5G Network,” April 25, 2017. 202 Smith, “What Are T-Mobile’s Capex Plans for 2017?” September 28, 2017. 203 Rayner, “The Cost of Rising Data Consumption,” January 23, 2018. 204 Sibley, “What’s the IoT Plan, Verizon?” September 11, 2017. 205 Sibley, “What’s the IoT Plan, Verizon?” September 11, 2017.

Chapter 5: Telecommunications Services
U.S. International Trade Commission | 103
Verizon is also moving into the connected car and fleet management markets. In June 2016, Verizon Telematics announced plans to acquire Telogis, a California-based developer of telematics and fleet logistics software used by Ford, Volvo, GM, and other automobile manufacturers.206 In August 2016, Verizon also announced plans to spend $2.4 billion in cash to buy Fleetmatics Group, a fleet management company that develops software and uses GPS technologies to track vehicle location, fuel usage, speed, mileage, and driver behavior.207 AT&T has also been building a connected-car business and now has more than a dozen car companies as customers.208
Smart home services are another growing IoT market. AT&T has launched a smart home service known as Digital Life, which offers home security as well as automated thermostats, lighting control, and water-leak detection.209 By the end of 2016, AT&T had roughly 308,000 subscribers, making it the third-largest provider of such services in the United States.210 Similarly, CenturyLink offers a smart home service that includes home security, fire and carbon monoxide monitoring, and home automation services.211
Outside of the United States, telecom carrier involvement in the IoT market is also in the early stages, but growing rapidly. Spain’s Telefónica announced that roughly 15 million machine-to-machine subscriber identification modules were connected to its network at the end of June 2017, up 15 percent from the same period in 2016, while revenues for such services were up 25.5 percent to $82 million.212 In 2017, Telefónica also launched “The Thinx,” a facility/platform that allows customers to launch new applications or devices.213 In South Korea, mobile carrier SK Telecom signed agreements with home automation companies Commax and Hyundai Telecom in 2015 and smart home equipment provider Kocom in 2016, with the goal of controlling 50 percent of South Korea’s smart home market by 2020.214 Going forward,
206 PRNewswire, “Verizon to Enhance Significantly Its Connected Vehicle Business,” June 21, 201; Lunden, “Verizon Buys Telogis to Drive Deeper Into the Connected Vehicle Market,” June 21, 2016. 207 Nayak, “Verizon to Buy Vehicle Management Company Fleetmatics for $2.4 Billion,” August 1, 2016. 208 Newcomb, “Verizon’s Acquisition of Telogis Expands Company’s Connected-Car Footprint,” June 30, 2016. 209 AT&T, “AT&T Digital Life Home,” https://my-digitallife.att.com/learn/home-security-and-automation (accessed January 5, 2018). 210 Engebretson, “Report: AT&T Third in Smart Home Market Share,” January 2017. In 2016, the top two companies in the U.S. smart home market were Vivint and ADT Pulse. 211 Century Link, http://www.centurylink.com/home/help/products/smart-home-frequently-asked-questions.html (accessed January 5, 2018). 212 TeleGeography, “IoT Time,” July 27, 2017. 213 Telecompaper, “Telefonica Launches ‘The Thinx’ Project,” November 2, 2017. 214 Iglauer, “SK Telecom to Dominate Smart Home Services Market by 2020,” March 31, 2016.
Recent Trends in U.S. Service Trade: 2018 Annual Report
104 | www.usitc.gov
theglobal IoT market is expected to grow to $457 billion during 2016–20, representing a CAGR of 28.5 percent.215
Carriers Enter Complementary Content and Advertising Markets Some telecom carriers are responding to flat or declining revenues in their core service markets by entering complementary markets. In October 2016, AT&T announced plans to purchase Time Warner, which owns the Warner Brothers movie studio as well as CNN, HBO, and TBS, for $85 billion (plus $22 billion in assumed debt).216 The deal, which would merge AT&T’s distribution network with Time Warner’s movie and television content, is predicated on locking customers into internet and wireless services by offering packages that include Time Warner content. The deal would also allow AT&T to better manage its content costs, while simultaneously earning revenues by offering content to other pay-TV services providers.217 In a setback to AT&T, the U.S. Department of Justice filed a civil antitrust lawsuit in November 2017 to block the acquisition, saying that the combined company would hinder competitors by forcing them to pay hundreds of millions of dollars more per year for Time Warner’s content.218
Verizon has also undertaken several large acquisitions in recent years to complement its existing network and services. In 2015, Verizon purchased AOL for $4.4 billion in cash.219 Although AOL’s digital content development business was largely unprofitable, it had developed a set of valuable ad-buying and targeting tools, particularly for videos. Also, in June 2017, Verizon completed its purchase of Yahoo for roughly $4.8 billion. Yahoo, too, had failed to generate profits from its content operations, but had developed advertising technologies and had a customer base of more than one billion users. Over the past few years, Verizon has also purchased Microsoft’s ad-technology operations as well as the ad-technology company Millennial Media.220
The combination of these companies gives Verizon both a variety of content and data on the online activities of more than a billion users, which it can use to target its own ads, as well as the ads of other companies.221 Verizon hopes that its collection of digital advertising assets will allow it to compete against Facebook and Google. In 2016, most of the internet’s ad-referral
215 Columbus, “2017 Roundup of Internet of Things Forecasts,” December 10, 2017. 216 Downes, “Why Mergers Like the AT&T Time Warner Deal Should Go Through,” November 2017; Pressman, “AT&T’s Time Warner Deal Makes Strategic Sense,” October 22, 2016. 217 Pressman, “AT&T’s Time Warner Deal Makes Strategic Sense,” October 22, 2016. 218 USDOJ, “Justice Department Challenges AT&T/DirecTV’s Acquisition of Time Warner,” November 20, 2017. 219 DiChristopher, “Verizon Closes AOL Acquisition,” June 23, 2015. 220 Ingram, “Here’s Why Verizon Wants to Buy Yahoo So Badly,” April 19, 2016. 221 Ingram, “Here’s Why Verizon Wants to Buy Yahoo So Badly,” April 19, 2016.
Chapter 5: Telecommunications Services
U.S. International Trade Commission | 105
traffic went to Google (which accounted for 31 percent of global digital ad revenues) and Facebook (with 12 percent), whereas the combined ad revenue of Yahoo and Verizon was less than 3 percent.222
Data Centers and Interconnection Capacity In recent years, U.S. telecom carriers have responded to the growth of cloud computing and surging demand for data by investing significant capital in a geographically diverse set of data centers,223 either by expanding existing data centers or buying data centers from other companies. Now, however, many have decided to sell their data centers, largely due to the effort of operating and managing data centers as well as the high costs of providing power and air conditioning. In 2015, for example, AT&T sold several data centers for $2 billion, and is reportedly trying to sell several others. Similarly, in 2016, Verizon sold 29 data centers to data-center operator Equinix for $3.6 billion.224 In May 2017, Verizon also sold its cloud and managed hosting business to IBM,225 while CenturyLink sold its data center and colocation226 business for $2.3 billion to a consortium led by BC Partners.227
Instead of operating data centers, many U.S. carriers decided to focus on their core competency by offering wide area networking (WAN) services to data center operators. WANs are high-speed networks that connect companies’ offices and facilities in different locations to form a single network. These networks can connect distinct offices within a single city or two or more offices anywhere in the world. WAN technologies have also become increasingly important for connecting data centers and cloud computing facilities.
Although leased lines and Internet Protocol virtual private network (IP-VPN) services are used to connect data centers, business Ethernet is now the dominant data center interconnection service. The primary benefit of business Ethernet is faster data transmission: connection speeds of 2.5 gigabits per second (Gbps), 5 Gpbs, and 10 Gbps are now largely standard products, and 40 Gbps and 100 Gbps products are becoming increasingly common. Business Ethernet is increasingly the service of choice for companies that have large data transmission needs and/or require high-bandwidth connections to (or between) data centers and cloud computing
222 Udland, “Yahoo Is the Latest Piece of Verizon’s $10 Billion Plan,” July 25, 2016. 223 Data centers are large, warehouse-like facilities that offer space for companies to install servers and other computer equipment. The core services provided by data centers are telecom network connectivity, space rental, physical security, air conditioning and electricity services, and emergency backup systems. 224 EIU, “The Great Datacentre Sell-Off,” May 5, 2017; Buckley, “How AT&T, Verizon, and CenturyLink Are Exiting Data Centers,” May 22, 2017. 225 Lardinois, “Verizon Sells Its Private Cloud,” May 3, 2017. 226 Colocation services involve the leasing of space for telecom networking equipment and computer hardware. 227 Moss, “CenturyLink Completes Sale of Its Data Center Business,” May 2, 2017.

Recent Trends in U.S. Service Trade: 2018 Annual Report
106 | www.usitc.gov
facilities. In 2015, the U.S. business Ethernet market grew by 29.4 percent to $6.6 billion, faster than the average annual rate of 26.4 percent recorded during 2010–14. This expansion was driven by ongoing growth in cloud computing services, falling product prices, and growing demand for high-speed network facilities.228
Trade Trends Telecom services are traded between countries in two main ways: through cross-border trade between countries—most commonly payments for connecting international telephone calls and for roaming on foreign networks—and through affiliate sales, or the local sales of telecom services in one country by an affiliate of a telecom services company headquartered in another country.
Cross-Border Trade In 2016, U.S. cross-border exports of telecom services (box 5.1) totaled $12.2 billion, while imports totaled $5.5 billion, yielding a trade surplus of $6.7 billion (figure 5.1).229 Exports of telecom services experienced essentially no growth during 2011–15 and fell by 3 percent in 2016. This trend likely reflected a decline in demand for traditional voice services in favor of smartphone-based communications apps, often referred to as over-the-top (OTT) services; examples of OTT services include WhatsApp, Facebook Messenger, and FaceTime.230 Imports of telecom services also decreased during the period, falling by 11 percent from 2011 through 2015 and by another 13 percent in 2016. The decline in U.S. telecom imports also likely reflects the impact of smartphone-based communications apps.231
Box 5.1: Understanding BEA Data on Cross-Border Trade and Affiliate Transactions in Telecommunications Services
BEA data on cross-border trade in telecommunications services cover the following services: telephone message services, telex, telegram, and other jointly provided basic services; private leased channel services; value-added services; support services; and reciprocal exchanges.a These figures are collected quarterly by the BEA (using Form BE-125).b Companies are instructed to report data for these categories in the aggregate, so data by specific service type are not available.c In addition, the BEA periodically conducts benchmark surveys (using Form BE-120). The latest such survey occurred in 2011.
In 2006, the BEA started collecting and reporting data for both affiliated and unaffiliated telecommunication transactions (earlier, the BEA had collected only unaffiliated data).d Affiliated
228 TIA, TIA’s 2016–2020 ICT Market Review and Forecast, 2016, 2–8. 229 USDOC, BEA, U.S. International Services, 12. 230 Christian, “Market Sees First Decline in International Carrier Voice,” January 26, 2017. 231 Ibid.
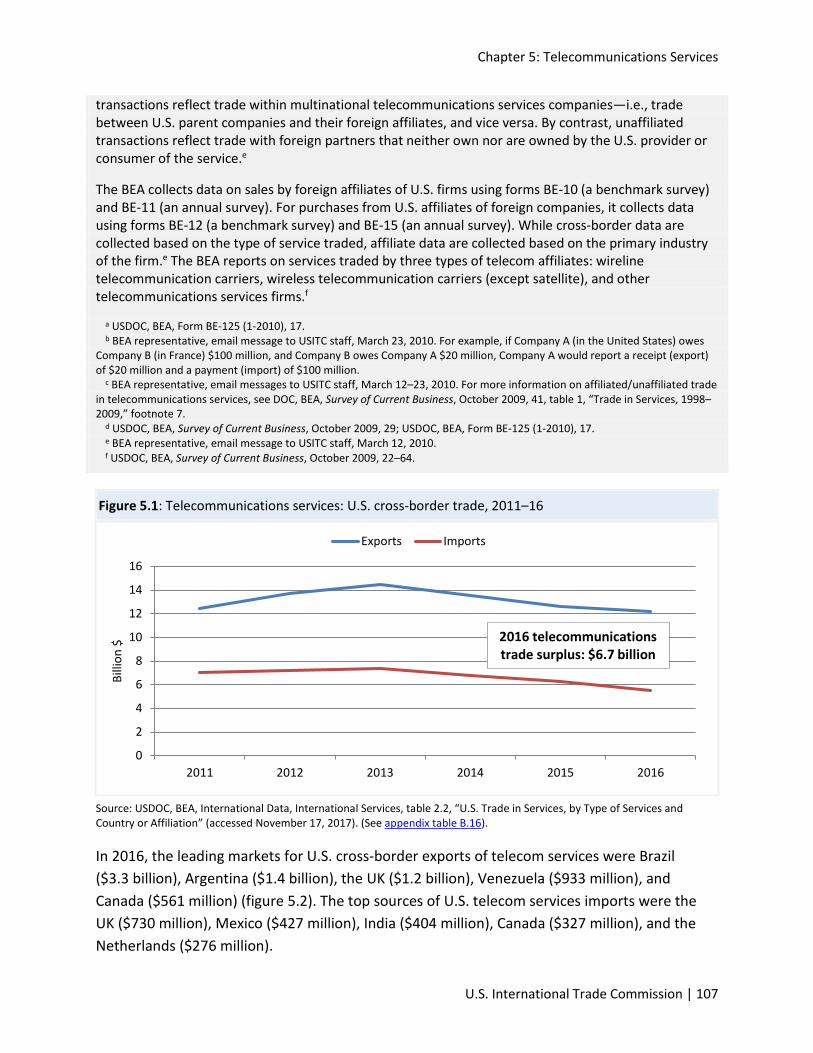
Chapter 5: Telecommunications Services
U.S. International Trade Commission | 107
transactions reflect trade within multinational telecommunications services companies—i.e., trade between U.S. parent companies and their foreign affiliates, and vice versa. By contrast, unaffiliated transactions reflect trade with foreign partners that neither own nor are owned by the U.S. provider or consumer of the service.e
The BEA collects data on sales by foreign affiliates of U.S. firms using forms BE-10 (a benchmark survey) and BE-11 (an annual survey). For purchases from U.S. affiliates of foreign companies, it collects data using forms BE-12 (a benchmark survey) and BE-15 (an annual survey). While cross-border data are collected based on the type of service traded, affiliate data are collected based on the primary industry of the firm.e The BEA reports on services traded by three types of telecom affiliates: wireline telecommunication carriers, wireless telecommunication carriers (except satellite), and other telecommunications services firms.f
a USDOC, BEA, Form BE-125 (1-2010), 17. b BEA representative, email message to USITC staff, March 23, 2010. For example, if Company A (in the United States) owes
Company B (in France) $100 million, and Company B owes Company A $20 million, Company A would report a receipt (export) of $20 million and a payment (import) of $100 million.
c BEA representative, email messages to USITC staff, March 12–23, 2010. For more information on affiliated/unaffiliated trade in telecommunications services, see DOC, BEA, Survey of Current Business, October 2009, 41, table 1, “Trade in Services, 1998–2009,” footnote 7.
d USDOC, BEA, Survey of Current Business, October 2009, 29; USDOC, BEA, Form BE-125 (1-2010), 17. e BEA representative, email message to USITC staff, March 12, 2010. f USDOC, BEA, Survey of Current Business, October 2009, 22–64.
Figure 5.1: Telecommunications services: U.S. cross-border trade, 2011–16
Source: USDOC, BEA, International Data, International Services, table 2.2, “U.S. Trade in Services, by Type of Services and Country or Affiliation” (accessed November 17, 2017). (See appendix table B.16).
In 2016, the leading markets for U.S. cross-border exports of telecom services were Brazil ($3.3 billion), Argentina ($1.4 billion), the UK ($1.2 billion), Venezuela ($933 million), and Canada ($561 million) (figure 5.2). The top sources of U.S. telecom services imports were the UK ($730 million), Mexico ($427 million), India ($404 million), Canada ($327 million), and the Netherlands ($276 million).
0
2
4
6
8
10
12
14
16
2011 2012 2013 2014 2015 2016
Billi
on $
Exports Imports
2016 telecommunicationstrade surplus: $6.7 billion
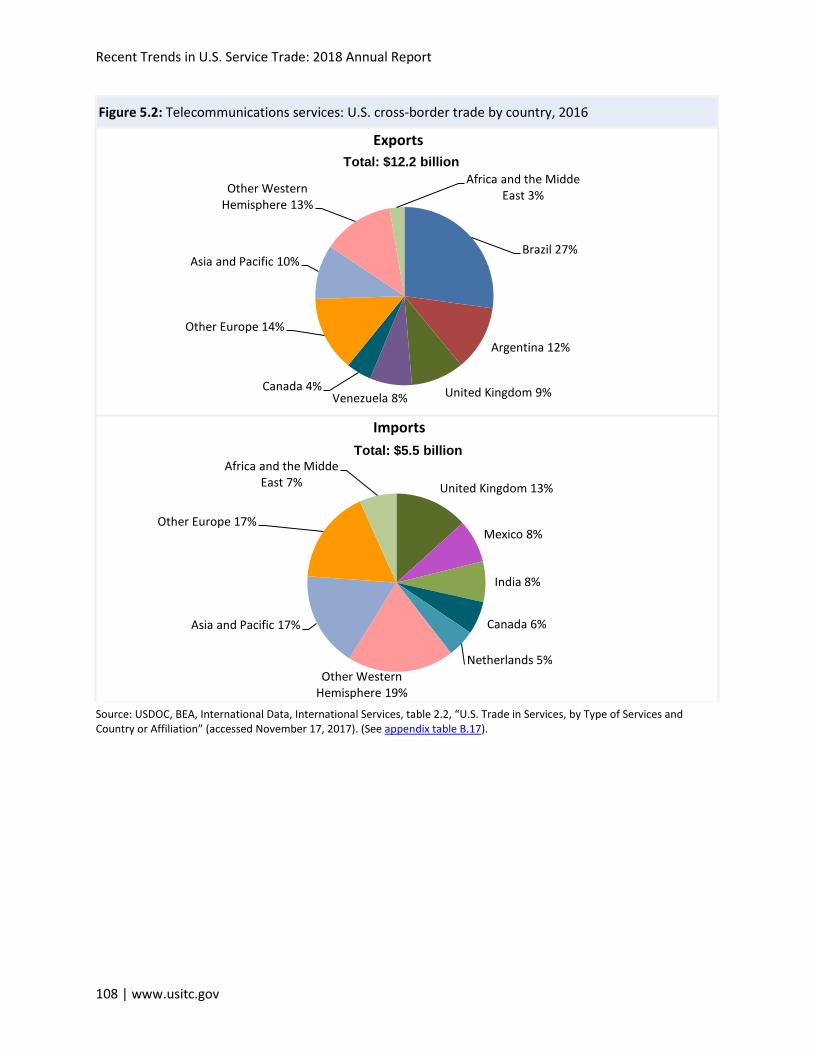
Recent Trends in U.S. Service Trade: 2018 Annual Report
108 | www.usitc.gov
Figure 5.2: Telecommunications services: U.S. cross-border trade by country, 2016
Source: USDOC, BEA, International Data, International Services, table 2.2, “U.S. Trade in Services, by Type of Services and Country or Affiliation” (accessed November 17, 2017). (See appendix table B.17).
Brazil 27%
Argentina 12%
United Kingdom 9%Venezuela 8%Canada 4%
Other Europe 14%
Asia and Pacific 10%
Other Western Hemisphere 13%
Africa and the Midde East 3%
ExportsTotal: $12.2 billion
United Kingdom 13%
Mexico 8%
India 8%
Canada 6%
Netherlands 5%Other Western
Hemisphere 19%
Asia and Pacific 17%
Other Europe 17%
Africa and the Midde East 7%
ImportsTotal: $5.5 billion
Chapter 5: Telecommunications Services
U.S. International Trade Commission | 109
Affiliate Transactions U.S. carriers primarily offer telecom services to customers in foreign countries—including the foreign affiliates of U.S.-based multinational firms—through in-country affiliates (box 5.2). In 2015, data on the total sales of U.S. telecom carriers through their foreign affiliates were suppressed by the BEA to protect the confidential data of individual firms, but sales by affiliates in the wired and wireless carrier segments were $26.5 billion and $5.5 billion, respectively. These figures were roughly 5 percent lower than in 2014.232 By contrast, telecom services purchased from U.S.-based affiliates of foreign telecom services companies totaled $75.6 billion—13 percent higher than in 2014. A large portion of the data pertaining to U.S. sales and purchases of telecom services through foreign affiliates—including virtually all country-level data—is suppressed. The suppression of such data, however, likely indicates that only one or two U.S. companies operate in most foreign countries, suggesting that the dollar amounts of such sales and purchases in individual countries are relatively small.
Box 5.2: U.S. Telecom Carriers in the Global Market
For more than a decade, U.S. telecom carriers have largely avoided making investments in consumera
telecom services markets abroad. In recent years, one of the few examples of a U.S. carrier entering a foreign consumer telecom services market is AT&T’s acquisition of two companies in Mexico—lusacell and Nextel Mexico—in 2015.a AT&T’s acquisition of DirecTV in 2015 also included satellite-TV services in more than a dozen Latin American and Caribbean countries, as well as significant ownership positions in Sky Brazil and Sky Mexico.b
Instead, in foreign countries, U.S. carriers primarily offer business services to multinational corporations and government agencies that maintain offices in one or more countries. Common business services include fixed-line and mobile voice, private line, digital subscriber line, cable modem, dedicated internet access, managed router, managed security, infrastructure as a service, hosted cloud, carrier Ethernet, and Internet Protocol virtual private networks. Although more than 15 U.S. carriers offer business services, including several cable television companies, most focus on the U.S. market, leaving the global business services market to only a few companies—mainly AT&T, CenturyLink, GTT, Level 3, Sprint, Verizon, and XO Communications. For the two largest providers, AT&T and Verizon, domestic and international business services were a significant source of revenues, accounting in 2016 for 9.3 percent and 6.9 percent of total company revenues, respectively.c
In 2017, a number of mergers led to a decline in the number of companies offering such services. Verizon completed its $1.8 billion purchase of XO Communications in February 2017, mainly to acquire fiber-optic networks in key cities,d and CenturyLink closed its $25 billion purchase of Level 3 Communications in November 2017, a deal that increased its presence in the business services market outside the United States.e
232 USDOC, BEA, “Table 4.1. Services Supplied to Foreign Persons by U.S. MNEs through Their MOFAs, by Industry of Affiliate and by Country of Affiliate,” October 24, 2017.
Recent Trends in U.S. Service Trade: 2018 Annual Report
110 | www.usitc.gov
In 2016, the global business services market was valued at $310 billion, up 3.5 percent from the previous year.f The largest 10 companies hold an out-sized share of the market and increased that market share, while the market shares of second- and third-tier companies contracted. Worldwide, the largest provider of business services in 2016 was Japan-based NTT, with 15.8 percent of the global market, followed by AT&T (United States; 8.3 percent), China Telecom (China; 6.0 percent), Verizon (United States; 4.4 percent), and Deutsche Telekom (Germany, 4.2 percent). All remaining companies, including British Telecom (United Kingdom), Orange (France), Telstra (Australia), China Unicom (China), and Telefónica (Spain), had a market share of less than 4 percent.
Revenue growth in the business networking market is increasingly driven by changing consumer and data usage patterns. Specifically, service demand and corresponding network traffic are being driven by the migration away from legacy networking technologies to hybrid wide area networks and cloud technologies, both of which, in turn, are driving emerging services like the Internet of Things, cognitive computing, collaboration, and video services.g
a AT&T, “AT&T Closes Acquisition of Mexican Wireless Provider,” January 16, 2015; AT&T, “AT&T Completes Acquisition of Nextel Mexico,” April 30, 2015.
b Sherman, “AT&T Is Weighing a Public Share Offering,” October 12, 2017. c Munroe, “Worldwide Telecommunications Wireline Business Market Shares, 2016,” 2017. d Buckley, “After Delay, Verizon Wraps $1.8 Billion XO Acquisition,” February 1, 2017. e CenturyLink, “CenturyLink Completes Acquisition of Level 3,” November 1, 2017; Lind, “CenturyLink Announces Intent to
Acquire Level 3,” October 31, 2016. f Munroe, “Worldwide Telecommunications Wireline Business Market Shares, 2016,” 2017. g Munroe, “Worldwide Telecommunications Wireline Business Market Shares, 2016,” 2017.
Outlook Over the next three years, the global telecom services industry is forecast to grow at a rate of 1.3 percent,233 largely due to flat or declining revenues in the core fixed-line, mobile, and internet markets. Going forward, in an effort to offset anemic revenue growth, U.S. carriers are expected to continue upgrading and expanding their networks, particularly 5G networks. At the same time, they will likely focus on earning revenues from recent investments and acquisitions that they have made in new markets, including broadcasting content, IoT, online advertising, smart home, and WAN services. Carriers are also expected to continue cutting costs and reducing their exposure to unprofitable market segments.
233 IDC, Worldwide Telecom Services Database (accessed January 30, 2018).
Chapter 5: Telecommunications Services
U.S. International Trade Commission | 111
Bibliography AT&T. “AT&T Closes Acquisition of Mexican Wireless Provider lusacell.” News release, January
16, 2015. http://about.att.com/story/att_completes_acquisition_of_iusacell.html.
AT&T. “AT&T Completes Acquisition of Nextel Mexico.” News release, April 30, 2015. http://about.att.com/story/att_completes_acquisition_of_nextel_mexico.html.
Buckley, Sean. “After Delay, Verizon Wraps $1.8 Billion OX Acquisition, Deepening Metro Fiber Density in 45 Markets.” FierceTelecom, February 1, 2017. https://www.fiercetelecom.com/telecom/after-delay-verizon-wraps-1-8b-xo-acquisition-deepens-metro-fiber-density-45-markets.
Buckley, Sean. “Editor’s Corner––How AT&T, Verizon and CenturyLink Are Exiting Data Centers and Cloud Services to Become Managed IT Players.” Fierce Telecom, May 22, 2017. https://www.fiercetelecom.com/telecom/editor-s-corner-how-at-t-verizon-and-centurylink-are-exiting-data-centers-cloud-services-to.
Business Monitor International (BMI). United States Telecommunications Report, Q3 2017, June 2017.
CenturyLink. “CenturyLink Completes Acquisition of Level 3.” News release, November 1, 2017. http://news.centurylink.com/2017-11-01-CenturyLink-completes-acquisition-of-Level-3.
Chatterjee, Indranil. “Top 3 Data Trends to Watch for in 2018.” VanillaPlus (blog) (UK), January 26, 2018. https://www.vanillaplus.com/2018/01/26/35027-top-3-mobile-data-trends-watch-2018/.
Christian, Patrick. “Market Sees First Decline in International Voice Carrier Traffic since Great Depression.” TeleGeography Blog: Voice, January 26, 2017. https://blog.telegeography.com/market-sees-first-decline-in-international-voice-carrier-traffic-since-great-depression.
Columbus, Louis. “2017 Roundup of Internet of Things Forecasts.” Forbes, December 10, 2017. https://www.forbes.com/sites/louiscolumbus/2017/12/10/2017-roundup-of-internet-of-things-forecasts/#6dc31ea01480.
DiChristopher, Tom. “Verizon Closes AOL Acquisition.” CNBC, June 23, 2015. https://www.cnbc.com/2015/06/23/verizon-closes-aol-acquisition.html.

Recent Trends in U.S. Service Trade: 2018 Annual Report
112 | www.usitc.gov
Downes, Larry. “Why Mergers Like the AT&T-Time Warner Deal Should Go Through.” Harvard Business Review, November 16, 2017. https://hbr.org/2017/11/why-mergers-like-the-att-time-warner-deal-should-go-through.
Economist Intelligence Unit (EIU). Telecommunications: United States of America, Q4 2017. http://www.eiu.com/FileHandler.ashx?issue_id=116171195&mode=pdf.
Economist Intelligence Unit (EUI). “The Great Datacenter Sell-Off,” May 5, 2017. http://www.eiu.com/industry/article/335396817/the-great-datacentre-sell-off/2017-05-05.
Engebretson, Joan. “Report: AT&T Third in Smart Home Market Share.” Telecompetitor, January 24, 2017. http://www.telecompetitor.com/report-att-third-in-smart-home-market-share/.
Gartenburg, Chaim. “AT&T Announces It Will Build a Fake 5G Network.” Verge, April 25, 2017. https://www.theverge.com/2017/4/25/15425414/att-5g-evolution-network-lte-advanced-misleading-marketing.
Gartenburg, Chaim. “AT&T Announces Plans to Roll Out a True 5G Network by the End of 2018.” Verge, January 4, 2018. https://www.theverge.com/2018/1/4/16848220/att-5g-network-2018-3gpp-standard-evolution-cellular-network-lte.
Iglauer, Philip. “SK Telecom to Dominate Smart Home Services Market by 2020.” ZDNet, March 31, 2016. http://www.zdnet.com/article/sk-telecom-to-dominate-smart-home-services-market-by-2020/.
Ingram, Mathew. “Here’s Why Verizon Wants to Buy Yahoo So Badly.” Fortune, April 19, 2016. http://fortune.com/2016/04/19/verizon-yahoo/.
International Data Corporation (IDC). Worldwide Telecommunications Services Database (accessed January 3, 2018; fee required).
International Telecommunications Union (ITU). ITU World Telecommunications/ICT Indicators database (accessed various dates; fee required).
Lardinois, Frederic. “Verizon Sells Its Private Cloud and Managed Hosting Businesses to IBM.” TechCrunch, May 3, 2017. https://techcrunch.com/2017/05/03/verizon-sells-its-private-cloud-and-managed-hosting-businesses-to-ibm/.

Chapter 5: Telecommunications Services
U.S. International Trade Commission | 113
Lind, Amy, and Courtney Munroe. “CenturyLink Announces Intent to Acquire Level 3.” International Data Corporation (IDC), October 31, 2016. https://www.idc.com/getdoc.jsp?containerId=lcUS41889216.
Longo, Daniel. Wired Telecommunications Carriers in the US. IBISWorld, April 2017.
Lunden, Ingrid. “Verizon Buys Telogis to Drive Deeper into the Connected Vehicle Market.” TechCrunch, June 21, 2016. https://techcrunch.com/2016/06/21/verizon-buys-telogis-to-drive-deeper-into-the-connected-vehicle-market/.
Moss, Sebastian. “CenturyLink Completes Sale of its Data Center Business, Now Called Cyxtera.” DataCenterDynamics, May 2, 2017. http://www.datacenterdynamics.com/content-tracks/colo-cloud/centurylink-completes-sale-of-its-data-center-business-now-called-cyxtera/98245.fullarticle.
Munroe, Courtney. “Worldwide Telecommunications Wireline Business Market Shares, 2016: Tier 1 CSPs Gain Share,” IDC, July 2017. https://www.idc.com/getdoc.jsp?containerId=US42835517.
Nayak, Malathi. “Verizon to Buy Vehicle Management Company Fleetmatics for $2.4 Billion.” Reuters, August 1, 2016. https://www.reuters.com/article/us-fleetmatics-m-a-verizon/verizon-to-buy-vehicle-management-company-fleetmatics-for-2-4-billion-idUSKCN10C29J.
Newcomb, Doug. “Verizon Acquisition of Telogis Expands Company’s Connected Car Footprint.” Forbes, June 30, 2016. https://www.forbes.com/sites/dougnewcomb/2016/06/30/verizon-acquisition-of-telogis-expands-companys-connected-car-footprint/#531cb50c5a83.
Pressman, Aaron. “AT&T’s Time Warner Deal Makes Strategic Sense but Price May Be Too High.” Fortune, October 22, 2016. http://fortune.com/2016/10/22/att-time-warner-strategy-vs-price/.
PRNewswire. “Verizon to Enhance Significantly Its Connected Vehicle Business with Acquisition of Telogis.” June 21, 2016. https://www.prnewswire.com/news-releases/verizon-to-enhance-significantly-its-connected-vehicle-business-with-the-acquisition-of-telogis-300288143.html.
Rayner, Tristan. “The Cost of Rising Data Consumption.” Android Authority, January 2018. https://www.androidauthority.com/rising-data-consumption-829693/.
Recent Trends in U.S. Service Trade: 2018 Annual Report
114 | www.usitc.gov
Sherman, Alex, Scott Moritz, and Alex Barinka. “AT&T Is Weighing a Public Share Offering of Its Latin American TV Assets.” Bloomberg, October 12, 2017. https://www.bloomberg.com/news/articles/2017-10-12/at-t-is-said-to-mull-share-offering-of-latin-american-tv-assets.
Sibley, Mari. “What’s the IoT Plan, Verizon?” Light Reading, September 11, 2017. http://www.lightreading.com/iot/iot-strategies/whats-the-iot-plan-verizon/d/d-id/736192.
Smith, Andrew. “What Are T-Mobile’s Capex Plans for 2017?” Market Realist, September 28, 2017. https://marketrealist.com/2017/09/what-are-t-mobiles-capex-plans-for-2017.Statista. “Fixed Broadband Revenue in Selected Countries from 2006 to 2015 (in Billion GBP),” 2016. https://www.statista.com/statistics/256393/fixed-broadband-revenue-by-country/ (fee required).
Telecommunications Industry Association (TIA). TIA’s 2016–2020 ICT Market Review and Forecast. Arlington, VA: TIA, 2016. https://www.tiaonline.org/resources/tias-2016-2020-ict-market-review-and-forecast.
Telecompaper. “Telefonica Launches ‘The Thinx’ Project as IoT Sales Surge 30%,” November 2, 2017. https://www.telecompaper.com/news/telefonica-launches-the-thinx-project-as-iot-sales-surge-30--1218792.
TeleGeography. “IoT Time: M2M/Internet of Things Weekly Digest,” July 27, 2017. https://www.telegeography.com/products/commsupdate/articles/2017/07/27/iot-time-m2minternet-of-things-weekly-digest/.
TeleGeography. “T-Mobile US Extends LTE-A to 920 Markets; ‘Gigabit Class’ LTE Now in 430 Locations,” November 7, 2017. https://www.telegeography.com/products/commsupdate/articles/2017/11/10/t-mobile-us-extends-lte-a-to-920-markets-gigabit-class-lte-now-in-430-locations/.
Udland, Myles. “Yahoo Is the Latest Piece of Verizon’s $10 Billion Plan to Challenge Facebook and Google.” Business Insider, July 25, 2016. https://www.businessinsider.in/Yahoo-is-the-latest-piece-of-Verizons-10-billion-plan-to-challenge-Facebook-and-Google/articleshow/53380545.cms.
U.S. Department of Commerce (USDOC). Bureau of Economic Analysis (BEA). Interactive data. International Services Tables 2.1, 4.1, and 5.1. https://www.bea.gov/iTable/index_ita.cfm (accessed various dates).

Chapter 5: Telecommunications Services
U.S. International Trade Commission | 115
U.S. Department of Justice (USDOJ). “Justice Department Challenges AT&T/DirectTV’s Acquisition of Time Warner.” News release, November 20, 2017. https://www.justice.gov/opa/pr/justice-department-challenges-attdirectv-s-acquisition-time-warner.
World Trade Organization (WTO). “Coverage of Basic Telecommunications and Value-Added Services.” https://www.wto.org/english/tratop_e/serv_e/telecom_e/telecom_coverage_e.htm (accessed January 4, 2018).
Zino, Angelo. Industry Surveys: Telecommunications. S&P Capital IQ Industry Surveys, January 2017.

Recent Trends in U.S. Service Trade: 2018 Annual Report
116 | www.usitc.gov
U.S. International Trade Commission | 117
Chapter 6 Services Roundtable The Commission hosted its 11th annual Services Roundtable on October 25, 2017. These roundtable discussions are held regularly to encourage dialogue among individuals from government, industry, and academia about issues affecting trade in services. The 2017 event focused on two themes: the relationship between goods and services trade, and recent developments in the tradability of services.
The roundtable also discussed current trade data limitations and considered whether including services as manufacturing inputs could be a new approach to calculating services trade. Commissioner Meredith Broadbent moderated the first half of the discussion, and Chairman Rhonda Schmidtlein moderated the second half.
The Relationship between Goods and Services Trade The first half of the roundtable focused on the relationship between goods and services trade. Participants discussed the ways that services facilitate merchandise trade, serve as a substitute for certain goods, and are part of the value added in some exported goods.
One participant cited the importance of financial and telecommunications services in the production and export of goods, while others pointed out that maintenance and educational services are bundled with certain goods. A participant noted that companies use social media for marketing, which increases domestic sales and exports, and another stressed that payment services enable trade in goods and services. Another participant noted that some companies use data analytics to inform consumers of the location and availability of products—such as gasoline—in real time, which facilitates purchases and increases efficiency. Finally, a participant stated that digital services are an important part of manufacturing and merchandise trade during both design and production, as well as in marketing, distribution, and exporting.
The participants discussed the contribution of services to trade in value added. Participants indicated that governments, multilateral agencies, and businesses have been trying to more accurately assess the value added by services in manufactured goods by using new approaches to trade statistics. They noted that the services incorporated into the value of a good can be sourced either in-house or from an outside supplier, and are indirectly exported when finished goods are provided to overseas customers. According to one participant, services components
Recent Trends in U.S. Services Trade: 2018 Annual Report
118 | www.usitc.gov
of manufactured goods are increasingly sourced internationally, which extends manufacturing supply chains. Echoing statements made in the previous services roundtable, one participant suggested that defining a fifth mode of supply, “value-added services,” to the four already defined by the General Agreement on Tariffs and Trade would increase awareness of services tradability and facilitate the collection of more comprehensive trade statistics.234
Several participants remarked that services can substantially increase the value of a good. One participant gave the example of bicycles, which can be bundled with valuable bike-sharing services. Another participant stated that complex products—such as aircraft engines, as well as heating, ventilation, and air conditioning systems—are increasingly integrated with digital services, which allow manufacturers or other service providers to manage their performance and provide diagnostic services remotely.
Services, especially digital services, can also substitute for certain goods. For example, one participant stated that some consumers are increasingly interested in using transport services, which connect passengers to local drivers, instead of buying their own vehicles. The participant pointed out that some ridesharing services operate across borders.
Developments in the Tradability of Services The second half of the roundtable focused on developments in the tradability of services (i.e., when services are produced in one location and consumed in another). Participants described technological advances that enable services trade, noting that digital technology facilitates direct cross-border trade in some services that traditionally have been traded through mode 2 or mode 3. These include education (online distance learning) and medical consultation (telemedicine). Participants indicated that providers in these industries no longer need to share a physical space with a student, patient, or other type of customer.
One participant noted that certain digital services are difficult to capture in official trade statistics because they may cross multiple countries in a single transaction. The participant added that sometimes such services are provided to the end user free of charge, typically because the free service provides valuable data to the provider. A participant said that free services bundled with goods are not captured in trade data, and another gave the specific example of a free translation app for smartphones that allows individuals to translate conversations while traveling, with data being transferred between the user’s smartphone and a data center in another country. Another participant stated that trade in certain services, such
234 See chapter 1, box 1.1.

Chapter 6: Services Roundtable
U.S. International Trade Commission | 119
as cloud computing, can involve multiple modes of supply and may take place as an ongoing business relationship rather than a single distinct transaction.
Despite innovations in services trade, several participants noted that services trade restrictions still have significant effects, especially in large developing countries like India, China, and Brazil. One participant said that the presence of different licensing rules in different markets is an obstacle to trade in audiovisual services. A second participant identified foreign direct investment restrictions as a major barrier. A third participant noted that digital trade restrictions both limit exports of computer and information services and reduce manufacturing firms’ access to logistics and financial services, which affects their goods’ exports and supply chains.
One participant said that some trade restrictions have a limited effect because companies learn to bypass restrictions by providing their services through different modes of supply; for this reason, barriers are a greater impediment when they affect multiple modes of supply. Another participant noted that medical services are frequently affected by privacy regulations that prevent the transfer of patient data through mode 1, while licensing requirements may restrict the ability of healthcare professionals to provide services abroad through mode 4. Despite these challenges, the participant indicated that medical services are still tradable through mode 2. One participant expressed the view that facilitating the entry of foreign producers and consumers into the United States would increase access to medical services, boost employment, and facilitate mode 2 services trade in other industries like tourism.

Recent Trends in U.S. Services Trade: 2018 Annual Report
120 | www.usitc.gov

U.S. International Trade Commission | 121
Appendix A Summary of Selected Services Research

Recent Trends in U.S. Services Trade: 2018 Annual Report
122 | www.usitc.gov
Appendix A: Summary of Selected Services Research
United States International Trade Commission, Office Of Operations, Office Of Industries, Services Division | 123
Selected Services Research This appendix provides summaries and links to recent U. S. International Trade Commission reports that feature topics in services trade, and lists several forthcoming Commission reports that include information on the services sector. Services-related reports and investigations were prepared under section 332(g) of the Tariff Act of 1930 (19 U.S.C. § 1332(g)) in response to requests from the U.S. Trade Representative, the U.S. House of Representatives Committee on Ways and Means, and/or the U.S. Senate Committee on Finance. Executive Briefings on Trade, articles in the Journal of International Commerce and Economics, and other staff publications and working papers reflect the opinions and research of individual authors and are not the views of the U.S. International Trade Commission or any of its Commissioners.
332 Investigations Global Digital Trade I : Market Opportunities and Key Foreign Trade Restrictions Investigation No. 332-561, September 2017
https://www.usitc.gov/sites/default/files/publications/332/pub4716_0.pdf
This report is the first of three on global digital trade to be prepared by the Commission during 2017–19, at the request of the U.S. Trade Representative (USTR). When the series is complete, the reports will describe developments in several areas—global business-to-business and business-to-consumer digital trade; the adoption of digital technology by different industries; and market conditions for U.S. companies in foreign markets, including regulations and policy measures related to digital trade that may impede those companies’ ability to compete.
Articles in the Journal of International Commerce and Economics "The Impact of Liberalizing International Trade in Professional Services" Tamar Khachaturian (Office of Industries) and David Riker (Office of Economics), May 2017
https://www.usitc.gov/sites/default/files/publications/332/journals/the_impact_of_liberalizing_international_trade_in_professional_services_khachaturian_riker.pdf
Recent Trends in U.S. Services Trade: 2018 Annual Report
124 | www.usitc.gov
The paper analyzes trade in services using an economic model which features multiple modes of supply and firm heterogeneity. The Commission authors calibrated the model to the U.S. markets for two types of professional services—architectural and engineering services, and legal services. They then estimated the economic impact of reducing fixed costs of supplying U.S. markets for these services through cross-border trade and, alternatively, through affiliate transactions. Among other results, the authors estimated that reducing the fixed costs of trade in these services by half would have large effects on the value of cross-border imports into the U.S. market and on foreign affiliate sales in the U.S. market. However, that reduction would have only small effects on the sales of domestic producers and on overall prices of the services in the U.S. market.
“The Impact of Trade and Technology on the U.S. Labor Market: Summary of USITC Roundtable Discussion” Joann Peterson (Office of Industries), August 2017
https://www.usitc.gov/sites/default/files/publications/332/journals/jice_labor_roundtable_summary_peterson_commission_draft_508_compliant.pdf
The Commission hosted its second labor roundtable on March 29, 2017. The roundtable facilitated an exchange of ideas among 30 participants representing academic institutions, government agencies, industry associations, international organizations, think tanks, and nonprofit organizations. The 2017 event focused on the role that trade plays in U.S. labor markets and mechanisms, with the aim of assessing the connection between trade and labor. Within this framework, participants discussed three broad topics: the influence of trade and technology on the U.S. labor market; worker displacement and the efficacy of worker retraining programs (including the Trade Adjustment Assistance program); and the impact of labor provisions in trade agreements on U.S. and global labor standards.

Appendix A: Summary of Selected Services Research
United States International Trade Commission, Office Of Operations, Office Of Industries, Services Division | 125
“An Overview of Customs Reforms to Facilitate Trade” Joann Peterson (Office of Industries), August 2017
https://www.usitc.gov/sites/default/files/publications/332/journals/jice_customsreformstofacilitatetradepeterson_508_compliant.pdf
The factors motivating customs reform in various countries are the focus of this article. In particular, it describes how certain customs practices have recently evolved in response to the globalization of manufacturing, just-in-time production processes, and the growth in e-commerce. Countries have undertaken several types of customs reform, including the use of online single-window systems to streamline customs paperwork and improve transparency; the adoption of “trusted trader” programs and risk assessment tools to speed customs clearance at border checkpoints; and efforts at harmonizing customs processing among regional trading partners. Guiding principles to improve customs efficiency were also agreed upon under the World Customs Organization’s Kyoto Convention and the World Trade Organization’s Trade Facilitation Agreement (TFA). This article outlines these developments and reviews work by the Organisation for Economic Co-operation and Development, the World Bank, and the World Economic Forum to benchmark countries’ progress in achieving customs reform, including implementing policy recommendations under the TFA.
“Does Trade Promote State Capacity in Ghana? A Synthetic Control” Jeremy Streatfeild (Office of Industries), March 2018
Can changes in trade volumes explain improvements in the capacity of African states to collect revenue and to provide public services? To study this relationship, the author argues that Ghana’s state capacity is stronger than it would have been otherwise, thanks to its recent trade growth. This research represents a departure from most economics literature on trade, which focuses on improvements to economic performance. Instead, it discusses an oft-overlooked aspect of trade—its impact on a state’s political economy. Identifying the roots of stronger African state capacity is an important objective, in light of a concern that African states, in their current form, may just limp along, hampered by their endowment of inhospitable geography. Improvements in a state’s capacity for governance mean it can better provide public goods, combat corruption, and attract private investment.
The findings presented in this paper not only are consistent with the hypothesis that trade growth has had a measurable impact on Ghana’s state capacity, but—using a synthetic

Recent Trends in U.S. Services Trade: 2018 Annual Report
126 | www.usitc.gov
control—show just how quickly that impact has arisen. Although the weakness of African states has received much attention, the findings in this paper suggest that capacity levels can be directly bolstered through trade-promotion policies.
Staff Publications and Working Papers “Do Non-Tariff Measures Make Domestic Firms More Profitable? Evidence from the Commercial Banking Sector” Sarah Oliver (Office of Industries), December 2017
https://www.usitc.gov/sites/default/files/publications/332/working_papers/ntms_and_commercial_banking_id_047_508_compliant.pdf
Using firm-level data from 78 country markets in 2012, this paper analyzes the relationship between the severity of nontariff measures related to the entry and operation of foreign firms and firm profitability in the commercial banking sector. It also differentiates the impact of these nontariff measures on foreign-owned and domestic firms. It finds a nonlinear relationship between the level of restrictions and the profitability of firms. Banks in countries with low levels of restriction are significantly more profitable than banks in countries with no restrictions, while banks in countries with moderate levels of restriction are less profitable than banks in countries with no restrictions. Additionally, foreign-owned firms are significantly more profitable than domestic firms when there are no restrictions on the entry and operation of foreign firms, but less profitable than domestically owned firms at both low and moderate levels of restriction.
“The Sub-Saharan African Services Economy: Insights and Trends” Jennifer Powell (Office of Industries), July 2017
https://www.usitc.gov/sites/default/files/publications/332/sub-saharan_african_id-17-046_final_071217sae.pdf
This staff report gives insights into the sub-Saharan African (SSA) services sector, describing its general characteristics and highlighting its distinctive qualities. This compilation of recent work does not present summary findings or a comprehensive overview of the region’s services sector, although a few broad themes emerge. For example, overall services output and trade in SSA, while small, are growing rapidly: in many individual SSA countries, services account for
Appendix A: Summary of Selected Services Research
United States International Trade Commission, Office Of Operations, Office Of Industries, Services Division | 127
more than half of total GDP. Nonetheless, several factors—including poor infrastructure and a lack of skilled workers—inhibit services sector expansion in the region.
The report begins with a brief overview of SSA services output, employment, and trade. This is followed by a discussion of issues affecting the SSA services sector as a whole, including the growth in Chinese investment and foreign aid in the region, the role of the informal sector in the SSA services economy, and measures affecting the foreign provision of services in SSA. The second section of the report focuses on trends in particular services industries, including architecture, engineering, and construction services; financial services (in particular, microinsurance); telecommunications (with special attention to the recent expansion of submarine cable infrastructure and mobile money); tourism; and transportation services (with an emphasis on transit corridors). The final section of the report gives overviews of service sector developments in a subgroup of SSA countries, including Botswana, Ethiopia, Ghana, Kenya, Mauritius, Nigeria, Rwanda, Senegal, South Africa, Tanzania, Togo, Uganda, and Zambia.

Recent Trends in U.S. Services Trade: 2018 Annual Report
128 | www.usitc.gov

U.S. International Trade Commission | 129
Appendix B Data Tables for Figures

Recent Trends U.S. Services Trade: 2018 Annual Report
130 | www.usitc.gov
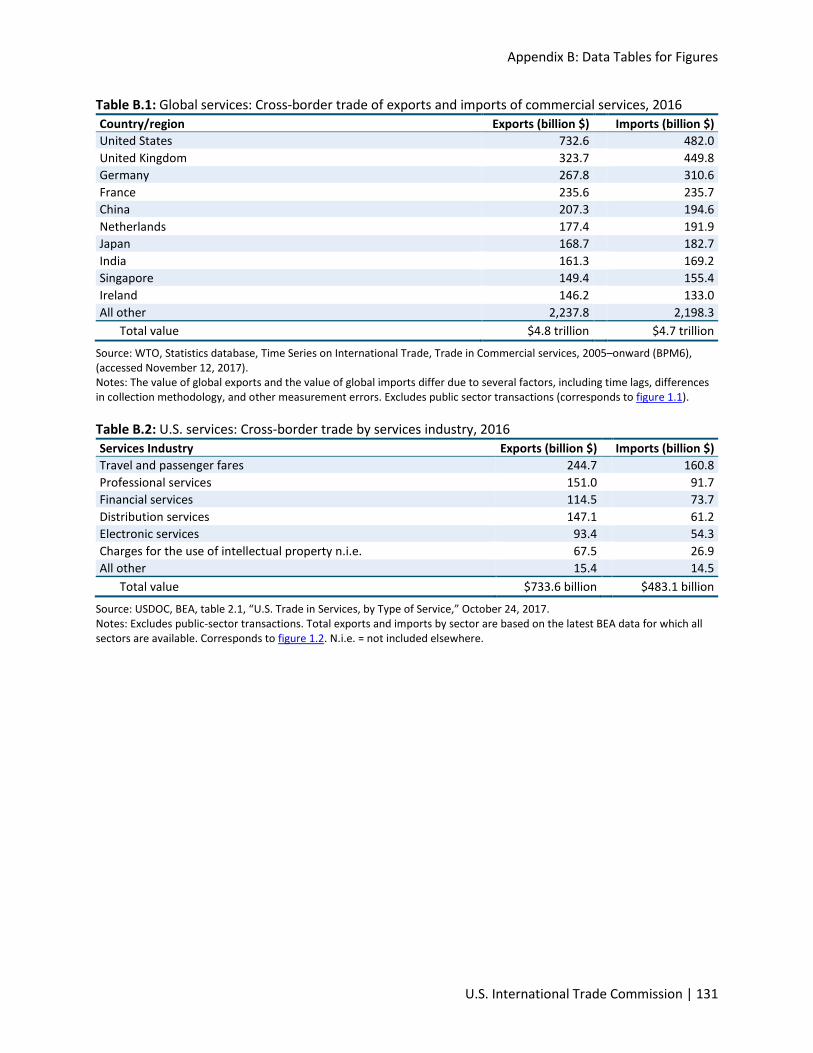
Appendix B: Data Tables for Figures
U.S. International Trade Commission | 131
Table B.1: Global services: Cross-border trade of exports and imports of commercial services, 2016 Country/region Exports (billion $) Imports (billion $) United States 732.6
482.0
United Kingdom 323.7
449.8 Germany 267.8
310.6
France 235.6
235.7 China 207.3
194.6
Netherlands 177.4
191.9 Japan 168.7
182.7
India 161.3
169.2 Singapore 149.4
155.4
Ireland 146.2
133.0 All other 2,237.8
2,198.3
Total value $4.8 trillion
$4.7 trillion
Source: WTO, Statistics database, Time Series on International Trade, Trade in Commercial services, 2005–onward (BPM6), (accessed November 12, 2017). Notes: The value of global exports and the value of global imports differ due to several factors, including time lags, differences in collection methodology, and other measurement errors. Excludes public sector transactions (corresponds to figure 1.1).
Table B.2: U.S. services: Cross-border trade by services industry, 2016 Services Industry Exports (billion $) Imports (billion $) Travel and passenger fares 244.7 160.8 Professional services 151.0 91.7 Financial services 114.5 73.7 Distribution services 147.1 61.2 Electronic services 93.4 54.3 Charges for the use of intellectual property n.i.e. 67.5 26.9 All other 15.4 14.5
Total value $733.6 billion
$483.1 billion
Source: USDOC, BEA, table 2.1, “U.S. Trade in Services, by Type of Service,” October 24, 2017. Notes: Excludes public-sector transactions. Total exports and imports by sector are based on the latest BEA data for which all sectors are available. Corresponds to figure 1.2. N.i.e. = not included elsewhere.
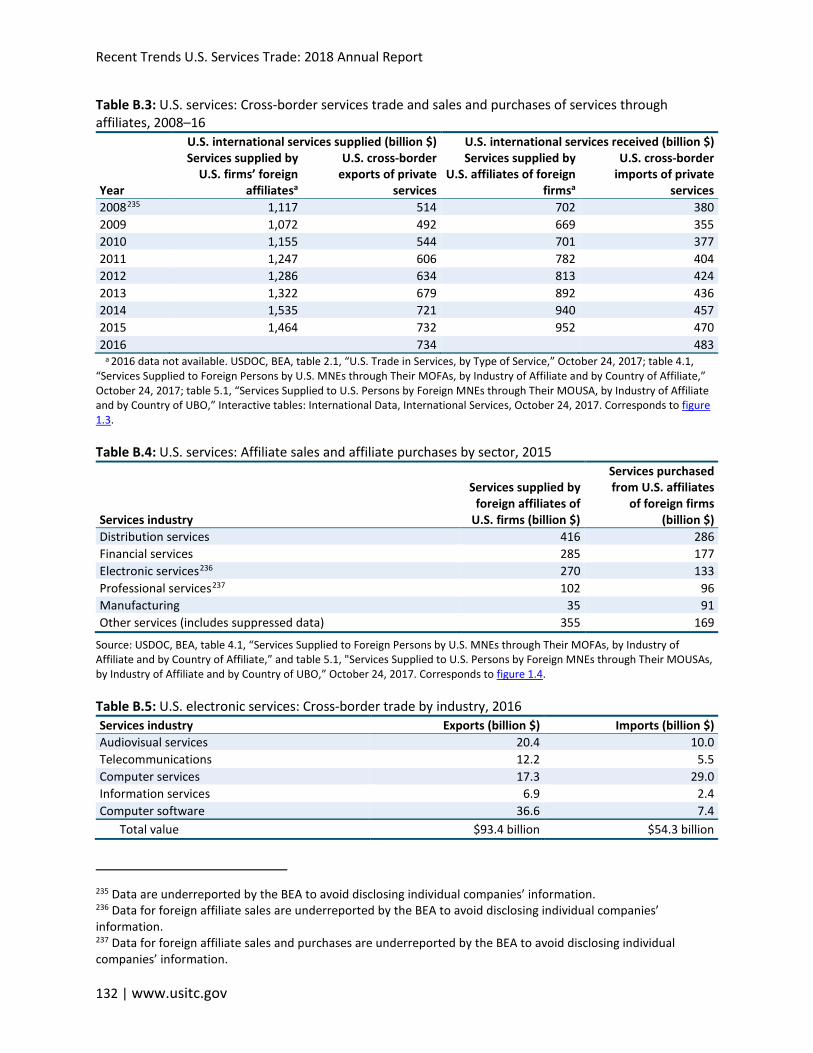
Recent Trends U.S. Services Trade: 2018 Annual Report
132 | www.usitc.gov
Table B.3: U.S. services: Cross-border services trade and sales and purchases of services through affiliates, 2008–16 U.S. international services supplied (billion $) U.S. international services received (billion $)
Year
Services supplied by U.S. firms’ foreign
affiliatesa
U.S. cross-border exports of private
services
Services supplied by U.S. affiliates of foreign
firmsa
U.S. cross-border imports of private
services 2008235 1,117 514 702 380 2009 1,072 492 669 355 2010 1,155 544 701 377 2011 1,247 606 782 404 2012 1,286 634 813 424 2013 1,322 679 892 436 2014 1,535 721 940 457 2015 1,464 732 952 470 2016 734 483
a 2016 data not available. USDOC, BEA, table 2.1, “U.S. Trade in Services, by Type of Service,” October 24, 2017; table 4.1, “Services Supplied to Foreign Persons by U.S. MNEs through Their MOFAs, by Industry of Affiliate and by Country of Affiliate,” October 24, 2017; table 5.1, “Services Supplied to U.S. Persons by Foreign MNEs through Their MOUSA, by Industry of Affiliate and by Country of UBO,” Interactive tables: International Data, International Services, October 24, 2017. Corresponds to figure 1.3.
Table B.4: U.S. services: Affiliate sales and affiliate purchases by sector, 2015
Services industry
Services supplied by foreign affiliates of
U.S. firms (billion $)
Services purchased from U.S. affiliates
of foreign firms (billion $)
Distribution services 416 286 Financial services 285 177 Electronic services236 270 133 Professional services237 102 96 Manufacturing 35 91 Other services (includes suppressed data) 355 169
Source: USDOC, BEA, table 4.1, “Services Supplied to Foreign Persons by U.S. MNEs through Their MOFAs, by Industry of Affiliate and by Country of Affiliate,” and table 5.1, "Services Supplied to U.S. Persons by Foreign MNEs through Their MOUSAs, by Industry of Affiliate and by Country of UBO,” October 24, 2017. Corresponds to figure 1.4.
Table B.5: U.S. electronic services: Cross-border trade by industry, 2016 Services industry Exports (billion $) Imports (billion $) Audiovisual services 20.4 10.0 Telecommunications 12.2 5.5 Computer services 17.3 29.0 Information services 6.9 2.4 Computer software 36.6 7.4
Total value $93.4 billion $54.3 billion
235 Data are underreported by the BEA to avoid disclosing individual companies’ information. 236 Data for foreign affiliate sales are underreported by the BEA to avoid disclosing individual companies’ information. 237 Data for foreign affiliate sales and purchases are underreported by the BEA to avoid disclosing individual companies’ information.

Appendix B: Data Tables for Figures
U.S. International Trade Commission | 133
Source: USDOC, BEA, table 2.1, “U.S. Trade in Services, by Type of Service,” October 24, 2017. Notes: Excludes public-sector transactions. Corresponds to figure 2.1.
Table B.6: U.S. electronic services: Affiliate sales and affiliate purchases by industry, 2015
Services industry U.S.-owned foreign
affiliate sales (billion $) Foreign-owned U.S. affiliate
purchases (billion $) Motion picture and sound recording industries238 12.3 4.9 Telecommunications 40.2 75.6 Broadcasting (except internet)239 18.5 0.2 Data processing, hosting, and related services240 17.2 1.1 Computer systems design and related services241 93.8 28.3 Other information services 75.1 18.2 Software publishers 71.8 4.4
Source: USDOC, BEA, table 4.1, “Services Supplied to Foreign Persons by U.S. MNEs through Their MOFAs, by Industry of Affiliate and by Country of Affiliate,” and table 5.1, "Services Supplied to U.S. Persons by Foreign MNEs through Their MOUSAs, by Industry of Affiliate and by Country of UBO,” October 24, 2017. Corresponds to figure 2.2.
Table B.7: Audiovisual services: U.S. cross-border trade, 2011–16 Year Exports (billion $) Imports (billion $) 2011 17.9 3.6 2012 18.7 5.5 2013 18.4 5.2 2014 19.8 7.5 2015 21.4 9.0 2016 20.4 10.0
Source: USDOC, BEA, International Data, International Services, table 2.2, "U.S. Trade in Services, by Type of Services and Country or Affiliation” (accessed November 17, 2017). Corresponds to figure 3.1.
Table B.8: Audiovisual services: U.S. cross-border trade by country, 2016 Country/region Exports (million $) Country/region Imports (million $) United Kingdom 4,468
United Kingdom 1,683
Canada 1,879
Brazil 1,364 Germany 1,459
Mexico 661
France 1,070
Canada 498 Brazil 1,013
Argentina 468
Other Europe 3,299
Other Europe 2,255 Asia-Pacific 4,876
Other Western Hemisphere 2,070
Other Western Hemisphere 1,887
Asia-Pacific 971 Africa and the Middle East 418
All other 53
Total value $20.4 billion
$10.0 billion
Source: USDOC, BEA, International Data, International Services, table 2.2, "U.S. Trade in Services, by Type of Services and Country or Affiliation” (accessed November 17, 2017). Corresponds to figure 3.2.
238 Data are underreported by the BEA to avoid disclosing individual companies’ information. 239 Data are underreported by the BEA to avoid disclosing individual companies’ information. 240 Data are underreported by the BEA to avoid disclosing individual companies’ information. 241 Includes ancillary services provided by goods manufacturers, such as computer hardware services.
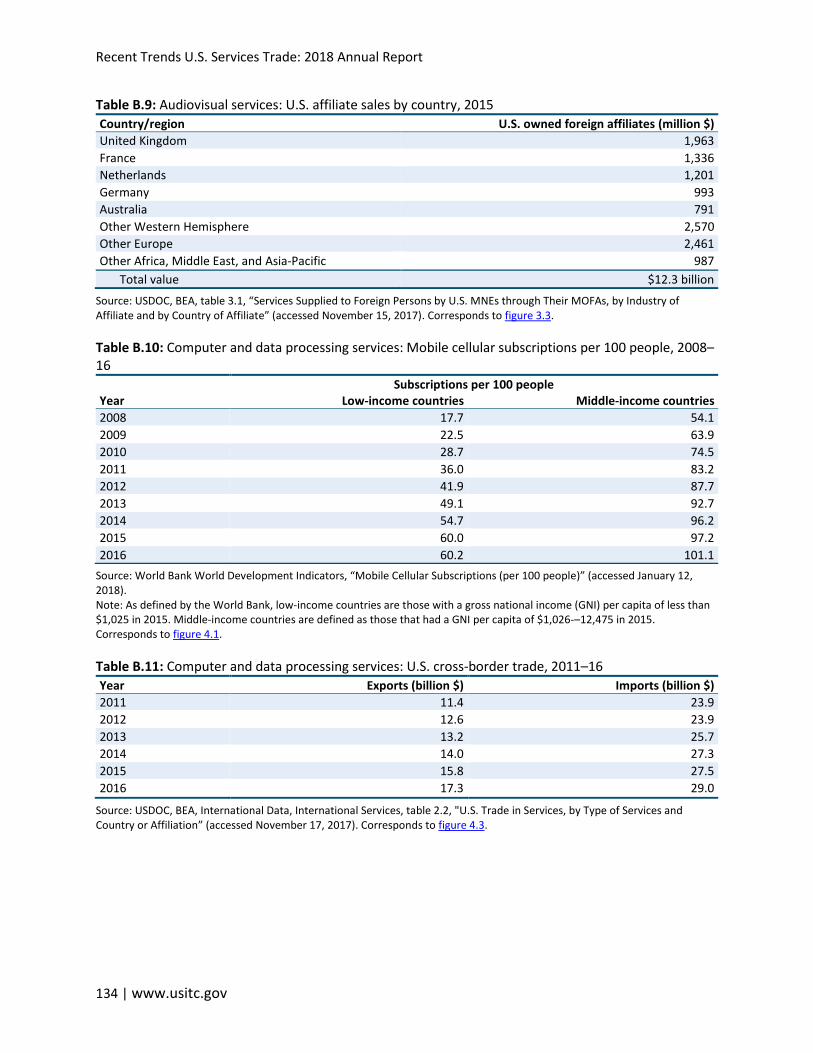
Recent Trends U.S. Services Trade: 2018 Annual Report
134 | www.usitc.gov
Table B.9: Audiovisual services: U.S. affiliate sales by country, 2015 Country/region U.S. owned foreign affiliates (million $) United Kingdom 1,963 France 1,336 Netherlands 1,201 Germany 993 Australia 791 Other Western Hemisphere 2,570 Other Europe 2,461 Other Africa, Middle East, and Asia-Pacific 987
Total value $12.3 billion Source: USDOC, BEA, table 3.1, “Services Supplied to Foreign Persons by U.S. MNEs through Their MOFAs, by Industry of Affiliate and by Country of Affiliate” (accessed November 15, 2017). Corresponds to figure 3.3.
Table B.10: Computer and data processing services: Mobile cellular subscriptions per 100 people, 2008–16 Subscriptions per 100 people Year Low-income countries Middle-income countries 2008 17.7 54.1 2009 22.5 63.9 2010 28.7 74.5 2011 36.0 83.2 2012 41.9 87.7 2013 49.1 92.7 2014 54.7 96.2 2015 60.0 97.2 2016 60.2 101.1
Source: World Bank World Development Indicators, “Mobile Cellular Subscriptions (per 100 people)” (accessed January 12, 2018). Note: As defined by the World Bank, low-income countries are those with a gross national income (GNI) per capita of less than $1,025 in 2015. Middle-income countries are defined as those that had a GNI per capita of $1,026-–12,475 in 2015. Corresponds to figure 4.1.
Table B.11: Computer and data processing services: U.S. cross-border trade, 2011–16 Year Exports (billion $) Imports (billion $) 2011 11.4 23.9 2012 12.6 23.9 2013 13.2 25.7 2014 14.0 27.3 2015 15.8 27.5 2016 17.3 29.0
Source: USDOC, BEA, International Data, International Services, table 2.2, "U.S. Trade in Services, by Type of Services and Country or Affiliation” (accessed November 17, 2017). Corresponds to figure 4.3.
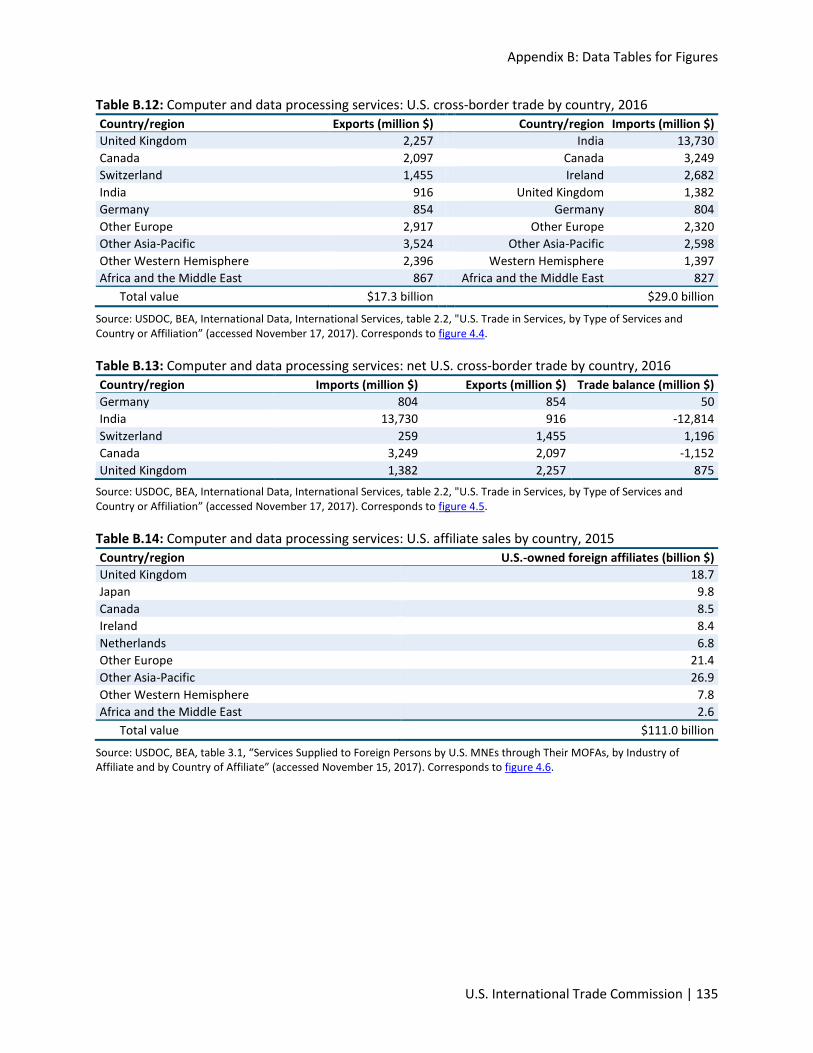
Appendix B: Data Tables for Figures
U.S. International Trade Commission | 135
Table B.12: Computer and data processing services: U.S. cross-border trade by country, 2016 Country/region Exports (million $) Country/region Imports (million $) United Kingdom 2,257
India 13,730
Canada 2,097
Canada 3,249 Switzerland 1,455
Ireland 2,682
India 916
United Kingdom 1,382 Germany 854
Germany 804
Other Europe 2,917
Other Europe 2,320 Other Asia-Pacific 3,524
Other Asia-Pacific 2,598
Other Western Hemisphere 2,396
Western Hemisphere 1,397 Africa and the Middle East 867
Africa and the Middle East 827
Total value $17.3 billion
$29.0 billion
Source: USDOC, BEA, International Data, International Services, table 2.2, "U.S. Trade in Services, by Type of Services and Country or Affiliation” (accessed November 17, 2017). Corresponds to figure 4.4.
Table B.13: Computer and data processing services: net U.S. cross-border trade by country, 2016 Country/region Imports (million $) Exports (million $) Trade balance (million $) Germany 804 854 50 India 13,730 916 -12,814 Switzerland 259 1,455 1,196 Canada 3,249 2,097 -1,152 United Kingdom 1,382 2,257 875
Source: USDOC, BEA, International Data, International Services, table 2.2, "U.S. Trade in Services, by Type of Services and Country or Affiliation” (accessed November 17, 2017). Corresponds to figure 4.5.
Table B.14: Computer and data processing services: U.S. affiliate sales by country, 2015 Country/region U.S.-owned foreign affiliates (billion $) United Kingdom 18.7 Japan 9.8 Canada 8.5 Ireland 8.4 Netherlands 6.8 Other Europe 21.4 Other Asia-Pacific 26.9 Other Western Hemisphere 7.8 Africa and the Middle East 2.6
Total value $111.0 billion
Source: USDOC, BEA, table 3.1, “Services Supplied to Foreign Persons by U.S. MNEs through Their MOFAs, by Industry of Affiliate and by Country of Affiliate” (accessed November 15, 2017). Corresponds to figure 4.6.
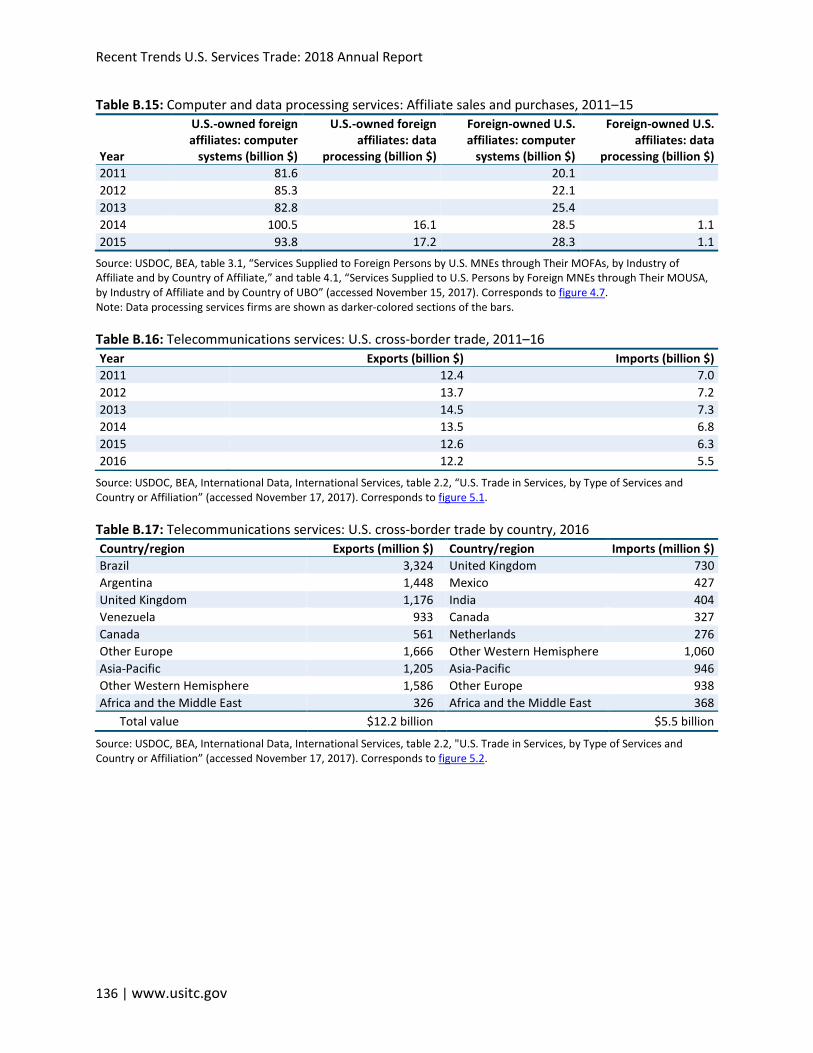
Recent Trends U.S. Services Trade: 2018 Annual Report
136 | www.usitc.gov
Table B.15: Computer and data processing services: Affiliate sales and purchases, 2011–15
Year
U.S.-owned foreign affiliates: computer
systems (billion $)
U.S.-owned foreign affiliates: data
processing (billion $)
Foreign-owned U.S. affiliates: computer
systems (billion $)
Foreign-owned U.S. affiliates: data
processing (billion $) 2011 81.6 20.1 2012 85.3 22.1 2013 82.8 25.4 2014 100.5 16.1 28.5 1.1 2015 93.8 17.2 28.3 1.1
Source: USDOC, BEA, table 3.1, “Services Supplied to Foreign Persons by U.S. MNEs through Their MOFAs, by Industry of Affiliate and by Country of Affiliate,” and table 4.1, “Services Supplied to U.S. Persons by Foreign MNEs through Their MOUSA, by Industry of Affiliate and by Country of UBO” (accessed November 15, 2017). Corresponds to figure 4.7. Note: Data processing services firms are shown as darker-colored sections of the bars.
Table B.16: Telecommunications services: U.S. cross-border trade, 2011–16 Year Exports (billion $) Imports (billion $) 2011 12.4 7.0 2012 13.7 7.2 2013 14.5 7.3 2014 13.5 6.8 2015 12.6 6.3 2016 12.2 5.5
Source: USDOC, BEA, International Data, International Services, table 2.2, “U.S. Trade in Services, by Type of Services and Country or Affiliation” (accessed November 17, 2017). Corresponds to figure 5.1.
Table B.17: Telecommunications services: U.S. cross-border trade by country, 2016 Country/region Exports (million $) Country/region Imports (million $) Brazil 3,324
United Kingdom 730
Argentina 1,448
Mexico 427 United Kingdom 1,176
India 404
Venezuela 933
Canada 327 Canada 561
Netherlands 276
Other Europe 1,666
Other Western Hemisphere 1,060 Asia-Pacific 1,205
Asia-Pacific 946
Other Western Hemisphere 1,586
Other Europe 938 Africa and the Middle East 326
Africa and the Middle East 368
Total value $12.2 billion
$5.5 billion
Source: USDOC, BEA, International Data, International Services, table 2.2, "U.S. Trade in Services, by Type of Services and Country or Affiliation” (accessed November 17, 2017). Corresponds to figure 5.2.


