24
This Time is Different MARK ZANDI, CHIEF ECONOMIST FROM MOODY’S ECONOMY.COM
| Date post: | 24-Dec-2015 |
| Category: |
Documents |
| Upload: | leslie-lee |
| View: | 219 times |
| Download: | 0 times |
This Time is DifferentMARK ZANDI, CHIEF ECONOMIST
FROM MOODY’S ECONOMY.COM

'12q4 '13q1 '13q2 '13q3 '13q4 '14q1 '14q2 '14q3 '14q4-2.0
-1.5
-1.0
-0.5
0.0
Other Tax and SpendingPayroll TaxSequester
Fiscal Headwinds Are Blowing Hard…Real GDP growth impact of fiscal austerity, percentage points
Source: Moody’s Analytics

'05 '06 '07 '08 '09 '10 '11 '12 '13F '14F '15F-6-5-4-3-2-1012345
Private EconomyFederal Fiscal PolicyTotal
…But Will Fade Next Year…
Source: Moody’s Analytics
Contribution to real GDP growth, %
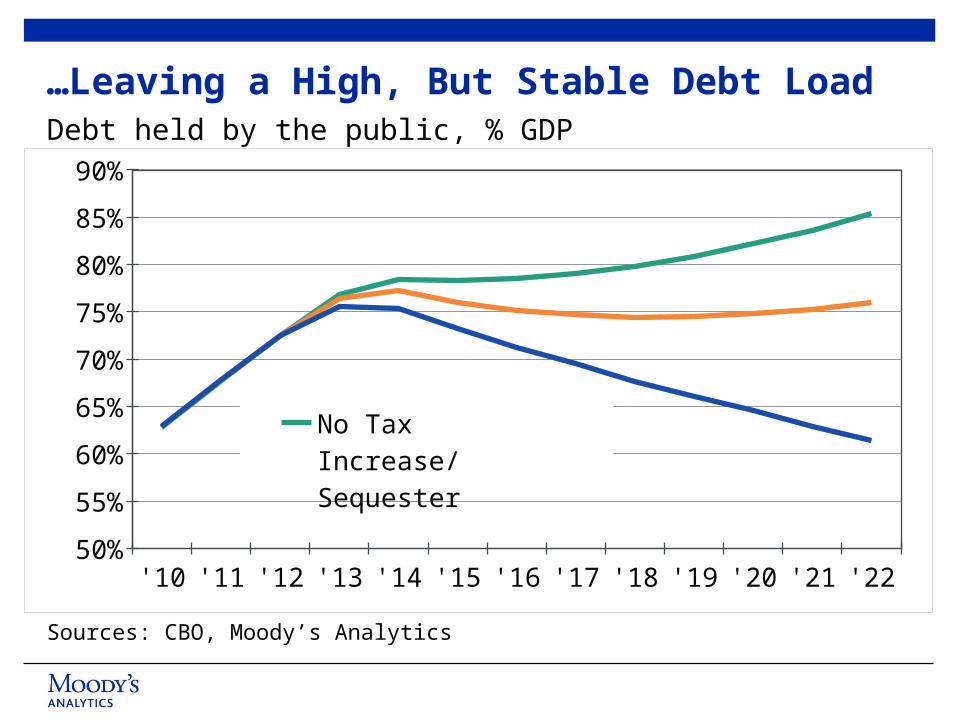
'10 '11 '12 '13 '14 '15 '16 '17 '18 '19 '20 '21 '2250%
55%
60%
65%
70%
75%
80%
85%
90%
No Tax Increase/SequesterCurrent PolicySimpson-Bowles
…Leaving a High, But Stable Debt LoadDebt held by the public, % GDP
Sources: CBO, Moody’s Analytics
'45
'46
'47
'48
'49
'50
'51
'52
'53
'54
'55
'56
'57
'58
'59
'60
'61
'62
'63
'64
'65
'66
'67
'68
'69
'70
'71
'72
'73
'74
'75
'76
'77
'78
'79
'80
'81
'82
'83
'84
'85
'86
'87
'88
'89
'90
'91
'92
'93
'94
'95
'96
'97
'98
'99
'00
'01
'02
'03
'04
'05
'06
'07
'08
'09
'10
'11
'12
6
8
10
12
14
16
18
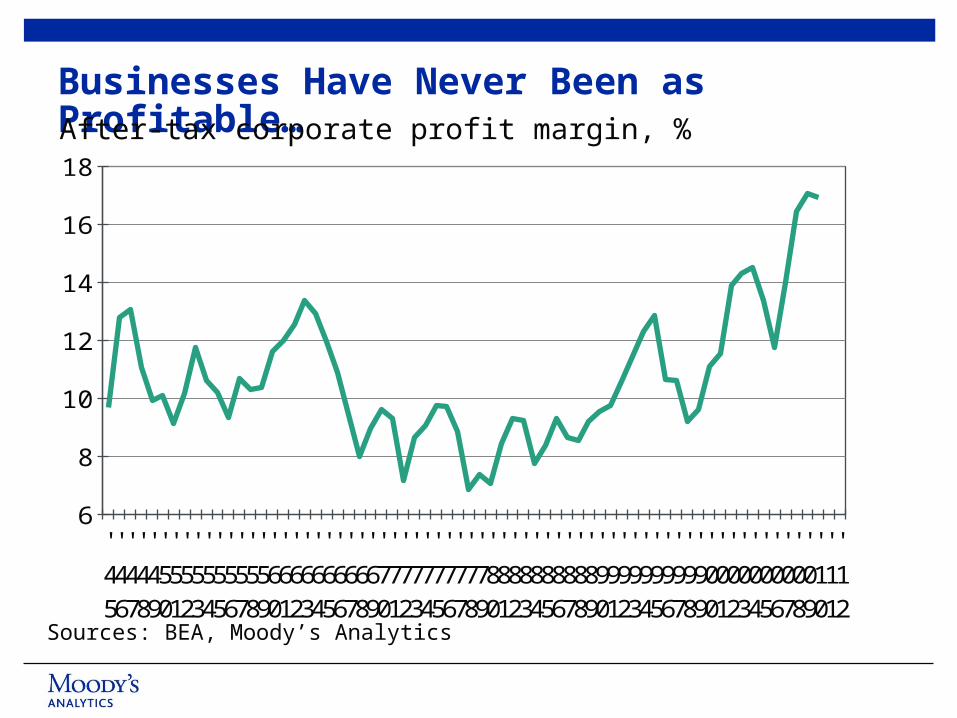
Businesses Have Never Been as Profitable…
Sources: BEA, Moody’s Analytics
After-tax corporate profit margin, %

8080:02:0080:03:0080:04:0081:01:0081:02:0081:03:0081:04:0082:01:0082:02:0082:03:0082:04:0083:01:0083:02:0083:03:0083:04:0084:01:0084:02:0084:03:0084:04:008585:02:0085:03:0085:04:0086:01:0086:02:0086:03:0086:04:0087:01:0087:02:0087:03:0087:04:0088:01:0088:02:0088:03:0088:04:0089:01:0089:02:0089:03:0089:04:009090:02:0090:03:0090:04:0091:01:0091:02:0091:03:0091:04:0092:01:0092:02:0092:03:0092:04:0093:01:0093:02:0093:03:0093:04:0094:01:0094:02:0094:03:0094:04:009595:02:0095:03:0095:04:0096:01:0096:02:0096:03:0096:04:0097:01:0097:02:0097:03:0097:04:0098:01:0098:02:0098:03:0098:04:0099:01:0099:02:0099:03:0099:04:000001020304050607080910'11'120
10
20
30
40
50
60
Interest coverage ratio
Quick ratio
…And Their Balance Sheets Are StrongNonfinancial corporate businesses
Sources: Federal Reserve, Moody’s Analytics
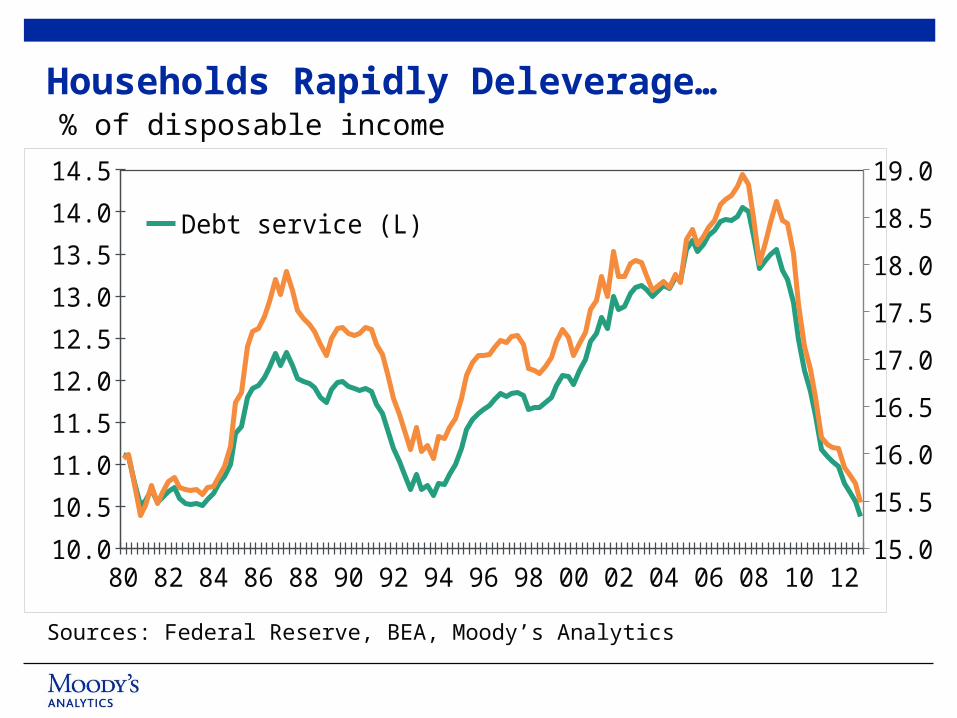
80 82 84 86 88 90 92 94 96 98 00 02 04 06 08 10 1210.0
10.5
11.0
11.5
12.0
12.5
13.0
13.5
14.0
14.5
15.0
15.5
16.0
16.5
17.0
17.5
18.0
18.5
19.0Debt service (L)Financial obligations (R)
Households Rapidly Deleverage… % of disposable income
Sources: Federal Reserve, BEA, Moody’s Analytics

'06
6-Feb
6-Mar
6-Apr
6-May
6-Jun
6-Jul
6-Aug
6-Sep
6-Oct
6-Nov
6-Dec
077-Feb
7-Mar
7-Apr
7-May
7-Jun
7-Jul
7-Aug
7-Sep
7-Oct
7-Nov
7-Dec
'08
8-Feb
8-Mar
8-Apr
8-May
8-Jun
8-Jul
8-Aug
8-Sep
8-Oct
8-Nov
8-Dec
'09
9-Feb
9-Mar
9-Apr
9-May
9-Jun
9-Jul
9-Aug
9-Sep
9-Oct
9-Nov
9-Dec
'10
10-Feb
10-Mar
10-Apr
10-May
10-Jun
10-Jul
10-Aug
10-Sep
10-Oct
10-Nov
10-Dec
'11
11-Feb
11-Mar
11-Apr
11-May
11-Jun
11-Jul
11-Aug
11-Sep
11-Oct
11-Nov
11-Dec
'12
12-Feb
12-Mar
12-Apr
12-May
12-Jun
12-Jul
12-Aug
12-Sep
12-Oct
12-Nov
12-Dec
'13
13-Feb
1.5
2.0
2.5
3.0
3.5
4.0
4.5
5.0
5.5Non First Mortgage
First Mortgage
30-90 Day Delinquency Rate, % of $, SA
Sources: Equifax, Moody’s Analytics
…And Right the Wrongs

'90
90:02:00
90:03:00
90:04:00
91:01:00
91:02:00
91:03:00
91:04:00
'92
92:02:00
92:03:00
92:04:00
93:01:00
93:02:00
93:03:00
93:04:00
'94
94:02:00
94:03:00
94:04:00
95:01:00
95:02:00
95:03:00
95:04:00
'96
96:02:00
96:03:00
96:04:00
97:01:00
97:02:00
97:03:00
97:04:00
'98
98:02:00
98:03:00
98:04:00
99:01:00
99:02:00
99:03:00
99:04:00
'00
0:02
0:03
0:04
1:01
1:02
1:03
1:04
'02
2:02
2:03
2:04
3:01
3:02
3:03
3:04
'04
4:02
4:03
4:04
5:01
5:02
5:03
5:04
'06
6:02
6:03
6:04
7:01
7:02
7:03
7:04
'08
8:02
8:03
8:04
9:01
9:02
9:03
9:04
'10
'11
'12
6.25
6.75
7.25
7.75
8.25
8.75
9.25
0.0
0.2
0.4
0.6
0.8
1.0
1.2
1.4
1.6
Core Capital Ratio (L)
Return on Assets (R )
Banks are Well Capitalized and More Profitable…Commercial banks
Source: FDIC
90Jan-00
Jan-00
Jan-00
Jan-00
91:02:00
91:03:00
91:04:00
9292:02:00
92:03:00
92:04:00
93:01:00
93:02:00
93:03:00
93:04:00
9494:02:00
94:03:00
94:04:00
95:01:00
95:02:00
95:03:00
95:04:00
9696:02:00
96:03:00
96:04:00
97:01:00
97:02:00
97:03:00
97:04:00
9898:02:00
98:03:00
98:04:00
99:01:00
99:02:00
99:03:00
99:04:00
000:02
0:03
0:04
1:01
1:02
1:03
1:04
022:02
2:03
2:04
3:01
3:02
3:03
3:04
044:02
4:03
4:04
5:01
5:02
5:03
5:04
066:02
6:03
6:04
7:01
7:02
7:03
7:04
088:02
8:03
8:04
9:01
9:02
9:03
9:04
1010:02
10:03
10:04
11
12
'13
-50
-40
-30
-20
-10
0
10
20
30
40
50
-80
-60
-40
-20
0
20
40
60
80
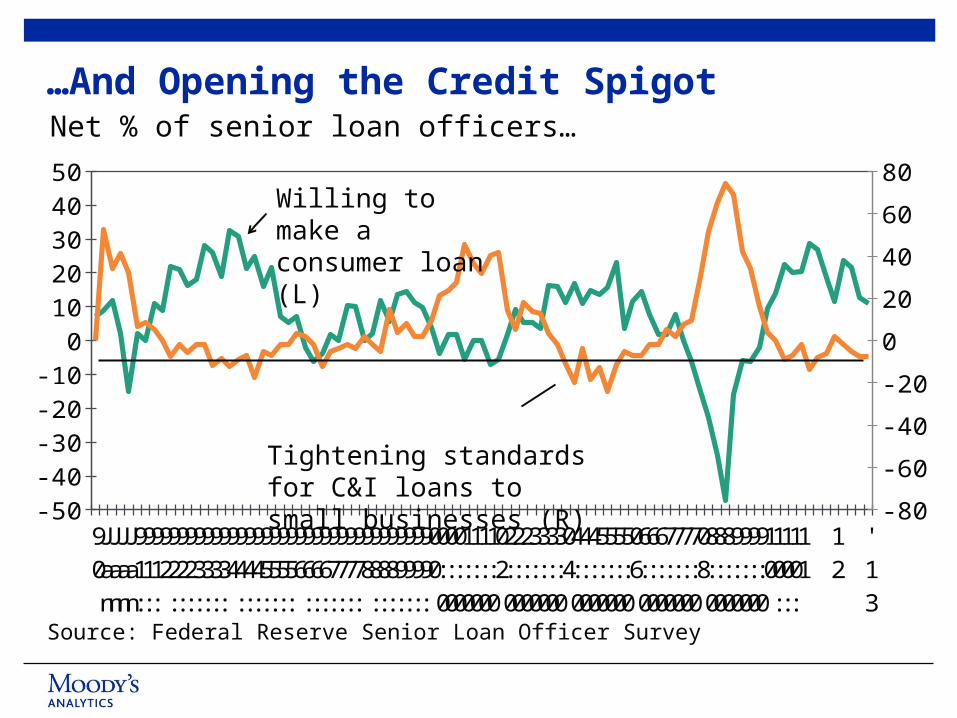
…And Opening the Credit Spigot
Source: Federal Reserve Senior Loan Officer Survey
Net % of senior loan officers…
Willing to make a consumer loan (L)
Tightening standards for C&I loans to small businesses (R)

90
91
92
93
94
95
96
97
98
99
00
01
02
03
04
05
06
07
08
09
10
11
12
-20
-10
0
10
20
30
40
50
60
Fairly valued
Housing Is Fairly Valued…
Sources: PPR, BEA, Census Bureau, Fiserv, Moody’s Analytics
% over- or undervalued

9090909091919191929292929393939394949494959595959696969697979797989898989999999900000000010101010202020203030303040404040505050506060606070707070808080809090909101010101111111112121212
5,500
6,500
7,500
8,500
9,500
10,500
11,500
Trend Vacancy
Sources: Census, Moody’s Analytics
Vacant homes for sale, for rent and held off market, ths
…And Will Soon Be Undersupplied…
Housing Supply 950,000 Single-family 600,000 Multifamily 300,000 Manufactured Housing 50,000
Housing Demand 1,800,000 Household Formations 1,250,000 Obsolescence 350,000 Second Homes 200,000

…Fueling a Big Turn in Housing’s Contribution…
96 97 98 99 00 01 02 03 04 05 06 07 08 09 10 11 12 13 14 15-2.5
-2.0
-1.5
-1.0
-0.5
0.0
0.5
1.0
1.5
Housing wealth effectResidential investmentTotal
Source: Moody’s Analytics
Contribution to real GDP growth, %

'05
5-Feb
5-Mar
5-Apr
5-May
5-Jun
5-Jul
5-Aug
5-Sep
5-Oct
5-Nov
5-Dec
'06
6-Feb
6-Mar
6-Apr
6-May
6-Jun
6-Jul
6-Aug
6-Sep
6-Oct
6-Nov
6-Dec
'07
7-Feb
7-Mar
7-Apr
7-May
7-Jun
7-Jul
7-Aug
7-Sep
7-Oct
7-Nov
7-Dec
'08
8-Feb
8-Mar
8-Apr
8-May
8-Jun
8-Jul
8-Aug
8-Sep
8-Oct
8-Nov
8-Dec
'09
9-Feb
9-Mar
9-Apr
9-May
9-Jun
9-Jul
9-Aug
9-Sep
9-Oct
9-Nov
9-Dec
'10
10-Feb
10-Mar
10-Apr
10-May
10-Jun
10-Jul
10-Aug
10-Sep
10-Oct
10-Nov
10-Dec
'11
11-Feb
11-Mar
11-Apr
11-May
11-Jun
11-Jul
11-Aug
11-Sep
11-Oct
11-Nov
11-Dec
'12
12-Feb
12-Mar
12-Apr
12-May
12-Jun
12-Jul
12-Aug
12-Sep
12-Oct
12-Nov
12-Dec
'13
13-Feb
6,000
6,500
7,000
7,500
8,000
8,500
9,000
9,500
122,000
124,000
126,000
128,000
130,000
Housing-Related (L)
Non Housing-Related (R )
…And More Job Growth
Source: Wall Street Journal, Moody’s Analytics
Millions of jobs

'96
'97
'98
'99
'00
'01
'02
'03
'04
'05
'06
'07
'08
'09
'10
'11
'12
8
10
12
14
16
18
20
-6
-4
-2
0
2
4
6
8
10
12
Units (L)Spent-up/pent-up demand (R)
Sources: BEA, Moody’s Analytics
Light vehicle sales, milPent-Up Demand Mounts
Trend sales
08394513945639461394643946939472394773948239485394903949339498395033950639511395143951939524395273953239535395403954539548395533955639561395663956939574395773958239587395903959539598396033960839611396163961939624396293963239637396403964539650396533965839661396663967139674396793968239687396923969539700397033970839713397163972139724397293973439737397423974539750397553975839763397663977139776397793978439787397923979739800398053980839813398183982139826398293983439839398423984739850398553986039863398683987139876398813988439889398923989739902399053991039913399183992339926399313993439939399443994739952399553996039965399683997339976399813998639989399943999740002400074001040015400184002340028400314003640039400444004940052400574006040065400704007340078400814008640091400944009940102401074011240115401204012340128401334013640141401444014940154401574016240165401704017540178401834018640191401964019940204402074021240217402204022540228402334023840241402464024940254402594026240267402704027540280402834028840291402964030140304403094031240317403224032540330403334033840343403464035140354403594036440367403724037540380403854038840393403964040140406404094041440417404224042740430404354043840443404484045140456404594046440469404724047740480404854049040493404984050140506405114051440519405224052740532405354054040543405481140556405614056440569405744057740582405854059040595405984060340606406114061640619406244062740632406374064040645406484065340658406614066640669406744067940682406874069040695407004070340708407114071640721407247/5/20117/8/20117/13/20117/18/20117/21/20117/26/20117/29/20118/3/20118/8/20118/11/20118/16/20118/19/20118/24/20118/29/20119/1/20119/6/20119/9/20119/14/20119/19/20119/22/20119/27/20119/30/201110/5/201110/10/201110/13/201110/18/201110/21/201110/26/201110/31/201111/3/201111/8/201111/11/201111/16/201111/21/201111/24/201111/29/201112/2/201112/7/201112/12/201112/15/201112/20/201112/23/2011121212121212121/26/20121/31/20122/3/20122/8/20122/13/20122/16/20122/21/20122/24/20122/29/20123/5/20123/8/20123/13/20123/16/20123/21/20123/26/20123/29/20124/3/20124/6/20124/11/20124/16/20124/19/20124/24/20124/27/20125/2/20125/7/20125/10/20125/15/20125/18/20125/23/20125/28/20125/31/20126/5/20126/8/20126/13/20126/18/20126/21/20126/26/20126/29/20127/4/20127/9/20127/12/20127/17/20127/20/20127/25/20127/30/20128/2/20128/7/20128/10/20128/15/20128/20/20128/23/20128/28/20128/31/20129/5/20129/10/20123.0
3.5
4.0
4.5
5.0
5.5
6.0
6.5
7.0
7.5
8.0
LTRO
LTRO
SMP
OTM
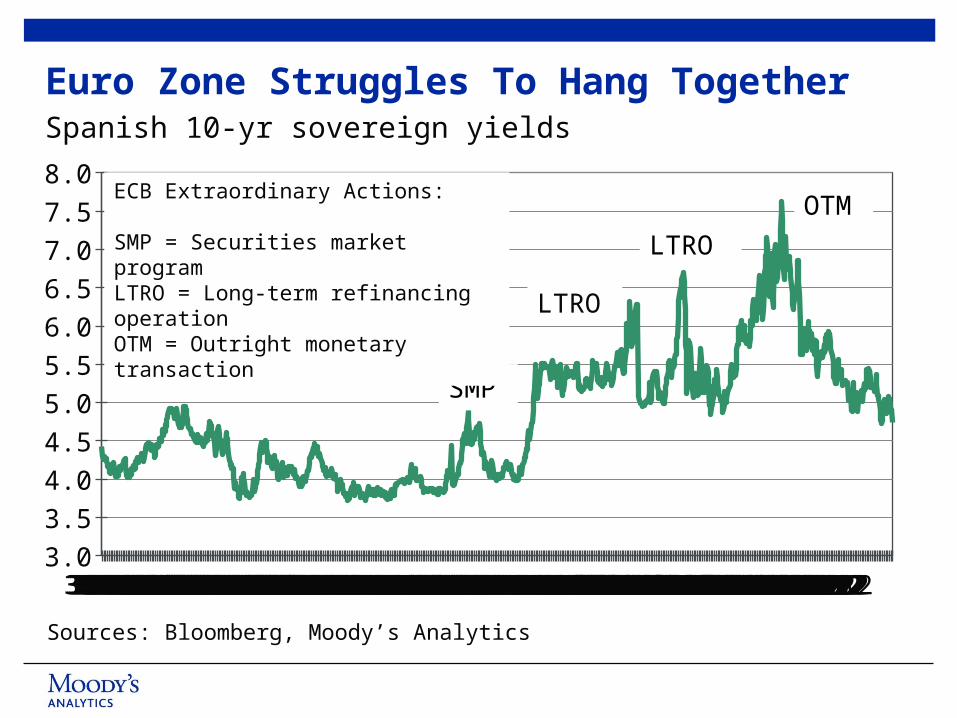
Sources: Bloomberg, Moody’s Analytics
Spanish 10-yr sovereign yields
Euro Zone Struggles To Hang Together
ECB Extraordinary Actions:
SMP = Securities market programLTRO = Long-term refinancing operationOTM = Outright monetary transaction
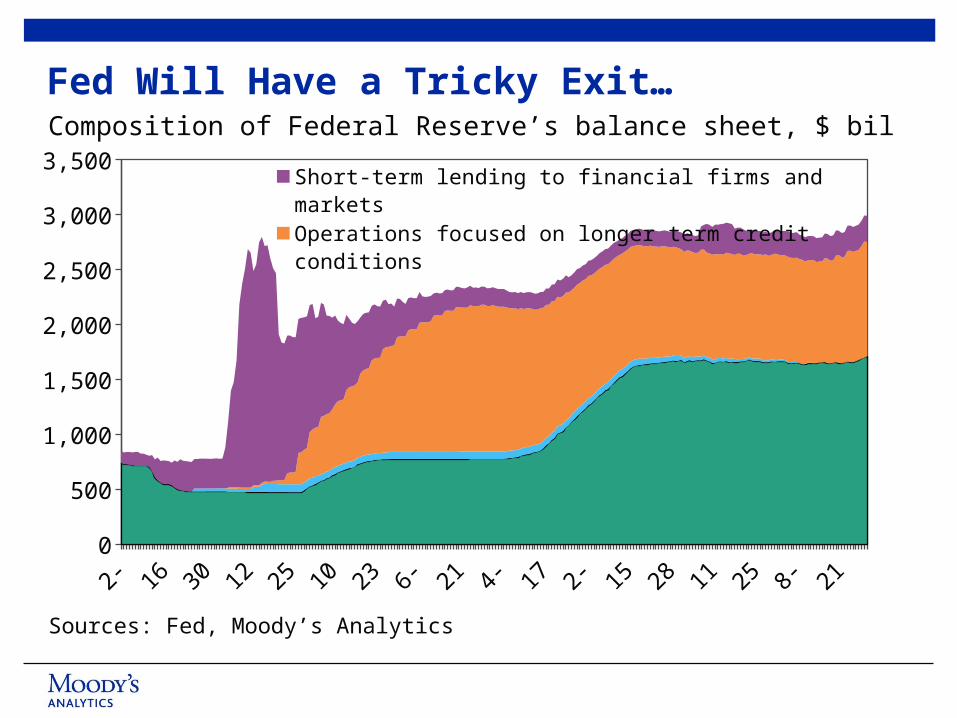
Fed Will Have a Tricky Exit…Composition of Federal Reserve’s balance sheet, $ bil
Sources: Fed, Moody’s Analytics
Jan-08 Jan-09 Jan-10 Jan-11 Jan-12 Jan-130
500
1,000
1,500
2,000
2,500
3,000
3,500Short-term lending to financial firms and marketsOperations focused on longer term credit conditionsRescue operationsTraditional portfolio

'6060:02:0060:03:0060:04:0061:01:0061:02:0061:03:0061:04:0062:01:0062:02:0062:03:0062:04:0063:01:0063:02:0063:03:0063:04:0064:01:0064:02:0064:03:0064:04:00'6565:02:0065:03:0065:04:0066:01:0066:02:0066:03:0066:04:0067:01:0067:02:0067:03:0067:04:0068:01:0068:02:0068:03:0068:04:0069:01:0069:02:0069:03:0069:04:00'7070:02:0070:03:0070:04:0071:01:0071:02:0071:03:0071:04:0072:01:0072:02:0072:03:0072:04:0073:01:0073:02:0073:03:0073:04:0074:01:0074:02:0074:03:0074:04:00'7575:02:0075:03:0075:04:0076:01:0076:02:0076:03:0076:04:0077:01:0077:02:0077:03:0077:04:0078:01:0078:02:0078:03:0078:04:0079:01:0079:02:0079:03:0079:04:00'8080:02:0080:03:0080:04:0081:01:0081:02:0081:03:0081:04:0082:01:0082:02:0082:03:0082:04:0083:01:0083:02:0083:03:0083:04:0084:01:0084:02:0084:03:0084:04:00'8585:02:0085:03:0085:04:0086:01:0086:02:0086:03:0086:04:0087:01:0087:02:0087:03:0087:04:0088:01:0088:02:0088:03:0088:04:0089:01:0089:02:0089:03:0089:04:00'9090:02:0090:03:0090:04:0091:01:0091:02:0091:03:0091:04:0092:01:0092:02:0092:03:0092:04:0093:01:0093:02:0093:03:0093:04:0094:01:0094:02:0094:03:0094:04:00'9595:02:0095:03:0095:04:0096:01:0096:02:0096:03:0096:04:0097:01:0097:02:0097:03:0097:04:0098:01:0098:02:0098:03:0098:04:0099:01:0099:02:0099:03:0099:04:00'000:020:030:041:011:021:031:042:012:022:032:043:013:023:033:044:014:024:034:04'055:025:035:046:016:026:036:047:017:027:037:048:018:028:038:049:019:029:039:04'1010:0210:0310:0411:0111:0211:0311:0412:0112:0212:03-3
-2
-1
0
1
2
3
4
…Given the Overvalued Bond Market…
Source: Treasury, BEA, Moody’s Analytics
Difference between 10-yr Treasury yield and potential GDP growth
Undervalued
Overvalued
'8585:02:0085:03:0085:04:0086:01:0086:02:0086:03:0086:04:0087:01:0087:02:0087:03:0087:04:0088:01:0088:02:0088:03:0088:04:0089:01:0089:02:0089:03:0089:04:00'9090:02:0090:03:0090:04:0091:01:0091:02:0091:03:0091:04:0092:01:0092:02:0092:03:0092:04:0093:01:0093:02:0093:03:0093:04:0094:01:0094:02:0094:03:0094:04:00'9595:02:0095:03:0095:04:0096:01:0096:02:0096:03:0096:04:0097:01:0097:02:0097:03:0097:04:0098:01:0098:02:0098:03:0098:04:0099:01:0099:02:0099:03:0099:04:00'000:02:000:03:000:04:001:01:001:02:001:03:001:04:002:01:002:02:002:03:002:04:003:01:003:02:003:03:003:04:004:01:004:02:004:03:004:04:00'055:02:005:03:005:04:006:01:006:02:006:03:006:04:007:01:007:02:007:03:007:04:008:01:008:02:008:03:008:04:009:01:009:02:009:03:009:04:00'1010:02:0010:03:0010:04:0011:01:0011:02:0011:03:0011:04:0012:01:0012:02:0012:03:0012:04:000
2
4
6
8
10
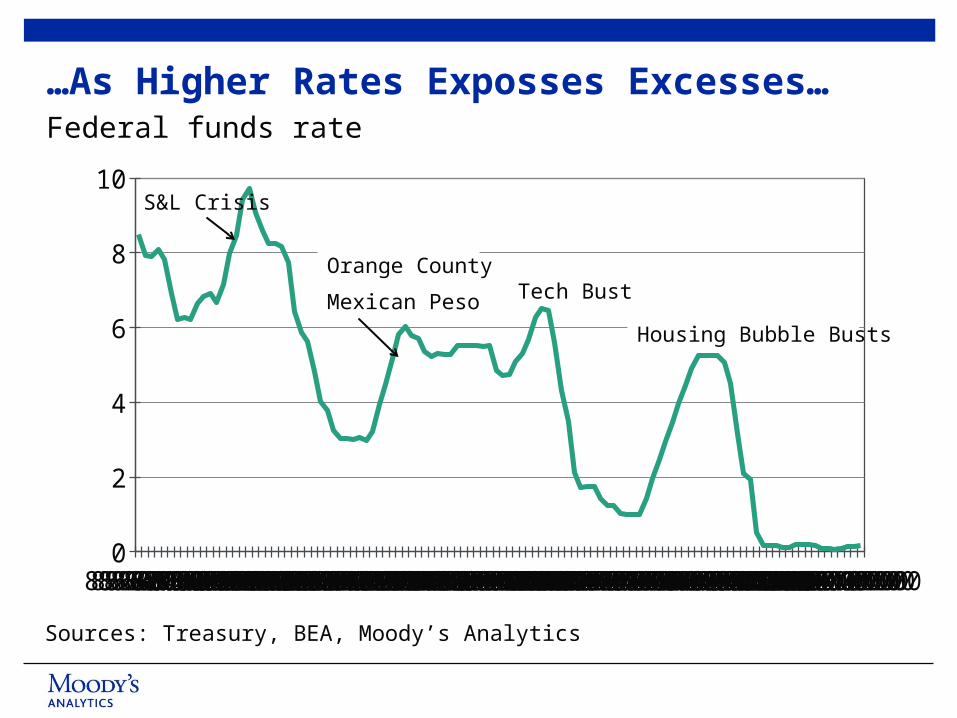
…As Higher Rates Exposses Excesses…
Sources: Treasury, BEA, Moody’s Analytics
Federal funds rate
S&L Crisis
Orange County
Mexican Peso Tech Bust
Housing Bubble Busts
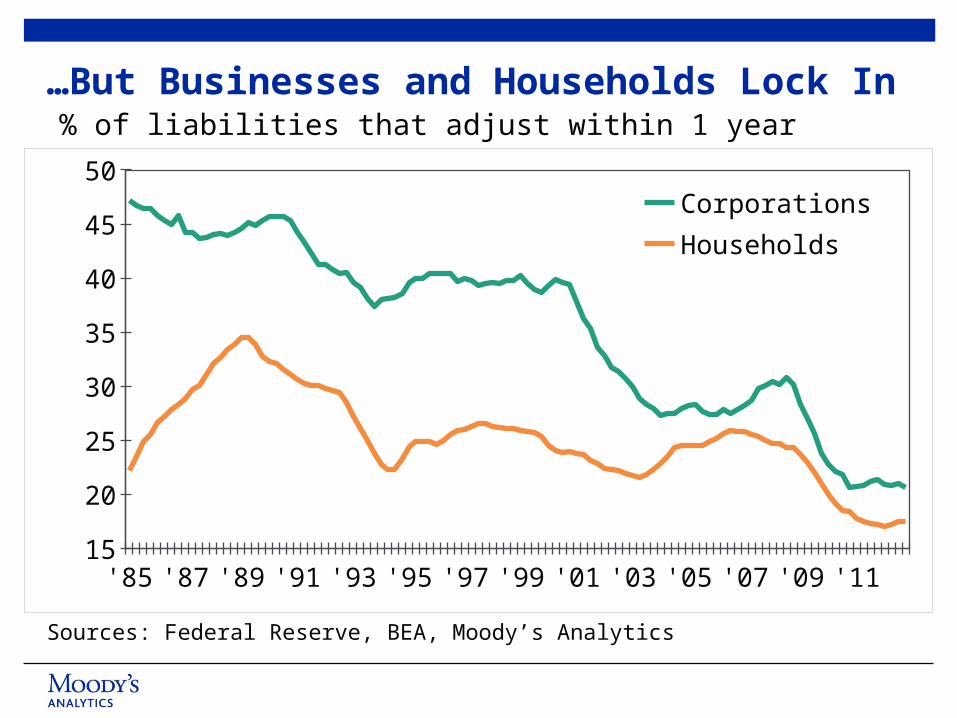
'85 '87 '89 '91 '93 '95 '97 '99 '01 '03 '05 '07 '09 '1115
20
25
30
35
40
45
50Corporations
Households
…But Businesses and Households Lock In % of liabilities that adjust within 1 year
Sources: Federal Reserve, BEA, Moody’s Analytics
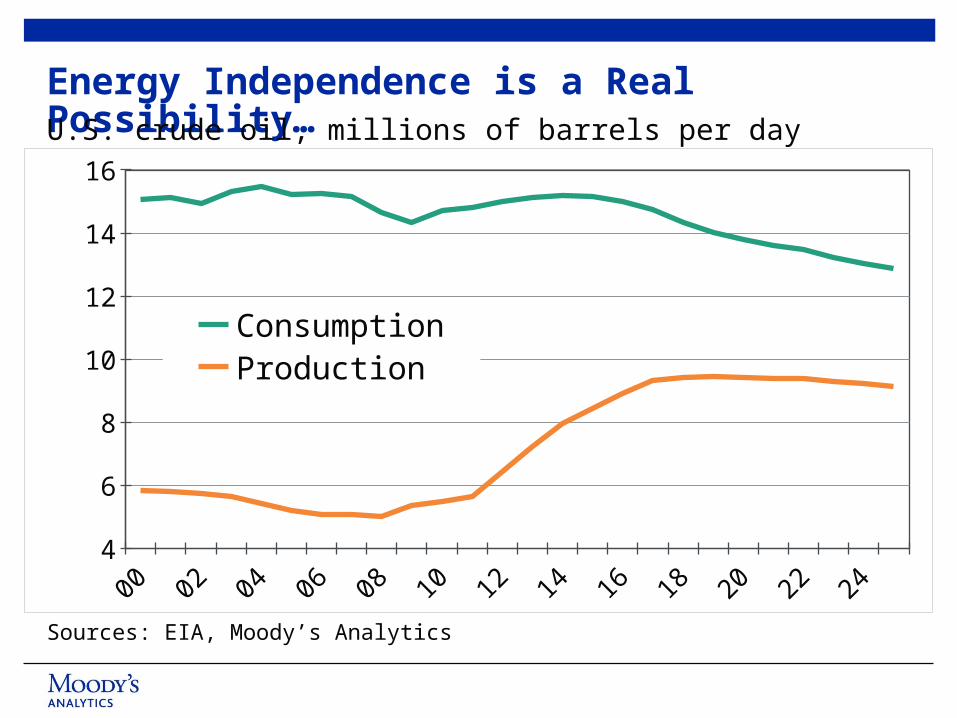
00010203040506070809101112131415161718192021222324254
6
8
10
12
14
16
ConsumptionProduction
Sources: EIA, Moody’s Analytics
Energy Independence is a Real Possibility…U.S. crude oil, millions of barrels per day
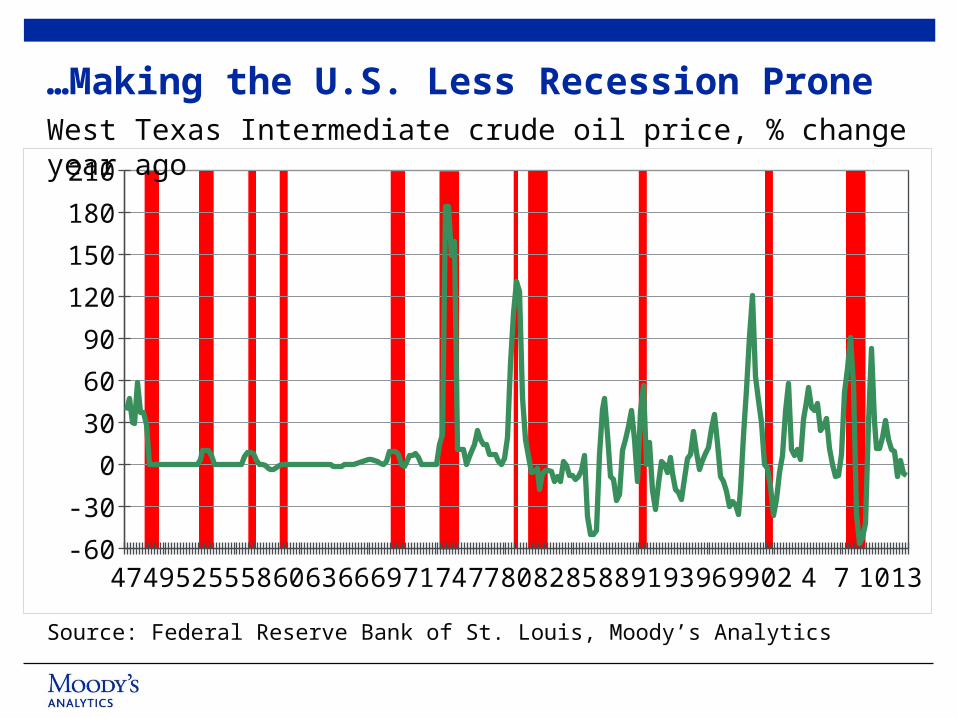
474952555860636669717477808285889193969902 4 7 1013-60
-30
0
30
60
90
120
150
180
210
…Making the U.S. Less Recession ProneWest Texas Intermediate crude oil price, % change year ago
Source: Federal Reserve Bank of St. Louis, Moody’s Analytics

www.economy.com121 North Walnut StreetSuite 500West Chester, PA 19380610.235.5299

2424
© 2012, Moody's Analytics, Inc. and/or its licensors and affiliates (together, "Moody's"). All rights reserved. ALL INFORMATION CONTAINED HEREIN IS PROTECTED BY COPYRIGHT LAW AND NONE OF SUCH INFORMATION MAY BE COPIED OR OTHERWISE REPRODUCED, REPACKAGED, FURTHER
TRANSMITTED, TRANSFERRED, DISSEMINATED, REDISTRIBUTED OR RESOLD, OR STORED FOR SUBSEQUENT USE FOR ANY PURPOSE, IN WHOLE OR IN PART, IN ANY FORM OR MANNER OR BY ANY MEANS WHATSOEVER, BY ANY PERSON WITHOUT MOODY'S PRIOR WRITTEN CONSENT. All
information contained herein is obtained by Moody's from sources believed by it to be accurate and reliable. Because of the possibility of human and mechanical error as well as other factors, however, all information contained herein is provided "AS IS" without warranty of any kind. Under no circumstances shall Moody's have any liability to any person or entity for (a) any loss or damage in whole or in part caused by, resulting from, or relating to, any error (negligent or otherwise)
or other circumstance or contingency within or outside the control of Moody's or any of its directors, officers, employees or agents in connection with the procurement, collection, compilation, analysis, interpretation, communication, publication or delivery of any such information, or (b) any direct, indirect, special,
consequential, compensatory or incidental damages whatsoever (including without limitation, lost profits), even if Moody's is advised in advance of the possibility of such damages, resulting from the use of or inability to use, any such information. The financial reporting, analysis, projections, observations, and other
information contained herein are, and must be construed solely as, statements of opinion and not statements of fact or recommendations to purchase, sell, or hold any securities. NO WARRANTY, EXPRESS OR IMPLIED, AS TO THE ACCURACY, TIMELINESS, COMPLETENESS, MERCHANTABILITY OR FITNESS
FOR ANY PARTICULAR PURPOSE OF ANY SUCH OPINION OR INFORMATION IS GIVEN OR MADE BY MOODY'S IN ANY FORM OR MANNER WHATSOEVER. Each opinion must be weighed solely as one factor in any investment decision made by or on behalf of any user of the information contained
herein, and each such user must accordingly make its own study and evaluation prior to investing.


