I I I NASA-TM-86383 NASA 1'1fe,Otf-l\VSCOM Technical Memorandum 86383 . . :: -' Background Noise From Jet Exit Vanes To Reduce Flow Pulsations in an Open-Jet Wind Tunnel . -.". , Danny R. Hoadand Ruth M. Martin JUNE 1985 "" ". L. "' .• <-' : -" .' NI\SI\ NF00566 https://ntrs.nasa.gov/search.jsp?R=19850019604 2018-06-02T07:20:28+00:00Z
Transcript
I I I
NASA-TM-86383
NASA Iq~500 1'1fe,Otf-l\VSCOM Technical Memorandum 86383 . T:hni~~~r;'{ft~l
. :: ~-~~.-'-:~'
-'
Background Noise Measl;tre.-n~~~~-:-<> From Jet Exit Vanes DesigtleCJ.~,"« To Reduce Flow Pulsations in an Open-Jet Wind Tunnel
Background Noise Measurements From Jet Exit Vanes Designed To Reduce Flow Pulsations in an Open-Jet Wind Tunnel
Danny R. Hoad
Structures Laboratory USAA VSCOM Research and Technology Laboratories Langley Research Center Hampton, Virginia
Ruth M. Martin
Langley Research Center Hampton, Virginia
NI\S/\ National Aeronautics and Space Administration
Scientific and Technical Information Branch
1985
SUMMARY
An experimental investigation has been conducted in the Langley 4- by 7-Meter Tunnel to evaluate the effect on tunnel background noise of a modification to the jet exit nozzle. This modification included the installation of triangular vanes around the perimeter of the open-jet nozzle and was aimed at reducing the flow pulsations typical of some open-jet wind tunnels. Although these vanes were effective in reducing flow pulsations, acoustic measurements in and out of the tunnel fl~w indicated that they generated significant high-frequency noise. The additional noise was attributed to the generation and shedding of vorticity by the vane structure.
During a subsequent test program, modifications were made to the vane structure in an attempt to reduce the additional background noise. The results of this test with these noise reduction modifications verified that the high-frequency noise levels could be greatly reduced without sacrificing the flow pulsation reduction benefits. The noise levels measured during this test were comparable to clear-tunnel background noise levels in this facility; however, the installation of these vanes in an acoustic tunnel may be of concern because the noise levels from the vanes could be well above the background levels in a quiet facility.
INTRODUCTION
Many open-jet wind tunnels experience a phenomenon often described as pumping, surging, or pulsations of the flow. These pulsations are typically characterized by periodic low-frequency velocity and pressure variations not only in the test section but throughout the tunnel circuit. These pulsations are probably created by the interaction of the unstable shear layer, formed at the jet exit, with acoustic waves radiating from the region of shear layer impingement on the flow collector. In some cases, the pUlsations have been of sufficiently large amplitude to affect the structural integrity of the facility and have limited the operational envelope of the facility. In the case of the Langley 4- by 7-Meter Tunnel, these pulsations in the open-tunnel configuration have resulted in a degradation of the flow quality. In the pulsating environment, measurements can be compromised because of the unsteadiness of the flow and the lack of stationarity in the experimental process.
Facility personnel have made rigorous attempts to reduce these pulsations or eliminate them altogether (refs. 1 and 2). These attempts have focused on modifications to both the jet exit and the collector at the entrance to the first diffuser. The jet exit modifications were designed to introduce random turbulence to disrupt the process of large-scale vortex creation at the jet exit. Results of the modifications to the jet exit are reported in reference 1. These results showed that several devices were effective in diminishing the pulsation content; however, because of their adverse effects on power requirements and tunnel potential-core size, efforts are continuing on modifications to the collector to accomplish similar results. Some of the most recent results of this work are presented in reference 2.
Since the facility is regularly used in the open-jet configuration for acoustic research, the issue of tunnel background noise was important. To address this issue, a test program was conducted to acoustically evaluate two of the most promising pulsation alleviation devices as described in reference 1; that is, triangular vanes.
SYMBOLS
f frequency, Hz
q test section dynamic pressure, 1/2 p(1.6878Voo )2, lb/ft2
SPL sound pressure level, dB re 20 ~Pa
SP~
u
'" u
X,Y,Z
x,y,z
w
p
normalized sound pressure level, SPL - 60 log V, dB re 20 ~Pa
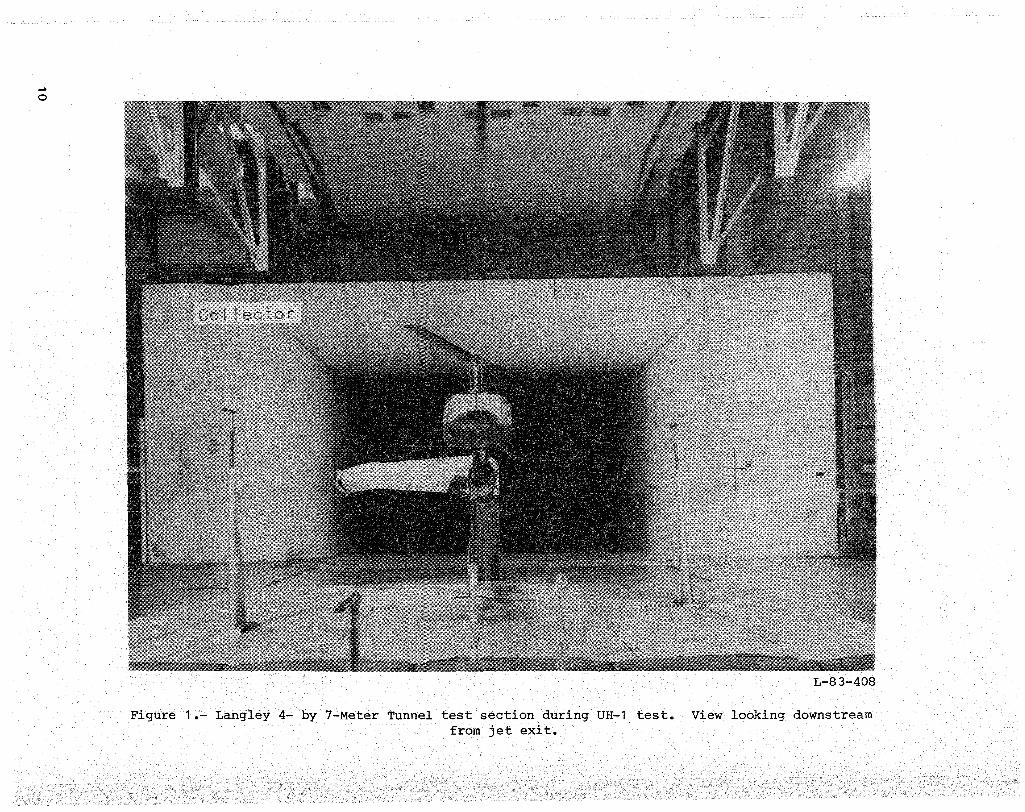
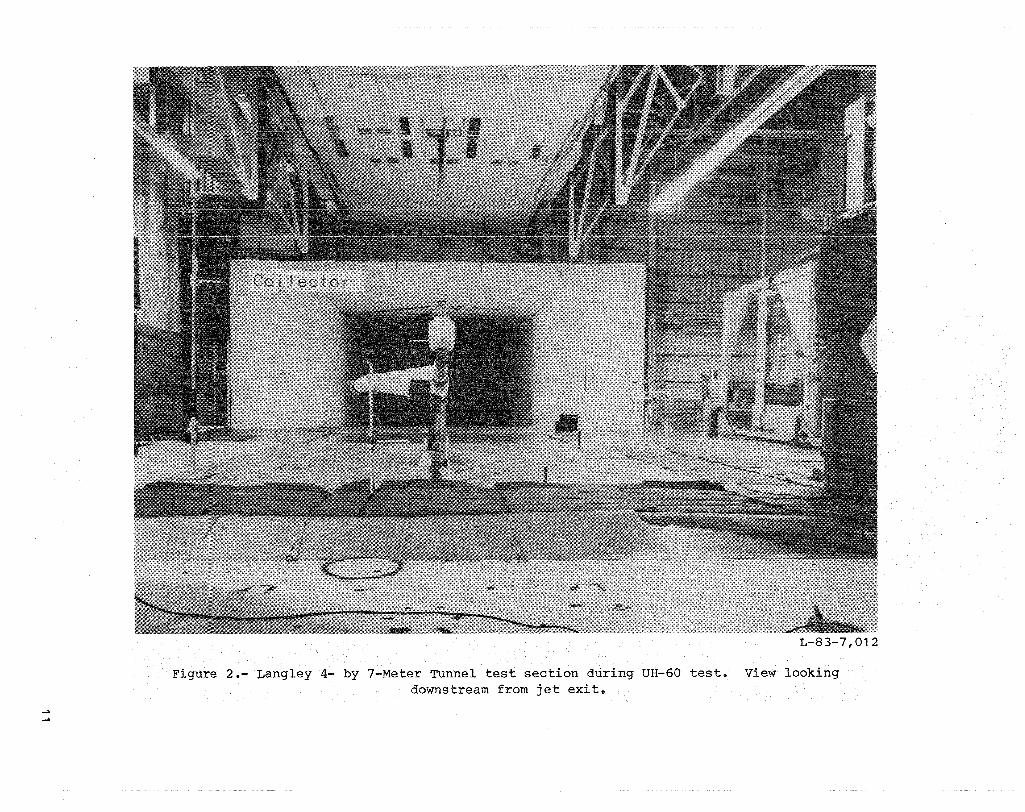
The Langley 4- by 7-Meter Tunnel is a closed-circuit atmospheric wind tunnel capable of test section velocities up to 200 knots. The test section walls and ceiling can be raised approximately 25 feet above the floor to allow an open-jet configuration on three sides. Most of the data presented in this report were collected during a test of a UH-1 helicopter (hereafter referred to as the UH-1 test), and some data were collected during a later program with a UH-60 helicopter (hereafter referred to as the UH-60 test). Figure 1 shows the facility in the open-jet configuration during the UH-1 test. The view is looking downstream from the jet exit toward the collector. The rotor model, sting, and various microphones located in the test section can be seen. Figure 2 shows the same view of the UH-60 test. Table I contains the coordinates of the pertinent microphone locations for the UH-1 and UH-60 test programs.
Jet Exit Nozzle Configurations
A total of six modifications to the jet exit configuration were aerodynamically evaluated in reference 1; however, only two of these six were selected for acoustic evaluation in this report. In addition, one other promising vane configuration not reported in reference" was selected. Those selected from reference 1, designated as configurations 5 and 6 in that report, will carry the same designations in this report. The third vane reported herein will be referred to as configuration 7.
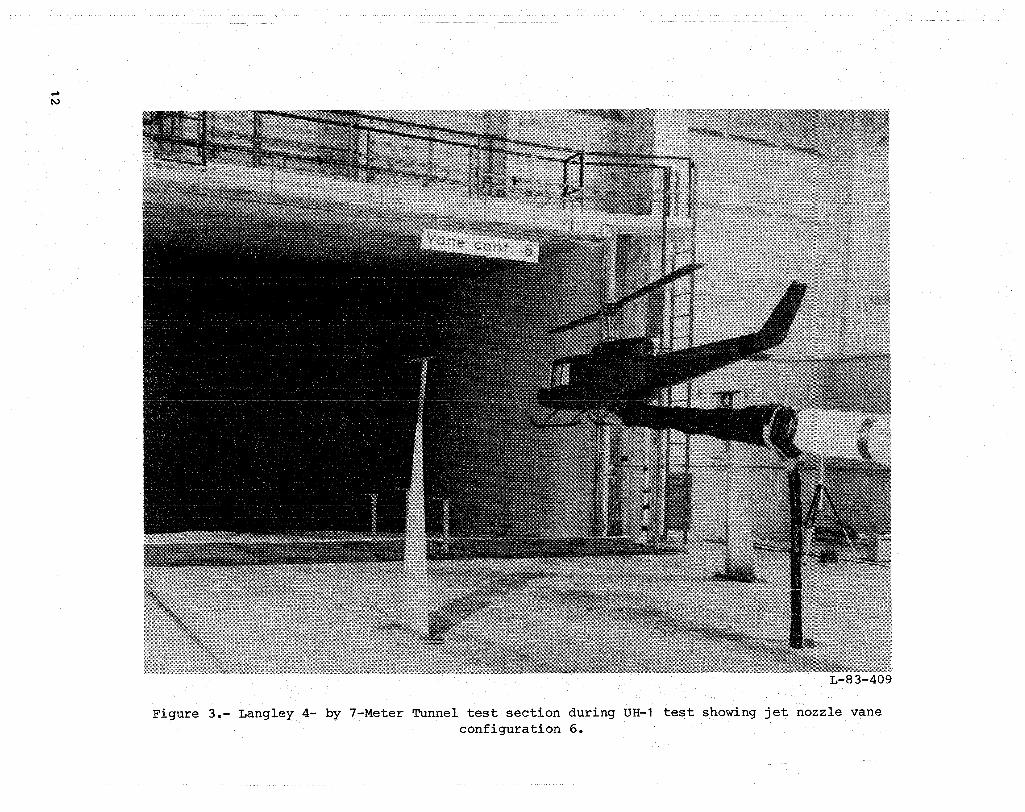
Figure 3 shows a photograph of the.test section during the UH-1 test as viewed from the collector looking upstream at the jet exit. Vane configuration 6 is shown
2
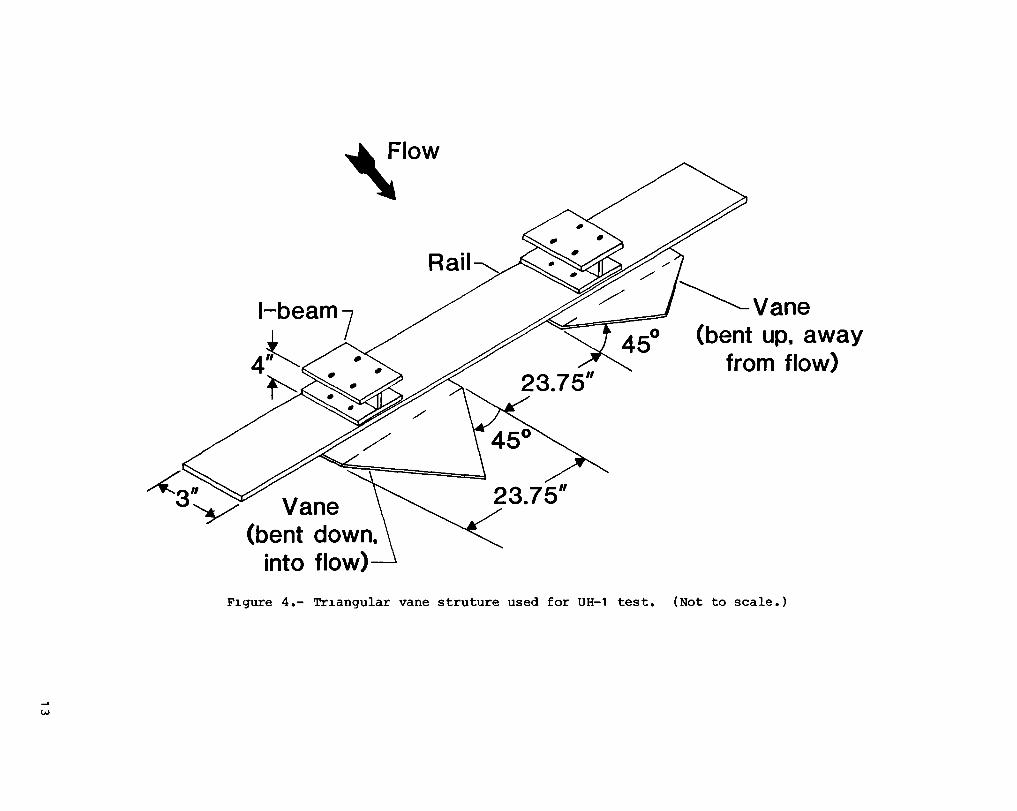
installed inside the lip of the nozzle exit. The vanes were mounted on lengths of 3-in-wide steel rail, which in turn were mounted to small sections of 4-in. steel I-beam. The entire assembly was mounted inside the nozzle, just upstream of the jet exit. The vanes were triangular in shape with a span of 23.75 in. and a chord of 5.7 in., and were bent to form a 45° flap. (See fig. 4.)
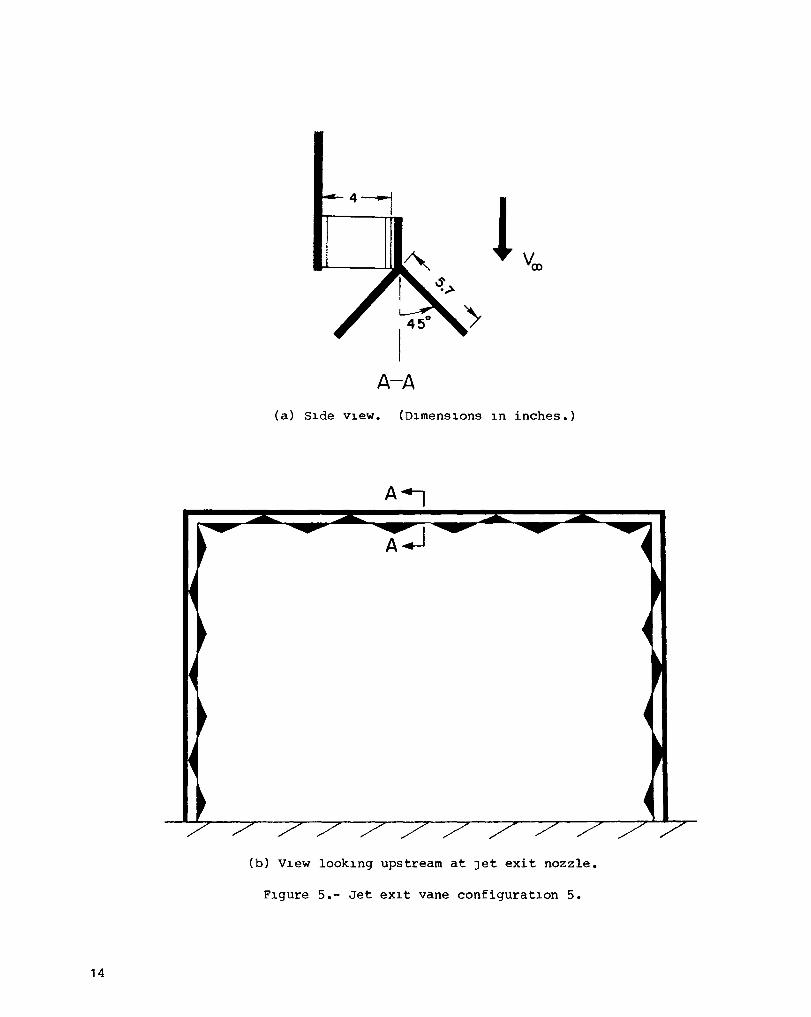
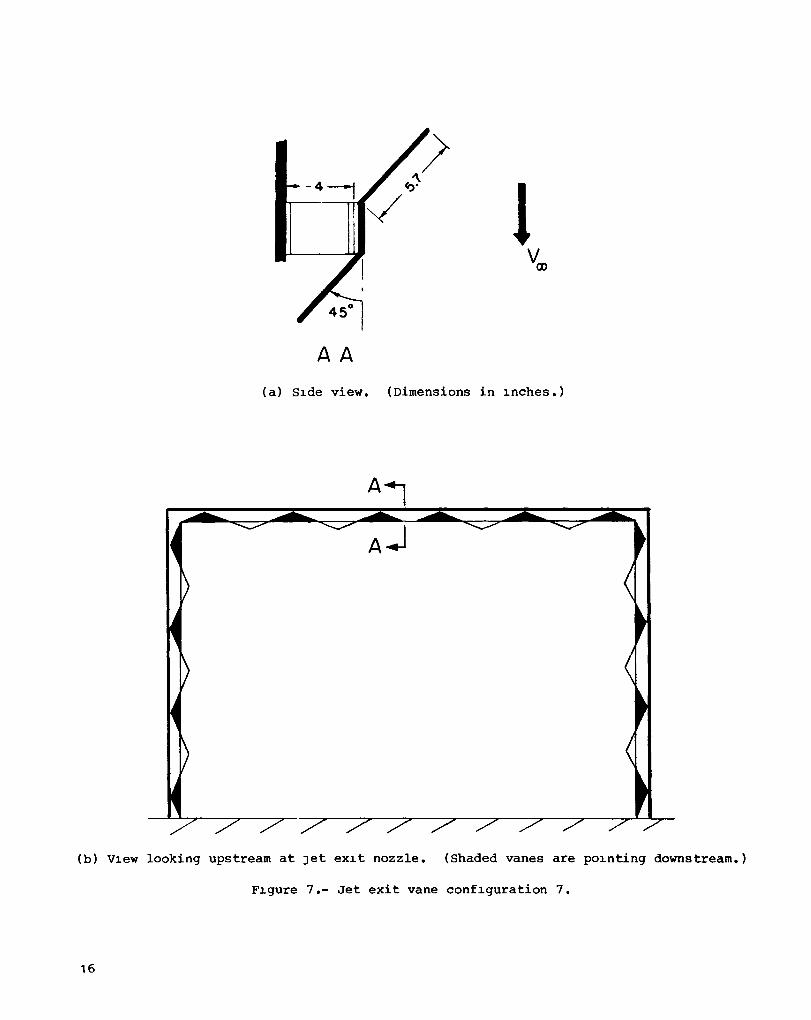
The vane configuration was varied by alternating the vanes into and out of the flow, selectively removing certain vanes, or pointing the vanes alternately upstream and downstream. Table II provides a summary of each configuration and a short description of the vane type and arrangement. Figures 5, 6, and 7 illustrate the three vane configurations.
Noise Reduction Modifications to Vanes
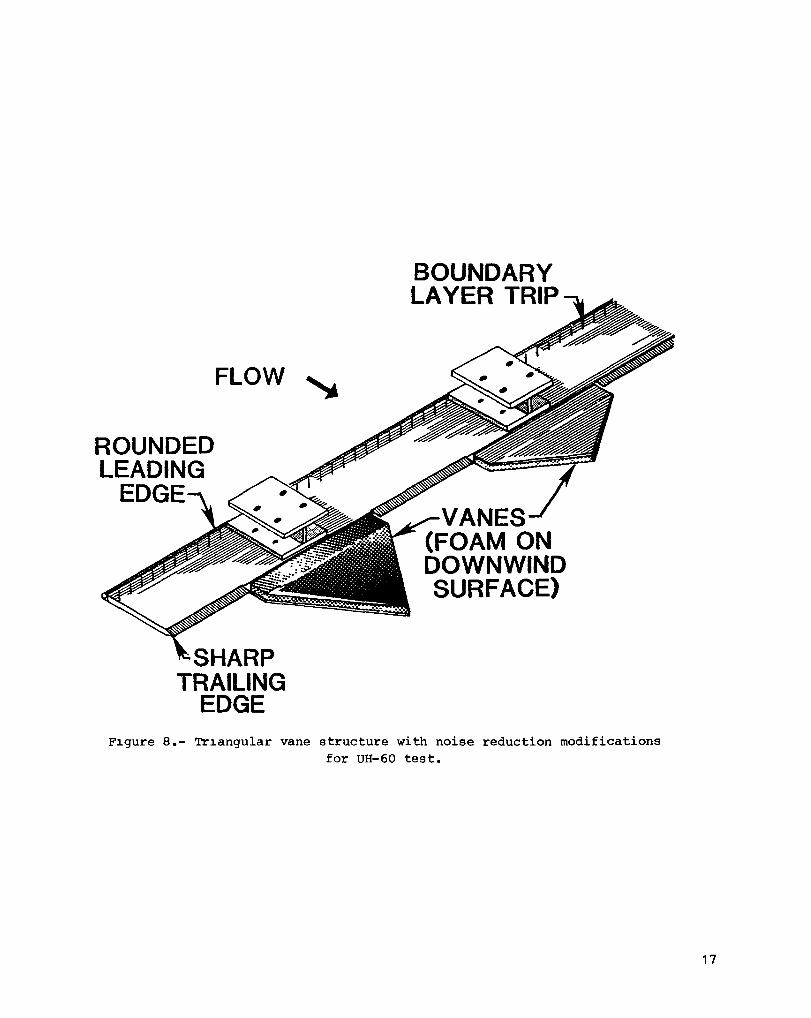
Several noise reduction modifications to the vane structure were implemented during the UH-60 test program. The modifications were made only to configuration 6, and are shown in figure 8. A thin layer of open-cell polyurethane foam was glued to the downwind surface of each vane. The foam was shaped to have a smooth junction with the structure near the leading edge and was approximately 1 in. thick at the trailing edge. This foam changed the noise source impedance characteristics and thus reduced the radiation efficiency. To make the structure more aerodynamically streamlined, sections of a wood dowel were attached to the blunt leading edge of the support rails to create a rounded leading edge, and slender triangular lengths of wood were attached to the rail trailing edge. All bolt holes, protruding hardware, and sharp corners or steps were filled or covered with clay to avoid cavity noise or "whistles." A boundary layer trip was applied near the leading edge of the steel rail to prevent the occurrence of the coherent vortex-shedding noise attributed to laminar boundary layers.
ACOUSTIC INSTRUMENTATION AND DATA REDUCTION
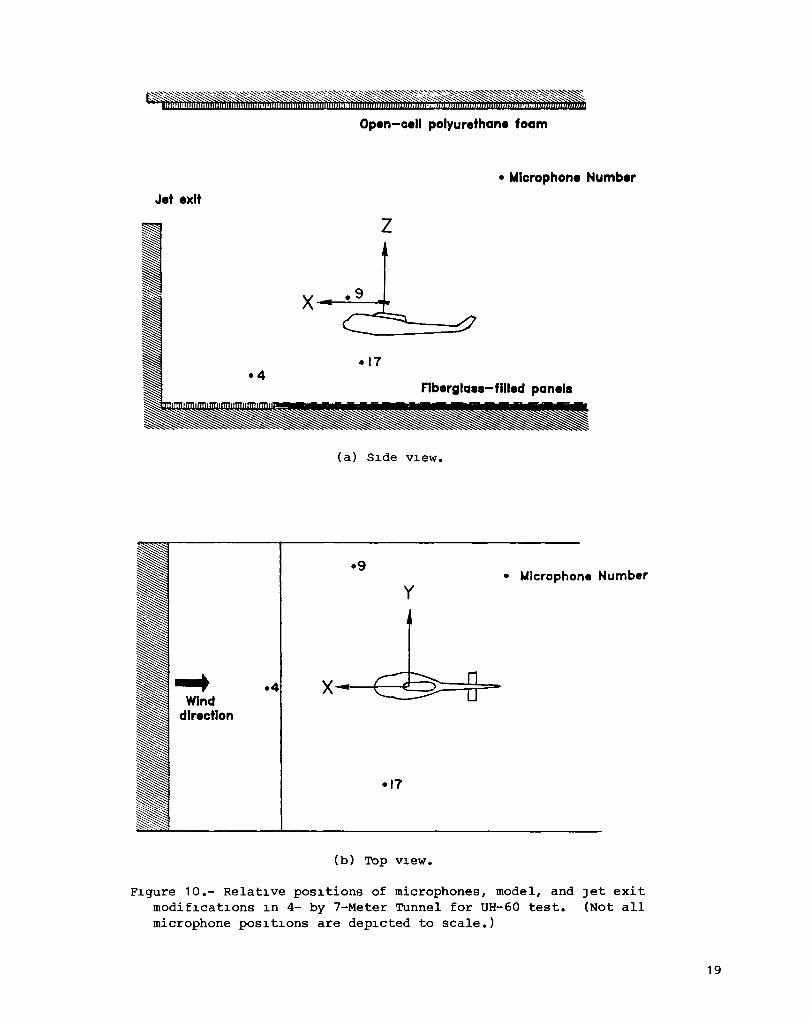
The acoustic transducers used for the measurements obtained in the UH-1 investigation were 0.50-in-diameter microphones, and those for the UH-60 test were 0.25-in. microphones. At the frequencies presented in this report, the microphone size difference created only negligible differences in noise measurements. Those microphones positioned outside the flow were fitted with standard wind screens, and those positioned inside the flow were fitted with standard nose cones. Microphone positions relative to the rotor hub (with the model positioned at 0° angle of attack) are presented in table I and are shown schematically in figures 9 and 10 (UH-1 and UH-60 tests, .respectively). Comparisons of acoustic data from the UH-1 and UH-60 tests will be made for comparable microphone locations.
The one-third-octave data presented in this report were obtained with a realtime analyzer at a digitizing speed of 80 000 samples per second. Samples of 1024 points were ensemble averaged for 2 sec to obtain the one-third-octave data. To obtain averaged narrowband spectra, the analog data tapes from both tests were digitized, calibrated, and stored on digital tape. The analog data were low-pass filtered at one-half the sampling rate to prevent aliasing in the digitizing process. Computer software was used to perform a fast Fourier transform (FFT) on 50 blocks of data and average the FFT results to obtain an average spectrum. This approach yielded an estimated accuracy of 0.8 to -0.7 dB in the calculated spectral levels with 80 percent confidence. The data from the UH-1 tests were digitized at approximately 44 000 samples per second. The FFT block size was 2048 data points, and the
3
resulting frequency resolution was 21.5 Hz. tized at approximately 100 000 samples per the frequency resolution was 24.4 Hz. The here have been corrected for bandwidth and
The data from the UH-60 test were digisecond. A 4096-point FFT was used, and narrowband data for both tests presented are referenced to a 21.5-Hz bandwidth.
PRESENTATION OF RESULTS
Dynamic-flow measurements from the baseline tunnel and vane configurations 5 and 6 were reported in detail in reference 1; therefore, only summary figures will be presented herein. Figure 11 presents the nondimensional root-mean-square (rms) of the longitudinal velocity fluctuations in the open test section as a function of the test section dynamic pressure for the baseline and three vane configurations. These data were obtained with no model installed and at a location nearly two-thirds of the distance from the jet exit to the collector. The baseline tunnel configuration exhibits periodic flow pulsations at three distinct ranges of dynamic pressure. All three vane configurations were effective in reducing the flow pulsation except at very low dynamic pressures.
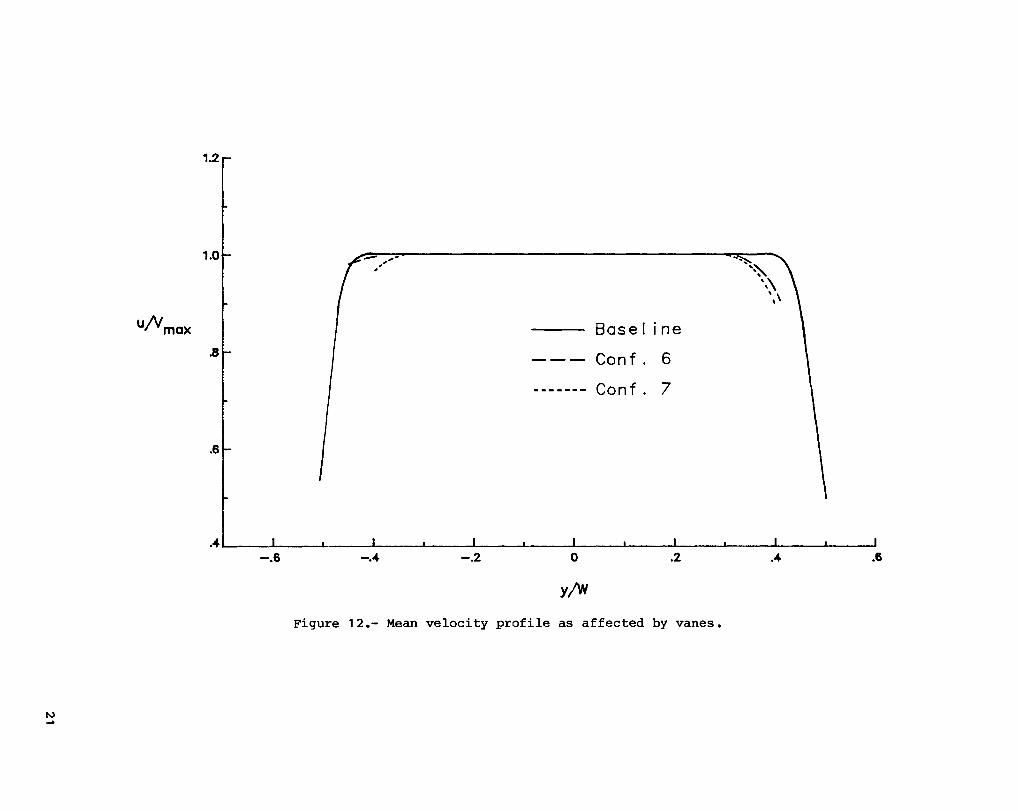
The vane configurations have been shown to be effective in reducing the flow pulsation problem; however, the penalties for their use can be substantial. A potential problem which exists with these vanes is that they can decrease the size of the uniform-velocity core in the open test section. Measurements of the mean velocity profile were obtained in the open test section at the model location (without the model, about one-quarter of the distance from the jet exit to the collector) and are presented in reference 2. (Velocity profile measurements were not obtained for configuration 5.) Figure 12 presents a fairing of these data in order to provide clarity. The information in figure 12 is presented as local mean velocity nondimensionalized by the maximum mean velocity as a function of lateral position in the test section. Configuration 6 had a lesser effect on the core size; furthermore, a comparison of figures 11 and 12 shows that the more effective a vane configuration is in reducing the pulsations, the more it will reduce the size of the uniform velocity core.
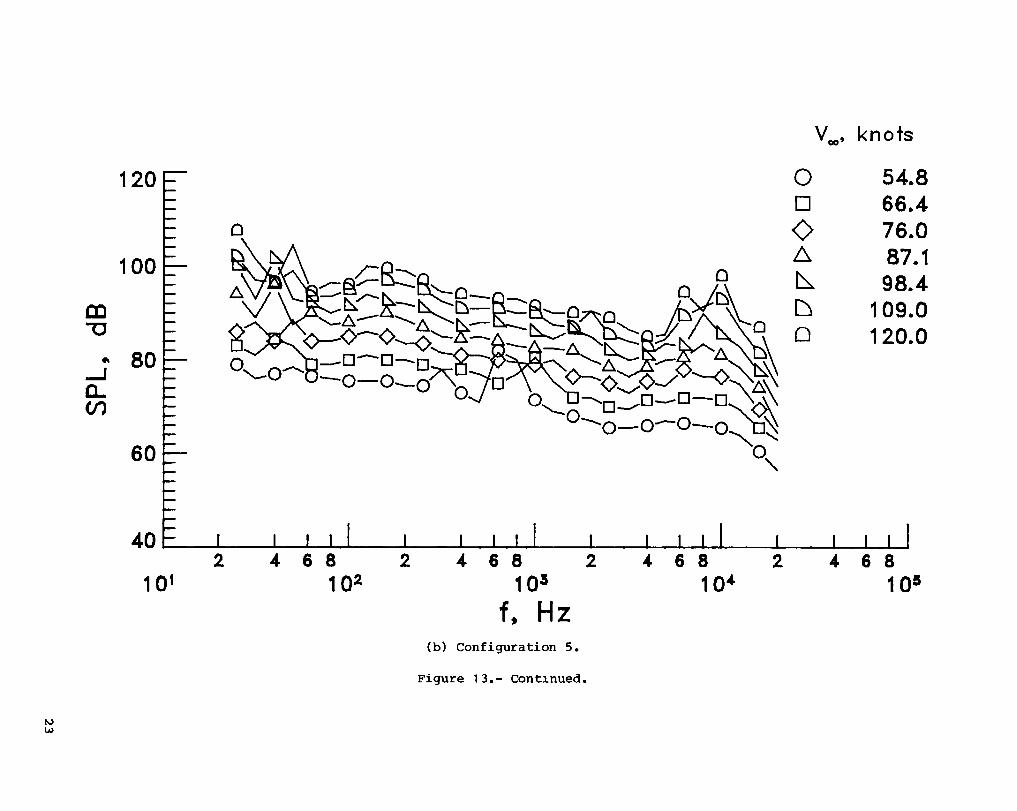
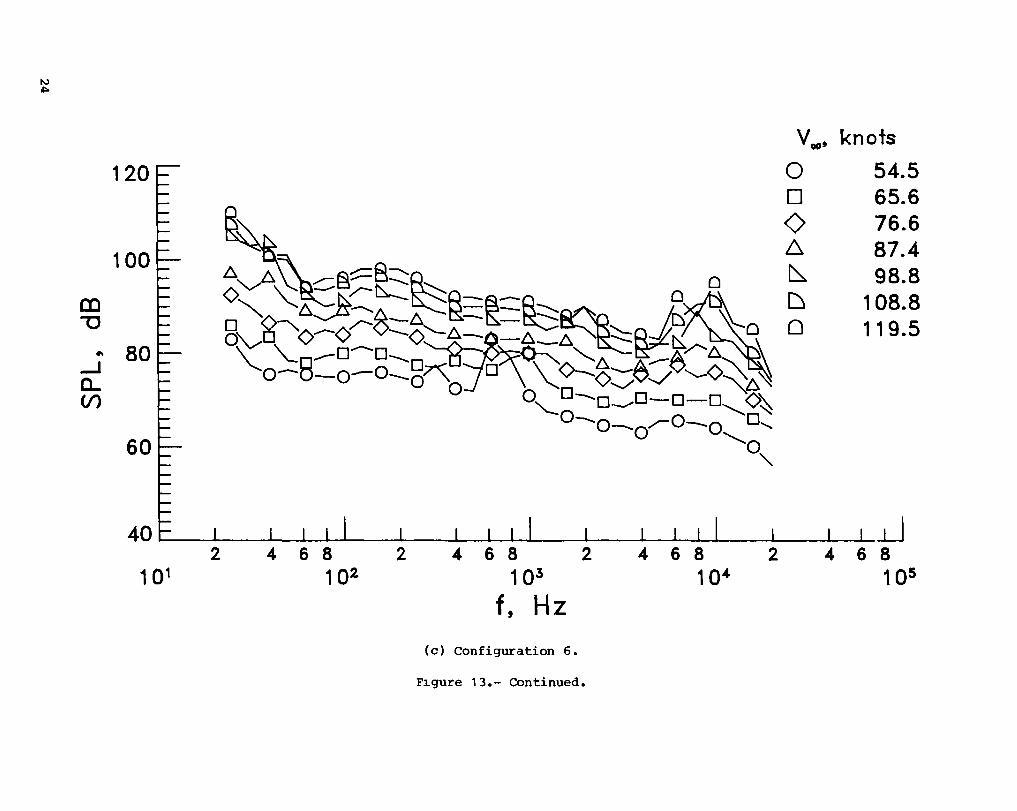
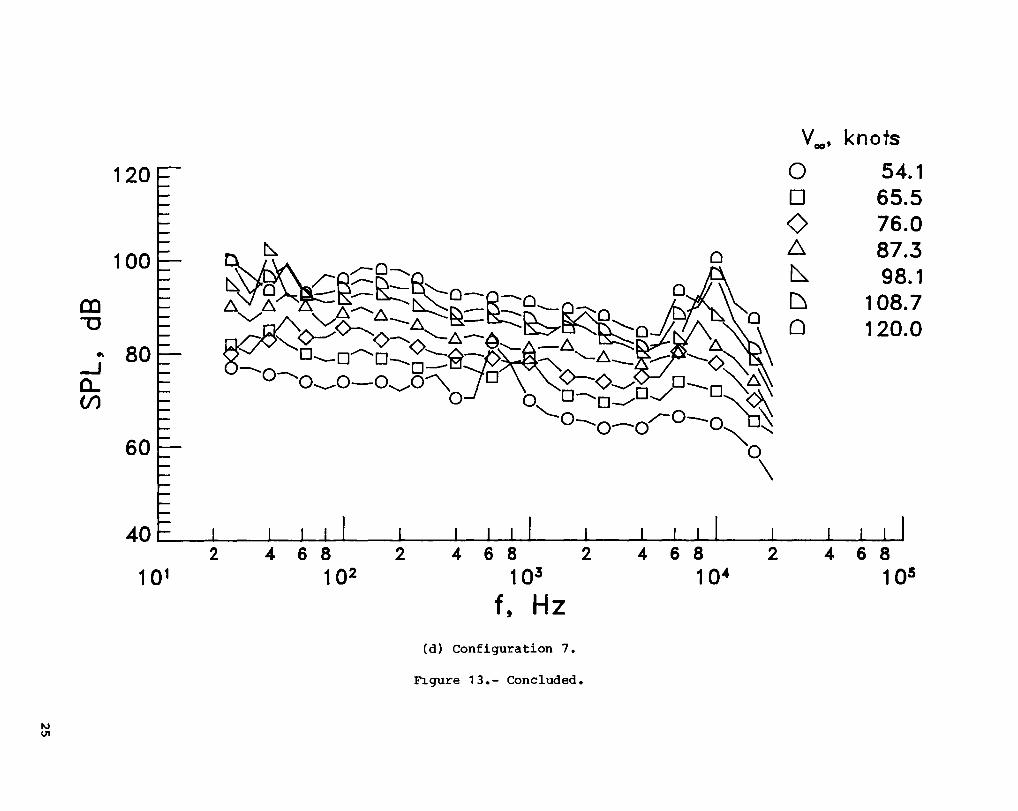
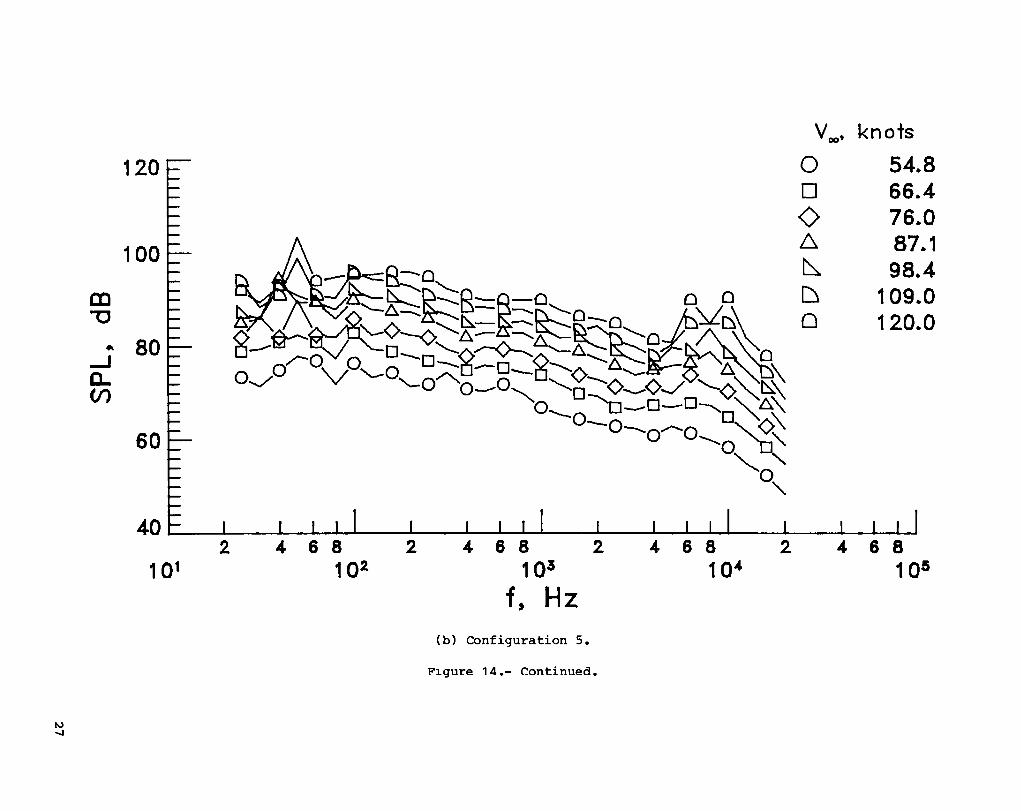
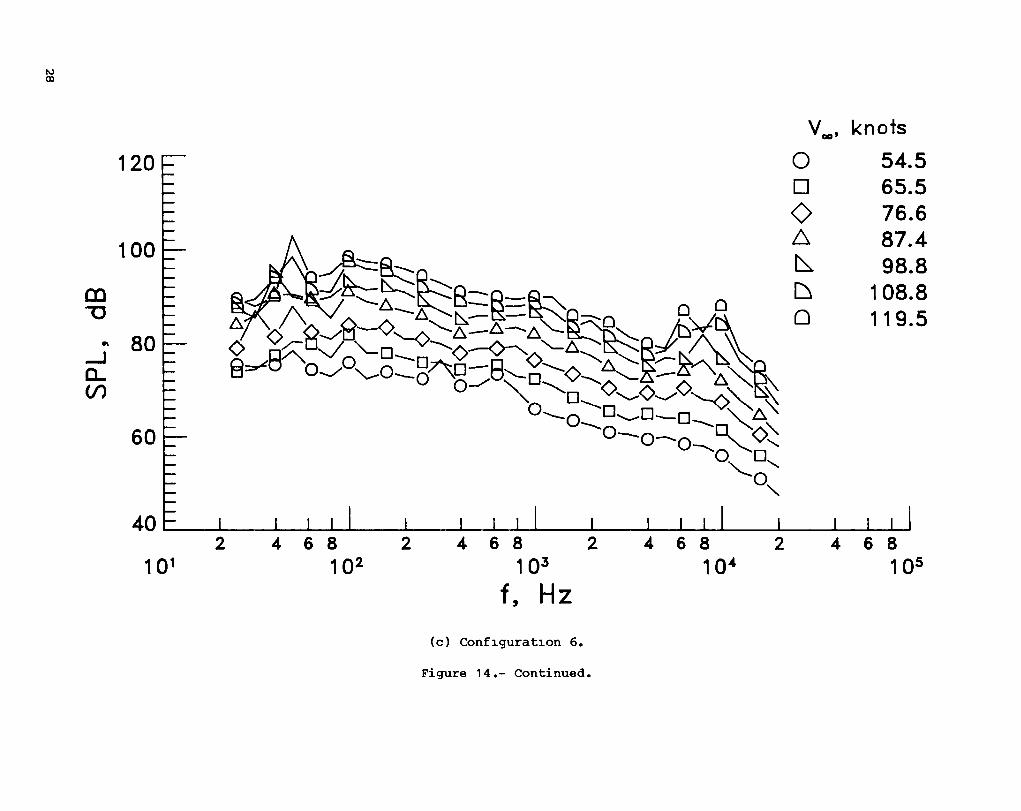
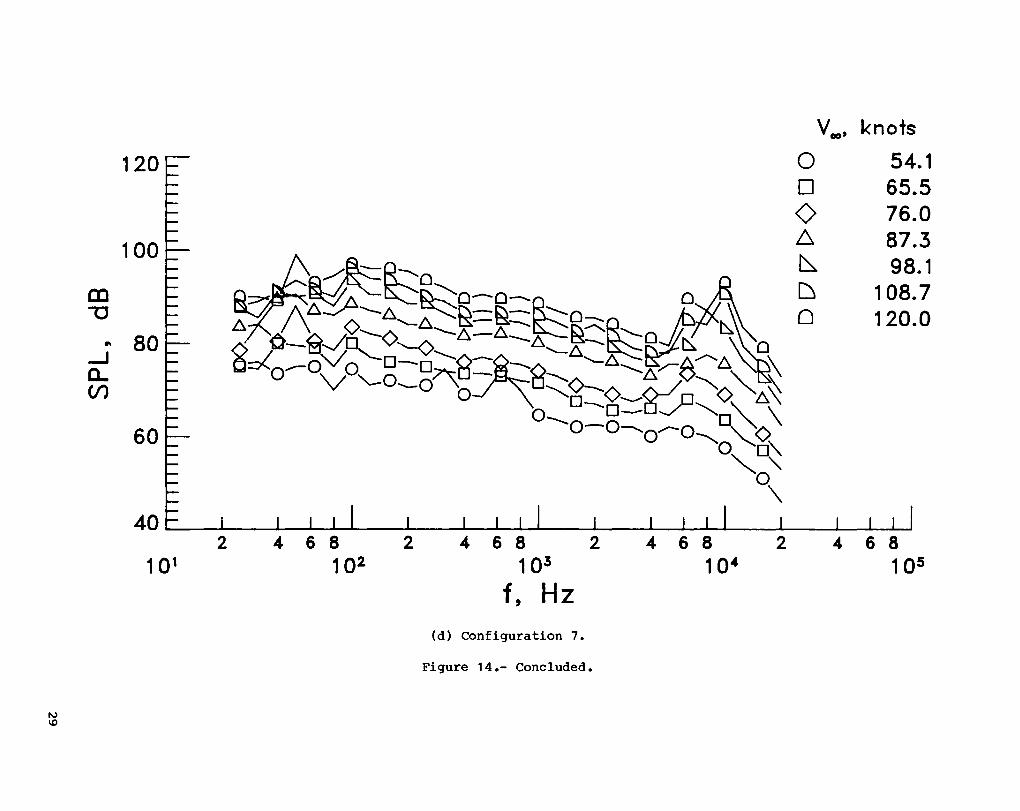
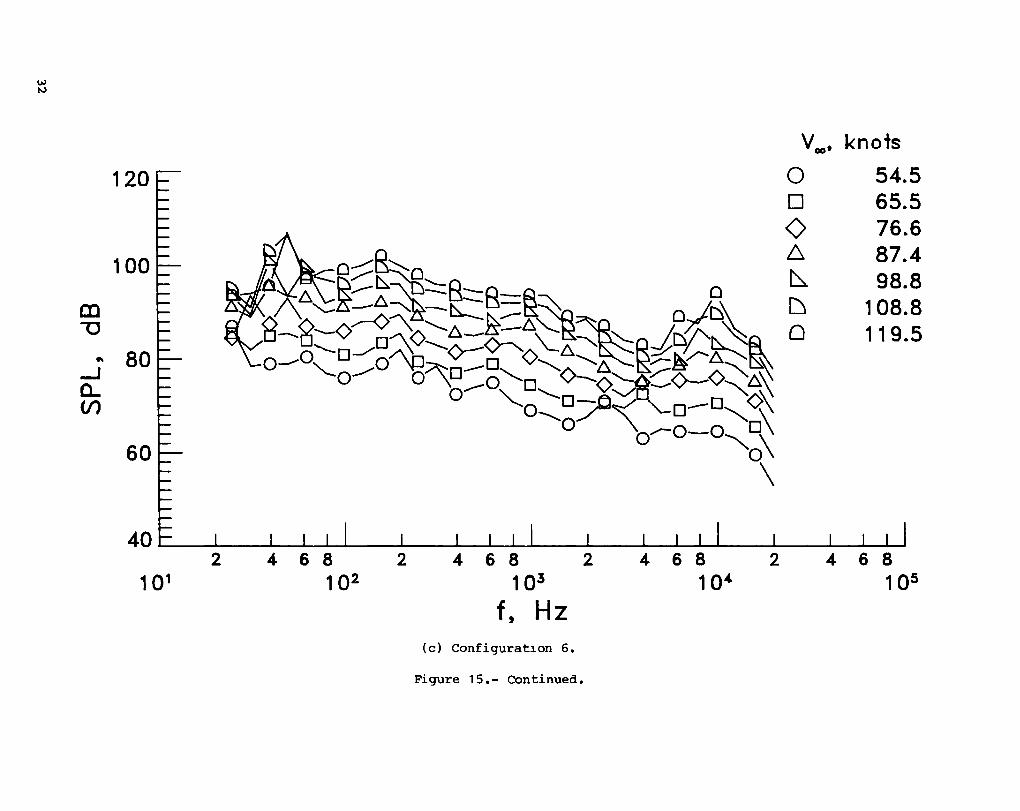
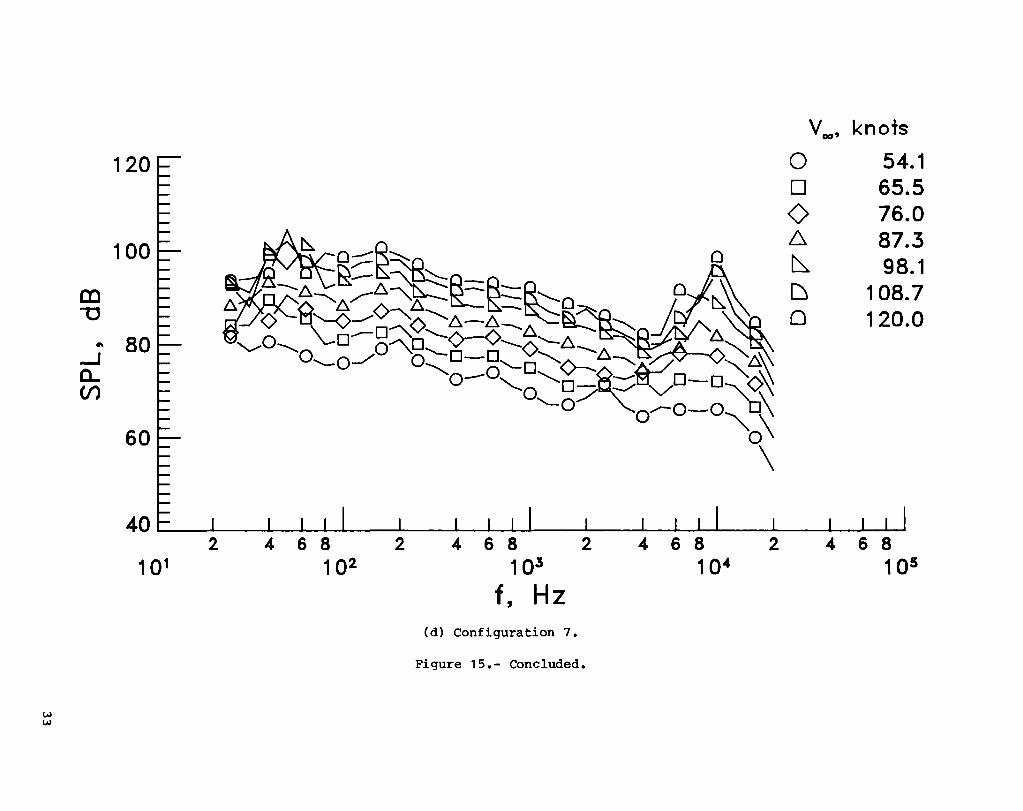
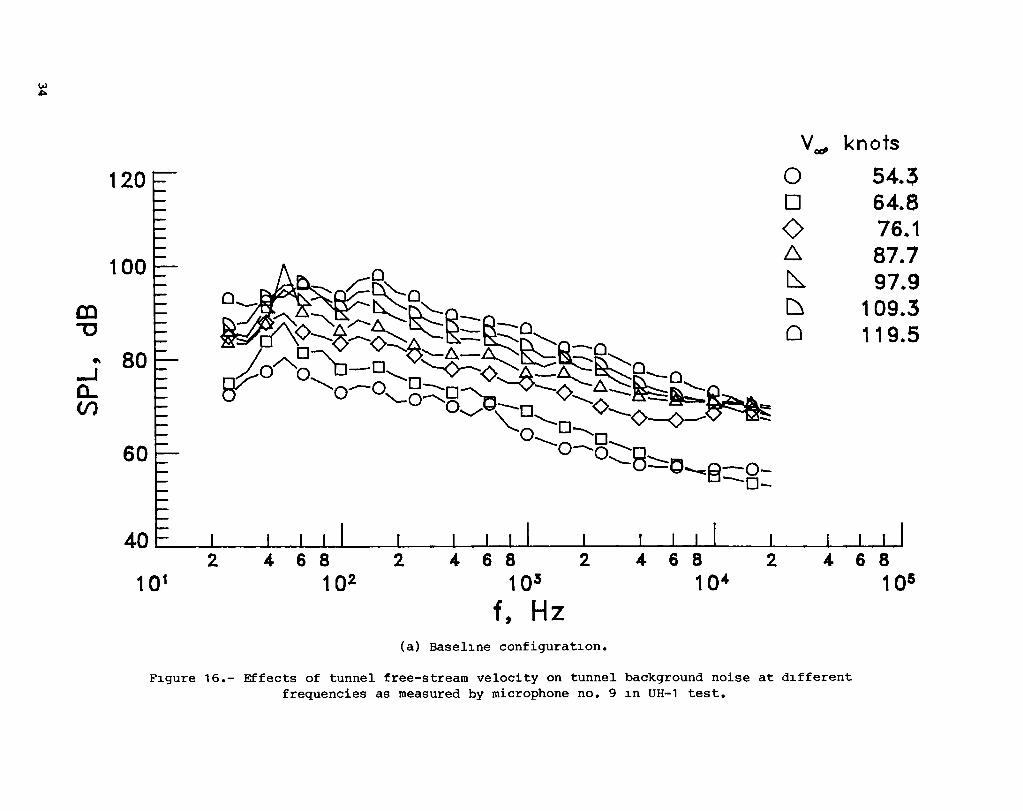
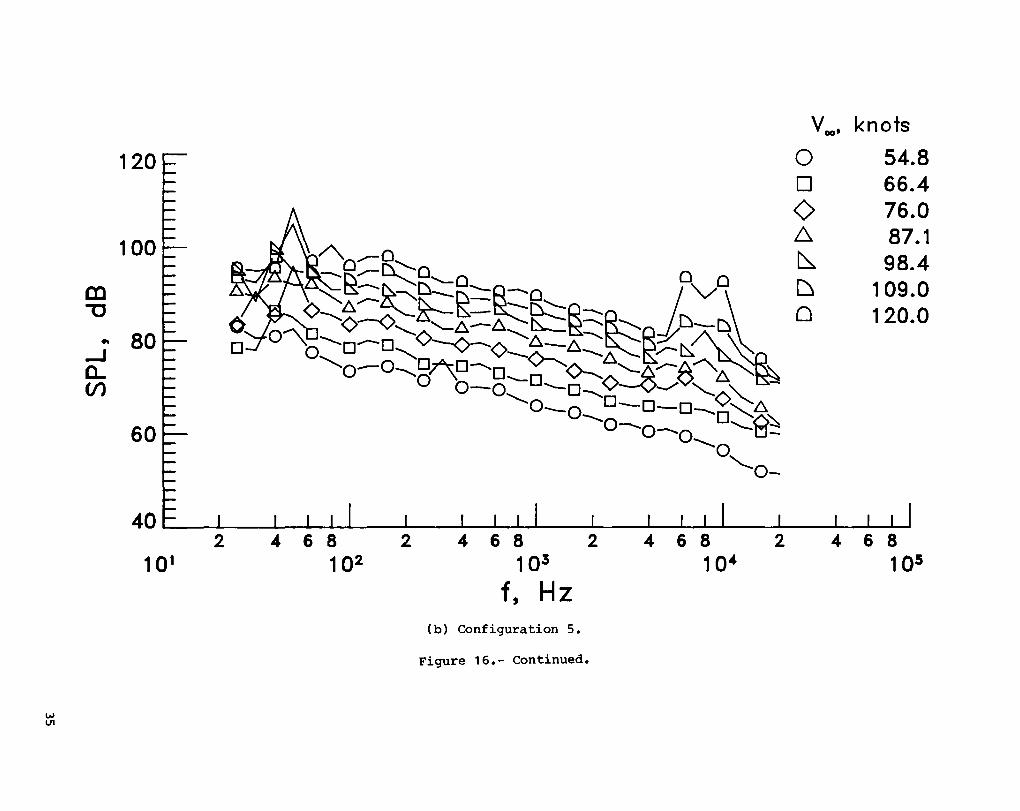
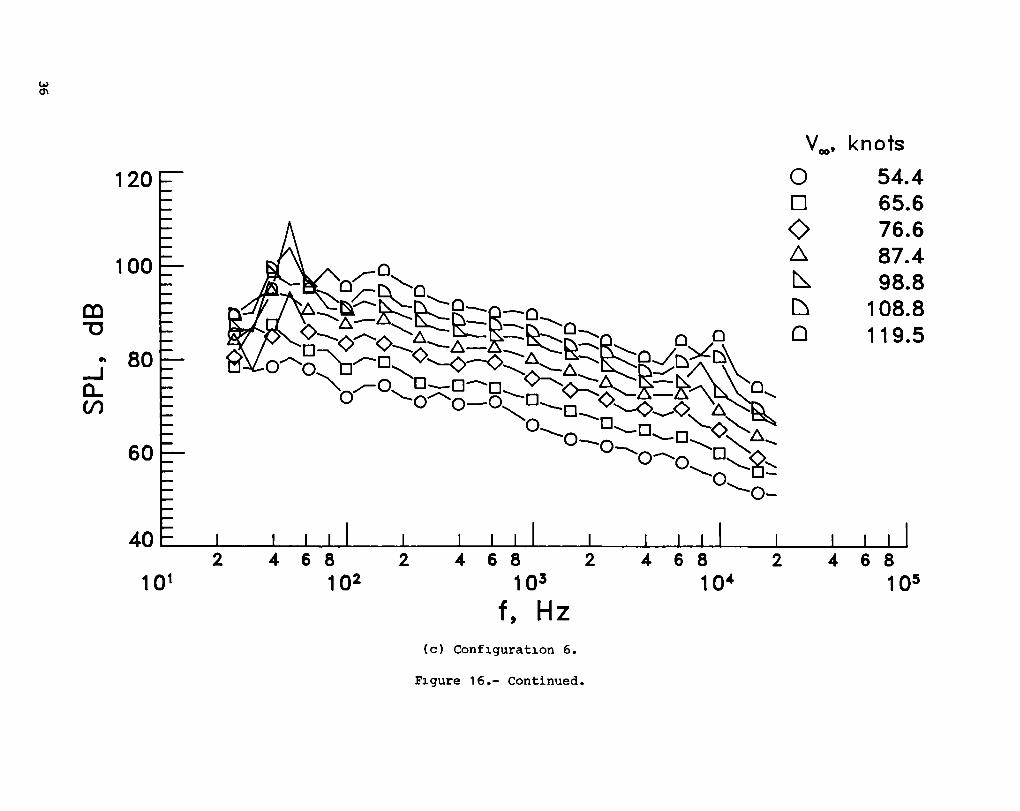
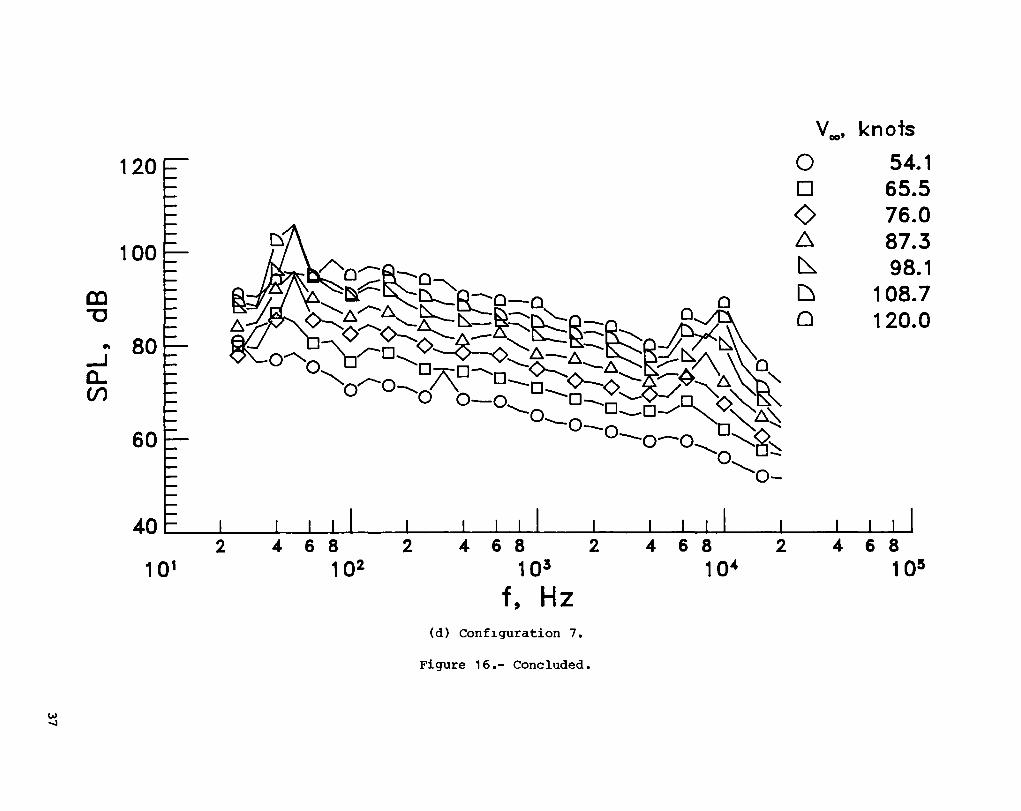
Increased background noise is another penalty of the use of these pulsation alleviation devices. The vanes are typically installed in the highest velocity portion of the tunnel and very near the test section, where acoustic research tests are normally conducted. In this light, the remainder of this report will concentrate on the noise generated in this facility by these vane modifications. The background noise data acquired in the baseline tunnel configuration and with vane configurations 5, 6, and 7 are presented in figures 13 to 18. Symbols are used on every other data point for clarity. The organization of the figures is given below.
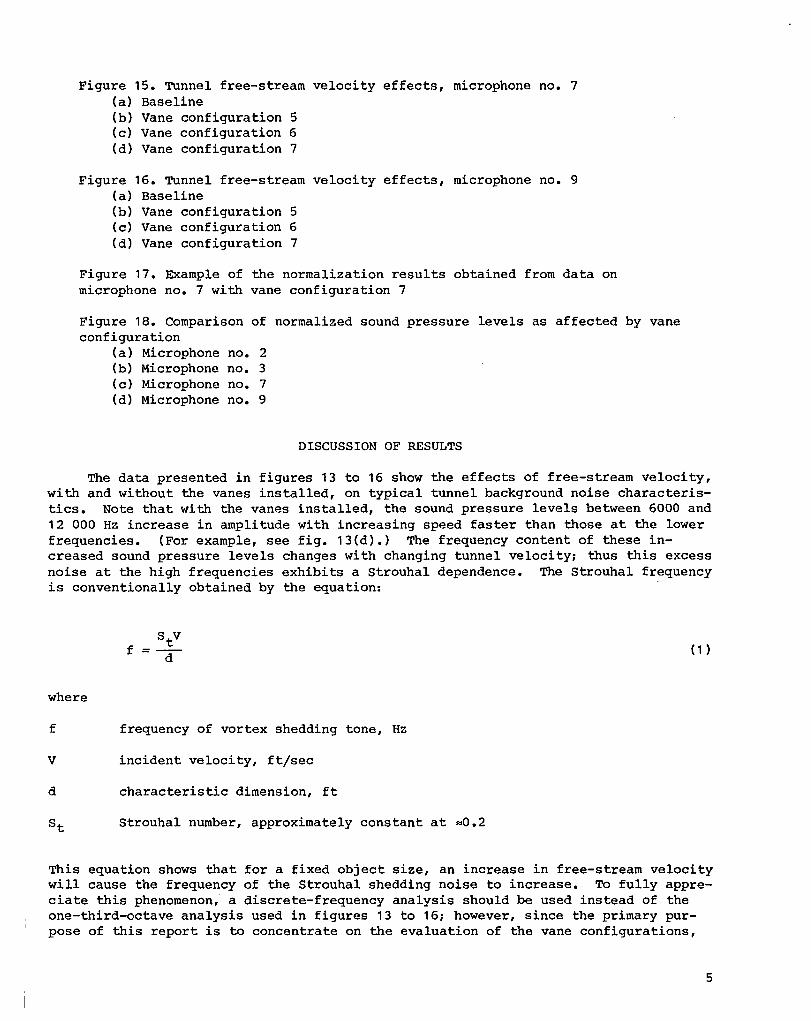
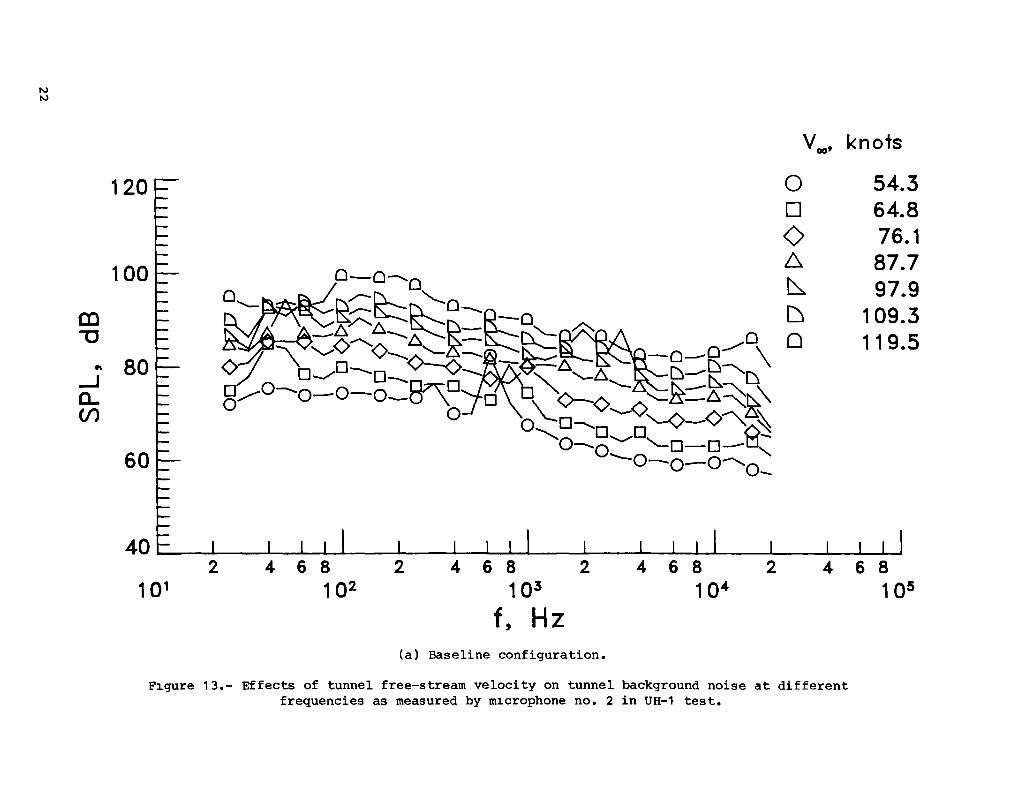
The data presented in figures 13 to 16 show the effects of free-stream velocity, with and without the vanes installed, on typical tunnel background noise characteristics. Note that with the vanes installed, the sound pressure levels between 6000 and 12 000 Hz increase in amplitude with increasing speed faster than those at the lower frequencies. (For example, see fig. 13(d).) The frequency content of these increased sound pressure levels changes with changing tunnel velocity~ thus this excess noise at the high frequencies exhibits a Strouhal dependence. The Strouhal frequency is conventionally obtained by the equation:
where
f frequency of vortex shedding tone, Hz
V incident velocity, ft/sec
d characteristic dimension, ft
St Strouhal number, approximately constant at ~O.2
This equation shows that for a fixed object size, an increase in free-stream velocity will cause the frequency of the Strouhal shedding noise to increase. To fully appreciate this phenomenon, a discrete-frequency analysis should be used instead of the one-third-octave analysis used in figures 13 to 16~ however, since the primary purpose of this report is to concentrate on the evaluation of the vane configurations,
5
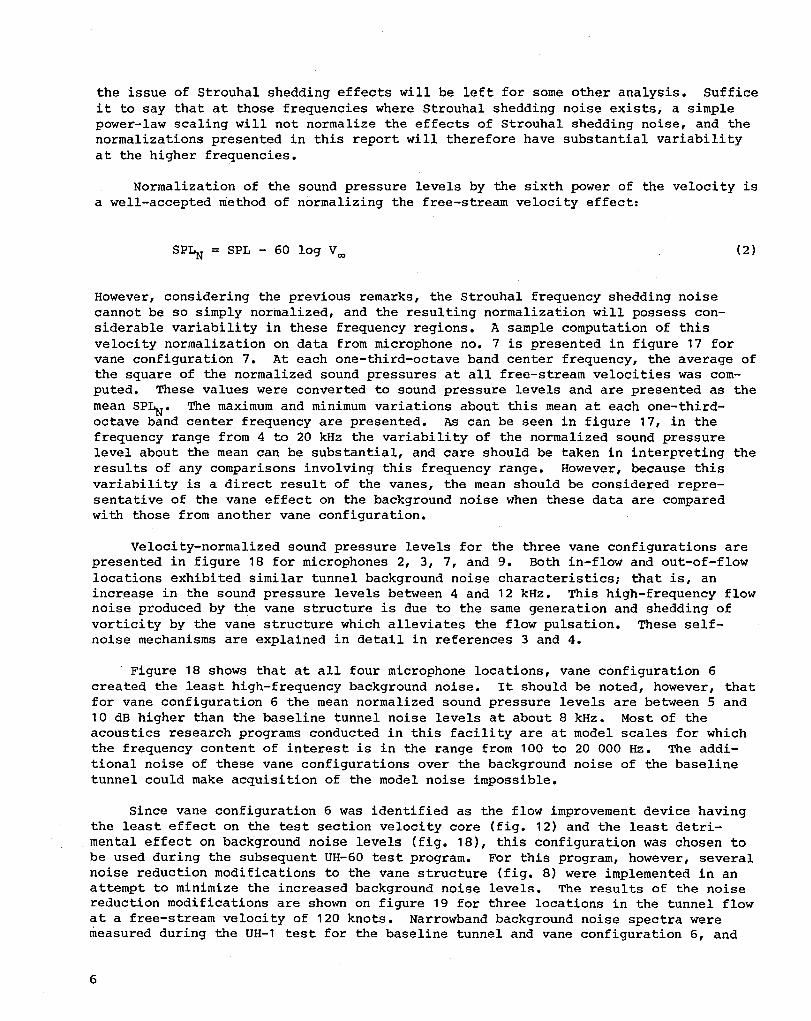
the issue of Strouhal shedding effects will be left for some other analysis. Suffice it to say that at those frequencies where Strouhal shedding noise exists, a simple power-law scaling will not normalize the effects of Strouhal shedding noise, and the normalizations presented in this report will therefore have substantial variability at the higher frequencies.
Normalization of the sound pressure levels by the sixth power of the velocity is a well-accepted method of normalizing the free-stream velocity effect:
SP~ = SPL - 60 log Voo (2)
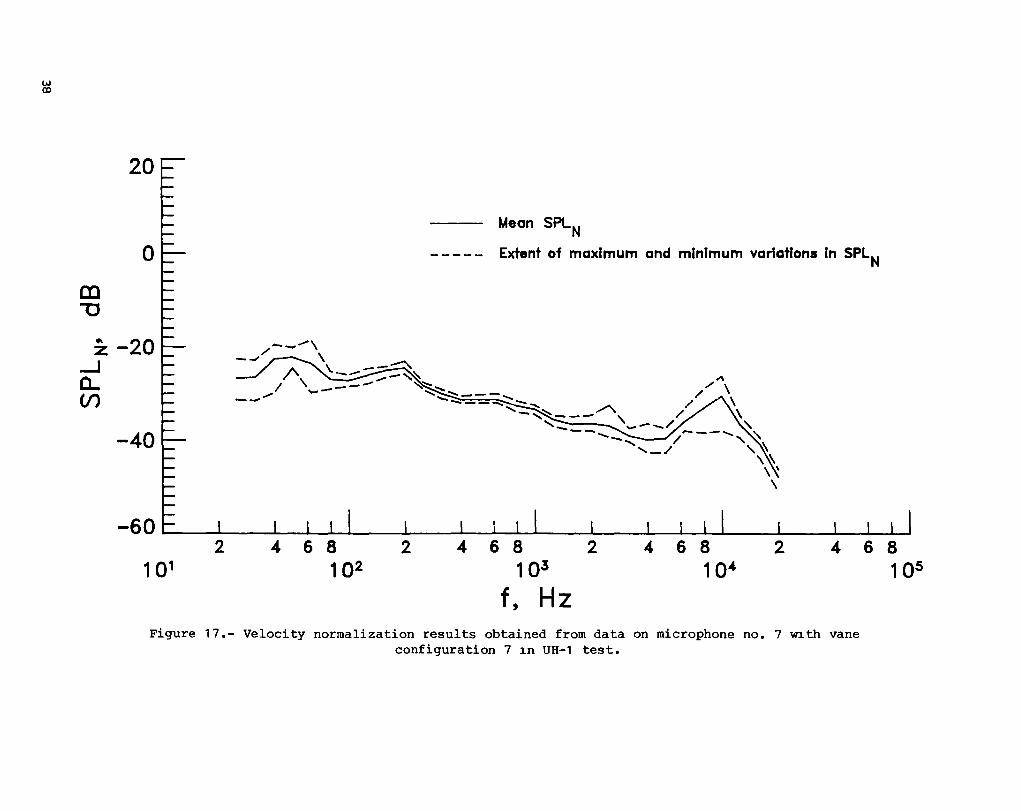
However, considering the previous remarks, the Strouhal frequency shedding noise cannot be so simply normalized, and the resulting normalization will possess considerable variability in these frequency regions. A sample computation of this velocity normalization on data from microphone no. 7 is presented in figure 17 for vane configuration 7. At each one-third-octave band center frequency, the average of the square of the normalized sound pressures at all free-stream velocities was computed. These values were converted to sound pressure levels and are presented as the mean SP~. The maximum and minimum variations about this mean at each one-thirdoctave band center frequency are presented. As can be seen in figure 17, in the frequency range from 4 to 20 kHz the variability of the normalized sound pressure level about the mean can be substantial, and care should be taken in interpreting the results of any comparisons involving this frequency range. However, because this variability is a direct result of the vanes, the mean should be considered representative of the vane effect on the background noise when these data are compared with those from another vane configuration.
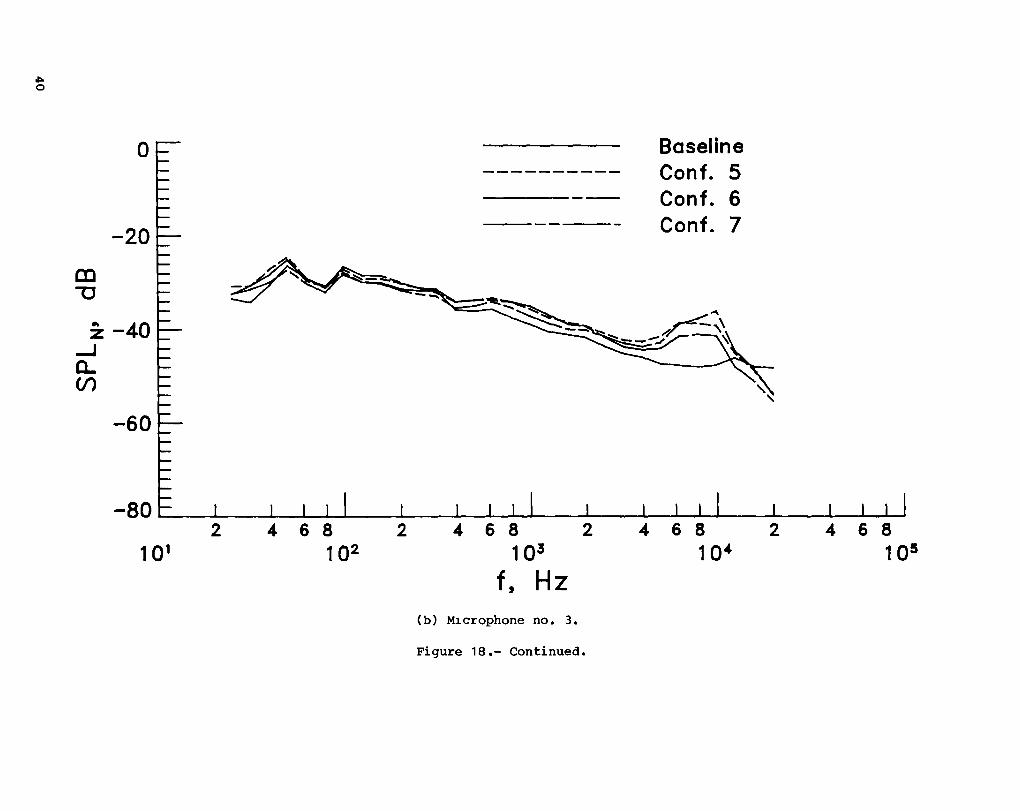
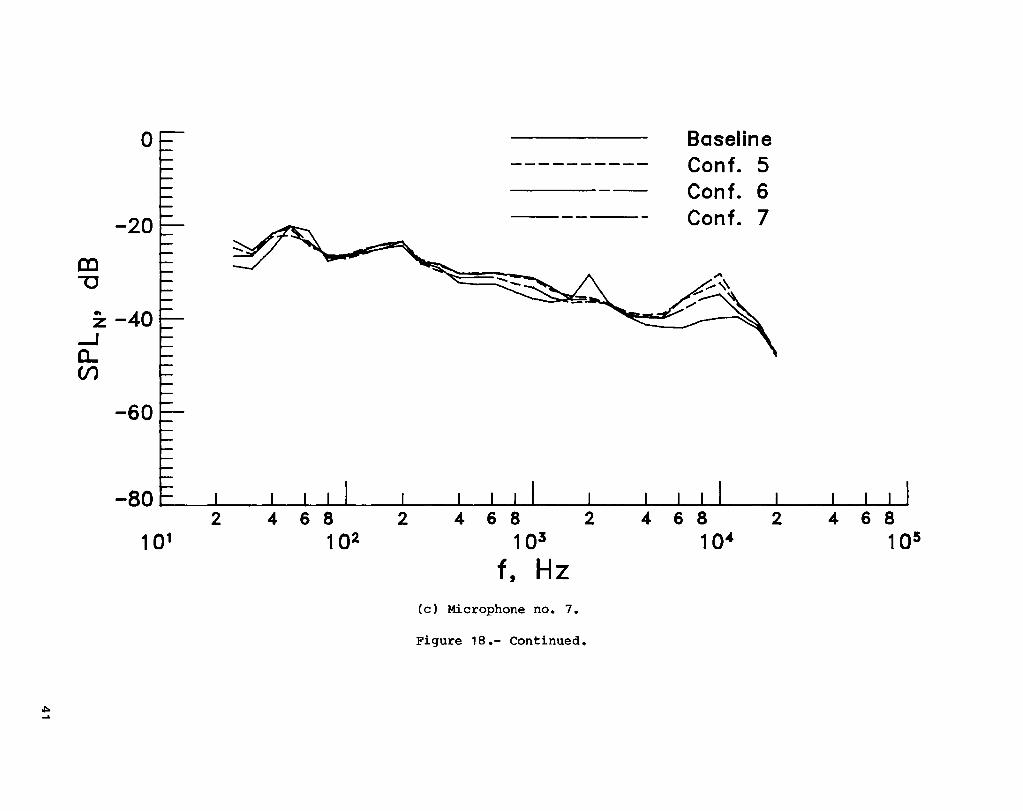
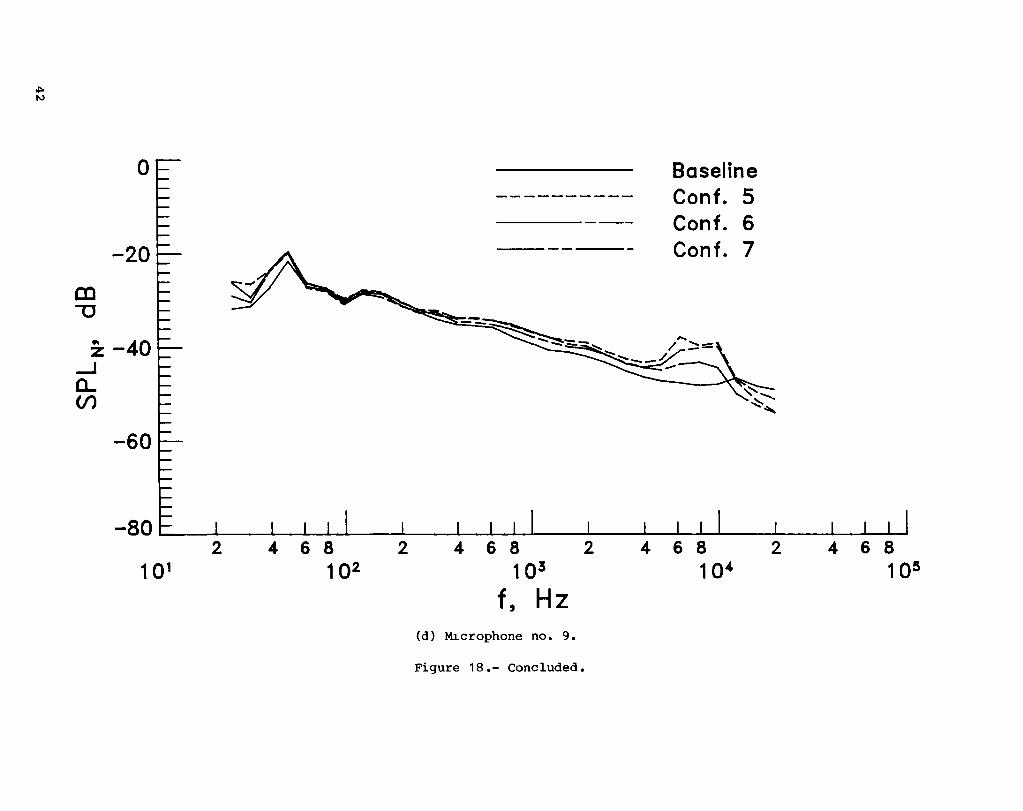
Velocity-normalized sound pressure levels for the three vane configurations are presented in figure 18 for microphones 2, 3, 7, and 9. Both in-flow and out-of-flow locations exhibited similar tunnel background noise characteristics; that is, an increase in the sound pressure levels between 4 and 12 kHz. This high-frequency flow noise produced by the vane structure is due to the same generation and shedding of vorticity by the vane structure which alleviates the flow pulsation. These selfnoise mechanisms are explained in detail in references 3 and 4.
Figure 18 shows that at all four microphone locations, vane configuration 6 created the least high-frequency background noise. It should be noted, however, that for vane configuration 6 the mean normalized sound pressure levels are between 5 and 10 dB higher than the baseline tunnel noise levels at about 8 kHz. Most of the acoustics research programs conducted in this facility are at model scales for which the frequency content of interest is in the range from 100 to 20 000 Hz. The additional noise of these vane configurations over the background noise of the baseline tunnel could make acquisition of the model noise impossible.
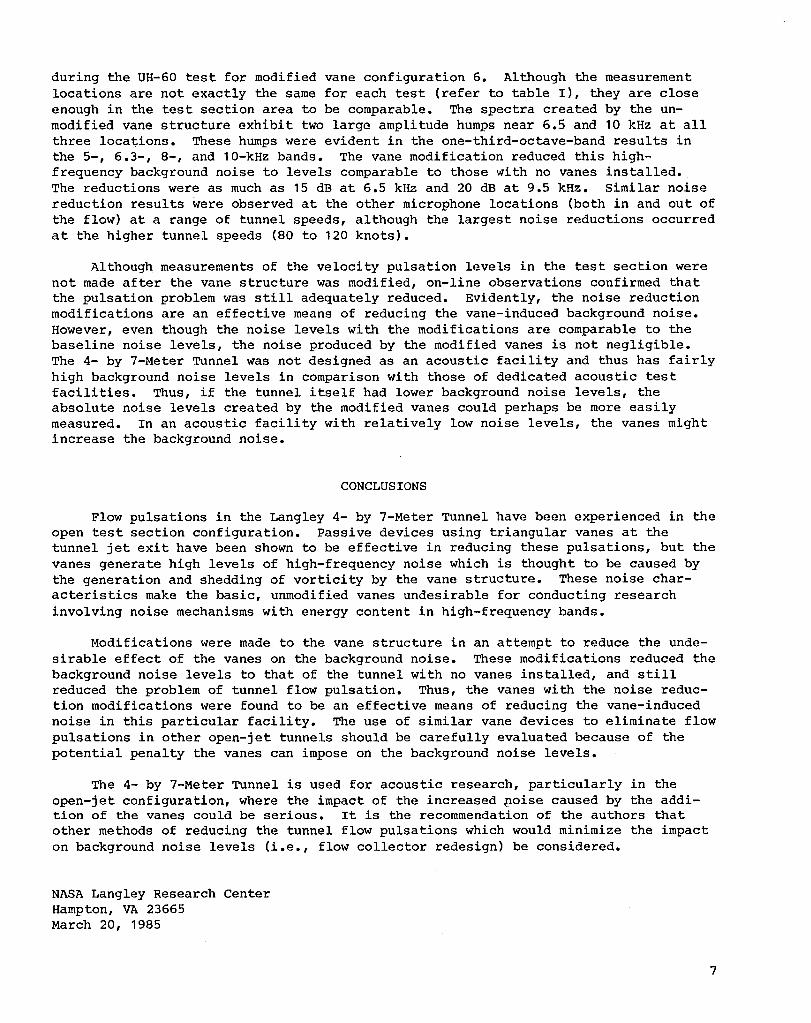
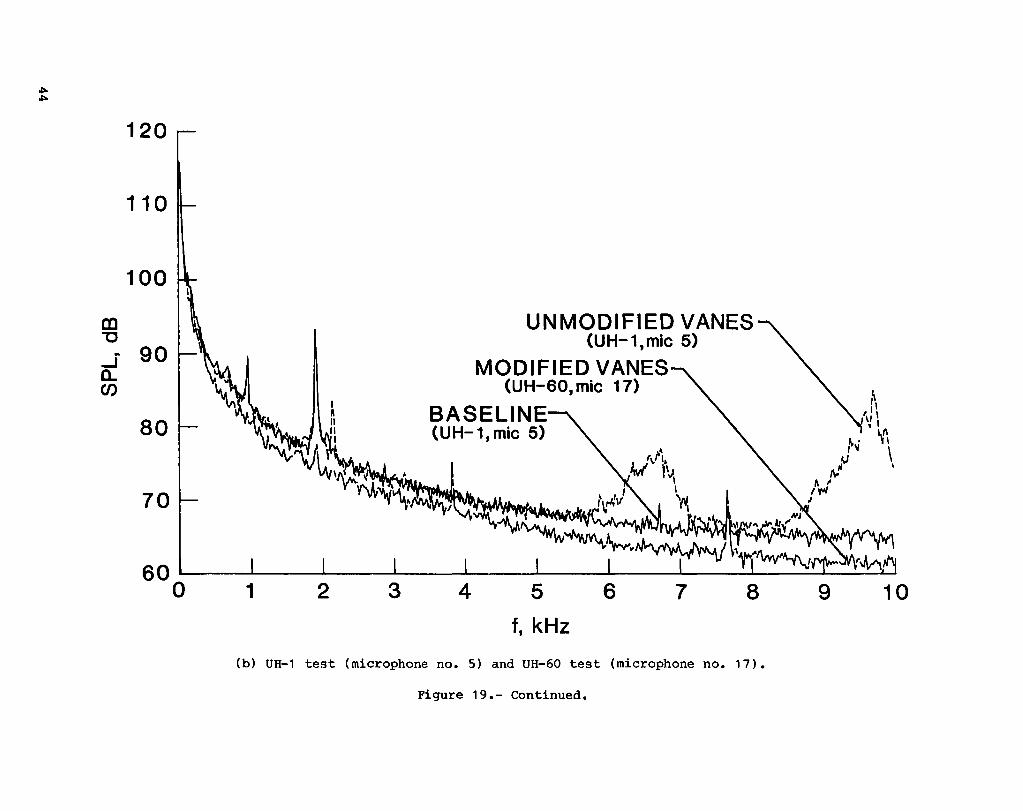
Since vane configuration 6 was identified as the flow improvement device having the least effect on the test section velocity core (fig. 12) and the least detrimental effect on background noise levels (fig. 18), this configuration was chosen to be used during the subsequent UH-60 test program. For this program, however, several noise reduction modifications to the vane structure (fig. 8) were implemented in an attempt to minimize the increased background noise levels. The results of the noise reduction modifications are shown on figure 19 for three locations in the tunnel flow at a free-stream velocity of 120 knots. Narrowband background noise spectra were measured during the UH-1 test for the baseline tunnel and vane configuration 6, and
6
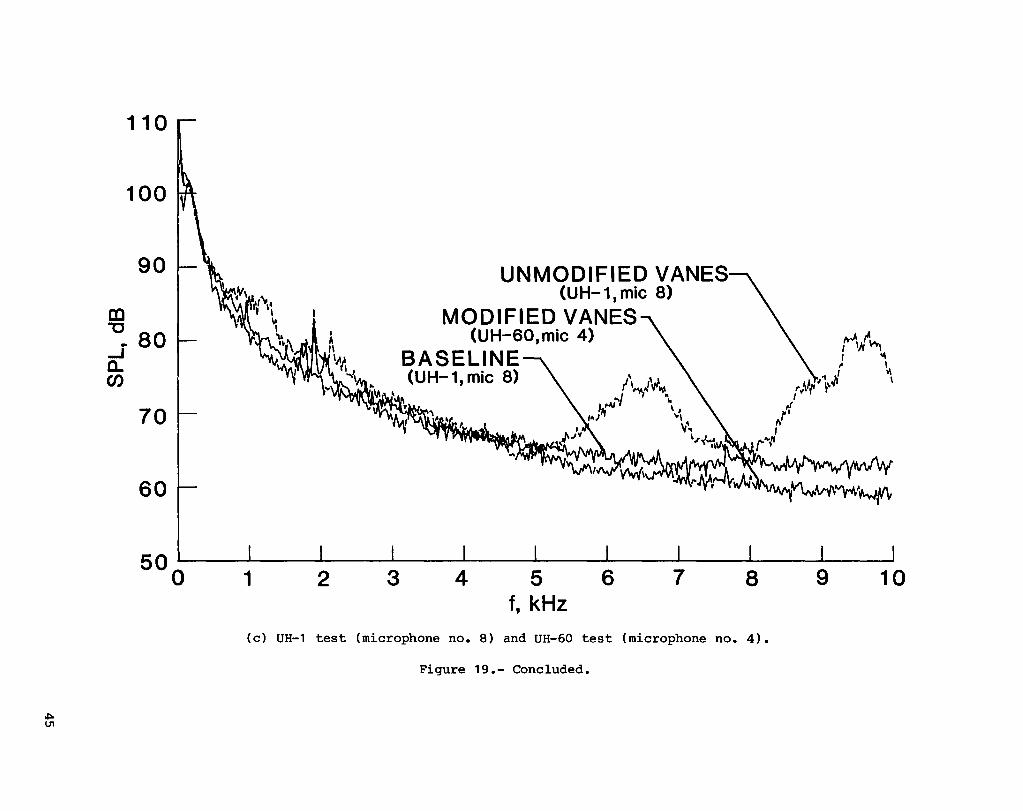
during the UH-60 test for modified vane configuration 6. Although the measurement locations are not exactly the same for each test (refer to table I), they are close enough in the test section area to be comparable. The spectra created by the unmodified vane structure exhibit two large amplitude humps near 6.5 and 10 kHz at all three locations. These humps were evident in the one-third-octave-band results in the 5-, 6.3-, 8-, and 10-kHz bands. The vane modification reduced this highfrequency background noise to levels comparable to those with no vanes installed. The reductions were as much as 15 dB at 6.5 kHz and 20 dB at 9.5 kHz. Similar noise reduction results were observed at the other microphone locations (both in and out of the flow) at a range of tunnel speeds, although the largest noise reductions occurred at the higher tunnel speeds (80 to 120 knots).
Although measurements of the velocity pulsation levels in the test section were not made after the vane structure was modified, on-line observations confirmed that the pulsation problem was still adequately reduced. Evidently, the noise reduction modifications are an effective means of reducing the vane-induced background noise. However, even though the noise levels with the modifications are comparable to the baseline noise levels, the noise produced by the modified vanes is not negligible. The 4- by 7-Meter TUnnel was not designed as an acoustic facility and thus has fairly high background noise levels in comparison with those of dedicated acoustic test facilities. Thus, if the tunnel itself had lower background noise levels, the absolute noise levels created by the modified vanes could perhaps be more easily measured. In an acoustic facility with relatively low noise levels, the vanes might increase the background noise.
CONCLUSIONS
Flow pulsations in the Langley 4- by 7-Meter Tunnel have been experienced in the open test section configuration. Passive devices using triangular vanes at the tunnel jet exit have been shown to be effective in reducing these pulsations, but the vanes generate high levels of high-frequency noise which is thought to be caused by the generation and shedding of vorticity by the vane structure. These noise characteristics make the basic, unmodified vanes undesirable for conducting research involving noise mechanisms with energy content in high-frequency bands.
Modifications were made to the vane structure in an attempt to reduce the undesirable effect of the vanes on the background noise. These modifications reduced the background noise levels to that of the tunnel with no vanes installed, and still reduced the problem of tunnel flow pulsation. Thus, the vanes with the noise reduction modifications were found to be an effective means of reducing the vane-induced noise in this particular facility. The use of similar vane devices to eliminate flow pulsations in other open-jet tunnels should be carefully evaluated because of the potential penalty the vanes can impose on the background noise levels.
The 4- by 7-Meter TUnnel is used for acoustic research, particularly in the open-jet configuration, where the impact of the increased ~oise caused by the addition of the vanes could be serious. It is the recommendation of the authors that other methods of reducing the tunnel flow pulsations which would minimize the impact on background noise levels (i.e., flow collector redesign) be considered.
NASA Langley Research Center Hampton, VA 23665 March 20, 1985
7
REFERENCES
1. Sellers, William L., III; Applin, Zachary T.; Molloy, John K.; and Gentry, Garl L., Jr.: Effect of Jet Exit Vanes on Flow Pulsations in an Open-Jet Wind Tunnel. NASA TM-86299, 1985.
2. Applin, Zachary T.: Modification to the NASA Langley 4- by 7-Meter Tunnel for Improved Rotorcraft Aerodynamics and Acoustics. NASA paper presented at the American Helicopter Society National Specialists Meeting on Helicopter Testing Technology (Williamsburg, VA), Oct. 29 - Nov. 1, 1984.
3. Brooks, Thomas F.; and Schlinker, Robert H.: Progress in Rotor Broadband Noise Research. Vertica, vol. 7, no. 4, 1983, pp. 287-307.
4. Brooks, Thomas F.; and Marcolini, Michael A.: Airfoil Self Noise - Effect of Scale. AlAA-83-0785, Apr. 1983.
8
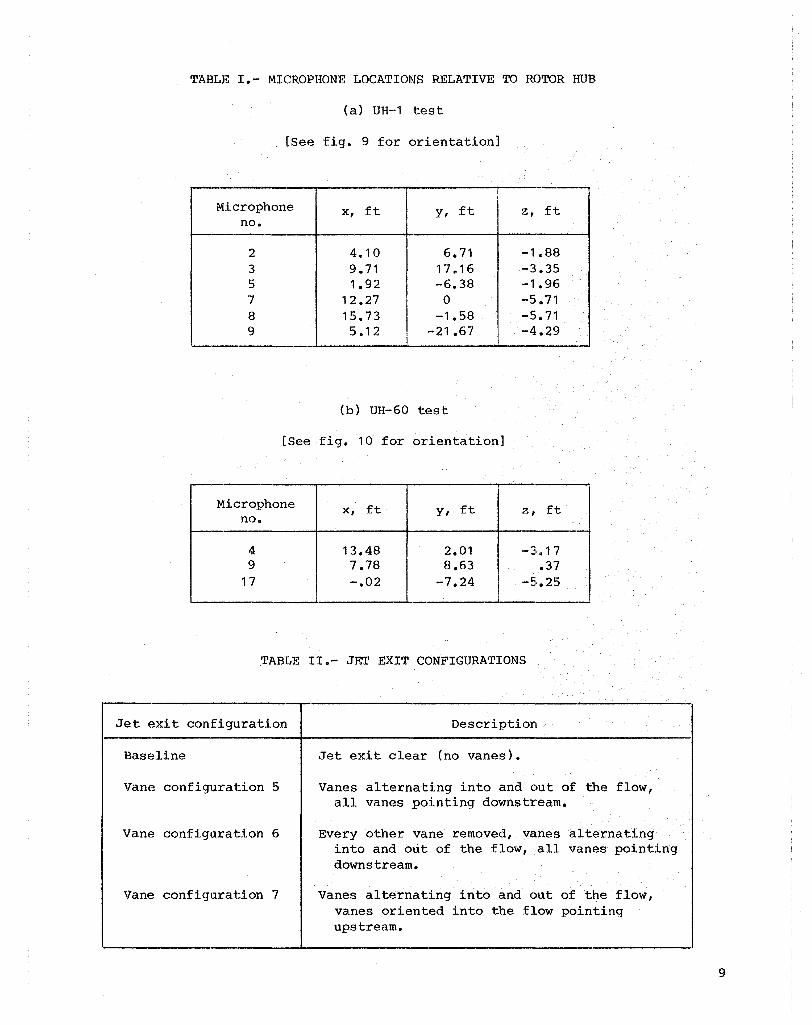
TABLE I.- MICROPHONE LOCATIONS RELATIVE TO ROTOR HUB
Vanes alternating into and out of the flow, all vanes pointing downstream.
Every other vane removed, vanes alternating into and out of the flow, all vanes pointing downstream.
Vanes alternating into and out of the flow, vanes oriented into the flow pointing upstream.
9
o
L .... 83-408
Figure 1.- Langley 4- by 7-Meter Tunnel test section during UH-1 test. View looking downstream from jet exit.
L-83-7,012
Figure 2.- Langley 4- by 7-Meter TUnnel test section during UH-60 test. View looking downstream from jet exit.
to.>
L-83-409
Figure 3.- Langley 4- by 7-Meter Tunnel test section during UH-1 test showing jet nozzle vane configuration 6.
w
~IOW
--<38 ~ Vane ~ (bent down.
into flow)
Rail____.
~vane ~.. %'" (bent up. away
from flow)
F1gure 4.- Tr1angular vane struture used for UH-l test. (Not to scale.)
A~
(a) S~de v~ew. (D~mens~ons ~n inches.)
(b) V~ew look~ng upstream at Jet exit nozzle.
F~gure 5.- Jet ex~t vane configurat~on 5.
14
(a) S1de V1ew. (D1mens10ns in inches.)
(b) V1ew looking upstream at jet exit nozzle.
Figure 6.- Jet eX1t vane configuration 6.
15
AA (a) S1de view. (Dimensions in 1nches.)
(b) V1ew looking upstream at Jet eX1t nozzle. (Shaded vanes are p01nting downstream.)
F1gure 7.- Jet exit vane conf1guration 7.
16
ROUNDED LEADING
EDGE
FLOW ~
SHARP TRAILING
EDGE
BOUNDARY LAYER TRIP
VANES (FOAM ON DOWNWIND SURFACE)
F1gure 8.- Tr1angular vane structure with noise reduction modifications for UH-60 test.
17
18
Open-cell polyurethane foam
- Microphone Number
z
X -2
- 3 -8 -9
-5 -7
(a) S1de view.
- Microphone Number
-8
WInd direction
-2 y
(b) Top new.
F1gure 9.- Relat1ve pos1t10ns of m1crophones, model, and modif1cations 1n 4- by 7-Meter Tunnel for UH-l ~esL. m1crophone posit10ns are depicted to scale.)
Jet exit I,,,,_L. .... \1'lO"l: aLL
Jet exit
.... Wind
direction -
Open-cell polyurethane foam
- Microphone Number
(a) Sl.de Vl.ew.
-9 - tA'crophone Number
y
-17
(b) Top Vl.ew.
Fl.gure 10.- Relatl.ve posl.tions of microphones, model, and Jet exit modifl.catl.ons l.n 4- by 7-Meter Tunnel for UH-60 test. (Not all microphone posl.tl.ons are depl.cted to scale.)
(a) UH-1 test (m1crophone no. 2) and UH-60 test (microphone no. 9).
F1gure 19.- Effects of noise reduction modifications on tunnel background noise. Vane configuration 6; v~ = 120 knots.
,.. ,..
[Xl "'C
120
110
100
J 90 a.. en
80
70
UNMODIFIED VANES (UH-1,mic 5)
MODIFIED VANES (UH-60, mic 17)
BASELINE (UH-1, mic 5)
l'v IJ
r./ " ,. ,'I"i I
1\ II
'\I ' , , \", \ ,
600
I
1 3 2 4 6 5 7 8 9 10
f, kHz
(b) UH-1 test (microphone no. 5) and UH-60 test (microphone no. 17).
Figure 19.- Continued.
"'" 111
110
100
90
III "0 80 .. ...J a. en
70
60
500 1 2 3
UNMODIFIED VANES (UH-1, mic 8)
MODIFIED VANES (UH-60, mic 4)
BASELINE (UH-1, mic 8)
4 5 f, kHz
6 7
,f ,., '" ,
r","
8
(c) UH-1 test (microphone no. 8) and UH-60 test (microphone no. 4).
Figure 19.- Concluded.
".). ~ , w~\ , '" ~ \
I r,1 ,! >I f' ~\r{' ~\'1' \ I
9 10
"' 2 Government Accession No 1 Report No
NASA TM-86383 AVSCOM TM 85-B-1
4 Title and Subtitle
Background Noise Measurements From Jet Exit Vanes Des1gned To Reduce Flow Pulsat10ns 1n an Open-Jet W~nd Tunnel
7 Author(s)
Danny R. Hoad and Ruth M. Martin
9 Performing Organization Name and Address
NASA Langley Research Center and
structures Laboratory USAAVSCOM Research and Technology Laborator1es Hampton, VA 23665
12 Sponsoring Agency Name and Address
Nat10nal Aeronautics and Space Adm1nistration Washington, DC 20546
and u.S. Army AV1at10n Systems Command St. LOU1S, MO 63120
15 Supplementary Notes
3 Recipient's Catalog No
5 Report Date
June 1985 6 Performing Organization Code
505-42-23-09
8 Performing Organization Report No
L-15923
10 Work Unit No
11 Contract or Grant No
13 Type of Report and Period Covered
Techn1cal Memorandum
14 Army Project No
1L162209AH76
Danny R. Hoad: Structures Laboratory, USAAVSCOM Research and Technology Laborator1es, Hampton, V1rg1n1a.
Ruth M. Mart1n: NASA Langley Research Center, Hampton, V1rg1nia. 16 Abstract
Many open-Jet w1nd tunnels exper1ence pulsations of the flow which are tYP1cally characterized by periodic low-frequency velocity and pressure variations. One method of reducing these fluctuations 1S to install vanes around the per1meter of the Jet exit to protrude into the flow. Although these vanes have been shown to be effect~ve ~n reducing the fluctuation content, they can also ~ncrease the test sect10n background n01se level. Th1S report presents the results of an experimental acoustic program 1n the Langley 4- by 7-Meter Tunnel to evaluate the effect on tunnel background n01se of such mod1fications to the Jet exit nozzle. N01se levels for the base11ne tunnel conf1gurat1on are compared W1th those for three Jet exit nozzle mod1f1cat1ons, 1ncluding an enhanced n01se reduct10n conf1guration that m1n1-m1zes the effect of the vanes on the background n01se. Although the n01se levels for th1s mod1f1ed vane conf1guration were comparable to baseline tunnel background n01se levels 1n th1s fac111ty, 1nstallat1on of these modified vanes 1n an acoustic tunnel may be of concern because the n01se levels for the vanes could be well above background n01se levels 1n a qU1et facility.
17 Key Words (Suggested by Author(s)) 18 DistributIOn Statement