WWW.COLUMBIATHREADNEEDLE.COM SICAV A Luxembourg Undertaking For Collective Investment In Transferable Securities Under Part I of the Law of December 17, 2010, as amended R.C.S. Luxembourg B-50.216 THREADNEEDLE (LUX) ANNUAL REPORT AND AUDITED FINANCIAL STATEMENTS SOCIÉTÉ D’INVESTISSEMENT À CAPITAL VARIABLE MARCH 31, 2021
Transcript
WWW.COLUMBIATHREADNEEDLE.COM
SICAVA Luxembourg UndertakingFor Collective InvestmentIn Transferable SecuritiesUnder Part I of the Law of December 17, 2010, as amendedR.C.S. Luxembourg B-50.216
THREADNEEDLE (LUX)
ANNUAL REPORT AND AUDITED FINANCIAL STATEMENTSSOCIÉTÉ D’INVESTISSEMENT À CAPITAL VARIABLEMARCH 31, 2021
2
Threadneedle (Lux) Annual Report and Audited Financial Statements March 2021
Contents
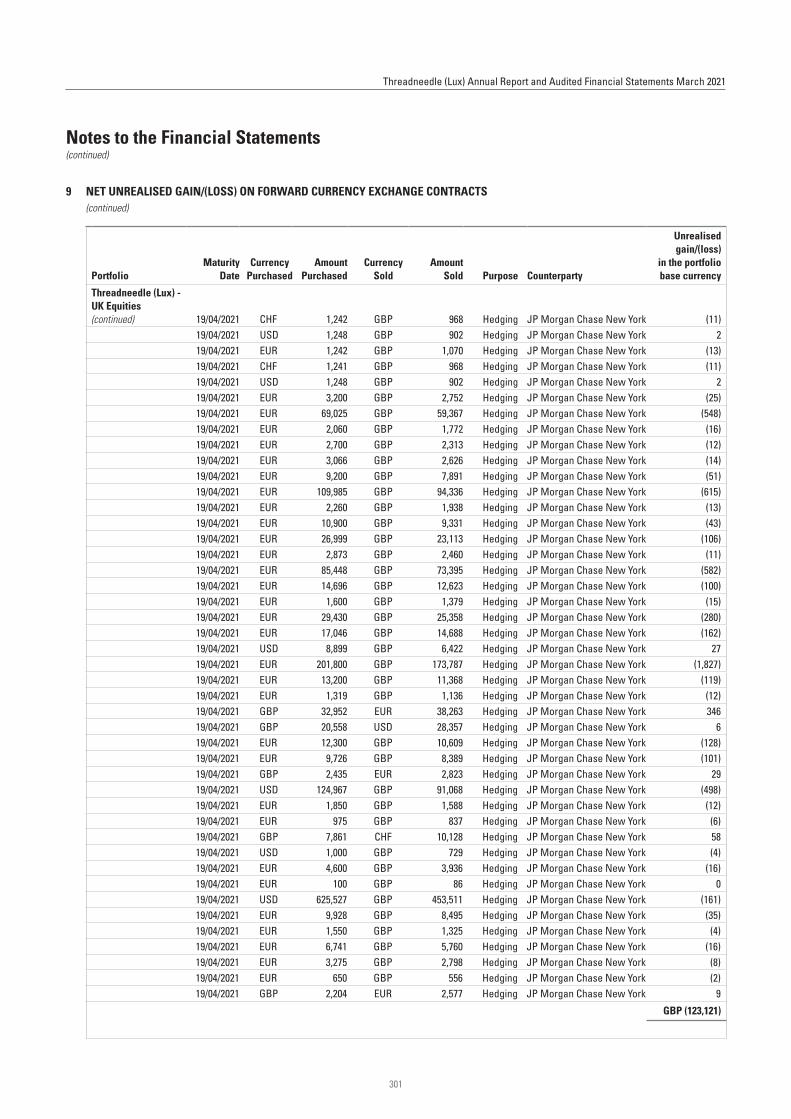
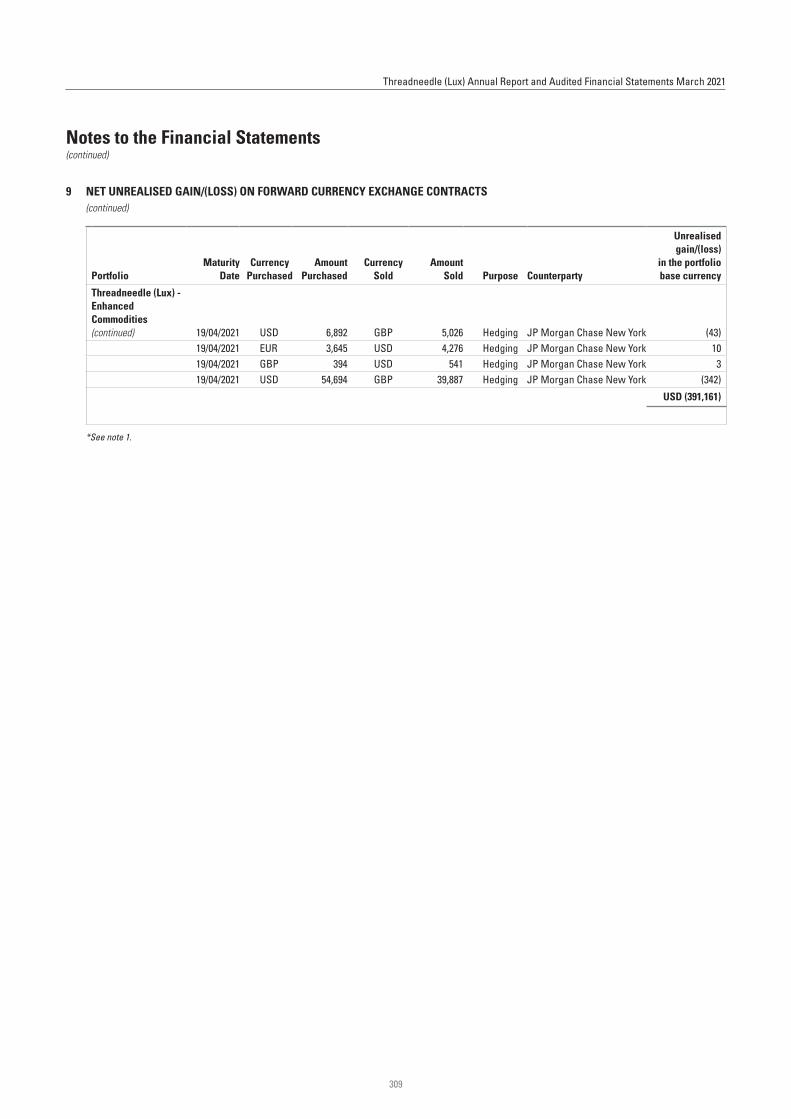
*See note 1.
Company Information 4Directors’ Report 5Performance 8Shariah Audit Reports 9Audit report 12Financial Statements: Aggregated Financial Statements for Threadneedle (Lux) 15Threadneedle (Lux) - Global Corporate Bond 16Threadneedle (Lux) - European Corporate Bond 18Threadneedle (Lux) - European High Yield Bond 20Threadneedle (Lux) - European Short-Term High Yield Bond 22Threadneedle (Lux) - European Social Bond 23Threadneedle (Lux) - European Strategic Bond 25Threadneedle (Lux) - Emerging Market Corporate Bonds 26Threadneedle (Lux) - Emerging Market Debt 27Threadneedle (Lux) - Global Emerging Market Short-Term Bonds 28Threadneedle (Lux) - US High Yield Bond 29Threadneedle (Lux) - Flexible Asian Bond 31Threadneedle (Lux) - Euro Dynamic Real Return 32Threadneedle (Lux) - Global Dynamic Real Return 33Threadneedle (Lux) - Global Multi Asset Income 34Threadneedle (Lux) - Emerging Market ESG Equities* 36Threadneedle (Lux) - Global Focus 37Threadneedle (Lux) - Global Emerging Market Equities 39Threadneedle (Lux) - Global Equity Income 40Threadneedle (Lux) - Global Select 42Threadneedle (Lux) - Global Smaller Companies 43Threadneedle (Lux) - American 45Threadneedle (Lux) - American Select 47Threadneedle (Lux) - American Smaller Companies 49Threadneedle (Lux) - Asia Contrarian Equity 50Threadneedle (Lux) - Asia Equities 51Threadneedle (Lux) - US Contrarian Core Equities 52Threadneedle (Lux) - US Disciplined Core Equities 53Threadneedle (Lux) - Pan European ESG Equities* 55Threadneedle (Lux) - Pan European Equity Dividend 57Threadneedle (Lux) - Pan European Small Cap Opportunities 59Threadneedle (Lux) - Pan European Smaller Companies 60Threadneedle (Lux) - European Select 62Threadneedle (Lux) - European Smaller Companies 64Threadneedle (Lux) - Asian Equity Income 65Threadneedle (Lux) - Global Technology 66Threadneedle (Lux) - UK Equities 67Threadneedle (Lux) - UK Equity Income 69Threadneedle (Lux) - STANLIB Africa Equity 71Threadneedle (Lux) - American Absolute Alpha 72Threadneedle (Lux) - Credit Opportunities 73Threadneedle (Lux) - Global Investment Grade Credit Opportunities 74
Threadneedle (Lux) - Pan European Absolute Alpha 76Threadneedle (Lux) - American Extended Alpha 77Threadneedle (Lux) - Global Extended Alpha 78Threadneedle (Lux) - Enhanced Commodities 79Threadneedle (Lux) - Gatehouse Shariah Global Equity* 81Portfolio StatementsThreadneedle (Lux) - Global Corporate Bond 82Threadneedle (Lux) - European Corporate Bond 91Threadneedle (Lux) - European High Yield Bond 97Threadneedle (Lux) - European Short-Term High Yield Bond 106Threadneedle (Lux) - European Social Bond 111Threadneedle (Lux) - European Strategic Bond 119Threadneedle (Lux) - Emerging Market Corporate Bonds 128Threadneedle (Lux) - Emerging Market Debt 133Threadneedle (Lux) - Global Emerging Market Short-Term Bonds 139Threadneedle (Lux) - US High Yield Bond 144Threadneedle (Lux) - Flexible Asian Bond 156Threadneedle (Lux) - Euro Dynamic Real Return 160Threadneedle (Lux) - Global Dynamic Real Return 161Threadneedle (Lux) - Global Multi Asset Income 164Threadneedle (Lux) - Emerging Market ESG Equities* 180Threadneedle (Lux) - Global Focus 182Threadneedle (Lux) - Global Emerging Market Equities 184Threadneedle (Lux) - Global Equity Income 187Threadneedle (Lux) - Global Select 189Threadneedle (Lux) - Global Smaller Companies 191Threadneedle (Lux) - American 193Threadneedle (Lux) - American Select 194Threadneedle (Lux) - American Smaller Companies 195Threadneedle (Lux) - Asia Contrarian Equity 197Threadneedle (Lux) - Asia Equities 199Threadneedle (Lux) - US Contrarian Core Equities 201Threadneedle (Lux) - US Disciplined Core Equities 203Threadneedle (Lux) - Pan European ESG Equities* 205Threadneedle (Lux) - Pan European Equity Dividend 207Threadneedle (Lux) - Pan European Small Cap Opportunities 209Threadneedle (Lux) - Pan European Smaller Companies 211Threadneedle (Lux) - European Select 213Threadneedle (Lux) - European Smaller Companies 214Threadneedle (Lux) - Asian Equity Income 216Threadneedle (Lux) - Global Technology 218Threadneedle (Lux) - UK Equities 220Threadneedle (Lux) - UK Equity Income 221Threadneedle (Lux) - STANLIB Africa Equity 222Threadneedle (Lux) - American Absolute Alpha 224Threadneedle (Lux) - Credit Opportunities 225Threadneedle (Lux) - Global Investment Grade Credit Opportunities 232Threadneedle (Lux) - Pan European Absolute Alpha 237
Contents(continued)
3
Threadneedle (Lux) Annual Report and Audited Financial Statements March 2021
Threadneedle (Lux) - American Extended Alpha 238Threadneedle (Lux) - Global Extended Alpha 239Threadneedle (Lux) - Enhanced Commodities 241Notes to the Financial Statements 242
Global Risk Exposure (unaudited) 352
Shareholders’ Information (unaudited) 353
Information for Investors in Switzerland (unaudited) 356
No subscription can be accepted on the basis of the financial reports. Subscriptions are only valid if they are made on the basis of the prospectus accompanied by the latest annual report and the latest semi-annual report, if published thereafter.
4
Threadneedle (Lux) Annual Report and Audited Financial Statements March 2021
Registered Office 31 Z.A. Bourmicht L-8070 Bertrange Grand Duchy of Luxembourg
Management Company Threadneedle Management Luxembourg S.A.44, rue de la Vallée L-2661 Luxembourg Grand Duchy of Luxembourg
Board of Directors Jonathan Allen (resigned from the Board of Directors on May 7, 2021)Head of Asia Pacific Institutional Sales and Product Development Columbia Threadneedle Investments Singapore
Marie-Jeanne Chèvremont-Lorenzini (resigned from the Board of Directors on May 7, 2021)Independent non-executive Director Luxembourg Grand Duchy of Luxembourg
Claude Kremer Independent non-executive Director Luxembourg Grand Duchy of Luxembourg
Julie GriffithsChief Risk Officer, EMEA and Global Head of Investment RiskColumbia Threadneedle Investments London United Kingdom
Annemarie Nicole Arens (appointed to the Board of Directors on May 7, 2021)Independent non-executive DirectorLuxembourgGrand Duchy of Luxembourg
Joseph Patrick LaRocque (appointed to the Board of Directors on May 7, 2021)Independent non-executive DirectorMarylandUnited States of America
Thomas Seale (appointed to the Board of Directors on May 7, 2021)Independent non-executive DirectorLuxembourgGrand Duchy of Luxembourg
Directors’ Report
5
Threadneedle (Lux) Annual Report and Audited Financial Statements March 2021
The year in review was a turbulent period in terms of both world events and financial-market movements. Following the sharp declines of March 2020, equities and industrial commodities rallied over subsequent months. In fixed income, yields on core government bonds (which move inversely to price) rebounded from historic lows to finish the year higher. Credit spreads (the yield premiums offered by corporate bonds over “risk-free” government bonds of the same maturity) tightened in the investment-grade (IG) and high-yield (HY) markets.
The unprecedented stimulus measures from central banks and governments helped risk assets rally from April until September. Declining coronavirus caseloads and the resulting easing of lockdown restrictions also boosted markets. After some shocking data releases in April, subsequent economic news tended to reinforce this sentiment and, although weak, was generally better than expected. Corporate earnings also beat generally low estimates. Despite the ‘risk-on’ tone, core government bond yields remained low until August, anchored by central-bank asset-purchase programmes and low interest rates. In August, the Federal Reserve (Fed) announced a major shift in policy, announcing it would target an average inflation rate, allowing it to rise above 2% to make up for time spent below that level, and that it would no longer view the approach of full employment as a cue to hike rates.
In September, however, profit-taking in US tech stocks heralded a change of mood, as investors refocused on more worrying elements of the backdrop, including resurgent coronavirus infection rates in many countries and the reimposition of control measures to contain the virus. Meanwhile, political uncertainty also mounted, in relation to the US presidential election and Brexit. The mood turned markedly positive in the last two months of 2020. Investors welcomed Joe Biden’s triumph in the US election, landmark results in coronavirus vaccine trials, and the subsequent approval of the first vaccines for use in Western democracies. These developments sparked a surge in oil prices and stocks in beaten-down sectors that were perceived to be major beneficiaries from a resumption of ‘normal’ economic activity. The risk-on rally received further impetus from the anticipation of another fiscal relief package in the US and further monetary stimulus in the eurozone. News of the last-minute trade agreement between the UK and the EU also bolstered sentiment as the year drew to a close.
2021 was characterised by a sharp rise in core bond yields on expectations of higher US government spending, after the Democrats took control of the Senate. Yields also rose on expectations that a vaccine-driven recovery in global growth would lead to increased inflation. This prompted some volatility in equity markets, though value-oriented sectors benefited. Corporate-bond markets were less impacted, and credit spreads tightened modestly over the first three months of 2021.
Over the 12 months to 31 March, the MSCI All Country World index posted double-digit gains. At a sector level, returns were initially led by healthcare, as firms raced to develop tests, vaccines and medications for COVID-19, and technology, as the pandemic accelerated “the digitisation of everything”. However, the optimism around vaccines and US fiscal stimulus in November fuelled a rotation towards financials and energy, which ultimately outperformed over the year.
At a regional level, US equities were the top performers in local-currency terms, helped by the outperformance of the sizeable technology sector over the first half of the period. Emerging markets (EMs) and Asia ex Japan also outperformed thanks to strong gains from China – one of the only major economies to report positive GDP growth over 2020. Asian countries in general proved more successful in containing the virus than their European and US counterparts. Meanwhile, EMs benefited from the dual tailwinds of a weaker US dollar and rising commodity prices over 2020. The export-heavy regions of continental Europe and Japan lagged slightly, amid concerns over the toll of the pandemic on global growth. In Japan, the resignation of Prime Minister Shinzo Abe in August also prompted some volatility. However, market concerns were allayed by the swift appointment of Yoshihide Suga – a supporter of Abe’s policies and prominent figure in the “Abenomics” reform initiatives. UK equities brought up the rear, hurt by the market’s high exposure to sectors perceived to be vulnerable to COVID, as well as jitters about a no-deal Brexit.
Within fixed income, core bond yields dropped to historic lows in 2020, but rose sharply in 2021 and finished the review period higher.
Sovereign bonds issued by peripheral eurozone countries benefited from the European Central Bank’s (ECB) quantitative-easing programme, as well as the joint pandemic-relief fiscal stimulus initiative. Italian bonds were boosted late in the period as former ECB president Mario Draghi formed a new technocratic government.
Following the sharp widening in March 2020, spreads in the IG and HY markets tightened over the year in review. Meanwhile, EM bonds posted positive returns, helped by the risk-on backdrop and the ongoing hunt for yield among investors, which continued to drive funds into this asset class.
In commodities, oil and industrial metals rebounded strongly from the declines seen last March, aided by hopes of increased demand from a recovering global economy. Oil prices also benefited from OPEC-led production cuts. Gold – a traditional safe haven – notched only a modest gain, however.
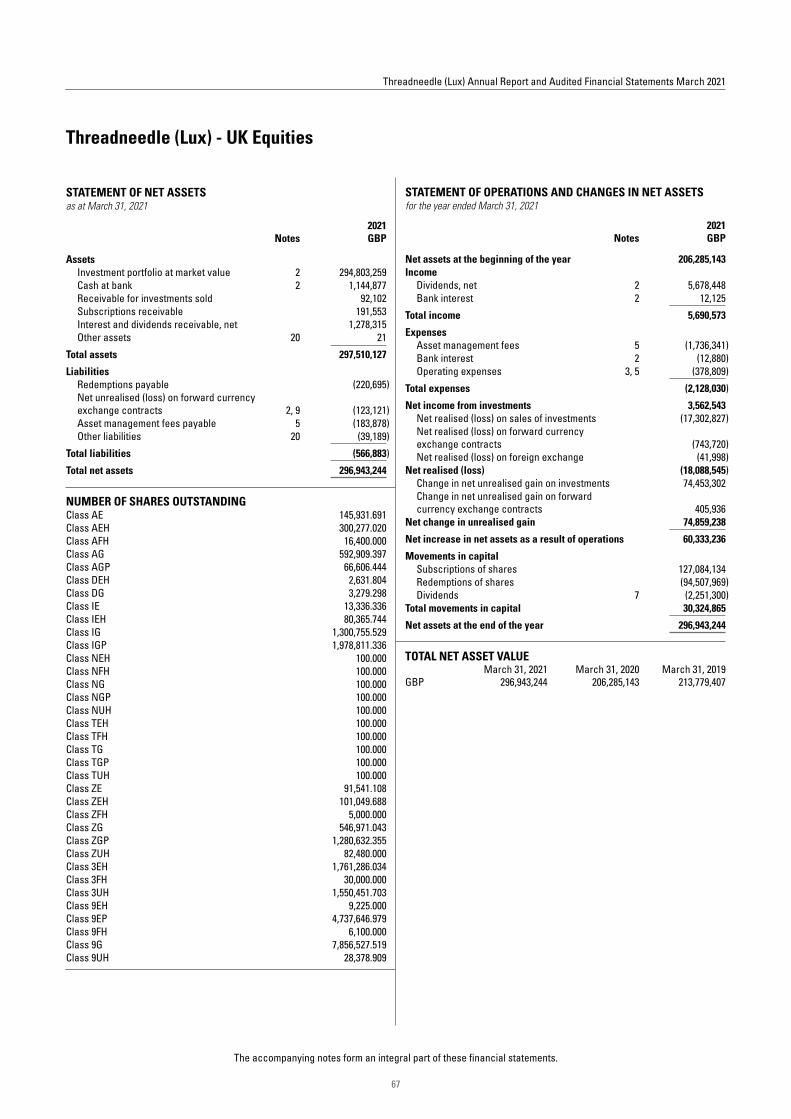
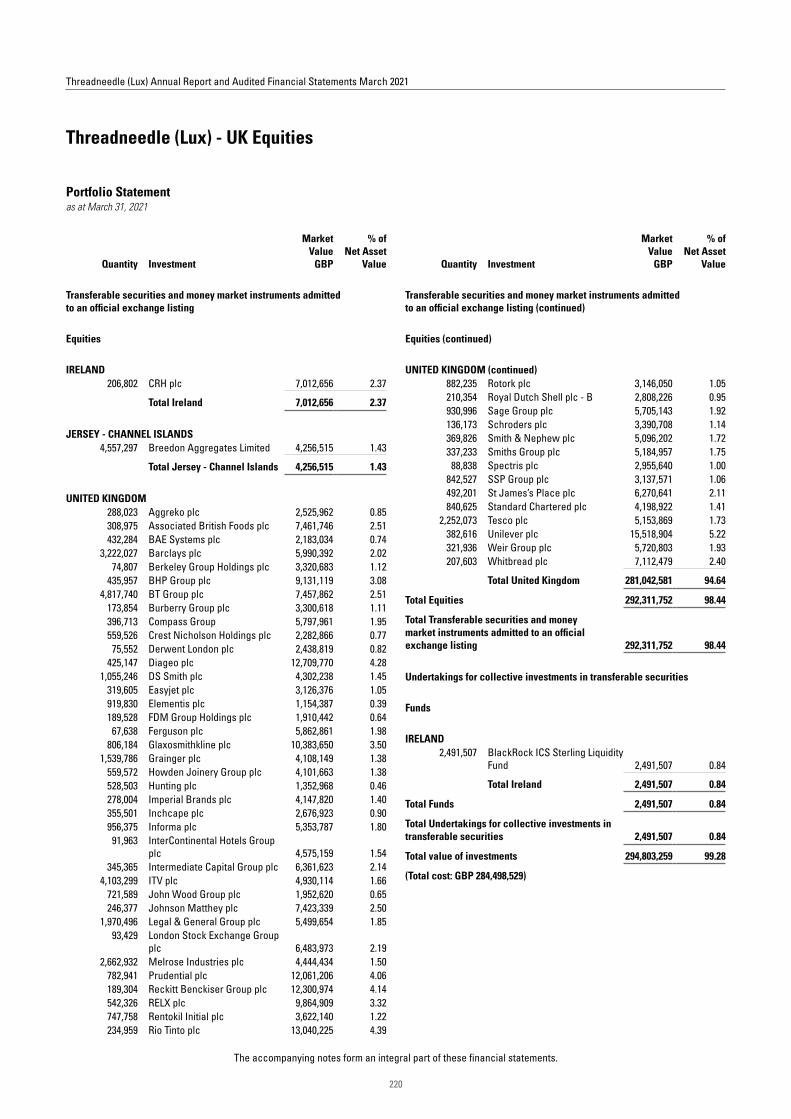
In terms of activity, in the Threadneedle (Lux) UK Equities Fund, defence manufacturer BAE Systems was a new addition. The firm’s growth prospects appear to be improving in several key areas, notably in the electronic and US land segments. Government spending on defence is expected to hold up well, particularly in the US, which accounts for nearly half of BAE’s revenues. We expect free cashflow to improve, which should pave the way for dividends to go up and for net debt to come down. Over the year, we also took advantage of companies’ fund-raisings in response to the crisis to top up some holdings, such as Whitbread and Compass. The position in RSA Insurance was profitably closed ahead of the company’s takeover. We also sold British American Tobacco; we feel that over the long term, return on capital is likely to be constrained unless the company cuts dividends or deleverages.
Directors’ Report(continued)
6
Threadneedle (Lux) Annual Report and Audited Financial Statements March 2021
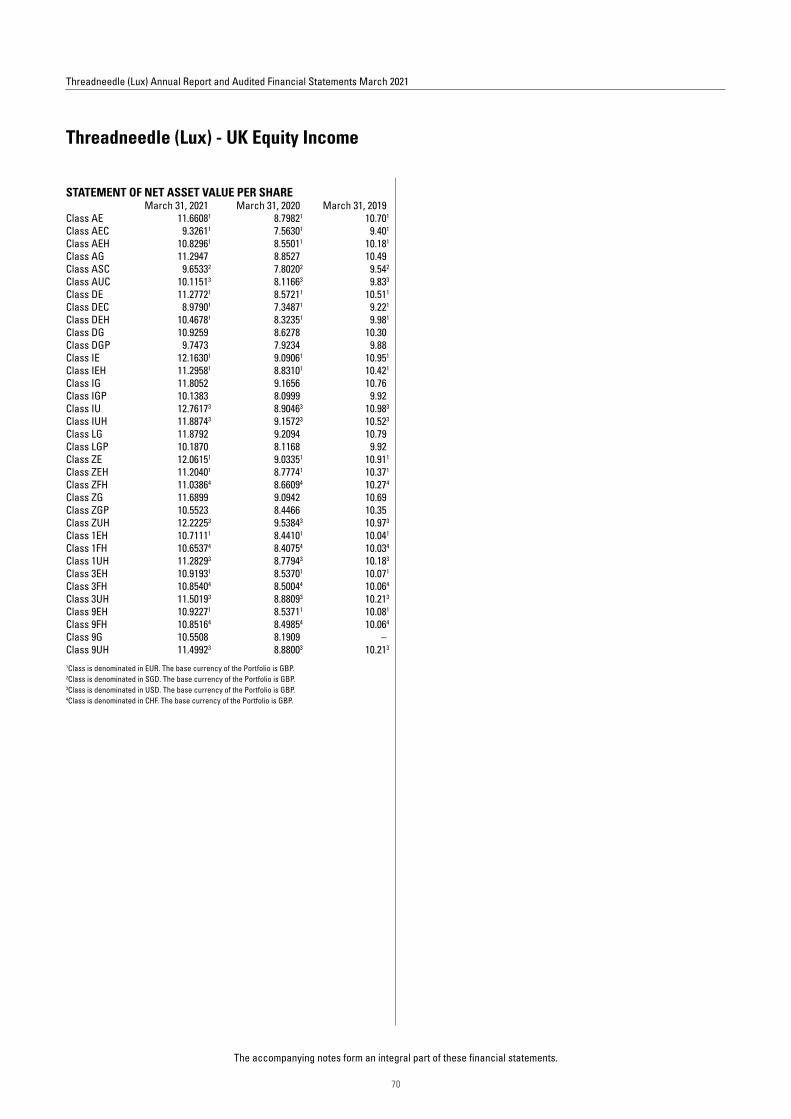
In the Threadneedle (Lux) UK Equity Income Fund, we initiated a position in Direct Line, one of the major personal-lines insurers in the UK. The stock was trading at an attractive valuation with a favourable dividend yield. With a range of well-established brands, the company also boasts scale and diversification advantages – factors which bode well for profitability. Over the review period, we also topped up some existing holdings, such as Imperial Brands, JD Wetherspoon and Rank; the last of these was among the holdings that we increased by taking advantage of the aforementioned refinancing measures. We profitably sold RSA Insurance ahead of the company’s takeover. We also realised some gains in AstraZeneca, which performed well in 2020.
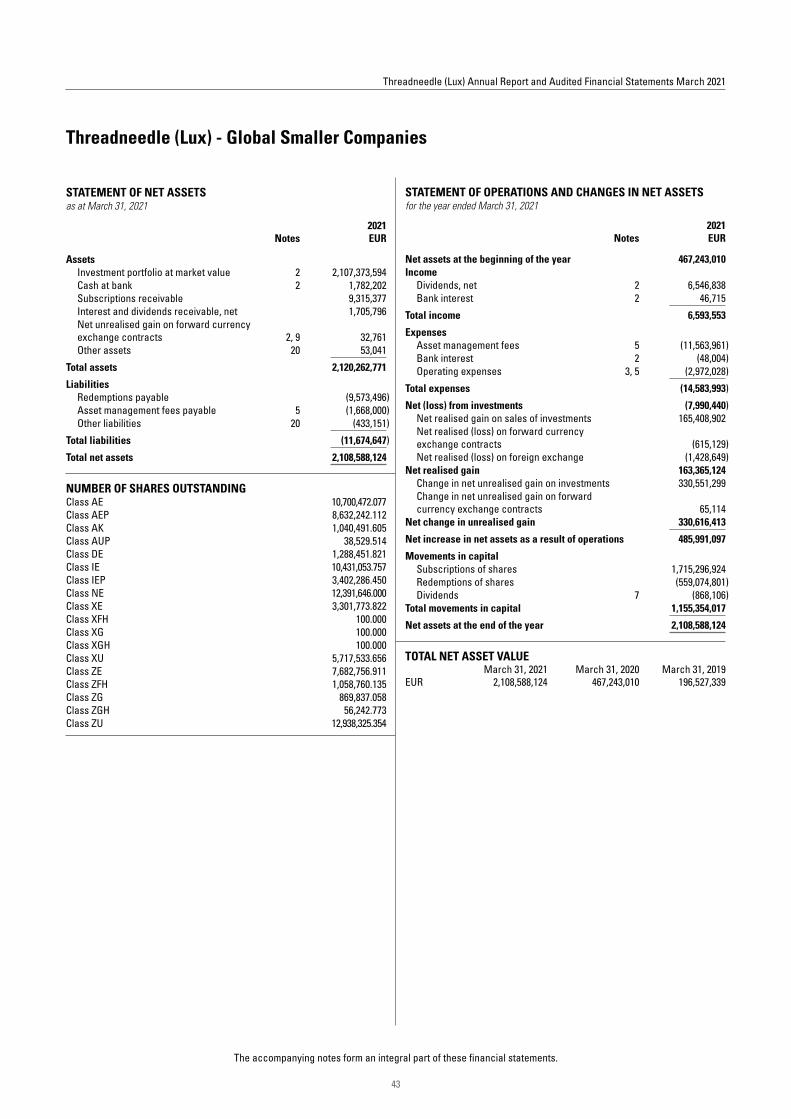
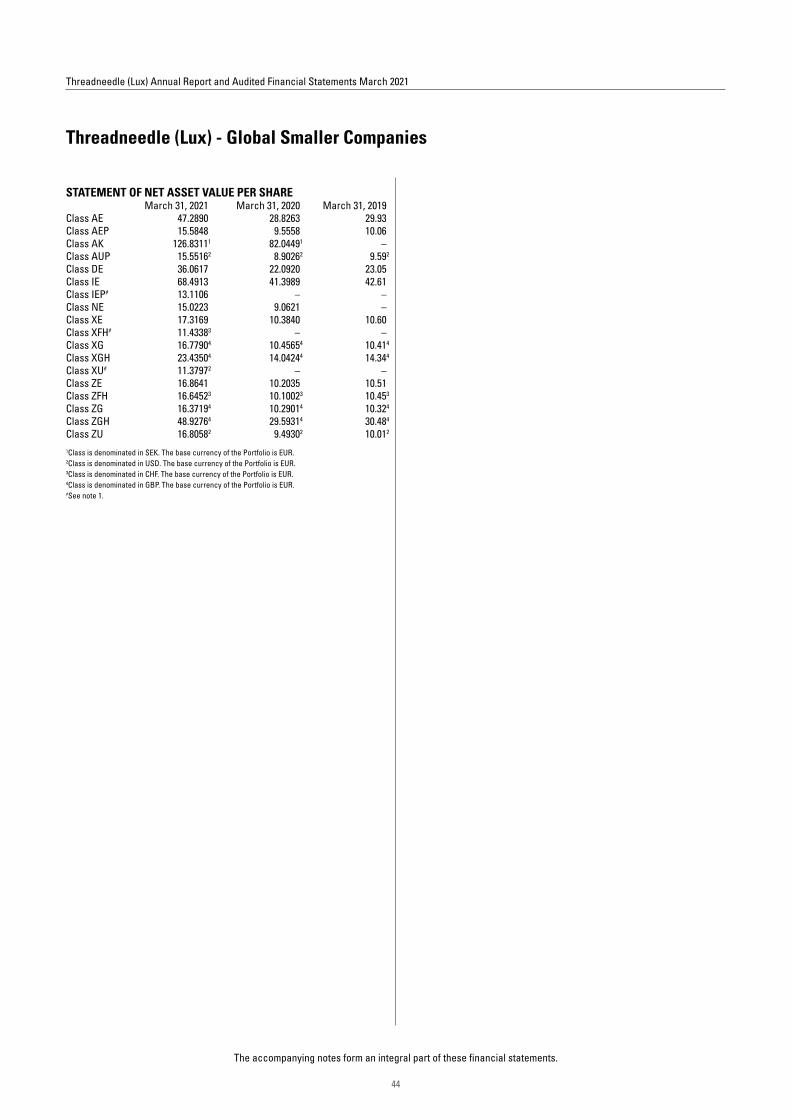
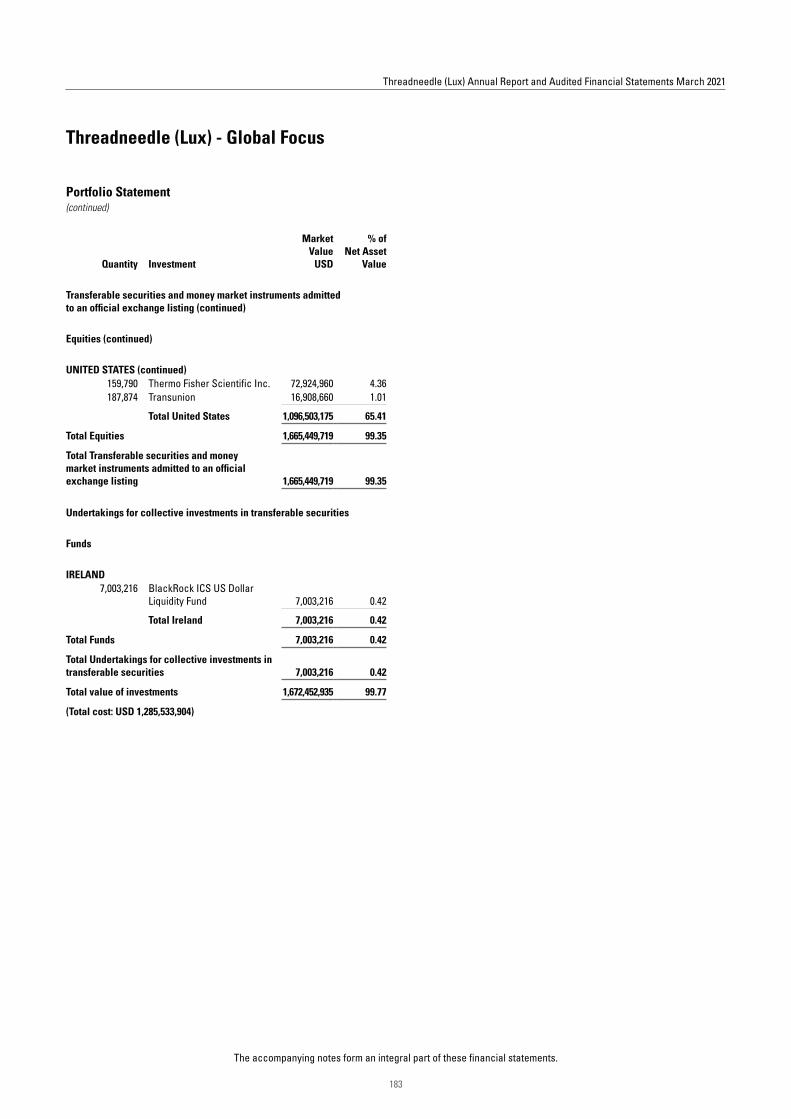
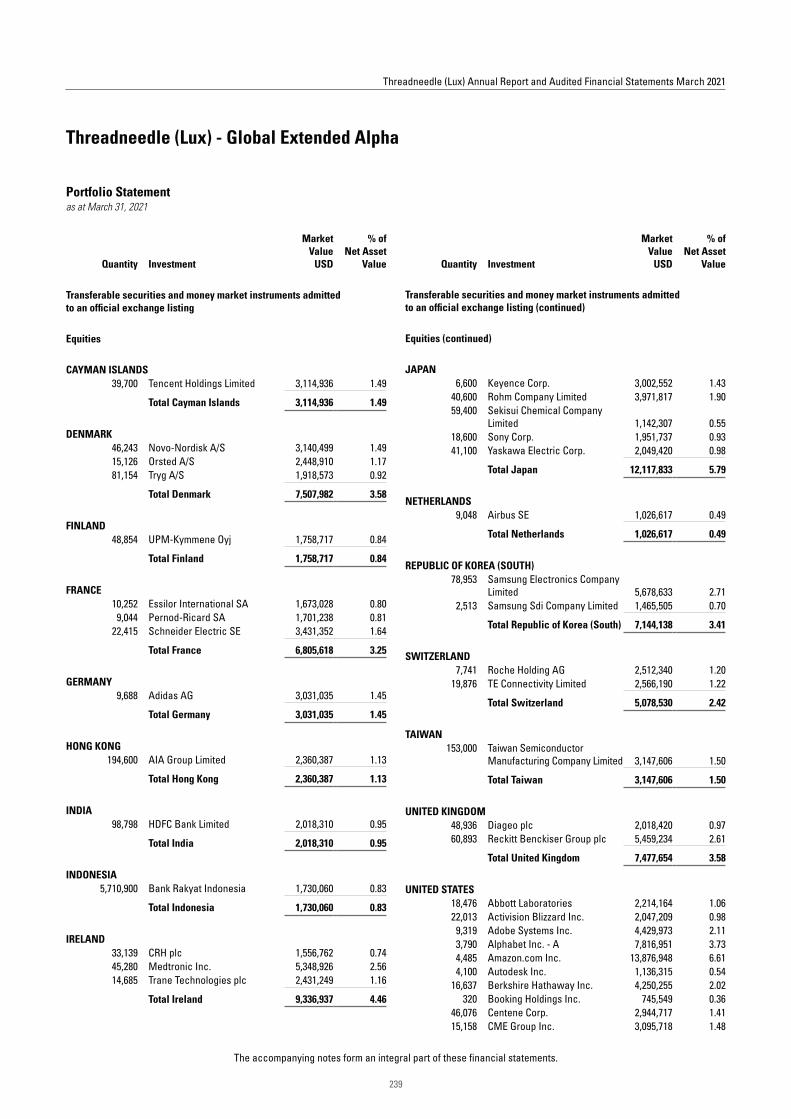
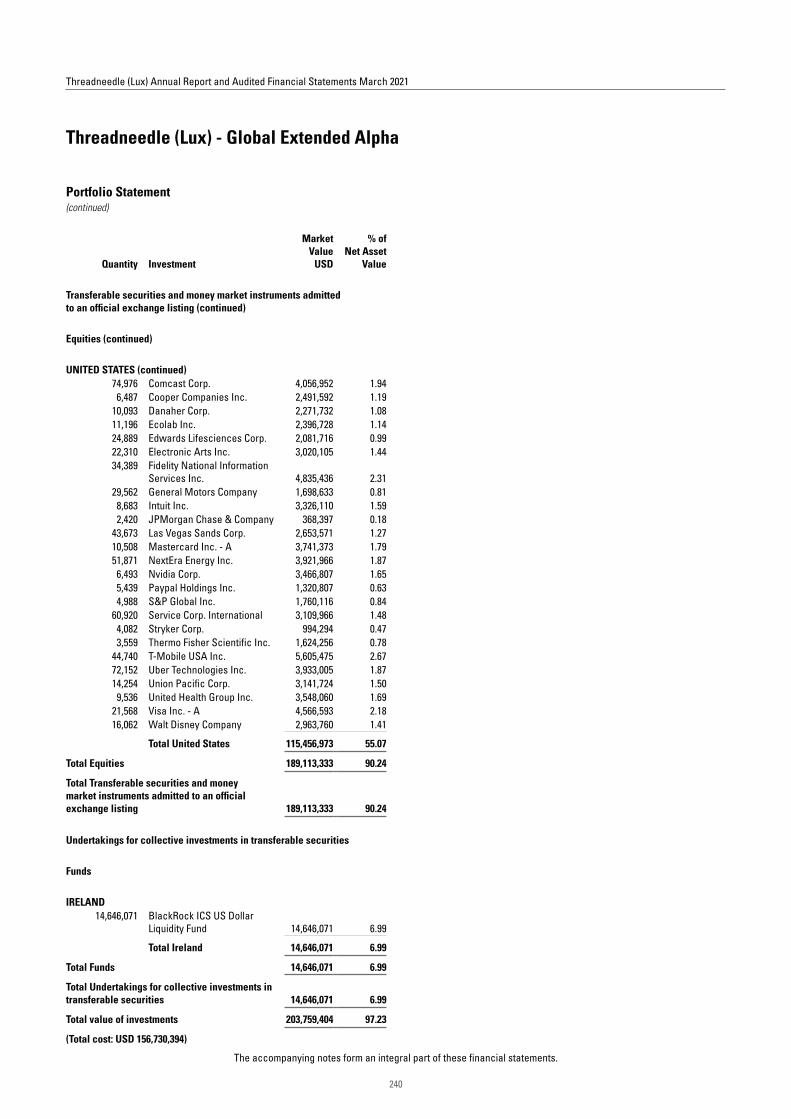
In the Threadneedle (Lux) Global Focus, Threadneedle (Lux) Global Select, Threadneedle (Lux) Global Extended Alpha and Threadneedle (Lux) Global Smaller Companies funds, we retain our focus on companies with durable competitive advantages, as we believe these are best placed to continue delivering high returns and earnings growth across a range of market conditions. Purchases in some of these funds included T-Mobile US and Intuit. T-Mobile US is the leading challenger brand in American wireless. The company boasts a resilient business model and is well positioned to gain market share post-pandemic, as the demand for cloud computing and the development of 5G increases. Software solutions firm Intuit is seeing increasing momentum across its business segments and boasts operational efficiencies and strong financial discipline. Sales included Chinese retailer Alibaba. The tightening of Chinese regulations has clouded the firm’s outlook, so we decided to reallocate this capital elsewhere. We also exited RELX, due to concerns about the impact of the pandemic on the firm’s events business.
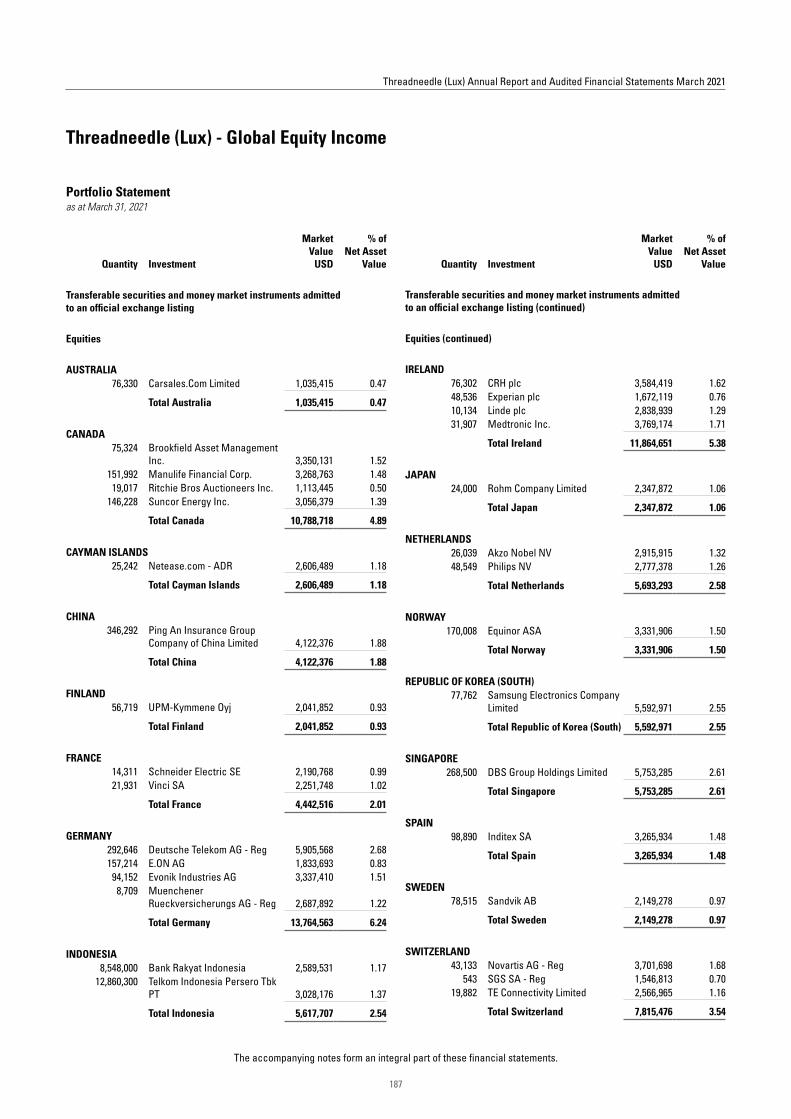
Within the Threadneedle (Lux) Global Equity Income Fund, we maintain our focus on quality income – companies with high, rising and sustainable dividend streams. New positions included Microsoft and Fidelity National Information Services (FIS). Microsoft boasts large distribution channels and an installed customer base which serve as durable competitive advantages, while FIS’s scale leaves it well placed to capitalise on trends such as cashless transactions, e-commerce and emerging-market wealth creation. Sales included Hong Kong Exchanges and Clearing, Pfizer and Verizon, following these stocks’ strong gains.
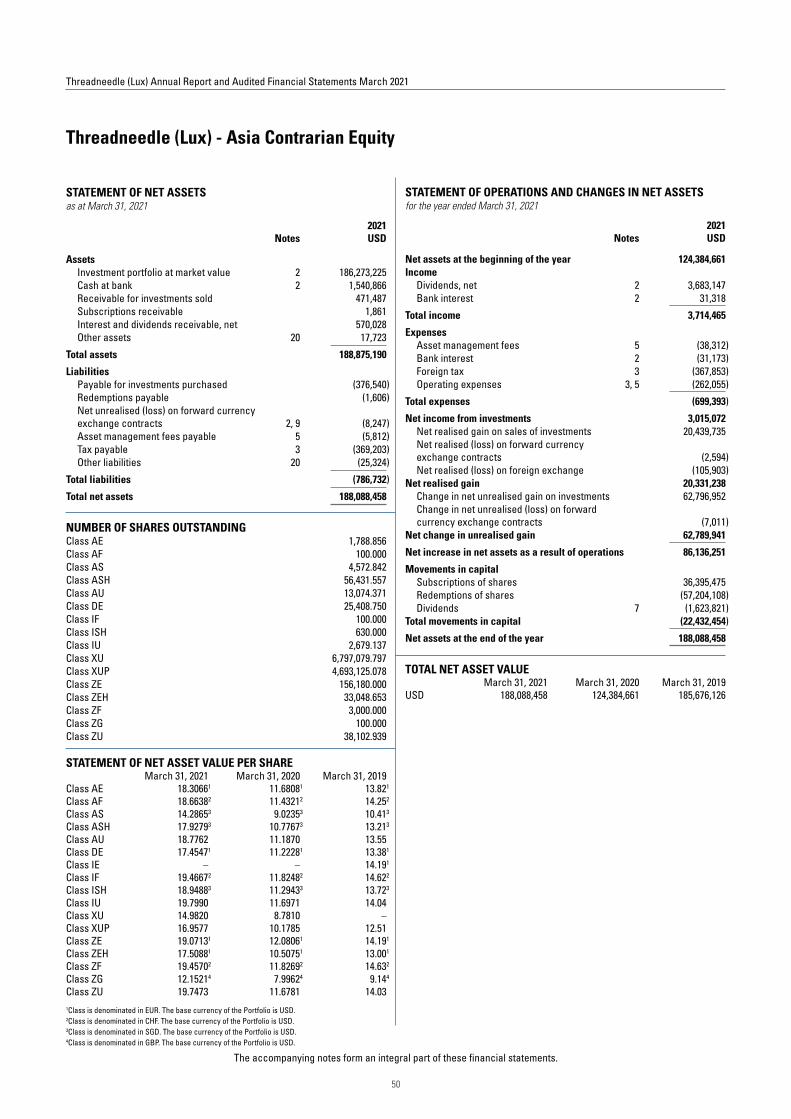
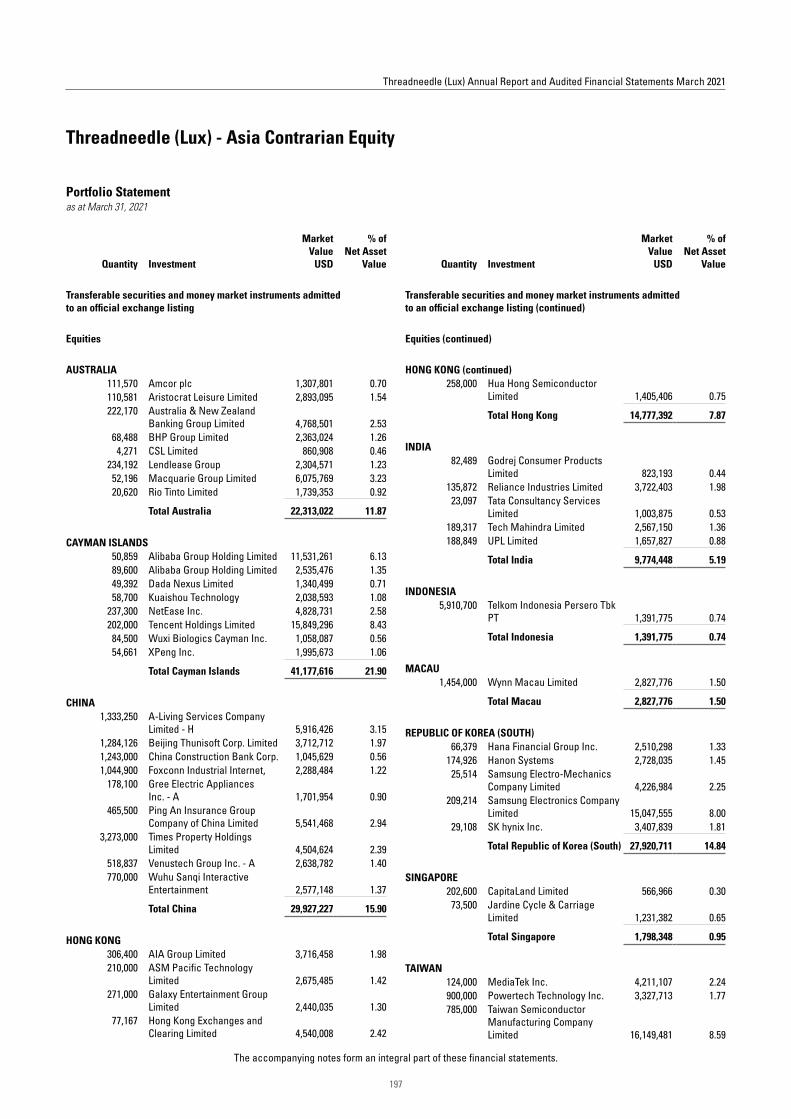
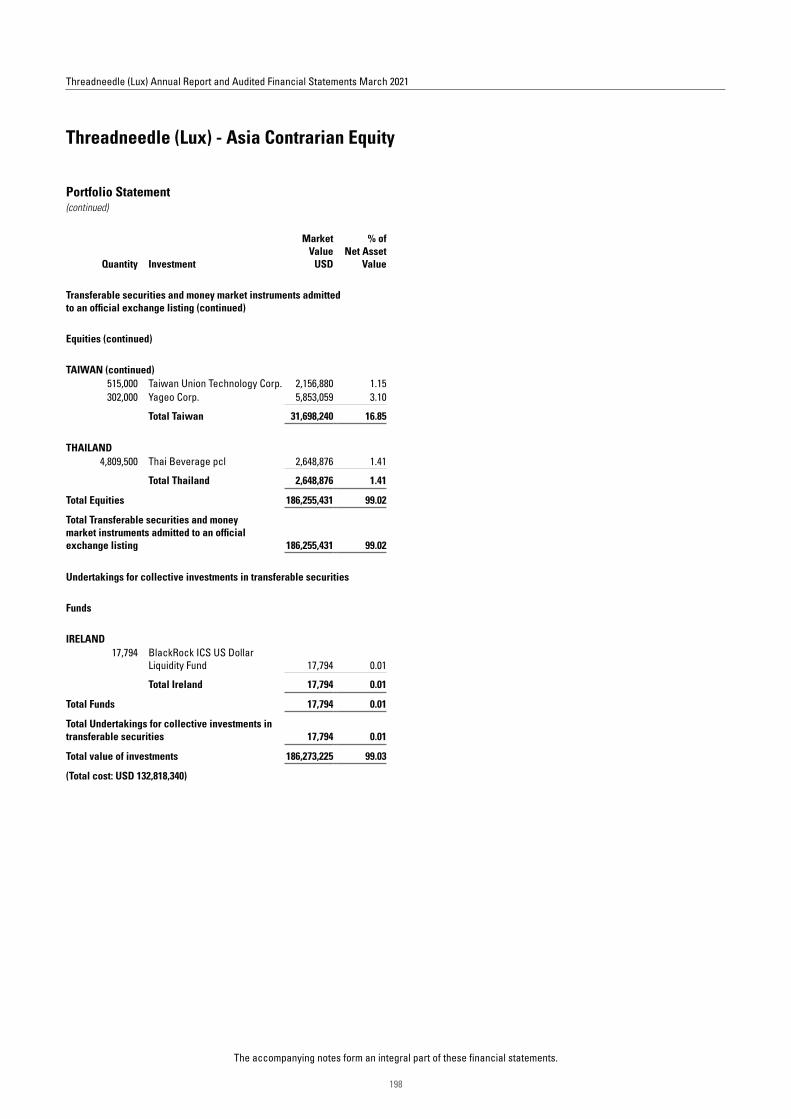
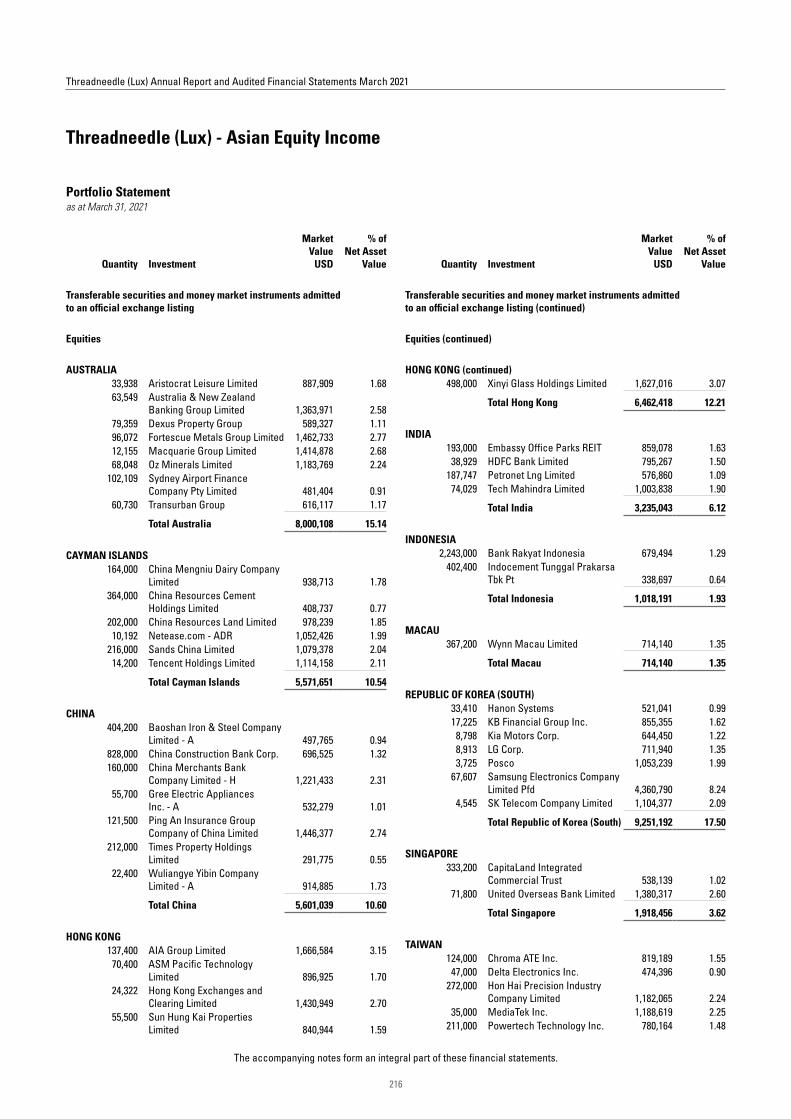
In the Threadneedle (Lux) Asia Contrarian Equity Fund, new holdings that performed particularly well included Dada Nexus, Hanon Systems, Tech Mahindra and SK Hynix. Dada Nexus is an e-commerce play with a strong digital solution for online retail and a crowdsourcing platform for delivery service. Korea’s Hanon Systems is a leading manufacturer of thermal systems for the autos industry, and should gain from the growing demand for electric vehicles. Indian IT services provider Tech Mahindra stands to benefit from demand for IT upgrades to help leverage 5G technology. SK Hynix is one of the world’s foremost memory-chip foundries and operates within an oligopolistic market. In February, we trimmed exposure to technology hardware companies which had outperformed significantly, and where valuations no longer looked as appealing. Some of the proceeds were used to increase exposure to software companies, including a new position in Beijing Thunisoft. The IT solutions company is expected to grow with the trend towards digitalisation and cloud migration. An earlier new software holding in the portfolio was Venustech, a leading security software provider in China benefiting from demand from cloud computing. We sold E-Mart, CapitaLand Integrated Commercial Trust, China Life Insurance, Beijing Enterprises Water, Adani Ports and Indonesian property developer Pakuwon Jati. In some cases, valuations no longer looked as attractive following strong performance, while others seemed unlikely to perform well due to the lack of a share-price catalyst. At the end of the reporting period, the fund’s biggest overweight was in Taiwan, while India was the key underweight given its high valuation.
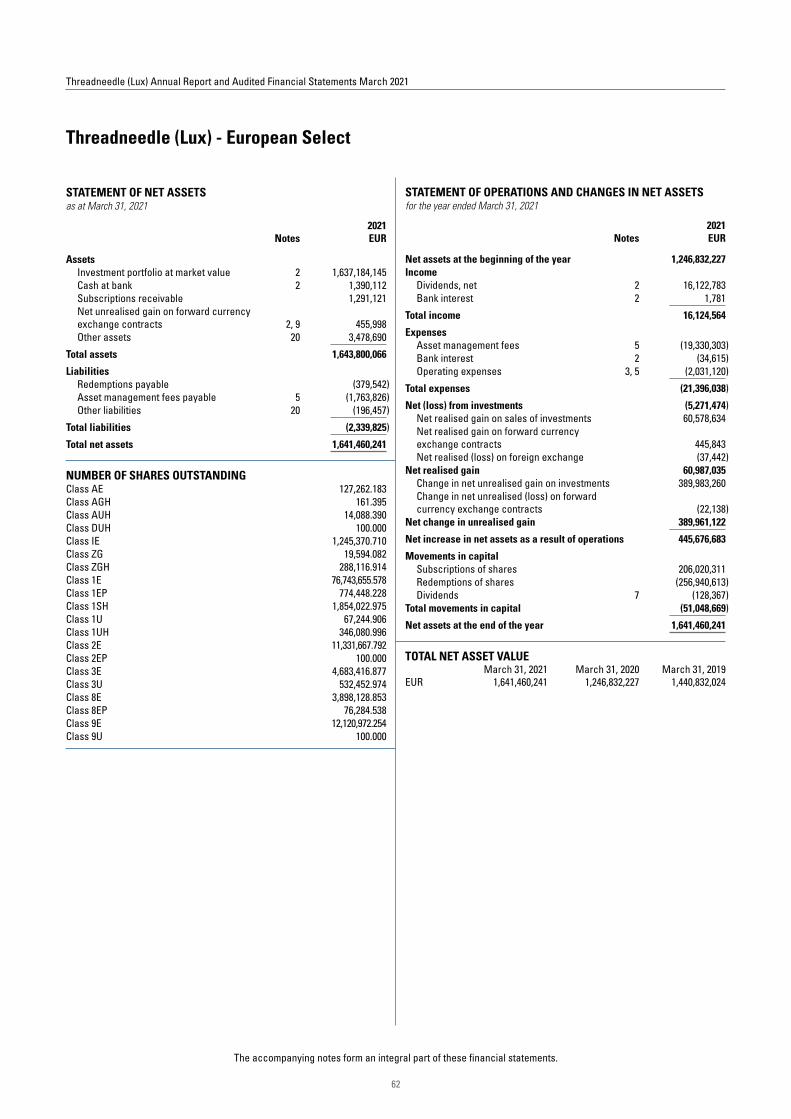
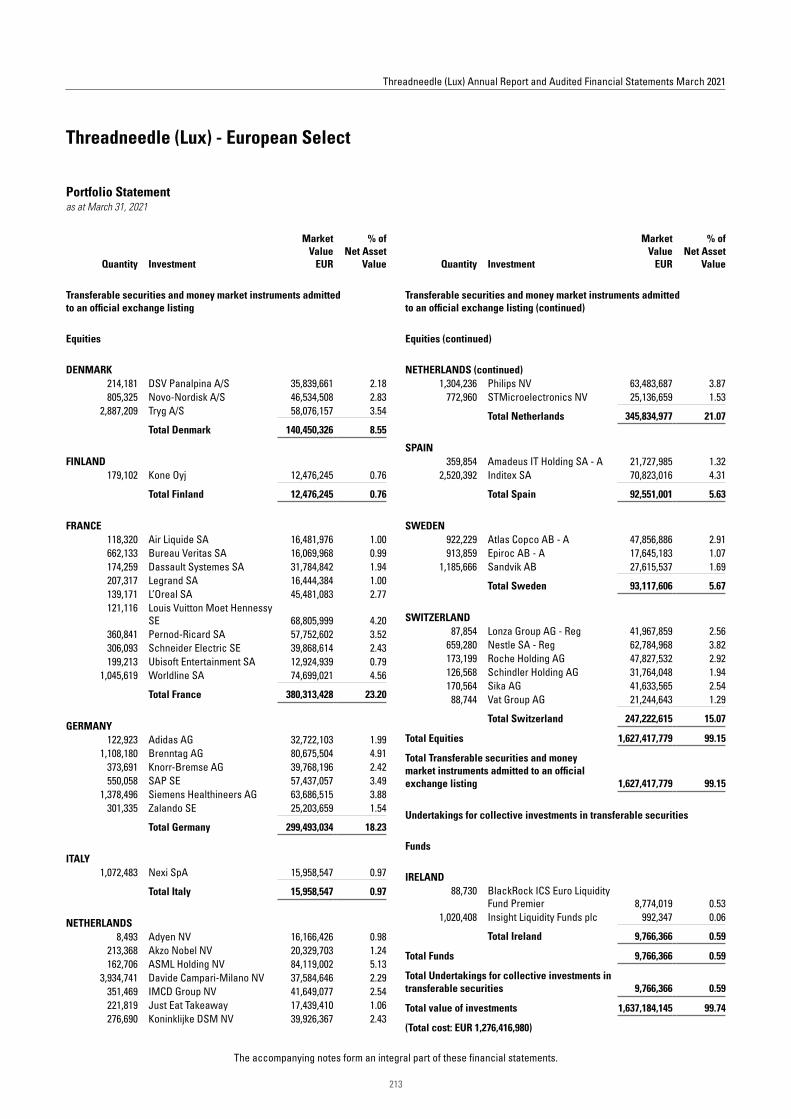
In the Threadneedle (Lux) European Select Fund, our main focus in managing this high-conviction portfolio is on stock selection. We seek to identify high-quality companies with the pricing power to sustain strong returns. During the year, new positions included Siemens Healthineers, Tryg and STMicroelectronics. Siemens Healthineers is a world-leading hospital technology business; barriers to entry are high, which is likely to sustain market share and pricing, and there are encouraging opportunities in diagnostics. Tryg has a high-quality insurance franchise in the concentrated Scandinavian market. Scale supports the business model, makes it unattractive for new entrants to compete, and boosts customer loyalty. STMicroelectronics is a specialist in microprocessors and sensors used in auto and consumer electronics. Restructuring in recent years has focused on niche areas (where it has high market share) and manufacturing, with a likely boost to future margins, growth and returns. Sales included RELX; much of the company’s business has been resilient, but the exhibitions division is suffering heavily owing to virus-related lockdowns.
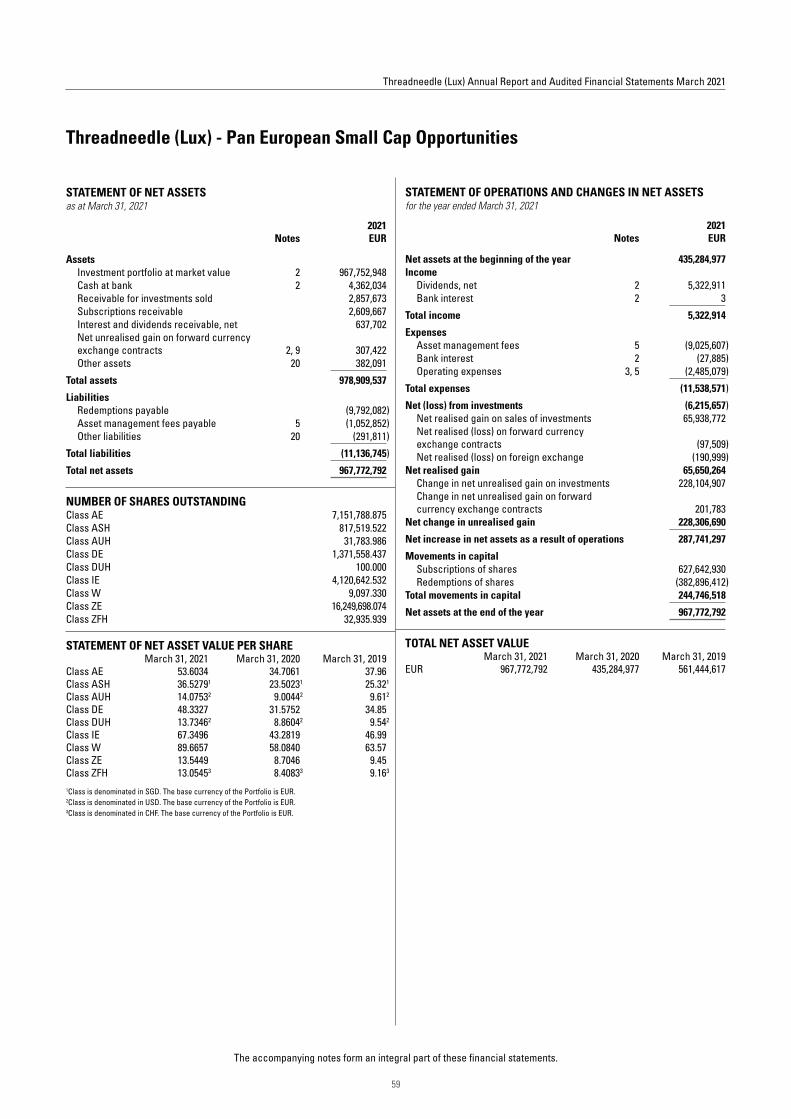
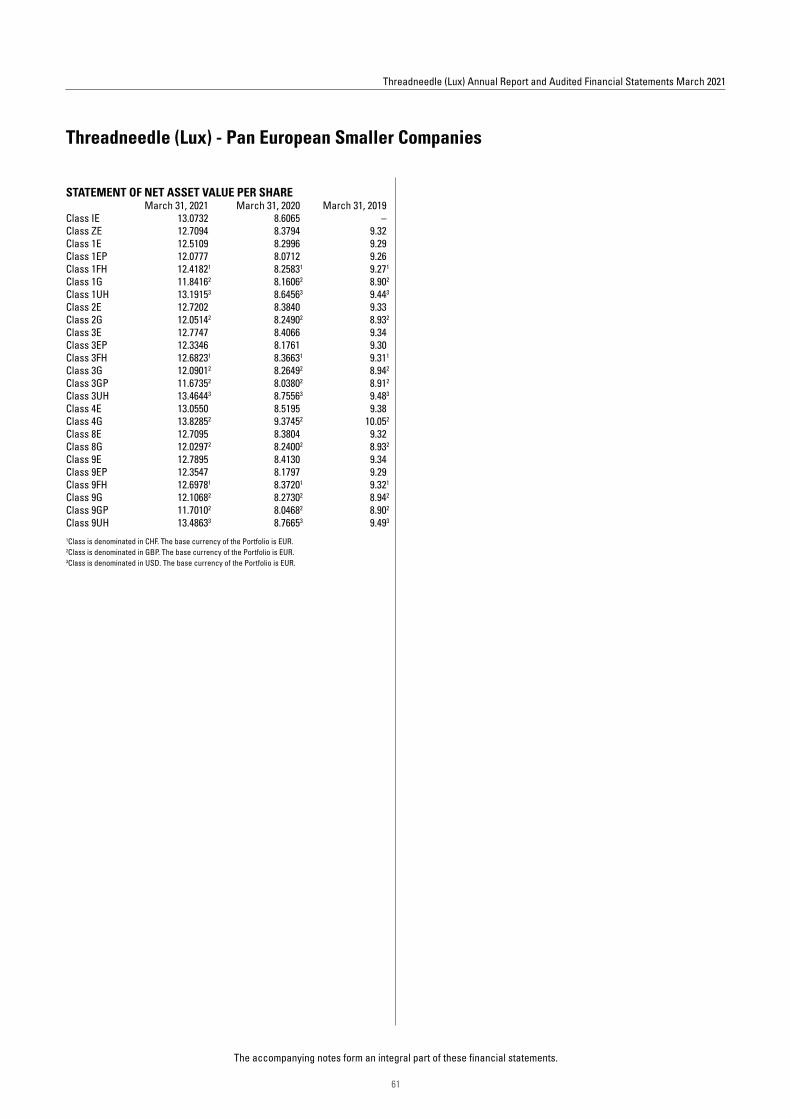
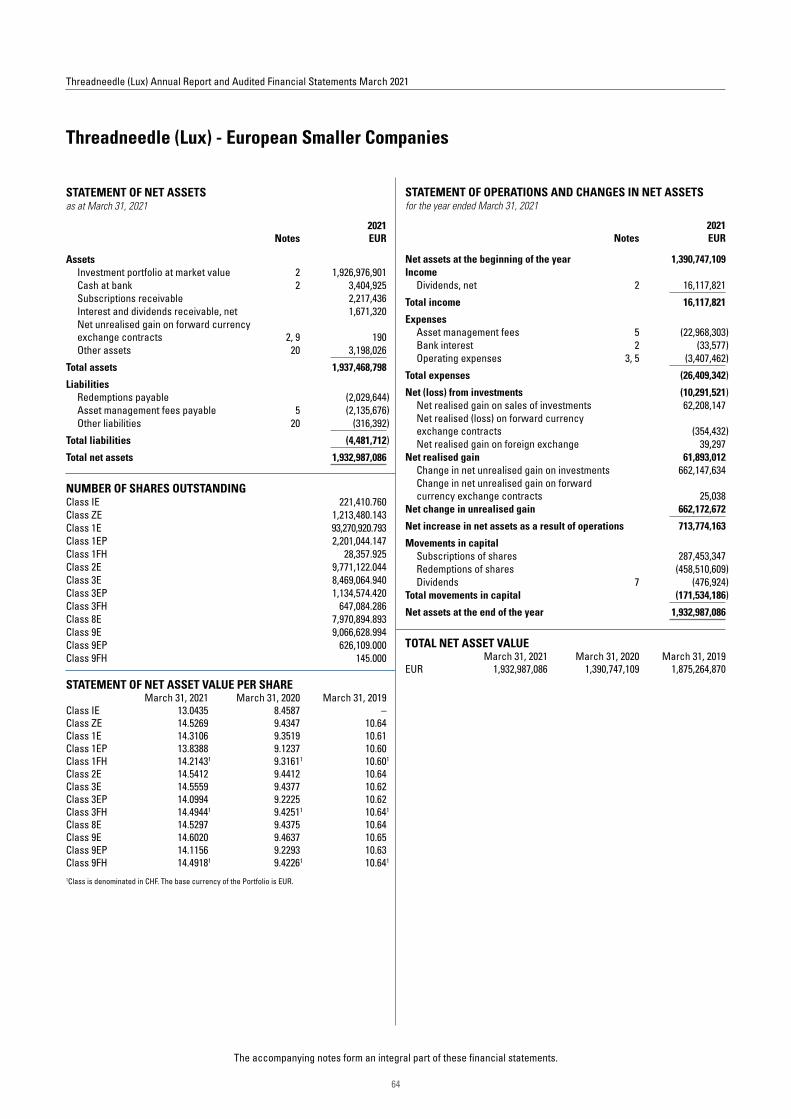
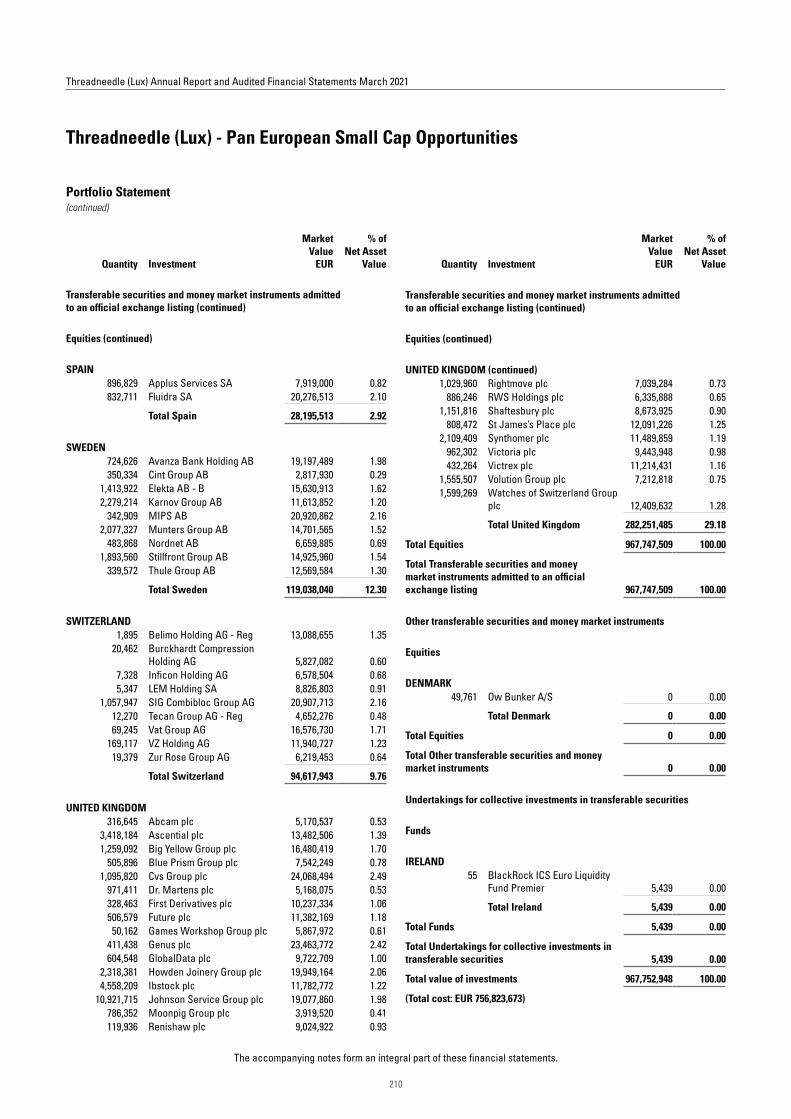
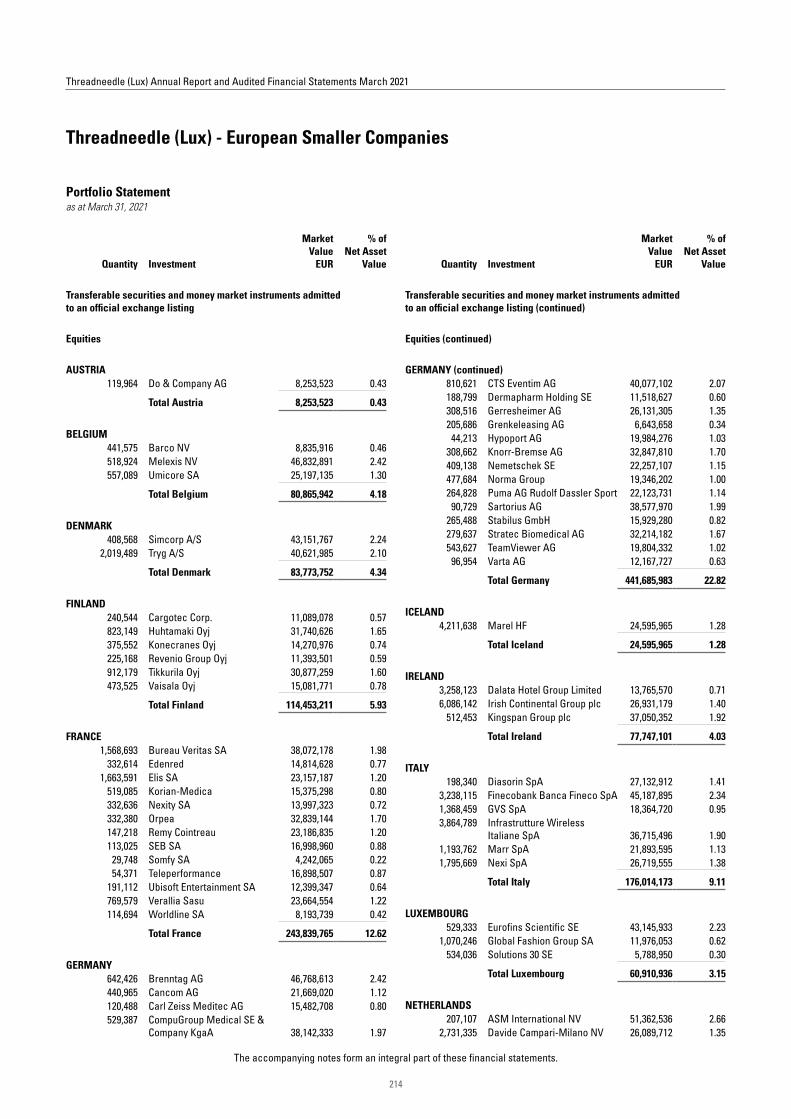
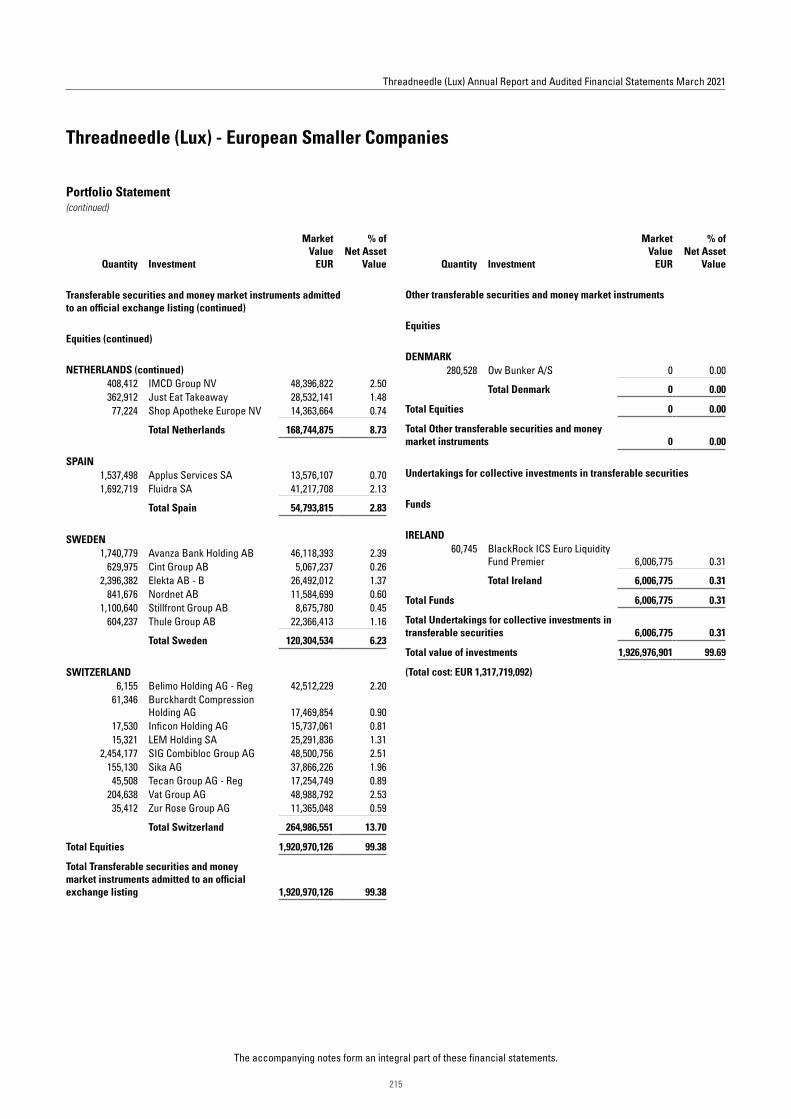
In the Threadneedle (Lux) Pan European Smaller Companies Fund, our main focus in managing the portfolio is on stock selection, informed by macroeconomic and thematic views. We favour companies that have a competitive advantage and pricing power generated by brands, patented processes, regulatory barriers to entry and strong market positions. We opened several new holdings during the year, including Watches of Switzerland, GVS and Shop Apotheke Europe. Watches of Switzerland sells premium brands to the ultra-rich, whose spending has held up well in the downturn. Demand exceeds supply, which is tightly controlled. GVS specialises in filtration systems, is now a major mask maker, and stands to benefit from COVID-19 safety measures. Shop Apotheke Europe has online pharmacy businesses, which operate in a number of European countries and are winning market share. Scale, regulation and product range create competitive advantage and barriers to entry. Sales included Ashtead Technology (equipment hire), following a period of good returns.
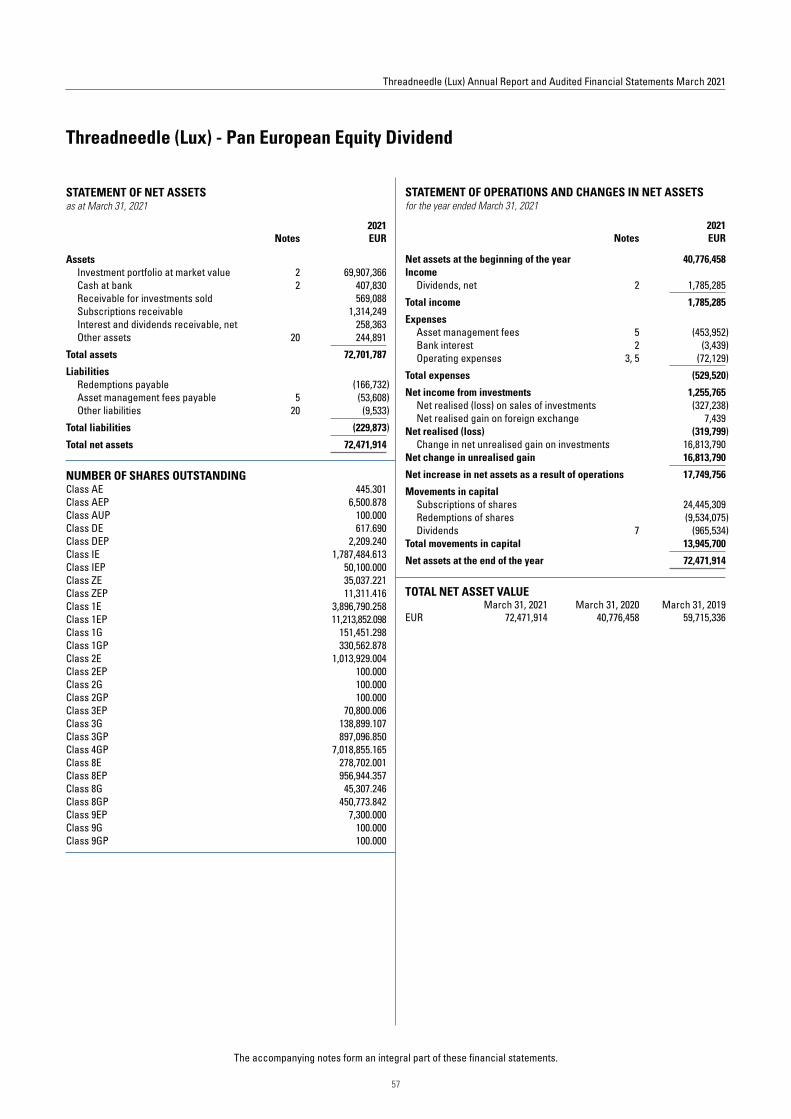
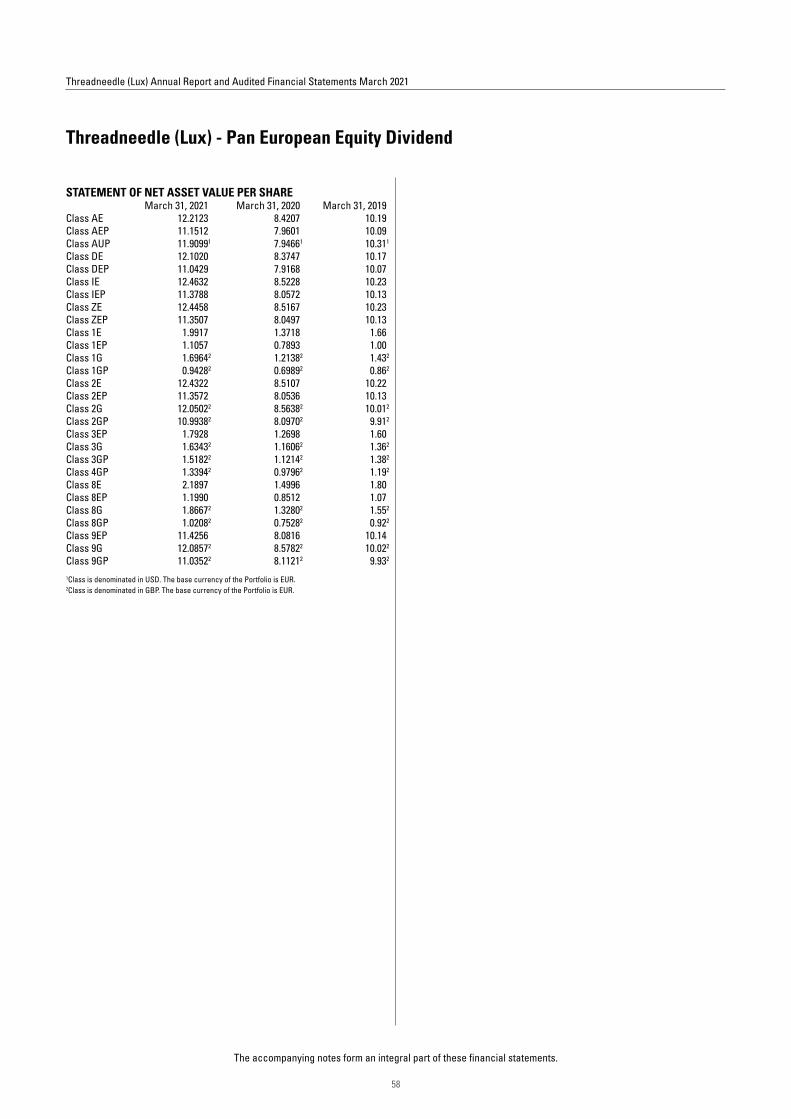
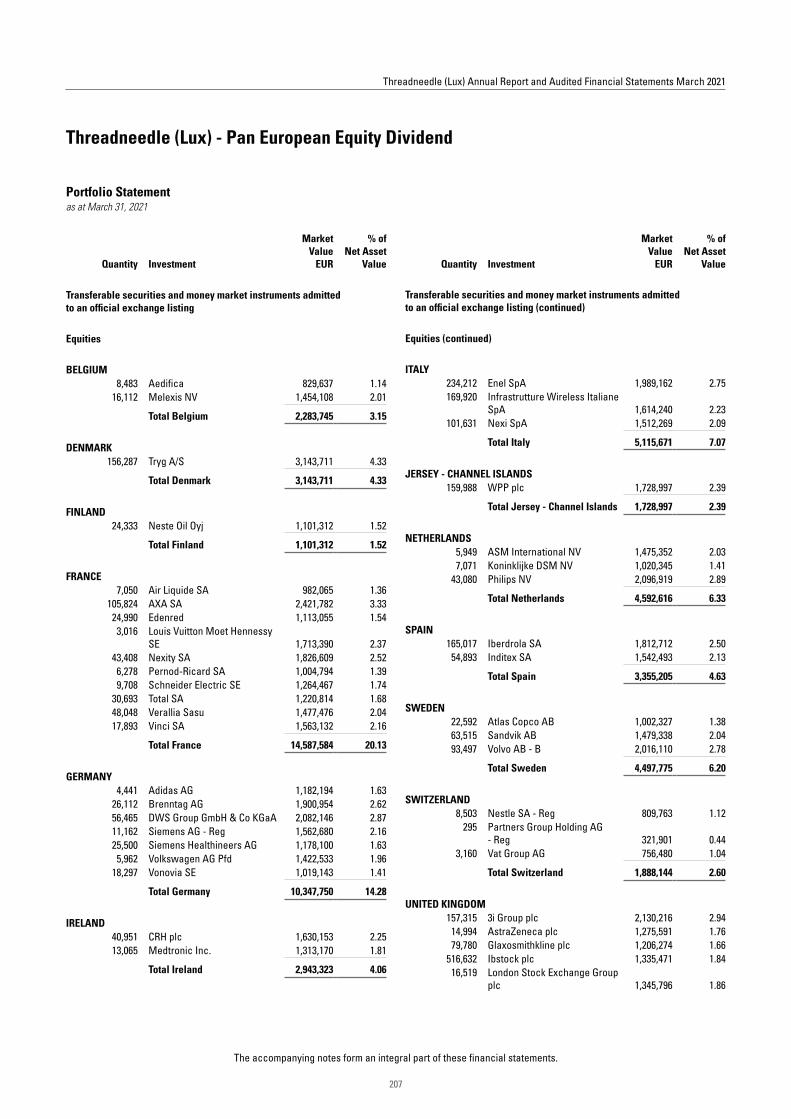
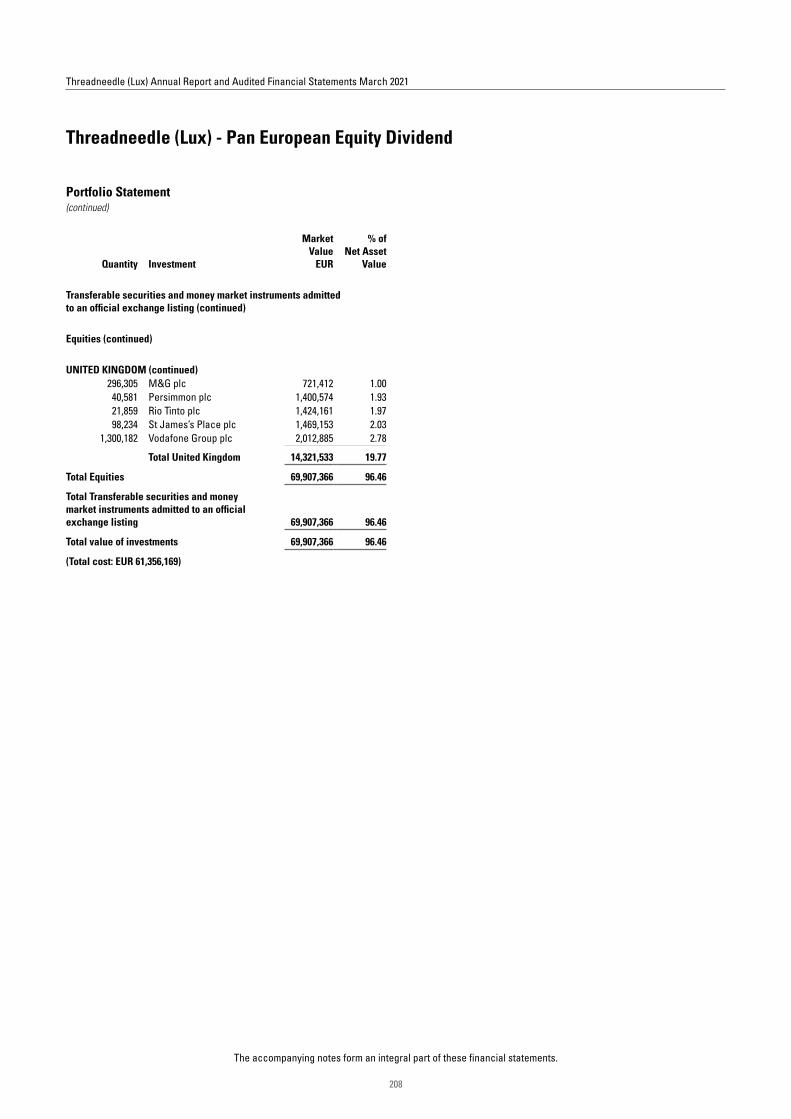
In the Threadneedle (Lux) Pan European Equity Dividend Fund, our main focus in managing the portfolio is on stock selection, informed by macroeconomic and thematic views. Several companies have announced dividend cuts in the wake of the coronavirus pandemic, but we aim to steer a way through this tough environment by focusing on high-quality companies with pricing power. During the year, new holdings included 3i, Nexi and Enel. 3i focuses on private equity, infrastructure and debt management; the company’s robust balance sheet and strong management give it a competitive edge. 3i has an excellent track record of investments and is a healthy dividend payer. Nexi, a payments processor, is seeing indications of an acceleration in the structural transition from cash to digital payments. The merger with SIA will create a fully integrated European payments technology business, enhancing longer-term earnings prospects. Enel was a traditional distributor of gas and electricity, but is transforming itself into a leading alternative energy company. Sales included FinecoBank (online banking and brokerage services), following a period of strong returns.
Directors’ Report(continued)
7
Threadneedle (Lux) Annual Report and Audited Financial Statements March 2021
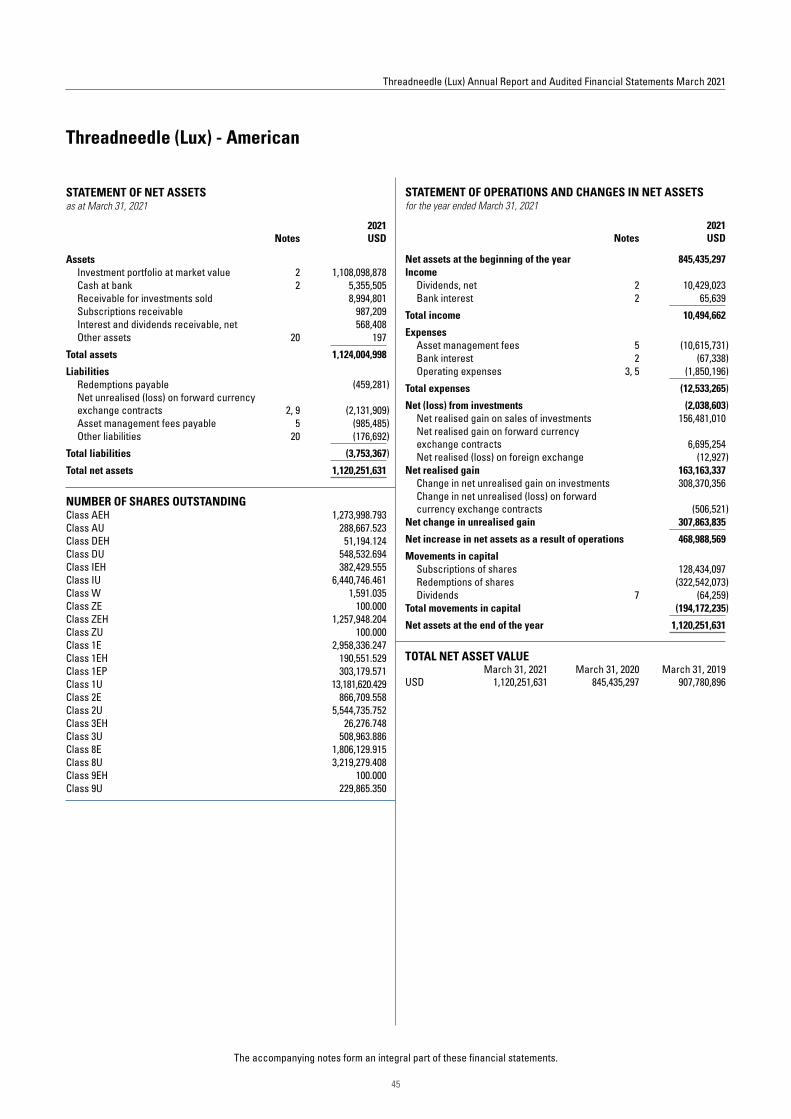
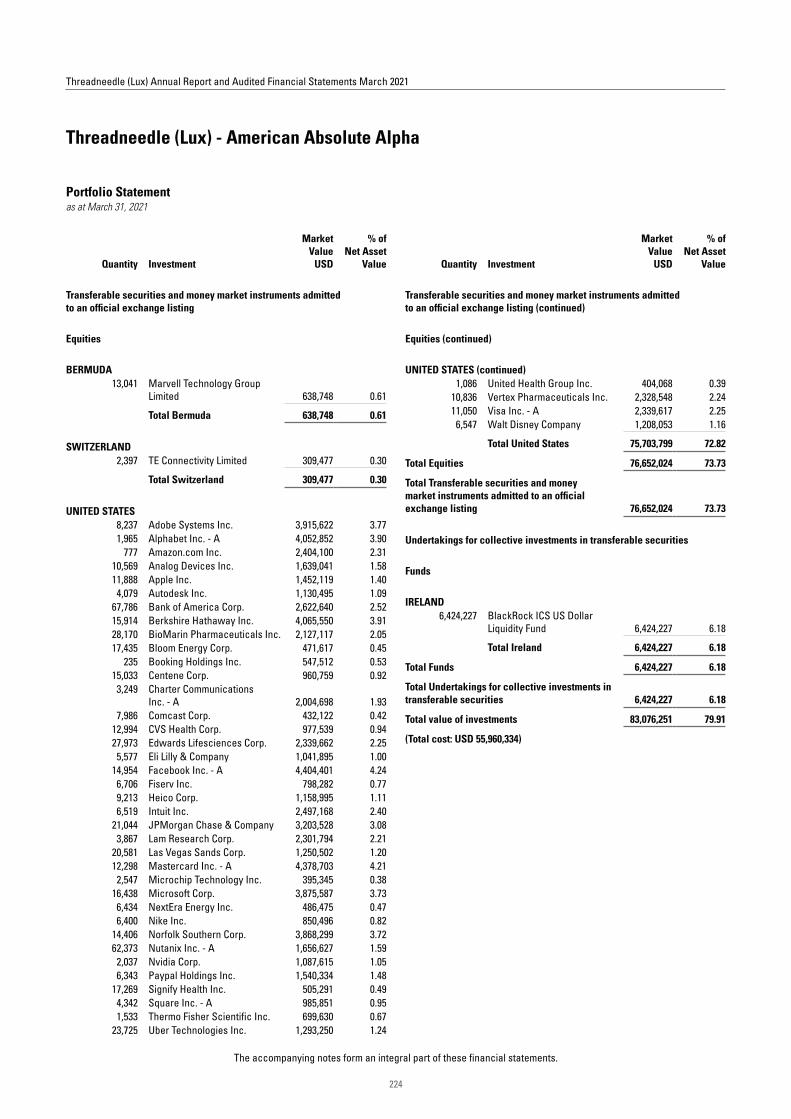
Within the Threadneedle (Lux) American Fund, we initiated positions in Morgan Stanley and Intercontinental Exchange (ICE). Morgan Stanley’s acquisition of fund manager Eaton Vance in October is accelerating the firm’s shift towards a more stable, fee-based asset-management model. Additionally, margins are improving and new-client and asset growth is rising within the firm’s wealth management division. ICE operates in an effective duopoly with CME Group in the futures exchange industry. As well as providing clearing services, ICE has a data business relaying information including pricing and volume figures to traders, and is moving into new areas such as mortgage services, with the aim of automating mortgage origination; if successful, this would be a very attractive proposition. Sales included Visa, Procter & Gamble and Apple.
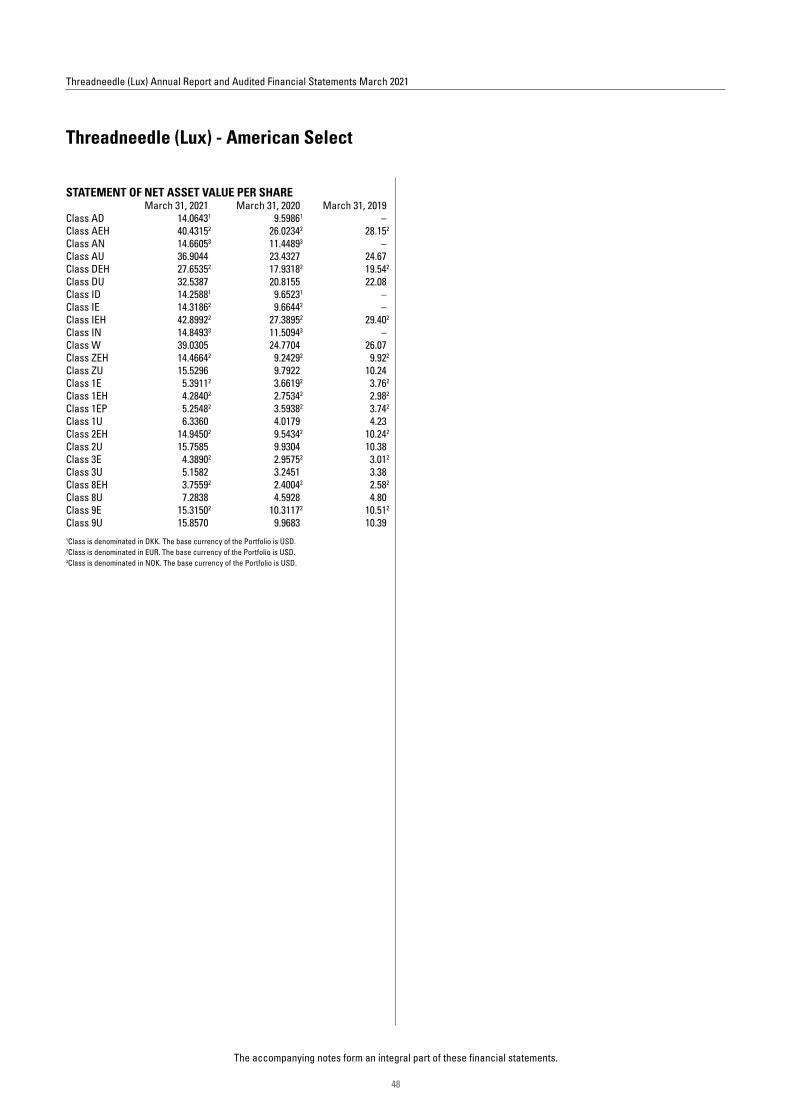
New holdings in the Threadneedle (Lux) American Select Fund during the year included financial software company Intuit, casino operator Las Vegas Sands and online payments firm PayPal. We exited PNC Financial Services, Alexion Pharmaceuticals and Mondelez International, following strong performance.
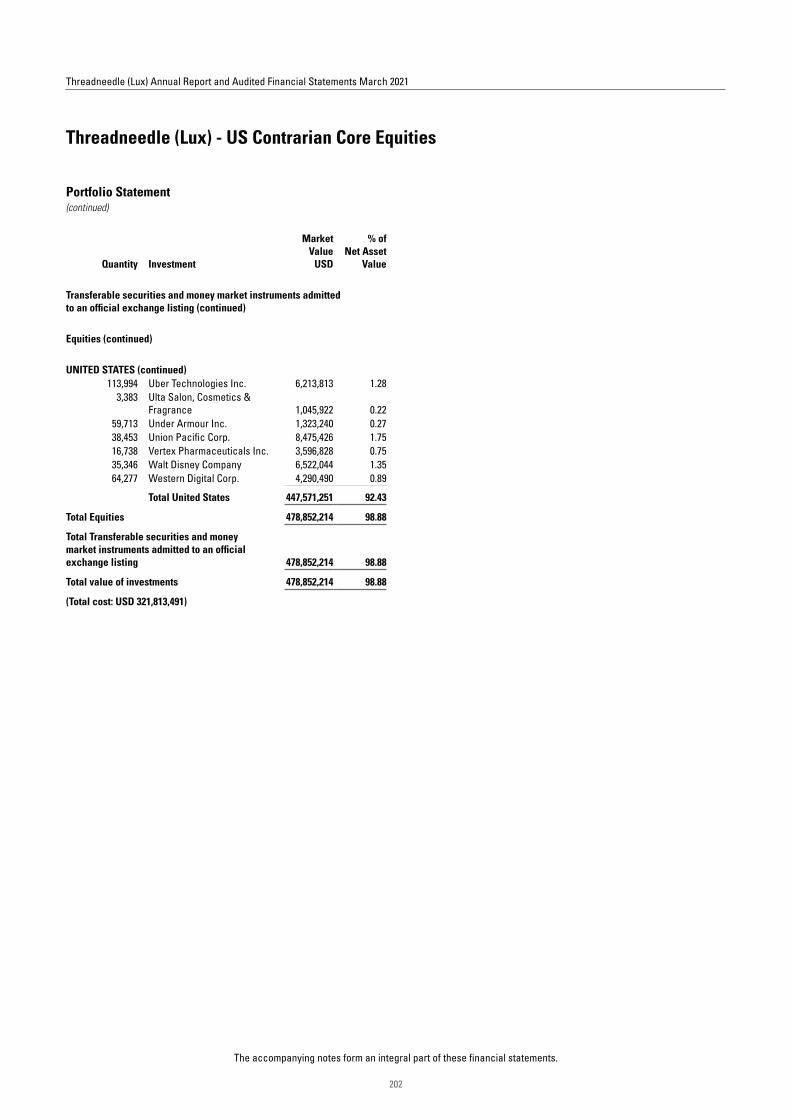
In the Threadneedle (Lux) American Smaller Companies Fund, new holdings included Avista and Under Armour. Electric and gas utility Avista is poised to expand its rate base at a sustainable 3–5% pace, reflecting an increased focus on renewable power and leading to low-single-digit dividend growth. We believe there is a strong sales and margin-recovery opportunity ahead for athletic-wear brand Under Armour, given a pandemic-driven tailwind for athleisurewear and households’ improved expense discipline. Among sales, the fund profitably closed its positions in Medifast, Cubic and MTS Systems, following recent gains.
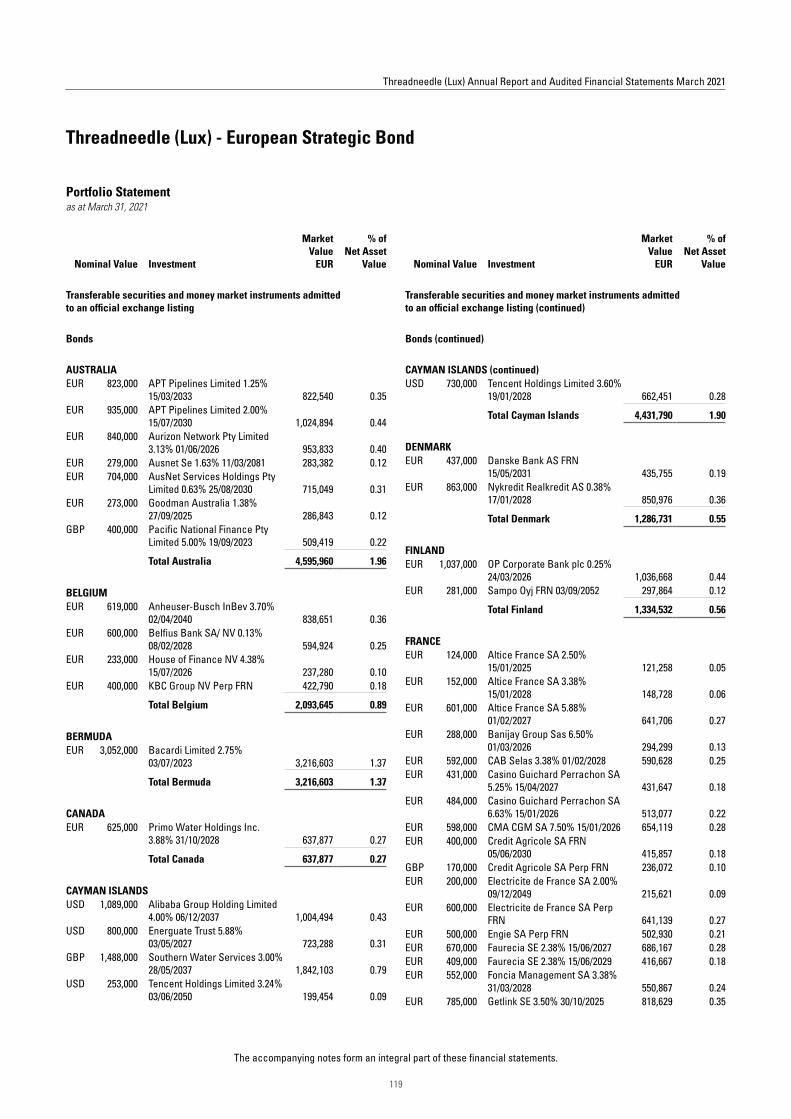
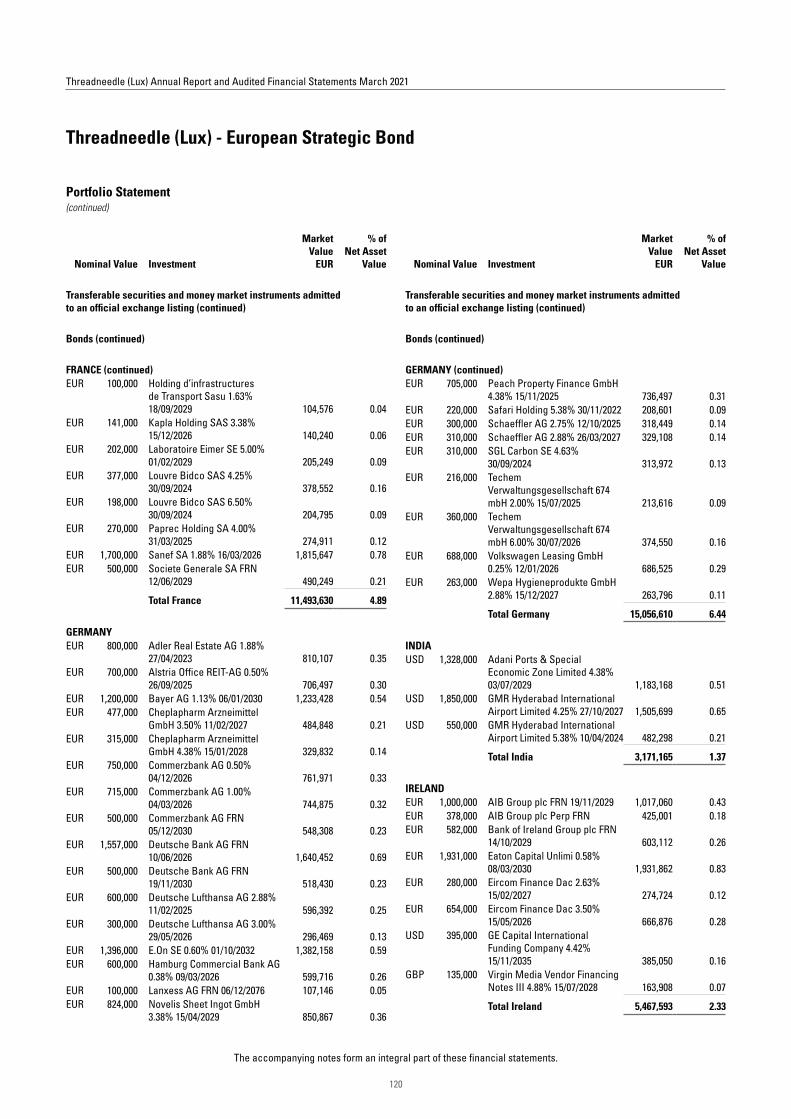
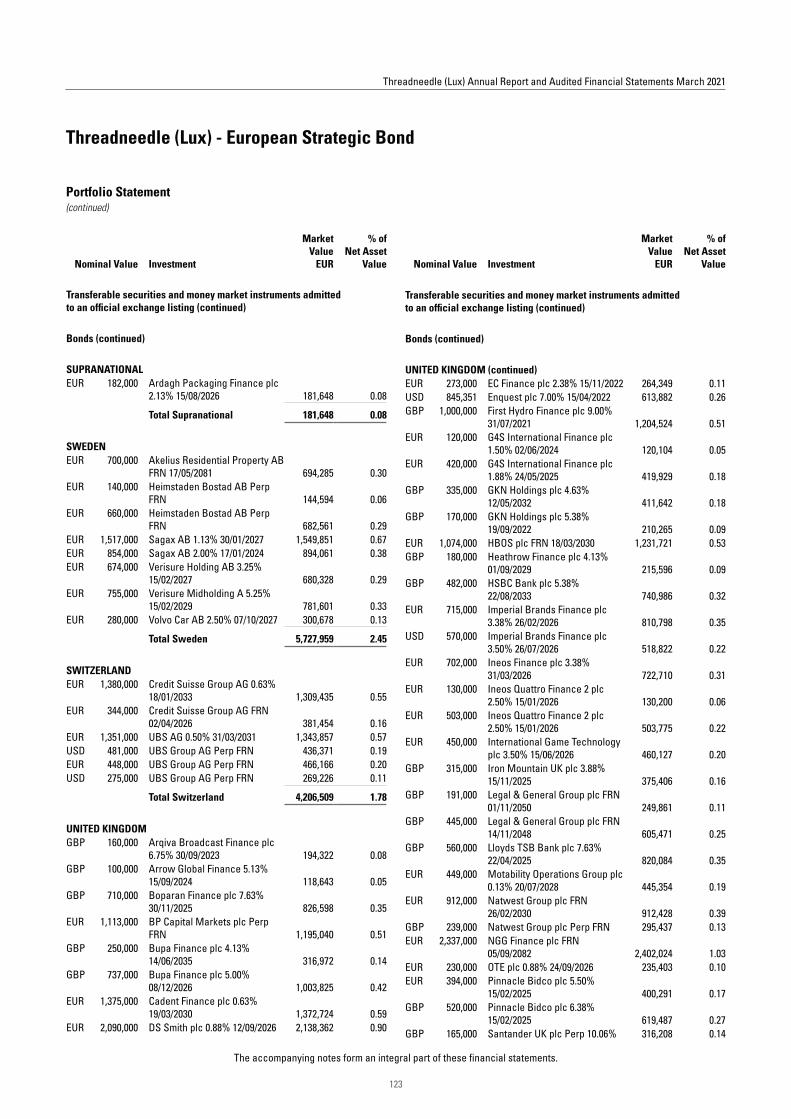
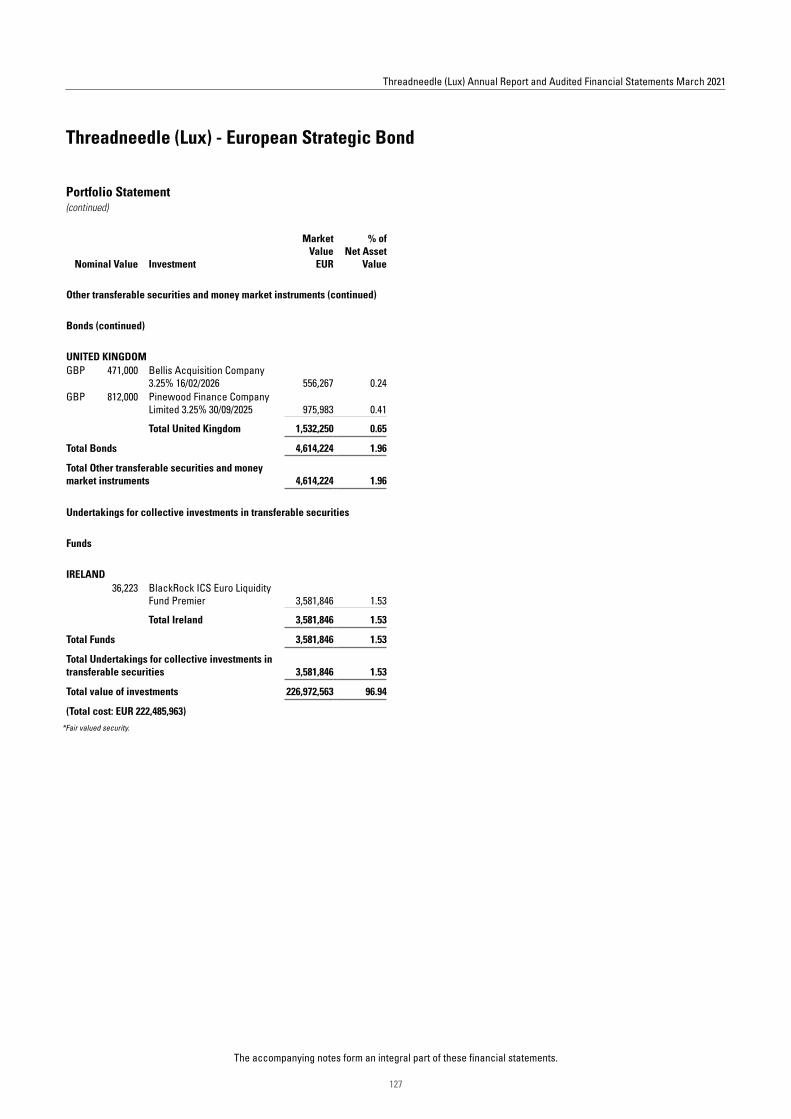
In the Threadneedle (Lux) European Strategic Bond Fund, within rates, we continue to see value in the longer end of yield curves, which is expressed via exposure to credit, agency debt and eurozone peripheral markets. We believe that increases in inflation are likely to be transitory. Hopes for a return to a higher growth path (and, therefore, a sustainably higher level of real interest rates) rest on the ability of governments to bring about a permanent shift towards more expansive fiscal policy. We reserve judgement on the success of this project, which makes us inclined to become more positive towards duration when longer-dated yields approach estimates of ‘neutral’ interest rates.
Early in the period, we became more constructive on the outlook for corporate bonds, especially IG, given the scale and credit-friendly nature of the policy response and the compelling valuations on offer following the sharp declines in March 2020. Hence, we increased IG credit risk within the portfolio, mainly via attractively priced new issues. We reduced risk somewhat after the summer, as spreads came back in towards their long-term averages. At the end of the period, the portfolio still had a long position in credit risk, which remains tilted to defensive sectors, such as utilities, higher-quality technology and senior preferred bank debt (i.e. senior in the capital structure). We feel these areas will weather the crisis well. We have a modest preference for IG over HY and EMs, although we see value in some select defensive BB rated names. The central-bank policy response favours IG, and government support typically backs companies that are large employers / national champions, which, again, tend to be IG names.
Despite the ongoing battle with coronavirus, a synchronised global economic recovery is underway, helped by the rollout of vaccines and, crucially, a continuation of the enormous stimulus from governments and central banks across the world.
As the recovery in global earnings and economic data continues, markets have recently become somewhat unsettled by rising inflation expectations and the corresponding increase in bond yields. This is important, as low bond yields have been critical in supporting risk-asset valuations at elevated levels. However, the degree to which higher yields have impacted equities and credit spreads so far has been relatively modest.
Moreover, we believe that these inflationary pressures will prove temporary, driven by bounces in activity as economies reopen and some accrued savings are spent. Therefore, we do not expect a shift in easy monetary policy conditions, a view reflected in recent comments from the US Fed.
As the pace of the recovery will affect regions, industries and companies differently, we believe active management remains critical to adding value through asset allocation as well as security selection.
The Board of Directors
June 28, 2021
Past performance is not a guide to future performance. The value of investments and any income from them may go down as well as up.
Performance
8
Threadneedle (Lux) Annual Report and Audited Financial Statements March 2021
Threadneedle (Lux) Portfolios returns for the year ended March 31, 2021:
Portfolio1 Year Return**
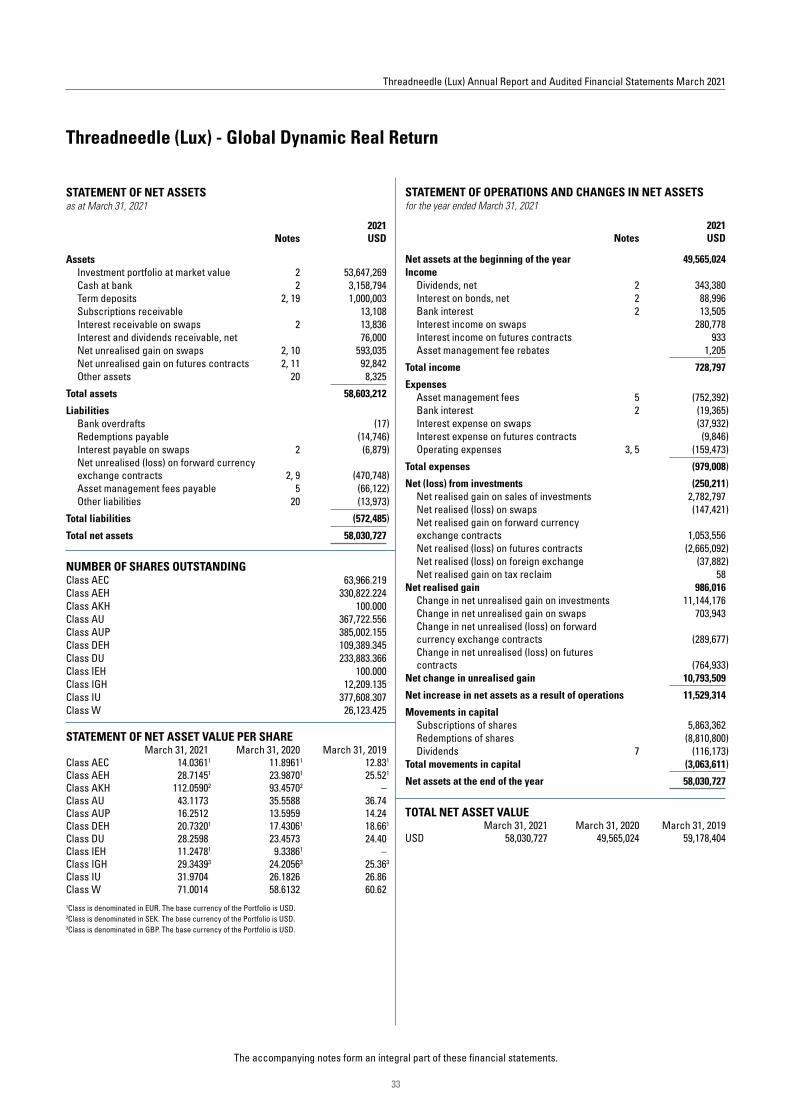
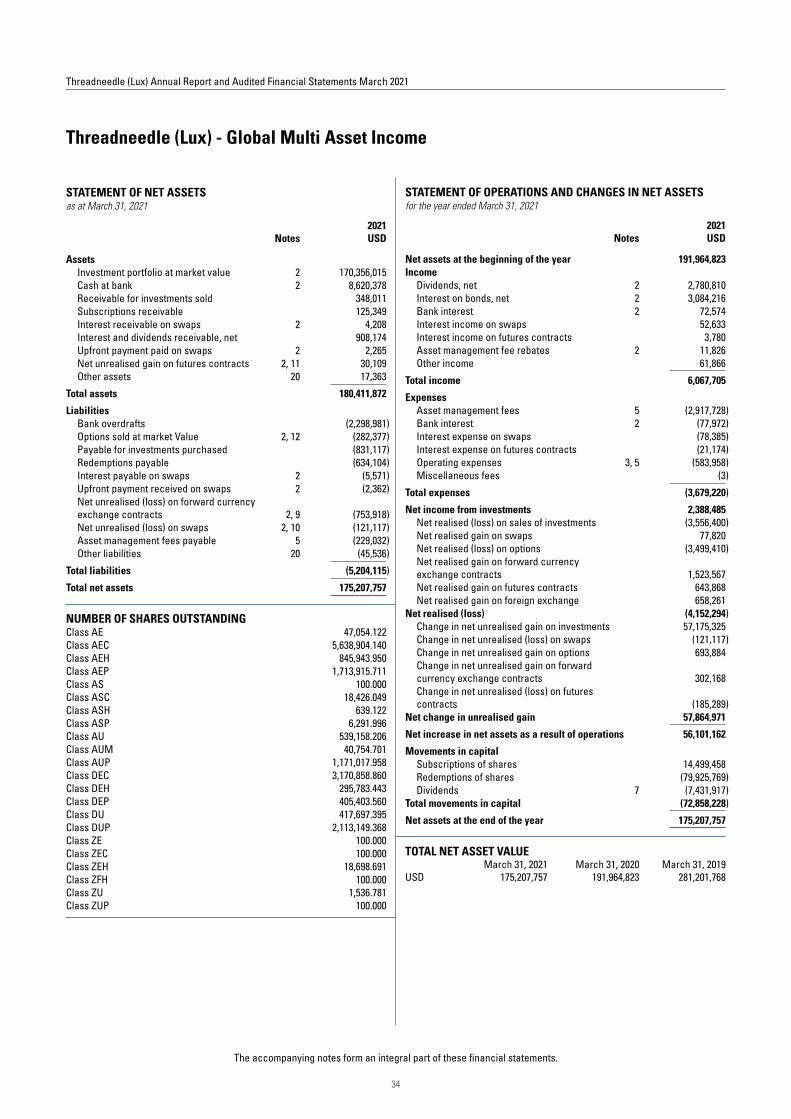
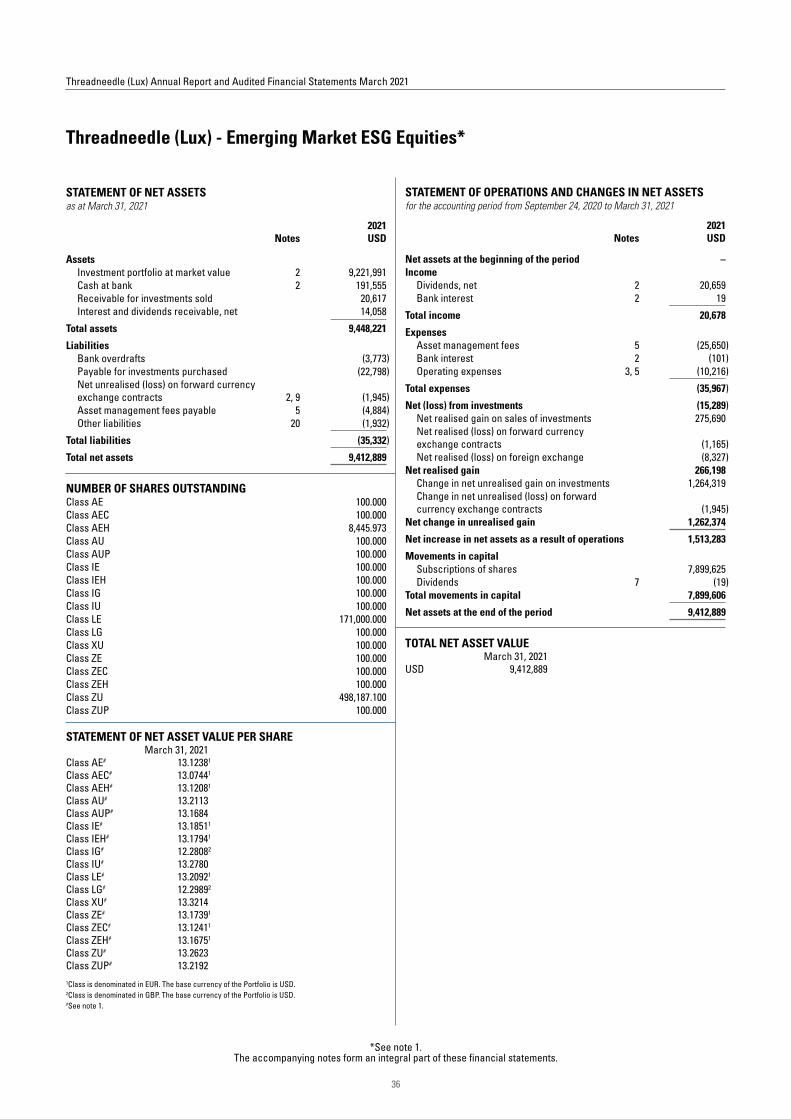
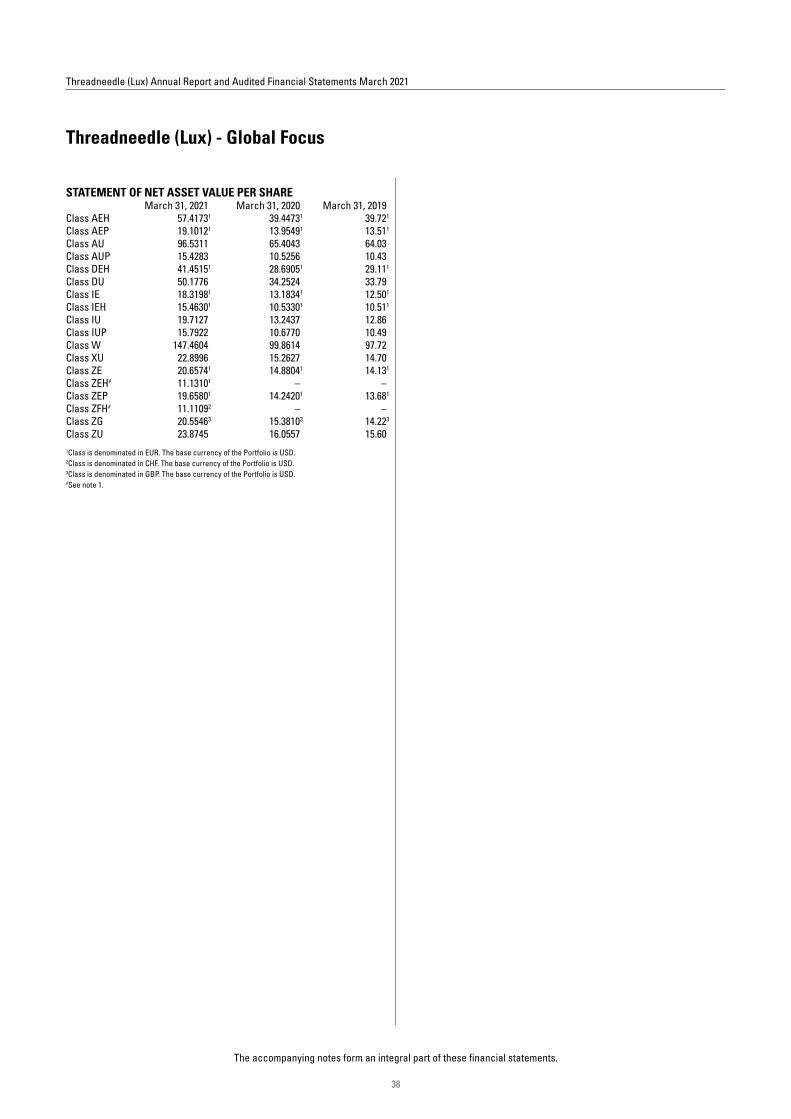
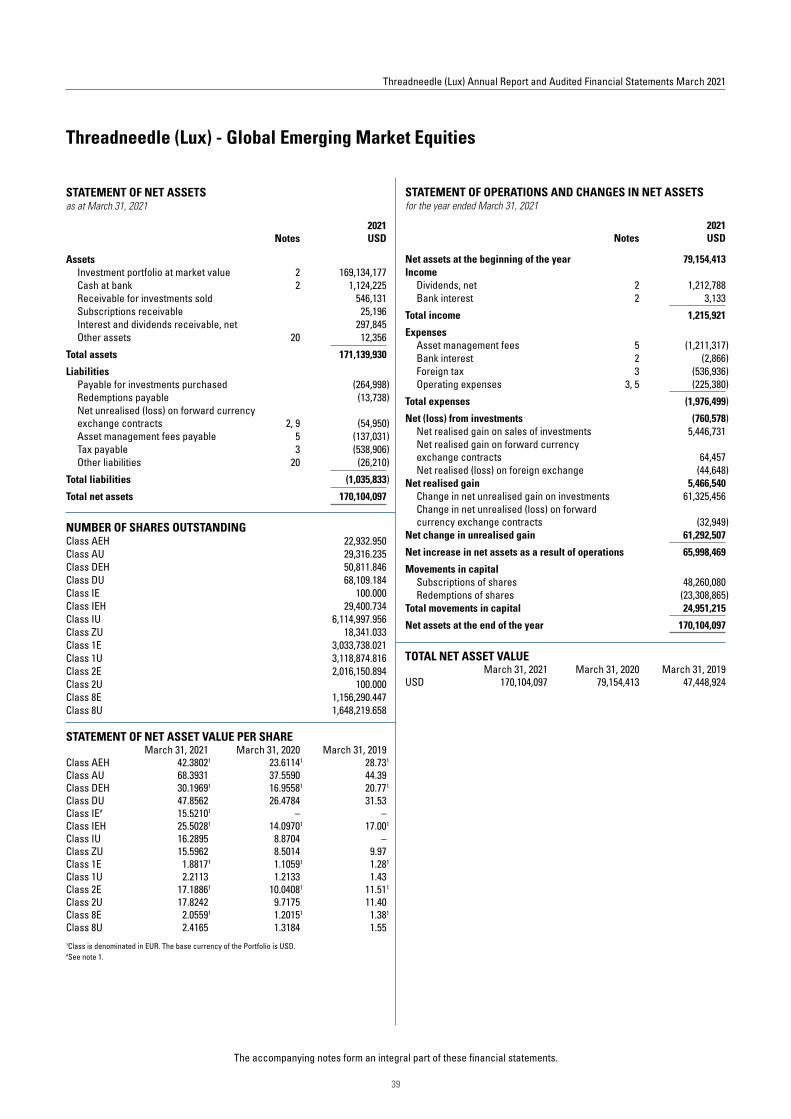
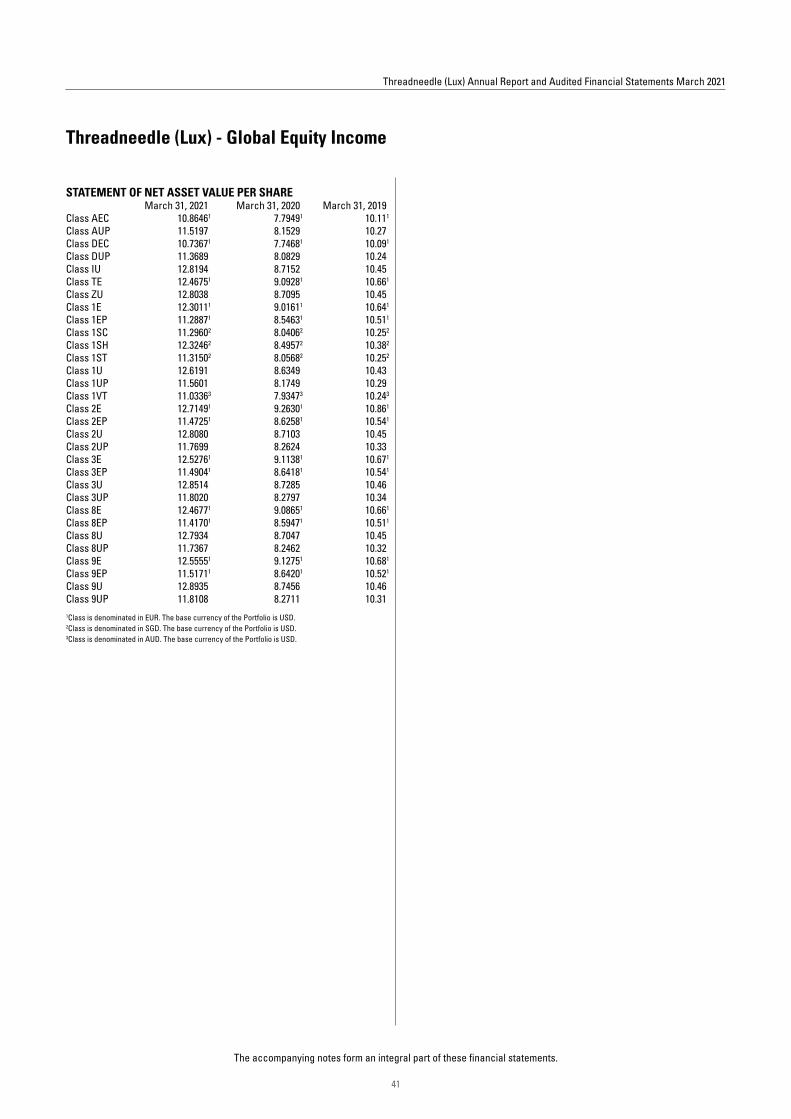
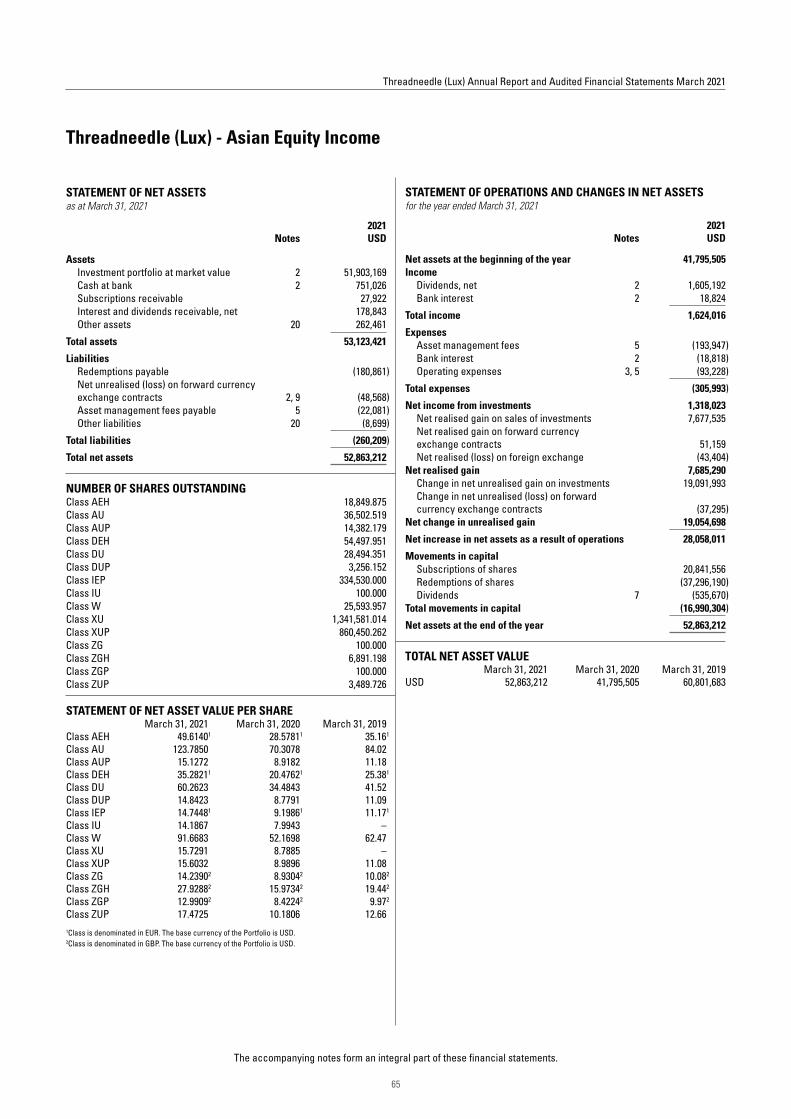
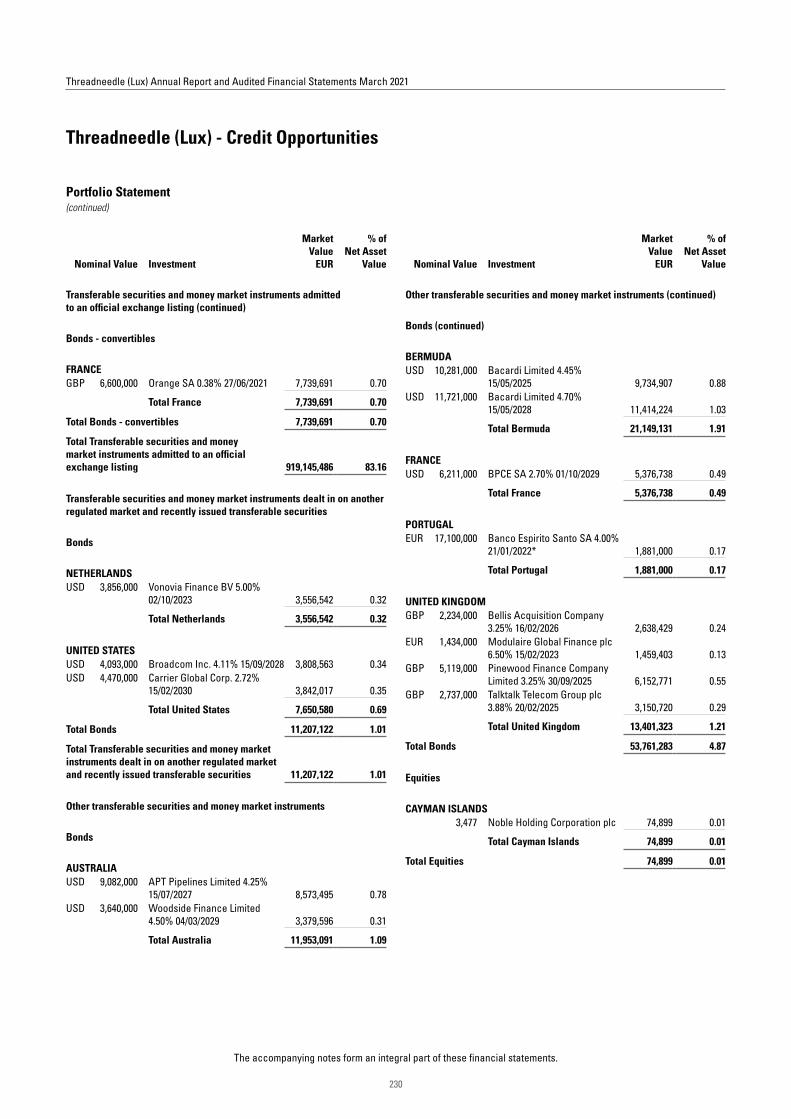
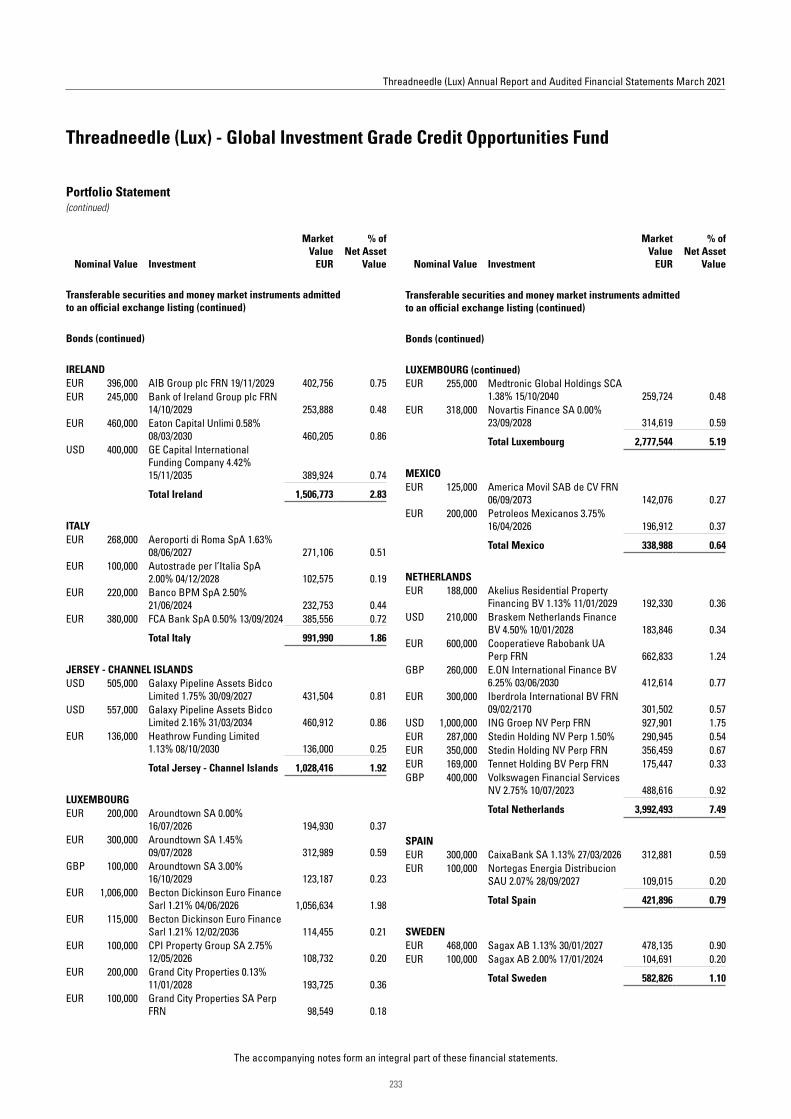
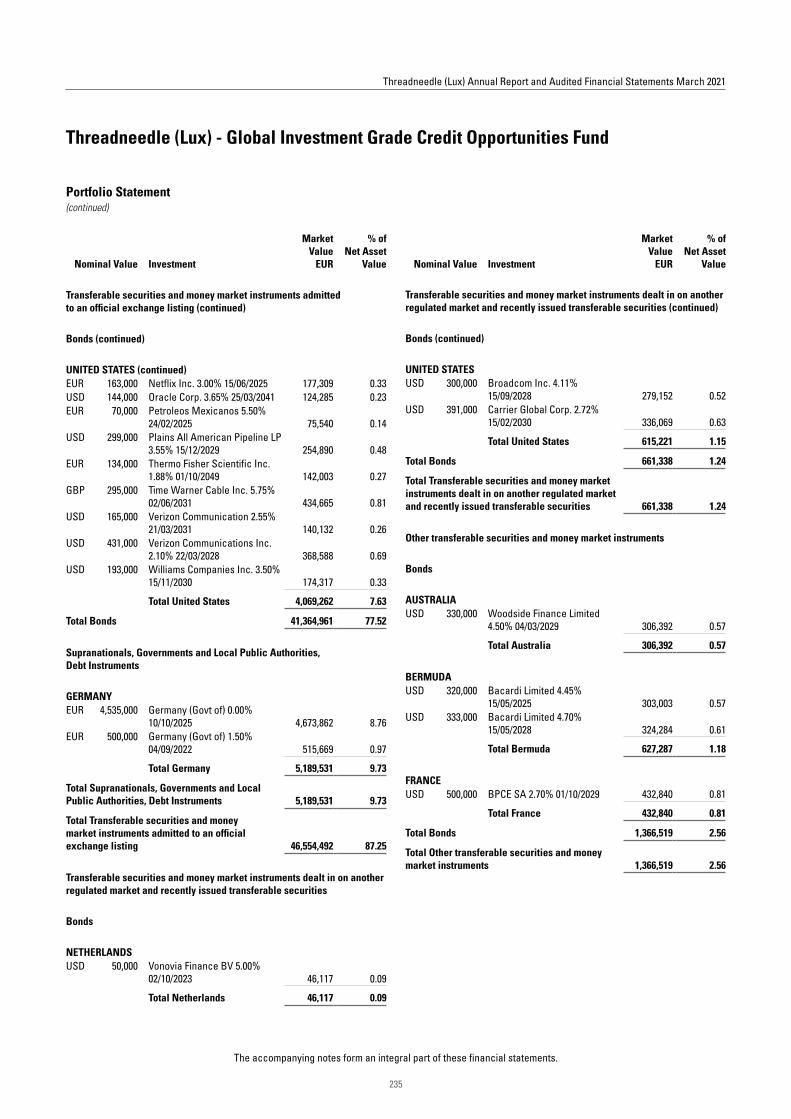
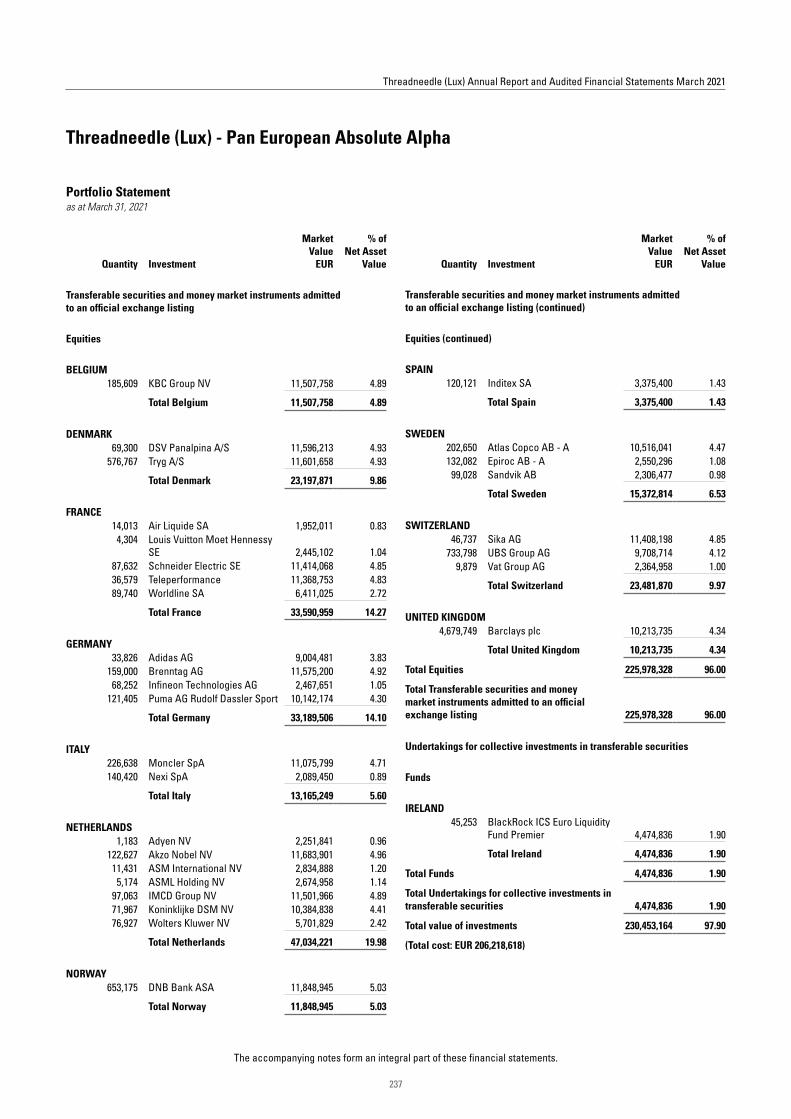
Primary Share ClassThreadneedle (Lux) - Global Corporate Bond ZU 10.14%Threadneedle (Lux) - European Corporate Bond ZE 9.54%Threadneedle (Lux) - European High Yield Bond ZE 18.89%Threadneedle (Lux) - European Short-Term High Yield Bond ZE 15.69%Threadneedle (Lux) - European Social Bond ZE 5.62%Threadneedle (Lux) - European Strategic Bond AE 11.95%Threadneedle (Lux) - Emerging Market Corporate Bonds AU 19.75%Threadneedle (Lux) - Emerging Market Debt ZU 20.76%Threadneedle (Lux) - Global Emerging Market Short-Term Bonds AU 18.02%Threadneedle (Lux) - US High Yield Bond ZU 19.99%Threadneedle (Lux) - Flexible Asian Bond ZU 15.52%Threadneedle (Lux) - Euro Dynamic Real Return ZE 24.80%Threadneedle (Lux) - Global Dynamic Real Return AU 21.26%Threadneedle (Lux) - Global Multi Asset Income ZU 29.45%Threadneedle (Lux) - Emerging Market ESG Equities* ZE 31.74%Threadneedle (Lux) - Global Focus ZU 48.70%Threadneedle (Lux) - Global Emerging Market Equities ZU 83.45%Threadneedle (Lux) - Global Equity Income ZU 47.01%Threadneedle (Lux) - Global Select ZU 47.95%Threadneedle (Lux) - Global Smaller Companies ZU 77.03%Threadneedle (Lux) - American ZU 60.11%Threadneedle (Lux) - American Select ZU 58.59%Threadneedle (Lux) - American Smaller Companies ZU 106.73%Threadneedle (Lux) - Asia Contrarian Equity ZU 69.10%Threadneedle (Lux) - Asia Equities ZU 72.05%Threadneedle (Lux) - US Contrarian Core Equities ZU 59.44%Threadneedle (Lux) - US Disciplined Core Equities ZU 49.56%Threadneedle (Lux) - Pan European ESG Equities* AE 40.50%Threadneedle (Lux) - Pan European Equity Dividend ZE 46.13%Threadneedle (Lux) - Pan European Small Cap Opportunities ZE 55.61%Threadneedle (Lux) - Pan European Smaller Companies ZE 51.67%Threadneedle (Lux) - European Select AE 35.27%Threadneedle (Lux) - European Smaller Companies ZE 53.97%Threadneedle (Lux) - Asian Equity Income ZUP 77.38%Threadneedle (Lux) - Global Technology ZU 100.08%Threadneedle (Lux) - UK Equities ZG 31.65%Threadneedle (Lux) - UK Equity Income ZG 28.54%Threadneedle (Lux) - STANLIB Africa Equity ZU 27.78%Threadneedle (Lux) - American Absolute Alpha ZU 4.40%Threadneedle (Lux) - Credit Opportunities ZE 9.52%Threadneedle (Lux) - Global Investment Grade Credit Opportunities ZE 8.31%Threadneedle (Lux) - Pan European Absolute Alpha ZE 2.07%Threadneedle (Lux) - American Extended Alpha ZU 57.14%Threadneedle (Lux) - Global Extended Alpha ZU 47.61%Threadneedle (Lux) - Enhanced Commodities ZU 36.15%
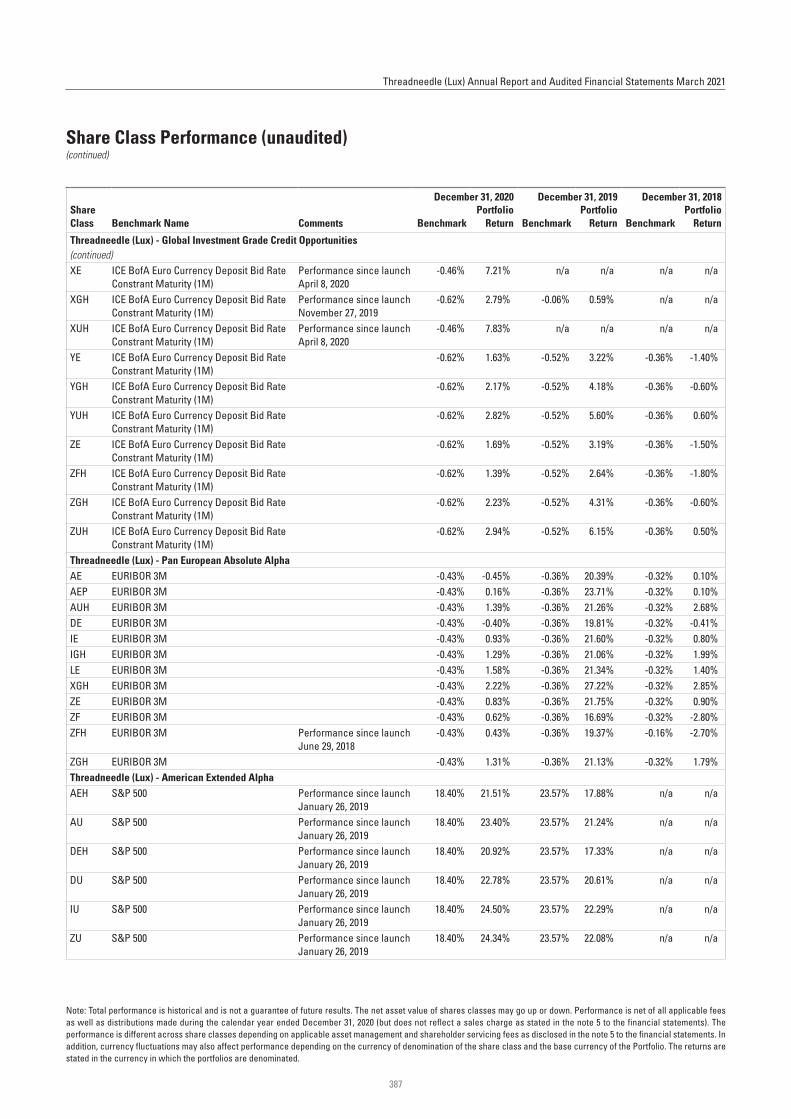
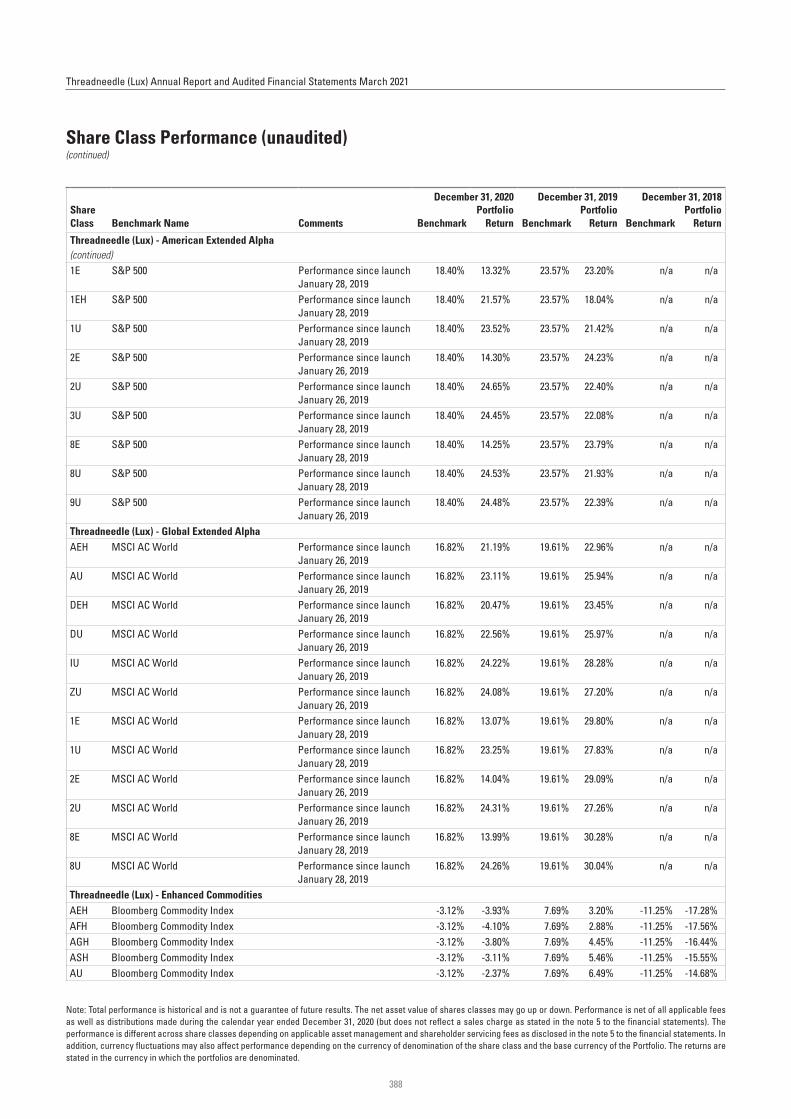
The returns are stated in the currency in which the portfolios are denominated.
*See note 1.**Performance is for one year or since inception date for share classes launched in the year.
9
Threadneedle (Lux) Annual Report and Audited Financial Statements March 2021
Shariah Audit Report
The DirectorsThreadneedle Management Luxembourg S.A.44, Rue de la ValléeL-2661 LuxembourgGrand Duchy of Luxembourg,
Dear Sirs
As-salaamu Alaikum
In accordance with a Shariah Advisory Agreement dated 30 March 2017 between Threadneedle Management Luxembourg S.A., acting as management company of Threadneedle (Lux) (respectively the Management Company and the SICAV), and Gatehouse Bank Plc (the Shariah Advisor) relating to Threadneedle (Lux) – Gatehouse Shariah Global Equity (the “Shariah Sub-Fund”), we are required to submit this Shariah Audit Report.
Terms de�ned in the Shariah Advisory Agreement have the same meanings when used herein.
We have conducted Shariah audit which included examining Investments made during the period from 01 April 2020 to 30 June 2020 by the Shariah Sub-Fund (the “Shariah Audit”). We have also consulted and presented our �ndings to the Shariah Supervisory Board who con�rmed that the investments and the computation of the puri�cation amount are within the agreed Shariah guidelines and parameters.
Following the Shariah Audit, the Shariah Sub Fund is advised by the Shariah Advisor to purify USD974.84 in respect of the dividends during the above period and shall donate to charity which is to be agreed with the Shariah Supervisory Board. The Shariah Sub-Fund is not expected to make any puri�cation of the capital gains during the said period.
And Allah knows best.
Dated: 24 July 2020
Signed for and on behalf of the Shariah Advisor
Abdirahman Sh. Osman Ali
GATEHOUSE BANK PLC | THE HELICON | ONE SOUTH PLACE | LONDON | EC2M 2RB
T +44 (0) 20 7070 6000 W www.gatehousebank.com
Authorised by the Prudential Regulation Authority and regulated by the Financial Conduct Authority and the Prudential Regulation AuthorityRegistered in England & Wales No.06260053. Registered address: The Helicon, One South Place, London, EC2M 2RB.
10
Threadneedle (Lux) Annual Report and Audited Financial Statements March 2021
Shariah Audit Report
The DirectorsThreadneedle Management Luxembourg S.A.44, Rue de la ValléeL-2661 LuxembourgGrand Duchy of Luxembourg,
Dear Sirs
As-salaamu Alaikum
In accordance with a Shariah Advisory Agreement dated 30 March 2017 between Threadneedle Management Luxembourg S.A., acting as management company of Threadneedle (Lux) (respectively the Management Company and the SICAV), and Gatehouse Bank Plc (the Shariah Advisor) relating to Threadneedle (Lux) – Gatehouse Shariah Global Equity (the “Shariah Sub-Fund”), we are required to submit this Shariah Audit Report.
Terms de�ned in the Shariah Advisory Agreement have the same meanings when used herein.
We have conducted Shariah audit which included examining Investments made during the period from 01 July 2020 to 30 September 2020 by the Shariah Sub-Fund (the “Shariah Audit”). We have also consulted and presented our �ndings to the Shariah Supervisory Board who con�rmed that the investments and the computation of the puri�cation amount are within the agreed Shariah guidelines and parameters.
Following the Shariah Audit, the Shariah Sub Fund is advised by the Shariah Advisor to purify USD562.60 in respect of the dividends during the above period and shall donate to charity which is to be agreed with the Shariah Supervisory Board. The Shariah Sub-Fund is not expected to make any puri�cation of the capital gains during the said period.
And Allah knows best.
Dated: 13 November 2020
Signed for and on behalf of the Shariah Advisor
Abdirahman Sh. Osman Ali
GATEHOUSE BANK PLC | THE HELICON | ONE SOUTH PLACE | LONDON | EC2M 2RB
T +44 (0) 20 7070 6000 W www.gatehousebank.com
Authorised by the Prudential Regulation Authority and regulated by the Financial Conduct Authority and the Prudential Regulation AuthorityRegistered in England & Wales No.06260053. Registered address: The Helicon, One South Place, London, EC2M 2RB.
11
Threadneedle (Lux) Annual Report and Audited Financial Statements March 2021
Shariah Audit Report
The DirectorsThreadneedle Management Luxembourg S.A.44, Rue de la ValléeL-2661 LuxembourgGrand Duchy of Luxembourg,
Dear Sirs
As-salaamu Alaikum
In accordance with a Shariah Advisory Agreement dated 30 March 2017 between Threadneedle Management Luxembourg S.A., acting as management company of Threadneedle (Lux) (respectively the Management Company and the SICAV), and Gatehouse Bank Plc (the Shariah Advisor) relating to Threadneedle (Lux) – Gatehouse Shariah Global Equity (the “Shariah Sub-Fund”), we are required to submit this Shariah Audit Report.
Terms de�ned in the Shariah Advisory Agreement have the same meanings when used herein.
We have conducted Shariah audit which included examining Investments made during the period from 01 October 2020 to 06 November 2020 by the Shariah Sub-Fund (the “Shariah Audit”). We have also consulted and presented our �ndings to the Shariah Supervisory Board who con�rmed that the investments and the computation of the puri�cation amount are within the agreed Shariah guidelines and parameters.
Following the Shariah Audit, the Shariah Sub Fund is advised by the Shariah Advisor to purify USD0.58 in respect of the dividends during the above period and shall donate to charity which is to be agreed with the Shariah Supervisory Board. The Shariah Sub-Fund is not expected to make any puri�cation of the capital gains during the said period.
And Allah knows best.
Dated: 13 November 2020
Signed for and on behalf of the Shariah Advisor
Abdirahman Sh. Osman Ali
GATEHOUSE BANK PLC | THE HELICON | ONE SOUTH PLACE | LONDON | EC2M 2RB
T +44 (0) 20 7070 6000 W www.gatehousebank.com
Authorised by the Prudential Regulation Authority and regulated by the Financial Conduct Authority and the Prudential Regulation AuthorityRegistered in England & Wales No.06260053. Registered address: The Helicon, One South Place, London, EC2M 2RB.
PricewaterhouseCoopers, Société coopérative, 2 rue Gerhard Mercator, B.P. 1443, L-1014 LuxembourgT : +352 494848 1, F : +352 494848 2900, www.pwc.lu Cabinet de révision agréé. Expert-comptable (autorisation gouvernementale n°10028256)R.C.S. Luxembourg B 65 477 - TVA LU25482518
Audit report
To the Shareholders ofThreadneedle (Lux)
Our opinion
In our opinion, the accompanying financial statements give a true and fair view of the financial position of Threadneedle (Lux) (the “Fund”) and of each of its sub-funds as at 31 March 2021, and of the results of their operations and changes in their net assets for the year then ended in accordance with Luxembourg legal and regulatory requirements relating to the preparation and presentation of the financial statements.
What we have audited
The Fund’s financial statements comprise:
the statement of net assets as at 31 March 2021; the portfolio statement as at 31 March 2021; the statement of operations and changes in net assets for the year then ended; and the notes to the financial statements, which include a summary of significant accounting policies.
Basis for opinion
We conducted our audit in accordance with the Law of 23 July 2016 on the audit profession (Law of 23 July 2016) and with International Standards on Auditing (ISAs) as adopted for Luxembourg by the “Commission de Surveillance du Secteur Financier” (CSSF). Our responsibilities under the Law of 23 July 2016 and ISAs as adopted for Luxembourg by the CSSF are further described in the “Responsibilities of the “Réviseur d’entreprises agréé” for the audit of the financial statements” section of our report.
We believe that the audit evidence we have obtained is sufficient and appropriate to provide a basis for our opinion.
We are independent of the Fund in accordance with the International Code of Ethics for Professional Accountants, including International Independence Standards, issued by the International Ethics Standards Board for Accountants (IESBA Code) as adopted for Luxembourg by the CSSF together with the ethical requirements that are relevant to our audit of the financial statements. We have fulfilled our other ethical responsibilities under those ethical requirements.
Other information
The Board of Directors is responsible for the other information. The other information comprises the information stated in the annual report but does not include the financial statements and our audit report thereon.
Our opinion on the financial statements does not cover the other information and we do not express any form of assurance conclusion thereon.
13
In connection with our audit of the financial statements, our responsibility is to read the other information identified above and, in doing so, consider whether the other information is materially inconsistent with the financial statements or our knowledge obtained in the audit, or otherwise appears to be materially misstated. If, based on the work we have performed, we conclude that there is a material misstatement of this other information, we are required to report that fact. We have nothing to report in this regard.
Responsibilities of the Board of Directors for the financial statements
The Board of Directors is responsible for the preparation and fair presentation of the financial statements in accordance with Luxembourg legal and regulatory requirements relating to the preparation and presentation of the financial statements, and for such internal control as the Board of Directors determines is necessary to enable the preparation of financial statements that are free from material misstatement, whether due to fraud or error.
In preparing the financial statements, the Board of Directors is responsible for assessing the Fund’s and each of its sub-funds' ability to continue as a going concern, disclosing, as applicable, matters related to going concern and using the going concern basis of accounting unless the Board of Directors either intends to liquidate the Fund or close any of its sub-funds or to cease operations, or has no realistic alternative but to do so.
Responsibilities of the “Réviseur d’entreprises agréé” for the audit of the financial statements
The objectives of our audit are to obtain reasonable assurance about whether the financial statements as a whole are free from material misstatement, whether due to fraud or error, and to issue an audit report that includes our opinion. Reasonable assurance is a high level of assurance, but is not a guarantee that an audit conducted in accordance with the Law of 23 July 2016 and with ISAs as adopted for Luxembourg by the CSSF will always detect a material misstatement when it exists. Misstatements can arise from fraud or error and are considered material if, individually or in the aggregate, they could reasonably be expected to influence the economic decisions of users taken on the basis of these financial statements.
As part of an audit in accordance with the Law of 23 July 2016 and with ISAs as adopted for Luxembourg by the CSSF, we exercise professional judgment and maintain professional scepticism throughout the audit. We also:
identify and assess the risks of material misstatement of the financial statements, whether due to fraud or error, design and perform audit procedures responsive to those risks, and obtain audit evidence that is sufficient and appropriate to provide a basis for our opinion. The risk of not detecting a material misstatement resulting from fraud is higher than for one resulting from error, as fraud may involve collusion, forgery, intentional omissions, misrepresentations, or the override of internal control;
obtain an understanding of internal control relevant to the audit in order to design audit procedures that are appropriate in the circumstances, but not for the purpose of expressing an opinion on the effectiveness of the Fund’s internal control;
evaluate the appropriateness of accounting policies used and the reasonableness of accounting estimates and related disclosures made by the Board of Directors;
14
conclude on the appropriateness of the Board of Directors’ use of the going concern basis of accounting and, based on the audit evidence obtained, whether a material uncertainty exists related to events or conditions that may cast significant doubt on the Fund’s or any of its sub-funds' ability to continue as a going concern. If we conclude that a material uncertainty exists, we are required to draw attention in our audit report to the related disclosures in the financial statements or, if such disclosures are inadequate, to modify our opinion. Our conclusions are based on the audit evidence obtained up to the date of our audit report. However, future events or conditions may cause the Fund or any of its sub-funds (except for Threadneedle (Lux) - STANLIB Africa Equity where a decision to liquidate exists) to cease to continue as a going concern;
evaluate the overall presentation, structure and content of the financial statements, including the disclosures, and whether the financial statements represent the underlying transactions and events in a manner that achieves fair presentation.
We communicate with those charged with governance regarding, among other matters, the planned scope and timing of the audit and significant audit findings, including any significant deficiencies in internal control that we identify during our audit.
PricewaterhouseCoopers, Société coopérativeRepresented by@esig
@esigSerene Shtayyeh
Luxembourg, 28 June 2021
STATEMENT OF NET ASSETSas at March 31, 2021
Notes2021 USD
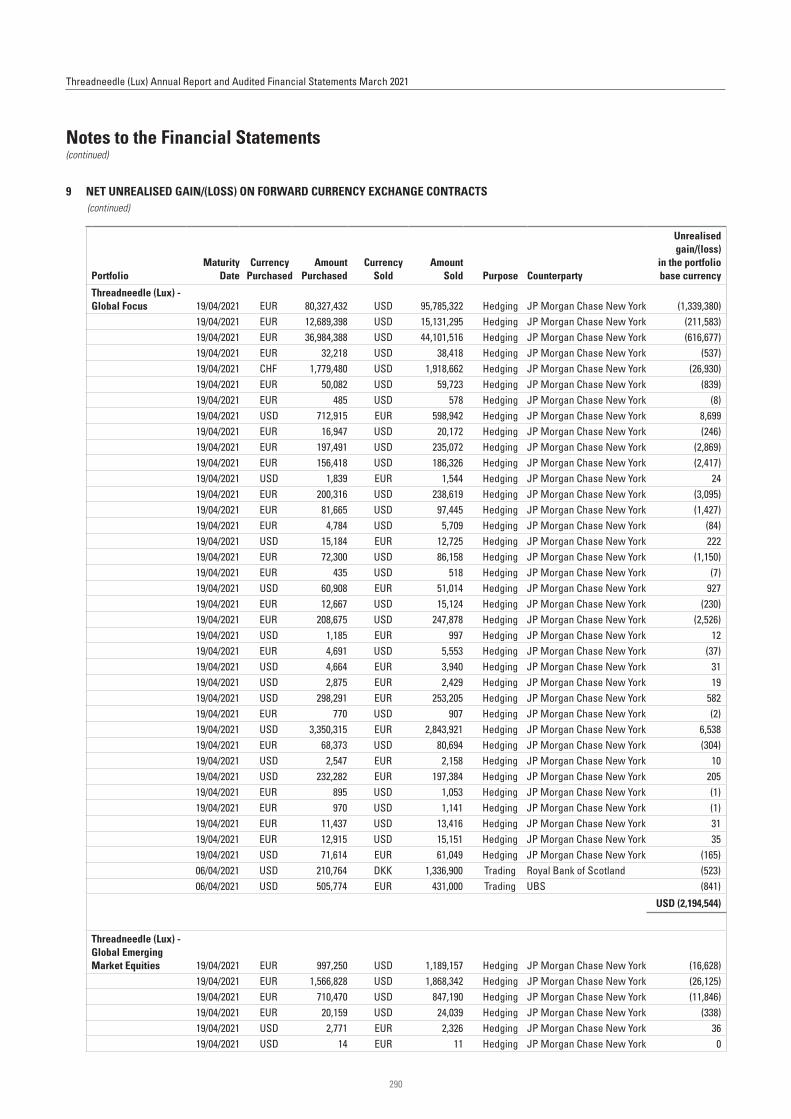
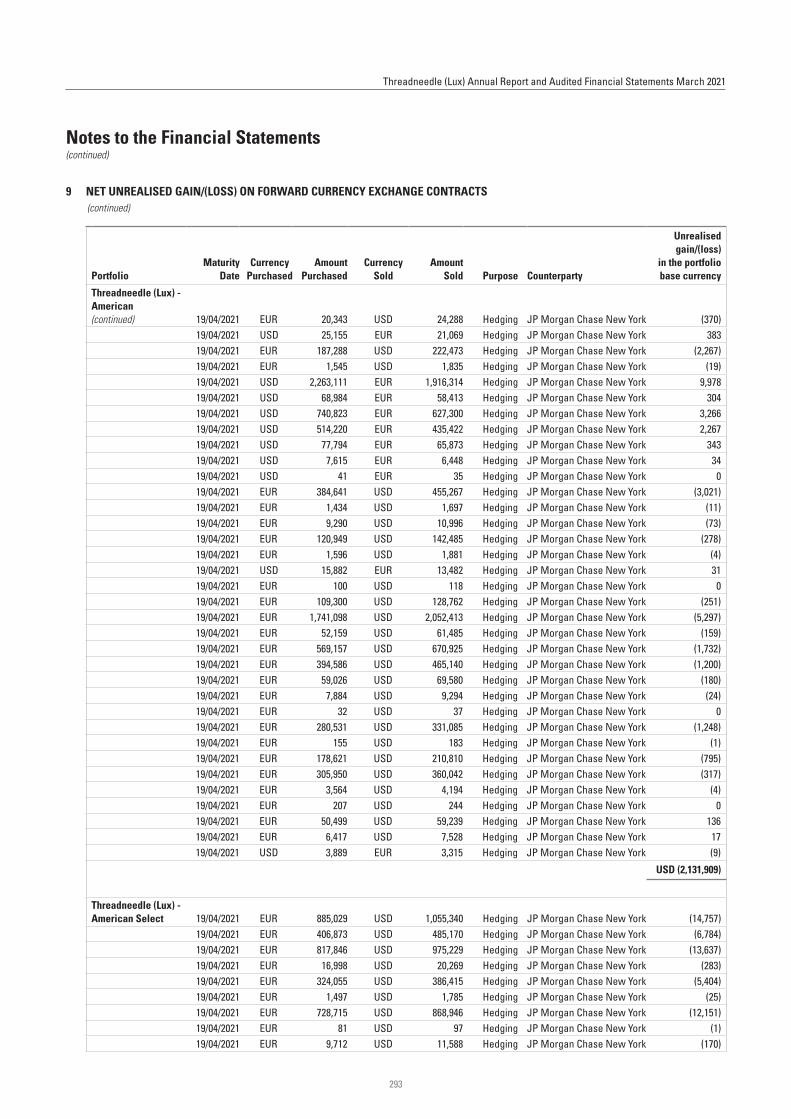
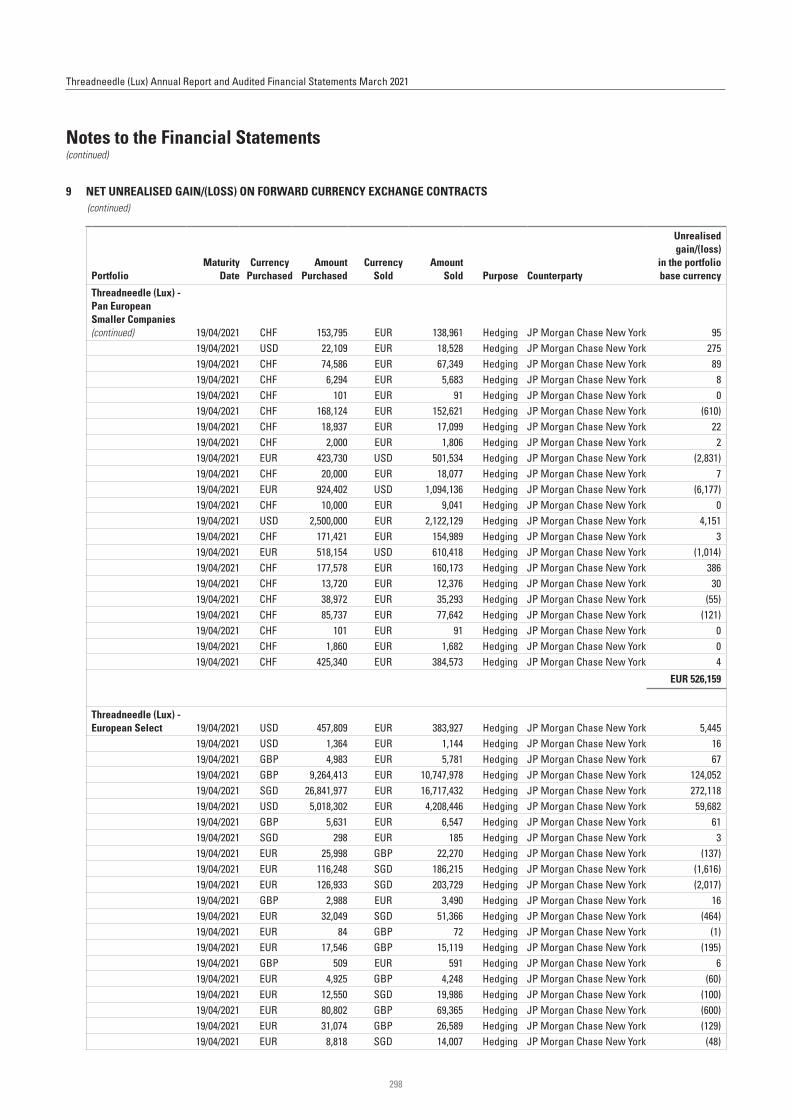
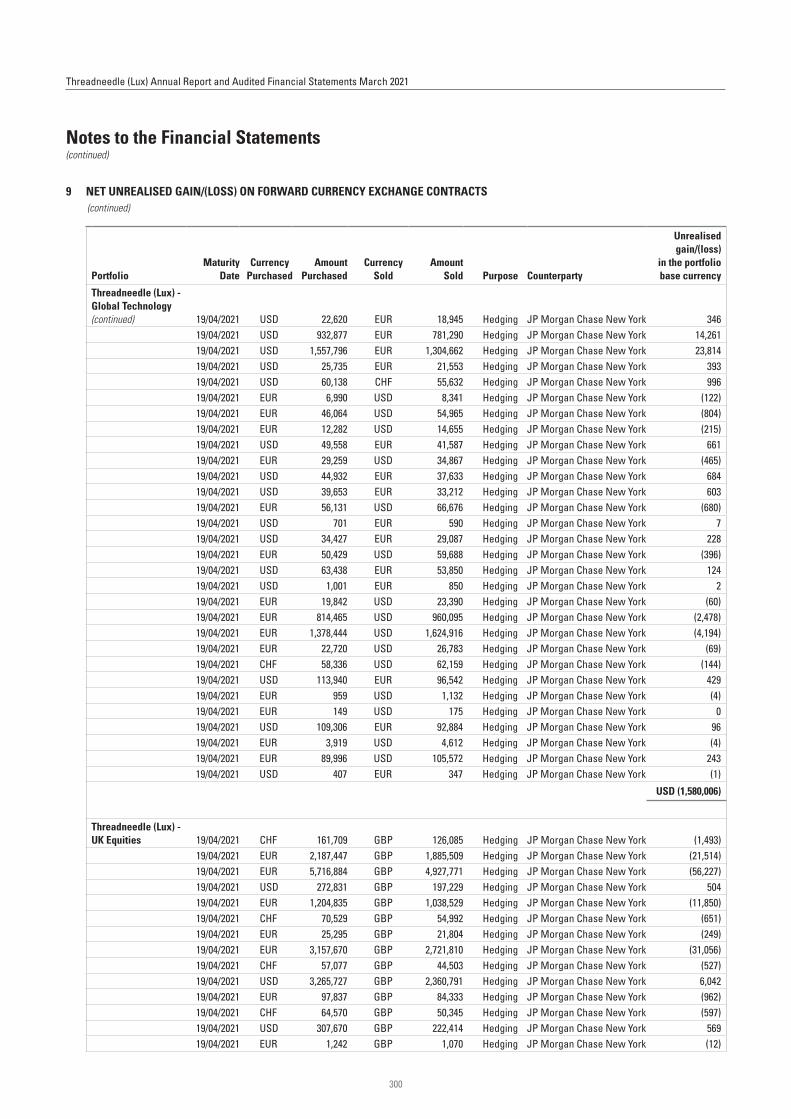
Assets Investment portfolio at market value 2, 18 22,771,957,340 Cash at bank 2 264,929,385 Term deposits 2, 19 41,536,427 Receivable for investments sold 39,498,502 Subscriptions receivable 57,712,110 Interest receivable on swaps 2 6,099,402 Interest and dividends receivable, net 55,742,101 Upfront payment paid on swaps 2 3,137,812 Net unrealised gain on forward currency exchange contracts 2, 9 4,135,388 Net unrealised gain on swaps 2, 10 1,154,747 Net unrealised gain on futures contracts 2, 11 6,248,307 Other assets 20 12,383,756
Total assets 23,264,535,277
Liabilities Bank overdrafts (2,302,771)Options sold at market value 2, 12 (282,377)Payable for investments purchased (40,999,956)Redemptions payable (37,890,120)Interest payable on swaps 2 (9,928,777)Dividend payable on swaps 2 (275,662)Upfront payment received on swaps 2 (4,048,182)Net unrealised (loss) on forward currency exchange contracts 2, 9 (18,471,176)Net unrealised (loss) on swaps 2, 10 (73,367,806)Net unrealised (loss) on futures contracts 2, 11 (765,401)Asset management fees payable 5 (18,797,915)Performance fees payable 8 (113,809)Tax payable 3 (1,364,329)Other liabilities 20 (3,730,046)
Total liabilities (212,338,327)
Total net assets 23,052,196,950
The accompanying notes form an integral part of these financial statements.
Aggregated Financial Statements for Threadneedle (Lux)
15
Threadneedle (Lux) Annual Report and Audited Financial Statements March 2021
STATEMENT OF OPERATIONS AND CHANGES IN NET ASSETSfor the year ended March 31, 2021
Notes2021 USD
Net assets at the beginning of the year 14,111,060,670 Income
Dividends, net 2 147,692,535 Interest on bonds, net 2 122,723,290 Bank interest 2 1,173,209 Interest income on swaps 10,986,097 Interest income on futures contracts 9,139 Asset management fee rebates 2 14,823 Other income 154,345
Net income from investments 16,825,484 Net realised gain on sales of investments 1,096,234,642 Net realised gain on swaps 74,929,815 Net realised (loss) on options (2,507,528)Net realised gain on forward currency exchange contracts 104,488,987 Net realised (loss) on futures contracts (13,238,544)Net realised (loss) on foreign exchange (21,847,014)Net realised gain on tax reclaim 1,156
Net realised gain 1,238,061,514 Change in net unrealised gain on investments 5,066,930,063 Change in net unrealised (loss) on swaps (86,693,427)Change in net unrealised gain on options 754,615 Change in net unrealised gain on forward currency exchange contracts 2,798,423 Change in net unrealised gain on futures contracts 14,416,953
Net change in unrealised gain 4,998,206,627
Net increase in net assets as a result of operations 6,253,093,625
Movements in capital Subscriptions of shares 8,940,183,464 Redemptions of shares (6,831,412,374)Dividends 7 (43,486,135)
Total movements in capital 2,065,284,955
Exchange differences 2 629,689,109 Change in cross investments in Portfolios 18 (6,931,409)
Net assets at the end of the year 23,052,196,950
STATEMENT OF NET ASSETSas at March 31, 2021
Notes2021 USD
Assets Investment portfolio at market value 2 497,094,271 Cash at bank 2 13,474,849 Receivable for investments sold 762,353 Subscriptions receivable 3,189,003 Interest receivable on swaps 2 46,379 Interest and dividends receivable, net 3,833,385 Upfront payment paid on swaps 2 61,966
Total assets 518,462,206
Liabilities Payable for investments purchased (6,688,299)Redemptions payable (300,663)Interest payable on swaps 2 (93,058)Upfront payment received on swaps 2 (144,107)Net unrealised (loss) on forward currency exchange contracts 2, 9 (1,077,556)Net unrealised (loss) on swaps 2, 10 (4,000,715)Net unrealised (loss) on futures contracts 2, 11 (345,063)Asset management fees payable 5 (128,863)Other liabilities 20 (72,316)
Total liabilities (12,850,640)
Total net assets 505,611,566
NUMBER OF SHARES OUTSTANDINGClass AEC 1,596,616.295 Class AEH 1,080,691.794 Class AKH 163.000 Class ANH 1,000.000 Class AU 1,110,503.340 Class AUP 93,337.657 Class DEC 103,522.725 Class DEH 281,505.418 Class DU 233,090.110 Class DUP 64,324.436 Class IEC 1,192,414.887 Class IEH 890,496.903 Class IEP 954.440 Class IGC 206,789.438 Class IGH 1,928,596.230 Class IKH 2,230.161 Class INH 1,000.000 Class IU 781,991.144 Class IUP 172,325.660 Class NEC 206,485.000 Class NEH 126,772.495 Class NGC 9,654,552.018 Class NGH 1,074,602.425 Class NU 1,688,596.402 Class NUP 88,869.227 Class XEH 100.000 Class XFH 100.000 Class XGH 9,247,188.444 Class XU 100.000 Class ZEH 1,020,768.767 Class ZFH 100.000 Class ZGH 22,029.133 Class ZU 1,829,825.464
Threadneedle (Lux) - Global Corporate Bond
16
The accompanying notes form an integral part of these financial statements.
Threadneedle (Lux) Annual Report and Audited Financial Statements March 2021
STATEMENT OF OPERATIONS AND CHANGES IN NET ASSETSfor the year ended March 31, 2021
Notes2021 USD
Net assets at the beginning of the year 231,720,967 Income
Dividends, net 2 23,970 Interest on bonds, net 2 9,959,151 Bank interest 2 8,989 Interest income on swaps 955,727 Interest income on futures contracts 3,446
Net income from investments 7,226,528 Net realised gain on sales of investments 12,343,504 Net realised gain on swaps 2,926,198 Net realised gain on forward currency exchange contracts 18,948,616 Net realised gain on futures contracts 1,062,893 Net realised gain on foreign exchange 2,846,489
Net realised gain 38,127,700 Change in net unrealised gain on investments 17,173,338 Change in net unrealised (loss) on swaps (4,676,701)Change in net unrealised (loss) on forward currency exchange contracts (1,438,118)Change in net unrealised (loss) on futures contracts (1,270,983)
Net change in unrealised gain 9,787,536
Net increase in net assets as a result of operations 55,141,764 Movements in capital
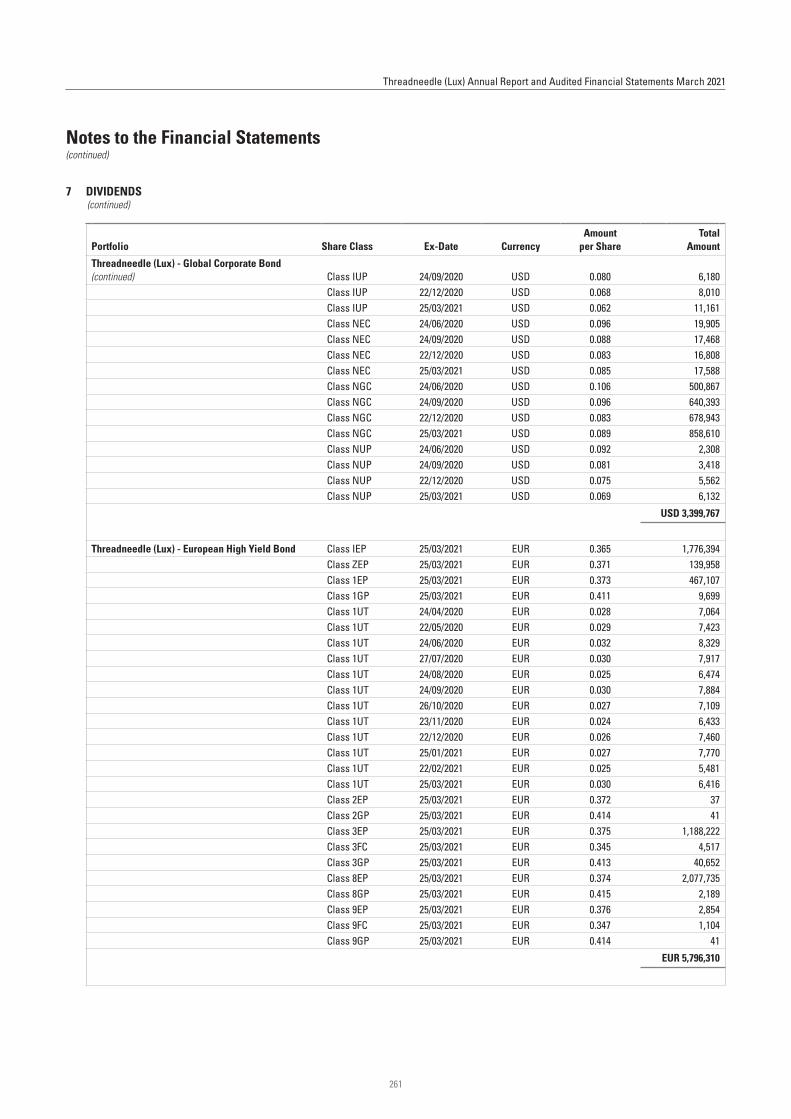
Subscriptions of shares 321,134,430 Redemptions of shares (98,985,828)Dividends 7 (3,399,767)
Total movements in capital 218,748,835
Net assets at the end of the year 505,611,566
TOTAL NET ASSET VALUE March 31, 2021 March 31, 2020 March 31, 2019USD 505,611,566 231,720,967 185,075,332
The accompanying notes form an integral part of these financial statements.
Threadneedle (Lux) - Global Corporate Bond
17
Threadneedle (Lux) Annual Report and Audited Financial Statements March 2021
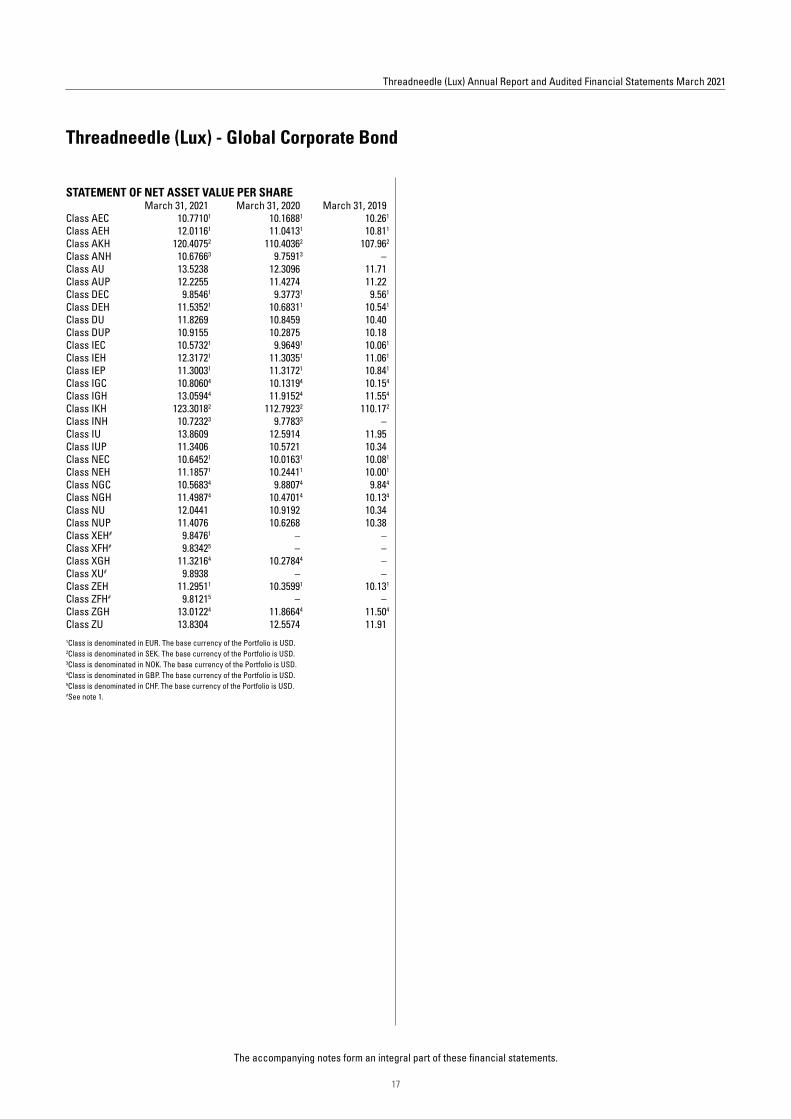
STATEMENT OF NET ASSET VALUE PER SHARE March 31, 2021 March 31, 2020 March 31, 2019Class AEC 10.77101 10.16881 10.261
Class AEH 12.01161 11.04131 10.811
Class AKH 120.40752 110.40362 107.962
Class ANH 10.67663 9.75913 –Class AU 13.5238 12.3096 11.71Class AUP 12.2255 11.4274 11.22Class DEC 9.85461 9.37731 9.561
Class DEH 11.53521 10.68311 10.541
Class DU 11.8269 10.8459 10.40Class DUP 10.9155 10.2875 10.18Class IEC 10.57321 9.96491 10.061
Class IEH 12.31721 11.30351 11.061
Class IEP 11.30031 11.31721 10.841
Class IGC 10.80604 10.13194 10.154
Class IGH 13.05944 11.91524 11.554
Class IKH 123.30182 112.79232 110.172
Class INH 10.72323 9.77833 –Class IU 13.8609 12.5914 11.95Class IUP 11.3406 10.5721 10.34Class NEC 10.64521 10.01631 10.081
Class ZFH# 9.81215 – –Class ZGH 13.01224 11.86644 11.504
Class ZU 13.8304 12.5574 11.911Class is denominated in EUR. The base currency of the Portfolio is USD.2Class is denominated in SEK. The base currency of the Portfolio is USD.3Class is denominated in NOK. The base currency of the Portfolio is USD.4Class is denominated in GBP. The base currency of the Portfolio is USD.5Class is denominated in CHF. The base currency of the Portfolio is USD.#See note 1.
STATEMENT OF NET ASSETSas at March 31, 2021
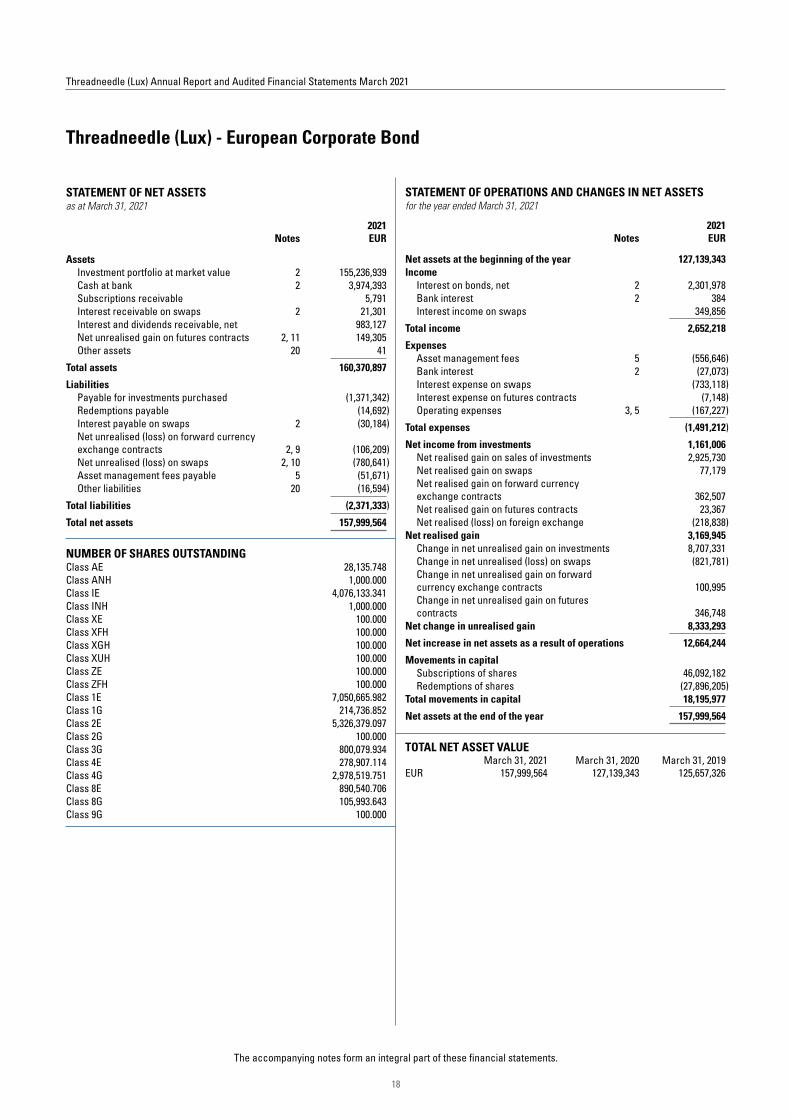
Notes2021 EUR
Assets Investment portfolio at market value 2 155,236,939 Cash at bank 2 3,974,393 Subscriptions receivable 5,791 Interest receivable on swaps 2 21,301 Interest and dividends receivable, net 983,127 Net unrealised gain on futures contracts 2, 11 149,305 Other assets 20 41
Total assets 160,370,897
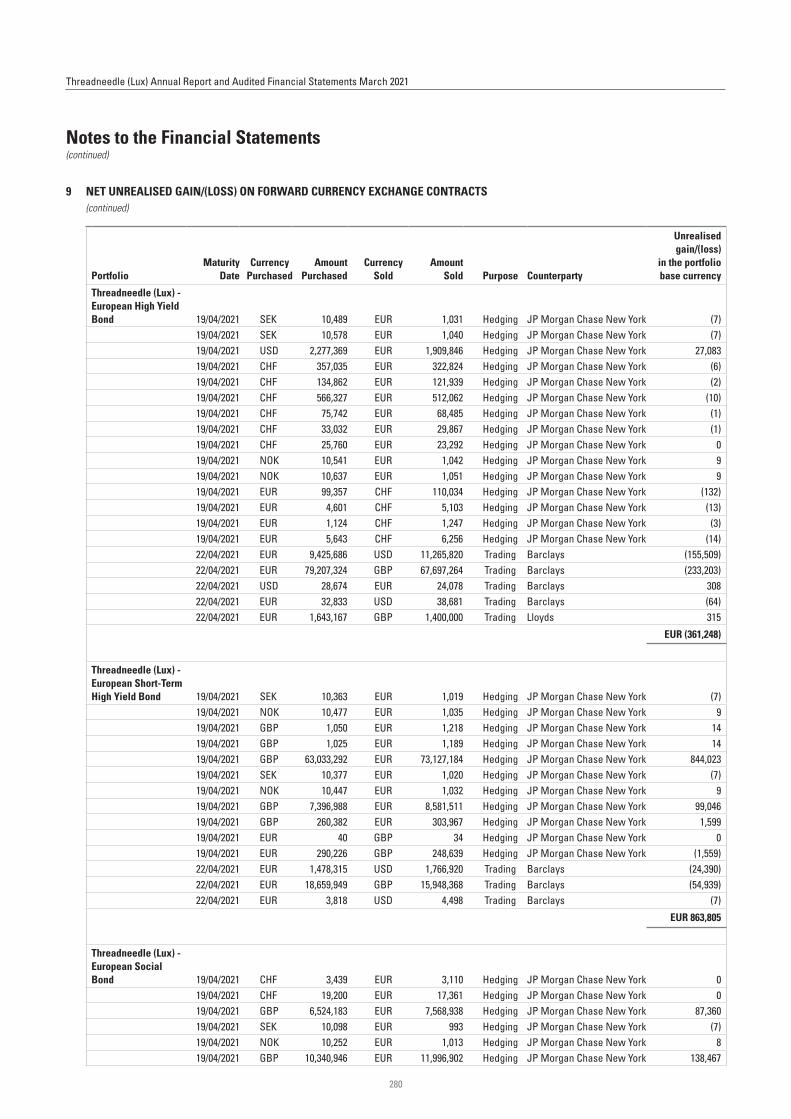
Liabilities Payable for investments purchased (1,371,342)Redemptions payable (14,692)Interest payable on swaps 2 (30,184)Net unrealised (loss) on forward currency exchange contracts 2, 9 (106,209)Net unrealised (loss) on swaps 2, 10 (780,641)Asset management fees payable 5 (51,671)Other liabilities 20 (16,594)
Total liabilities (2,371,333)
Total net assets 157,999,564
NUMBER OF SHARES OUTSTANDINGClass AE 28,135.748 Class ANH 1,000.000 Class IE 4,076,133.341 Class INH 1,000.000 Class XE 100.000 Class XFH 100.000 Class XGH 100.000 Class XUH 100.000 Class ZE 100.000 Class ZFH 100.000 Class 1E 7,050,665.982 Class 1G 214,736.852 Class 2E 5,326,379.097 Class 2G 100.000 Class 3G 800,079.934 Class 4E 278,907.114 Class 4G 2,978,519.751 Class 8E 890,540.706 Class 8G 105,993.643 Class 9G 100.000
Threadneedle (Lux) - European Corporate Bond
18
The accompanying notes form an integral part of these financial statements.
Threadneedle (Lux) Annual Report and Audited Financial Statements March 2021
STATEMENT OF OPERATIONS AND CHANGES IN NET ASSETSfor the year ended March 31, 2021
Notes2021 EUR
Net assets at the beginning of the year 127,139,343 Income
Interest on bonds, net 2 2,301,978 Bank interest 2 384 Interest income on swaps 349,856
Net income from investments 1,161,006 Net realised gain on sales of investments 2,925,730 Net realised gain on swaps 77,179 Net realised gain on forward currency exchange contracts 362,507 Net realised gain on futures contracts 23,367 Net realised (loss) on foreign exchange (218,838)
Net realised gain 3,169,945 Change in net unrealised gain on investments 8,707,331 Change in net unrealised (loss) on swaps (821,781)Change in net unrealised gain on forward currency exchange contracts 100,995 Change in net unrealised gain on futures contracts 346,748
Net change in unrealised gain 8,333,293
Net increase in net assets as a result of operations 12,664,244 Movements in capital
Subscriptions of shares 46,092,182 Redemptions of shares (27,896,205)
Total movements in capital 18,195,977
Net assets at the end of the year 157,999,564
TOTAL NET ASSET VALUE March 31, 2021 March 31, 2020 March 31, 2019EUR 157,999,564 127,139,343 125,657,326
The accompanying notes form an integral part of these financial statements.
Threadneedle (Lux) - European Corporate Bond
19
Threadneedle (Lux) Annual Report and Audited Financial Statements March 2021
STATEMENT OF NET ASSET VALUE PER SHARE March 31, 2021 March 31, 2020 March 31, 2019Class AE 10.7975 9.9041 10.19Class ANH 10.42171 9.49491 –Class IE 10.9588 9.9912 10.22Class INH 10.50631 9.51941 –Class XE# 10.1073 – –Class XFH# 10.09382 – –Class XGH# 10.13153 – –Class XUH# 10.14414 – –Class ZE 10.9309 9.9786 10.22Class ZFH# 10.08012 – –Class 1E 1.4728 1.3507 1.39Class 1G 1.15483 1.10023 1.103
Class 2E 10.9688 9.9984 10.23Class 2G 10.39393 9.84573 9.813
Class 3G 1.29413 1.22673 1.223
Class 4E# 11.0208 – –Class 4G 10.80943 10.18453 –Class 8E 1.8383 1.6764 1.72Class 8G 1.56773 1.48503 1.483
Class 9G 10.37833 9.83733 9.813
1Class is denominated in NOK. The base currency of the Portfolio is EUR.2Class is denominated in CHF. The base currency of the Portfolio is EUR.3Class is denominated in GBP. The base currency of the Portfolio is EUR.4Class is denominated in USD. The base currency of the Portfolio is EUR.#See note 1.
STATEMENT OF NET ASSETSas at March 31, 2021
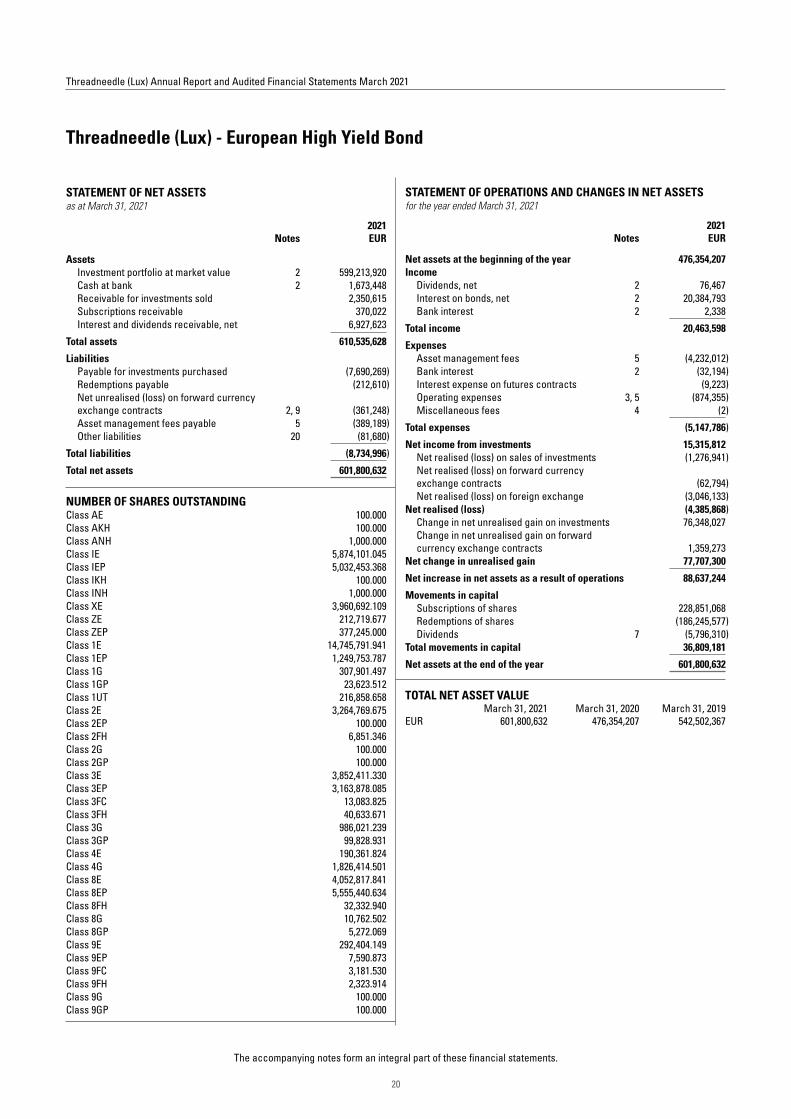
Notes2021 EUR
Assets Investment portfolio at market value 2 599,213,920 Cash at bank 2 1,673,448 Receivable for investments sold 2,350,615 Subscriptions receivable 370,022 Interest and dividends receivable, net 6,927,623
NUMBER OF SHARES OUTSTANDINGClass AE 100.000 Class AKH 100.000 Class ANH 1,000.000 Class IE 5,874,101.045 Class IEP 5,032,453.368 Class IKH 100.000 Class INH 1,000.000 Class XE 3,960,692.109 Class ZE 212,719.677 Class ZEP 377,245.000 Class 1E 14,745,791.941 Class 1EP 1,249,753.787 Class 1G 307,901.497 Class 1GP 23,623.512 Class 1UT 216,858.658 Class 2E 3,264,769.675 Class 2EP 100.000 Class 2FH 6,851.346 Class 2G 100.000 Class 2GP 100.000 Class 3E 3,852,411.330 Class 3EP 3,163,878.085 Class 3FC 13,083.825 Class 3FH 40,633.671 Class 3G 986,021.239 Class 3GP 99,828.931 Class 4E 190,361.824 Class 4G 1,826,414.501 Class 8E 4,052,817.841 Class 8EP 5,555,440.634 Class 8FH 32,332.940 Class 8G 10,762.502 Class 8GP 5,272.069 Class 9E 292,404.149 Class 9EP 7,590.873 Class 9FC 3,181.530 Class 9FH 2,323.914 Class 9G 100.000 Class 9GP 100.000
Threadneedle (Lux) - European High Yield Bond
20
The accompanying notes form an integral part of these financial statements.
Threadneedle (Lux) Annual Report and Audited Financial Statements March 2021
STATEMENT OF OPERATIONS AND CHANGES IN NET ASSETSfor the year ended March 31, 2021
Notes2021 EUR
Net assets at the beginning of the year 476,354,207 Income
Dividends, net 2 76,467 Interest on bonds, net 2 20,384,793 Bank interest 2 2,338
Net income from investments 15,315,812 Net realised (loss) on sales of investments (1,276,941)Net realised (loss) on forward currency exchange contracts (62,794)Net realised (loss) on foreign exchange (3,046,133)
Net realised (loss) (4,385,868)Change in net unrealised gain on investments 76,348,027 Change in net unrealised gain on forward currency exchange contracts 1,359,273
Net change in unrealised gain 77,707,300
Net increase in net assets as a result of operations 88,637,244 Movements in capital
Subscriptions of shares 228,851,068 Redemptions of shares (186,245,577)Dividends 7 (5,796,310)
Total movements in capital 36,809,181
Net assets at the end of the year 601,800,632
TOTAL NET ASSET VALUE March 31, 2021 March 31, 2020 March 31, 2019EUR 601,800,632 476,354,207 542,502,367
The accompanying notes form an integral part of these financial statements.
Threadneedle (Lux) - European High Yield Bond
21
Threadneedle (Lux) Annual Report and Audited Financial Statements March 2021
STATEMENT OF NET ASSET VALUE PER SHARE March 31, 2021 March 31, 2020 March 31, 2019Class AE# 11.2181 – –Class AKH 104.93571 88.66431 –Class ANH 10.54882 8.89542 –Class IE 11.1683 9.3892 10.20Class IEP 9.9899 8.7058 9.93Class IKH 105.85881 88.90891 –Class INH 10.64792 8.92222 –Class XE 10.8140 9.0281 –Class ZE 11.1495 9.3780 10.19Class ZEP 9.9735 8.7007 9.93Class 1E 11.0164 9.3105 10.16Class 1EP 9.8573 8.6466 9.90Class 1G 10.42973 9.15683 9.733
Class 1GP 9.35693 8.52253 9.513
Class 1UT 10.47524 9.11074 10.094
Class 2E 11.1761 9.3929 10.20Class 2EP 10.0267 8.7357 9.94Class 2FH 11.06155 9.32525 10.175
Class 2G 10.58723 9.24433 9.773
Class 2GP 9.49953 8.59563 9.523
Class 3E 11.1933 9.4027 10.20Class 3EP 10.0878 8.7895 10.00Class 3FC 9.93025 8.69065 9.925
Class 3FH 11.07605 9.33315 10.175
Class 3G 10.59643 9.24683 9.773
Class 3GP 9.43313 8.53903 9.473
Class 4E 11.3964 9.5067 10.24Class 4G 11.03653 9.56323 10.033
Class 4GP# – 8.71703 9.593
Class 8E 11.1642 9.3866 10.19Class 8EP 10.0322 8.7498 9.97Class 8FH 11.04865 9.31795 10.165
Class 8G 10.57183 9.23363 9.763
Class 8GP 9.49643 8.60373 9.553
Class 9E 11.2018 9.4061 10.20Class 9EP 10.0992 8.7964 10.01Class 9FC 10.00325 8.75105 9.995
Class 9FH 11.09185 9.34205 10.185
Class 9G 10.61613 9.25453 9.773
Class 9GP 9.51223 8.60213 9.533
1Class is denominated in SEK. The base currency of the Portfolio is EUR.2Class is denominated in NOK. The base currency of the Portfolio is EUR.3Class is denominated in GBP. The base currency of the Portfolio is EUR.4Class is denominated in USD. The base currency of the Portfolio is EUR.5Class is denominated in CHF. The base currency of the Portfolio is EUR.#See note 1.
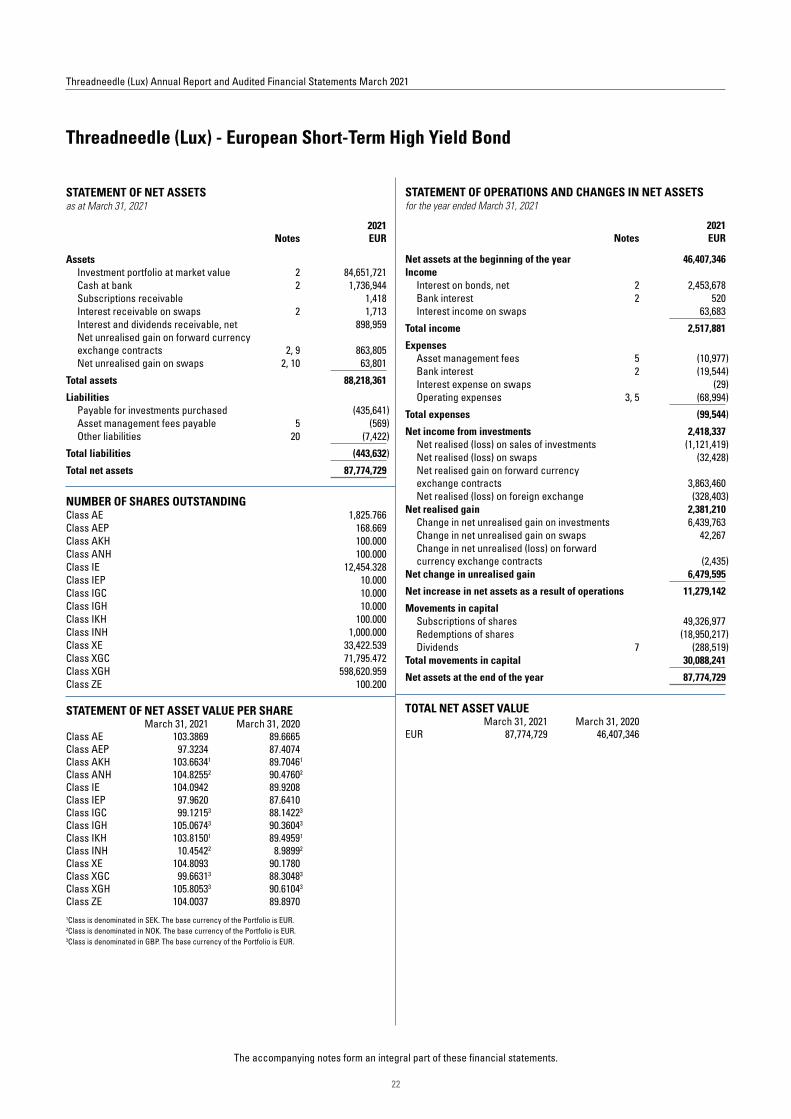
STATEMENT OF NET ASSETSas at March 31, 2021
Notes2021 EUR
Assets Investment portfolio at market value 2 84,651,721 Cash at bank 2 1,736,944 Subscriptions receivable 1,418 Interest receivable on swaps 2 1,713 Interest and dividends receivable, net 898,959 Net unrealised gain on forward currency exchange contracts 2, 9 863,805 Net unrealised gain on swaps 2, 10 63,801
NUMBER OF SHARES OUTSTANDINGClass AE 1,825.766 Class AEP 168.669 Class AKH 100.000 Class ANH 100.000 Class IE 12,454.328 Class IEP 10.000 Class IGC 10.000 Class IGH 10.000 Class IKH 100.000 Class INH 1,000.000 Class XE 33,422.539 Class XGC 71,795.472 Class XGH 598,620.959 Class ZE 100.200
STATEMENT OF NET ASSET VALUE PER SHARE March 31, 2021 March 31, 2020 Class AE 103.3869 89.6665 Class AEP 97.3234 87.4074 Class AKH 103.66341 89.70461 Class ANH 104.82552 90.47602 Class IE 104.0942 89.9208 Class IEP 97.9620 87.6410 Class IGC 99.12153 88.14223 Class IGH 105.06743 90.36043 Class IKH 103.81501 89.49591 Class INH 10.45422 8.98992 Class XE 104.8093 90.1780 Class XGC 99.66313 88.30483 Class XGH 105.80533 90.61043 Class ZE 104.0037 89.8970 1Class is denominated in SEK. The base currency of the Portfolio is EUR.2Class is denominated in NOK. The base currency of the Portfolio is EUR.3Class is denominated in GBP. The base currency of the Portfolio is EUR.
Threadneedle (Lux) - European Short-Term High Yield Bond
22
The accompanying notes form an integral part of these financial statements.
Threadneedle (Lux) Annual Report and Audited Financial Statements March 2021
STATEMENT OF OPERATIONS AND CHANGES IN NET ASSETSfor the year ended March 31, 2021
Notes2021 EUR
Net assets at the beginning of the year 46,407,346 Income
Interest on bonds, net 2 2,453,678 Bank interest 2 520 Interest income on swaps 63,683
Net income from investments 2,418,337 Net realised (loss) on sales of investments (1,121,419)Net realised (loss) on swaps (32,428)Net realised gain on forward currency exchange contracts 3,863,460 Net realised (loss) on foreign exchange (328,403)
Net realised gain 2,381,210 Change in net unrealised gain on investments 6,439,763 Change in net unrealised gain on swaps 42,267 Change in net unrealised (loss) on forward currency exchange contracts (2,435)
Net change in unrealised gain 6,479,595
Net increase in net assets as a result of operations 11,279,142 Movements in capital
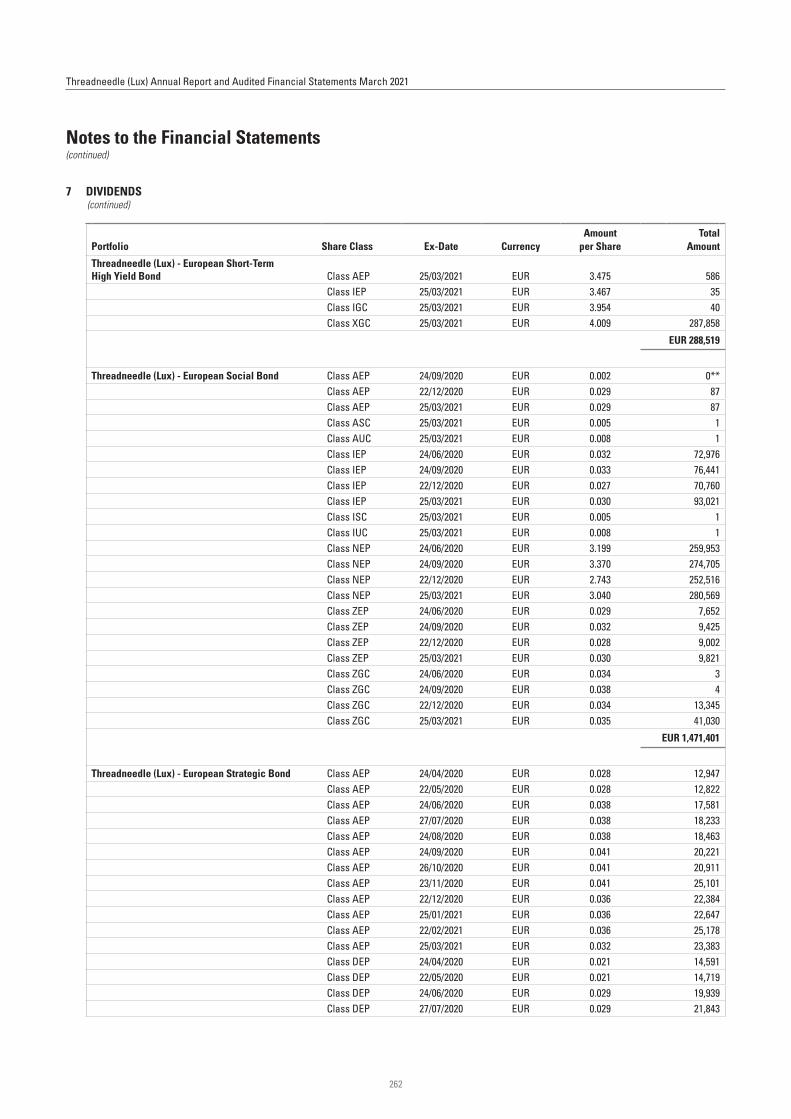
Subscriptions of shares 49,326,977 Redemptions of shares (18,950,217)Dividends 7 (288,519)
Total movements in capital 30,088,241
Net assets at the end of the year 87,774,729
TOTAL NET ASSET VALUE March 31, 2021 March 31, 2020 EUR 87,774,729 46,407,346
STATEMENT OF NET ASSETSas at March 31, 2021
Notes2021 EUR
Assets Investment portfolio at market value 2 322,861,102 Cash at bank 2 5,527,846 Receivable for investments sold 1,673,580 Subscriptions receivable 1,126,767 Interest and dividends receivable, net 1,730,296 Net unrealised gain on futures contracts 2, 11 220,186
NUMBER OF SHARES OUTSTANDINGClass AE 1,482,059.000 Class AEP 3,000.000 Class AFH 100.000 Class AKH 100.000 Class ANH 1,000.000 Class ASC 100.000 Class ASH 100.000 Class AUC 100.000 Class AUH 100.000 Class ID 22,738,393.068 Class IE 3,864,934.519 Class IEP 3,103,460.342 Class IFH 327.000 Class IGH 100.000 Class IKH 100.000 Class INH 1,000.000 Class ISC 100.000 Class ISH 100.000 Class IUC 100.000 Class IUH 100.000 Class LE 4,653,349.887 Class NEP 92,557.669 Class ZD 9,443,744.726 Class ZE 2,801,589.217 Class ZEP 326,117.002 Class ZFH 1,827.000 Class ZGC 1,233,227.946 Class ZGH 333,788.609 Class ZUH 2,134.941
The accompanying notes form an integral part of these financial statements.
Threadneedle (Lux) - European Social Bond
23
Threadneedle (Lux) Annual Report and Audited Financial Statements March 2021
STATEMENT OF OPERATIONS AND CHANGES IN NET ASSETSfor the year ended March 31, 2021
Notes2021 EUR
Net assets at the beginning of the year 154,103,742 Income
Interest on bonds, net 2 2,728,353 Bank interest 2 820 Other income 850
Net income from investments 1,756,265 Net realised gain on sales of investments 723,220 Net realised gain on forward currency exchange contracts 305,925 Net realised gain on futures contracts 568,340 Net realised (loss) on foreign exchange (342,213)
Net realised gain 1,255,272 Change in net unrealised gain on investments 5,764,085 Change in net unrealised (loss) on forward currency exchange contracts (130,131)Change in net unrealised gain on futures contracts 168,878
Net change in unrealised gain 5,802,832
Net increase in net assets as a result of operations 8,814,369 Movements in capital
Subscriptions of shares 187,061,070 Redemptions of shares (18,611,401)Dividends 7 (1,471,401)
Total movements in capital 166,978,268
Net assets at the end of the year 329,896,379
TOTAL NET ASSET VALUE March 31, 2021 March 31, 2020 March 31, 2019EUR 329,896,379 154,103,742 29,456,674
Threadneedle (Lux) - European Social Bond
24
The accompanying notes form an integral part of these financial statements.
Threadneedle (Lux) Annual Report and Audited Financial Statements March 2021
STATEMENT OF NET ASSET VALUE PER SHARE March 31, 2021 March 31, 2020 March 31, 2019Class AE# 9.9729 – –Class AEP# 9.9137 – –Class AFH# 9.97101 – –Class AKH# 99.52782 – –Class ANH# 9.97623 – –Class ASC# 9.97034 – –Class ASH# 9.97844 – –Class AUC# 9.97045 – –Class AUH# 9.97925 – –Class ID 10.08746 9.57786 –Class IE 10.7559 10.1785 10.27Class IEP 10.2088 9.7761 10.01Class IFH 10.49091 9.96421 10.111
Class ZGC# 10.49347 – –Class ZGH# 10.62187 – –Class ZUH# 10.24725 – –1Class is denominated in CHF. The base currency of the Portfolio is EUR.2Class is denominated in SEK. The base currency of the Portfolio is EUR.3Class is denominated in NOK. The base currency of the Portfolio is EUR.4Class is denominated in SGD. The base currency of the Portfolio is EUR.5Class is denominated in USD. The base currency of the Portfolio is EUR.6Class is denominated in DKK. The base currency of the Portfolio is EUR.7Class is denominated in GBP. The base currency of the Portfolio is EUR.#See note 1.
STATEMENT OF NET ASSETSas at March 31, 2021
Notes2021 EUR
Assets Investment portfolio at market value 2 226,972,563 Cash at bank 2 11,371,329 Receivable for investments sold 427,443 Subscriptions receivable 3,042,620 Interest receivable on swaps 2 41,580 Interest and dividends receivable, net 2,154,588 Upfront payment paid on swaps 2 47,121 Net unrealised gain on futures contracts 2, 11 604,445
Total assets 244,661,689
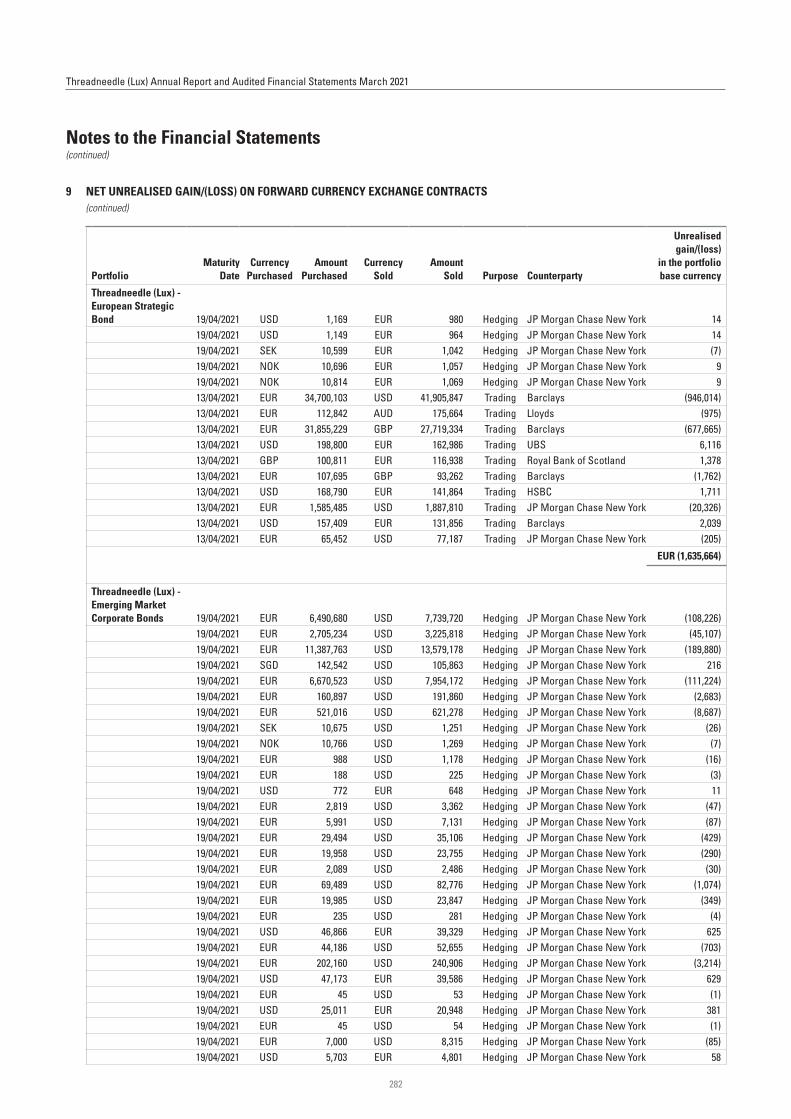
Liabilities Payable for investments purchased (4,604,223)Redemptions payable (306,099)Interest payable on swaps 2 (86,867)Upfront payment received on swaps 2 (76,782)Net unrealised (loss) on forward currency exchange contracts 2, 9 (1,635,664)Net unrealised (loss) on swaps 2, 10 (3,597,437)Asset management fees payable 5 (167,773)Other liabilities 20 (42,143)
Total liabilities (10,516,988)
Total net assets 234,144,701
NUMBER OF SHARES OUTSTANDINGClass AE 2,862,485.164 Class AEP 736,346.384 Class AKH 100.000 Class ANH 1,000.000 Class AUH 100.000 Class DE 1,277,944.560 Class DEP 1,587,207.898 Class DUH 100.000 Class IE 2,490,319.035 Class INH 1,000.000
STATEMENT OF NET ASSET VALUE PER SHARE March 31, 2021 March 31, 2020 March 31, 2019Class AE 31.0867 27.7686 28.63Class AEP 15.3978 14.1492 14.89Class AKH 105.85671 94.46081 –Class ANH 10.68642 9.50872 –Class AUH 11.67843 10.35013 10.383
Class DE 29.1371 26.1701 27.13Class DEP 11.5522 10.6750 11.30Class DUH 11.47743 10.24053 10.343
Class IE 31.4196 27.8985 28.59Class INH 10.80712 9.54322 –Class W# – 58.8490 60.671Class is denominated in SEK. The base currency of the Portfolio is EUR.2Class is denominated in NOK. The base currency of the Portfolio is EUR.3Class is denominated in USD. The base currency of the Portfolio is EUR.#See note 1.
The accompanying notes form an integral part of these financial statements.
Threadneedle (Lux) - European Strategic Bond
25
Threadneedle (Lux) Annual Report and Audited Financial Statements March 2021
STATEMENT OF OPERATIONS AND CHANGES IN NET ASSETSfor the year ended March 31, 2021
Notes2021 EUR
Net assets at the beginning of the year 165,029,205 Income
Interest on bonds, net 2 5,318,469 Bank interest 2 3,701 Interest income on swaps 881,629 Interest income on futures contracts 154
Net income from investments 2,061,867 Net realised gain on sales of investments 2,419,959 Net realised gain on swaps 2,199,925 Net realised gain on forward currency exchange contracts 5,735,507 Net realised gain on futures contracts 1,852,806 Net realised (loss) on foreign exchange (1,508,128)
Net realised gain 10,700,069 Change in net unrealised gain on investments 15,788,408 Change in net unrealised (loss) on swaps (4,874,362)Change in net unrealised (loss) on forward currency exchange contracts (3,884,202)Change in net unrealised gain on futures contracts 262,918
Net change in unrealised gain 7,292,762
Net increase in net assets as a result of operations 20,054,698 Movements in capital
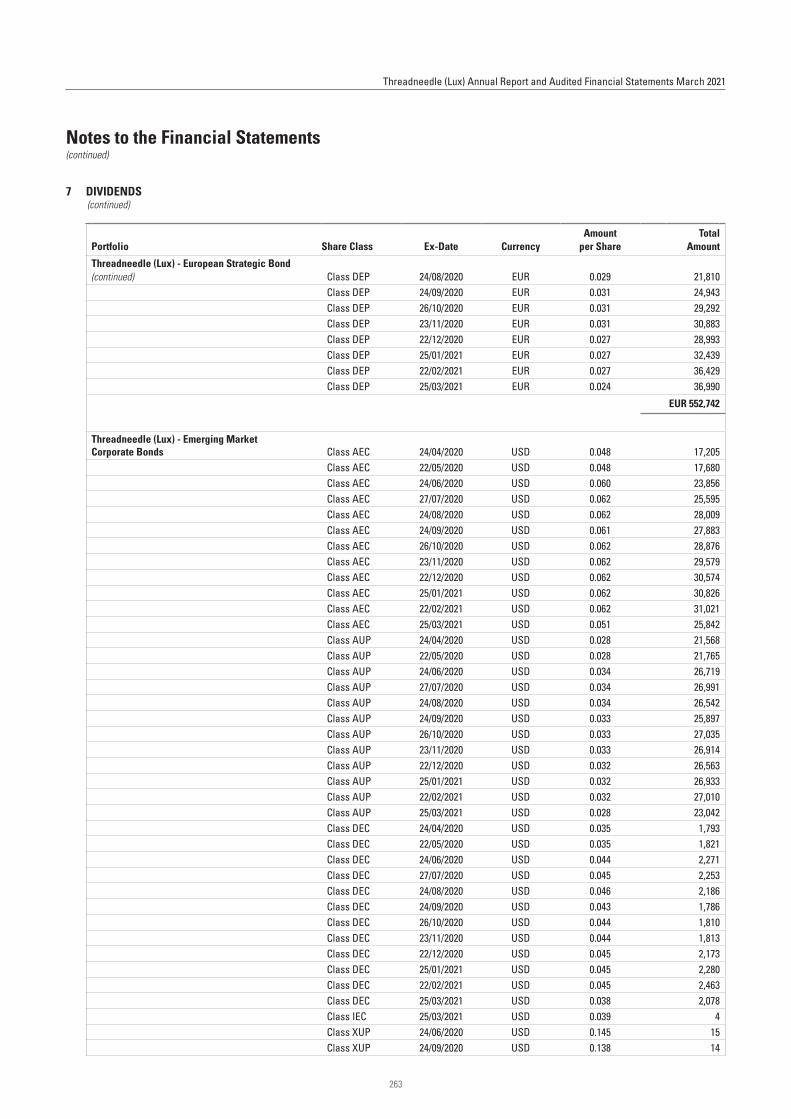
Subscriptions of shares 107,601,267 Redemptions of shares (57,987,727)Dividends 7 (552,742)
Total movements in capital 49,060,798
Net assets at the end of the year 234,144,701
TOTAL NET ASSET VALUE March 31, 2021 March 31, 2020 March 31, 2019EUR 234,144,701 165,029,205 97,043,105
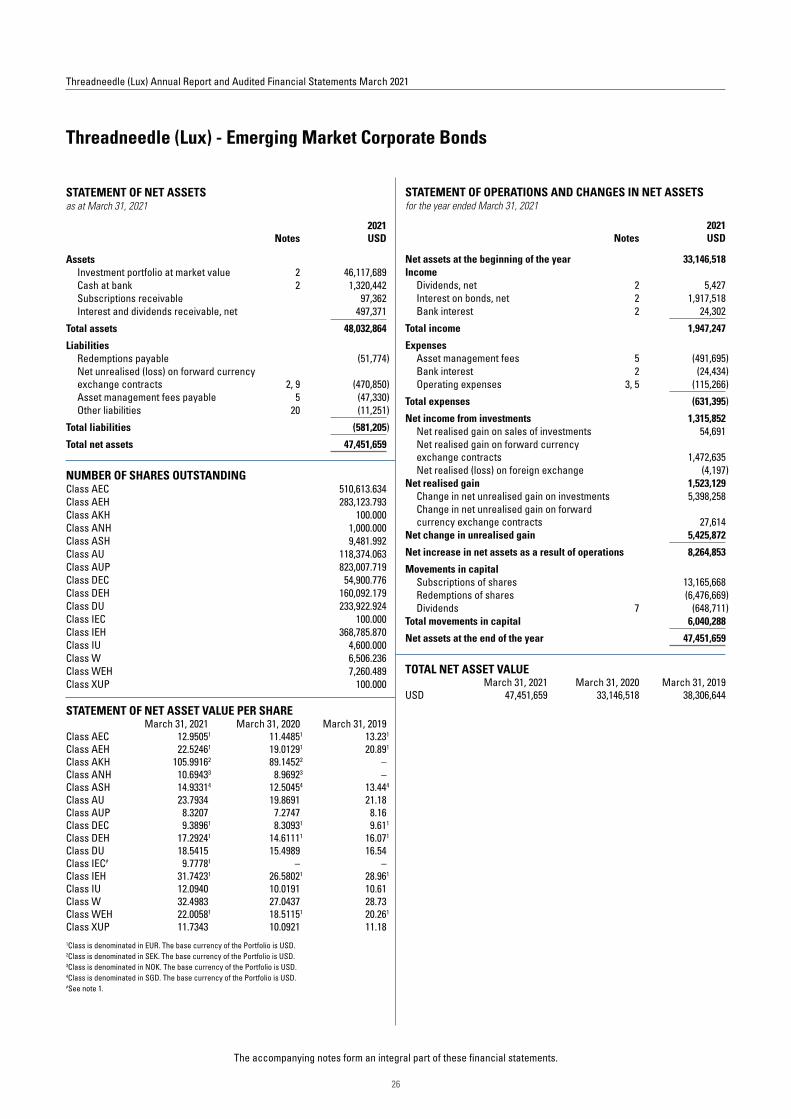
STATEMENT OF NET ASSETSas at March 31, 2021
Notes2021 USD
Assets Investment portfolio at market value 2 46,117,689 Cash at bank 2 1,320,442 Subscriptions receivable 97,362 Interest and dividends receivable, net 497,371
NUMBER OF SHARES OUTSTANDINGClass AEC 510,613.634 Class AEH 283,123.793 Class AKH 100.000 Class ANH 1,000.000 Class ASH 9,481.992 Class AU 118,374.063 Class AUP 823,007.719 Class DEC 54,900.776 Class DEH 160,092.179 Class DU 233,922.924 Class IEC 100.000 Class IEH 368,785.870 Class IU 4,600.000 Class W 6,506.236 Class WEH 7,260.489 Class XUP 100.000
STATEMENT OF NET ASSET VALUE PER SHARE March 31, 2021 March 31, 2020 March 31, 2019Class AEC 12.95051 11.44851 13.231
Class AEH 22.52461 19.01291 20.891
Class AKH 105.99162 89.14522 –Class ANH 10.69433 8.96923 –Class ASH 14.93314 12.50454 13.444
Class AU 23.7934 19.8691 21.18Class AUP 8.3207 7.2747 8.16Class DEC 9.38961 8.30931 9.611
Class DEH 17.29241 14.61111 16.071
Class DU 18.5415 15.4989 16.54Class IEC# 9.77781 – –Class IEH 31.74231 26.58021 28.961
Class IU 12.0940 10.0191 10.61Class W 32.4983 27.0437 28.73Class WEH 22.00581 18.51151 20.261
Class XUP 11.7343 10.0921 11.181Class is denominated in EUR. The base currency of the Portfolio is USD.2Class is denominated in SEK. The base currency of the Portfolio is USD.3Class is denominated in NOK. The base currency of the Portfolio is USD.4Class is denominated in SGD. The base currency of the Portfolio is USD.#See note 1.
Net income from investments 1,315,852 Net realised gain on sales of investments 54,691 Net realised gain on forward currency exchange contracts 1,472,635 Net realised (loss) on foreign exchange (4,197)
Net realised gain 1,523,129 Change in net unrealised gain on investments 5,398,258 Change in net unrealised gain on forward currency exchange contracts 27,614
Net change in unrealised gain 5,425,872
Net increase in net assets as a result of operations 8,264,853 Movements in capital
Subscriptions of shares 13,165,668 Redemptions of shares (6,476,669)Dividends 7 (648,711)
Total movements in capital 6,040,288
Net assets at the end of the year 47,451,659
TOTAL NET ASSET VALUE March 31, 2021 March 31, 2020 March 31, 2019USD 47,451,659 33,146,518 38,306,644
STATEMENT OF NET ASSETSas at March 31, 2021
Notes2021 USD
Assets Investment portfolio at market value 2 45,096,230 Cash at bank 2 693,215 Subscriptions receivable 2,136 Interest and dividends receivable, net 518,836 Other assets 20 198
NUMBER OF SHARES OUTSTANDINGClass AEC 76,596.823 Class AEH 16,417.034 Class AKH 100.000 Class ANH 1,000.000 Class ASH 4,783.159 Class AU 60,102.027 Class AUP 3,172,662.893 Class DEH 14,482.629 Class DU 22,173.894 Class IEH 20,118.643 Class IU 100.000 Class SU 1,149.458 Class SUP 52,605.021 Class W 8,468.618 Class XUP 100.000 Class ZU 200.000
STATEMENT OF NET ASSET VALUE PER SHARE March 31, 2021 March 31, 2020 March 31, 2019Class AEC 9.21771 8.17001 9.971
Class AEH 26.83841 22.64021 26.101
Class AKH 100.75662 84.84432 –Class ANH 10.13283 8.52113 –Class ASH 12.61344 10.55974 11.914
Class AU 79.1694 66.0483 73.87Class AUP 11.3182 9.9193 11.75Class DEH 19.94651 16.84521 19.441
Class DU 56.3008 47.0167 52.64Class IEH 29.36331 24.57291 28.111
Class IU 10.8581 9.0048 –Class SU 31.7934 26.5644 29.75Class SUP 10.8819 9.5489 11.32Class W 65.8940 54.7816 61.05Class XUP 10.9029 9.3824 10.96Class ZU 12.6758 10.4968 11.651Class is denominated in EUR. The base currency of the Portfolio is USD.2Class is denominated in SEK. The base currency of the Portfolio is USD.3Class is denominated in NOK. The base currency of the Portfolio is USD.4Class is denominated in SGD. The base currency of the Portfolio is USD.
The accompanying notes form an integral part of these financial statements.
Threadneedle (Lux) - Emerging Market Debt
27
Threadneedle (Lux) Annual Report and Audited Financial Statements March 2021
STATEMENT OF OPERATIONS AND CHANGES IN NET ASSETSfor the year ended March 31, 2021
Notes2021 USD
Net assets at the beginning of the year 45,432,000 Income
Dividends, net 2 9,029 Interest on bonds, net 2 2,294,114 Bank interest 2 330
Net income from investments 1,506,580 Net realised gain on sales of investments 382,813 Net realised gain on forward currency exchange contracts 216,935 Net realised (loss) on foreign exchange (20,739)
Net realised gain 579,009
Change in net unrealised gain on investments 6,141,382 Change in net unrealised (loss) on forward currency exchange contracts (222,569)
Net change in unrealised gain 5,918,813
Net increase in net assets as a result of operations 8,004,402 Movements in capital
Subscriptions of shares 1,436,692 Redemptions of shares (7,376,983)Dividends 7 (1,980,289)
Total movements in capital (7,920,580)
Net assets at the end of the year 45,515,822
TOTAL NET ASSET VALUE March 31, 2021 March 31, 2020 March 31, 2019USD 45,515,822 45,432,000 57,760,204
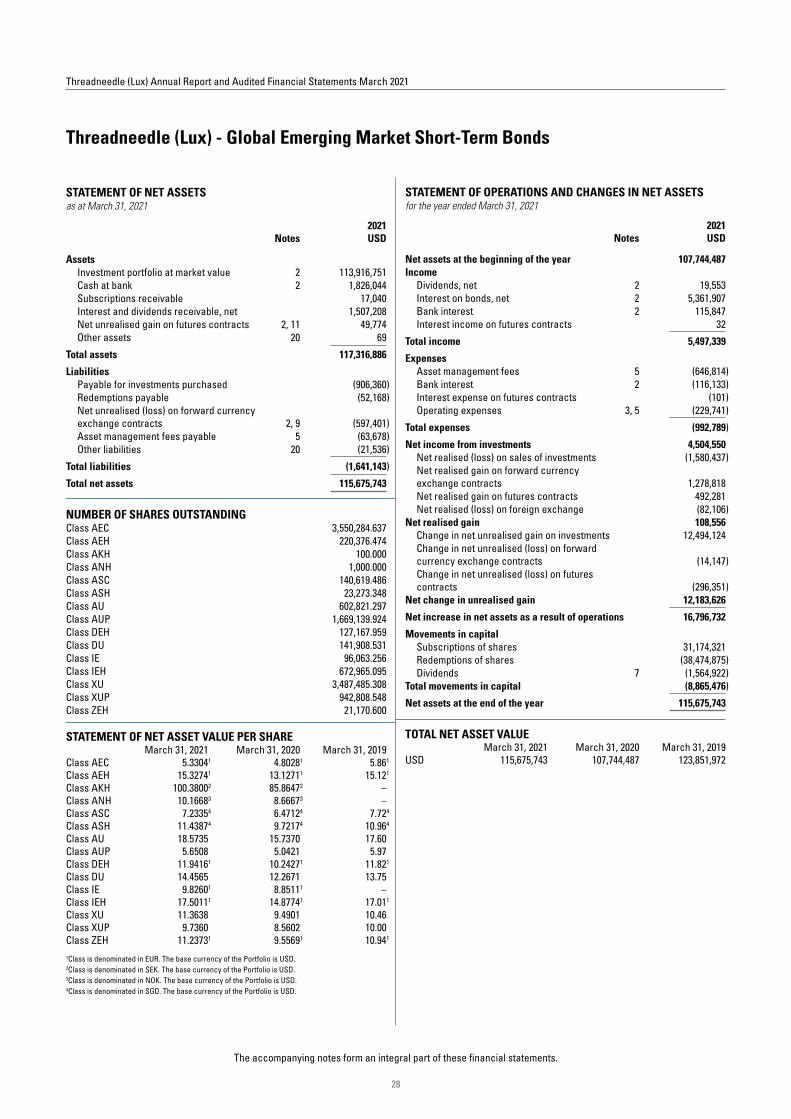
STATEMENT OF NET ASSETSas at March 31, 2021
Notes2021 USD
Assets Investment portfolio at market value 2 113,916,751 Cash at bank 2 1,826,044 Subscriptions receivable 17,040 Interest and dividends receivable, net 1,507,208 Net unrealised gain on futures contracts 2, 11 49,774 Other assets 20 69
NUMBER OF SHARES OUTSTANDINGClass AEC 3,550,284.637 Class AEH 220,376.474 Class AKH 100.000 Class ANH 1,000.000 Class ASC 140,619.486 Class ASH 23,273.348 Class AU 602,821.297 Class AUP 1,669,139.924 Class DEH 127,167.959 Class DU 141,908.531 Class IE 96,063.256 Class IEH 672,965.095 Class XU 3,487,485.308 Class XUP 942,808.548 Class ZEH 21,170.600
STATEMENT OF NET ASSET VALUE PER SHARE March 31, 2021 March 31, 2020 March 31, 2019Class AEC 5.33041 4.80281 5.861
Class AEH 15.32741 13.12711 15.121
Class AKH 100.38002 85.86472 –Class ANH 10.16683 8.66673 –Class ASC 7.23354 6.47124 7.724
Class ASH 11.43874 9.72174 10.964
Class AU 18.5735 15.7370 17.60Class AUP 5.6508 5.0421 5.97Class DEH 11.94161 10.24271 11.821
Class DU 14.4565 12.2671 13.75Class IE 9.82601 8.85111 –Class IEH 17.50111 14.87741 17.011
1Class is denominated in EUR. The base currency of the Portfolio is USD.2Class is denominated in SEK. The base currency of the Portfolio is USD.3Class is denominated in NOK. The base currency of the Portfolio is USD.4Class is denominated in SGD. The base currency of the Portfolio is USD.
Threadneedle (Lux) - Global Emerging Market Short-Term Bonds
28
The accompanying notes form an integral part of these financial statements.
Threadneedle (Lux) Annual Report and Audited Financial Statements March 2021
STATEMENT OF OPERATIONS AND CHANGES IN NET ASSETSfor the year ended March 31, 2021
Notes2021 USD
Net assets at the beginning of the year 107,744,487 Income
Dividends, net 2 19,553 Interest on bonds, net 2 5,361,907 Bank interest 2 115,847 Interest income on futures contracts 32
Net income from investments 4,504,550 Net realised (loss) on sales of investments (1,580,437)Net realised gain on forward currency exchange contracts 1,278,818 Net realised gain on futures contracts 492,281 Net realised (loss) on foreign exchange (82,106)
Net realised gain 108,556 Change in net unrealised gain on investments 12,494,124 Change in net unrealised (loss) on forward currency exchange contracts (14,147)Change in net unrealised (loss) on futures contracts (296,351)
Net change in unrealised gain 12,183,626
Net increase in net assets as a result of operations 16,796,732 Movements in capital
Subscriptions of shares 31,174,321 Redemptions of shares (38,474,875)Dividends 7 (1,564,922)
Total movements in capital (8,865,476)
Net assets at the end of the year 115,675,743
TOTAL NET ASSET VALUE March 31, 2021 March 31, 2020 March 31, 2019USD 115,675,743 107,744,487 123,851,972
STATEMENT OF NET ASSETSas at March 31, 2021
Notes2021 USD
Assets Investment portfolio at market value 2 201,291,321 Cash at bank 2 9,145,490 Receivable for investments sold 302,363 Subscriptions receivable 3,672 Interest and dividends receivable, net 2,701,617
NUMBER OF SHARES OUTSTANDINGClass AEC 29,399.197 Class AEH 25,337.827 Class AKH 100.000 Class ANH 1,000.000 Class ASH 33,098.563 Class AU 108,617.002 Class AUP 293,209.951 Class DEC 30,019.154 Class DEH 27,948.363 Class DU 54,796.888 Class IEC 100.000 Class IEH 1,993,292.913 Class IKH 100.000 Class INH 1,000.000 Class IU 9,995,107.297 Class TEH 5,929.627 Class XUP 100.000 Class ZFH 100.000 Class ZGH 100.000 Class ZU 220,922.057
The accompanying notes form an integral part of these financial statements.
Threadneedle (Lux) - US High Yield Bond
29
Threadneedle (Lux) Annual Report and Audited Financial Statements March 2021
STATEMENT OF OPERATIONS AND CHANGES IN NET ASSETSfor the year ended March 31, 2021
Notes2021 USD
Net assets at the beginning of the year 109,192,138 Income
Interest on bonds, net 2 9,955,237 Bank interest 2 131,095 Other income 1,678
Net income from investments 8,628,972 Net realised gain on sales of investments 43,643 Net realised gain on forward currency exchange contracts 3,585,637 Net realised (loss) on foreign exchange (3,129)
Net realised gain 3,626,151 Change in net unrealised gain on investments 20,057,739 Change in net unrealised gain on forward currency exchange contracts 107,250
Net change in unrealised gain 20,164,989
Net increase in net assets as a result of operations 32,420,112 Movements in capital
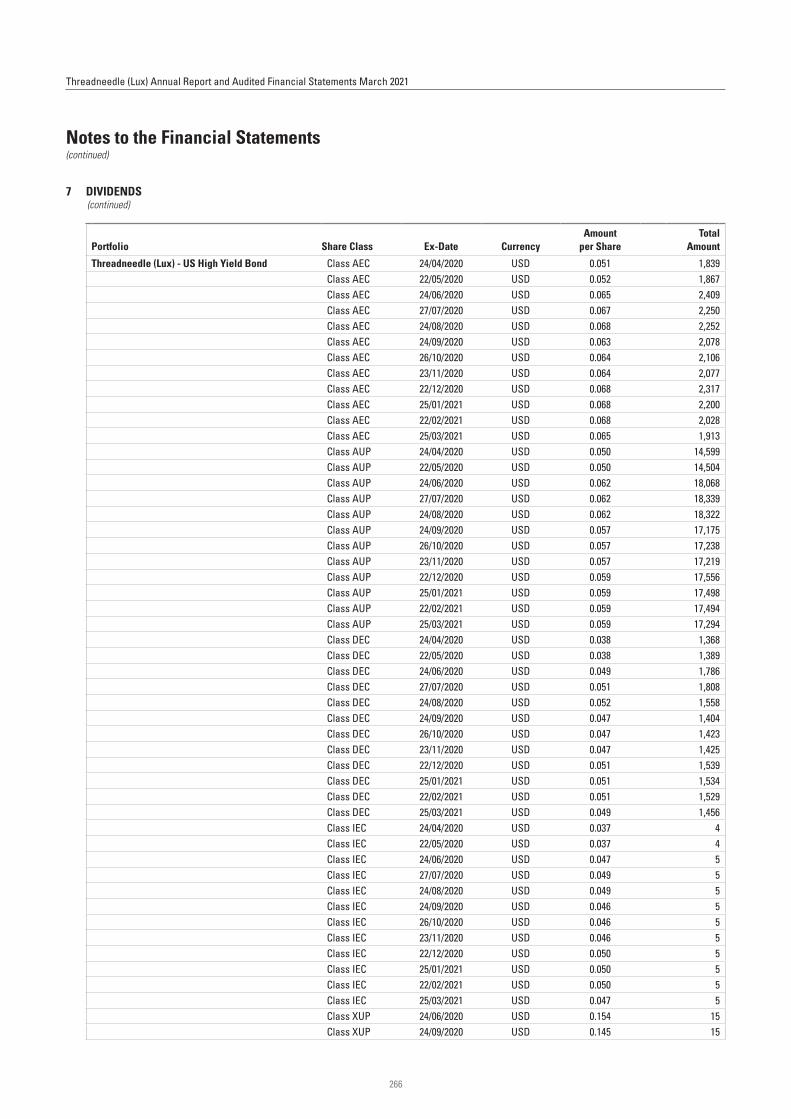
Subscriptions of shares 77,210,447 Redemptions of shares (7,996,111)Dividends 7 (248,978)
Total movements in capital 68,965,358
Net assets at the end of the year 210,577,608
TOTAL NET ASSET VALUE March 31, 2021 March 31, 2020 March 31, 2019USD 210,577,608 109,192,138 218,412,478
Threadneedle (Lux) - US High Yield Bond
30
The accompanying notes form an integral part of these financial statements.
Threadneedle (Lux) Annual Report and Audited Financial Statements March 2021
STATEMENT OF NET ASSET VALUE PER SHARE March 31, 2021 March 31, 2020 March 31, 2019Class AEC 12.51081 11.19301 12.861
Class AEH 32.73441 27.77541 30.281
Class AKH 104.54292 88.54582 –Class ANH 10.48673 8.86523 –Class ASH 15.30064 12.88414 13.764
Class AU 38.3288 32.1520 34.04Class AUP 13.3803 11.8329 13.20Class DEC 9.44711 8.46451 9.741
Class DEH 23.57981 20.04621 21.901
Class DU 27.5635 23.1677 24.57Class IEC 9.15421 8.12161 9.241
Class IEH 32.50651 27.33641 29.551
Class IKH 105.97502 88.94112 –Class INH 10.63743 8.90743 –Class IU 11.8836 9.8795 10.36Class TEH 11.60331 9.76021 10.541
Class XUP 10.9963 9.6033 10.65Class ZFH 11.09195 9.37625 10.205
Class ZGH 12.20296 10.23906 11.026
Class ZU 13.8794 11.5675 12.171Class is denominated in EUR. The base currency of the Portfolio is USD.2Class is denominated in SEK. The base currency of the Portfolio is USD.3Class is denominated in NOK. The base currency of the Portfolio is USD.4Class is denominated in SGD. The base currency of the Portfolio is USD.5Class is denominated in CHF. The base currency of the Portfolio is USD.6Class is denominated in GBP. The base currency of the Portfolio is USD.
STATEMENT OF NET ASSETSas at March 31, 2021
Notes2021 USD
Assets Investment portfolio at market value 2 63,576,136 Cash at bank 2 1,982,184 Term deposits 2, 19 2,800,302 Subscriptions receivable 33,901 Interest and dividends receivable, net 647,555 Net unrealised gain on futures contracts 2, 11 81,375
NUMBER OF SHARES OUTSTANDINGClass AEH 73,866.257 Class AKH 100.000 Class AS 588.627 Class ASC 13,391.591 Class ASH 43,061.928 Class AU 140,381.448 Class AUP 1,233,581.295 Class AVC 100.000 Class AVH 100.000 Class DEH 57,198.901 Class IEH 1,140,988.911 Class IGH 200.000 Class ISH 250.000 Class IU 250.000 Class XU 2,509,247.889 Class ZU 42,250.000 Class ZUP 100.000
STATEMENT OF NET ASSET VALUE PER SHARE March 31, 2021 March 31, 2020 March 31, 2019Class AEH 11.96041 10.52311 11.221
Class AKH 102.87292 90.25782 –Class AS 11.64263 10.73993 10.573
Class ASC 10.86413 9.86423 10.703
Class ASH 13.13273 11.46063 11.963
Class AU 13.4327 11.6914 12.10Class AUP 11.3378 10.2697 11.06Class AVC 10.38784 9.46104 10.344
Class AVH 11.61504 10.16534 10.694
Class DEH 11.65151 10.27731 10.981
Class IEH 12.47081 10.90011 11.531
Class IGH 13.18275 11.45705 12.025
Class ISH 13.74203 11.91523 12.343
Class IU 14.0310 12.1334 12.46Class XU 13.2554 11.3998 11.63Class ZU 14.0429 12.1566 12.50Class ZUP 10.8803 9.8031 10.501Class is denominated in EUR. The base currency of the Portfolio is USD.2Class is denominated in SEK. The base currency of the Portfolio is USD.3Class is denominated in SGD. The base currency of the Portfolio is USD.4Class is denominated in AUD. The base currency of the Portfolio is USD.5Class is denominated in GBP. The base currency of the Portfolio is USD.
The accompanying notes form an integral part of these financial statements.
Threadneedle (Lux) - Flexible Asian Bond
31
Threadneedle (Lux) Annual Report and Audited Financial Statements March 2021
STATEMENT OF OPERATIONS AND CHANGES IN NET ASSETSfor the year ended March 31, 2021
Notes2021 USD
Net assets at the beginning of the year 47,684,339 Income
Interest on bonds, net 2 2,087,307 Bank interest 2 1,181
Net income from investments 1,821,372 Net realised gain on sales of investments 1,047,574 Net realised gain on forward currency exchange contracts 874,944 Net realised gain on futures contracts 87,742 Net realised (loss) on foreign exchange (21,297)
Net realised gain 1,988,963 Change in net unrealised gain on investments 3,316,635 Change in net unrealised (loss) on forward currency exchange contracts (37,927)Change in net unrealised gain on futures contracts 81,375
Net change in unrealised gain 3,360,083
Net increase in net assets as a result of operations 7,170,418 Movements in capital
Subscriptions of shares 29,432,982 Redemptions of shares (15,152,950)Dividends 7 (315,606)
Total movements in capital 13,964,426
Net assets at the end of the year 68,819,183
TOTAL NET ASSET VALUE March 31, 2021 March 31, 2020 March 31, 2019USD 68,819,183 47,684,339 38,976,738
STATEMENT OF NET ASSETSas at March 31, 2021
Notes2021 EUR
Assets Investment portfolio at market value 2 28,223,249 Cash at bank 2 1,952,575 Term deposits 2, 19 1,793,149 Subscriptions receivable 7,422 Interest and dividends receivable, net 1,272 Net unrealised gain on futures contracts 2, 11 54,116 Other assets 20 579
Total assets 32,032,362
Liabilities Net unrealised (loss) on forward currency exchange contracts 2, 9 (133,039)Asset management fees payable 5 (14,890)Other liabilities 20 (5,420)
Total liabilities (153,349)
Total net assets 31,879,013
NUMBER OF SHARES OUTSTANDINGClass AE 16,910.736 Class AEP 100.265 Class DE 36,356.170 Class IE 580,902.147 Class IEP 100.925 Class LE 2,109,458.216 Class LEP 100.870 Class ZE 100.748 Class ZEP 100.538
STATEMENT OF NET ASSET VALUE PER SHARE March 31, 2021 March 31, 2020 March 31, 2019Class AE 11.3495 9.1419 10.03Class AEP 11.2520 9.0786 9.99Class DE 11.1024 9.0100 9.96Class IE 11.5850 9.2667 10.10Class IEP 11.4878 9.2021 10.05Class LE 11.6371 9.2945 10.11Class LEP 11.5394 9.2290 10.07Class ZE 11.5196 9.2308 10.08Class ZEP 11.4285 9.1673 10.03
Threadneedle (Lux) - Euro Dynamic Real Return
32
The accompanying notes form an integral part of these financial statements.
Threadneedle (Lux) Annual Report and Audited Financial Statements March 2021
STATEMENT OF OPERATIONS AND CHANGES IN NET ASSETSfor the year ended March 31, 2021
Notes2021 EUR
Net assets at the beginning of the year 26,502,999 Income
Interest on bonds, net 2 26,394 Bank interest 2 138 Interest income on futures contracts 82 Asset management fee rebates 2 1,525
Net (loss) from investments (214,636)Net realised gain on sales of investments 160,168 Net realised gain on forward currency exchange contracts 197,794 Net realised gain on futures contracts 1,408,101 Net realised gain on foreign exchange 24,882
Net realised gain 1,790,945 Change in net unrealised gain on investments 4,844,166 Change in net unrealised (loss) on forward currency exchange contracts (223,340)Change in net unrealised gain on futures contracts 159,809
Net change in unrealised gain 4,780,635
Net increase in net assets as a result of operations 6,356,944 Movements in capital
Subscriptions of shares 4,238,779 Redemptions of shares (5,219,705)Dividends 7 (4)
Total movements in capital (980,930)
Net assets at the end of the year 31,879,013
TOTAL NET ASSET VALUE March 31, 2021 March 31, 2020 March 31, 2019EUR 31,879,013 26,502,999 22,759,479
STATEMENT OF NET ASSETSas at March 31, 2021
Notes2021 USD
Assets Investment portfolio at market value 2 53,647,269 Cash at bank 2 3,158,794 Term deposits 2, 19 1,000,003 Subscriptions receivable 13,108 Interest receivable on swaps 2 13,836 Interest and dividends receivable, net 76,000 Net unrealised gain on swaps 2, 10 593,035 Net unrealised gain on futures contracts 2, 11 92,842 Other assets 20 8,325
Total assets 58,603,212
Liabilities Bank overdrafts (17)Redemptions payable (14,746)Interest payable on swaps 2 (6,879)Net unrealised (loss) on forward currency exchange contracts 2, 9 (470,748)Asset management fees payable 5 (66,122)Other liabilities 20 (13,973)
Total liabilities (572,485)
Total net assets 58,030,727
NUMBER OF SHARES OUTSTANDINGClass AEC 63,966.219 Class AEH 330,822.224 Class AKH 100.000 Class AU 367,722.556 Class AUP 385,002.155 Class DEH 109,389.345 Class DU 233,883.366 Class IEH 100.000 Class IGH 12,209.135 Class IU 377,608.307 Class W 26,123.425
STATEMENT OF NET ASSET VALUE PER SHARE March 31, 2021 March 31, 2020 March 31, 2019Class AEC 14.03611 11.89611 12.831
Class AEH 28.71451 23.98701 25.521
Class AKH 112.05902 93.45702 –Class AU 43.1173 35.5588 36.74Class AUP 16.2512 13.5959 14.24Class DEH 20.73201 17.43061 18.661
Class DU 28.2598 23.4573 24.40Class IEH 11.24781 9.33861 –Class IGH 29.34393 24.20563 25.363
Class IU 31.9704 26.1826 26.86Class W 71.0014 58.6132 60.621Class is denominated in EUR. The base currency of the Portfolio is USD.2Class is denominated in SEK. The base currency of the Portfolio is USD.3Class is denominated in GBP. The base currency of the Portfolio is USD.
The accompanying notes form an integral part of these financial statements.
Threadneedle (Lux) - Global Dynamic Real Return
33
Threadneedle (Lux) Annual Report and Audited Financial Statements March 2021
STATEMENT OF OPERATIONS AND CHANGES IN NET ASSETSfor the year ended March 31, 2021
Notes2021 USD
Net assets at the beginning of the year 49,565,024 Income
Dividends, net 2 343,380 Interest on bonds, net 2 88,996 Bank interest 2 13,505 Interest income on swaps 280,778 Interest income on futures contracts 933 Asset management fee rebates 1,205
Net (loss) from investments (250,211)Net realised gain on sales of investments 2,782,797 Net realised (loss) on swaps (147,421)Net realised gain on forward currency exchange contracts 1,053,556 Net realised (loss) on futures contracts (2,665,092)Net realised (loss) on foreign exchange (37,882)Net realised gain on tax reclaim 58
Net realised gain 986,016 Change in net unrealised gain on investments 11,144,176 Change in net unrealised gain on swaps 703,943 Change in net unrealised (loss) on forward currency exchange contracts (289,677)Change in net unrealised (loss) on futures contracts (764,933)
Net change in unrealised gain 10,793,509
Net increase in net assets as a result of operations 11,529,314 Movements in capital
Subscriptions of shares 5,863,362 Redemptions of shares (8,810,800)Dividends 7 (116,173)
Total movements in capital (3,063,611)
Net assets at the end of the year 58,030,727
TOTAL NET ASSET VALUE March 31, 2021 March 31, 2020 March 31, 2019USD 58,030,727 49,565,024 59,178,404
STATEMENT OF NET ASSETSas at March 31, 2021
Notes2021 USD
Assets Investment portfolio at market value 2 170,356,015 Cash at bank 2 8,620,378 Receivable for investments sold 348,011 Subscriptions receivable 125,349 Interest receivable on swaps 2 4,208 Interest and dividends receivable, net 908,174 Upfront payment paid on swaps 2 2,265 Net unrealised gain on futures contracts 2, 11 30,109 Other assets 20 17,363
Total assets 180,411,872
Liabilities Bank overdrafts (2,298,981)Options sold at market Value 2, 12 (282,377)Payable for investments purchased (831,117)Redemptions payable (634,104)Interest payable on swaps 2 (5,571)Upfront payment received on swaps 2 (2,362)Net unrealised (loss) on forward currency exchange contracts 2, 9 (753,918)Net unrealised (loss) on swaps 2, 10 (121,117)Asset management fees payable 5 (229,032)Other liabilities 20 (45,536)
Total liabilities (5,204,115)
Total net assets 175,207,757
NUMBER OF SHARES OUTSTANDINGClass AE 47,054.122 Class AEC 5,638,904.140 Class AEH 845,943.950 Class AEP 1,713,915.711 Class AS 100.000 Class ASC 18,426.049 Class ASH 639.122 Class ASP 6,291.996 Class AU 539,158.206 Class AUM 40,754.701 Class AUP 1,171,017.958 Class DEC 3,170,858.860 Class DEH 295,783.443 Class DEP 405,403.560 Class DU 417,697.395 Class DUP 2,113,149.368 Class ZE 100.000 Class ZEC 100.000 Class ZEH 18,698.691 Class ZFH 100.000 Class ZU 1,536.781 Class ZUP 100.000
Threadneedle (Lux) - Global Multi Asset Income
34
The accompanying notes form an integral part of these financial statements.
Threadneedle (Lux) Annual Report and Audited Financial Statements March 2021
STATEMENT OF OPERATIONS AND CHANGES IN NET ASSETSfor the year ended March 31, 2021
Notes2021 USD
Net assets at the beginning of the year 191,964,823 Income
Dividends, net 2 2,780,810 Interest on bonds, net 2 3,084,216 Bank interest 2 72,574 Interest income on swaps 52,633 Interest income on futures contracts 3,780 Asset management fee rebates 2 11,826 Other income 61,866
Net income from investments 2,388,485 Net realised (loss) on sales of investments (3,556,400)Net realised gain on swaps 77,820 Net realised (loss) on options (3,499,410)Net realised gain on forward currency exchange contracts 1,523,567 Net realised gain on futures contracts 643,868 Net realised gain on foreign exchange 658,261
Net realised (loss) (4,152,294)Change in net unrealised gain on investments 57,175,325 Change in net unrealised (loss) on swaps (121,117)Change in net unrealised gain on options 693,884 Change in net unrealised gain on forward currency exchange contracts 302,168 Change in net unrealised (loss) on futures contracts (185,289)
Net change in unrealised gain 57,864,971
Net increase in net assets as a result of operations 56,101,162 Movements in capital
Subscriptions of shares 14,499,458 Redemptions of shares (79,925,769)Dividends 7 (7,431,917)
Total movements in capital (72,858,228)
Net assets at the end of the year 175,207,757
TOTAL NET ASSET VALUE March 31, 2021 March 31, 2020 March 31, 2019USD 175,207,757 191,964,823 281,201,768
The accompanying notes form an integral part of these financial statements.
Threadneedle (Lux) - Global Multi Asset Income
35
Threadneedle (Lux) Annual Report and Audited Financial Statements March 2021
STATEMENT OF NET ASSET VALUE PER SHARE March 31, 2021 March 31, 2020 March 31, 2019Class AE 11.16641 9.28551 10.481
Class AEC 8.17611 6.76621 8.481
Class AEH 18.02581 14.18691 16.861
Class AEP 9.29891 8.13311 9.681
Class AQ# – 81.03352 –Class AQM# – 80.01662 –Class AS 11.09463 9.14443 10.083
Class ASC 9.54063 7.82803 9.623
Class ASH 11.05863 8.62943 10.073
Class ASP 9.46603 8.19193 9.493
Class AU 20.4434 15.8709 18.33Class AUM 10.1632 8.2835 –Class AUP 9.6048 7.8434 9.55Class DEC 7.78341 6.49211 8.191
Class DEH 10.34011 8.19901 9.821
Class DEP 8.77971 7.73801 9.281
Class DU 12.6591 9.9014 11.52Class DUP 8.7793 7.2225 8.86Class ZE 11.39491 9.42861 10.581
Class ZEC 9.01801 7.43231 9.261
Class ZEH 10.84641 8.49171 10.051
Class ZFH 10.72514 8.41614 9.994
Class ZU 11.9183 9.2068 10.58Class ZUP 9.6307 7.8321 9.501Class is denominated in EUR. The base currency of the Portfolio is USD.2Class is denominated in HKD. The base currency of the Portfolio is USD.3Class is denominated in SGD. The base currency of the Portfolio is USD.4Class is denominated in CHF. The base currency of the Portfolio is USD.#See note 1.
STATEMENT OF NET ASSETSas at March 31, 2021
Notes2021 USD
Assets Investment portfolio at market value 2 9,221,991 Cash at bank 2 191,555 Receivable for investments sold 20,617 Interest and dividends receivable, net 14,058
Total assets 9,448,221
Liabilities Bank overdrafts (3,773)Payable for investments purchased (22,798)Net unrealised (loss) on forward currency exchange contracts 2, 9 (1,945)Asset management fees payable 5 (4,884)Other liabilities 20 (1,932)
Total liabilities (35,332)
Total net assets 9,412,889
NUMBER OF SHARES OUTSTANDINGClass AE 100.000 Class AEC 100.000 Class AEH 8,445.973 Class AU 100.000 Class AUP 100.000 Class IE 100.000 Class IEH 100.000 Class IG 100.000 Class IU 100.000 Class LE 171,000.000 Class LG 100.000 Class XU 100.000 Class ZE 100.000 Class ZEC 100.000 Class ZEH 100.000 Class ZU 498,187.100 Class ZUP 100.000
STATEMENT OF NET ASSET VALUE PER SHARE March 31, 2021 Class AE# 13.12381 Class AEC# 13.07441 Class AEH# 13.12081 Class AU# 13.2113 Class AUP# 13.1684 Class IE# 13.18511 Class IEH# 13.17941 Class IG# 12.28082 Class IU# 13.2780 Class LE# 13.20921 Class LG# 12.29892 Class XU# 13.3214 Class ZE# 13.17391 Class ZEC# 13.12411 Class ZEH# 13.16751 Class ZU# 13.2623 Class ZUP# 13.2192 1Class is denominated in EUR. The base currency of the Portfolio is USD.2Class is denominated in GBP. The base currency of the Portfolio is USD.#See note 1.
Net (loss) from investments (15,289)Net realised gain on sales of investments 275,690 Net realised (loss) on forward currency exchange contracts (1,165)Net realised (loss) on foreign exchange (8,327)
Net realised gain 266,198 Change in net unrealised gain on investments 1,264,319 Change in net unrealised (loss) on forward currency exchange contracts (1,945)
Net change in unrealised gain 1,262,374
Net increase in net assets as a result of operations 1,513,283
Movements in capital Subscriptions of shares 7,899,625 Dividends 7 (19)
Total movements in capital 7,899,606
Net assets at the end of the period 9,412,889
TOTAL NET ASSET VALUE March 31, 2021 USD 9,412,889
STATEMENT OF NET ASSETSas at March 31, 2021
Notes2021 USD
Assets Investment portfolio at market value 2 1,672,452,935 Cash at bank 2 4,340,488 Receivable for investments sold 2,846,873 Subscriptions receivable 2,399,428 Interest and dividends receivable, net 1,588,337 Other assets 20 284,970
NUMBER OF SHARES OUTSTANDINGClass AEH 1,393,468.194 Class AEP 1,532,873.120 Class AU 6,537,751.082 Class AUP 23,249.810 Class DEH 307,500.244 Class DU 1,142,455.858 Class IE 5,608,132.305 Class IEH 2,229,708.516 Class IU 13,085,918.709 Class IUP 26,175.405 Class W 18,014.468 Class XU 8,822,951.593 Class ZE 2,325,680.754 Class ZEH 2,900.000 Class ZEP 2,255,976.096 Class ZFH 160,440.000 Class ZG 645,514.397 Class ZU 3,808,863.460
The accompanying notes form an integral part of these financial statements.
Threadneedle (Lux) - Global Focus
37
Threadneedle (Lux) Annual Report and Audited Financial Statements March 2021
STATEMENT OF OPERATIONS AND CHANGES IN NET ASSETSfor the year ended March 31, 2021
Notes2021 USD
Net assets at the beginning of the year 781,859,426 Income
Dividends, net 2 8,864,071 Bank interest 2 208,188
Net (loss) from investments (9,043,835)Net realised gain on sales of investments 131,053,946 Net realised gain on forward currency exchange contracts 7,245,513 Net realised gain on foreign exchange 315,897
Net realised gain 138,615,356 Change in net unrealised gain on investments 346,844,710 Change in net unrealised (loss) on forward currency exchange contracts (932,872)
Net change in unrealised gain 345,911,838
Net increase in net assets as a result of operations 475,483,359 Movements in capital
Subscriptions of shares 1,135,143,309 Redemptions of shares (715,828,054)Dividends 7 (347,274)
Total movements in capital 418,967,981
Net assets at the end of the year 1,676,310,766
TOTAL NET ASSET VALUE March 31, 2021 March 31, 2020 March 31, 2019USD 1,676,310,766 781,859,426 640,308,193
Threadneedle (Lux) - Global Focus
38
The accompanying notes form an integral part of these financial statements.
Threadneedle (Lux) Annual Report and Audited Financial Statements March 2021
STATEMENT OF NET ASSET VALUE PER SHARE March 31, 2021 March 31, 2020 March 31, 2019Class AEH 57.41731 39.44731 39.721
Class AEP 19.10121 13.95491 13.511
Class AU 96.5311 65.4043 64.03Class AUP 15.4283 10.5256 10.43Class DEH 41.45151 28.69051 29.111
Class DU 50.1776 34.2524 33.79Class IE 18.31981 13.18341 12.501
Class IEH 15.46301 10.53301 10.511
Class IU 19.7127 13.2437 12.86Class IUP 15.7922 10.6770 10.49Class W 147.4604 99.8614 97.72Class XU 22.8996 15.2627 14.70Class ZE 20.65741 14.88041 14.131
Class ZEH# 11.13101 – –Class ZEP 19.65801 14.24201 13.681
Class ZFH# 11.11092 – –Class ZG 20.55463 15.38103 14.223
Class ZU 23.8745 16.0557 15.601Class is denominated in EUR. The base currency of the Portfolio is USD.2Class is denominated in CHF. The base currency of the Portfolio is USD.3Class is denominated in GBP. The base currency of the Portfolio is USD.#See note 1.
STATEMENT OF NET ASSETSas at March 31, 2021
Notes2021 USD
Assets Investment portfolio at market value 2 169,134,177 Cash at bank 2 1,124,225 Receivable for investments sold 546,131 Subscriptions receivable 25,196 Interest and dividends receivable, net 297,845 Other assets 20 12,356
NUMBER OF SHARES OUTSTANDINGClass AEH 22,932.950 Class AU 29,316.235 Class DEH 50,811.846 Class DU 68,109.184 Class IE 100.000 Class IEH 29,400.734 Class IU 6,114,997.956 Class ZU 18,341.033 Class 1E 3,033,738.021 Class 1U 3,118,874.816 Class 2E 2,016,150.894 Class 2U 100.000 Class 8E 1,156,290.447 Class 8U 1,648,219.658
STATEMENT OF NET ASSET VALUE PER SHARE March 31, 2021 March 31, 2020 March 31, 2019Class AEH 42.38021 23.61141 28.731
Class AU 68.3931 37.5590 44.39Class DEH 30.19691 16.95581 20.771
Class DU 47.8562 26.4784 31.53Class IE# 15.52101 – –Class IEH 25.50281 14.09701 17.001
Class IU 16.2895 8.8704 –Class ZU 15.5962 8.5014 9.97Class 1E 1.88171 1.10591 1.281
Class 1U 2.2113 1.2133 1.43Class 2E 17.18861 10.04081 11.511
Class 2U 17.8242 9.7175 11.40Class 8E 2.05591 1.20151 1.381
Class 8U 2.4165 1.3184 1.551Class is denominated in EUR. The base currency of the Portfolio is USD.#See note 1.
The accompanying notes form an integral part of these financial statements.
Threadneedle (Lux) - Global Emerging Market Equities
39
Threadneedle (Lux) Annual Report and Audited Financial Statements March 2021
STATEMENT OF OPERATIONS AND CHANGES IN NET ASSETSfor the year ended March 31, 2021
Notes2021 USD
Net assets at the beginning of the year 79,154,413 Income
Net (loss) from investments (760,578)Net realised gain on sales of investments 5,446,731 Net realised gain on forward currency exchange contracts 64,457 Net realised (loss) on foreign exchange (44,648)
Net realised gain 5,466,540 Change in net unrealised gain on investments 61,325,456 Change in net unrealised (loss) on forward currency exchange contracts (32,949)
Net change in unrealised gain 61,292,507
Net increase in net assets as a result of operations 65,998,469 Movements in capital
Subscriptions of shares 48,260,080 Redemptions of shares (23,308,865)
Total movements in capital 24,951,215
Net assets at the end of the year 170,104,097
TOTAL NET ASSET VALUE March 31, 2021 March 31, 2020 March 31, 2019USD 170,104,097 79,154,413 47,448,924
STATEMENT OF NET ASSETSas at March 31, 2021
Notes2021 USD
Assets Investment portfolio at market value 2 215,287,522 Cash at bank 2 3,348,633 Receivable for investments sold 563,035 Subscriptions receivable 1,011,372 Interest and dividends receivable, net 786,468 Net unrealised gain on forward currency exchange contracts 2, 9 8,107 Other assets 20 3,816
NUMBER OF SHARES OUTSTANDINGClass AEC 4,600.000 Class AUP 100.000 Class DEC 100.000 Class DUP 100.000 Class IU 100.000 Class TE 100.000 Class ZU 100.000 Class 1E 1,911,811.744 Class 1EP 1,579,253.511 Class 1SC 491,543.354 Class 1SH 33,508.170 Class 1ST 83,098.123 Class 1U 518,409.501 Class 1UP 438,125.679 Class 1VT 7,391.490 Class 2E 1,000,021.633 Class 2EP 100.000 Class 2U 100.000 Class 2UP 100.000 Class 3E 173,763.512 Class 3EP 9,935,709.249 Class 3U 27,155.767 Class 3UP 39,325.200 Class 8E 122,214.288 Class 8EP 165.977 Class 8U 13,158.578 Class 8UP 57,898.704 Class 9E 100.000 Class 9EP 100.000 Class 9U 100.000 Class 9UP 100.000
Threadneedle (Lux) - Global Equity Income
40
The accompanying notes form an integral part of these financial statements.
Threadneedle (Lux) Annual Report and Audited Financial Statements March 2021
STATEMENT OF OPERATIONS AND CHANGES IN NET ASSETSfor the year ended March 31, 2021
Notes2021 USD
Net assets at the beginning of the year 302,458,662 Income
Net income from investments 3,706,051 Net realised (loss) on sales of investments (2,841,973)Net realised gain on forward currency exchange contracts 251,560 Net realised (loss) on foreign exchange (202,253)
Net realised (loss) (2,792,666)Change in net unrealised gain on investments 92,244,273 Change in net unrealised gain on forward currency exchange contracts 33,487
Net change in unrealised gain 92,277,760
Net increase in net assets as a result of operations 93,191,145 Movements in capital
Subscriptions of shares 15,725,758 Redemptions of shares (184,988,500)Dividends 7 (5,775,027)
Total movements in capital (175,037,769)
Net assets at the end of the year 220,612,038
TOTAL NET ASSET VALUE March 31, 2021 March 31, 2020 March 31, 2019USD 220,612,038 302,458,662 896,154,687
The accompanying notes form an integral part of these financial statements.
Threadneedle (Lux) - Global Equity Income
41
Threadneedle (Lux) Annual Report and Audited Financial Statements March 2021
STATEMENT OF NET ASSET VALUE PER SHARE March 31, 2021 March 31, 2020 March 31, 2019Class AEC 10.86461 7.79491 10.111
Class AUP 11.5197 8.1529 10.27Class DEC 10.73671 7.74681 10.091
Class DUP 11.3689 8.0829 10.24Class IU 12.8194 8.7152 10.45Class TE 12.46751 9.09281 10.661
Class ZU 12.8038 8.7095 10.45Class 1E 12.30111 9.01611 10.641
Class 2U 12.8080 8.7103 10.45Class 2UP 11.7699 8.2624 10.33Class 3E 12.52761 9.11381 10.671
Class 3EP 11.49041 8.64181 10.541
Class 3U 12.8514 8.7285 10.46Class 3UP 11.8020 8.2797 10.34Class 8E 12.46771 9.08651 10.661
Class 8EP 11.41701 8.59471 10.511
Class 8U 12.7934 8.7047 10.45Class 8UP 11.7367 8.2462 10.32Class 9E 12.55551 9.12751 10.681
Class 9EP 11.51711 8.64201 10.521
Class 9U 12.8935 8.7456 10.46Class 9UP 11.8108 8.2711 10.311Class is denominated in EUR. The base currency of the Portfolio is USD.2Class is denominated in SGD. The base currency of the Portfolio is USD.3Class is denominated in AUD. The base currency of the Portfolio is USD.
STATEMENT OF NET ASSETSas at March 31, 2021
Notes2021 USD
Assets Investment portfolio at market value 2 603,656,105 Cash at bank 2 2,353,758 Subscriptions receivable 22,723 Interest and dividends receivable, net 1,152,289 Other assets 20 59,345
NUMBER OF SHARES OUTSTANDINGClass IU 47,718.714 Class ZU 100.000 Class 1E 29,784,835.158 Class 1U 76,649,635.334 Class 2E 100.000 Class 2U 246,070.349 Class 3U 4,455,021.549 Class 8E 83,218.592 Class 8U 20,127,269.033 Class 9U 82,680.683
STATEMENT OF NET ASSET VALUE PER SHARE March 31, 2021 March 31, 2020 March 31, 2019Class IU 15.4100 10.4063 10.66Class ZU 15.3846 10.3985 10.66Class 1E 3.63051 2.64511 2.671
Class 1U 4.2662 2.9019 2.99Class 2E 14.92121 10.80241 10.821
Class 2U 15.3787 10.3974 10.66Class 3U 4.5175 3.0491 3.12Class 8E 5.30101 3.84041 3.851
Class 8U 6.2292 4.2132 4.32Class 9U 15.4477 10.4222 10.661Class is denominated in EUR. The base currency of the Portfolio is USD.
Threadneedle (Lux) - Global Select
42
The accompanying notes form an integral part of these financial statements.
Threadneedle (Lux) Annual Report and Audited Financial Statements March 2021
STATEMENT OF OPERATIONS AND CHANGES IN NET ASSETSfor the year ended March 31, 2021
Notes2021 USD
Net assets at the beginning of the year 365,150,642 Income
Dividends, net 2 5,130,267 Bank interest 2 2,329 Other income 127
Net (loss) from investments (2,628,925)Net realised gain on sales of investments 20,636,142 Net realised (loss) on forward currency exchange contracts (931)Net realised (loss) on foreign exchange (76,340)Net realised gain on tax reclaim 1,084
Net realised gain 20,559,955 Change in net unrealised gain on investments 162,941,801 Change in net unrealised (loss) on forward currency exchange contracts (230)
Net change in unrealised gain 162,941,571
Net increase in net assets as a result of operations 180,872,601 Movements in capital
Subscriptions of shares 141,941,999 Redemptions of shares (82,049,746)
Total movements in capital 59,892,253
Net assets at the end of the year 605,915,496
TOTAL NET ASSET VALUE March 31, 2021 March 31, 2020 March 31, 2019USD 605,915,496 365,150,642 441,869,956
STATEMENT OF NET ASSETSas at March 31, 2021
Notes2021 EUR
Assets Investment portfolio at market value 2 2,107,373,594 Cash at bank 2 1,782,202 Subscriptions receivable 9,315,377 Interest and dividends receivable, net 1,705,796 Net unrealised gain on forward currency exchange contracts 2, 9 32,761 Other assets 20 53,041
NUMBER OF SHARES OUTSTANDINGClass AE 10,700,472.077 Class AEP 8,632,242.112 Class AK 1,040,491.605 Class AUP 38,529.514 Class DE 1,288,451.821 Class IE 10,431,053.757 Class IEP 3,402,286.450 Class NE 12,391,646.000 Class XE 3,301,773.822 Class XFH 100.000 Class XG 100.000 Class XGH 100.000 Class XU 5,717,533.656 Class ZE 7,682,756.911 Class ZFH 1,058,760.135 Class ZG 869,837.058 Class ZGH 56,242.773 Class ZU 12,938,325.354
The accompanying notes form an integral part of these financial statements.
Threadneedle (Lux) - Global Smaller Companies
43
Threadneedle (Lux) Annual Report and Audited Financial Statements March 2021
STATEMENT OF OPERATIONS AND CHANGES IN NET ASSETSfor the year ended March 31, 2021
Notes2021 EUR
Net assets at the beginning of the year 467,243,010 Income
Net (loss) from investments (7,990,440)Net realised gain on sales of investments 165,408,902 Net realised (loss) on forward currency exchange contracts (615,129)Net realised (loss) on foreign exchange (1,428,649)
Net realised gain 163,365,124 Change in net unrealised gain on investments 330,551,299 Change in net unrealised gain on forward currency exchange contracts 65,114
Net change in unrealised gain 330,616,413
Net increase in net assets as a result of operations 485,991,097 Movements in capital
Subscriptions of shares 1,715,296,924 Redemptions of shares (559,074,801)Dividends 7 (868,106)
Total movements in capital 1,155,354,017
Net assets at the end of the year 2,108,588,124
TOTAL NET ASSET VALUE March 31, 2021 March 31, 2020 March 31, 2019EUR 2,108,588,124 467,243,010 196,527,339
Threadneedle (Lux) - Global Smaller Companies
44
The accompanying notes form an integral part of these financial statements.
Threadneedle (Lux) Annual Report and Audited Financial Statements March 2021
STATEMENT OF NET ASSET VALUE PER SHARE March 31, 2021 March 31, 2020 March 31, 2019Class AE 47.2890 28.8263 29.93Class AEP 15.5848 9.5558 10.06Class AK 126.83111 82.04491 –Class AUP 15.55162 8.90262 9.592
Class DE 36.0617 22.0920 23.05Class IE 68.4913 41.3989 42.61Class IEP# 13.1106 – –Class NE 15.0223 9.0621 –Class XE 17.3169 10.3840 10.60Class XFH# 11.43383 – –Class XG 16.77904 10.45654 10.414
Class XGH 23.43504 14.04244 14.344
Class XU# 11.37972 – –Class ZE 16.8641 10.2035 10.51Class ZFH 16.64523 10.10023 10.453
Class ZG 16.37194 10.29014 10.324
Class ZGH 48.92764 29.59314 30.484
Class ZU 16.80582 9.49302 10.012
1Class is denominated in SEK. The base currency of the Portfolio is EUR.2Class is denominated in USD. The base currency of the Portfolio is EUR.3Class is denominated in CHF. The base currency of the Portfolio is EUR.4Class is denominated in GBP. The base currency of the Portfolio is EUR.#See note 1.
STATEMENT OF NET ASSETSas at March 31, 2021
Notes2021 USD
Assets Investment portfolio at market value 2 1,108,098,878 Cash at bank 2 5,355,505 Receivable for investments sold 8,994,801 Subscriptions receivable 987,209 Interest and dividends receivable, net 568,408 Other assets 20 197
NUMBER OF SHARES OUTSTANDINGClass AEH 1,273,998.793 Class AU 288,667.523 Class DEH 51,194.124 Class DU 548,532.694 Class IEH 382,429.555 Class IU 6,440,746.461 Class W 1,591.035 Class ZE 100.000 Class ZEH 1,257,948.204 Class ZU 100.000 Class 1E 2,958,336.247 Class 1EH 190,551.529 Class 1EP 303,179.571 Class 1U 13,181,620.429 Class 2E 866,709.558 Class 2U 5,544,735.752 Class 3EH 26,276.748 Class 3U 508,963.886 Class 8E 1,806,129.915 Class 8U 3,219,279.408 Class 9EH 100.000 Class 9U 229,865.350
The accompanying notes form an integral part of these financial statements.
Threadneedle (Lux) - American
45
Threadneedle (Lux) Annual Report and Audited Financial Statements March 2021
STATEMENT OF OPERATIONS AND CHANGES IN NET ASSETSfor the year ended March 31, 2021
Notes2021 USD
Net assets at the beginning of the year 845,435,297 Income
Dividends, net 2 10,429,023 Bank interest 2 65,639
Net (loss) from investments (2,038,603)Net realised gain on sales of investments 156,481,010 Net realised gain on forward currency exchange contracts 6,695,254 Net realised (loss) on foreign exchange (12,927)
Net realised gain 163,163,337 Change in net unrealised gain on investments 308,370,356 Change in net unrealised (loss) on forward currency exchange contracts (506,521)
Net change in unrealised gain 307,863,835
Net increase in net assets as a result of operations 468,988,569 Movements in capital
Subscriptions of shares 128,434,097 Redemptions of shares (322,542,073)Dividends 7 (64,259)
Total movements in capital (194,172,235)
Net assets at the end of the year 1,120,251,631
TOTAL NET ASSET VALUE March 31, 2021 March 31, 2020 March 31, 2019USD 1,120,251,631 845,435,297 907,780,896
Threadneedle (Lux) - American
46
The accompanying notes form an integral part of these financial statements.
Threadneedle (Lux) Annual Report and Audited Financial Statements March 2021
STATEMENT OF NET ASSET VALUE PER SHARE March 31, 2021 March 31, 2020 March 31, 2019Class AEH 62.48051 39.85001 43.591
Class AU 107.7058 67.7834 72.16Class DEH 46.23551 29.59271 32.491
Class DU 41.8962 26.4589 28.27Class IEH 67.37101 42.58051 46.171
Class IU 73.4915 45.8385 48.36Class W 143.3024 89.9169 95.43Class ZE 15.16721 10.14431 10.471
Class ZEH 14.33671 9.07061 9.841
Class ZU 15.4031 9.6205 10.16Class 1E 14.62011 9.84271 10.231
Class 1EH 14.02421 8.93241 9.761
Class 1EP 14.04551 9.57971 10.161
Class 1U 14.8399 9.3272 9.92Class 2E 14.84511 9.93371 10.261
Class 2U 15.0659 9.4120 9.95Class 3EH 14.29601 9.03651 9.801
Class 3U 15.1327 9.4368 9.95Class 8E 14.82901 9.92691 10.251
Class 8U 15.0466 9.4037 9.94Class 9EH 14.32001 9.04181 9.801
Class 9U 15.1413 9.4383 9.951Class is denominated in EUR. The base currency of the Portfolio is USD.
STATEMENT OF NET ASSETSas at March 31, 2021
Notes2021 USD
Assets Investment portfolio at market value 2 431,978,025 Cash at bank 2 984,806 Term deposits 2, 19 6,000,020 Subscriptions receivable 496,245 Interest and dividends receivable, net 22,069 Other assets 20 179
NUMBER OF SHARES OUTSTANDINGClass AD 1,000.000 Class AEH 21,851.017 Class AN 1,000.000 Class AU 134,410.887 Class DEH 13,916.960 Class DU 105,696.792 Class ID 1,000.000 Class IE 100.000 Class IEH 17,483.753 Class IN 1,000.000 Class W 9,809.367 Class ZEH 1,172.825 Class ZU 35,690.000 Class 1E 12,709,631.029 Class 1EH 75,484.803 Class 1EP 451,242.585 Class 1U 42,249,539.346 Class 2EH 761.000 Class 2U 100.000 Class 3E 6,464,405.244 Class 3U 4,129,810.755 Class 8EH 193,663.558 Class 8U 2,728,728.418 Class 9E 100.000 Class 9U 677.031
The accompanying notes form an integral part of these financial statements.
Threadneedle (Lux) - American Select
47
Threadneedle (Lux) Annual Report and Audited Financial Statements March 2021
STATEMENT OF OPERATIONS AND CHANGES IN NET ASSETSfor the year ended March 31, 2021
Notes2021 USD
Net assets at the beginning of the year 315,353,771 Income
Net (loss) from investments (4,272,097)Net realised gain on sales of investments 40,022,637 Net realised gain on forward currency exchange contracts 236,542 Net realised (loss) on foreign exchange (12,368)
Net realised gain 40,246,811 Change in net unrealised gain on investments 138,733,296 Change in net unrealised (loss) on forward currency exchange contracts (688)
Net change in unrealised gain 138,732,608
Net increase in net assets as a result of operations 174,707,322 Movements in capital
Subscriptions of shares 31,960,831 Redemptions of shares (83,467,925)Dividends 7 (18,680)
Total movements in capital (51,525,774)
Net assets at the end of the year 438,535,319
TOTAL NET ASSET VALUE March 31, 2021 March 31, 2020 March 31, 2019USD 438,535,319 315,353,771 363,379,073
Threadneedle (Lux) - American Select
48
The accompanying notes form an integral part of these financial statements.
Threadneedle (Lux) Annual Report and Audited Financial Statements March 2021
STATEMENT OF NET ASSET VALUE PER SHARE March 31, 2021 March 31, 2020 March 31, 2019Class AD 14.06431 9.59861 –Class AEH 40.43152 26.02342 28.152
Class AN 14.66053 11.44893 –Class AU 36.9044 23.4327 24.67Class DEH 27.65352 17.93182 19.542
Class DU 32.5387 20.8155 22.08Class ID 14.25881 9.65231 –Class IE 14.31862 9.66442 –Class IEH 42.89922 27.38952 29.402
Class IN 14.84933 11.50943 –Class W 39.0305 24.7704 26.07Class ZEH 14.46642 9.24292 9.922
Class ZU 15.5296 9.7922 10.24Class 1E 5.39112 3.66192 3.762
Class 1EH 4.28402 2.75342 2.982
Class 1EP 5.25482 3.59382 3.742
Class 1U 6.3360 4.0179 4.23Class 2EH 14.94502 9.54342 10.242
Class 2U 15.7585 9.9304 10.38Class 3E 4.38902 2.95752 3.012
Class 3U 5.1582 3.2451 3.38Class 8EH 3.75592 2.40042 2.582
Class 8U 7.2838 4.5928 4.80Class 9E 15.31502 10.31172 10.512
Class 9U 15.8570 9.9683 10.391Class is denominated in DKK. The base currency of the Portfolio is USD.2Class is denominated in EUR. The base currency of the Portfolio is USD.3Class is denominated in NOK. The base currency of the Portfolio is USD.
STATEMENT OF NET ASSETSas at March 31, 2021
Notes2021 USD
Assets Investment portfolio at market value 2 309,472,066 Cash at bank 2 1,114,550 Subscriptions receivable 7,603,713 Interest and dividends receivable, net 71,532
NUMBER OF SHARES OUTSTANDINGClass AEH 57,539.016 Class AU 24,386.645 Class DEH 15,827.783 Class DU 156,847.009 Class IE 179,600.000 Class IU 176,263.138 Class ZU 100.000 Class 1E 492,337.845 Class 1EP 884,157.428 Class 1U 7,370,909.296 Class 2U 1,732,027.907 Class 3EH 115,051.863 Class 3U 1,737,556.253 Class 8U 1,385,966.800 Class 9EH 1,253.258 Class 9U 3,265,863.358
STATEMENT OF NET ASSET VALUE PER SHARE March 31, 2021 March 31, 2020 March 31, 2019Class AEH 16.63681 8.22521 10.531
Class AU 17.6124 8.5873 10.69Class DEH 16.43571 8.16601 10.511
Class DU 17.4069 8.5270 10.66Class IE 15.90091 8.23601 –Class IU 17.9845 8.6950 10.72Class ZU 17.9572 8.6865 10.72Class 1E 17.25701 8.99941 10.921
Net (loss) from investments (789,064)Net realised gain on sales of investments 35,460,664 Net realised (loss) on forward currency exchange contracts (12,579)Net realised (loss) on foreign exchange (2,443)
Net realised gain 35,445,642 Change in net unrealised gain on investments 123,763,160 Change in net unrealised (loss) on forward currency exchange contracts (15,043)
Net change in unrealised gain 123,748,117
Net increase in net assets as a result of operations 158,404,695 Movements in capital
Subscriptions of shares 87,347,690 Redemptions of shares (100,945,299)Dividends 7 (151,100)
Total movements in capital (13,748,709)
Net assets at the end of the year 317,052,344
TOTAL NET ASSET VALUE March 31, 2021 March 31, 2020 March 31, 2019USD 317,052,344 172,396,358 256,158,593
STATEMENT OF NET ASSETSas at March 31, 2021
Notes2021 USD
Assets Investment portfolio at market value 2 186,273,225 Cash at bank 2 1,540,866 Receivable for investments sold 471,487 Subscriptions receivable 1,861 Interest and dividends receivable, net 570,028 Other assets 20 17,723
NUMBER OF SHARES OUTSTANDINGClass AE 1,788.856 Class AF 100.000 Class AS 4,572.842 Class ASH 56,431.557 Class AU 13,074.371 Class DE 25,408.750 Class IF 100.000 Class ISH 630.000 Class IU 2,679.137 Class XU 6,797,079.797 Class XUP 4,693,125.078 Class ZE 156,180.000 Class ZEH 33,048.653 Class ZF 3,000.000 Class ZG 100.000 Class ZU 38,102.939
STATEMENT OF NET ASSET VALUE PER SHARE March 31, 2021 March 31, 2020 March 31, 2019Class AE 18.30661 11.68081 13.821
Class AF 18.66382 11.43212 14.252
Class AS 14.28653 9.02353 10.413
Class ASH 17.92793 10.77673 13.213
Class AU 18.7762 11.1870 13.55Class DE 17.45471 11.22281 13.381
Class IE – – 14.191
Class IF 19.46672 11.82482 14.622
Class ISH 18.94883 11.29433 13.723
Class IU 19.7990 11.6971 14.04Class XU 14.9820 8.7810 –Class XUP 16.9577 10.1785 12.51Class ZE 19.07131 12.08061 14.191
Class ZEH 17.50881 10.50751 13.001
Class ZF 19.45702 11.82692 14.632
Class ZG 12.15214 7.99624 9.144
Class ZU 19.7473 11.6781 14.031Class is denominated in EUR. The base currency of the Portfolio is USD.2Class is denominated in CHF. The base currency of the Portfolio is USD.3Class is denominated in SGD. The base currency of the Portfolio is USD.4Class is denominated in GBP. The base currency of the Portfolio is USD.
Threadneedle (Lux) - Asia Contrarian Equity
50
The accompanying notes form an integral part of these financial statements.
Threadneedle (Lux) Annual Report and Audited Financial Statements March 2021
STATEMENT OF OPERATIONS AND CHANGES IN NET ASSETSfor the year ended March 31, 2021
Notes2021 USD
Net assets at the beginning of the year 124,384,661 Income
Net income from investments 3,015,072 Net realised gain on sales of investments 20,439,735 Net realised (loss) on forward currency exchange contracts (2,594)Net realised (loss) on foreign exchange (105,903)
Net realised gain 20,331,238 Change in net unrealised gain on investments 62,796,952 Change in net unrealised (loss) on forward currency exchange contracts (7,011)
Net change in unrealised gain 62,789,941
Net increase in net assets as a result of operations 86,136,251 Movements in capital
Subscriptions of shares 36,395,475 Redemptions of shares (57,204,108)Dividends 7 (1,623,821)
Total movements in capital (22,432,454)
Net assets at the end of the year 188,088,458
TOTAL NET ASSET VALUE March 31, 2021 March 31, 2020 March 31, 2019USD 188,088,458 124,384,661 185,676,126
STATEMENT OF NET ASSETSas at March 31, 2021
Notes2021 USD
Assets Investment portfolio at market value 2 341,072,798 Cash at bank 2 2,453,795 Subscriptions receivable 461,002 Interest and dividends receivable, net 849,151 Other assets 20 33,169
NUMBER OF SHARES OUTSTANDINGClass IE 422,602.468 Class IU 356,363.139 Class ZU 31,454.134 Class 1E 1,395,119.956 Class 1U 23,824,427.131 Class 2E 9,204,616.512 Class 2U 1,743,303.265 Class 3U 4,246,180.765 Class 8E 474.483 Class 8U 1,526,642.109 Class 9U 163,615.364
STATEMENT OF NET ASSET VALUE PER SHARE March 31, 2021 March 31, 2020 March 31, 2019Class IE 14.50961 9.02521 –Class IU 16.0271 9.3071 10.72Class ZU 16.0024 9.3012 10.72Class 1E 3.65811 2.29251 2.601
Class 1U 4.2991 2.5152 2.92Class 2E 15.50851 9.66011 10.881
Class 2U 15.9916 9.2995 10.72Class 3U 3.8480 2.2346 2.57Class 8E 4.15931 2.59301 2.921
Class 8U 4.8912 2.8455 3.28Class 9U 16.0542 9.3192 10.721Class is denominated in EUR. The base currency of the Portfolio is USD.
The accompanying notes form an integral part of these financial statements.
Threadneedle (Lux) - Asia Equities
51
Threadneedle (Lux) Annual Report and Audited Financial Statements March 2021
STATEMENT OF OPERATIONS AND CHANGES IN NET ASSETSfor the year ended March 31, 2021
Notes2021 USD
Net assets at the beginning of the year 195,909,991 Income
Net income from investments 695,311 Net realised gain on sales of investments 18,136,792 Net realised gain on forward currency exchange contracts 34,597 Net realised (loss) on foreign exchange (159,330)
Net realised gain 18,012,059 Change in net unrealised gain on investments 120,906,225
Net change in unrealised gain 120,906,225
Net increase in net assets as a result of operations 139,613,595 Movements in capital
Subscriptions of shares 28,725,499 Redemptions of shares (20,318,559)
Total movements in capital 8,406,940
Net assets at the end of the year 343,930,526
TOTAL NET ASSET VALUE March 31, 2021 March 31, 2020 March 31, 2019USD 343,930,526 195,909,991 235,034,331
STATEMENT OF NET ASSETSas at March 31, 2021
Notes2021 USD
Assets Investment portfolio at market value 2 478,852,214 Cash at bank 2 5,194,893 Receivable for investments sold 121,155 Subscriptions receivable 229,114 Interest and dividends receivable, net 286,362 Net unrealised gain on forward currency exchange contracts 2, 9 34,561 Other assets 20 2,004
NUMBER OF SHARES OUTSTANDINGClass AEC 311.758 Class AEH 35,023.839 Class AU 98,959.496 Class AUP 13,619.008 Class DU 10,147.387 Class IU 3,724,871.469 Class XS 100.000 Class XSH 7,219,456.080 Class ZEH 467,289.028 Class ZFH 200.000 Class ZGH 200.000 Class ZU 4,286,506.749
STATEMENT OF NET ASSET VALUE PER SHARE March 31, 2021 March 31, 2020 March 31, 2019Class AEC 17.51611 11.35911 12.751
Class AEH 28.61861 18.32801 20.191
Class AU 52.1802 32.9720 35.32Class AUP 19.1464 12.2618 13.41Class DU 26.0427 16.5381 17.81Class IU 74.9789 47.0024 49.95Class XS 18.01542 11.85702 11.872
Class XSH 18.38482 11.49882 12.242
Class ZEH 18.55961 11.80151 12.891
Class ZFH 18.17753 11.57193 12.683
Class ZGH 19.22814 12.21354 13.324
Class ZU 20.7962 13.0432 13.871Class is denominated in EUR. The base currency of the Portfolio is USD.2Class is denominated in SGD. The base currency of the Portfolio is USD.3Class is denominated in CHF. The base currency of the Portfolio is USD.4Class is denominated in GBP. The base currency of the Portfolio is USD.
Threadneedle (Lux) - US Contrarian Core Equities
52
The accompanying notes form an integral part of these financial statements.
Threadneedle (Lux) Annual Report and Audited Financial Statements March 2021
STATEMENT OF OPERATIONS AND CHANGES IN NET ASSETSfor the year ended March 31, 2021
Notes2021 USD
Net assets at the beginning of the year 462,376,758 Income
Dividends, net 2 4,883,380 Bank interest 2 260,904
Net income from investments 1,069,317 Net realised gain on sales of investments 79,246,225 Net realised gain on forward currency exchange contracts 5,697,597 Net realised (loss) on foreign exchange (385,248)
Net realised gain 84,558,574 Change in net unrealised gain on investments 127,522,132 Change in net unrealised gain on forward currency exchange contracts 570,843
Net change in unrealised gain 128,092,975
Net increase in net assets as a result of operations 213,720,866 Movements in capital
Subscriptions of shares 123,297,569 Redemptions of shares (315,099,637)Dividends 7 (3,330)
Total movements in capital (191,805,398)
Net assets at the end of the year 484,292,226
TOTAL NET ASSET VALUE March 31, 2021 March 31, 2020 March 31, 2019USD 484,292,226 462,376,758 607,510,212
STATEMENT OF NET ASSETSas at March 31, 2021
Notes2021 USD
Assets Investment portfolio at market value 2 26,242,866 Cash at bank 2 70,345 Subscriptions receivable 232,667 Interest and dividends receivable, net 13,825
NUMBER OF SHARES OUTSTANDINGClass AE 1,550.544 Class AEH 100.100 Class AU 754.571 Class AUP 100.640 Class DE 10,626.880 Class DEH 243.724 Class DU 598.556 Class IE 100.100 Class IEC 100.100 Class IEH 100.100 Class IFH 100.100 Class IG 100.000 Class IU 100.576 Class NE 100.000 Class NG 1,564,737.888 Class NU 1,645.000 Class XG 80,100.000 Class ZEH 100.100 Class ZFH 100.100 Class ZU 100.002
The accompanying notes form an integral part of these financial statements.
Threadneedle (Lux) - US Disciplined Core Equities
53
Threadneedle (Lux) Annual Report and Audited Financial Statements March 2021
STATEMENT OF OPERATIONS AND CHANGES IN NET ASSETSfor the year ended March 31, 2021
Notes2021 USD
Net assets at the beginning of the year 5,455,757 Income
Net income from investments 147,010 Net realised gain on sales of investments 848,911 Net realised gain on forward currency exchange contracts 1,786 Net realised gain on foreign exchange 52,245
Net realised gain 902,942 Change in net unrealised gain on investments 1,626,382 Change in net unrealised gain on forward currency exchange contracts 267
Net change in unrealised gain 1,626,649
Net increase in net assets as a result of operations 2,676,601 Movements in capital
Subscriptions of shares 37,838,763 Redemptions of shares (19,410,084)Dividends 7 (6,166)
Total movements in capital 18,422,513
Net assets at the end of the year 26,554,871
TOTAL NET ASSET VALUE March 31, 2021 March 31, 2020 March 31, 2019USD 26,554,871 5,455,757 6,080,103
Threadneedle (Lux) - US Disciplined Core Equities
54
The accompanying notes form an integral part of these financial statements.
Threadneedle (Lux) Annual Report and Audited Financial Statements March 2021
STATEMENT OF NET ASSET VALUE PER SHARE March 31, 2021 March 31, 2020 March 31, 2019Class AE 15.24041 10.94221 12.111
Class AEH 14.67091 9.96861 11.611
Class AU 16.0663 10.7691 12.19Class AUP 14.8613 10.1509 11.77Class DE 15.11861 10.87641 12.061
Class DEH 14.56331 9.91481 11.571
Class DU 15.9450 10.7091 12.15Class IE 15.41651 11.03321 12.171
Class ZU 16.2192 10.8446 12.251Class is denominated in EUR. The base currency of the Portfolio is USD.2Class is denominated in CHF. The base currency of the Portfolio is USD.3Class is denominated in GBP. The base currency of the Portfolio is USD.#See note 1.
STATEMENT OF NET ASSETSas at March 31, 2021
Notes2021 EUR
Assets Investment portfolio at market value 2 383,036,489 Cash at bank 2 3,644,748 Receivable for investments sold 1,212,912 Subscriptions receivable 1,629,962 Interest and dividends receivable, net 790,687 Net unrealised gain on forward currency exchange contracts 2, 9 57,839 Other assets 20 509,457
NUMBER OF SHARES OUTSTANDINGClass AE 139,450.983 Class ASH 245,630.866 Class AUH 9,207.391 Class DE 138,793.909 Class IE 2,283,314.226 Class W 34,793.973 Class XE 947,553.807 Class ZUH 2,840.005 Class 1E 3,095,186.575 Class 1EP 100.000 Class 1G 184,773.554 Class 1GP 100.000 Class 2E 7,804,717.903 Class 2G 507,488.018 Class 2U 100.000 Class 3E 442,340.120 Class 3G 282,666.947 Class 3GP 100.000 Class 4E 1,356,614.192 Class 4G 100.000 Class 8E 284,370.888 Class 8G 36,898.438 Class 8U 100.000 Class 9E 100.000 Class 9G 100.000 Class 9GP 100.000
*See note 1.The accompanying notes form an integral part of these financial statements.
Threadneedle (Lux) - Pan European ESG Equities*
55
Threadneedle (Lux) Annual Report and Audited Financial Statements March 2021
STATEMENT OF OPERATIONS AND CHANGES IN NET ASSETSfor the year ended March 31, 2021
Notes2021 EUR
Net assets at the beginning of the year 169,655,099 Income
Net income from investments 2,979,569 Net realised gain on sales of investments 3,341,261 Net realised (loss) on forward currency exchange contracts (49,294)Net realised gain on foreign exchange 73,004
Net realised gain 3,364,971 Change in net unrealised gain on investments 75,072,397 Change in net unrealised gain on forward currency exchange contracts 3,626
Net change in unrealised gain 75,076,023
Net increase in net assets as a result of operations 81,420,563 Movements in capital
Subscriptions of shares 177,899,657 Redemptions of shares (42,403,080)Dividends 7 (102)
Total movements in capital 135,496,475
Net assets at the end of the year 386,572,137
TOTAL NET ASSET VALUE March 31, 2021 March 31, 2020 March 31, 2019EUR 386,572,137 169,655,099 196,368,240
Threadneedle (Lux) - Pan European ESG Equities*
56
*See note 1.The accompanying notes form an integral part of these financial statements.
Threadneedle (Lux) Annual Report and Audited Financial Statements March 2021
STATEMENT OF NET ASSET VALUE PER SHARE March 31, 2021 March 31, 2020 March 31, 2019Class AE 78.4220 55.8171 59.63Class ASH 22.39601 15.85021 16.691
Class AUH 26.82622 18.89092 19.692
Class DE 28.3149 20.2086 21.67Class IE 55.2576 39.0176 41.33Class W 65.8450 46.8999 50.08Class XE 64.0957 44.9324 47.21Class ZUH 17.47262 12.22532 12.652
Class 1E 12.4836 8.8812 9.48Class 1EP 12.2262 8.8718 9.47Class 1G 11.81863 8.73453 9.083
Class 1GP 11.57993 8.72783 9.083
Class 2E 12.6844 8.9747 9.52Class 2G 12.00793 8.82583 9.123
Class 2U 12.77122 8.43232 9.142
Class 3E 12.7289 8.9937 9.53Class 3G 12.05043 8.84483 9.123
Class 3GP 11.80793 8.83853 9.123
Class 4E 13.0161 9.1182 9.57Class 4G 12.33573 8.97463 9.173
Class 8E 12.6660 8.9653 9.51Class 8G 11.99613 8.82073 9.113
Class 8U 12.74912 8.41882 9.142
Class 9E 12.7770 9.0171 9.53Class 9G 12.08963 8.86643 9.133
Class 9GP 11.86023 8.86643 9.133
1Class is denominated in SGD. The base currency of the Portfolio is EUR.2Class is denominated in USD. The base currency of the Portfolio is EUR.3Class is denominated in GBP. The base currency of the Portfolio is EUR.
STATEMENT OF NET ASSETSas at March 31, 2021
Notes2021 EUR
Assets Investment portfolio at market value 2 69,907,366 Cash at bank 2 407,830 Receivable for investments sold 569,088 Subscriptions receivable 1,314,249 Interest and dividends receivable, net 258,363 Other assets 20 244,891
NUMBER OF SHARES OUTSTANDINGClass AE 445.301 Class AEP 6,500.878 Class AUP 100.000 Class DE 617.690 Class DEP 2,209.240 Class IE 1,787,484.613 Class IEP 50,100.000 Class ZE 35,037.221 Class ZEP 11,311.416 Class 1E 3,896,790.258 Class 1EP 11,213,852.098 Class 1G 151,451.298 Class 1GP 330,562.878 Class 2E 1,013,929.004 Class 2EP 100.000 Class 2G 100.000 Class 2GP 100.000 Class 3EP 70,800.006 Class 3G 138,899.107 Class 3GP 897,096.850 Class 4GP 7,018,855.165 Class 8E 278,702.001 Class 8EP 956,944.357 Class 8G 45,307.246 Class 8GP 450,773.842 Class 9EP 7,300.000 Class 9G 100.000 Class 9GP 100.000
The accompanying notes form an integral part of these financial statements.
Threadneedle (Lux) - Pan European Equity Dividend
57
Threadneedle (Lux) Annual Report and Audited Financial Statements March 2021
STATEMENT OF OPERATIONS AND CHANGES IN NET ASSETSfor the year ended March 31, 2021
Notes2021 EUR
Net assets at the beginning of the year 40,776,458 Income
Net income from investments 1,255,765 Net realised (loss) on sales of investments (327,238)Net realised gain on foreign exchange 7,439
Net realised (loss) (319,799)Change in net unrealised gain on investments 16,813,790
Net change in unrealised gain 16,813,790
Net increase in net assets as a result of operations 17,749,756 Movements in capital
Subscriptions of shares 24,445,309 Redemptions of shares (9,534,075)Dividends 7 (965,534)
Total movements in capital 13,945,700
Net assets at the end of the year 72,471,914
TOTAL NET ASSET VALUE March 31, 2021 March 31, 2020 March 31, 2019EUR 72,471,914 40,776,458 59,715,336
Threadneedle (Lux) - Pan European Equity Dividend
58
The accompanying notes form an integral part of these financial statements.
Threadneedle (Lux) Annual Report and Audited Financial Statements March 2021
STATEMENT OF NET ASSET VALUE PER SHARE March 31, 2021 March 31, 2020 March 31, 2019Class AE 12.2123 8.4207 10.19Class AEP 11.1512 7.9601 10.09Class AUP 11.90991 7.94661 10.311
Class DE 12.1020 8.3747 10.17Class DEP 11.0429 7.9168 10.07Class IE 12.4632 8.5228 10.23Class IEP 11.3788 8.0572 10.13Class ZE 12.4458 8.5167 10.23Class ZEP 11.3507 8.0497 10.13Class 1E 1.9917 1.3718 1.66Class 1EP 1.1057 0.7893 1.00Class 1G 1.69642 1.21382 1.432
Class 1GP 0.94282 0.69892 0.862
Class 2E 12.4322 8.5107 10.22Class 2EP 11.3572 8.0536 10.13Class 2G 12.05022 8.56382 10.012
Class 2GP 10.99382 8.09702 9.912
Class 3EP 1.7928 1.2698 1.60Class 3G 1.63432 1.16062 1.362
Class 3GP 1.51822 1.12142 1.382
Class 4GP 1.33942 0.97962 1.192
Class 8E 2.1897 1.4996 1.80Class 8EP 1.1990 0.8512 1.07Class 8G 1.86672 1.32802 1.552
Class 8GP 1.02082 0.75282 0.922
Class 9EP 11.4256 8.0816 10.14Class 9G 12.08572 8.57822 10.022
Class 9GP 11.03522 8.11212 9.932
1Class is denominated in USD. The base currency of the Portfolio is EUR.2Class is denominated in GBP. The base currency of the Portfolio is EUR.
STATEMENT OF NET ASSETSas at March 31, 2021
Notes2021 EUR
Assets Investment portfolio at market value 2 967,752,948 Cash at bank 2 4,362,034 Receivable for investments sold 2,857,673 Subscriptions receivable 2,609,667 Interest and dividends receivable, net 637,702 Net unrealised gain on forward currency exchange contracts 2, 9 307,422 Other assets 20 382,091
NUMBER OF SHARES OUTSTANDINGClass AE 7,151,788.875 Class ASH 817,519.522 Class AUH 31,783.986 Class DE 1,371,558.437 Class DUH 100.000 Class IE 4,120,642.532 Class W 9,097.330 Class ZE 16,249,698.074 Class ZFH 32,935.939
STATEMENT OF NET ASSET VALUE PER SHARE March 31, 2021 March 31, 2020 March 31, 2019Class AE 53.6034 34.7061 37.96Class ASH 36.52791 23.50231 25.321
Class AUH 14.07532 9.00442 9.612
Class DE 48.3327 31.5752 34.85Class DUH 13.73462 8.86042 9.542
Class IE 67.3496 43.2819 46.99Class W 89.6657 58.0840 63.57Class ZE 13.5449 8.7046 9.45Class ZFH 13.05453 8.40833 9.163
1Class is denominated in SGD. The base currency of the Portfolio is EUR.2Class is denominated in USD. The base currency of the Portfolio is EUR.3Class is denominated in CHF. The base currency of the Portfolio is EUR.
The accompanying notes form an integral part of these financial statements.
Threadneedle (Lux) - Pan European Small Cap Opportunities
59
Threadneedle (Lux) Annual Report and Audited Financial Statements March 2021
STATEMENT OF OPERATIONS AND CHANGES IN NET ASSETSfor the year ended March 31, 2021
Notes2021 EUR
Net assets at the beginning of the year 435,284,977 Income
Net (loss) from investments (6,215,657)Net realised gain on sales of investments 65,938,772 Net realised (loss) on forward currency exchange contracts (97,509)Net realised (loss) on foreign exchange (190,999)
Net realised gain 65,650,264 Change in net unrealised gain on investments 228,104,907 Change in net unrealised gain on forward currency exchange contracts 201,783
Net change in unrealised gain 228,306,690
Net increase in net assets as a result of operations 287,741,297 Movements in capital
Subscriptions of shares 627,642,930 Redemptions of shares (382,896,412)
Total movements in capital 244,746,518
Net assets at the end of the year 967,772,792
TOTAL NET ASSET VALUE March 31, 2021 March 31, 2020 March 31, 2019EUR 967,772,792 435,284,977 561,444,617
STATEMENT OF NET ASSETSas at March 31, 2021
Notes2021 EUR
Assets Investment portfolio at market value 2 1,973,165,237 Cash at bank 2 3,151,879 Subscriptions receivable 4,005,488 Interest and dividends receivable, net 949,895 Net unrealised gain on forward currency exchange contracts 2, 9 526,159 Other assets 20 1,978,234
NUMBER OF SHARES OUTSTANDINGClass IE 507,023.129 Class ZE 1,578,567.788 Class 1E 29,039,455.433 Class 1EP 919,082.616 Class 1FH 221,028.450 Class 1G 777,439.455 Class 1UH 2,137,941.969 Class 2E 18,922,302.188 Class 2G 100.000 Class 3E 33,502,494.634 Class 3EP 1,684,841.556 Class 3FH 757,588.275 Class 3G 2,315,516.059 Class 3GP 162,743.571 Class 3UH 1,056,513.835 Class 4E 8,470,815.919 Class 4G 1,848,282.340 Class 8E 9,628,074.536 Class 8G 803,359.018 Class 9E 39,585,960.763 Class 9EP 100.000 Class 9FH 16,478.528 Class 9G 931,279.577 Class 9GP 100.000 Class 9UH 220,084.836
Threadneedle (Lux) - Pan European Smaller Companies
60
The accompanying notes form an integral part of these financial statements.
Threadneedle (Lux) Annual Report and Audited Financial Statements March 2021
STATEMENT OF OPERATIONS AND CHANGES IN NET ASSETSfor the year ended March 31, 2021
Notes2021 EUR
Net assets at the beginning of the year 922,670,066 Income
Net (loss) from investments (4,817,357)Net realised gain on sales of investments 4,682,420 Net realised (loss) on forward currency exchange contracts (1,524,911)Net realised (loss) on foreign exchange (44,690)
Net realised gain 3,112,819 Change in net unrealised gain on investments 515,382,100 Change in net unrealised gain on forward currency exchange contracts 142,779
Net change in unrealised gain 515,524,879
Net increase in net assets as a result of operations 513,820,341 Movements in capital
Subscriptions of shares 964,024,779 Redemptions of shares (419,999,590)Dividends 7 (242,661)
Total movements in capital 543,782,528
Net assets at the end of the year 1,980,272,935
TOTAL NET ASSET VALUE March 31, 2021 March 31, 2020 March 31, 2019EUR 1,980,272,935 922,670,066 1,381,828,793
The accompanying notes form an integral part of these financial statements.
Threadneedle (Lux) - Pan European Smaller Companies
61
Threadneedle (Lux) Annual Report and Audited Financial Statements March 2021
STATEMENT OF NET ASSET VALUE PER SHARE March 31, 2021 March 31, 2020 March 31, 2019Class IE 13.0732 8.6065 –Class ZE 12.7094 8.3794 9.32Class 1E 12.5109 8.2996 9.29Class 1EP 12.0777 8.0712 9.26Class 1FH 12.41821 8.25831 9.271
Class 1G 11.84162 8.16062 8.902
Class 1UH 13.19153 8.64563 9.443
Class 2E 12.7202 8.3840 9.33Class 2G 12.05142 8.24902 8.932
Class 3E 12.7747 8.4066 9.34Class 3EP 12.3346 8.1761 9.30Class 3FH 12.68231 8.36631 9.311
Class 3G 12.09012 8.26492 8.942
Class 3GP 11.67352 8.03802 8.912
Class 3UH 13.46443 8.75563 9.483
Class 4E 13.0550 8.5195 9.38Class 4G 13.82852 9.37452 10.052
Class 8E 12.7095 8.3804 9.32Class 8G 12.02972 8.24002 8.932
Class 9E 12.7895 8.4130 9.34Class 9EP 12.3547 8.1797 9.29Class 9FH 12.69781 8.37201 9.321
Class 9G 12.10682 8.27302 8.942
Class 9GP 11.70102 8.04682 8.902
Class 9UH 13.48633 8.76653 9.493
1Class is denominated in CHF. The base currency of the Portfolio is EUR.2Class is denominated in GBP. The base currency of the Portfolio is EUR.3Class is denominated in USD. The base currency of the Portfolio is EUR.
STATEMENT OF NET ASSETSas at March 31, 2021
Notes2021 EUR
Assets Investment portfolio at market value 2 1,637,184,145 Cash at bank 2 1,390,112 Subscriptions receivable 1,291,121 Net unrealised gain on forward currency exchange contracts 2, 9 455,998 Other assets 20 3,478,690
NUMBER OF SHARES OUTSTANDINGClass AE 127,262.183 Class AGH 161.395 Class AUH 14,088.390 Class DUH 100.000 Class IE 1,245,370.710 Class ZG 19,594.082 Class ZGH 288,116.914 Class 1E 76,743,655.578 Class 1EP 774,448.228 Class 1SH 1,854,022.975 Class 1U 67,244.906 Class 1UH 346,080.996 Class 2E 11,331,667.792 Class 2EP 100.000 Class 3E 4,683,416.877 Class 3U 532,452.974 Class 8E 3,898,128.853 Class 8EP 76,284.538 Class 9E 12,120,972.254 Class 9U 100.000
Threadneedle (Lux) - European Select
62
The accompanying notes form an integral part of these financial statements.
Threadneedle (Lux) Annual Report and Audited Financial Statements March 2021
STATEMENT OF OPERATIONS AND CHANGES IN NET ASSETSfor the year ended March 31, 2021
Notes2021 EUR
Net assets at the beginning of the year 1,246,832,227 Income
Net (loss) from investments (5,271,474)Net realised gain on sales of investments 60,578,634 Net realised gain on forward currency exchange contracts 445,843 Net realised (loss) on foreign exchange (37,442)
Net realised gain 60,987,035 Change in net unrealised gain on investments 389,983,260 Change in net unrealised (loss) on forward currency exchange contracts (22,138)
Net change in unrealised gain 389,961,122
Net increase in net assets as a result of operations 445,676,683 Movements in capital
Subscriptions of shares 206,020,311 Redemptions of shares (256,940,613)Dividends 7 (128,367)
Total movements in capital (51,048,669)
Net assets at the end of the year 1,641,460,241
TOTAL NET ASSET VALUE March 31, 2021 March 31, 2020 March 31, 2019EUR 1,641,460,241 1,246,832,227 1,440,832,024
The accompanying notes form an integral part of these financial statements.
Threadneedle (Lux) - European Select
63
Threadneedle (Lux) Annual Report and Audited Financial Statements March 2021
STATEMENT OF NET ASSET VALUE PER SHARE March 31, 2021 March 31, 2020 March 31, 2019Class AE 29.4285 21.7556 22.18Class AGH 31.37711 23.10921 23.481
Class AUH 33.03052 24.14742 24.022
Class DUH 13.86502 10.19242 10.202
Class IE 42.4042 31.0840 31.41Class ZG 14.26781 10.87561 10.711
Class ZGH 32.15621 23.51521 23.711
Class 1E 14.0231 10.3514 10.53Class 1EP 13.5040 10.0817 10.50Class 1SH 14.45953 10.60753 10.633
Class 1U 14.23252 9.80842 10.212
Class 1UH 14.74012 10.75922 10.682
Class 2E 14.2266 10.4401 10.56Class 2EP 13.7092 10.1699 10.52Class 3E 14.2900 10.4678 10.57Class 3U 14.50142 9.91732 10.252
Class 8E 14.2134 10.4345 10.56Class 8EP 13.7016 10.1732 10.54Class 9E 14.3031 10.4732 10.57Class 9U 14.53682 9.92862 10.252
1Class is denominated in GBP. The base currency of the Portfolio is EUR.2Class is denominated in USD. The base currency of the Portfolio is EUR.3Class is denominated in SGD. The base currency of the Portfolio is EUR.
STATEMENT OF NET ASSETSas at March 31, 2021
Notes2021 EUR
Assets Investment portfolio at market value 2 1,926,976,901 Cash at bank 2 3,404,925 Subscriptions receivable 2,217,436 Interest and dividends receivable, net 1,671,320 Net unrealised gain on forward currency exchange contracts 2, 9 190 Other assets 20 3,198,026
NUMBER OF SHARES OUTSTANDINGClass IE 221,410.760 Class ZE 1,213,480.143 Class 1E 93,270,920.793 Class 1EP 2,201,044.147 Class 1FH 28,357.925 Class 2E 9,771,122.044 Class 3E 8,469,064.940 Class 3EP 1,134,574.420 Class 3FH 647,084.286 Class 8E 7,970,894.893 Class 9E 9,066,628.994 Class 9EP 626,109.000 Class 9FH 145.000
STATEMENT OF NET ASSET VALUE PER SHARE March 31, 2021 March 31, 2020 March 31, 2019Class IE 13.0435 8.4587 –Class ZE 14.5269 9.4347 10.64Class 1E 14.3106 9.3519 10.61Class 1EP 13.8388 9.1237 10.60Class 1FH 14.21431 9.31611 10.601
Class 2E 14.5412 9.4412 10.64Class 3E 14.5559 9.4377 10.62Class 3EP 14.0994 9.2225 10.62Class 3FH 14.49441 9.42511 10.641
Class 8E 14.5297 9.4375 10.64Class 9E 14.6020 9.4637 10.65Class 9EP 14.1156 9.2293 10.63Class 9FH 14.49181 9.42261 10.641
1Class is denominated in CHF. The base currency of the Portfolio is EUR.
Threadneedle (Lux) - European Smaller Companies
64
The accompanying notes form an integral part of these financial statements.
Threadneedle (Lux) Annual Report and Audited Financial Statements March 2021
STATEMENT OF OPERATIONS AND CHANGES IN NET ASSETSfor the year ended March 31, 2021
Notes2021 EUR
Net assets at the beginning of the year 1,390,747,109 Income
Net (loss) from investments (10,291,521)Net realised gain on sales of investments 62,208,147 Net realised (loss) on forward currency exchange contracts (354,432)Net realised gain on foreign exchange 39,297
Net realised gain 61,893,012 Change in net unrealised gain on investments 662,147,634 Change in net unrealised gain on forward currency exchange contracts 25,038
Net change in unrealised gain 662,172,672
Net increase in net assets as a result of operations 713,774,163 Movements in capital
Subscriptions of shares 287,453,347 Redemptions of shares (458,510,609)Dividends 7 (476,924)
Total movements in capital (171,534,186)
Net assets at the end of the year 1,932,987,086
TOTAL NET ASSET VALUE March 31, 2021 March 31, 2020 March 31, 2019EUR 1,932,987,086 1,390,747,109 1,875,264,870
STATEMENT OF NET ASSETSas at March 31, 2021
Notes2021 USD
Assets Investment portfolio at market value 2 51,903,169 Cash at bank 2 751,026 Subscriptions receivable 27,922 Interest and dividends receivable, net 178,843 Other assets 20 262,461
NUMBER OF SHARES OUTSTANDINGClass AEH 18,849.875 Class AU 36,502.519 Class AUP 14,382.179 Class DEH 54,497.951 Class DU 28,494.351 Class DUP 3,256.152 Class IEP 334,530.000 Class IU 100.000 Class W 25,593.957 Class XU 1,341,581.014 Class XUP 860,450.262 Class ZG 100.000 Class ZGH 6,891.198 Class ZGP 100.000 Class ZUP 3,489.726
STATEMENT OF NET ASSET VALUE PER SHARE March 31, 2021 March 31, 2020 March 31, 2019Class AEH 49.61401 28.57811 35.161
Class AU 123.7850 70.3078 84.02Class AUP 15.1272 8.9182 11.18Class DEH 35.28211 20.47621 25.381
Class DU 60.2623 34.4843 41.52Class DUP 14.8423 8.7791 11.09Class IEP 14.74481 9.19861 11.171
Class IU 14.1867 7.9943 –Class W 91.6683 52.1698 62.47Class XU 15.7291 8.7885 –Class XUP 15.6032 8.9896 11.08Class ZG 14.23902 8.93042 10.082
Class ZGH 27.92882 15.97342 19.442
Class ZGP 12.99092 8.42242 9.972
Class ZUP 17.4725 10.1806 12.661Class is denominated in EUR. The base currency of the Portfolio is USD.2Class is denominated in GBP. The base currency of the Portfolio is USD.
The accompanying notes form an integral part of these financial statements.
Threadneedle (Lux) - Asian Equity Income
65
Threadneedle (Lux) Annual Report and Audited Financial Statements March 2021
STATEMENT OF OPERATIONS AND CHANGES IN NET ASSETSfor the year ended March 31, 2021
Notes2021 USD
Net assets at the beginning of the year 41,795,505 Income
Net income from investments 1,318,023 Net realised gain on sales of investments 7,677,535 Net realised gain on forward currency exchange contracts 51,159 Net realised (loss) on foreign exchange (43,404)
Net realised gain 7,685,290 Change in net unrealised gain on investments 19,091,993 Change in net unrealised (loss) on forward currency exchange contracts (37,295)
Net change in unrealised gain 19,054,698
Net increase in net assets as a result of operations 28,058,011 Movements in capital
Subscriptions of shares 20,841,556 Redemptions of shares (37,296,190)Dividends 7 (535,670)
Total movements in capital (16,990,304)
Net assets at the end of the year 52,863,212
TOTAL NET ASSET VALUE March 31, 2021 March 31, 2020 March 31, 2019USD 52,863,212 41,795,505 60,801,683
STATEMENT OF NET ASSETSas at March 31, 2021
Notes2021 USD
Assets Investment portfolio at market value 2 529,527,795 Cash at bank 2 6,479,843 Receivable for investments sold 1,232,242 Subscriptions receivable 2,870,283 Interest and dividends receivable, net 133,315
NUMBER OF SHARES OUTSTANDINGClass AEH 513,695.980 Class AS 269,273.891 Class AU 2,799,358.713 Class AUP 15,838.900 Class BU 60,218.276 Class DEH 43,744.552 Class DU 428,270.073 Class IE 557,445.847 Class IEH 2,563,615.294 Class IG 100.000 Class IU 677,277.000 Class ZEH 51,014.134 Class ZFH 112,350.000 Class ZG 100.000 Class ZU 2,151,326.328
STATEMENT OF NET ASSET VALUE PER SHARE March 31, 2021 March 31, 2020 March 31, 2019Class AEH 67.43471 34.42501 35.641
Class AS 23.01062 12.28472 11.772
Class AU 88.8329 44.7525 45.07Class AUP 19.1460 9.7092 10.10Class BU 112.5857 56.9448 57.58Class DEH 19.41091 9.94441 10.331
Class DU 130.7275 66.0879 66.79Class IE 14.72711 7.87621 –Class IEH 22.73181 11.50051 11.801
Class IG 19.84993 11.02633 10.473
Class IU 15.5922 7.7851 –Class ZEH 18.86111 9.55671 9.811
Class ZFH 22.04854 11.18324 11.504
Class ZG 19.80923 11.01683 10.473
Class ZU 40.3192 20.1512 20.131Class is denominated in EUR. The base currency of the Portfolio is USD.2Class is denominated in SGD. The base currency of the Portfolio is USD.3Class is denominated in GBP. The base currency of the Portfolio is USD.4Class is denominated in CHF. The base currency of the Portfolio is USD.
Threadneedle (Lux) - Global Technology
66
The accompanying notes form an integral part of these financial statements.
Threadneedle (Lux) Annual Report and Audited Financial Statements March 2021
STATEMENT OF OPERATIONS AND CHANGES IN NET ASSETSfor the year ended March 31, 2021
Notes2021 USD
Net assets at the beginning of the year 275,490,723 Income
Net (loss) from investments (4,549,113)Net realised gain on sales of investments 68,681,349 Net realised gain on forward currency exchange contracts 1,610,534 Net realised (loss) on foreign exchange (19,585)
Net realised gain 70,272,298 Change in net unrealised gain on investments 197,005,277 Change in net unrealised (loss) on forward currency exchange contracts (1,029,395)
Net change in unrealised gain 195,975,882
Net increase in net assets as a result of operations 261,699,067 Movements in capital
Subscriptions of shares 171,190,105 Redemptions of shares (171,101,794)Dividends 7 (1,931)
Total movements in capital 86,380
Net assets at the end of the year 537,276,170
TOTAL NET ASSET VALUE March 31, 2021 March 31, 2020 March 31, 2019USD 537,276,170 275,490,723 240,513,696
STATEMENT OF NET ASSETSas at March 31, 2021
Notes2021 GBP
Assets Investment portfolio at market value 2 294,803,259 Cash at bank 2 1,144,877 Receivable for investments sold 92,102 Subscriptions receivable 191,553 Interest and dividends receivable, net 1,278,315 Other assets 20 21
NUMBER OF SHARES OUTSTANDINGClass AE 145,931.691 Class AEH 300,277.020 Class AFH 16,400.000 Class AG 592,909.397 Class AGP 66,606.444 Class DEH 2,631.804 Class DG 3,279.298 Class IE 13,336.336 Class IEH 80,365.744 Class IG 1,300,755.529 Class IGP 1,978,811.336 Class NEH 100.000 Class NFH 100.000 Class NG 100.000 Class NGP 100.000 Class NUH 100.000 Class TEH 100.000 Class TFH 100.000 Class TG 100.000 Class TGP 100.000 Class TUH 100.000 Class ZE 91,541.108 Class ZEH 101,049.688 Class ZFH 5,000.000 Class ZG 546,971.043 Class ZGP 1,280,632.355 Class ZUH 82,480.000 Class 3EH 1,761,286.034 Class 3FH 30,000.000 Class 3UH 1,550,451.703 Class 9EH 9,225.000 Class 9EP 4,737,646.979 Class 9FH 6,100.000 Class 9G 7,856,527.519 Class 9UH 28,378.909
The accompanying notes form an integral part of these financial statements.
Threadneedle (Lux) - UK Equities
67
Threadneedle (Lux) Annual Report and Audited Financial Statements March 2021
STATEMENT OF OPERATIONS AND CHANGES IN NET ASSETSfor the year ended March 31, 2021
Notes2021 GBP
Net assets at the beginning of the year 206,285,143 Income
Net income from investments 3,562,543 Net realised (loss) on sales of investments (17,302,827)Net realised (loss) on forward currency exchange contracts (743,720)Net realised (loss) on foreign exchange (41,998)
Net realised (loss) (18,088,545)Change in net unrealised gain on investments 74,453,302 Change in net unrealised gain on forward currency exchange contracts 405,936
Net change in unrealised gain 74,859,238
Net increase in net assets as a result of operations 60,333,236 Movements in capital
Subscriptions of shares 127,084,134 Redemptions of shares (94,507,969)Dividends 7 (2,251,300)
Total movements in capital 30,324,865
Net assets at the end of the year 296,943,244
TOTAL NET ASSET VALUE March 31, 2021 March 31, 2020 March 31, 2019GBP 296,943,244 206,285,143 213,779,407
Threadneedle (Lux) - UK Equities
68
The accompanying notes form an integral part of these financial statements.
Threadneedle (Lux) Annual Report and Audited Financial Statements March 2021
STATEMENT OF NET ASSET VALUE PER SHARE March 31, 2021 March 31, 2020 March 31, 2019Class AE 9.28451 6.83971 –Class AEH 20.14891 15.51411 19.801
Class AFH 9.82312 7.56102 9.682
Class AG 27.9800 21.4122 27.27Class AGP 21.0118 16.5430 21.99Class DEH 9.57311 7.43061 9.561
Class 9G 10.0527 7.6191 –Class 9UH 11.12803 8.37083 10.323
1Class is denominated in EUR. The base currency of the Portfolio is GBP.2Class is denominated in CHF. The base currency of the Portfolio is GBP.3Class is denominated in USD. The base currency of the Portfolio is GBP.#See note 1.
STATEMENT OF NET ASSETSas at March 31, 2021
Notes2021 GBP
Assets Investment portfolio at market value 2 200,169,507 Cash at bank 2 2,610,940 Receivable for investments sold 86,300 Subscriptions receivable 744,991 Interest and dividends receivable, net 325,919 Other assets 20 568
NUMBER OF SHARES OUTSTANDINGClass AE 1,885,237.015 Class AEC 50,749.574 Class AEH 235,354.477 Class AG 693,594.850 Class ASC 175.600 Class AUC 151,398.937 Class DE 5,939.959 Class DEC 114.600 Class DEH 2,700.635 Class DG 9,421.672 Class DGP 100.000 Class IE 1,469,545.602 Class IEH 225,287.372 Class IG 403,262.703 Class IGP 1,062,881.877 Class IU 228,386.869 Class IUH 100.000 Class LG 461,709.674 Class LGP 10,001,585.610 Class ZE 786,494.356 Class ZEH 12,715.600 Class ZFH 12,317.172 Class ZG 104,247.758 Class ZGP 6,442.000 Class ZUH 74,864.772 Class 1EH 238,734.365 Class 1FH 29,076.102 Class 1UH 46,931.432 Class 3EH 195,171.680 Class 3FH 29,689.467 Class 3UH 263,948.427 Class 9EH 42,200.000 Class 9FH 100.000 Class 9G 1,340,888.079 Class 9UH 100.000
The accompanying notes form an integral part of these financial statements.
Threadneedle (Lux) - UK Equity Income
69
Threadneedle (Lux) Annual Report and Audited Financial Statements March 2021
STATEMENT OF OPERATIONS AND CHANGES IN NET ASSETSfor the year ended March 31, 2021
Notes2021 GBP
Net assets at the beginning of the year 149,344,890 Income
Net income from investments 3,140,092 Net realised gain on sales of investments 148,018 Net realised (loss) on forward currency exchange contracts (579,193)Net realised (loss) on foreign exchange (31,596)
Net realised (loss) (462,771)Change in net unrealised gain on investments 36,620,582 Change in net unrealised gain on forward currency exchange contracts 25,092
Net change in unrealised gain 36,645,674
Net increase in net assets as a result of operations 39,322,995 Movements in capital
Subscriptions of shares 82,932,091 Redemptions of shares (65,661,174)Dividends 7 (2,409,620)
Total movements in capital 14,861,297
Net assets at the end of the year 203,529,182
TOTAL NET ASSET VALUE March 31, 2021 March 31, 2020 March 31, 2019GBP 203,529,182 149,344,890 139,659,238
Threadneedle (Lux) - UK Equity Income
70
The accompanying notes form an integral part of these financial statements.
Threadneedle (Lux) Annual Report and Audited Financial Statements March 2021
STATEMENT OF NET ASSET VALUE PER SHARE March 31, 2021 March 31, 2020 March 31, 2019Class AE 11.66081 8.79821 10.701
Class AEC 9.32611 7.56301 9.401
Class AEH 10.82961 8.55011 10.181
Class AG 11.2947 8.8527 10.49Class ASC 9.65332 7.80202 9.542
Class 9G 10.5508 8.1909 –Class 9UH 11.49923 8.88003 10.213
1Class is denominated in EUR. The base currency of the Portfolio is GBP.2Class is denominated in SGD. The base currency of the Portfolio is GBP.3Class is denominated in USD. The base currency of the Portfolio is GBP.4Class is denominated in CHF. The base currency of the Portfolio is GBP.
STATEMENT OF NET ASSETSas at March 31, 2021
Notes2021 USD
Assets Investment portfolio at market value 2 6,713,752 Cash at bank 2 201,434 Receivable for investments sold 2,301 Interest and dividends receivable, net 32
Net income from investments 162,240 Net realised gain on sales of investments 294,953 Net realised (loss) on forward currency exchange contracts (235)Net realised (loss) on foreign exchange (21,166)
Net realised gain 273,552 Change in net unrealised gain on investments 1,130,515
Net change in unrealised gain 1,130,515
Net increase in net assets as a result of operations 1,566,307 Movements in capital
Subscriptions of shares 130,000 Redemptions of shares (759,384)
Total movements in capital (629,384)
Net assets at the end of the year 6,857,182
TOTAL NET ASSET VALUE March 31, 2021 March 31, 2020 March 31, 2019USD 6,857,182 5,920,259 7,921,925
STATEMENT OF NET ASSETSas at March 31, 2021
Notes2021 USD
Assets Investment portfolio at market value 2 83,076,251 Cash at bank 2 7,433,936 Term deposits 2, 19 12,000,509 Receivable for investments sold 1,489,374 Subscriptions receivable 1,601 Interest receivable on swaps 2 1,084,973 Interest and dividends receivable, net 4,570 Other assets 20 46
NUMBER OF SHARES OUTSTANDINGClass AEH 44,204.560 Class AFH 620.000 Class AGH 1,161.845 Class AU 120,169.348 Class DEH 9,294.561 Class DU 88,640.230 Class IEH 53,680.688 Class IGH 78,620.241 Class IU 49,752.955 Class XGH 6,561,562.177 Class ZE 100.000 Class ZEH 100.000 Class ZGH 2,396.072 Class ZU 100.000
STATEMENT OF NET ASSET VALUE PER SHARE March 31, 2021 March 31, 2020 March 31, 2019Class AEH 15.37141 14.99091 15.941
Class AFH 13.99492 13.68412 14.602
Class AGH 16.40183 15.90913 16.753
Class AU 17.2872 16.6795 17.25Class DEH 11.91351 11.67561 12.471
Class DU 13.2965 12.8939 13.40Class IEH 22.27201 21.53631 22.701
Class IGH 23.58143 22.67953 23.693
Class IU 24.8005 23.7275 24.33Class XGH 10.43723 9.96033 10.323
Class ZE 10.11611 10.37311 10.401
Class ZEH 9.72631 9.41191 9.921
Class ZGH 16.15253 15.55083 16.263
Class ZU 10.3329 9.8971 10.161Class is denominated in EUR. The base currency of the Portfolio is USD.2Class is denominated in CHF. The base currency of the Portfolio is USD.3Class is denominated in GBP. The base currency of the Portfolio is USD.
Threadneedle (Lux) - American Absolute Alpha
72
The accompanying notes form an integral part of these financial statements.
Threadneedle (Lux) Annual Report and Audited Financial Statements March 2021
STATEMENT OF OPERATIONS AND CHANGES IN NET ASSETSfor the year ended March 31, 2021
Notes2021 USD
Net assets at the beginning of the year 180,468,553 Income
Dividends, net 2 317,266 Bank interest 2 5,428 Interest income on swaps 95,106 Interest income on futures contracts 327
Total income 418,127
Expenses Asset management fees 5 (153,341)Bank interest 2 (918)Dividends expenses on swaps (562,508)Interest expense on swaps (182,820)Interest expense on futures contracts (15,928)Operating expenses 3, 5 (168,694)
Total expenses (1,084,209)
Net (loss) from investments (666,082)Net realised gain on sales of investments 18,563,702 Net realised (loss) on swaps (21,044,305)Net realised gain on options 991,882 Net realised gain on forward currency exchange contracts 9,971,652 Net realised (loss) on futures contracts (9,816,345)Net realised gain on foreign exchange 706,669
Net realised (loss) (626,745)Change in net unrealised gain on investments 21,002,258 Change in net unrealised gain on swaps 2,255,458 Change in net unrealised gain on options 60,731 Change in net unrealised (loss) on forward currency exchange contracts (1,558,736)Change in net unrealised (loss) on futures contracts (3,942,850)
Net change in unrealised gain 17,816,861
Net increase in net assets as a result of operations 16,524,034 Movements in capital
Subscriptions of shares 15,796,626 Redemptions of shares (108,827,383)
Total movements in capital (93,030,757)
Net assets at the end of the year 103,961,830
TOTAL NET ASSET VALUE March 31, 2021 March 31, 2020 March 31, 2019USD 103,961,830 180,468,553 197,738,046
STATEMENT OF NET ASSETSas at March 31, 2021
Notes2021 EUR
Assets Investment portfolio at market value 2 1,047,700,840 Cash at bank 2 66,389,335 Term deposits 2, 19 14,998,813 Receivable for investments sold 6,383,961 Subscriptions receivable 2,158,690 Interest receivable on swaps 2 370,963 Interest and dividends receivable, net 11,379,587 Upfront payment paid on swaps 2 2,438,899 Net unrealised gain on futures contracts 2, 11 3,781,244 Other assets 20 99
Total assets 1,155,602,431
Liabilities Payable for investments purchased (3,580,161)Redemptions payable (377,841)Interest payable on swaps 2 (919,464)Upfront payment received on swaps 2 (3,077,153)Net unrealised (loss) on forward currency exchange contracts 2, 9 (3,174,159)Net unrealised (loss) on swaps 2, 10 (38,677,979)Asset management fees payable 5 (532,595)Other liabilities 20 (81,375)
Total liabilities (50,420,727)
Total net assets 1,105,181,704
NUMBER OF SHARES OUTSTANDINGClass ZE 79,843.748 Class 1E 15,333,887.628 Class 1EP 105,229.198 Class 1GH 122,932.570 Class 1UH 298,039.146 Class 2E 61,915,278.031 Class 2EP 100.000 Class 2GC 100.000 Class 2GH 13,976.118 Class 4GH 242,133.138 Class 8E 28,002,826.606 Class 8EP 118,475.811 Class 8GC 67,637.527 Class 8GH 1,224,208.624
STATEMENT OF NET ASSET VALUE PER SHARE March 31, 2021 March 31, 2020 March 31, 2019Class ZE 10.2122 9.3241 9.95Class 1E 10.1181 9.2723 9.93Class 1EP 9.2533 8.7619 9.73Class 1GH 10.32761 9.41901 9.991
Class 1UH 10.63932 9.66852 10.082
Class 2E 10.2797 9.3632 9.96Class 2EP 9.3705 8.8321 9.73Class 2GC 9.54531 8.94321 9.781
Class 2GH 10.49251 9.51191 10.021
Class 4GH 10.63051 9.58881 10.051
Class 8E 10.2650 9.3536 9.96Class 8EP 9.3952 8.8706 9.79Class 8GC 9.58011 8.98611 9.831
Class 8GH 10.48431 9.50691 10.021
1Class is denominated in GBP. The base currency of the Portfolio is EUR.2Class is denominated in USD. The base currency of the Portfolio is EUR.
The accompanying notes form an integral part of these financial statements.
Threadneedle (Lux) - Credit Opportunities
73
Threadneedle (Lux) Annual Report and Audited Financial Statements March 2021
STATEMENT OF OPERATIONS AND CHANGES IN NET ASSETSfor the year ended March 31, 2021
Notes2021 EUR
Net assets at the beginning of the year 1,551,456,289 Income
Dividends, net 2 48,330 Interest on bonds, net 2 38,772,698 Bank interest 2 15,671 Interest income on swaps 6,075,954
Net income from investments 10,320,914 Net realised gain on sales of investments 15,079,917 Net realised gain on swaps 23,211,758 Net realised gain on forward currency exchange contracts 14,087,614 Net realised (loss) on futures contracts (7,165,191)Net realised (loss) on foreign exchange (13,461,141)
Net realised gain 31,752,957 Change in net unrealised gain on investments 100,469,576 Change in net unrealised (loss) on swaps (65,381,610)Change in net unrealised gain on forward currency exchange contracts 10,317,400 Change in Net unrealised gain on futures contracts 16,282,479
Net change in unrealised gain 61,687,845
Net increase in net assets as a result of operations 103,761,716 Movements in capital
Subscriptions of shares 246,605,719 Redemptions of shares (796,543,314)Dividends 7 (98,706)
Total movements in capital (550,036,301)
Net assets at the end of the year 1,105,181,704
TOTAL NET ASSET VALUE March 31, 2021 March 31, 2020 March 31, 2019EUR 1,105,181,704 1,551,456,289 1,710,173,003
STATEMENT OF NET ASSETSas at March 31, 2021
Notes2021 EUR
Assets Investment portfolio at market value 2 50,783,070 Cash at bank 2 2,835,200 Receivable for investments sold 297,521 Subscriptions receivable 1,352 Interest receivable on swaps 2 12,538 Interest and dividends receivable, net 445,519 Upfront payment paid on swaps 2 129,126 Net unrealised gain on forward currency exchange contracts 2, 9 349,022 Net unrealised gain on futures contracts 2, 11 290,854
Total assets 55,144,202
Liabilities Payable for investments purchased (134,515)Interest payable on swaps 2 (31,647)Upfront payment received on swaps 2 (165,824)Net unrealised (loss) on swaps 2, 10 (1,442,389)Asset management fees payable 5 (1,097)Performance fees payable 8 (2)Other liabilities 20 (6,924)
Total liabilities (1,782,398)
Total net assets 53,361,804
NUMBER OF SHARES OUTSTANDINGClass AE 100.002 Class AFH 189.200 Class AKH 100.000 Class ANH 1,000.000 Class AUH 100.000 Class DE 8,860.596 Class IE 306,078.389 Class IEP 99.999 Class IGH 140.800 Class INH 1,000.000 Class IU 100.000 Class IUH 100.000 Class JE 99.997 Class JGH 140.800 Class JUH 100.000 Class LE 9,600.001 Class LEP 100.320 Class LGH 140.800 Class XE 305,471.604 Class XGH 3,813,980.912 Class XUH 2,820.054 Class YE 100.001 Class YGH 140.800 Class YUH 100.000 Class ZE 99.997 Class ZFH 189.200 Class ZGH 140.800 Class ZUH 100.000
Threadneedle (Lux) - Global Investment Grade Credit Opportunities
74
The accompanying notes form an integral part of these financial statements.
Threadneedle (Lux) Annual Report and Audited Financial Statements March 2021
STATEMENT OF OPERATIONS AND CHANGES IN NET ASSETSfor the year ended March 31, 2021
Notes2021 EUR
Net assets at the beginning of the year 65,678,771 Income
Interest on bonds, net 2 1,546,068 Bank interest 2 916 Interest income on swaps 386,976
Net income from investments 646,418 Net realised gain on sales of investments 1,070,696 Net realised gain on swaps 141,707 Net realised gain on forward currency exchange contracts 2,994,212 Net realised (loss) on futures contracts (79,751)Net realised (loss) on foreign exchange (688,304)
Net realised gain 3,438,560 Change in net unrealised gain on investments 4,541,908 Change in net unrealised (loss) on swaps (2,515,700)Change in net unrealised (loss) on forward currency exchange contracts (719)Change in Net unrealised gain on futures contracts 801,318
Net change in unrealised gain 2,826,807
Net increase in net assets as a result of operations 6,911,785 Movements in capital
Subscriptions of shares 8,207,383 Redemptions of shares (27,416,107)Dividends 7 (20,028)
Total movements in capital (19,228,752)
Net assets at the end of the year 53,361,804
TOTAL NET ASSET VALUE March 31, 2021 March 31, 2020 March 31, 2019EUR 53,361,804 65,678,771 50,389,420
The accompanying notes form an integral part of these financial statements.
Threadneedle (Lux) - Global Investment Grade Credit Opportunities
75
Threadneedle (Lux) Annual Report and Audited Financial Statements March 2021
STATEMENT OF NET ASSET VALUE PER SHARE March 31, 2021 March 31, 2020 March 31, 2019Class AE 10.2349 9.4969 9.96Class AFH 10.12681 9.41561 9.921
Class AKH 102.33582 94.63582 –Class ANH 10.36613 9.55603 –Class AUH 10.89774 10.03024 10.244
Class DE 10.0608 9.3822 9.90Class IE 10.4353 9.6157 10.02Class IEP 9.4983 9.0726 9.72Class IGH 10.69205 9.81335 10.125
Class INH 10.40133 9.53743 –Class IU 10.87264 9.35874 –Class IUH 11.09104 10.14414 10.294
Class JE 10.4159 9.6164 10.03Class JGH 10.69395 9.81275 10.145
Class JUH 11.03214 10.10464 10.294
Class LE 10.4800 9.6450 10.03Class LEP 9.5877 9.1359 9.77Class LGH 10.73825 9.83495 10.145
Class ZE 10.3835 9.5865 10.01Class ZFH 10.26201 9.49981 9.961
Class ZGH 10.66425 9.79115 10.125
Class ZUH 11.04904 10.12154 10.284
1Class is denominated in CHF. The base currency of the Portfolio is EUR.2Class is denominated in SEK. The base currency of the Portfolio is EUR.3Class is denominated in NOK. The base currency of the Portfolio is EUR.4Class is denominated in USD. The base currency of the Portfolio is EUR.5Class is denominated in GBP. The base currency of the Portfolio is EUR.#See note 1.
STATEMENT OF NET ASSETSas at March 31, 2021
Notes2021 EUR
Assets Investment portfolio at market value 2 230,453,164 Cash at bank 2 10,671,581 Receivable for investments sold 666,700 Subscriptions receivable 502,631 Interest receivable on swaps 2 2,505,873 Net unrealised gain on forward currency exchange contracts 2, 9 889,081 Other assets 20 74,249
NUMBER OF SHARES OUTSTANDINGClass AE 6,924,114.954 Class AEP 21,585.024 Class AUH 4,130.000 Class DE 1,614,108.512 Class IE 2,502,685.324 Class IGH 78,340.830 Class LE 1,492,938.591 Class XGH 4,708,027.230 Class ZE 399,559.748 Class ZF 100.000 Class ZFH 6,400.000 Class ZGH 200.000
STATEMENT OF NET ASSET VALUE PER SHARE March 31, 2021 March 31, 2020 March 31, 2019Class AE 11.9823 11.8815 10.93Class AEP 12.3580 12.2004 11.06Class AUH 12.89331 12.60491 11.381
Class DE 11.7839 11.6749 10.78Class IE 12.5007 12.2490 11.08Class IGH 12.75132 12.42172 11.272
Class LE 12.6752 12.3472 11.23Class XGH 13.86622 13.36022 11.812
Class ZE 12.5092 12.2555 11.14Class ZF 12.23673 11.48283 11.043
Class ZFH 11.82673 11.63413 10.723
Class ZGH 12.72042 12.38782 11.242
1Class is denominated in USD. The base currency of the Portfolio is EUR.2Class is denominated in GBP. The base currency of the Portfolio is EUR.3Class is denominated in CHF. The base currency of the Portfolio is EUR.
Threadneedle (Lux) - Pan European Absolute Alpha
76
The accompanying notes form an integral part of these financial statements.
Threadneedle (Lux) Annual Report and Audited Financial Statements March 2021
STATEMENT OF OPERATIONS AND CHANGES IN NET ASSETSfor the year ended March 31, 2021
Notes2021 EUR
Net assets at the beginning of the year 145,122,405 Income
Dividends, net 2 1,350,776 Bank interest 2 5,155 Interest income on swaps 201,521
Net (loss) from investments (2,964,064)Net realised gain on sales of investments 16,325,745 Net realised (loss) on swaps (43,459,981)Net realised gain on forward currency exchange contracts 5,106,128 Net realised (loss) on foreign exchange (151,683)
Net realised (loss) (22,179,791)Change in net unrealised gain on investments 31,820,205 Change in net unrealised (loss) on swaps (788,741)Change in net unrealised (loss) on forward currency exchange contracts (1,168,791)
Net change in unrealised gain 29,862,673
Net increase in net assets as a result of operations 4,718,818 Movements in capital
Subscriptions of shares 139,779,261 Redemptions of shares (54,232,729)
Total movements in capital 85,546,532
Net assets at the end of the year 235,387,755
TOTAL NET ASSET VALUE March 31, 2021 March 31, 2020 March 31, 2019EUR 235,387,755 145,122,405 62,685,309
STATEMENT OF NET ASSETSas at March 31, 2021
Notes2021 USD
Assets Investment portfolio at market value 2 110,611,936 Cash at bank 2 984,050 Receivable for investments sold 769,507 Subscriptions receivable 37,790 Interest receivable on swaps 2 609,541 Interest and dividends receivable, net 8,426 Other assets 20 70
Total assets 113,021,320
Liabilities Redemptions payable (93,965)Interest payable on swaps 2 (3)Dividend payable on swaps 2 (9,000)Net unrealised (loss) on forward currency exchange contracts 2, 9 (58,391)Net unrealised (loss) on swaps 2, 10 (98,993)Asset management fees payable 5 (121,932)Other liabilities 20 (16,146)
Total liabilities (398,430)
Total net assets 112,622,890
NUMBER OF SHARES OUTSTANDINGClass AEH 100.000 Class AU 1,294.402 Class DEH 273.123 Class DU 27,756.180 Class IU 28,645.000 Class ZU 100.000 Class 1E 3,876,674.992 Class 1EH 663,829.769 Class 1U 5,654,714.792 Class 2E 487.000 Class 2U 100.000 Class 3U 45,000.000 Class 8E 1,087,170.797 Class 8U 2,428,980.777 Class 9U 100.000
STATEMENT OF NET ASSET VALUE PER SHARE March 31, 2021 March 31, 2020 March 31, 2019Class AEH 14.79441 9.61051 10.311
Class AU 15.4832 9.9317 10.36Class DEH 14.63651 9.55511 10.301
Class DU 15.3058 9.8657 10.35Class IU 15.7911 10.0392 10.38Class ZU 15.7432 10.0184 10.38Class 1E 6.83061 4.68821 4.771
Class 1EH 5.38031 3.49431 3.741
Class 1U 8.0266 5.1432 5.36Class 2E 15.33391 10.43541 10.541
Class 2U 15.8326 10.0509 10.38Class 3U 4.5061 2.8659 2.98Class 8E 7.48371 5.09471 5.181
Class 8U 8.7414 5.5557 5.82Class 9U 15.8025 10.0466 10.381Class is denominated in EUR. The base currency of the Portfolio is USD.
The accompanying notes form an integral part of these financial statements.
Threadneedle (Lux) - American Extended Alpha
77
Threadneedle (Lux) Annual Report and Audited Financial Statements March 2021
STATEMENT OF OPERATIONS AND CHANGES IN NET ASSETSfor the year ended March 31, 2021
Notes2021 USD
Net assets at the beginning of the year 107,950,260 Income
Dividends, net 2 489,084 Bank interest 2 1,448 Interest income on swaps 62,230 Interest income on futures contracts 344
Total income 553,106
Expenses Asset management fees 5 (1,467,521)Bank interest 2 (137)Dividends expenses on swaps (186,000)Interest expense on swaps (244,653)Interest expense on futures contracts (2,074)Operating expenses 3, 5 (195,744)
Total expenses (2,096,129)
Net (loss) from investments (1,543,023)Net realised gain on sales of investments 17,501,707 Net realised (loss) on swaps (807,004)Net realised gain on forward currency exchange contracts 222,526 Net realised gain on futures contracts 943,112 Net realised (loss) on foreign exchange (65,425)
Net realised gain 17,794,916 Change in net unrealised gain on investments 36,202,518 Change in net unrealised gain on swaps 121,774 Change in net unrealised (loss) on forward currency exchange contracts (6,292)Change in net unrealised (loss) on futures contracts (385,450)
Net change in unrealised gain 35,932,550
Net increase in net assets as a result of operations 52,184,443 Movements in capital
Subscriptions of shares 17,130,775 Redemptions of shares (64,642,588)
Total movements in capital (47,511,813)
Net assets at the end of the year 112,622,890
TOTAL NET ASSET VALUE March 31, 2021 March 31, 2020 March 31, 2019USD 112,622,890 107,950,260 130,515,247
STATEMENT OF NET ASSETSas at March 31, 2021
Notes2021 USD
Assets Investment portfolio at market value 2 203,759,404 Cash at bank 2 2,897,024 Receivable for investments sold 1,460,775 Subscriptions receivable 44,037 Interest receivable on swaps 2 868,666 Interest and dividends receivable, net 405,198 Net unrealised gain on swaps 2, 10 486,727 Other assets 20 22,385
NUMBER OF SHARES OUTSTANDINGClass AEH 155,947.128 Class AU 20,588.976 Class DEH 22,275.562 Class DU 659.597 Class IU 244,799.137 Class ZU 100.000 Class 1E 24,178,621.897 Class 1U 1,025,186.577 Class 2E 44,054.110 Class 2U 2,766,884.049 Class 8E 1,055,161.252 Class 8U 205,938.041
STATEMENT OF NET ASSET VALUE PER SHARE March 31, 2021 March 31, 2020 March 31, 2019Class AEH 15.02231 10.39131 10.741
Class AU 15.6740 10.7050 10.79Class DEH 14.97621 10.42421 10.731
Class DU 15.5884 10.6942 10.78Class IU 16.1456 10.9288 10.80Class ZU 15.9900 10.8327 10.80Class 1E 5.02131 3.66941 3.581
Class 1U 5.9106 4.0324 4.02Class 2E 15.53051 11.25231 10.941
Class 2U 16.0307 10.8434 10.78Class 8E 5.53021 4.00841 3.891
Class 8U 6.5821 4.4540 4.371Class is denominated in EUR. The base currency of the Portfolio is USD.
Threadneedle (Lux) - Global Extended Alpha
78
The accompanying notes form an integral part of these financial statements.
Threadneedle (Lux) Annual Report and Audited Financial Statements March 2021
STATEMENT OF OPERATIONS AND CHANGES IN NET ASSETSfor the year ended March 31, 2021
Notes2021 USD
Net assets at the beginning of the year 163,281,752 Income
Dividends, net 2 1,763,395 Bank interest 2 1,665 Interest income on swaps 184,681
Net (loss) from investments (2,214,902)Net realised gain on sales of investments 18,888,977 Net realised gain on swaps 4,137,586 Net realised gain on forward currency exchange contracts 52,043 Net realised gain on foreign exchange 24,958 Net realised gain on tax reclaim 7
Net realised gain 23,103,571 Change in net unrealised gain on investments 53,063,184 Change in net unrealised (loss) on swaps (341,152)Change in net unrealised (loss) on forward currency exchange contracts (40,840)
Net change in unrealised gain 52,681,192
Net increase in net assets as a result of operations 73,569,861 Movements in capital
Subscriptions of shares 30,684,748 Redemptions of shares (57,981,095)
Total movements in capital (27,296,347)
Net assets at the end of the year 209,555,266
TOTAL NET ASSET VALUE March 31, 2021 March 31, 2020 March 31, 2019USD 209,555,266 163,281,752 170,492,979
STATEMENT OF NET ASSETSas at March 31, 2021
Notes2021 USD
Assets Investment portfolio at market value 2 515,301,625 Cash at bank 2 26,643,327 Subscriptions receivable 1,697,330 Interest and dividends receivable, net 366
NUMBER OF SHARES OUTSTANDINGClass AEH 245,310.013 Class AFH 184,842.729 Class AGH 50,442.617 Class ASH 438,009.514 Class AU 645,246.604 Class DEH 167,146.470 Class DU 284,217.110 Class IEH 551,735.117 Class IG 100.000 Class IGH 4,392,421.398 Class IU 3,559,405.697 Class NG 11,797,263.399 Class XU 13,648,204.046 Class ZEH 38,398.000 Class ZFH 5,110.000 Class ZGH 141,859.316 Class ZU 67,887.964
The accompanying notes form an integral part of these financial statements.
Threadneedle (Lux) - Enhanced Commodities
79
Threadneedle (Lux) Annual Report and Audited Financial Statements March 2021
STATEMENT OF OPERATIONS AND CHANGES IN NET ASSETSfor the year ended March 31, 2021
Notes2021 USD
Net assets at the beginning of the year 292,751,295 Income
Interest on bonds, net 2 1,552,177 Bank interest 2 7,075
Net (loss) from investments (1,290,707)Net realised gain on sales of investments 98,307 Net realised gain on swaps 110,779,963 Net realised gain on forward currency exchange contracts 9,518,682 Net realised gain on foreign exchange 23,827
Net realised gain 120,420,779 Change in net unrealised (loss) on investments (1,311,635)Change in net unrealised gain on swaps 2,736,084 Change in net unrealised (loss) on forward currency exchange contracts (639,169)
Net change in unrealised gain 785,280
Net increase in net assets as a result of operations 119,915,352 Movements in capital
Subscriptions of shares 177,004,551 Redemptions of shares (60,777,600)
Total movements in capital 116,226,951
Net assets at the end of the year 528,893,598
TOTAL NET ASSET VALUE March 31, 2021 March 31, 2020 March 31, 2019USD 528,893,598 292,751,295 446,269,011
Threadneedle (Lux) - Enhanced Commodities
80
The accompanying notes form an integral part of these financial statements.
Threadneedle (Lux) Annual Report and Audited Financial Statements March 2021
STATEMENT OF NET ASSET VALUE PER SHARE March 31, 2021 March 31, 2020 March 31, 2019Class AEH 8.49061 6.38651 8.481
Class AFH 6.27392 4.72742 6.302
Class AGH 9.09513 6.80773 8.983
Class ASH 4.77024 3.55754 4.634
Class AU 10.0129 7.4279 9.58Class DEH 6.44571 4.87291 6.501
Class DU 7.6039 5.6690 7.35Class IEH 12.49031 9.29681 12.211
Class IFH – – 9.062
Class IG 10.04763 8.21933 10.003
Class IGH 13.34933 9.88743 12.903
Class IU 14.7124 10.8005 13.79Class NG 9.67353 7.87433 9.533
Class XU 15.5436 11.3145 14.32Class ZEH 5.27511 3.92851 5.161
Class ZFH 5.10752 3.81092 5.022
Class ZGH 7.64373 5.66443 7.403
Class ZU 6.0682 4.4569 5.691Class is denominated in EUR. The base currency of the Portfolio is USD.2Class is denominated in CHF. The base currency of the Portfolio is USD.3Class is denominated in GBP. The base currency of the Portfolio is USD.4Class is denominated in SGD. The base currency of the Portfolio is USD.5Class is denominated in SEK. The base currency of the Portfolio is USD.
STATEMENT OF NET ASSET VALUE PER SHARE November 10, 2020# March 31, 2020 March 31, 2019Class AU – 11.4255 11.56Class XU – 11.7913 11.74#See note 1.
*See note 1.The accompanying notes form an integral part of these financial statements.
Threadneedle (Lux) - Gatehouse Shariah Global Equity*
81
Threadneedle (Lux) Annual Report and Audited Financial Statements March 2021
STATEMENT OF OPERATIONS AND CHANGES IN NET ASSETSfor the accounting period from April 01, 2020 to November 10, 2020
Notes2020 USD
Net assets at the beginning of the period 12,190,122 Income
Net (loss) from investments (42,313)Net realised gain on sales of investments 3,540,349 Net realised (loss) on forward currency exchange contracts (46)Net realised (loss) on foreign exchange (8,864)Net realised gain on tax reclaim 7
Net realised gain 3,531,446 Change in net unrealised gain on investments 289
Net change in unrealised gain 289
Net increase in net assets as a result of operations 3,489,422 Movements in capital
Subscriptions of shares 108,814 Redemptions of shares (15,788,358)
Total movements in capital (15,679,544)
Net assets at the end of the period –
TOTAL NET ASSET VALUE November 10, 2020# March 31, 2020 March 31, 2019USD – 12,190,122 12,383,414
Nominal Value Investment
Market Value
USD
% of Net Asset
Value
Transferable securities and money market instruments admitted to an official exchange listing
01/05/2026 946,126 0.19 EUR 773,000 International Game Technology
plc 3.50% 15/06/2026 928,953 0.18
Threadneedle (Lux) - Global Corporate Bond
86
The accompanying notes form an integral part of these financial statements.
Threadneedle (Lux) Annual Report and Audited Financial Statements March 2021
Portfolio Statement(continued)
Nominal Value Investment
Market Value
USD
% of Net Asset
Value
Transferable securities and money market instruments admitted to an official exchange listing (continued)
Bonds (continued)
UNITED STATES (continued)USD 1,002,000 Broadcom Inc. 4.15% 15/11/2030 1,083,162 0.22 USD 630,000 Broadcom Inc. 5.00% 15/04/2030 719,443 0.14 USD 530,000 Burlington Northern Santa Fe
LLC 4.38% 01/09/2042 618,951 0.12 USD 600,000 Charter Communications
Operating LLC 3.70% 01/04/2051 563,147 0.11 USD 1,092,000 Charter Communications
Operating LLC 4.80% 01/03/2050 1,181,170 0.23 EUR 2,860,000 Chubb Ina Holdings I 0.88%
LLC 4.45% 15/02/2043 1,717,563 0.34 USD 3,515,000 Eversource Energy 2.55%
15/03/2031 3,516,279 0.71 USD 1,590,000 Eversource Energy 3.45%
15/01/2050 1,594,450 0.32 USD 580,000 Eversource Energy 3.45%
15/01/2050 581,623 0.12 USD 335,000 Fedex Corp. 4.95% 17/10/2048 409,678 0.08 EUR 700,000 Fidelity National Information
Services Inc. 1.50% 21/05/2027 875,524 0.17 EUR 917,000 Fidelity National Information
Services Inc. 1.50% 21/05/2027 1,146,936 0.23 EUR 868,000 Fidelity National Information
Services Inc. 2.00% 21/05/2030 1,130,396 0.22 EUR 454,000 Fidelity National Information
Services Inc. 2.95% 21/05/2039 645,791 0.13 EUR 500,000 Fiserv Inc. 1.13% 01/07/2027 615,018 0.12
Nominal Value Investment
Market Value
USD
% of Net Asset
Value
Transferable securities and money market instruments admitted to an official exchange listing (continued)
Bonds (continued)
UNITED STATESUSD 2,867,000 AbbVie Inc. 4.25% 21/11/2049 3,253,956 0.64 USD 967,000 AbbVie Inc. 4.88% 14/11/2048 1,184,624 0.23 USD 684,000 Altria Group Inc. 4.00%
04/02/2061 634,001 0.13 USD 991,000 Amazon.com Inc. 2.70%
03/06/2060 885,144 0.18 USD 569,000 American International Group
Inc. 3.40% 30/06/2030 606,114 0.12 USD 1,805,000 Amgen Inc. 3.15% 21/02/2040 1,797,743 0.36 USD 2,012,000 Anheuser-Busch Companies
Company 4.00% 01/03/2049 385,209 0.08 USD 676,000 Indiana Michigan Power
Company 3.75% 01/07/2047 710,435 0.14 USD 81,000 Indiana Michigan Power
Company 6.05% 15/03/2037 107,384 0.02 USD 501,000 Transcontinental Gas Pipe Line
Company 3.25% 15/05/2030 527,592 0.10
Total United States 7,402,029 1.46
Total Bonds 7,845,396 1.55
Total Transferable securities and money market instruments dealt in on another regulated market and recently issued transferable securities 7,845,396 1.55
Nominal Value Investment
Market Value
USD
% of Net Asset
Value
Transferable securities and money market instruments admitted to an official exchange listing (continued)
Supranationals, Governments and Local Public Authorities, Debt Instruments
01/09/2028 317,072 0.20 EUR 471,000 AT&T Inc. 1.80% 14/09/2039 474,009 0.30 EUR 200,000 AT&T Inc. 1.80% 14/09/2039 201,278 0.13 EUR 810,000 AT&T Inc. 3.15% 04/09/2036 971,819 0.62 EUR 293,000 Avantor Funding Inc. 2.63%
01/11/2025 300,529 0.19 EUR 634,000 Bank of America Corp. 0.69%
22/03/2031 633,567 0.40 EUR 1,390,000 Bank of America Corp. FRN
31/03/2029 1,690,224 1.07 EUR 1,151,000 Becton Dickinson and Company
1.90% 15/12/2026 1,255,365 0.79 EUR 435,000 Berkshire Hathaway Inc. 1.13%
16/03/2027 460,229 0.29 EUR 907,000 Chubb Ina Holdings I 0.88%
15/12/2029 930,115 0.59 EUR 542,000 Citigroup Inc. FRN 06/07/2026 566,009 0.36 EUR 106,000 Digital Euro Finco LLC 2.50%
16/01/2026 116,778 0.07 EUR 480,000 Digital Euro Finco LLC 2.50%
16/01/2026 528,806 0.33 EUR 385,000 Exxon Mobil Corp. 0.52%
26/06/2028 390,404 0.25 EUR 681,000 Fidelity National Information
Services Inc. 1.50% 21/05/2027 724,717 0.46 EUR 200,000 Fidelity National Information
Services Inc. 1.50% 21/05/2027 212,839 0.13 EUR 606,000 Fidelity National Information
Services Inc. 2.00% 21/05/2030 671,482 0.42 EUR 325,000 Fiserv Inc. 1.13% 01/07/2027 340,136 0.22 EUR 910,000 Fiserv Inc. 1.63% 01/07/2030 980,265 0.62 EUR 973,000 General Electric Company
2.13% 17/05/2037 1,050,284 0.66 EUR 585,000 General Motors Financial
Company Inc. 0.60% 20/05/2027 580,602 0.37
Nominal Value Investment
Market Value
EUR
% of Net Asset
Value
Transferable securities and money market instruments admitted to an official exchange listing (continued)
Bonds (continued)
UNITED KINGDOM (continued)EUR 864,000 BP Capital Markets plc Perp
Total Supranationals, Governments and Local Public Authorities, Debt Instruments 8,050,132 5.10
Bonds - convertibles
FRANCEGBP 100,000 Orange SA 0.38% 27/06/2021 117,268 0.07
Total France 117,268 0.07
Total Bonds - convertibles 117,268 0.07
Total Transferable securities and money market instruments admitted to an official exchange listing 151,075,511 95.62
Transferable securities and money market instruments dealt in on another regulated market and recently issued transferable securities
Bonds
NETHERLANDSUSD 1,150,000 Vonovia Finance BV 5.00%
02/10/2023 1,060,691 0.67
Total Netherlands 1,060,691 0.67
Total Bonds 1,060,691 0.67
Total Transferable securities and money market instruments dealt in on another regulated market and recently issued transferable securities 1,060,691 0.67
Nominal Value Investment
Market Value
EUR
% of Net Asset
Value
Transferable securities and money market instruments admitted to an official exchange listing (continued)
Bonds (continued)
UNITED STATES (continued)EUR 629,000 Goldman Sachs Group Inc.
1.00% 18/03/2033 629,286 0.40 EUR 212,000 Honeywell International Inc.
0.75% 10/03/2032 217,234 0.14 EUR 427,000 Iqvia Inc. 1.75% 15/03/2026 428,829 0.27 EUR 236,000 JPMorgan Chase & Company
FRN 17/02/2033 231,553 0.15 EUR 1,455,000 Kraft Heinz Foods Company
2.25% 25/05/2028 1,571,487 0.99 EUR 620,000 Metropolitan Life Global
Funding I 0.38% 09/04/2024 630,313 0.40 EUR 600,000 Morgan Stanley FRN 07/02/2031 591,194 0.37 EUR 320,000 Netflix Inc. 3.00% 15/06/2025 348,092 0.22 EUR 260,000 Netflix Inc. 3.63% 15/06/2030 304,816 0.19 EUR 602,000 New York Life Global Funding
0.25% 23/01/2027 607,980 0.38 EUR 481,000 Thermo Fisher Scientific Inc.
1.88% 01/10/2049 509,727 0.32 EUR 484,000 Verizon Communication 1.13%
19/09/2035 479,232 0.30 EUR 948,000 Verizon Communications Inc.
0.88% 08/04/2027 985,687 0.62 USD 1,071,000 Verizon Communications Inc.
Transferable securities and money market instruments admitted to an official exchange listing (continued)
Mortgage and Asset Backed Securities
FRANCEEUR 472,000 Louvre Bidco SAS FRN
30/09/2024 474,517 0.08
Total France 474,517 0.08
Total Mortgage and Asset Backed Securities 474,517 0.08
Total Transferable securities and money market instruments admitted to an official exchange listing 559,253,390 92.90
Transferable securities and money market instruments dealt in on another regulated market and recently issued transferable securities
Bonds
UNITED STATESUSD 640,000 Primo Water Holdings Inc.
5.50% 01/04/2025 560,361 0.09
Total United States 560,361 0.09
Total Bonds 560,361 0.09
Total Transferable securities and money market instruments dealt in on another regulated market and recently issued transferable securities 560,361 0.09
Other transferable securities and money market instruments
Bonds
PORTUGALEUR 1,000,000 Banco Espirito Santo SA 2.63%
31/12/2049* 110,000 0.02 EUR 6,900,000 Banco Espirito Santo SA 4.00%
21/01/2022* 759,000 0.13 EUR 1,400,000 Banco Espirito Santo SA 4.75%
15/01/2022* 154,000 0.03
Total Portugal 1,023,000 0.18
UNITED KINGDOMGBP 5,630,000 Bellis Acquisition Company
3.25% 16/02/2026 6,649,218 1.11 GBP 1,289,000 Miller Homes 5.50% 15/10/2024 1,551,805 0.26 GBP 2,848,000 Pinewood Finance Company
The accompanying notes form an integral part of these financial statements.
Threadneedle (Lux) Annual Report and Audited Financial Statements March 2021
Portfolio Statement(continued)
Nominal Value Investment
Market Value
EUR
% of Net Asset
Value
Transferable securities and money market instruments dealt in on another regulated market and recently issued transferable securities (continued)
Bonds (continued)
UNITED STATESUSD 925,000 Carrier Global Corp. 2.72%
15/02/2030 795,049 0.34 USD 700,000 Primo Water Holdings Inc.
5.50% 01/04/2025 612,895 0.26
Total United States 1,407,944 0.60
Total Bonds 1,838,677 0.78
Total Transferable securities and money market instruments dealt in on another regulated market and recently issued transferable securities 1,838,677 0.78
Other transferable securities and money market instruments
Bonds
AUSTRALIAUSD 1,270,000 Woodside Finance Limited
4.50% 04/03/2029 1,179,145 0.50
Total Australia 1,179,145 0.50
BERMUDAUSD 833,000 Bacardi Limited 4.45%
15/05/2025 788,754 0.34
Total Bermuda 788,754 0.34
FRANCEUSD 850,000 BPCE SA 2.70% 01/10/2029 735,828 0.31
Total France 735,828 0.31
ITALYUSD 400,000 Intesa Sanpaolo SpA 4.00%
23/09/2029 367,247 0.16
Total Italy 367,247 0.16
PORTUGALEUR 100,000 Banco Espirito Santo SA 4.00%
21/01/2022* 11,000 0.00
Total Portugal 11,000 0.00
Nominal Value Investment
Market Value
EUR
% of Net Asset
Value
Transferable securities and money market instruments admitted to an official exchange listing (continued)
Supranationals, Governments and Local Public Authorities, Debt Instruments (continued)
Total Supranationals, Governments and Local Public Authorities, Debt Instruments 1,766,612 3.72
Total Transferable securities and money market instruments admitted to an official exchange listing 42,181,465 88.90
Transferable securities and money market instruments dealt in on another regulated market and recently issued transferable securities
Bonds
BERMUDAUSD 500,000 Tengizchevroil Finance
Company International 2.63% 15/08/2025 504,229 1.06
Total Bermuda 504,229 1.06
PERUUSD 300,000 Inretail Consumer 3.25%
22/03/2028 299,625 0.63
Total Peru 299,625 0.63
Total Bonds 803,854 1.69
Total Transferable securities and money market instruments dealt in on another regulated market and recently issued transferable securities 803,854 1.69
Other transferable securities and money market instruments
Bonds
LUXEMBOURGUSD 500,000 Altice Financing SA 5.00%
15/01/2028 494,944 1.04
Total Luxembourg 494,944 1.04
Total Bonds 494,944 1.04
Total Other transferable securities and money market instruments 494,944 1.04
Nominal Value Investment
Market Value
USD
% of Net Asset
Value
Transferable securities and money market instruments admitted to an official exchange listing (continued)
Total Supranationals, Governments and Local Public Authorities, Debt Instruments 514,261 1.14
Total Transferable securities and money market instruments dealt in on another regulated market and recently issued transferable securities 514,261 1.14
Other transferable securities and money market instruments
Bonds
VENEZUELAUSD 1,999,683 Petroleos de Venezuela SA
6.00% 15/11/2026 91,236 0.20
Total Venezuela 91,236 0.20
Total Bonds 91,236 0.20
Supranationals, Governments and Local Public Authorities, Debt Instruments
VENEZUELAUSD 2,004,400 Venezuela (Govt of) 8.25%
13/10/2024 210,462 0.46
Total Venezuela 210,462 0.46
Total Supranationals, Governments and Local Public Authorities, Debt Instruments 210,462 0.46
Total Other transferable securities and money market instruments 301,698 0.66
Nominal Value Investment
Market Value
USD
% of Net Asset
Value
Transferable securities and money market instruments admitted to an official exchange listing (continued)
Supranationals, Governments and Local Public Authorities, Debt Instruments (continued)
SOUTH AFRICAUSD 200,000 South Africa (Govt of) 4.85%
30/09/2029 202,083 0.44 USD 600,000 South Africa (Govt of) 5.75%
Total Supranationals, Governments and Local Public Authorities, Debt Instruments 1,071,892 0.93
Total Transferable securities and money market instruments dealt in on another regulated market and recently issued transferable securities 2,779,475 2.40
Nominal Value Investment
Market Value
USD
% of Net Asset
Value
Transferable securities and money market instruments admitted to an official exchange listing (continued)
Supranationals, Governments and Local Public Authorities, Debt Instruments (continued)
RUSSIAN FEDERATIONUSD 800,000 Russia (Govt of) 4.75%
27/05/2026 897,312 0.78
Total Russian Federation 897,312 0.78
SENEGALUSD 250,000 Senegal (Govt of) 8.75%
13/05/2021 250,520 0.22
Total Senegal 250,520 0.22
SOUTH AFRICAUSD 350,000 South Africa (Govt of) 4.85%
30/09/2029 353,646 0.31 USD 600,000 South Africa (Govt of) 4.88%
14/04/2026 631,367 0.55
Total South Africa 985,013 0.86
SRI LANKAUSD 399,000 Sri Lanka (Govt of) 5.75%
18/04/2023 273,714 0.24 USD 261,000 Sri Lanka (Govt of) 6.85%
15/06/2023 149,837 0.07 USD 547,000 T-Mobile USA Inc. 2.63%
15/02/2029 531,887 0.25 USD 304,000 T-Mobile USA Inc. 2.88%
15/02/2031 295,317 0.14 USD 826,000 T-Mobile USA Inc. 3.50%
15/04/2031 830,646 0.39 USD 196,000 T-Mobile USA Inc. 4.50%
01/02/2026 200,655 0.10 USD 361,000 T-Mobile USA Inc. 4.75%
01/02/2028 384,781 0.18 USD 422,000 Transdigm Inc. 6.38% 15/06/2026 439,154 0.21 USD 303,000 Transdigm Inc. 6.50% 15/05/2025 310,052 0.15 USD 624,000 TransDigm Inc. 5.50%
15/11/2027 647,247 0.31 USD 404,000 TRI Pointe Group Inc. 5.88%
15/06/2024 446,915 0.21 USD 506,000 Tri Pointe Homes Inc. 5.70%
15/06/2028 560,501 0.27 USD 147,000 United Rentals North America
Inc. 5.50% 15/05/2027 157,051 0.07 USD 310,000 United Rentals North America
Inc. 5.88% 15/09/2026 324,809 0.15 USD 169,000 Welbilt Inc. 9.50% 15/02/2024 174,366 0.08 USD 44,000 Western Midstream Operating
LP 4.50% 01/03/2028 45,706 0.02
Nominal Value Investment
Market Value
USD
% of Net Asset
Value
Transferable securities and money market instruments admitted to an official exchange listing (continued)
Bonds (continued)
UNITED STATES (continued)USD 551,000 Netflix Inc. 4.88% 15/04/2028 624,007 0.31 USD 352,000 Netflix Inc. 5.88% 15/11/2028 426,236 0.20 USD 384,000 NortonLifeLock Inc. 5.00%
15/04/2025 389,587 0.19 USD 318,000 NRG Energy Inc. 6.63%
15/01/2027 331,714 0.16 USD 322,000 NRG Energy Inc. 7.25%
Total Transferable securities and money market instruments dealt in on another regulated market and recently issued transferable securities 145,218,346 68.91
Other transferable securities and money market instruments
Bonds
GERMANYUSD 183,000 Vertical Holdco GmbH 7.63%
15/07/2028 197,228 0.09
Total Germany 197,228 0.09
LUXEMBOURGUSD 459,000 Altice France Holding SA 6.00%
15/02/2028 452,804 0.22 USD 327,000 Altice France Holding SA
10.50% 15/05/2027 367,988 0.17
Total Luxembourg 820,792 0.39
UNITED KINGDOMUSD 446,000 Vmed O2 UK Financing 4.25%
REPUBLIC OF KOREA (SOUTH)USD 1,000,000 Korea (Govt of) 1.00%
16/09/2030 921,551 1.34
Total Republic of Korea (South) 921,551 1.34
SRI LANKAUSD 600,000 Sri Lanka (Govt of) 6.75%
18/04/2028 369,753 0.54 USD 350,000 Sri Lanka (Govt of) 6.83%
18/07/2026 215,433 0.31
Total Sri Lanka 585,186 0.85
Total Supranationals, Governments and Local Public Authorities, Debt Instruments 7,737,628 11.24
Total Transferable securities and money market instruments admitted to an official exchange listing 60,097,818 87.32
Transferable securities and money market instruments dealt in on another regulated market and recently issued transferable securities
Supranationals, Governments and Local Public Authorities, Debt Instruments
CHINACNY 6,000,000 China (Govt of) 2.36% 02/07/2023 906,247 1.32 CNY 10,000,000 China (Govt of) 2.85% 04/06/2027 1,501,993 2.19 CNY 7,000,000 China (Govt of) 3.12% 05/12/2026 1,070,078 1.55
Total China 3,478,318 5.06
Total Supranationals, Governments and Local Public Authorities, Debt Instruments 3,478,318 5.06
Total Transferable securities and money market instruments dealt in on another regulated market and recently issued transferable securities 3,478,318 5.06
Total value of investments 63,576,136 92.38
(Total cost: USD 63,597,296)
Nominal Value Investment
Market Value
EUR
% of Net Asset
Value
Transferable securities and money market instruments admitted to an official exchange listing
Supranationals, Governments and Local Public Authorities, Debt Instruments
INDONESIAIDR 4,000,000,000 Indonesia (Govt of) 7.00%
15/09/2030 237,532 0.75
Total Indonesia 237,532 0.75
UNITED STATESUSD 266,000 United States Treasury Inflation
Indexed N/B 0.13% 15/04/2022 250,306 0.78 USD 77,600 United States Treasury Inflation
Indexed N/B FRN 15/02/2041 114,329 0.36 USD 81,000 United States Treasury Inflation
Indexed N/B 2.57% 15/02/2040 119,538 0.37
Total United States 484,173 1.51
Total Supranationals, Governments and Local Public Authorities, Debt Instruments 721,705 2.26
Total Transferable securities and money market instruments admitted to an official exchange listing 721,705 2.26
Undertakings for collective investments in transferable securities
JAPAN 1,100 Keyence Corp. 500,425 0.87 5,800 Rohm Company Limited 567,402 0.98 10,500 Sekisui Chemical Company
Limited 201,923 0.35 3,600 Sony Corp. 377,756 0.65 5,600 Yaskawa Electric Corp. 279,240 0.48
Total Japan 1,926,746 3.33
NETHERLANDS 1,920 Airbus SE 217,850 0.38
Total Netherlands 217,850 0.38
REPUBLIC OF KOREA (SOUTH) 14,804 Samsung Electronics Company
Limited 1,064,767 1.84 465 Samsung Sdi Company Limited 271,174 0.47
Total Republic of Korea (South) 1,335,941 2.31
SWITZERLAND 4,323 Nestle SA - Reg 483,860 0.83 1,510 Roche Holding AG 490,070 0.84 4,635 TE Connectivity Limited 598,425 1.03
Total Switzerland 1,572,355 2.70
The accompanying notes form an integral part of these financial statements.
Threadneedle (Lux) - Global Dynamic Real Return
161
Portfolio Statementas at March 31, 2021
Threadneedle (Lux) Annual Report and Audited Financial Statements March 2021
Threadneedle (Lux) - Global Dynamic Real Return
162
The accompanying notes form an integral part of these financial statements.
Threadneedle (Lux) Annual Report and Audited Financial Statements March 2021
Portfolio Statement(continued)
Nominal Value Investment
Market Value
USD
% of Net Asset
Value
Transferable securities and money market instruments admitted to an official exchange listing (continued)
Equities (continued)
UNITED STATES (continued) 3,141 Union Pacific Corp. 692,308 1.19 1,598 United Health Group Inc. 594,568 1.02 3,388 Visa Inc. - A 717,342 1.23 2,603 Walt Disney Company 480,306 0.83
Total Structured Instruments - Commodities 278,964 0.48
Total Transferable securities and money market instruments admitted to an official exchange listing 40,656,670 70.07
Transferable securities and money market instruments dealt in on another regulated market and recently issued transferable securities
Supranationals, Governments and Local Public Authorities, Debt Instruments
UNITED STATESUSD 2,500,000 United States Treasury Bill
0.00% 22/04/2021 2,500,486 4.31 USD 5,000,000 United States Treasury Bill
0.00% 22/07/2021 4,999,803 8.61
Total United States 7,500,289 12.92
Total Supranationals, Governments and Local Public Authorities, Debt Instruments 7,500,289 12.92
Total Transferable securities and money market instruments dealt in on another regulated market and recently issued transferable securities 7,500,289 12.92
Nominal Value Investment
Market Value
USD
% of Net Asset
Value
Transferable securities and money market instruments admitted to an official exchange listing (continued)
Equities (continued)
TAIWAN 31,000 Taiwan Semiconductor
Manufacturing Company Limited 637,750 1.10
Total Taiwan 637,750 1.10
UNITED KINGDOM 11,454 Diageo plc 472,433 0.82 7,526 Reckitt Benckiser Group plc 674,728 1.16
Total United Kingdom 1,147,161 1.98
UNITED STATES 3,302 Abbott Laboratories 395,712 0.68 6,276 Activision Blizzard Inc. 583,668 1.01 1,952 Adobe Systems Inc. 927,922 1.60 956 Alphabet Inc. - A 1,971,769 3.40 110 Alphabet Inc. - C 227,549 0.39 560 Amazon.com Inc. 1,732,685 3.00 1,709 American Tower Corp. 408,554 0.70 646 Autodesk Inc. 179,039 0.31 9,985 Centene Corp. 638,141 1.10 2,902 CME Group Inc. 592,675 1.02 14,099 Comcast Corp. 762,896 1.31 977 Cooper Companies Inc. 375,256 0.65 2,004 Ecolab Inc. 428,996 0.74 4,610 Edwards Lifesciences Corp. 385,580 0.66 3,796 Electronic Arts Inc. 513,865 0.89 755 Equinix Inc. 513,090 0.89 3,664 Facebook Inc. - A 1,079,158 1.86 4,432 Fidelity National Information
Services Inc. 623,184 1.07 7,473 General Motors Company 429,399 0.74 1,566 Intuit Inc. 599,872 1.03 4,536 JPMorgan Chase & Company 690,515 1.19 1,135 Lam Research Corp. 675,597 1.16 2,530 Mastercard Inc. - A 900,807 1.55 8,162 Microsoft Corp. 1,924,354 3.32 7,144 NextEra Energy Inc. 540,158 0.93 1,114 Nvidia Corp. 594,798 1.02 1,021 Paypal Holdings Inc. 247,940 0.43 1,061 S&P Global Inc. 374,395 0.65 8,856 Service Corp. International 452,099 0.78 1,584 Stryker Corp. 385,831 0.66 667 Thermo Fisher Scientific Inc. 304,405 0.52 5,644 T-Mobile USA Inc. 707,137 1.22 3,010 Transunion 270,900 0.47 6,947 Uber Technologies Inc. 378,681 0.65
The accompanying notes form an integral part of these financial statements.
Threadneedle (Lux) - Global Dynamic Real Return
163
Threadneedle (Lux) Annual Report and Audited Financial Statements March 2021
Portfolio Statement(continued)
Nominal Value Investment
Market Value
USD
% of Net Asset
Value
Undertakings for collective investments in transferable securities
Funds
LUXEMBOURG 190,349 Threadneedle (Lux) - Enhanced
Commodities XU* 2,958,707 5.10 57,165 Threadneedle (Lux) - Global
Transferable securities and money market instruments admitted to an official exchange listing (continued)
Bonds (continued)
FRANCE (continued)EUR 100,000 Louvre Bidco SAS 6.50%
30/09/2024 121,563 0.07 EUR 100,000 Loxam Sas 5.75% 15/07/2027 117,422 0.07 EUR 182,000 Loxam SAS 3.25% 14/01/2025 212,692 0.12 EUR 100,000 Orano SA 3.38% 23/04/2026 127,190 0.07 EUR 160,000 Paprec Holding SA 4.00%
31/03/2025 191,468 0.11 EUR 163,000 Parts Europe SA 6.50%
16/07/2025 201,173 0.11 EUR 100,000 Renault SA 1.25% 24/06/2025 114,774 0.07 EUR 300,000 Renault SA 2.38% 25/05/2026 356,868 0.20 EUR 100,000 SPCM SA 2.63% 01/02/2029 120,609 0.07 EUR 100,000 Spie SA 3.13% 22/03/2024 123,430 0.07 USD 38,000 Total Capital International SA
2.99% 29/06/2041 36,564 0.02 EUR 100,000 Veolia Environnement SA Perp
FRN 119,801 0.07
Total France 7,064,797 4.07
GERMANYEUR 107,000 Adler Real Estate AG 2.13%
06/02/2024 127,232 0.07 EUR 100,000 Adler Real Estate AG 3.00%
31/01/2031 263,300 0.15 EUR 100,000 Vodafone Group plc FRN
27/08/2080 121,732 0.07 EUR 100,000 Vodafone Group plc FRN
27/08/2080 121,480 0.07 EUR 100,000 Vodafone Group plc FRN
03/01/2079 122,717 0.07 GBP 155,000 Vodafone Group plc FRN
03/10/2078 232,471 0.13 USD 231,000 Vodafone Group plc FRN
03/10/2078 255,544 0.14 USD 159,000 Vodafone Group plc FRN
04/04/2079 191,606 0.11
Total United Kingdom 9,357,022 5.36
UNITED STATESUSD 98,000 AbbVie Inc. 4.25% 21/11/2049 111,227 0.06 USD 32,000 AbbVie Inc. 4.88% 14/11/2048 39,202 0.02 USD 20,000 Altria Group Inc. 4.00%
04/02/2061 18,538 0.01 USD 38,000 Amazon.com Inc. 2.70%
03/06/2060 33,941 0.02 USD 51,000 American International Group
Inc. 3.40% 30/06/2030 54,327 0.03 USD 35,000 Amgen Inc. 3.15% 21/02/2040 34,859 0.02 USD 148,000 Anheuser-Busch Companies
FRANCE 980 Air Liquide SA 160,445 0.09 14,711 AXA SA 395,678 0.23 3,532 Edenred 184,893 0.11 418 Louis Vuitton Moet Hennessy
SE 279,094 0.16 6,088 Nexity SA 301,092 0.17 891 Pernod-Ricard SA 167,603 0.10 1,923 Schneider Electric SE 294,378 0.17 4,253 Total SA 198,817 0.11 6,560 Verallia Sasu 237,082 0.14 3,242 Vinci SA 332,870 0.19
Total France 2,551,952 1.47
GERMANY 635 Adidas AG 198,669 0.11 3,730 Brenntag AG 319,146 0.18 10,190 Deutsche Telekom AG - Reg 205,633 0.12 7,805 DWS Group GmbH & Co KGaA 338,262 0.19 5,512 E.ON AG 64,290 0.04 3,410 Evonik Industries AG 120,874 0.07 323 Muenchener
Rueckversicherungs AG - Reg 99,689 0.06 1,572 Siemens AG - Reg 258,660 0.15 3,785 Siemens Healthineers AG 205,521 0.12 788 Volkswagen AG Pfd 220,976 0.13 2,609 Vonovia SE 170,796 0.10
Total Germany 2,202,516 1.27
Nominal Value Investment
Market Value
USD
% of Net Asset
Value
Transferable securities and money market instruments admitted to an official exchange listing (continued)
Equities
AUSTRALIA 9,531 Aristocrat Leisure Limited 249,356 0.14 16,254 Australia & New Zealand
Banking Group Limited 348,864 0.20 2,829 Carsales.Com Limited 38,375 0.02 22,885 Dexus Property Group 169,946 0.10 26,723 Fortescue Metals Group Limited 406,868 0.24 3,391 Macquarie Group Limited 394,722 0.23 19,200 Oz Minerals Limited 334,005 0.19 29,613 Sydney Airport Finance
Company Pty Limited 139,614 0.08 17,505 Transurban Group 177,591 0.10
REPUBLIC OF KOREA (SOUTH) 9,620 Hanon Systems 150,027 0.09 4,915 KB Financial Group Inc. 244,068 0.14 2,400 Kia Motors Corp. 175,799 0.10 2,275 LG Corp. 181,719 0.10 1,066 Posco 301,410 0.17 2,814 Samsung Electronics Company
Limited 202,395 0.12 18,811 Samsung Electronics Company
Limited Pfd 1,213,349 0.70 1,258 SK Telecom Company Limited 305,678 0.17
Total Republic of Korea (South) 2,774,445 1.59
SINGAPORE 92,600 CapitaLand Integrated
Commercial Trust 149,555 0.09 9,600 DBS Group Holdings Limited 205,704 0.12 20,100 United Overseas Bank Limited 386,412 0.22
Total Singapore 741,671 0.43
SPAIN 20,678 Iberdrola SA 266,967 0.15 11,371 Inditex SA 375,538 0.21
Total Spain 642,505 0.36
Nominal Value Investment
Market Value
USD
% of Net Asset
Value
Transferable securities and money market instruments admitted to an official exchange listing (continued)
Equities (continued)
HONG KONG 38,800 AIA Group Limited 470,622 0.27 19,700 ASM Pacific Technology
Limited 250,986 0.14 6,900 Hong Kong Exchanges and
Clearing Limited 405,951 0.23 14,000 Sun Hung Kai Properties
ITALY 34,358 Enel SpA 342,955 0.20 23,914 Infrastrutture Wireless Italiane
SpA 267,008 0.15 14,081 Nexi SpA 246,255 0.14
Total Italy 856,218 0.49
JAPAN 800 Rohm Company Limited 78,262 0.04
Total Japan 78,262 0.04
Threadneedle (Lux) - Global Multi Asset Income
176
The accompanying notes form an integral part of these financial statements.
Threadneedle (Lux) Annual Report and Audited Financial Statements March 2021
Portfolio Statement(continued)
Nominal Value Investment
Market Value
USD
% of Net Asset
Value
Transferable securities and money market instruments admitted to an official exchange listing (continued)
Equities (continued)
UNITED KINGDOM (continued) 1,210,000 Supermarket Income Reit plc 1,811,339 1.04 1,100,000 Target Healthcare REIT plc 1,721,038 0.98 2,022 Unilever plc 113,072 0.06 175,907 Vodafone Group plc 320,071 0.18
Total United Kingdom 6,774,235 3.88
UNITED STATES 5,700 Allstate Corp. 654,930 0.37 9,674 American Electric Power
Company Inc. 819,388 0.47 462 American Tower Corp. 110,446 0.06 4,026 Apple Inc. 491,776 0.28 17,240 AT&T Inc. 521,855 0.30 4,174 Automatic Data Processing Inc. 786,674 0.44 841 BlackRock Inc. 634,081 0.36 14,831 Bristol-Myers Squibb Company 936,281 0.53 2,546 Broadcom Inc. 1,180,478 0.68 4,663 Caterpillar Inc. 1,081,210 0.62 4,341 Chevron Corp. 454,893 0.26 18,741 Cisco Systems Inc. 969,097 0.55 3,636 CME Group Inc. 742,581 0.42 1,546 Coca Cola Company 81,490 0.05 19,136 Comcast Corp. 1,035,449 0.59 20,130 Conocophillips 1,066,286 0.62 876 Crown Castle International
Corp. 150,786 0.09 6,684 DuPont de Nemours Inc. 516,539 0.29 15,453 Ebay Inc. 946,342 0.54 6,158 Edison International 360,859 0.21 4,865 Eli Lilly & Company 908,879 0.52 3,581 Enterprise Products Partners
LP 78,854 0.05 7,670 Equity Lifestyle Properties Inc. 488,119 0.28 5,080 Fidelity National Information
Services Inc. 714,299 0.41 3,580 General Motors Company 205,707 0.12 4,562 Home Depot Inc. 1,392,551 0.80 762 IBM Corp. 101,544 0.06 1,051 IntercontinentalExchange Inc. 117,376 0.07 7,862 Johnson & Johnson 1,292,121 0.73 3,659 JPMorgan Chase & Company 557,010 0.32 3,545 KLA Corp. 1,171,268 0.67 11,264 Kontoor Brands Inc. 546,642 0.31 1,731 Las Vegas Sands Corp. 105,176 0.06 218 Lockheed Martin Corp. 80,551 0.05 1,020 Marsh & McLennan Companies
Inc. 124,236 0.07 1,309 Mastercard Inc. - A 466,069 0.27
Nominal Value Investment
Market Value
USD
% of Net Asset
Value
Transferable securities and money market instruments admitted to an official exchange listing (continued)
Equities (continued)
SWEDEN 3,253 Atlas Copco AB 169,624 0.10 11,452 Sandvik AB 313,488 0.18 12,203 Volvo AB - B 309,266 0.17
Total Sweden 792,378 0.45
SWITZERLAND 1,215 Nestle SA - Reg 135,991 0.08 1,505 Novartis AG - Reg 129,160 0.07 39 Partners Group Holding AG
- Reg 50,016 0.03 19 SGS SA - Reg 54,124 0.03 5,707 TE Connectivity Limited 736,830 0.43 442 Vat Group AG 124,360 0.07
Total Switzerland 1,230,481 0.71
TAIWAN 35,000 Chroma ATE Inc. 231,223 0.13 13,000 Delta Electronics Inc. 131,216 0.07 4,000 Eclat Textile Company Limited 67,290 0.04 72,000 Hon Hai Precision Industry
Company Limited 312,900 0.18 12,000 MediaTek Inc. 407,527 0.23 59,000 Powertech Technology Inc. 218,150 0.12 65,000 Taiwan Semiconductor
Company 4.00% 01/03/2049 19,092 0.01 USD 44,000 Indiana Michigan Power
Company 3.75% 01/07/2047 46,241 0.03 USD 24,000 Transcontinental Gas Pipe Line
Company 3.25% 15/05/2030 25,274 0.01
Total United States 267,565 0.15
Total Bonds 267,565 0.15
Supranationals, Governments and Local Public Authorities, Debt Instruments
SUPRANATIONALAUD 70,000 International Finance Corp.
1.50% 15/04/2035 46,984 0.03
Total Supranational 46,984 0.03
UNITED STATESUSD 180,000 Fannie Mae 5.63% 15/07/2037 266,402 0.15
Total United States 266,402 0.15
Total Supranationals, Governments and Local Public Authorities, Debt Instruments 313,386 0.18
Total Transferable securities and money market instruments dealt in on another regulated market and recently issued transferable securities 580,951 0.33
Nominal Value Investment
Market Value
USD
% of Net Asset
Value
Transferable securities and money market instruments admitted to an official exchange listing (continued)
Equities (continued)
UNITED STATES (continued) 1,195 Maxim Integrated Products Inc. 109,187 0.06 11,269 Merck & Company Inc. 868,727 0.50 13,182 Metlife Inc. 801,333 0.45 15,786 Microsoft Corp. 3,721,864 2.13 8,018 Moelis & Company - A 440,028 0.25 10,005 Morgan Stanley 776,988 0.45 11,860 NextEra Energy Inc. 896,735 0.50 30,800 Nortonlifelock Inc. 654,808 0.37 7,247 PepsiCo Inc. 1,025,087 0.58 13,378 Philip Morris International Inc. 1,187,164 0.68 8,775 Procter & Gamble Company 1,188,398 0.68 8,037 Prologis Inc. 851,921 0.48 773 Quest Diagnostics Inc. 99,207 0.05 9,797 Raytheon Technologies Corp. 757,014 0.43 1,290 SBA Communications 358,040 0.20 1,209 Service Corp. International 61,719 0.04 557 Stanley Works 111,216 0.06 7,945 Starbucks Corp. 868,150 0.50 13,821 Store Capital Corp. 463,004 0.26 4,072 Target Corp. 806,541 0.46 5,095 Texas Instruments Inc. 962,904 0.55 10,623 Tjx Companies Inc. 702,711 0.40 13,978 Truist Financial Corp. 815,197 0.46 4,860 Union Pacific Corp. 1,071,193 0.61 6,276 United Parcel Service Inc. 1,066,857 0.61 5,985 Valero Energy Corp. 428,526 0.24 17,595 Verizon Communications Inc. 1,023,149 0.59 4,532 Virtu Financial Inc. 140,719 0.08 6,163 Voya Financial Inc. 392,213 0.22 2,422 Wells Fargo & Company 94,628 0.05 10,540 Xcel Energy Inc. 701,015 0.40
Total United States 45,338,086 25.86
Total Equities 81,127,981 46.30
Total Transferable securities and money market instruments admitted to an official exchange listing 149,831,518 85.50
Threadneedle (Lux) - Global Multi Asset Income
178
The accompanying notes form an integral part of these financial statements.
Threadneedle (Lux) Annual Report and Audited Financial Statements March 2021
Portfolio Statement(continued)
Nominal Value Investment
Market Value
USD
% of Net Asset
Value
Other transferable securities and money market instruments (continued)
Bonds (continued)
UNITED STATES (continued)USD 32,000 Metropolitan Edison Company
4.30% 15/01/2029 35,403 0.02 USD 156,000 Metropolitan Life Global
Funding I 1.55% 07/01/2031 144,997 0.08 USD 17,000 New York Life Insurance
Company 4.45% 04/04/2069 20,188 0.01 USD 86,000 Northwestern Mutual Life
Insurance Company 3.45% 30/03/2051 86,244 0.05
USD 8,000 Northwestern Mutual Life Insurance Company 3.63% 30/09/2059 8,096 0.00
USD 18,000 Northwestern Mutual Life Insurance Company 3.85% 30/09/2047 19,325 0.01
USD 11,000 Teachers Insurance & Annuity Association America 4.90% 15/09/2044 13,488 0.01
USD 75,000 Teachers Insurance & Annuity Association of America 4.27% 15/05/2047 84,607 0.05
Total United States 678,469 0.39
Total Bonds 2,426,693 1.40
Total Other transferable securities and money market instruments 2,426,693 1.40
Undertakings for collective investments in transferable securities
Funds
LUXEMBOURG 411,140 Threadneedle (Lux) - Asian
Equity Income XUP** 6,415,103 3.67 585,537 Threadneedle (Lux) - Global
Group Company Limited 34,372 0.37 1,284 Kuaishou Technology 44,592 0.47 912 Netease.com - ADR 94,173 1.00 1,823 Pagseguro Digital Limited 84,405 0.90 692 Sea Limited 154,475 1.64 4,500 Shenzhou International Group
Holdings Limited 93,247 0.99 1,186 StoneCo Limited - A 72,607 0.77 2,079 Tal Education Group - ADR 111,954 1.19 8,700 Tencent Holdings Limited 682,617 7.25 17,000 Wuxi Biologics Cayman Inc. 212,870 2.26 2,454 Xp Inc. - A 92,442 0.98 3,878 XPeng Inc. 141,586 1.50
Total Cayman Islands 2,565,899 27.26
CHINA 27,000 Country Garden Services
Holdings 273,664 2.91 2,900 Glodon Company Limited - A 29,344 0.31 2,484 JD.com Inc. - ADR 209,476 2.23 19,500 Li Ning Company Limited 126,664 1.35 4,400 WuXi AppTec Company Limited
- H 86,534 0.92 299 Zai Lab Limited 39,896 0.42
Total China 765,578 8.14
CYPRUS 1,641 Ozon Holdings plc 92,011 0.98
Total Cyprus 92,011 0.98
Quantity Investment
Market Value
USD
% of Net Asset
Value
Transferable securities and money market instruments admitted to an official exchange listing (continued)
Equities (continued)
HONG KONG 10,200 AIA Group Limited 123,720 1.31 9,476 Techtronic Industries Company 162,108 1.72
Total Hong Kong 285,828 3.03
HUNGARY 2,998 OTP Bank plc 128,396 1.36
Total Hungary 128,396 1.36
INDIA 6,594 HDFC Bank Limited - ADR 512,288 5.45 13,524 ICICI Bank Limited - ADR 216,790 2.30 10,193 Infosys Technologies Limited
- ADR 190,814 2.03
Total India 919,892 9.78
INDONESIA 77,600 Bank Central Asia Tbk Pt 166,026 1.76 658,100 Bank Rakyat Indonesia 199,365 2.12
Total Indonesia 365,391 3.88
LUXEMBOURG 3,399 Allegro.eu SA 47,867 0.51 263 Globant SA 54,601 0.58
Total Luxembourg 102,468 1.09
NETHERLANDS 2,186 Yandex NV - A 140,035 1.49
Total Netherlands 140,035 1.49
REPUBLIC OF KOREA (SOUTH) 171 Kakao Corp. 75,245 0.80 471 Naver Corp. 156,896 1.67 171 Pearlabyss Corp. 46,552 0.49 118 Samsung Biologics Company
Transferable securities and money market instruments admitted to an official exchange listing (continued)
Equities (continued)
REPUBLIC OF KOREA (SOUTH) 697,910 Samsung Electronics Company
Limited 50,196,637 2.99
Total Republic of Korea (South) 50,196,637 2.99
SWITZERLAND 37,196 Lonza Group AG - Reg 20,883,354 1.25 149,038 Nestle SA - Reg 16,681,363 1.00 135,973 TE Connectivity Limited 17,555,474 1.05
Total Switzerland 55,120,191 3.30
TAIWAN 1,471,000 Taiwan Semiconductor
Manufacturing Company Limited 30,262,278 1.81
Total Taiwan 30,262,278 1.81
UNITED KINGDOM 119,240 Linde plc 33,480,108 1.99
Total United Kingdom 33,480,108 1.99
UNITED STATES 264,542 Abbott Laboratories 31,702,714 1.89 255,568 Activision Blizzard Inc. 23,767,824 1.42 188,120 Adobe Systems Inc. 89,426,604 5.33 47,948 Alphabet Inc. - A 98,893,709 5.90 36,934 Amazon.com Inc. 114,276,751 6.82 76,910 American Tower Corp. 18,386,105 1.10 53,629 Ansys Inc. 18,210,263 1.09 132,230 Cadence Design Systems Inc. 18,114,188 1.08 123,902 CME Group Inc. 25,304,505 1.51 567,966 Comcast Corp. 30,732,640 1.83 304,840 Edwards Lifesciences Corp. 25,496,818 1.52 112,237 Facebook Inc. - A 33,057,164 1.97 163,765 Fidelity National Information
Services Inc. 23,026,997 1.37 217,181 Intuit Inc. 83,193,354 4.96 57,224 Lam Research Corp. 34,062,014 2.03 249,264 Mastercard Inc. - A 88,750,447 5.29 4,930 Mercadolibre Inc. 7,257,650 0.43 545,387 Microsoft Corp. 128,585,893 7.67 58,139 Nvidia Corp. 31,042,156 1.85 166,449 Paypal Holdings Inc. 40,420,475 2.41 72,520 S&P Global Inc. 25,590,133 1.53 71,316 Stryker Corp. 17,371,151 1.04
Threadneedle (Lux) - Global Focus
182
Portfolio Statementas at March 31, 2021
The accompanying notes form an integral part of these financial statements.
Threadneedle (Lux) Annual Report and Audited Financial Statements March 2021
The accompanying notes form an integral part of these financial statements.
Threadneedle (Lux) - Global Focus
183
Threadneedle (Lux) Annual Report and Audited Financial Statements March 2021
Portfolio Statement(continued)
Quantity Investment
Market Value
USD
% of Net Asset
Value
Transferable securities and money market instruments admitted to an official exchange listing (continued)
Equities (continued)
UNITED STATES (continued) 159,790 Thermo Fisher Scientific Inc. 72,924,960 4.36 187,874 Transunion 16,908,660 1.01
Total United States 1,096,503,175 65.41
Total Equities 1,665,449,719 99.35
Total Transferable securities and money market instruments admitted to an official exchange listing 1,665,449,719 99.35
Undertakings for collective investments in transferable securities
Funds
IRELAND 7,003,216 BlackRock ICS US Dollar
Liquidity Fund 7,003,216 0.42
Total Ireland 7,003,216 0.42
Total Funds 7,003,216 0.42
Total Undertakings for collective investments in transferable securities 7,003,216 0.42
Total value of investments 1,672,452,935 99.77
(Total cost: USD 1,285,533,904)
Quantity Investment
Market Value
USD
% of Net Asset
Value
Transferable securities and money market instruments admitted to an official exchange listing
Equities
BERMUDA 290,000 Alibaba Health Information
Technology Limited 820,634 0.48
Total Bermuda 820,634 0.48
BRAZIL 301,339 Azul SA 2,021,212 1.19 97,364 Banco BTG Pactual SA 1,674,498 0.98 191,211 BK Brasil Operacao e
Assessoria a Restaurantes SA 327,665 0.19 88,969 Localiza Rent a Car 941,720 0.55 139,343 Locaweb Servicos de Internet
SA 564,238 0.33 308,417 Magazine Luiza SA 1,106,215 0.65 45,572 Notre Dame Intermedica
Company Limited 2,363,990 1.39 134,960 Samsung Electronics Company
Limited 9,706,894 5.70 2,666 Samsung Sdi Company Limited 1,554,730 0.91 36,252 SK hynix Inc. 4,244,227 2.50
Total Republic of Korea (South) 23,323,786 13.70
RUSSIAN FEDERATION 31,672 Lukoil PJSC - ADR 2,560,998 1.51 174,635 Sberbank of Russia PJSC - ADR 2,690,251 1.59
Total Russian Federation 5,251,249 3.10
SOUTH AFRICA 10,152 Capitec Bank Holdings Limited 976,160 0.57 9,953 Naspers Limited 2,380,503 1.40
Total South Africa 3,356,663 1.97
TAIWAN 137,000 MediaTek Inc. 4,652,594 2.74 106,653 Taiwan Semiconductor
Manufacturing Company Limited - ADR 12,614,917 7.41
Total Taiwan 17,267,511 10.15
THAILAND 1,015,300 Muangthai Capital pcl 2,298,638 1.36
Total Thailand 2,298,638 1.36
UNITED STATES 1,217 Mercadolibre Inc. 1,791,594 1.05
Total United States 1,791,594 1.05
Quantity Investment
Market Value
USD
% of Net Asset
Value
Transferable securities and money market instruments admitted to an official exchange listing (continued)
Equities (continued)
INDIA (continued) 72,325 Cholamandalam Investment
and Finance Company Limited 552,759 0.32 23,437 Eicher Motors Limited 834,691 0.49 30,978 HDFC Bank Limited - ADR 2,406,681 1.41 114,605 Hdfc Standard Life Insurance 1,091,260 0.64 12,159 Jubilant Foodworks Limited 484,087 0.28 95,998 Kotak Mahindra Bank Limited 2,301,627 1.35 127,159 Reliance Industries Limited 3,483,699 2.05 56,052 Tech Mahindra Limited 760,069 0.45
Total India 15,709,943 9.23
INDONESIA 6,637,700 ACE Hardware Indonesia 696,934 0.41 1,201,300 Bank Central Asia Tbk Pt 2,570,198 1.51 8,352,000 Bank Rakyat Indonesia 2,530,155 1.49 3,514,500 Bank Tabungan Pensiunan
Nasional Syariah Tbk Pt 842,067 0.50
Total Indonesia 6,639,354 3.91
KAZAKHSTAN 6,794 JSC Kaspi.kz. 482,374 0.28
Total Kazakhstan 482,374 0.28
LUXEMBOURG 26,529 Allegro.eu SA 373,597 0.22 3,689 Globant SA 765,873 0.45
Total Luxembourg 1,139,470 0.67
NETHERLANDS 33,179 Yandex NV - A 2,125,447 1.25
Total Netherlands 2,125,447 1.25
PHILIPPINES 2,095,300 Ayala Land Inc. 1,482,871 0.87 275,230 BDO Unibank Inc. 578,398 0.34
Total Philippines 2,061,269 1.21
POLAND 19,603 Dino Polska SA 1,294,612 0.76
Total Poland 1,294,612 0.76
Threadneedle (Lux) - Global Emerging Market Equities
186
The accompanying notes form an integral part of these financial statements.
Threadneedle (Lux) Annual Report and Audited Financial Statements March 2021
Portfolio Statement(continued)
Quantity Investment
Market Value
USD
% of Net Asset
Value
Transferable securities and money market instruments admitted to an official exchange listing (continued)
Equities (continued)
VIRGIN ISLANDS (BRITISH) 223,974 Fix Price Group Limited 2,185,986 1.29
Total Virgin Islands (British) 2,185,986 1.29
Total Equities 168,005,403 98.77
Total Transferable securities and money market instruments admitted to an official exchange listing 168,005,403 98.77
Transferable securities and money market instruments dealt in on another regulated market and recently issued transferable securities
Equities
RUSSIAN FEDERATION 597,602 Detsky Mir PJSC 1,128,774 0.66
Total Russian Federation 1,128,774 0.66
Total Equities 1,128,774 0.66
Total Transferable securities and money market instruments dealt in on another regulated market and recently issued transferable securities 1,128,774 0.66
Total value of investments 169,134,177 99.43
(Total cost: USD 115,131,997)
Quantity Investment
Market Value
USD
% of Net Asset
Value
Transferable securities and money market instruments admitted to an official exchange listing
Equities
AUSTRALIA 76,330 Carsales.Com Limited 1,035,415 0.47
Total Australia 1,035,415 0.47
CANADA 75,324 Brookfield Asset Management
Inc. 3,350,131 1.52 151,992 Manulife Financial Corp. 3,268,763 1.48 19,017 Ritchie Bros Auctioneers Inc. 1,113,445 0.50 146,228 Suncor Energy Inc. 3,056,379 1.39
REPUBLIC OF KOREA (SOUTH) 77,762 Samsung Electronics Company
Limited 5,592,971 2.55
Total Republic of Korea (South) 5,592,971 2.55
SINGAPORE 268,500 DBS Group Holdings Limited 5,753,285 2.61
Total Singapore 5,753,285 2.61
SPAIN 98,890 Inditex SA 3,265,934 1.48
Total Spain 3,265,934 1.48
SWEDEN 78,515 Sandvik AB 2,149,278 0.97
Total Sweden 2,149,278 0.97
SWITZERLAND 43,133 Novartis AG - Reg 3,701,698 1.68 543 SGS SA - Reg 1,546,813 0.70 19,882 TE Connectivity Limited 2,566,965 1.16
Total Switzerland 7,815,476 3.54
The accompanying notes form an integral part of these financial statements.
Threadneedle (Lux) - Global Equity Income
187
Portfolio Statementas at March 31, 2021
Threadneedle (Lux) Annual Report and Audited Financial Statements March 2021
Threadneedle (Lux) - Global Equity Income
188
The accompanying notes form an integral part of these financial statements.
Threadneedle (Lux) Annual Report and Audited Financial Statements March 2021
Portfolio Statement(continued)
Quantity Investment
Market Value
USD
% of Net Asset
Value
Transferable securities and money market instruments admitted to an official exchange listing (continued)
Equities (continued)
UNITED STATES (continued) 33,369 Service Corp. International 1,703,487 0.77 15,364 Stanley Works 3,067,729 1.39 8,748 United Parcel Service Inc. 1,487,073 0.67 36,627 Valero Energy Corp. 2,622,493 1.19 67,076 Wells Fargo & Company 2,620,659 1.19 51,869 Xcel Energy Inc. 3,449,808 1.56
Total United States 90,627,699 41.10
Total Equities 215,284,252 97.59
Total Transferable securities and money market instruments admitted to an official exchange listing 215,284,252 97.59
Undertakings for collective investments in transferable securities
Funds
IRELAND 3,270 BlackRock ICS US Dollar
Liquidity Fund 3,270 0.00
Total Ireland 3,270 0.00
Total Funds 3,270 0.00
Total Undertakings for collective investments in transferable securities 3,270 0.00
Total value of investments 215,287,522 97.59
(Total cost: USD 184,359,634)
Quantity Investment
Market Value
USD
% of Net Asset
Value
Transferable securities and money market instruments admitted to an official exchange listing (continued)
Equities (continued)
TAIWAN 111,000 Eclat Textile Company Limited 1,867,304 0.85 62,000 MediaTek Inc. 2,105,554 0.95 183,000 Taiwan Semiconductor
Manufacturing Company Limited 3,764,784 1.71
Total Taiwan 7,737,642 3.51
UNITED KINGDOM 98,173 Anglo American plc 3,850,146 1.75 393,133 BAE Systems plc 2,739,148 1.24 1,418,791 BT Group plc 3,030,219 1.37 93,936 Diageo plc 3,874,496 1.75 158,183 Glaxosmithkline plc 2,810,997 1.27 41,445 Reckitt Benckiser Group plc 3,715,665 1.68 21,081 Rio Tinto plc 1,614,243 0.73 54,536 Unilever plc 3,049,695 1.38
Total United Kingdom 24,684,609 11.17
UNITED STATES 30,858 Allstate Corp. 3,545,584 1.61 26,506 American Electric Power
Company Inc. 2,245,058 1.02 12,476 American Tower Corp. 2,982,513 1.35 16,715 Automatic Data Processing Inc. 3,150,277 1.43 75,243 Bristol-Myers Squibb Company 4,750,090 2.16 10,430 CME Group Inc. 2,130,119 0.97 43,155 Coca Cola Company 2,274,700 1.03 23,626 Crown Castle International
LP 2,185,331 0.99 26,994 Fidelity National Information
Services Inc. 3,795,626 1.72 99,947 General Motors Company 5,742,955 2.60 21,081 IBM Corp. 2,809,254 1.27 28,366 IntercontinentalExchange Inc. 3,167,915 1.43 47,515 Las Vegas Sands Corp. 2,887,011 1.31 5,975 Lockheed Martin Corp. 2,207,763 1.00 27,523 Marsh & McLennan Companies
Inc. 3,352,301 1.52 32,961 Maxim Integrated Products Inc. 3,011,647 1.37 35,456 Microsoft Corp. 8,359,461 3.79 36,098 NextEra Energy Inc. 2,729,370 1.24 14,284 PepsiCo Inc. 2,020,472 0.92 29,222 Philip Morris International Inc. 2,593,160 1.18 21,568 Quest Diagnostics Inc. 2,768,038 1.26
Quantity Investment
Market Value
USD
% of Net Asset
Value
Transferable securities and money market instruments admitted to an official exchange listing
JAPAN 16,200 Keyence Corp. 7,369,897 1.22 90,800 Rohm Company Limited 8,882,784 1.47 160,400 Sekisui Chemical Company
Limited 3,084,614 0.51 55,200 Sony Corp. 5,792,251 0.96 87,400 Yaskawa Electric Corp. 4,358,134 0.72
Total Japan 29,487,680 4.88
NETHERLANDS 28,879 Airbus SE 3,276,711 0.54
Total Netherlands 3,276,711 0.54
REPUBLIC OF KOREA (SOUTH) 230,759 Samsung Electronics Company
Limited 16,597,162 2.73 7,161 Samsung Sdi Company Limited 4,176,076 0.69
Total Republic of Korea (South) 20,773,238 3.42
SWITZERLAND 66,515 Nestle SA - Reg 7,444,818 1.23 22,610 Roche Holding AG 7,338,071 1.21 70,825 TE Connectivity Limited 9,144,216 1.51
Total Switzerland 23,927,105 3.95
TAIWAN 476,000 Taiwan Semiconductor
Manufacturing Company Limited 9,792,552 1.62
Total Taiwan 9,792,552 1.62
UNITED KINGDOM 175,666 Diageo plc 7,245,543 1.20 115,424 Reckitt Benckiser Group plc 10,348,097 1.71
Total United Kingdom 17,593,640 2.91
The accompanying notes form an integral part of these financial statements.
Threadneedle (Lux) - Global Select
189
Portfolio Statementas at March 31, 2021
Threadneedle (Lux) Annual Report and Audited Financial Statements March 2021
Threadneedle (Lux) - Global Select
190
The accompanying notes form an integral part of these financial statements.
Threadneedle (Lux) Annual Report and Audited Financial Statements March 2021
Portfolio Statement(continued)
Quantity Investment
Market Value
USD
% of Net Asset
Value
Undertakings for collective investments in transferable securities
Funds
IRELAND 3,098,365 BlackRock ICS US Dollar
Liquidity Fund 3,098,365 0.51
Total Ireland 3,098,365 0.51
Total Funds 3,098,365 0.51
Total Undertakings for collective investments in transferable securities 3,098,365 0.51
Total value of investments 603,656,105 99.63
(Total cost: USD 443,244,354)
Quantity Investment
Market Value
USD
% of Net Asset
Value
Transferable securities and money market instruments admitted to an official exchange listing (continued)
Equities (continued)
UNITED STATES 50,421 Abbott Laboratories 6,042,453 1.00 96,879 Activision Blizzard Inc. 9,009,747 1.49 30,024 Adobe Systems Inc. 14,272,509 2.36 16,660 Alphabet Inc. - A 34,361,583 5.67 8,748 Amazon.com Inc. 27,067,012 4.47 27,190 American Tower Corp. 6,500,041 1.07 9,968 Autodesk Inc. 2,762,631 0.46 152,219 Centene Corp. 9,728,316 1.61 45,115 CME Group Inc. 9,213,836 1.52 216,876 Comcast Corp. 11,735,161 1.94 14,097 Cooper Companies Inc. 5,414,517 0.89 30,530 Ecolab Inc. 6,535,557 1.08 70,823 Edwards Lifesciences Corp. 5,923,636 0.98 58,599 Electronic Arts Inc. 7,932,547 1.31 11,597 Equinix Inc. 7,881,206 1.30 56,917 Facebook Inc. - A 16,763,764 2.77 71,910 Fidelity National Information
Services Inc. 10,111,265 1.67 115,160 General Motors Company 6,617,094 1.09 24,050 Intuit Inc. 9,212,593 1.52 62,024 JPMorgan Chase & Company 9,441,914 1.56 17,166 Lam Research Corp. 10,217,890 1.69 39,768 Mastercard Inc. - A 14,159,396 2.33 125,409 Microsoft Corp. 29,567,681 4.88 110,837 NextEra Energy Inc. 8,380,386 1.38 17,376 Nvidia Corp. 9,277,568 1.53 15,635 Paypal Holdings Inc. 3,796,803 0.63 15,871 S&P Global Inc. 5,600,400 0.92 128,672 Service Corp. International 6,568,706 1.08 32,126 Stryker Corp. 7,825,251 1.29 10,140 Thermo Fisher Scientific Inc. 4,627,693 0.76 86,588 T-Mobile USA Inc. 10,848,611 1.79 45,477 Transunion 4,092,930 0.68 106,904 Uber Technologies Inc. 5,827,337 0.96 48,789 Union Pacific Corp. 10,753,583 1.77 23,110 United Health Group Inc. 8,598,538 1.42 50,204 Visa Inc. - A 10,629,693 1.76 39,872 Walt Disney Company 7,357,181 1.21
Total United States 374,657,029 61.84
Total Equities 600,557,740 99.12
Total Transferable securities and money market instruments admitted to an official exchange listing 600,557,740 99.12
Quantity Investment
Market Value
EUR
% of Net Asset
Value
Transferable securities and money market instruments admitted to an official exchange listing
Equities
BERMUDA 659,095 Axalta Coating System Limited 16,588,131 0.79
Total Bermuda 16,588,131 0.79
CANADA 207,299 Cargojet Inc. 22,767,902 1.08 727,681 Ritchie Bros Auctioneers Inc. 36,250,935 1.73
JAPAN 422,800 Asahi Intecc Company Limited 9,929,414 0.47 108,500 Disco Corp. 29,031,759 1.38 546,500 Giken Limited 20,998,077 1.01 729,388 Grace Technology Inc. 16,197,302 0.77 2,206,600 Infomart Corp. 16,192,180 0.77 175,000 IR Japan Holdings Limited 18,015,995 0.85 193,700 Jtower Inc. 12,782,013 0.61 169,400 Lasertec Corp. 18,939,514 0.90 386,300 Menicon Company Limited 19,423,464 0.92 505,100 Milbon Company Limited 23,607,765 1.12 633,772 Nihon M&A Center Inc. 14,605,908 0.69 630,700 Raksul Inc. 25,058,862 1.19 586,300 Shoei Company Limited 20,586,075 0.98 546,400 Square Enix Holdings Company
Limited 25,874,658 1.23 476,500 Zuken Inc. 10,368,689 0.49
Total Japan 281,611,675 13.38
NETHERLANDS 195,161 IMCD Group NV 23,126,578 1.09
Total Netherlands 23,126,578 1.09
SPAIN 922,952 Fluidra SA 22,473,881 1.07
Total Spain 22,473,881 1.07
SWEDEN 629,056 Avanza Bank Holding AB 16,665,557 0.79 267,209 Karnov Group AB 1,361,577 0.06
Total Sweden 18,027,134 0.85
SWITZERLAND 3,668 Belimo Holding AG - Reg 25,334,664 1.20 17,471 Inficon Holding AG 15,684,095 0.74 1,772,764 SIG Combibloc Group AG 35,034,308 1.66 53,910 Tecan Group AG - Reg 20,440,439 0.97 158,677 Vat Group AG 37,986,075 1.80
Total Switzerland 134,479,581 6.37
The accompanying notes form an integral part of these financial statements.
Threadneedle (Lux) - Global Smaller Companies
191
Portfolio Statementas at March 31, 2021
Threadneedle (Lux) Annual Report and Audited Financial Statements March 2021
Threadneedle (Lux) - Global Smaller Companies
192
The accompanying notes form an integral part of these financial statements.
Threadneedle (Lux) Annual Report and Audited Financial Statements March 2021
Portfolio Statement(continued)
Quantity Investment
Market Value
EUR
% of Net Asset
Value
Transferable securities and money market instruments admitted to an official exchange listing (continued)
Equities (continued)
UNITED STATES (continued) 406,569 Simpson Manufacturing
Company Inc. 35,883,096 1.70 160,026 SiteOne Landscape Supply Inc. 23,247,545 1.10 197,724 SiTime Corp. 16,587,753 0.79 383,204 Sps Commerce Inc. 32,379,809 1.54 281,522 TechTarget Inc. 16,635,499 0.78 671,275 Terminix Global Holdings Inc. 27,226,818 1.30 81,162 Watsco Inc. 18,006,459 0.85 60,512 WD-40 Company 15,764,115 0.75 1,597,831 WillScot Mobile Mini Holdings
Corp. 37,726,377 1.78 385,862 Workiva Inc. 28,976,585 1.37
Total United States 1,075,739,223 51.00
Total Equities 2,082,650,318 98.77
Total Transferable securities and money market instruments admitted to an official exchange listing 2,082,650,318 98.77
Undertakings for collective investments in transferable securities
Funds
IRELAND 29,057,266 BlackRock ICS US Dollar
Liquidity Fund 24,723,276 1.17
Total Ireland 24,723,276 1.17
Total Funds 24,723,276 1.17
Total Undertakings for collective investments in transferable securities 24,723,276 1.17
Total value of investments 2,107,373,594 99.94
(Total cost: EUR 1,814,307,143)
Quantity Investment
Market Value
EUR
% of Net Asset
Value
Transferable securities and money market instruments admitted to an official exchange listing (continued)
Equities (continued)
UNITED KINGDOM 1,865,440 Abcam plc 30,461,011 1.45 1,600,731 Big Yellow Group plc 20,952,176 0.99 201,428 Games Workshop Group plc 23,563,134 1.12 526,602 Genus plc 30,031,424 1.42 284,979 Renishaw plc 21,444,049 1.02 1,711,387 RWS Holdings plc 12,234,928 0.58 1,464,823 St James’s Place plc 21,907,382 1.04 1,917,606 Watches of Switzerland Group
plc 14,879,788 0.71
Total United Kingdom 175,473,892 8.33
UNITED STATES 333,779 Aaon Inc. 19,882,471 0.94 436,667 Advanced Drainage Systems 38,413,172 1.82 761,469 Altair Engineering Inc. 40,538,683 1.93 469,549 Armstrong World Industries
Inc. 35,992,230 1.71 308,731 Aspen Technology Inc. 37,912,996 1.80 315,471 Blackline Inc. 29,096,449 1.38 636,898 Bruker Corp. 34,833,493 1.65 285,618 Cardlytics Inc. 26,658,976 1.26 618,300 Casella Waste Systems Inc. - A 33,442,807 1.58 466,827 Certara Inc. 10,843,510 0.51 172,552 Conmed Corp. 19,172,608 0.91 375,390 Dermtech Inc. 16,222,291 0.77 676,912 Duck Creek Technologies Inc. 25,998,305 1.23 537,957 Envestnet Inc. 33,061,035 1.57 910,003 Evo Payments Inc. 21,307,992 1.01 398,386 Exponent Inc. 33,032,175 1.57 211,993 Floor & Decor Holdings Inc. - A 17,222,065 0.81 104,447 Freshpet Inc. 14,113,186 0.67 314,210 Graco Inc. 19,147,214 0.91 711,399 Grocery Outlet Holding Corp. 22,329,200 1.06 447,761 Hamilton Lane Inc. 33,739,228 1.61 736,814 Hayward Holdings Inc. 10,582,337 0.50 288,667 Impinj Inc. 13,967,917 0.66 585,508 Inter Parfums Inc. 35,335,729 1.68 674,163 Leslie’s Inc. 14,047,692 0.67 947,314 Levi Strauss & Company 19,271,912 0.91 202,145 Live Oak Bancshares Inc. 11,779,895 0.56 277,691 MSA Safety Inc. 35,445,592 1.68 120,178 Novanta Inc. 13,486,154 0.64 269,004 Power Integrations Inc. 18,649,235 0.88 981,332 Ranpak Holdings Corp. 16,749,358 0.79 192,283 Schrodinger Inc./United States 12,481,298 0.59 492,928 Service Corp. International 21,410,682 1.02 532,221 Shift4 Payments Inc. 37,137,280 1.76
Quantity Investment
Market Value
USD
% of Net Asset
Value
Transferable securities and money market instruments admitted to an official exchange listing
SWITZERLAND 106,943 TE Connectivity Limited 13,807,410 1.23
Total Switzerland 13,807,410 1.23
UNITED STATES 171,669 Abbott Laboratories 20,572,813 1.84 44,842 Adobe Systems Inc. 21,316,542 1.90 88,517 Albemarle Corp. 12,933,219 1.15 131,386 Allstate Corp. 15,096,251 1.35 29,623 Alphabet Inc. - A 61,098,030 5.45 21,360 Amazon.com Inc. 66,089,548 5.90 251,515 Array Technologies Inc. 7,500,177 0.67 46,894 Bill.com Holdings Inc. 6,823,077 0.61 30,524 BlackRock Inc. 23,013,875 2.05 297,885 Bristol-Myers Squibb
Company 18,805,480 1.67 67,317 Broadcom Inc. 31,212,200 2.79 47,851 Caterpillar Inc. 11,095,211 0.99 345,054 Centene Corp. 22,052,401 1.97 64,537 Charles River Laboratories
International Inc. 18,704,759 1.67 567,641 Cisco Systems Inc. 29,352,716 2.62 469,078 Coca Cola Company 24,725,101 2.21 450,706 Comcast Corp. 24,387,702 2.18 160,214 CVS Health Corp. 12,052,899 1.08 161,285 DuPont de Nemours Inc. 12,464,105 1.11 98,739 Eli Lilly & Company 18,446,420 1.65 104,915 Fidelity National Information
Services Inc. 14,752,098 1.32 107,035 FMC Corp. 11,839,141 1.06 249,189 General Motors Company 14,318,400 1.28 75,616 Home Depot Inc. 23,081,784 2.06 385,002 Howmet Aerospace Inc. 12,370,114 1.10 250,544 Ingersoll Rand Inc. 12,329,271 1.10 221,909 IntercontinentalExchange Inc. 24,782,797 2.22 30,046 Lam Research Corp. 17,884,581 1.60 178,292 Lyft Inc. - A 11,264,489 1.01 93,966 Mastercard Inc. - A 33,456,594 2.99 133,828 Match Group Inc. 18,385,291 1.64 83,283 Microchip Technology Inc. 12,927,187 1.15 342,259 Microsoft Corp. 80,694,405 7.20 537,670 Morgan Stanley 41,755,453 3.73 130,245 NextEra Energy Inc. 9,847,824 0.88
Quantity Investment
Market Value
USD
% of Net Asset
Value
Transferable securities and money market instruments admitted to an official exchange listing (continued)
Equities (continued)
UNITED STATES (continued) 55,720 Novavax Inc. 10,102,593 0.90 60,471 Nvidia Corp. 32,287,282 2.88 117,237 PepsiCo Inc. 16,583,174 1.48 162,490 Renewable Energy Group Inc. 10,730,840 0.96 118,057 Republic Services Inc. 11,728,963 1.05 144,844 State Street Corp. 12,168,344 1.09 10,721 Svb Financial Group 5,292,529 0.47 57,570 Take-Two Interactive
Software Inc. 10,172,619 0.91 148,830 Target Corp. 29,478,759 2.63 44,707 Thermo Fisher Scientific Inc. 20,403,381 1.82 165,023 Tjx Companies Inc. 10,916,271 0.97 88,322 T-Mobile USA Inc. 11,065,863 0.99 157,020 Trimble Navigation Limited 12,214,586 1.09 512,328 Under Armour Inc. 11,353,188 1.01 104,844 Union Pacific Corp. 23,108,666 2.06 117,044 Virtu Financial Inc. 3,634,216 0.32 411,489 Voya Financial Inc. 26,187,160 2.34
Total United States 1,054,860,389 94.17
Total Equities 1,108,091,292 98.92
Total Transferable securities and money market instruments admitted to an official exchange listing 1,108,091,292 98.92
Undertakings for collective investments in transferable securities
Funds
IRELAND 7,586 BlackRock ICS US Dollar
Liquidity Fund 7,586 0.00
Total Ireland 7,586 0.00
Total Funds 7,586 0.00
Total Undertakings for collective investments in transferable securities 7,586 0.00
Total value of investments 1,108,098,878 98.92
(Total cost: USD 808,583,665)
The accompanying notes form an integral part of these financial statements.
Threadneedle (Lux) - American
193
Portfolio Statementas at March 31, 2021
Threadneedle (Lux) Annual Report and Audited Financial Statements March 2021
Quantity Investment
Market Value
USD
% of Net Asset
Value
Transferable securities and money market instruments admitted to an official exchange listing
Equities
BERMUDA 52,375 Marvell Technology Group
Limited 2,565,328 0.58
Total Bermuda 2,565,328 0.58
SWITZERLAND 19,694 TE Connectivity Limited 2,542,692 0.58
Total Switzerland 2,542,692 0.58
UNITED STATES 41,465 Adobe Systems Inc. 19,711,216 4.49 17,806 Alphabet Inc. - A 36,725,231 8.38 9,129 Amazon.com Inc. 28,245,856 6.44 35,333 Analog Devices Inc. 5,479,442 1.25 29,360 Ansys Inc. 9,969,482 2.27 109,049 Apple Inc. 13,320,335 3.04 19,004 Autodesk Inc. 5,266,959 1.20 259,337 Bank of America Corp. 10,033,749 2.29 119,190 Berkshire Hathaway Inc. 30,449,469 6.94 69,053 BioMarin Pharmaceuticals Inc. 5,214,192 1.19 72,386 Bloom Energy Corp. 1,958,041 0.45 2,384 Booking Holdings Inc. 5,554,339 1.27 70,174 Centene Corp. 4,484,820 1.02 6,279 Charter Communications
Inc. - A 3,874,269 0.88 239,345 Comcast Corp. 12,950,958 2.95 60,876 CVS Health Corp. 4,579,701 1.04 104,788 Edwards Lifesciences Corp. 8,764,468 2.00 23,497 Eli Lilly & Company 4,389,710 1.00 73,988 Facebook Inc. - A 21,791,686 4.97 20,221 Fiserv Inc. 2,407,108 0.55 5,208 Heico Corp. 655,166 0.15 23,827 Intuit Inc. 9,127,171 2.08 59,583 JPMorgan Chase & Company 9,070,320 2.07 15,799 Lam Research Corp. 9,404,196 2.14 63,502 Las Vegas Sands Corp. 3,858,382 0.88 49,358 Mastercard Inc. - A 17,573,916 4.01 56,140 Microchip Technology Inc. 8,714,051 1.99 164,196 Microsoft Corp. 38,712,490 8.82 50,761 NextEra Energy Inc. 3,838,039 0.88 41,663 Nike Inc. 5,536,596 1.26 48,223 Norfolk Southern Corp. 12,948,840 2.95 135,001 Nutanix Inc. - A 3,585,627 0.82 9,911 Nvidia Corp. 5,291,780 1.21 37,230 Paypal Holdings Inc. 9,040,933 2.06 30,311 PepsiCo Inc. 4,287,491 0.98 20,099 Square Inc. - A 4,563,478 1.04 9,604 Thermo Fisher Scientific Inc. 4,383,074 1.00
Quantity Investment
Market Value
USD
% of Net Asset
Value
Transferable securities and money market instruments admitted to an official exchange listing (continued)
Equities (continued)
UNITED STATES (continued) 167,988 Uber Technologies Inc. 9,157,026 2.09 20,635 United Health Group Inc. 7,677,665 1.75 32,625 Vertex Pharmaceuticals Inc. 7,010,786 1.60 63,755 Visa Inc. - A 13,498,846 3.08 20,394 Walt Disney Company 3,763,101 0.86
Total United States 426,870,005 97.34
Total Equities 431,978,025 98.50
Total Transferable securities and money market instruments admitted to an official exchange listing 431,978,025 98.50
Total value of investments 431,978,025 98.50
(Total cost: USD 295,894,831)
Threadneedle (Lux) - American Select
194
Portfolio Statementas at March 31, 2021
The accompanying notes form an integral part of these financial statements.
Threadneedle (Lux) Annual Report and Audited Financial Statements March 2021
Quantity Investment
Market Value
USD
% of Net Asset
Value
Transferable securities and money market instruments admitted to an official exchange listing
BERMUDA 93,155 Axalta Coating System Limited 2,755,525 0.87 138,113 Essent Group Limited 6,558,986 2.07
Total Bermuda 9,314,511 2.94
CANADA 77,924 Canada Goose Holdings Inc. 3,058,517 0.96 102,106 Gildan Activewear Inc. 3,130,570 0.99 46,574 Masonite International Corp. 5,367,188 1.69 46,547 Ritchie Bros Auctioneers Inc. 2,725,327 0.86
Total Canada 14,281,602 4.50
UNITED STATES 55,597 Acushnet Holdings Corp. 2,297,824 0.72 30,327 Agco Corp. 4,356,474 1.37 93,806 Array Technologies Inc. 2,797,295 0.88 181,100 Avaya Holdings Corp. 5,076,233 1.61 200,918 Avista Corp. 9,593,835 3.03 123,165 BellRing Brands Inc. 2,907,926 0.92 9,808 Beyond Meat Inc. 1,276,217 0.40 15,763 Bill.com Holdings Inc. 2,293,517 0.72 76,418 Bloom Energy Corp. 2,067,107 0.65 229,426 Carriage SE 8,073,500 2.54 102,433 Cohu Inc. 4,285,797 1.35 66,933 Conmed Corp. 8,740,781 2.76 15,753 Curtiss-Wright Corp. 1,868,306 0.59 163,147 Elf Beauty Inc. 4,377,234 1.38 57,263 Envestnet Inc. 4,136,106 1.31 272,471 Evo Payments Inc. 7,498,402 2.36 21,022 Fti Consulting Inc. 2,945,392 0.93 137,316 Houlihan Lokey Inc. 9,132,887 2.88 23,299 Icf International Inc. 2,036,333 0.64 119,334 Impinj Inc. 6,786,525 2.14 35,794 Insmed Inc. 1,219,144 0.38 52,253 Integer Holdings Corp. 4,812,501 1.52 35,776 ITT Inc. 3,252,396 1.03 169,891 KBR Inc. 6,522,115 2.06 608,629 Kindred Biosciences Inc. 3,024,886 0.95 106,456 Kontoor Brands Inc. 5,166,310 1.63 9,391 Lithia Motors Inc. 3,663,335 1.16 25,703 Live Oak Bancshares Inc. 1,760,398 0.56
Quantity Investment
Market Value
USD
% of Net Asset
Value
Transferable securities and money market instruments admitted to an official exchange listing (continued)
Equities (continued)
UNITED STATES (continued) 276,572 Livent Corp. 4,790,227 1.51 145,948 Luminex Corp. 4,655,741 1.47 48,921 Lyft Inc. - A 3,090,829 0.97 176,330 Matthews International Corp.
- A 6,973,852 2.20 43,158 Medpace Holdings Inc. 7,080,069 2.23 13,217 Mirati Therapeutics Inc. 2,264,072 0.71 152,642 Moelis & Company - A 8,376,993 2.64 24,636 MSA Safety Inc. 3,695,893 1.17 131,523 Natus Medical Inc. 3,368,304 1.06 3,061,163 Newpark Resources 9,612,052 3.03 21,946 Novavax Inc. 3,979,029 1.26 136,718 QTS Realty Trust Inc. - A 8,481,985 2.68 198,302 Quanex Building Products Corp. 5,201,461 1.64 38,659 Quanterix Corp. 2,260,392 0.71 237,308 Qurate Retail Inc. 2,790,742 0.88 6,455 Qurate Retail Inc. 656,151 0.21 118,998 Regis Corp. 1,494,615 0.47 52,731 Renewable Energy Group Inc. 3,482,355 1.10 54,924 Sage Therapeutics Inc. 4,111,061 1.30 236,356 Schnitzer Steel Industries Inc. 9,877,317 3.12 21,384 SiTime Corp. 2,108,462 0.67 172,742 Sunpower Corp. 5,778,220 1.82 76,906 TechTarget Inc. 5,341,121 1.69 93,042 Teradata Corp. 3,585,839 1.13 9,174 Topbuild Corp. 1,921,311 0.61 171,708 Under Armour Inc. 3,805,049 1.20 338,151 Virtu Financial Inc. 10,499,588 3.31 127,848 Vishay Intertechnology Inc. 3,078,580 0.97 110,676 Voya Financial Inc. 7,043,421 2.22 127,236 Wendy’s Company 2,577,801 0.81 238,030 WillScot Mobile Mini Holdings
Corp. 6,605,333 2.08 55,092 Wingstop Inc. 7,006,050 2.21
Total United States 277,562,691 87.55
Total Equities 304,958,724 96.19
Total Transferable securities and money market instruments admitted to an official exchange listing 304,958,724 96.19
The accompanying notes form an integral part of these financial statements.
Threadneedle (Lux) - American Smaller Companies
195
Portfolio Statementas at March 31, 2021
Threadneedle (Lux) Annual Report and Audited Financial Statements March 2021
Threadneedle (Lux) - American Smaller Companies
196
The accompanying notes form an integral part of these financial statements.
Threadneedle (Lux) Annual Report and Audited Financial Statements March 2021
Portfolio Statement(continued)
Quantity Investment
Market Value
USD
% of Net Asset
Value
Undertakings for collective investments in transferable securities
Funds
IRELAND 4,513,342 BlackRock ICS US Dollar
Liquidity Fund 4,513,342 1.42
Total Ireland 4,513,342 1.42
Total Funds 4,513,342 1.42
Total Undertakings for collective investments in transferable securities 4,513,342 1.42
Total value of investments 309,472,066 97.61
(Total cost: USD 229,390,129)
Quantity Investment
Market Value
USD
% of Net Asset
Value
Transferable securities and money market instruments admitted to an official exchange listing
Equities
AUSTRALIA 111,570 Amcor plc 1,307,801 0.70 110,581 Aristocrat Leisure Limited 2,893,095 1.54 222,170 Australia & New Zealand
Banking Group Limited 4,768,501 2.53 68,488 BHP Group Limited 2,363,024 1.26 4,271 CSL Limited 860,908 0.46 234,192 Lendlease Group 2,304,571 1.23 52,196 Macquarie Group Limited 6,075,769 3.23 20,620 Rio Tinto Limited 1,739,353 0.92
Total Australia 22,313,022 11.87
CAYMAN ISLANDS 50,859 Alibaba Group Holding Limited 11,531,261 6.13 89,600 Alibaba Group Holding Limited 2,535,476 1.35 49,392 Dada Nexus Limited 1,340,499 0.71 58,700 Kuaishou Technology 2,038,593 1.08 237,300 NetEase Inc. 4,828,731 2.58 202,000 Tencent Holdings Limited 15,849,296 8.43 84,500 Wuxi Biologics Cayman Inc. 1,058,087 0.56 54,661 XPeng Inc. 1,995,673 1.06
Total Cayman Islands 41,177,616 21.90
CHINA 1,333,250 A-Living Services Company
Limited - H 5,916,426 3.15 1,284,126 Beijing Thunisoft Corp. Limited 3,712,712 1.97 1,243,000 China Construction Bank Corp. 1,045,629 0.56 1,044,900 Foxconn Industrial Internet, 2,288,484 1.22 178,100 Gree Electric Appliances
Inc. - A 1,701,954 0.90 465,500 Ping An Insurance Group
Company of China Limited 5,541,468 2.94 3,273,000 Times Property Holdings
Limited 4,504,624 2.39 518,837 Venustech Group Inc. - A 2,638,782 1.40 770,000 Wuhu Sanqi Interactive
Entertainment 2,577,148 1.37
Total China 29,927,227 15.90
HONG KONG 306,400 AIA Group Limited 3,716,458 1.98 210,000 ASM Pacific Technology
Limited 2,675,485 1.42 271,000 Galaxy Entertainment Group
Limited 2,440,035 1.30 77,167 Hong Kong Exchanges and
Clearing Limited 4,540,008 2.42
Quantity Investment
Market Value
USD
% of Net Asset
Value
Transferable securities and money market instruments admitted to an official exchange listing (continued)
Equities (continued)
HONG KONG (continued) 258,000 Hua Hong Semiconductor
SWITZERLAND 72,907 TE Connectivity Limited 9,413,022 1.94
Total Switzerland 9,413,022 1.94
UNITED STATES 39,368 Abbott Laboratories 4,717,861 0.97 72,924 Activision Blizzard Inc. 6,781,933 1.40 11,390 Adobe Systems Inc. 5,414,464 1.12 146,117 AES Corp. 3,917,397 0.81 7,619 Air Products & Chemicals Inc. 2,143,529 0.44 4,592 Alphabet Inc. - A 9,471,092 1.96 5,203 Alphabet Inc. - C 10,763,082 2.22 6,990 Amazon.com Inc. 21,627,620 4.46 59,290 American Electric Power
Company Inc. 5,021,863 1.04 45,598 American Express Company 6,449,381 1.33 31,071 American Tower Corp. 7,427,833 1.53 8,597 Anthem Inc. 3,085,893 0.64 205,842 Apple Inc. 25,143,600 5.19 15,928 Autodesk Inc. 4,414,445 0.91 1,995 Autozone Inc. 2,801,579 0.58 215,130 Bank of America Corp. 8,323,379 1.71 28,507 Baxter International Inc. 2,404,280 0.50 38,460 Berkshire Hathaway Inc. 9,825,376 2.03 32,217 BioMarin Pharmaceuticals Inc. 2,432,706 0.50
Quantity Investment
Market Value
USD
% of Net Asset
Value
Transferable securities and money market instruments admitted to an official exchange listing (continued)
Equities (continued)
UNITED STATES (continued) 9,375 BlackRock Inc. 7,068,375 1.46 116,551 Carrier Global Corp. 4,920,783 1.02 62,343 Chevron Corp. 6,532,922 1.36 16,029 Cigna Corp. 3,874,851 0.80 62,123 Cisco Systems Inc. 3,212,380 0.66 75,036 Citigroup Inc. 5,458,869 1.13 252,934 Comcast Corp. 13,686,259 2.82 91,322 Corteva Inc. 4,257,432 0.88 46,442 CVS Health Corp. 3,493,832 0.72 20,925 Darden Restaurants Inc. 2,971,350 0.61 60,995 Dentsply Sirona Inc. 3,892,091 0.80 37,812 Dollar Tree Inc. 4,327,962 0.89 118,838 Ebay Inc. 7,277,639 1.50 25,473 Eli Lilly & Company 4,758,866 0.98 60,241 EOG Resources Inc. 4,369,280 0.90 34,993 Facebook Inc. - A 10,306,489 2.13 35,782 Fidelity National Information
Services Inc. 5,031,307 1.04 53,711 Fiserv Inc. 6,393,757 1.32 24,894 Honeywell International Inc. 5,403,741 1.12 46,171 International Flavors &
Fragrances Inc. 6,445,934 1.34 13,482 Intuit Inc. 5,164,415 1.07 58,707 Johnson & Johnson 9,648,495 2.00 47,990 JPMorgan Chase & Company 7,305,518 1.51 7,005 Lam Research Corp. 4,169,656 0.86 50,283 Lowe’s Companies Inc. 9,562,820 1.98 34,594 Mastercard Inc. - A 12,317,194 2.54 17,276 McDonald’s Corp. 3,872,243 0.80 118,324 Microsoft Corp. 27,897,250 5.75 70,135 Mondelez International Inc. 4,105,002 0.85 72,993 Morgan Stanley 5,668,636 1.17 66,103 Newmont Mining Corp. 3,984,028 0.82 32,553 Nutrien Limited 1,754,281 0.36 8,385 Nvidia Corp. 4,477,003 0.93 14,737 Palo Alto Networks Inc. 4,746,199 0.98 21,854 Paypal Holdings Inc. 5,307,025 1.10 75,614 Philip Morris International Inc. 6,709,986 1.39 174,261 Raytheon Technologies Corp. 13,465,147 2.78 2,582 Sherwin-Williams Company 1,905,542 0.39 32,920 Stanley Works 6,573,136 1.36 59,771 State Street Corp. 5,021,362 1.04 6,167 Stryker Corp. 1,502,158 0.31 63,640 Sysco Corp. 5,011,013 1.03 89,849 Tapestry Inc. 3,702,677 0.76 50,932 T-Mobile USA Inc. 6,381,270 1.32
The accompanying notes form an integral part of these financial statements.
Threadneedle (Lux) - US Contrarian Core Equities
201
Portfolio Statementas at March 31, 2021
Threadneedle (Lux) Annual Report and Audited Financial Statements March 2021
Threadneedle (Lux) - US Contrarian Core Equities
202
The accompanying notes form an integral part of these financial statements.
Threadneedle (Lux) Annual Report and Audited Financial Statements March 2021
Portfolio Statement(continued)
Quantity Investment
Market Value
USD
% of Net Asset
Value
Transferable securities and money market instruments admitted to an official exchange listing (continued)
Equities (continued)
UNITED STATES (continued) 113,994 Uber Technologies Inc. 6,213,813 1.28 3,383 Ulta Salon, Cosmetics &
Fragrance 1,045,922 0.22 59,713 Under Armour Inc. 1,323,240 0.27 38,453 Union Pacific Corp. 8,475,426 1.75 16,738 Vertex Pharmaceuticals Inc. 3,596,828 0.75 35,346 Walt Disney Company 6,522,044 1.35 64,277 Western Digital Corp. 4,290,490 0.89
Total United States 447,571,251 92.43
Total Equities 478,852,214 98.88
Total Transferable securities and money market instruments admitted to an official exchange listing 478,852,214 98.88
Total value of investments 478,852,214 98.88
(Total cost: USD 321,813,491)
Quantity Investment
Market Value
USD
% of Net Asset
Value
Transferable securities and money market instruments admitted to an official exchange listing
UNITED STATES 4,660 Abbott Laboratories 558,454 2.10 2,255 AbbVie Inc. 244,036 0.92 1,549 Activision Blizzard Inc. 144,057 0.54 752 Adobe Systems Inc. 357,478 1.35 1,743 Advanced Micro Devices Inc. 136,826 0.52 4,535 AES Corp. 121,583 0.46 4,094 Allstate Corp. 470,401 1.77 643 Alphabet Inc. - A 1,326,200 4.99 10,715 Altria Group Inc. 548,180 2.07 227 Amazon.com Inc. 702,356 2.64 12,645 Apple Inc. 1,544,587 5.82 415 Applied Materials Inc. 55,444 0.21 628 Arthur J Gallagher & Company 78,356 0.30 1,688 Autodesk Inc. 467,829 1.76 2,991 Best Buy Company Inc. 343,397 1.29 120 Biogen Idec Inc. 33,570 0.13 909 BioMarin Pharmaceuticals Inc. 68,639 0.26 675 BlackRock Inc. 508,923 1.92 8,390 Bristol-Myers Squibb Company 529,661 1.99 1,260 Broadcom Inc. 584,211 2.19 366 Cadence Design Systems Inc. 50,138 0.19 1,320 Cardinal Health Inc. 80,190 0.30 604 Chevron Corp. 63,293 0.24 11,925 Cisco Systems Inc. 616,642 2.32 7,460 Citigroup Inc. 542,715 2.05 10,540 Citizens Financial Group Inc. 465,341 1.75 769 Darden Restaurants Inc. 109,198 0.41 1,574 Deere & Company 588,897 2.22 725 Delta Air Lines Inc. 35,003 0.13 2,675 Dentsply Sirona Inc. 170,692 0.64 7,895 Dow Inc. 504,806 1.90 277 DTE Energy Company 36,880 0.14 4,650 EOG Resources Inc. 337,265 1.27 205 Equinix Inc. 139,316 0.52 1,265 Etsy Inc. 255,113 0.96 2,330 Exelon Corp. 101,914 0.38 3,373 Facebook Inc. - A 993,450 3.75 2,720 Fortinet Inc. 501,622 1.89 1,225 General Mills Inc. 75,117 0.28 1,872 HCA Healthcare Inc 352,572 1.33
Quantity Investment
Market Value
USD
% of Net Asset
Value
Transferable securities and money market instruments admitted to an official exchange listing (continued)
Equities (continued)
UNITED STATES (continued) 1,095 Hilton Worldwide Holdings Inc. 132,407 0.50 6,235 Hollyfrontier Corp. 223,088 0.84 300 Hologic Inc. 22,314 0.08 384 Home Depot Inc. 117,216 0.44 360 Humana Inc. 150,930 0.57 7,305 Intel Corp. 467,520 1.76 950 International Paper Company 51,367 0.19 5,795 Interpublic Group of Companies
Inc. 169,214 0.64 2,102 Johnson & Johnson 345,464 1.30 302 JPMorgan Chase & Company 45,973 0.17 530 Kimberly-Clark Corp. 73,697 0.28 3,790 Kinder Morgan Inc. 63,104 0.24 945 Kraft Heinz Company 37,800 0.14 11,485 Kroger Company 413,345 1.56 1,550 Lennar Corp. 156,907 0.59 2,330 Lowe’s Companies Inc. 443,119 1.67 1,807 Mastercard Inc. - A 643,383 2.42 315 McDonald’s Corp. 70,604 0.27 934 McKesson Corp. 182,167 0.69 362 Merck & Company Inc. 27,907 0.11 565 Metlife Inc. 34,346 0.13 5,790 Microsoft Corp. 1,365,109 5.14 3,175 Morgan Stanley 246,571 0.93 1,515 Newmont Mining Corp. 91,309 0.34 1,760 News Corp. - A 44,757 0.17 902 Norfolk Southern Corp. 242,205 0.91 4,050 Nov Inc. 55,566 0.21 8,130 NRG Energy Inc. 306,745 1.16 710 Nucor Corp. 56,992 0.21 869 Parker Hannifin Corp. 274,109 1.03 15,990 Pfizer Inc. 579,318 2.18 2,606 Philip Morris International Inc. 231,256 0.87 1,477 Procter & Gamble Company 200,030 0.75 158 Public Storage Inc. 38,988 0.15 6,740 Pulte Homes Inc. 353,445 1.33 3,085 Quanta Services Inc. 271,418 1.02 4,090 Regions Financial Corp. 84,499 0.32 1,290 Robert Half International Inc. 100,710 0.38 491 S&P Global Inc. 173,259 0.65 529 Snap-On Inc. 122,061 0.46 665 Southwest Airlines Company 40,605 0.15 1,512 T Rowe Price Group Inc. 259,459 0.98 2,240 Target Corp. 443,677 1.67 230 Tesla Motors Inc. 153,624 0.58 1,988 United Parcel Service Inc. 337,940 1.28
The accompanying notes form an integral part of these financial statements.
Threadneedle (Lux) - US Disciplined Core Equities
203
Portfolio Statementas at March 31, 2021
Threadneedle (Lux) Annual Report and Audited Financial Statements March 2021
Threadneedle (Lux) - US Disciplined Core Equities
204
The accompanying notes form an integral part of these financial statements.
Threadneedle (Lux) Annual Report and Audited Financial Statements March 2021
Portfolio Statement(continued)
Quantity Investment
Market Value
USD
% of Net Asset
Value
Transferable securities and money market instruments admitted to an official exchange listing (continued)
Equities (continued)
UNITED STATES (continued) 1,032 VeriSign Inc. 205,120 0.77 4,280 Verizon Communications Inc. 248,882 0.94 674 Vertex Pharmaceuticals Inc. 144,835 0.54 11,235 Weyerhaeuser Company 399,966 1.51
Total United States 25,788,679 97.12
Total Equities 26,242,866 98.83
Total Transferable securities and money market instruments admitted to an official exchange listing 26,242,866 98.83
Total value of investments 26,242,866 98.83
(Total cost: USD 25,033,120)
Quantity Investment
Market Value
EUR
% of Net Asset
Value
Transferable securities and money market instruments admitted to an official exchange listing
FRANCE 405,687 AXA SA 9,284,147 2.41 160,449 BNP Paribas 8,324,094 2.15 17,062 Dassault Systemes SA 3,112,109 0.81 6,634 Kering 3,904,772 1.01 28,644 L’Oreal SA 9,360,859 2.42 20,367 Louis Vuitton Moet Hennessy
SE 11,570,492 2.99 72,906 Publicis Groupe SA 3,794,028 0.98 36,607 Schneider Electric SE 4,768,062 1.23 37,796 Teleperformance 11,746,997 3.04 76,399 Worldline SA 5,457,944 1.41
Total France 71,323,504 18.45
GERMANY 14,420 Adidas AG 3,838,604 0.99 43,340 Allianz SE - Reg 9,406,947 2.44 99,886 Brenntag AG 7,271,701 1.88 69,147 Daimler AG - Reg 5,255,863 1.36 212,573 Infineon Technologies AG 7,685,577 1.99 60,070 Knorr-Bremse AG 6,392,649 1.65 85,527 Puma AG Rudolf Dassler Sport 7,144,926 1.85 38,612 Volkswagen AG Pfd 9,212,824 2.38 55,087 Vonovia SE 3,068,346 0.79
FRANCE 7,050 Air Liquide SA 982,065 1.36 105,824 AXA SA 2,421,782 3.33 24,990 Edenred 1,113,055 1.54 3,016 Louis Vuitton Moet Hennessy
SE 1,713,390 2.37 43,408 Nexity SA 1,826,609 2.52 6,278 Pernod-Ricard SA 1,004,794 1.39 9,708 Schneider Electric SE 1,264,467 1.74 30,693 Total SA 1,220,814 1.68 48,048 Verallia Sasu 1,477,476 2.04 17,893 Vinci SA 1,563,132 2.16
Total France 14,587,584 20.13
GERMANY 4,441 Adidas AG 1,182,194 1.63 26,112 Brenntag AG 1,900,954 2.62 56,465 DWS Group GmbH & Co KGaA 2,082,146 2.87 11,162 Siemens AG - Reg 1,562,680 2.16 25,500 Siemens Healthineers AG 1,178,100 1.63 5,962 Volkswagen AG Pfd 1,422,533 1.96 18,297 Vonovia SE 1,019,143 1.41
JERSEY - CHANNEL ISLANDS 1,813,805 JTC plc 13,158,760 1.36
Total Jersey - Channel Islands 13,158,760 1.36
LUXEMBOURG 634,521 Global Fashion Group SA 7,100,290 0.73 265,132 Solutions 30 SE 2,874,031 0.30
Total Luxembourg 9,974,321 1.03
NETHERLANDS 115,544 IMCD Group NV 13,691,964 1.41 39,385 Shop Apotheke Europe NV 7,325,610 0.76
Total Netherlands 21,017,574 2.17
NORWAY 1,113,514 Link Mobility Group Holdinging
ASA 4,605,985 0.48
Total Norway 4,605,985 0.48
The accompanying notes form an integral part of these financial statements.
Threadneedle (Lux) - Pan European Small Cap Opportunities
209
Portfolio Statementas at March 31, 2021
Threadneedle (Lux) Annual Report and Audited Financial Statements March 2021
Threadneedle (Lux) - Pan European Small Cap Opportunities
210
The accompanying notes form an integral part of these financial statements.
Threadneedle (Lux) Annual Report and Audited Financial Statements March 2021
Portfolio Statement(continued)
Quantity Investment
Market Value
EUR
% of Net Asset
Value
Transferable securities and money market instruments admitted to an official exchange listing (continued)
Equities (continued)
UNITED KINGDOM (continued) 1,029,960 Rightmove plc 7,039,284 0.73 886,246 RWS Holdings plc 6,335,888 0.65 1,151,816 Shaftesbury plc 8,673,925 0.90 808,472 St James’s Place plc 12,091,226 1.25 2,109,409 Synthomer plc 11,489,859 1.19 962,302 Victoria plc 9,443,948 0.98 432,264 Victrex plc 11,214,431 1.16 1,555,507 Volution Group plc 7,212,818 0.75 1,599,269 Watches of Switzerland Group
plc 12,409,632 1.28
Total United Kingdom 282,251,485 29.18
Total Equities 967,747,509 100.00
Total Transferable securities and money market instruments admitted to an official exchange listing 967,747,509 100.00
Other transferable securities and money market instruments
Equities
DENMARK 49,761 Ow Bunker A/S 0 0.00
Total Denmark 0 0.00
Total Equities 0 0.00
Total Other transferable securities and money market instruments 0 0.00
Undertakings for collective investments in transferable securities
Funds
IRELAND 55 BlackRock ICS Euro Liquidity
Fund Premier 5,439 0.00
Total Ireland 5,439 0.00
Total Funds 5,439 0.00
Total Undertakings for collective investments in transferable securities 5,439 0.00
Total value of investments 967,752,948 100.00
(Total cost: EUR 756,823,673)
Quantity Investment
Market Value
EUR
% of Net Asset
Value
Transferable securities and money market instruments admitted to an official exchange listing (continued)
Equities (continued)
SPAIN 896,829 Applus Services SA 7,919,000 0.82 832,711 Fluidra SA 20,276,513 2.10
Total Spain 28,195,513 2.92
SWEDEN 724,626 Avanza Bank Holding AB 19,197,489 1.98 350,334 Cint Group AB 2,817,930 0.29 1,413,922 Elekta AB - B 15,630,913 1.62 2,279,214 Karnov Group AB 11,613,852 1.20 342,909 MIPS AB 20,920,862 2.16 2,077,327 Munters Group AB 14,701,565 1.52 483,868 Nordnet AB 6,659,885 0.69 1,893,560 Stillfront Group AB 14,925,960 1.54 339,572 Thule Group AB 12,569,584 1.30
Holding AG 5,827,082 0.60 7,328 Inficon Holding AG 6,578,504 0.68 5,347 LEM Holding SA 8,826,803 0.91 1,057,947 SIG Combibloc Group AG 20,907,713 2.16 12,270 Tecan Group AG - Reg 4,652,276 0.48 69,245 Vat Group AG 16,576,730 1.71 169,117 VZ Holding AG 11,940,727 1.23 19,379 Zur Rose Group AG 6,219,453 0.64
Total Switzerland 94,617,943 9.76
UNITED KINGDOM 316,645 Abcam plc 5,170,537 0.53 3,418,184 Ascential plc 13,482,506 1.39 1,259,092 Big Yellow Group plc 16,480,419 1.70 505,896 Blue Prism Group plc 7,542,249 0.78 1,095,820 Cvs Group plc 24,068,494 2.49 971,411 Dr. Martens plc 5,168,075 0.53 328,463 First Derivatives plc 10,237,334 1.06 506,579 Future plc 11,382,169 1.18 50,162 Games Workshop Group plc 5,867,972 0.61 411,438 Genus plc 23,463,772 2.42 604,548 GlobalData plc 9,722,709 1.00 2,318,381 Howden Joinery Group plc 19,949,164 2.06 4,558,209 Ibstock plc 11,782,772 1.22 10,921,715 Johnson Service Group plc 19,077,860 1.98 786,352 Moonpig Group plc 3,919,520 0.41 119,936 Renishaw plc 9,024,922 0.93
Quantity Investment
Market Value
EUR
% of Net Asset
Value
Transferable securities and money market instruments admitted to an official exchange listing
FINLAND 707,800 Huhtamaki Oyj 27,292,767 1.37 205,512 Revenio Group Oyj 10,398,907 0.53
Total Finland 37,691,674 1.90
FRANCE 1,007,580 Bureau Veritas SA 24,453,967 1.23 302,160 Edenred 13,458,206 0.68 1,989,964 Elis SA 27,700,298 1.41 1,009,814 Korian-Medica 29,910,691 1.51 185,006 Nexity SA 7,785,052 0.39 289,991 Orpea 28,651,111 1.45 90,811 Remy Cointreau 14,302,733 0.73 108,748 SEB SA 16,355,699 0.83 47,775 Teleperformance 14,848,470 0.75 214,521 Ubisoft Entertainment SA 13,918,122 0.70 772,398 Verallia Sasu 23,751,239 1.20 131,916 Worldline SA 9,424,079 0.48
Total France 224,559,667 11.36
GERMANY 260,258 Brenntag AG 18,946,782 0.96 680,492 Cancom AG 33,439,377 1.69 88,174 Carl Zeiss Meditec AG 11,330,359 0.57 526,028 CompuGroup Medical SE &
Company KgaA 37,900,317 1.92 735,343 CTS Eventim AG 36,355,357 1.84 185,876 Dermapharm Holding SE 11,340,295 0.57 289,151 Gerresheimer AG 24,491,090 1.24
Quantity Investment
Market Value
EUR
% of Net Asset
Value
Transferable securities and money market instruments admitted to an official exchange listing (continued)
Equities (continued)
GERMANY (continued) 164,613 Grenkeleasing AG 5,317,000 0.27 36,208 Hypoport AG 16,366,016 0.83 149,368 Nemetschek SE 8,125,619 0.41 485,189 Norma Group 19,650,155 0.99 227,696 Puma AG Rudolf Dassler Sport 19,021,724 0.96 73,328 Sartorius AG 31,179,066 1.57 369,859 Stabilus GmbH 22,191,540 1.12 194,617 Stratec Biomedical AG 22,419,878 1.13 539,006 TeamViewer AG 19,635,989 0.99 82,379 Varta AG 10,338,565 0.52
Total Germany 348,049,129 17.58
ICELAND 4,222,197 Marel HF 24,657,630 1.25
Total Iceland 24,657,630 1.25
IRELAND 5,300,341 Dalata Hotel Group Limited 22,393,941 1.13 4,153,766 Irish Continental Group plc 18,380,415 0.93 141,093 Kingspan Group plc 10,201,024 0.52
Total Transferable securities and money market instruments admitted to an official exchange listing 1,947,834,251 98.36
Undertakings for collective investments in transferable securities
Funds
IRELAND 256,167 BlackRock ICS Euro Liquidity
Fund Premier 25,330,986 1.28
Total Ireland 25,330,986 1.28
Total Funds 25,330,986 1.28
Total Undertakings for collective investments in transferable securities 25,330,986 1.28
Total value of investments 1,973,165,237 99.64
(Total cost: EUR 1,613,579,029)
Quantity Investment
Market Value
EUR
% of Net Asset
Value
Transferable securities and money market instruments admitted to an official exchange listing (continued)
Equities (continued)
NETHERLANDS 104,377 ASM International NV 25,885,496 1.31 900,651 Davide Campari-Milano NV 8,603,018 0.43 327,708 IMCD Group NV 38,833,398 1.96 172,731 Just Eat Takeaway 13,561,336 0.68 73,572 Shop Apotheke Europe NV 13,684,392 0.69
Total Netherlands 100,567,640 5.07
SPAIN 1,624,114 Applus Services SA 14,340,927 0.72 1,671,034 Fluidra SA 40,689,678 2.05
Total Spain 55,030,605 2.77
SWEDEN 1,736,208 Avanza Bank Holding AB 45,997,294 2.32 2,604,009 Elekta AB - B 28,787,329 1.46 679,563 Intrum Justitia AB 18,574,128 0.94 818,297 Nordnet AB 11,262,914 0.57 1,058,072 Stillfront Group AB 8,340,238 0.42 597,069 Thule Group AB 22,101,082 1.12
Total Sweden 135,062,985 6.83
SWITZERLAND 3,839 Belimo Holding AG - Reg 26,515,751 1.33 13,287 Inficon Holding AG 11,928,028 0.60 2,231,592 SIG Combibloc Group AG 44,101,912 2.23 41,550 Sika AG 10,142,085 0.51 21,465 Tecan Group AG - Reg 8,138,639 0.41 112,400 Vat Group AG 26,907,711 1.36 35,190 Zur Rose Group AG 11,293,800 0.57
Total Switzerland 139,027,926 7.01
UNITED KINGDOM 561,623 Abcam plc 9,170,815 0.46 6,540,868 Ascential plc 25,799,458 1.30 714,860 Aveva Group plc 28,716,858 1.45 2,287,243 Big Yellow Group plc 29,938,021 1.51 715,793 Blue Prism Group plc 10,671,540 0.54 2,020,606 Cvs Group plc 44,380,413 2.24 6,317,076 Elementis plc 9,306,701 0.47 631,937 First Derivatives plc 19,695,827 0.99 882,544 Future plc 19,829,612 1.00 92,168 Games Workshop Group plc 10,781,852 0.54 824,418 Genus plc 47,015,481 2.37 717,817 GlobalData plc 11,544,370 0.58 4,229,887 Howden Joinery Group plc 36,397,257 1.83
Quantity Investment
Market Value
EUR
% of Net Asset
Value
Transferable securities and money market instruments admitted to an official exchange listing
FRANCE 118,320 Air Liquide SA 16,481,976 1.00 662,133 Bureau Veritas SA 16,069,968 0.99 174,259 Dassault Systemes SA 31,784,842 1.94 207,317 Legrand SA 16,444,384 1.00 139,171 L’Oreal SA 45,481,083 2.77 121,116 Louis Vuitton Moet Hennessy
SE 68,805,999 4.20 360,841 Pernod-Ricard SA 57,752,602 3.52 306,093 Schneider Electric SE 39,868,614 2.43 199,213 Ubisoft Entertainment SA 12,924,939 0.79 1,045,619 Worldline SA 74,699,021 4.56
Total France 380,313,428 23.20
GERMANY 122,923 Adidas AG 32,722,103 1.99 1,108,180 Brenntag AG 80,675,504 4.91 373,691 Knorr-Bremse AG 39,768,196 2.42 550,058 SAP SE 57,437,057 3.49 1,378,496 Siemens Healthineers AG 63,686,515 3.88 301,335 Zalando SE 25,203,659 1.54
SPAIN 359,854 Amadeus IT Holding SA - A 21,727,985 1.32 2,520,392 Inditex SA 70,823,016 4.31
Total Spain 92,551,001 5.63
SWEDEN 922,229 Atlas Copco AB - A 47,856,886 2.91 913,859 Epiroc AB - A 17,645,183 1.07 1,185,666 Sandvik AB 27,615,537 1.69
Total Sweden 93,117,606 5.67
SWITZERLAND 87,854 Lonza Group AG - Reg 41,967,859 2.56 659,280 Nestle SA - Reg 62,784,968 3.82 173,199 Roche Holding AG 47,827,532 2.92 126,568 Schindler Holding AG 31,764,048 1.94 170,564 Sika AG 41,633,565 2.54 88,744 Vat Group AG 21,244,643 1.29
Total Switzerland 247,222,615 15.07
Total Equities 1,627,417,779 99.15
Total Transferable securities and money market instruments admitted to an official exchange listing 1,627,417,779 99.15
Undertakings for collective investments in transferable securities
Funds
IRELAND 88,730 BlackRock ICS Euro Liquidity
Fund Premier 8,774,019 0.53 1,020,408 Insight Liquidity Funds plc 992,347 0.06
Total Ireland 9,766,366 0.59
Total Funds 9,766,366 0.59
Total Undertakings for collective investments in transferable securities 9,766,366 0.59
Total value of investments 1,637,184,145 99.74
(Total cost: EUR 1,276,416,980)
The accompanying notes form an integral part of these financial statements.
Threadneedle (Lux) - European Select
213
Portfolio Statementas at March 31, 2021
Threadneedle (Lux) Annual Report and Audited Financial Statements March 2021
Quantity Investment
Market Value
EUR
% of Net Asset
Value
Transferable securities and money market instruments admitted to an official exchange listing
FRANCE 1,568,693 Bureau Veritas SA 38,072,178 1.98 332,614 Edenred 14,814,628 0.77 1,663,591 Elis SA 23,157,187 1.20 519,085 Korian-Medica 15,375,298 0.80 332,636 Nexity SA 13,997,323 0.72 332,380 Orpea 32,839,144 1.70 147,218 Remy Cointreau 23,186,835 1.20 113,025 SEB SA 16,998,960 0.88 29,748 Somfy SA 4,242,065 0.22 54,371 Teleperformance 16,898,507 0.87 191,112 Ubisoft Entertainment SA 12,399,347 0.64 769,579 Verallia Sasu 23,664,554 1.22 114,694 Worldline SA 8,193,739 0.42
Total France 243,839,765 12.62
GERMANY 642,426 Brenntag AG 46,768,613 2.42 440,965 Cancom AG 21,669,020 1.12 120,488 Carl Zeiss Meditec AG 15,482,708 0.80 529,387 CompuGroup Medical SE &
Company KgaA 38,142,333 1.97
Quantity Investment
Market Value
EUR
% of Net Asset
Value
Transferable securities and money market instruments admitted to an official exchange listing (continued)
Equities (continued)
GERMANY (continued) 810,621 CTS Eventim AG 40,077,102 2.07 188,799 Dermapharm Holding SE 11,518,627 0.60 308,516 Gerresheimer AG 26,131,305 1.35 205,686 Grenkeleasing AG 6,643,658 0.34 44,213 Hypoport AG 19,984,276 1.03 308,662 Knorr-Bremse AG 32,847,810 1.70 409,138 Nemetschek SE 22,257,107 1.15 477,684 Norma Group 19,346,202 1.00 264,828 Puma AG Rudolf Dassler Sport 22,123,731 1.14 90,729 Sartorius AG 38,577,970 1.99 265,488 Stabilus GmbH 15,929,280 0.82 279,637 Stratec Biomedical AG 32,214,182 1.67 543,627 TeamViewer AG 19,804,332 1.02 96,954 Varta AG 12,167,727 0.63
Total Germany 441,685,983 22.82
ICELAND 4,211,638 Marel HF 24,595,965 1.28
Total Iceland 24,595,965 1.28
IRELAND 3,258,123 Dalata Hotel Group Limited 13,765,570 0.71 6,086,142 Irish Continental Group plc 26,931,179 1.40 512,453 Kingspan Group plc 37,050,352 1.92
The accompanying notes form an integral part of these financial statements.
Threadneedle (Lux) Annual Report and Audited Financial Statements March 2021
The accompanying notes form an integral part of these financial statements.
Threadneedle (Lux) - European Smaller Companies
215
Threadneedle (Lux) Annual Report and Audited Financial Statements March 2021
Portfolio Statement(continued)
Quantity Investment
Market Value
EUR
% of Net Asset
Value
Other transferable securities and money market instruments
Equities
DENMARK 280,528 Ow Bunker A/S 0 0.00
Total Denmark 0 0.00
Total Equities 0 0.00
Total Other transferable securities and money market instruments 0 0.00
Undertakings for collective investments in transferable securities
Funds
IRELAND 60,745 BlackRock ICS Euro Liquidity
Fund Premier 6,006,775 0.31
Total Ireland 6,006,775 0.31
Total Funds 6,006,775 0.31
Total Undertakings for collective investments in transferable securities 6,006,775 0.31
Total value of investments 1,926,976,901 99.69
(Total cost: EUR 1,317,719,092)
Quantity Investment
Market Value
EUR
% of Net Asset
Value
Transferable securities and money market instruments admitted to an official exchange listing (continued)
Equities (continued)
NETHERLANDS (continued) 408,412 IMCD Group NV 48,396,822 2.50 362,912 Just Eat Takeaway 28,532,141 1.48 77,224 Shop Apotheke Europe NV 14,363,664 0.74
Total Netherlands 168,744,875 8.73
SPAIN 1,537,498 Applus Services SA 13,576,107 0.70 1,692,719 Fluidra SA 41,217,708 2.13
Total Spain 54,793,815 2.83
SWEDEN 1,740,779 Avanza Bank Holding AB 46,118,393 2.39 629,975 Cint Group AB 5,067,237 0.26 2,396,382 Elekta AB - B 26,492,012 1.37 841,676 Nordnet AB 11,584,699 0.60 1,100,640 Stillfront Group AB 8,675,780 0.45 604,237 Thule Group AB 22,366,413 1.16
Holding AG 17,469,854 0.90 17,530 Inficon Holding AG 15,737,061 0.81 15,321 LEM Holding SA 25,291,836 1.31 2,454,177 SIG Combibloc Group AG 48,500,756 2.51 155,130 Sika AG 37,866,226 1.96 45,508 Tecan Group AG - Reg 17,254,749 0.89 204,638 Vat Group AG 48,988,792 2.53 35,412 Zur Rose Group AG 11,365,048 0.59
Total Switzerland 264,986,551 13.70
Total Equities 1,920,970,126 99.38
Total Transferable securities and money market instruments admitted to an official exchange listing 1,920,970,126 99.38
Quantity Investment
Market Value
USD
% of Net Asset
Value
Transferable securities and money market instruments admitted to an official exchange listing
Equities
AUSTRALIA 33,938 Aristocrat Leisure Limited 887,909 1.68 63,549 Australia & New Zealand
Banking Group Limited 1,363,971 2.58 79,359 Dexus Property Group 589,327 1.11 96,072 Fortescue Metals Group Limited 1,462,733 2.77 12,155 Macquarie Group Limited 1,414,878 2.68 68,048 Oz Minerals Limited 1,183,769 2.24 102,109 Sydney Airport Finance
Company Pty Limited 481,404 0.91 60,730 Transurban Group 616,117 1.17
Total Australia 8,000,108 15.14
CAYMAN ISLANDS 164,000 China Mengniu Dairy Company
Limited 938,713 1.78 364,000 China Resources Cement
Holdings Limited 408,737 0.77 202,000 China Resources Land Limited 978,239 1.85 10,192 Netease.com - ADR 1,052,426 1.99 216,000 Sands China Limited 1,079,378 2.04 14,200 Tencent Holdings Limited 1,114,158 2.11
Total Cayman Islands 5,571,651 10.54
CHINA 404,200 Baoshan Iron & Steel Company
Limited - A 497,765 0.94 828,000 China Construction Bank Corp. 696,525 1.32 160,000 China Merchants Bank
Company Limited - H 1,221,433 2.31 55,700 Gree Electric Appliances
Inc. - A 532,279 1.01 121,500 Ping An Insurance Group
Company of China Limited 1,446,377 2.74 212,000 Times Property Holdings
Limited 291,775 0.55 22,400 Wuliangye Yibin Company
Limited - A 914,885 1.73
Total China 5,601,039 10.60
HONG KONG 137,400 AIA Group Limited 1,666,584 3.15 70,400 ASM Pacific Technology
Limited 896,925 1.70 24,322 Hong Kong Exchanges and
Clearing Limited 1,430,949 2.70 55,500 Sun Hung Kai Properties
Limited 840,944 1.59
Quantity Investment
Market Value
USD
% of Net Asset
Value
Transferable securities and money market instruments admitted to an official exchange listing (continued)
Equities (continued)
HONG KONG (continued) 498,000 Xinyi Glass Holdings Limited 1,627,016 3.07
Total Hong Kong 6,462,418 12.21
INDIA 193,000 Embassy Office Parks REIT 859,078 1.63 38,929 HDFC Bank Limited 795,267 1.50 187,747 Petronet Lng Limited 576,860 1.09 74,029 Tech Mahindra Limited 1,003,838 1.90
Total India 3,235,043 6.12
INDONESIA 2,243,000 Bank Rakyat Indonesia 679,494 1.29 402,400 Indocement Tunggal Prakarsa
Tbk Pt 338,697 0.64
Total Indonesia 1,018,191 1.93
MACAU 367,200 Wynn Macau Limited 714,140 1.35
Total Macau 714,140 1.35
REPUBLIC OF KOREA (SOUTH) 33,410 Hanon Systems 521,041 0.99 17,225 KB Financial Group Inc. 855,355 1.62 8,798 Kia Motors Corp. 644,450 1.22 8,913 LG Corp. 711,940 1.35 3,725 Posco 1,053,239 1.99 67,607 Samsung Electronics Company
Limited Pfd 4,360,790 8.24 4,545 SK Telecom Company Limited 1,104,377 2.09
Total Republic of Korea (South) 9,251,192 17.50
SINGAPORE 333,200 CapitaLand Integrated
Commercial Trust 538,139 1.02 71,800 United Overseas Bank Limited 1,380,317 2.60
Total Singapore 1,918,456 3.62
TAIWAN 124,000 Chroma ATE Inc. 819,189 1.55 47,000 Delta Electronics Inc. 474,396 0.90 272,000 Hon Hai Precision Industry
Company Limited 1,182,065 2.24 35,000 MediaTek Inc. 1,188,619 2.25 211,000 Powertech Technology Inc. 780,164 1.48
Threadneedle (Lux) - Asian Equity Income
216
Portfolio Statementas at March 31, 2021
The accompanying notes form an integral part of these financial statements.
Threadneedle (Lux) Annual Report and Audited Financial Statements March 2021
The accompanying notes form an integral part of these financial statements.
Threadneedle (Lux) - Asian Equity Income
217
Threadneedle (Lux) Annual Report and Audited Financial Statements March 2021
Portfolio Statement(continued)
Quantity Investment
Market Value
USD
% of Net Asset
Value
Transferable securities and money market instruments admitted to an official exchange listing (continued)
Transferable securities and money market instruments admitted to an official exchange listing (continued)
Equities (continued)
UNITED KINGDOM 136,210 Vodafone Group plc - ADR 2,510,350 0.47
Total United Kingdom 2,510,350 0.47
UNITED STATES 65,393 Activision Blizzard Inc. 6,081,549 1.13 76,568 Advanced Energy Industries
Inc. 8,358,929 1.56 9,826 Alphabet Inc. - A 20,266,322 3.77 5,380 Alphabet Inc. - C 11,129,229 2.07 40,068 Analog Devices Inc. 6,213,745 1.16 208,160 Apple Inc. 25,426,745 4.74 168,429 Applied Materials Inc. 22,502,114 4.19 14,921 Arista Networks Inc. 4,504,501 0.84 431,325 Bloom Energy Corp. 11,667,341 2.17 45,403 Broadcom Inc. 21,051,555 3.92 78,829 Cerence Inc. 7,061,502 1.31 28,900 Cisco Systems Inc. 1,494,419 0.28 129,414 CommScope Holding Company
Inc. 1,987,799 0.37 50,717 Cornerstone Ondemand Inc. 2,210,247 0.41 73,813 Dell Technologies Inc. - C 6,506,616 1.21 423,448 Dropbox Inc. - A 11,289,124 2.11 60,309 Dxc Technology Company 1,885,259 0.35 202,672 Ebay Inc. 12,411,634 2.31 234,200 Eiger Biopharmaceuticals Inc. 2,072,670 0.39 30,404 F5 Networks Inc. 6,342,882 1.18 35,708 Fidelity National Information
Services Inc. 5,020,902 0.93 32,807 Fiserv Inc. 3,905,345 0.73 53,123 Fortinet Inc. 9,796,944 1.82 12,184 Global Payments Inc. 2,456,050 0.46 100,552 GoDaddy Inc. 7,804,846 1.45 262,192 HP inc. 8,324,596 1.55 16,227 Inphi Corp. 2,895,059 0.54 72,950 Intel Corp. 4,668,800 0.87 68,446 Lam Research Corp. 40,741,797 7.57 65,569 Lumentum Holdings Lite US 5,989,728 1.11 8,800 Match Group Inc. 1,208,944 0.23 68,108 Maxim Integrated Products Inc. 6,223,028 1.16 139,699 Mcafee Corp. - A 3,176,755 0.59 162,462 Micron Technology Inc. 14,330,773 2.67 73,116 Microsoft Corp. 17,238,559 3.22 198,635 NetApp Inc. 14,434,805 2.69 344,611 Nortonlifelock Inc. 7,326,430 1.36 131,900 Oracle Corp. 9,255,423 1.72
Threadneedle (Lux) - Global Technology
218
Portfolio Statementas at March 31, 2021
The accompanying notes form an integral part of these financial statements.
Threadneedle (Lux) Annual Report and Audited Financial Statements March 2021
The accompanying notes form an integral part of these financial statements.
Threadneedle (Lux) - Global Technology
219
Threadneedle (Lux) Annual Report and Audited Financial Statements March 2021
Portfolio Statement(continued)
Quantity Investment
Market Value
USD
% of Net Asset
Value
Transferable securities and money market instruments admitted to an official exchange listing (continued)
Equities (continued)
UNITED STATES (continued) 22,759 Palo Alto Networks Inc. 7,329,764 1.36 204,513 Plantronics Inc. 7,957,600 1.48 16,550 Qorvo Inc. 3,023,685 0.56 105,407 Rambus Inc. 2,049,112 0.38 33,990 Sailpoint Technologies Holding
Inc. 1,721,254 0.32 21,677 Salesforce.com Inc. 4,592,706 0.85 95,002 Sciplay Corp. - A 1,537,132 0.29 144,141 Synaptics Inc. 19,519,574 3.63 66,606 Synopsys Inc. 16,503,635 3.07 13,988 Tenable Holdings Inc. 506,156 0.09 195,718 Teradyne Inc. 23,814,966 4.43 4,500 T-Mobile USA Inc. 563,805 0.10 34,237 Verint Systems Inc. 1,557,441 0.29 59,614 Visa Inc. - A 12,622,073 2.35 37,478 Vizio Holdinging Corp. - A 908,842 0.17 194,247 Western Digital Corp. 12,965,987 2.41 362,761 Xperi Holding Corp. 7,897,307 1.47 5,400 Zendesk Inc. 716,148 0.13
Total United States 481,050,153 89.52
Total Equities 529,527,795 98.56
Total Transferable securities and money market instruments admitted to an official exchange listing 529,527,795 98.56
Total value of investments 529,527,795 98.56
(Total cost: USD 331,421,562)
Quantity Investment
Market Value
GBP
% of Net Asset
Value
Transferable securities and money market instruments admitted to an official exchange listing
Equities
IRELAND 206,802 CRH plc 7,012,656 2.37
Total Ireland 7,012,656 2.37
JERSEY - CHANNEL ISLANDS 4,557,297 Breedon Aggregates Limited 4,256,515 1.43
plc 4,575,159 1.54 345,365 Intermediate Capital Group plc 6,361,623 2.14 4,103,299 ITV plc 4,930,114 1.66 721,589 John Wood Group plc 1,952,620 0.65 246,377 Johnson Matthey plc 7,423,339 2.50 1,970,496 Legal & General Group plc 5,499,654 1.85 93,429 London Stock Exchange Group
MOROCCO 8,094 Attijariwafa Bank 376,711 5.49 6,149 Bank of Africa 106,568 1.55 410 Label Vie 146,734 2.14 1,240 LafargeHolcim Maroc SA 220,520 3.22 20,594 Maroc Telecom 316,651 4.62
Quantity Investment
Market Value
USD
% of Net Asset
Value
Transferable securities and money market instruments admitted to an official exchange listing (continued)
Equities (continued)
MOROCCO (continued) 720 Societe des Brasseries du
Maroc 183,079 2.67 2,934 Societe d’Exploitation des Ports 70,003 1.02 930 Total Maroc SA 130,052 1.90
Transferable securities and money market instruments admitted to an official exchange listing
Equities
BERMUDA 13,041 Marvell Technology Group
Limited 638,748 0.61
Total Bermuda 638,748 0.61
SWITZERLAND 2,397 TE Connectivity Limited 309,477 0.30
Total Switzerland 309,477 0.30
UNITED STATES 8,237 Adobe Systems Inc. 3,915,622 3.77 1,965 Alphabet Inc. - A 4,052,852 3.90 777 Amazon.com Inc. 2,404,100 2.31 10,569 Analog Devices Inc. 1,639,041 1.58 11,888 Apple Inc. 1,452,119 1.40 4,079 Autodesk Inc. 1,130,495 1.09 67,786 Bank of America Corp. 2,622,640 2.52 15,914 Berkshire Hathaway Inc. 4,065,550 3.91 28,170 BioMarin Pharmaceuticals Inc. 2,127,117 2.05 17,435 Bloom Energy Corp. 471,617 0.45 235 Booking Holdings Inc. 547,512 0.53 15,033 Centene Corp. 960,759 0.92 3,249 Charter Communications
Inc. - A 2,004,698 1.93 7,986 Comcast Corp. 432,122 0.42 12,994 CVS Health Corp. 977,539 0.94 27,973 Edwards Lifesciences Corp. 2,339,662 2.25 5,577 Eli Lilly & Company 1,041,895 1.00 14,954 Facebook Inc. - A 4,404,401 4.24 6,706 Fiserv Inc. 798,282 0.77 9,213 Heico Corp. 1,158,995 1.11 6,519 Intuit Inc. 2,497,168 2.40 21,044 JPMorgan Chase & Company 3,203,528 3.08 3,867 Lam Research Corp. 2,301,794 2.21 20,581 Las Vegas Sands Corp. 1,250,502 1.20 12,298 Mastercard Inc. - A 4,378,703 4.21 2,547 Microchip Technology Inc. 395,345 0.38 16,438 Microsoft Corp. 3,875,587 3.73 6,434 NextEra Energy Inc. 486,475 0.47 6,400 Nike Inc. 850,496 0.82 14,406 Norfolk Southern Corp. 3,868,299 3.72 62,373 Nutanix Inc. - A 1,656,627 1.59 2,037 Nvidia Corp. 1,087,615 1.05 6,343 Paypal Holdings Inc. 1,540,334 1.48 17,269 Signify Health Inc. 505,291 0.49 4,342 Square Inc. - A 985,851 0.95 1,533 Thermo Fisher Scientific Inc. 699,630 0.67 23,725 Uber Technologies Inc. 1,293,250 1.24
Quantity Investment
Market Value
USD
% of Net Asset
Value
Transferable securities and money market instruments admitted to an official exchange listing (continued)
Equities (continued)
UNITED STATES (continued) 1,086 United Health Group Inc. 404,068 0.39 10,836 Vertex Pharmaceuticals Inc. 2,328,548 2.24 11,050 Visa Inc. - A 2,339,617 2.25 6,547 Walt Disney Company 1,208,053 1.16
Total United States 75,703,799 72.82
Total Equities 76,652,024 73.73
Total Transferable securities and money market instruments admitted to an official exchange listing 76,652,024 73.73
Undertakings for collective investments in transferable securities
Funds
IRELAND 6,424,227 BlackRock ICS US Dollar
Liquidity Fund 6,424,227 6.18
Total Ireland 6,424,227 6.18
Total Funds 6,424,227 6.18
Total Undertakings for collective investments in transferable securities 6,424,227 6.18
Total value of investments 83,076,251 79.91
(Total cost: USD 55,960,334)
Threadneedle (Lux) - American Absolute Alpha
224
Portfolio Statementas at March 31, 2021
The accompanying notes form an integral part of these financial statements.
Threadneedle (Lux) Annual Report and Audited Financial Statements March 2021
Nominal Value Investment
Market Value
EUR
% of Net Asset
Value
Transferable securities and money market instruments admitted to an official exchange listing
Transferable securities and money market instruments admitted to an official exchange listing (continued)
Bonds - convertibles
FRANCEGBP 6,600,000 Orange SA 0.38% 27/06/2021 7,739,691 0.70
Total France 7,739,691 0.70
Total Bonds - convertibles 7,739,691 0.70
Total Transferable securities and money market instruments admitted to an official exchange listing 919,145,486 83.16
Transferable securities and money market instruments dealt in on another regulated market and recently issued transferable securities
Bonds
NETHERLANDSUSD 3,856,000 Vonovia Finance BV 5.00%
02/10/2023 3,556,542 0.32
Total Netherlands 3,556,542 0.32
UNITED STATESUSD 4,093,000 Broadcom Inc. 4.11% 15/09/2028 3,808,563 0.34 USD 4,470,000 Carrier Global Corp. 2.72%
15/02/2030 3,842,017 0.35
Total United States 7,650,580 0.69
Total Bonds 11,207,122 1.01
Total Transferable securities and money market instruments dealt in on another regulated market and recently issued transferable securities 11,207,122 1.01
Other transferable securities and money market instruments
5.50% 28/09/2026 140,492 0.26 GBP 126,000 Legal & General Group plc FRN
26/11/2049 157,009 0.28 GBP 100,000 Legal & General Group plc FRN
01/11/2050 130,817 0.25 GBP 767,000 Lloyds Banking Group Pl Perp
FRN 941,310 1.77 GBP 550,000 Lloyds TSB Bank plc 7.63%
22/04/2025 805,439 1.52
The accompanying notes form an integral part of these financial statements.
Threadneedle (Lux) - Global Investment Grade Credit Opportunities Fund
235
Threadneedle (Lux) Annual Report and Audited Financial Statements March 2021
Portfolio Statement(continued)
Nominal Value Investment
Market Value
EUR
% of Net Asset
Value
Transferable securities and money market instruments dealt in on another regulated market and recently issued transferable securities (continued)
Bonds (continued)
UNITED STATESUSD 300,000 Broadcom Inc. 4.11%
15/09/2028 279,152 0.52 USD 391,000 Carrier Global Corp. 2.72%
15/02/2030 336,069 0.63
Total United States 615,221 1.15
Total Bonds 661,338 1.24
Total Transferable securities and money market instruments dealt in on another regulated market and recently issued transferable securities 661,338 1.24
Other transferable securities and money market instruments
FRANCE 14,013 Air Liquide SA 1,952,011 0.83 4,304 Louis Vuitton Moet Hennessy
SE 2,445,102 1.04 87,632 Schneider Electric SE 11,414,068 4.85 36,579 Teleperformance 11,368,753 4.83 89,740 Worldline SA 6,411,025 2.72
Total France 33,590,959 14.27
GERMANY 33,826 Adidas AG 9,004,481 3.83 159,000 Brenntag AG 11,575,200 4.92 68,252 Infineon Technologies AG 2,467,651 1.05 121,405 Puma AG Rudolf Dassler Sport 10,142,174 4.30
Transferable securities and money market instruments admitted to an official exchange listing (continued)
Equities (continued)
SPAIN 120,121 Inditex SA 3,375,400 1.43
Total Spain 3,375,400 1.43
SWEDEN 202,650 Atlas Copco AB - A 10,516,041 4.47 132,082 Epiroc AB - A 2,550,296 1.08 99,028 Sandvik AB 2,306,477 0.98
Total Sweden 15,372,814 6.53
SWITZERLAND 46,737 Sika AG 11,408,198 4.85 733,798 UBS Group AG 9,708,714 4.12 9,879 Vat Group AG 2,364,958 1.00
Total Switzerland 23,481,870 9.97
UNITED KINGDOM 4,679,749 Barclays plc 10,213,735 4.34
Total United Kingdom 10,213,735 4.34
Total Equities 225,978,328 96.00
Total Transferable securities and money market instruments admitted to an official exchange listing 225,978,328 96.00
Undertakings for collective investments in transferable securities
Funds
IRELAND 45,253 BlackRock ICS Euro Liquidity
Fund Premier 4,474,836 1.90
Total Ireland 4,474,836 1.90
Total Funds 4,474,836 1.90
Total Undertakings for collective investments in transferable securities 4,474,836 1.90
Total value of investments 230,453,164 97.90
(Total cost: EUR 206,218,618)
The accompanying notes form an integral part of these financial statements.
Threadneedle (Lux) - Pan European Absolute Alpha
237
Portfolio Statementas at March 31, 2021
Threadneedle (Lux) Annual Report and Audited Financial Statements March 2021
Quantity Investment
Market Value
USD
% of Net Asset
Value
Transferable securities and money market instruments admitted to an official exchange listing
Equities
BERMUDA 13,437 Marvell Technology Group
Limited 658,144 0.58
Total Bermuda 658,144 0.58
SWITZERLAND 6,424 TE Connectivity Limited 829,403 0.74
Total Switzerland 829,403 0.74
UNITED STATES 4,419 Alphabet Inc. - A 9,114,276 8.09 2,168 Amazon.com Inc. 6,707,965 5.96 14,868 Analog Devices Inc. 2,305,729 2.05 24,777 Apple Inc. 3,026,511 2.69 9,191 Autodesk Inc. 2,547,286 2.26 79,274 Bank of America Corp. 3,067,111 2.72 25,456 Berkshire Hathaway Inc. 6,503,244 5.77 20,769 BioMarin Pharmaceuticals Inc. 1,568,267 1.39 18,685 Bloom Energy Corp. 505,429 0.45 718 Booking Holdings Inc. 1,672,825 1.49 18,543 Centene Corp. 1,185,083 1.05 16,239 CVS Health Corp. 1,221,660 1.08 35,574 Edwards Lifesciences Corp. 2,975,409 2.64 5,997 Eli Lilly & Company 1,120,360 0.99 18,977 Facebook Inc. - A 5,589,296 4.96 5,417 Fiserv Inc. 644,840 0.57 7,623 Intuit Inc. 2,920,066 2.59 14,435 JPMorgan Chase & Company 2,197,440 1.95 7,078 Lam Research Corp. 4,213,110 3.74 22,867 Las Vegas Sands Corp. 1,389,399 1.23 14,520 Mastercard Inc. - A 5,169,846 4.59 9,129 Microchip Technology Inc. 1,417,003 1.26 39,243 Microsoft Corp. 9,252,322 8.23 9,980 NextEra Energy Inc. 754,588 0.67 11,133 Nike Inc. 1,479,464 1.31 14,559 Norfolk Southern Corp. 3,909,383 3.47 27,489 Nutanix Inc. - A 730,108 0.65 2,490 Nvidia Corp. 1,329,486 1.18 11,293 Paypal Holdings Inc. 2,742,392 2.44 18,474 Signify Health Inc. 540,549 0.48 1,655 Square Inc. - A 375,768 0.33 2,495 Thermo Fisher Scientific Inc. 1,138,668 1.01 48,091 Uber Technologies Inc. 2,621,440 2.33 6,198 United Health Group Inc. 2,306,090 2.05 8,314 Vertex Pharmaceuticals Inc. 1,786,596 1.59
Quantity Investment
Market Value
USD
% of Net Asset
Value
Transferable securities and money market instruments admitted to an official exchange listing (continued)
Equities (continued)
UNITED STATES (continued) 20,453 Visa Inc. - A 4,330,513 3.85 8,108 Walt Disney Company 1,496,088 1.33
Total United States 101,855,610 90.44
Total Equities 103,343,157 91.76
Total Transferable securities and money market instruments admitted to an official exchange listing 103,343,157 91.76
Undertakings for collective investments in transferable securities
Funds
IRELAND 7,268,779 BlackRock ICS US Dollar
Liquidity Fund 7,268,779 6.45
Total Ireland 7,268,779 6.45
Total Funds 7,268,779 6.45
Total Undertakings for collective investments in transferable securities 7,268,779 6.45
Total value of investments 110,611,936 98.21
(Total cost: USD 79,199,351)
Threadneedle (Lux) - American Extended Alpha
238
Portfolio Statementas at March 31, 2021
The accompanying notes form an integral part of these financial statements.
Threadneedle (Lux) Annual Report and Audited Financial Statements March 2021
Quantity Investment
Market Value
USD
% of Net Asset
Value
Transferable securities and money market instruments admitted to an official exchange listing
Transferable securities and money market instruments admitted to an official exchange listing (continued)
Equities (continued)
JAPAN 6,600 Keyence Corp. 3,002,552 1.43 40,600 Rohm Company Limited 3,971,817 1.90 59,400 Sekisui Chemical Company
Limited 1,142,307 0.55 18,600 Sony Corp. 1,951,737 0.93 41,100 Yaskawa Electric Corp. 2,049,420 0.98
Total Japan 12,117,833 5.79
NETHERLANDS 9,048 Airbus SE 1,026,617 0.49
Total Netherlands 1,026,617 0.49
REPUBLIC OF KOREA (SOUTH) 78,953 Samsung Electronics Company
Limited 5,678,633 2.71 2,513 Samsung Sdi Company Limited 1,465,505 0.70
Total Republic of Korea (South) 7,144,138 3.41
SWITZERLAND 7,741 Roche Holding AG 2,512,340 1.20 19,876 TE Connectivity Limited 2,566,190 1.22
Total Switzerland 5,078,530 2.42
TAIWAN 153,000 Taiwan Semiconductor
Manufacturing Company Limited 3,147,606 1.50
Total Taiwan 3,147,606 1.50
UNITED KINGDOM 48,936 Diageo plc 2,018,420 0.97 60,893 Reckitt Benckiser Group plc 5,459,234 2.61
Total United Kingdom 7,477,654 3.58
UNITED STATES 18,476 Abbott Laboratories 2,214,164 1.06 22,013 Activision Blizzard Inc. 2,047,209 0.98 9,319 Adobe Systems Inc. 4,429,973 2.11 3,790 Alphabet Inc. - A 7,816,951 3.73 4,485 Amazon.com Inc. 13,876,948 6.61 4,100 Autodesk Inc. 1,136,315 0.54 16,637 Berkshire Hathaway Inc. 4,250,255 2.02 320 Booking Holdings Inc. 745,549 0.36 46,076 Centene Corp. 2,944,717 1.41 15,158 CME Group Inc. 3,095,718 1.48
The accompanying notes form an integral part of these financial statements.
Threadneedle (Lux) - Global Extended Alpha
239
Portfolio Statementas at March 31, 2021
Threadneedle (Lux) Annual Report and Audited Financial Statements March 2021
Threadneedle (Lux) - Global Extended Alpha
240
The accompanying notes form an integral part of these financial statements.
Threadneedle (Lux) Annual Report and Audited Financial Statements March 2021
Portfolio Statement(continued)
Quantity Investment
Market Value
USD
% of Net Asset
Value
Transferable securities and money market instruments admitted to an official exchange listing (continued)
Equities (continued)
UNITED STATES (continued) 74,976 Comcast Corp. 4,056,952 1.94 6,487 Cooper Companies Inc. 2,491,592 1.19 10,093 Danaher Corp. 2,271,732 1.08 11,196 Ecolab Inc. 2,396,728 1.14 24,889 Edwards Lifesciences Corp. 2,081,716 0.99 22,310 Electronic Arts Inc. 3,020,105 1.44 34,389 Fidelity National Information
Services Inc. 4,835,436 2.31 29,562 General Motors Company 1,698,633 0.81 8,683 Intuit Inc. 3,326,110 1.59 2,420 JPMorgan Chase & Company 368,397 0.18 43,673 Las Vegas Sands Corp. 2,653,571 1.27 10,508 Mastercard Inc. - A 3,741,373 1.79 51,871 NextEra Energy Inc. 3,921,966 1.87 6,493 Nvidia Corp. 3,466,807 1.65 5,439 Paypal Holdings Inc. 1,320,807 0.63 4,988 S&P Global Inc. 1,760,116 0.84 60,920 Service Corp. International 3,109,966 1.48 4,082 Stryker Corp. 994,294 0.47 3,559 Thermo Fisher Scientific Inc. 1,624,256 0.78 44,740 T-Mobile USA Inc. 5,605,475 2.67 72,152 Uber Technologies Inc. 3,933,005 1.87 14,254 Union Pacific Corp. 3,141,724 1.50 9,536 United Health Group Inc. 3,548,060 1.69 21,568 Visa Inc. - A 4,566,593 2.18 16,062 Walt Disney Company 2,963,760 1.41
Total United States 115,456,973 55.07
Total Equities 189,113,333 90.24
Total Transferable securities and money market instruments admitted to an official exchange listing 189,113,333 90.24
Undertakings for collective investments in transferable securities
Funds
IRELAND 14,646,071 BlackRock ICS US Dollar
Liquidity Fund 14,646,071 6.99
Total Ireland 14,646,071 6.99
Total Funds 14,646,071 6.99
Total Undertakings for collective investments in transferable securities 14,646,071 6.99
Total value of investments 203,759,404 97.23
(Total cost: USD 156,730,394)
Nominal Value Investment
Market Value
USD
% of Net Asset
Value
Transferable securities and money market instruments admitted to an official exchange listing
Total Structured Instruments - Commodities 294,966 0.06
Total Transferable securities and money market instruments admitted to an official exchange listing 294,966 0.06
Transferable securities and money market instruments dealt in on another regulated market and recently issued transferable securities
Supranationals, Governments and Local Public Authorities, Debt Instruments
UNITED STATESUSD 72,500,000 United States Treasury Bill
0.00% 15/04/2021 72,499,783 13.71 USD 72,500,000 United States Treasury Bill
0.00% 22/04/2021 72,514,072 13.71 USD 72,000,000 United States Treasury Bill
0.00% 06/05/2021 71,999,287 13.61 USD 78,000,000 United States Treasury Bill
0.00% 13/05/2021 77,998,619 14.75 USD 75,000,000 United States Treasury Bill
0.00% 20/05/2021 74,998,965 14.18 USD 72,500,000 United States Treasury Bill
0.00% 17/06/2021 72,498,427 13.70 USD 72,500,000 United States Treasury Bill
0.00% 08/07/2021 72,497,506 13.71
Total United States 515,006,659 97.37
Total Supranationals, Governments and Local Public Authorities, Debt Instruments 515,006,659 97.37
Total Transferable securities and money market instruments dealt in on another regulated market and recently issued transferable securities 515,006,659 97.37
Total value of investments 515,301,625 97.43
(Total cost: USD 515,258,007)
The accompanying notes form an integral part of these financial statements.
Threadneedle (Lux) - Enhanced Commodities
241
Portfolio Statementas at March 31, 2021
Threadneedle (Lux) Annual Report and Audited Financial Statements March 2021
Notes to the Financial Statements
242
Threadneedle (Lux) Annual Report and Audited Financial Statements March 2021
1 GENERAL
Threadneedle (Lux) (the “SICAV”) is an investment company with variable capital (Société d’Investissement à Capital Variable) governed by Part I of the law of December 17, 2010, relating to Undertakings for Collective Investment, as amended.
The SICAV offers investors the opportunity to invest in separate compartments (the “Portfolios”), each of which has a different investment objective and is a separate portfolio of assets represented by separate securities. Each Portfolio may have one or more classes of shares (the “Share Classes”) related to it. The SICAV as a whole, including all of the existing Portfolios and all future Portfolios, is one legal entity. However, with regard to third parties and, in particular, with regard to the SICAV’s creditors and as between Shareholders, each Portfolio shall be exclusively responsible for all liabilities attributable to it.
Significant events during the year:
New Prospectuses
New Prospectuses have been issued in September 2020 and March 2021.
Changes to the investment policy of the Portfolios and name change
As from October 1, 2020 the investment policy of the Threadneedle (Lux) - American Portfolio has changed.
As from October 2, 2020 the investment policy of the Threadneedle (Lux) - Pan European Equities Portfolio has changed and its name changed to Threadneedle (Lux) - Pan European ESG Equities.
Fees reduction
As from September 1, 2020 the asset management fee of the I and Z Share Classes of the Threadneedle (Lux) - European Social Bond Portfolio has been reduced from 0.40% to 0.30%.
As from October 1, 2020 the fees for the below classes of the Threadneedle (Lux) - Flexible Asian Bond Portfolio have been reduced as follows:
The Threadneedle (Lux) - Emerging Market ESG Equities Portfolio launched on September 24, 2020.
With effect from November 3, 2020, the Threadneedle (Lux) - Gatehouse Shariah Global Equity Portfolio was put into liquidation and final shareholder redemptions were instructed on November 10, 2020.
Launched and dormant Share Classes
The following share classes were launched during the year ended March 31, 2021:
Share Class Portfolio Effective DateXEH Threadneedle (Lux) - Global Corporate Bond October 16, 2020XFH Threadneedle (Lux) - Global Corporate Bond October 16, 2020XU Threadneedle (Lux) - Global Corporate Bond October 16, 2020ZFH Threadneedle (Lux) - Global Corporate Bond October 14, 2020XE Threadneedle (Lux) - European Corporate Bond October 16, 2020XFH Threadneedle (Lux) - European Corporate Bond October 16, 2020
Notes to the Financial Statements(continued)
243
Threadneedle (Lux) Annual Report and Audited Financial Statements March 2021
Share Class Portfolio Effective DateXGH Threadneedle (Lux) - European Corporate Bond October 16, 2020XUH Threadneedle (Lux) - European Corporate Bond October 16, 2020ZFH Threadneedle (Lux) - European Corporate Bond October 14, 20204E Threadneedle (Lux) - European Corporate Bond April 8, 2020AE Threadneedle (Lux) - European High Yield Bond May 6, 2020AE Threadneedle (Lux) - European Social Bond September 18, 2020AEP Threadneedle (Lux) - European Social Bond September 18, 2020AFH Threadneedle (Lux) - European Social Bond February 25, 2021AKH Threadneedle (Lux) - European Social Bond October 14, 2020ANH Threadneedle (Lux) - European Social Bond October 14, 2020ASC Threadneedle (Lux) - European Social Bond February 25, 2021ASH Threadneedle (Lux) - European Social Bond February 25, 2021AUC Threadneedle (Lux) - European Social Bond February 25, 2021AUH Threadneedle (Lux) - European Social Bond February 25, 2021IGH Threadneedle (Lux) - European Social Bond February 25, 2021ISC Threadneedle (Lux) - European Social Bond February 25, 2021ISH Threadneedle (Lux) - European Social Bond February 25, 2021IUC Threadneedle (Lux) - European Social Bond February 25, 2021IUH Threadneedle (Lux) - European Social Bond February 25, 2021ZGC Threadneedle (Lux) - European Social Bond April 3, 2020ZGH Threadneedle (Lux) - European Social Bond April 3, 2020ZUH Threadneedle (Lux) - European Social Bond June 12, 2020IEC Threadneedle (Lux) - Emerging Market Corporate Bonds February 25, 2021AE Threadneedle (Lux) - Emerging Market ESG Equities September 24, 2020AEC Threadneedle (Lux) - Emerging Market ESG Equities September 24, 2020AEH Threadneedle (Lux) - Emerging Market ESG Equities September 24, 2020AU Threadneedle (Lux) - Emerging Market ESG Equities September 24, 2020AUP Threadneedle (Lux) - Emerging Market ESG Equities September 24, 2020IE Threadneedle (Lux) - Emerging Market ESG Equities September 24, 2020IEH Threadneedle (Lux) - Emerging Market ESG Equities September 24, 2020IG Threadneedle (Lux) - Emerging Market ESG Equities September 24, 2020IU Threadneedle (Lux) - Emerging Market ESG Equities September 24, 2020LE Threadneedle (Lux) - Emerging Market ESG Equities September 24, 2020LG Threadneedle (Lux) - Emerging Market ESG Equities September 24, 2020XU Threadneedle (Lux) - Emerging Market ESG Equities September 24, 2020ZE Threadneedle (Lux) - Emerging Market ESG Equities September 24, 2020ZEC Threadneedle (Lux) - Emerging Market ESG Equities September 24, 2020ZEH Threadneedle (Lux) - Emerging Market ESG Equities September 24, 2020ZU Threadneedle (Lux) - Emerging Market ESG Equities September 24, 2020ZUP Threadneedle (Lux) - Emerging Market ESG Equities September 24, 2020ZEH Threadneedle (Lux) - Global Focus September 16, 2020ZFH Threadneedle (Lux) - Global Focus September 16, 2020IE Threadneedle (Lux) - Global Emerging Market Equities May 6, 2020IEP Threadneedle (Lux) - Global Smaller Companies July 29, 2020XFH Threadneedle (Lux) - Global Smaller Companies November 11, 2020XU Threadneedle (Lux) - Global Smaller Companies November 11, 2020NE Threadneedle (Lux) - US Disciplined Core Equities September 18, 2020NG Threadneedle (Lux) - US Disciplined Core Equities September 18, 2020NU Threadneedle (Lux) - US Disciplined Core Equities September 18, 2020XG Threadneedle (Lux) - US Disciplined Core Equities May 20, 2020NEH Threadneedle (Lux) - UK Equities October 28, 2020NFH Threadneedle (Lux) - UK Equities October 28, 2020NG Threadneedle (Lux) - UK Equities October 28, 2020NGP Threadneedle (Lux) - UK Equities October 28, 2020NUH Threadneedle (Lux) - UK Equities October 28, 2020TEH Threadneedle (Lux) - UK Equities October 28, 2020TFH Threadneedle (Lux) - UK Equities October 28, 2020TG Threadneedle (Lux) - UK Equities October 28, 2020TGP Threadneedle (Lux) - UK Equities October 28, 2020TUH Threadneedle (Lux) - UK Equities October 28, 2020XE Threadneedle (Lux) - Global Investment Grade Credit Opportunities April 8, 2020XUH Threadneedle (Lux) - Global Investment Grade Credit Opportunities April 8, 2020
1 GENERAL (continued)
Notes to the Financial Statements(continued)
244
Threadneedle (Lux) Annual Report and Audited Financial Statements March 2021
The following share class which was dormant became active during the year ended March 31, 2021:
3FH Threadneedle (Lux) - UK Equities November 24, 2020
The following share classes became dormant during the year ended March 31, 2021:
Share Class Portfolio Effective Date4GP Threadneedle (Lux) - European High Yield Bond June 17, 2020W Threadneedle (Lux) - European Strategic Bond May 22, 2020AQ Threadneedle (Lux) - Global Multi Asset Income March 23, 2021AQM Threadneedle (Lux) - Global Multi Asset Income March 23, 2021
As at March 31, 2021 the active Portfolios of the SICAV are as follows:
The Bond Portfolios:- Threadneedle (Lux) - Global Corporate Bond- Threadneedle (Lux) - European Corporate Bond- Threadneedle (Lux) - European High Yield Bond- Threadneedle (Lux) - European Short-Term High Yield Bond- Threadneedle (Lux) - European Social Bond- Threadneedle (Lux) - European Strategic Bond- Threadneedle (Lux) - Emerging Market Corporate Bonds1
The Asset Allocation Portfolios:- Threadneedle (Lux) - Euro Dynamic Real Return- Threadneedle (Lux) - Global Dynamic Real Return- Threadneedle (Lux) - Global Multi Asset Income
The Equity Portfolios:- Threadneedle (Lux) - Emerging Market ESG Equities - Threadneedle (Lux) - Global Focus1
- Threadneedle (Lux) - Global Emerging Market Equities1
- Threadneedle (Lux) - Global Equity Income - Threadneedle (Lux) - Global Select - Threadneedle (Lux) - Global Smaller Companies - Threadneedle (Lux) - American1
- Threadneedle (Lux) - American Select- Threadneedle (Lux) - American Smaller Companies - Threadneedle (Lux) - Asia Contrarian Equity1
- Threadneedle (Lux) - Asia Equities - Threadneedle (Lux) - US Contrarian Core Equities - Threadneedle (Lux) - US Disciplined Core Equities - Threadneedle (Lux) - Pan European ESG Equities- Threadneedle (Lux) - Pan European Equity Dividend - Threadneedle (Lux) - Pan European Small Cap Opportunities1
- Threadneedle (Lux) - Pan European Smaller Companies - Threadneedle (Lux) - European Select - Threadneedle (Lux) - European Smaller Companies - Threadneedle (Lux) - Asian Equity Income1
- Threadneedle (Lux) - Global Technology1
- Threadneedle (Lux) - UK Equities - Threadneedle (Lux) - UK Equity Income - Threadneedle (Lux) - STANLIB Africa Equity
1 GENERAL (continued)
1As at March 31, 2021, these Portfolios have been authorised by the Securities and Futures Commission in Hong Kong and are available to the public of Hong Kong.
Notes to the Financial Statements(continued)
245
Threadneedle (Lux) Annual Report and Audited Financial Statements March 2021
The Absolute Return Portfolios:- Threadneedle (Lux) - American Absolute Alpha- Threadneedle (Lux) - Credit Opportunities- Threadneedle (Lux) - Global Investment Grade Credit Opportunities- Threadneedle (Lux) - Pan European Absolute Alpha
The Extended Alpha Portfolios:- Threadneedle (Lux) - American Extended Alpha- Threadneedle (Lux) - Global Extended Alpha
The Specialist Portfolio:- Threadneedle (Lux) - Enhanced Commodities
2 SUMMARY OF SIGNIFICANT ACCOUNTING POLICIES
The financial statements are prepared and presented in accordance with generally accepted accounting principles applicable to UCITS (Undertakings for Collective Investments in Transferable Securities) investment funds in Luxembourg and require management to make estimates and assumptions that affect the amounts reported in the financial statements and accompanying notes. Actual results could differ from those estimates.
The financial statements are presented on the basis of the Net Asset Value of the Portfolios which are calculated as of March 31, 2021. The last official trading Net Asset Value of the corresponding Portfolios has been calculated as of March 31, 2021.
The financial statements are prepared in accordance with Luxembourg legal and regulatory requirements relating to investment funds under the going concern basis of accounting except for the Threadneedle (Lux) - Gatehouse Shariah Global Equity Portfolio and the Threadneedle (Lux) - STANLIB Africa Equity Portfolio. The former was terminated on November 3, 2020 and the latter was put into liquidation on May 21, 2021. As such, the financial statements for these Portfolios have been prepared on a non-going concern basis and any additional costs in respect of the terminations of these Portfolios will be borne by the Management Company.
I) Valuation of securities
Transferable securities, money market instruments and any financial assets listed or dealt in on a regulated market are valued at their last exchange price in the relevant market at the time of closure of the market. If such prices are not representative of their fair market value, such securities are stated at the fair value at which it is expected they may be resold, as determined in good faith by or under the direction of the Board of Directors.
Fixed income securities not traded on such markets are valued at the last available price or yield equivalents obtained from one or more dealers or pricing services approved by the Board of Directors, or any other price deemed appropriate by the Board of Directors.
Money Market Instruments (or other instruments in line with market convention in the jurisdiction in which the instrument is held) with a remaining maturity of 90 days or less will be valued by the amortised cost method, which approximates market value. Under this valuation method, the relevant Portfolio’s investments are valued at their acquisition cost or the last market value prior to the 90 day period commencing (where an instrument at purchase date originally had more than 90 days to maturity) and adjusted for amortisation of premium or accretion of discount rather than at market value.
Units or shares of open-ended undertakings for collective investments (“UCIs”) are valued at their last determined and available net asset value (the “Net Asset Value”) or, if such price is not representative of the fair market value of such assets, then the price shall be determined by the SICAV, on a fair and equitable basis. Units or shares of closed-ended UCIs are valued at their last available stock market value.
The directors of the SICAV (the “Directors”), in their discretion, may permit some other method of valuation to be used if they consider that such valuation better reflects the fair value of any asset of the SICAV.
II) Forward Currency Exchange Contracts
For the purpose of hedging against specific currency risk or investing in other currencies, the SICAV may enter into forward currency exchange contracts. At the year-end, open forward currency exchange contracts are valued at the forward rates applicable for the remaining period until maturity. The net movement in the unrealised gain/(loss) arising on forward currency exchange contracts is recorded in the Statement of Operations and Changes in Net Assets. The contracts outstanding as at March 31, 2021 are disclosed in Note 9.
III) Futures Contracts
The SICAV may enter into futures exchange contracts. Open futures contracts are valued at the prices on the exchange for which the contracts are traded on. The net movement in the unrealised gain/(loss) arising on futures contracts is recorded in the Statement of Operations and Changes in Net Assets. The contracts outstanding as at March 31, 2021 are disclosed in Note 11.
Notes to the Financial Statements(continued)
246
Threadneedle (Lux) Annual Report and Audited Financial Statements March 2021
IV) Swaps
The SICAV may enter into Interest Rate Swaps (“IRS”), Credit Default Swaps (“CDS”) and Total Return Swaps (“TRS”). IRS are valued on the basis of their market value established by reference to the applicable interest rate curve. CDS are valued by reference to the net present value of the expected future cash flows based on the market interest rates and the markets expected default and recovery rate of the underlying asset. An upfront payment, if any, made by the SICAV is recorded as an asset in the Statement of Net Assets. An upfront payment, if any, received by the SICAV is recorded as a liability in the Statement of Net Assets. TRS are valued by reference to the mark to market value based on the market value of the underlying asset. The net movement in the unrealised gain or loss arising on swaps is recorded in the Statement of Operations and Changes in Net Assets. The contracts outstanding as at March 31, 2021 are disclosed in Note 10. Dividends payable on swaps short positions, if any, are recorded as a liability in the Statement of Net Assets.
V) Options
Options traded on a regulated market are valued at the market price on the valuation date. Such options open as at March 31, 2021 are shown in the Schedule of Investments. Over-the-counter (“OTC”) options are valued based on prices received from third party pricing agents/models. Such options open as at March 31, 2021 are shown in Note 12. Unrealised gains or losses arising at the time of reporting from the valuation of options trades are taken into account in the Statement of Operations and Changes in Net Assets.
VI) Translation of currencies
The accounts of each Portfolio are kept in the currency in which its net assets are expressed. The relevant Statement of Net Assets, Statement of Operations and Changes in Net Assets and the Schedule of Investments are expressed in this currency (the “base currency”).
During the year, transactions, income and expenses denominated in a currency other than the base currency are recorded on the basis of exchange rates prevailing on the date they occur or accrue to the Portfolio.
At the date of the Statement of Net Assets, monetary assets and liabilities denominated in a currency other than the base currency are translated into the base currency on the basis of exchange rates prevailing on that date. Exchange differences are included in the Statement of Operations and Changes in Net Assets.
The aggregated Statement of Net Assets and Statement of Operations and Changes in Net Assets are presented in USD based on the exchange rates ruling at the date of the Statement of Net Assets. Exchange rates used as at March 31, 2021 are: 1 USD = 1.312939 AUD, 1 USD = 0.850847 EUR, 1 USD = 0.724795 GBP, 1 USD = 0.941150 CHF, 1 USD = 8.716268 SEK, 1 USD = 6.327952 DKK, 1 USD = 8.536356 NOK and 1 USD = 1.343600 SGD.
The difference between the opening net assets stated at exchange rates ruling at the beginning of the year and their value at the end of the year is shown as a currency translation adjustment in the Aggregated Statement of Operations and Changes in Net Assets under the heading Exchange differences.
VII) Cash at bank
The cash at bank reflected in the statements of net assets includes also the margins on futures contracts and cash collateral due from brokers for swaps transactions and forward currency exchange contracts.
Cash and margins on futures contracts are valued at cost, which approximates the market value.
VIII) Term deposits
Term deposits are valued at cost, which approximates the market value.
IX) Investment transactions and investment income
Securities are recorded at cost, and where applicable on the basis of exchange rates prevailing on the date they are purchased.
Results on sales of securities are determined on the basis of the average cost method. Investment transactions are accounted for on the trade date. Dividends are accounted for on the ex-dividend date. Interest income is recorded on an accrual basis. Discounts/Premium on zero coupon bonds are accreted as adjustments to interest income.
Interest, dividends and capital gains on securities may be subject to withholding or capital gains taxes in certain countries.
X) Distribution policy
The policy of the SICAV in respect of all Share Classes of Portfolios, with the exception of Classes whose denomination ends in ‘C’, ‘M’, ‘P’ or ‘T’ is to make no distributions, to accumulate in such Portfolios all net earnings and to reinvest these within the same Portfolio and Class. In respect of Classes whose denomination ends in ‘C’, ‘M’, ‘P’ or ‘T’ the SICAV intends to make distributions, with a frequency, at least annually, and in an amount to be determined by the Directors. The Shareholders of these Share Classes have the option to receive the dividend or to reinvest it in the SICAV.
2 SUMMARY OF SIGNIFICANT ACCOUNTING POLICIES (continued)
Notes to the Financial Statements(continued)
247
Threadneedle (Lux) Annual Report and Audited Financial Statements March 2021
XI) Asset management fee rebates
Cross investments and investments in other Columbia Threadneedle funds are either made in non-fee paying share classes or any management fee paid is fully rebated. Please also refer to note 18 for details on cross investments.
3 TAXATION
Under current laws and practice, the SICAV is not liable to any Luxembourg income tax, or any Luxembourg capital gains on the realised capital appreciation of the assets of the SICAV nor are dividends paid by the SICAV liable to any Luxembourg withholding tax.
Under the prevailing law and regulations, the SICAV is subject, in the Grand Duchy of Luxembourg, to an annual subscription tax (“taxe d’abonnement”) of 0.05%, payable on a quarterly basis and assessed on its Net Asset Value at the end of each quarter. No tax is due on the assets held by the SICAV in other UCITS already subject to that tax in Luxembourg.
In respect of the Institutional Share Classes, a reduced annual subscription tax of 0.01% is levied on the Net Asset Value at the last day of each calendar quarter in accordance with the law of December 17, 2010, as amended.
In addition, those portfolios whose sole object is the collective investment in money market instruments and the placing of deposits with credit institutions are also subject to a reduced tax of 0.01%. Again, no such tax is due on the portion of the assets of the SICAV invested in other Luxembourg UCITS, if any.
For the avoidance of doubt, this taxe d’abonnement forms part of the SICAVs Operating Expenses.
Although the SICAV’s realised capital gains are not taxable in Luxembourg, whether short-or-long term, these realised capital gains may be subject to tax in the countries of origin.
4 MISCELLANEOUS FEES
The miscellaneous fees are mainly composed of Italian taxes. In the Threadneedle (Lux) - Gatehouse Shariah Global Equity Portfolio* the miscellaneous fees are composed of the impure income amount to be donated.
5 RELATED PARTY TRANSACTIONS
The SICAV may, on behalf of the different Portfolios, enter into borrowing arrangements (subject to the restrictions set out under “Investment Restrictions” in Appendix A of the Prospectus) with, and buy from or sell transferable securities, foreign exchange or other financial instruments through Threadneedle Asset Management Limited (“TAML”), a related entity and its affiliates, provided that such transactions are carried out at normal commercial terms and are in the best interests of the relevant Portfolio and its Shareholders.
For the year ending March 31, 2021, the SICAV did not enter into transactions with connected persons.
The SICAV has appointed Threadneedle Management Luxembourg S.A. (the “Management Company”) to serve as its designated Management Company in accordance with Chapter 15 of the law of December 17, 2010, as amended. Under the Management Company Services Agreement, the Management Company provides investment management, administrative and marketing services to the SICAV, subject to the overall supervision and control of the Board of Directors.
Neither the Management Company nor TAML earned commissions related to brokerage transactions.
Certain officers and/or directors of the Management Company, the SICAV and other Columbia Threadneedle Group entities are also officers and/or directors of TAML.
The Management Company (on behalf of the SICAV) has delegated certain marketing and/or distribution functions to other Columbia Threadneedle Group entities. The Management Company receives a monthly fee for Asset management services at an annual rate detailed in this note, expressed as a percentage of the average daily net assets for each of the Portfolios. The Management Company is responsible for paying sub-distribution fees out of this fee. Some of the sub-advisors are related entities.
As described in Note 8, the Management Company may also receive performance fees with respect to all A, D, I and Z Shares of the Threadneedle (Lux) - American Absolute Alpha Portfolio, with respect to all J and Y Shares of the Threadneedle (Lux) - Global Investment Grade Credit Opportunities Portfolio and with respect to all A, D, I, L and Z Shares of the Threadneedle (Lux) - Pan European Absolute Alpha Portfolio.
All expenses incurred in the operation of the SICAV and defined below (hereafter the “Operating Expenses”, “Asset Management Fee” or “Portfolio Charges”, together, the “Expenses”) are fixed at the rates shown in the tables from page 248 onwards. All expenses are accrued daily based on the Net Asset Value of the relevant Share Class in the relevant Portfolio.
2 SUMMARY OF SIGNIFICANT ACCOUNTING POLICIES (continued)
*See note 1.
Notes to the Financial Statements(continued)
248
Threadneedle (Lux) Annual Report and Audited Financial Statements March 2021
The Operating Expenses include, among other things, taxes, expenses for legal and auditing services, costs of printing proxies, stock certificates, Shareholders’ reports and notices, Prospectuses and Key Investor Information and other promotional expenses, fees and charges of the Depositary and its correspondents, and of the Domiciliary Agent, Administrative Agent, Registrar and Transfer Agent and of any paying agent, expenses of the issue and redemption of Shares, registration fees and expenses in various jurisdictions, listing fees, fees of unaffiliated directors of the SICAV, expenses of the Directors and officers of the SICAV and the Sub-Advisors relating to attendance at meetings of the Directors and of the Shareholders of the SICAV, translation costs, accounting and pricing costs (including the calculation of Net Asset Value per Share), insurance, litigation and other extraordinary or non-recurring expenses, and all other expenses properly payable by the SICAV. The Operating Expenses also include the service fee payable to the Management Company. The Management Company will bear the excess of any Operating Expenses above the annual rate. Conversely the Management Company will be entitled to retain any amount by which the annual rate of Operating Expenses exceeds the actual expenses incurred by the SICAV.
Furthermore, the Management Company is entitled to receive an asset management fee (the “Asset Management Fee”) as more fully described in the tables from page 248 onwards which are accrued daily and paid monthly. An Asset Management Fee is not payable for X Shares. For the avoidance of doubt, Operating Expenses do not include either Asset Management Fees or performance fees which are separate and distinct.
The SICAV offers B Shares on the Threadneedle (Lux) - Global Technology Portfolio.
Those B Shares are a legacy Share Class available only for further subscription by existing Shareholders and bear no initial sales charge.
A SHARES:
Portfolio (s)
Initial Sales Charge as a % of the amount invested Exchange Fee
Bond Portfolios Maximum 3.0% Maximum 0.75%Equity Portfolios and Asset Allocation Portfolios Maximum 5.0% Maximum 0.75%Absolute Return Portfolios Maximum 5.0% Maximum 0.75%Extended Alpha Portfolios Maximum 5.0% Maximum 0.75%Specialist Portfolio Maximum 5.0% Maximum 0.75%Shariah Portfolio* Maximum 5.0% Maximum 0.75%
Sales charges are maximums, which distributors or sub-distributors are allowed to waive in whole or in part, depending on the size of the subscription or upon local market considerations.
Portfolio Type
Name of Portfolio
Asset Management Fee
Operating Expenses
Base Currency
Bond PortfoliosThreadneedle (Lux) - Global Corporate Bond 0.60% 0.25% USDThreadneedle (Lux) - European Corporate Bond 0.90% 0.30% EURThreadneedle (Lux) - European High Yield Bond 1.25% 0.30% EURThreadneedle (Lux) - European Short-Term High Yield Bond 0.75% 0.15% EURThreadneedle (Lux) - European Social Bond 0.40% 0.15% EURThreadneedle (Lux) - European Strategic Bond 0.90% 0.25% EURThreadneedle (Lux) - Emerging Market Corporate Bonds 1.35% 0.30% USDThreadneedle (Lux) - Emerging Market Debt 1.35% 0.30% USDThreadneedle (Lux) - Global Emerging Market Short-Term Bonds 1.30% 0.30% USDThreadneedle (Lux) - US High Yield Bond 1.25% 0.30% USDThreadneedle (Lux) - Flexible Asian Bond 0.90%1 0.25%2 USD
Asset Allocation PortfoliosThreadneedle (Lux) - Euro Dynamic Real Return 1.25% 0.30% EURThreadneedle (Lux) - Global Dynamic Real Return 1.35% 0.30% USDThreadneedle (Lux) - Global Multi Asset Income 1.25% 0.30% USD
Equity PortfoliosThreadneedle (Lux) - Emerging Market ESG Equities* 1.50% 0.30% USDThreadneedle (Lux) - Global Focus 1.50% 0.30% USDThreadneedle (Lux) - Global Emerging Market Equities 1.50% 0.30% USDThreadneedle (Lux) - Global Equity Income 1.50% 0.30% USD
5 RELATED PARTY TRANSACTIONS (continued)
Notes to the Financial Statements(continued)
249
Threadneedle (Lux) Annual Report and Audited Financial Statements March 2021
Portfolio Type
Name of Portfolio
Asset Management Fee
Operating Expenses
Base Currency
Equity Portfolios (continued)
Threadneedle (Lux) - Global Smaller Companies 1.50% 0.30% EURThreadneedle (Lux) - American 1.50% 0.30% USDThreadneedle (Lux) - American Select 1.50% 0.30% USDThreadneedle (Lux) - American Smaller Companies 1.50% 0.30% USDThreadneedle (Lux) - Asia Contrarian Equity 1.50% 0.30% USDThreadneedle (Lux) - US Contrarian Core Equities 1.50% 0.35% USDThreadneedle (Lux) - US Disciplined Core Equities 0.55% 0.15% USDThreadneedle (Lux) - Pan European ESG Equities* 1.30%3 0.25%4 EURThreadneedle (Lux) - Pan European Equity Dividend 1.50% 0.30% EURThreadneedle (Lux) - Pan European Small Cap Opportunities 1.50% 0.35% EURThreadneedle (Lux) - European Select 1.50% 0.30% EURThreadneedle (Lux) - Asian Equity Income 1.50% 0.30% USDThreadneedle (Lux) - Global Technology 1.65% 0.30% USDThreadneedle (Lux) - UK Equities 1.50% 0.30% GBPThreadneedle (Lux) - UK Equity Income 1.50% 0.30% GBP
Absolute Return PortfoliosThreadneedle (Lux) - American Absolute Alpha 1.50% 0.30% USDThreadneedle (Lux) - Global Investment Grade Credit Opportunities 0.90% 0.30% EURThreadneedle (Lux) - Pan European Absolute Alpha 1.50% 0.35% EUR
Extended Alpha PortfoliosThreadneedle (Lux) - American Extended Alpha 1.50% 0.30% USDThreadneedle (Lux) - Global Extended Alpha 1.50% 0.30% USD
Initial Sales Charge as a % of the amount invested Exchange Fee
Each Portfolio listed below N/A Nil
Portfolio Type
Name of Portfolio
Asset Management Fee
Operating Expenses
Base Currency
Equity PortfolioThreadneedle (Lux) - Global Technology 2.00% 0.35% USD
D SHARES:
Portfolio (s)
Initial Sales Charge as a % of the amount invested Exchange Fee
Each Portfolio listed below Maximum 1.00% Maximum 0.75%
Sales charges are maximums, which distributors or sub-distributors are allowed to waive in whole or in part, depending on the size of the subscription or upon local market considerations.
5 RELATED PARTY TRANSACTIONS (continued)
Notes to the Financial Statements(continued)
250
Threadneedle (Lux) Annual Report and Audited Financial Statements March 2021
Portfolio Type
Name of Portfolio
Asset Management Fee
Operating Expenses
Base Currency
Bond PortfoliosThreadneedle (Lux) - Global Corporate Bond 1.35% 0.25% USDThreadneedle (Lux) - European Strategic Bond 1.45% 0.25% EURThreadneedle (Lux) - Emerging Market Corporate Bonds 1.45% 0.30% USDThreadneedle (Lux) - Emerging Market Debt 1.45% 0.30% USDThreadneedle (Lux) - Global Emerging Market Short-Term Bonds 1.45% 0.30% USDThreadneedle (Lux) - US High Yield Bond 1.45% 0.30% USDThreadneedle (Lux) - Flexible Asian Bond 1.20%5 0.25%2 USD
Asset Allocation PortfoliosThreadneedle (Lux) - Euro Dynamic Real Return 2.00% 0.30% EURThreadneedle (Lux) - Global Dynamic Real Return 2.00% 0.30% USDThreadneedle (Lux) - Global Multi Asset income 2.00% 0.30% USD
Equity PortfoliosThreadneedle (Lux) - Global Focus 2.25% 0.30% USDThreadneedle (Lux) - Global Emerging Market Equities 2.25% 0.30% USDThreadneedle (Lux) - Global Equity Income 2.00% 0.30% USDThreadneedle (Lux) - Global Smaller Companies 2.00% 0.30% EURThreadneedle (Lux) - American 1.85% 0.30% USDThreadneedle (Lux) - American Select 2.25% 0.30% USDThreadneedle (Lux) - American Smaller Companies 2.00% 0.30% USDThreadneedle (Lux) - Asia Contrarian Equity 2.25% 0.30% USDThreadneedle (Lux) - US Contrarian Core Equities 2.00% 0.35% USDThreadneedle (Lux) - US Disciplined Core Equities 0.75% 0.15% USDThreadneedle (Lux) - Pan European ESG Equities* 1.50%6 0.25%4 EURThreadneedle (Lux) - Pan European Equity Dividend 1.85% 0.30% EURThreadneedle (Lux) - Pan European Small Cap Opportunities 2.40% 0.35% EURThreadneedle (Lux) - European Select 2.00% 0.35% EURThreadneedle (Lux) - Asian Equity Income 2.25% 0.30% USDThreadneedle (Lux) - Global Technology 2.00% 0.30% USDThreadneedle (Lux) - UK Equities 2.25% 0.35% GBPThreadneedle (Lux) - UK Equity Income 2.25% 0.30% GBP
Absolute Return PortfoliosThreadneedle (Lux) - American Absolute Alpha 2.00% 0.30% USDThreadneedle (Lux) - Global Investment Grade Credit Opportunities 1.45% 0.30% EURThreadneedle (Lux) - Pan European Absolute Alpha 2.00% 0.35% EUR
Extended Alpha PortfoliosThreadneedle (Lux) - American Extended Alpha 2.00% 0.30% USDThreadneedle (Lux) - Global Extended Alpha 2.00% 0.30% USD
Initial Sales Charge as a % of the amount invested Exchange Fee
Each Portfolio listed below N/A Maximum 0.75%
5 RELATED PARTY TRANSACTIONS (continued)
Notes to the Financial Statements(continued)
251
Threadneedle (Lux) Annual Report and Audited Financial Statements March 2021
Portfolio Type
Name of Portfolio
Asset Management Fee
Operating Expenses
Base Currency
Bond PortfoliosThreadneedle (Lux) - Global Corporate Bond 0.50% 0.15% USDThreadneedle (Lux) - European Corporate Bond 0.40% 0.20% EURThreadneedle (Lux) - European High Yield Bond 0.65% 0.20% EURThreadneedle (Lux) - European Short-Term High Yield Bond 0.40% 0.10% EURThreadneedle (Lux) - European Social Bond 0.30%7 0.10% EURThreadneedle (Lux) - European Strategic Bond 0.40% 0.15% EURThreadneedle (Lux) - Emerging Market Corporate Bonds 0.65% 0.20% USDThreadneedle (Lux) - Emerging Market Debt 0.65% 0.20% USDThreadneedle (Lux) - Global Emerging Market Short-Term Bonds 0.65% 0.20% USDThreadneedle (Lux) - US High Yield Bond 0.55% 0.10% USDThreadneedle (Lux) - Flexible Asian Bond 0.40%8 0.15%9 USD
Asset Allocation PortfoliosThreadneedle (Lux) - Euro Dynamic Real Return 0.65% 0.20% EURThreadneedle (Lux) - Global Dynamic Real Return 0.75% 0.20% USD
Equity PortfoliosThreadneedle (Lux) - Emerging Market ESG Equities* 0.65% 0.15% USDThreadneedle (Lux) - Global Focus 0.75% 0.20% USDThreadneedle (Lux) - Global Emerging Market Equities 0.75% 0.20% USDThreadneedle (Lux) - Global Equity Income 0.75% 0.20% USDThreadneedle (Lux) - Global Select 0.75% 0.20% USDThreadneedle (Lux) - Global Smaller Companies 0.75% 0.20% EURThreadneedle (Lux) - American 0.70% 0.20% USDThreadneedle (Lux) - American Select 0.80% 0.20% USDThreadneedle (Lux) - American Smaller Companies 0.75% 0.20% USDThreadneedle (Lux) - Asia Contrarian Equity 0.75% 0.20% USDThreadneedle (Lux) - Asia Equities 0.75% 0.20% USDThreadneedle (Lux) - US Contrarian Core Equities 0.80% 0.25% USDThreadneedle (Lux) - US Disciplined Core Equities 0.25% 0.10% USDThreadneedle (Lux) - Pan European ESG Equities* 0.65%10 0.15%11 EURThreadneedle (Lux) - Pan European Equity Dividend 0.75% 0.20% EURThreadneedle (Lux) - Pan European Small Cap Opportunities 0.85% 0.25% EURThreadneedle (Lux) - Pan European Smaller Companies 0.75% 0.20% EURThreadneedle (Lux) - European Select 0.75% 0.20% EURThreadneedle (Lux) - European Smaller Companies 0.75% 0.20% EURThreadneedle (Lux) - Asian Equity Income 0.75% 0.20% USDThreadneedle (Lux) - Global Technology 0.85% 0.20% USDThreadneedle (Lux) - UK Equities 0.65% 0.20% GBPThreadneedle (Lux) - UK Equity Income 0.65% 0.20% GBPThreadneedle (Lux) - STANLIB Africa Equity 1.25% 0.35% USD
Absolute Return PortfoliosThreadneedle (Lux) - American Absolute Alpha 0.75% 0.20% USDThreadneedle (Lux) - Global Investment Grade Credit Opportunities 0.35% 0.20% EURThreadneedle (Lux) - Pan European Absolute Alpha 0.75% 0.20% EUR
Extended Alpha PortfoliosThreadneedle (Lux) - American Extended Alpha 0.75% 0.15% USDThreadneedle (Lux) - Global Extended Alpha 0.75% 0.15% USD
Initial Sales Charge as a % of the amount invested Exchange Fee
Each Portfolio listed below N/A 0.75%
Sales charges are maximums, which distributors or sub-distributors are allowed to waive in whole or in part, depending on the size of the subscription or upon local market considerations.
Portfolio Type Name of Portfolio
Asset Management Fee
Operating Expenses
Base Currency
Bond PortfolioThreadneedle (Lux) - European Social Bond 0.30% 0.10% EUR
Asset Allocation PortfolioThreadneedle (Lux) - Euro Dynamic Real Return 0.50% 0.20% EUR
Equity PortfoliosThreadneedle (Lux) - Emerging Market ESG Equities* 0.35% 0.15% USDThreadneedle (Lux) - UK Equity Income 0.50% 0.20% GBP
Absolute Return PortfoliosThreadneedle (Lux) - Global Investment Grade Credit Opportunities 0.20% 0.20% EURThreadneedle (Lux) - Pan European Absolute Alpha 0.375% 0.20% EUR
N SHARES:
Portfolio (s)
Initial Sales Charge as a % of the amount invested Exchange Fee
Each Portfolio listed below N/A 0.75%
Sales charges are maximums, which distributors or sub-distributors are allowed to waive in whole or in part, depending on the size of the subscription or upon local market considerations.
Portfolio Type Name of Portfolio
Asset Management Fee
Operating Expenses
Base Currency
Bond PortfoliosThreadneedle (Lux) - Global Corporate Bond 0.30% 0.15% USDThreadneedle (Lux) - European Social Bond 0.30% 0.10% EUR
Equity PortfoliosThreadneedle (Lux) - Global Smaller Companies 0.55% 0.20% USDThreadneedle (Lux) - US Disciplined Core Equities 0.10% 0.10% USDThreadneedle (Lux) - UK Equities 0.60% 0.08% GBP
Threadneedle (Lux) Annual Report and Audited Financial Statements March 2021
S SHARES:
Portfolio (s)
Initial Sales Charge as a % of the amount invested Exchange Fee
Each Portfolio listed below Maximum 5.0% Maximum 0.75%
Sales charges are maximums, which distributors or sub-distributors are allowed to waive in whole or in part, depending on the size of the subscription or upon local market considerations.
Portfolio Type Name of Portfolio
Asset Management Fee
Operating Expenses
Base Currency
Bond PortfolioThreadneedle (Lux) - Emerging Market Debt 1.50% 0.30% USD
T SHARES:
Portfolio (s)
Initial Sales Charge as a % of the amount invested Exchange Fee
Each Portfolio listed below 5.00% 0.75%
Sales charges are maximums, which distributors or sub-distributors are allowed to waive in whole or in part, depending on the size of the subscription or upon local market considerations.
Portfolio Type Name of Portfolio
Asset Management Fee
Operating Expenses
Base Currency
Bond PortfolioThreadneedle (Lux) - US High Yield Bond 0.55% 0.10% USD
Equity PortfoliosThreadneedle (Lux) - Global Equity Income 0.90% 0.19% USDThreadneedle (Lux) - UK Equities 0.60% 0.12% GBP
W SHARES:
Portfolio (s)
Initial Sales Charge as a % of the amount invested Exchange Fee
Each Portfolio listed below Maximum 5.0% Maximum 0.75%
Sales charges are maximums, which distributors or sub-distributors are allowed to waive in whole or in part, depending on the size of the subscription or upon local market considerations.
Portfolio Type
Name of Portfolio
Asset Management Fee
Operating Expenses
Base Currency
Bond PortfoliosThreadneedle (Lux) - European Strategic Bond 0.85% 0.30% EURThreadneedle (Lux) - Emerging Market Corporate Bonds 1.00% 0.30% USDThreadneedle (Lux) - Emerging Market Debt 1.00% 0.30% USD
Asset Allocation PortfolioThreadneedle (Lux) - Global Dynamic Real Return 1.40% 0.35% USD
5 RELATED PARTY TRANSACTIONS (continued)
Notes to the Financial Statements(continued)
254
Threadneedle (Lux) Annual Report and Audited Financial Statements March 2021
Portfolio Type
Name of Portfolio
Asset Management Fee
Operating Expenses
Base Currency
Equity PortfoliosThreadneedle (Lux) - Global Focus 1.40% 0.35% USDThreadneedle (Lux) - American 1.15% 0.35% USDThreadneedle (Lux) - American Select 1.40% 0.35% USDThreadneedle (Lux) - Pan European ESG Equities* 1.40% 0.35% EURThreadneedle (Lux) - Pan European Small Cap Opportunities 1.55% 0.35% EURThreadneedle (Lux) - Asian Equity Income 1.65% 0.35% USD
X SHARES:
Portfolio (s)
Initial Sales Charge as a % of the amount invested Exchange Fee
Each Portfolio listed below N/A Maximum 0.75%
Portfolio Type
Name of Portfolio
Operating Expenses
Base Currency
Bond PortfoliosThreadneedle (Lux) - Global Corporate Bond 0.15% USDThreadneedle (Lux) - European Corporate Bond 0.15% EURThreadneedle (Lux) - European High Yield Bond 0.15% EURThreadneedle (Lux) - European Short-Term High Yield Bond 0.10% EURThreadneedle (Lux) - Emerging Market Corporate Bonds 0.15% USDThreadneedle (Lux) - Emerging Market Debt 0.15% USDThreadneedle (Lux) - Global Emerging Market Short-Term Bonds 0.15% USDThreadneedle (Lux) - US High Yield Bond 0.15% USDThreadneedle (Lux) - Flexible Asian Bond 0.15% USD
Equity PortfoliosThreadneedle (Lux) - Emerging Market ESG Equities* 0.15% USDThreadneedle (Lux) - Global Focus 0.15% USDThreadneedle (Lux) - Global Smaller Companies 0.15% EURThreadneedle (Lux) - Asia Contrarian Equity 0.15% USDThreadneedle (Lux) - US Contrarian Core Equities 0.15% USDThreadneedle (Lux) - US Disciplined Core Equities 0.10% USDThreadneedle (Lux) - Pan European ESG Equities* 0.15% EURThreadneedle (Lux) - Asian Equity Income 0.15% USD
Absolute Return PortfoliosThreadneedle (Lux) - American Absolute Alpha 0.15% USDThreadneedle (Lux) - Global Investment Grade Credit Opportunities 0.15% EURThreadneedle (Lux) - Pan European Absolute Alpha 0.15% EUR
Shariah PortfolioThreadneedle (Lux) - Gatehouse Shariah Global Equity* 0.25% USD
Y SHARES:
Portfolio (s)
Initial Sales Charge as a % of the amount invested Exchange Fee
Each Portfolio listed below 5.00% Maximum 0.75%
Sales charges are maximums, which distributors or sub-distributors are allowed to waive in whole or in part, depending on the size of the subscription or upon local market considerations.
5 RELATED PARTY TRANSACTIONS (continued)
Notes to the Financial Statements(continued)
255
Threadneedle (Lux) Annual Report and Audited Financial Statements March 2021
Initial Sales Charge as a % of the amount invested Exchange Fee
Each Portfolio listed below 5.00% Maximum 0.75%
Sales charges are maximums, which distributors or sub-distributors are allowed to waive in whole or in part, depending on the size of the subscription or upon local market considerations.
Portfolio Type
Name of Portfolio
Asset Management Fee
Operating Expenses
Base Currency
Bond PortfoliosThreadneedle (Lux) - Global Corporate Bond 0.40% 0.20% USDThreadneedle (Lux) - European Corporate Bond 0.40% 0.30% EURThreadneedle (Lux) - European High Yield Bond 0.60% 0.30% EURThreadneedle (Lux) - European Short-Term High Yield Bond 0.40% 0.15% EURThreadneedle (Lux) - European Social Bond 0.30%7 0.15% EURThreadneedle (Lux) - Emerging Market Debt 0.60% 0.30% USDThreadneedle (Lux) - Global Emerging Market Short-Term Bonds 0.60% 0.30% USDThreadneedle (Lux) - US High Yield Bond 0.60% 0.30% USDThreadneedle (Lux) - Flexible Asian Bond 0.40%8 0.25%2 USD
Asset Allocation PortfoliosThreadneedle (Lux) - Euro Dynamic Real Return 0.75% 0.30% EURThreadneedle (Lux) - Global Multi Asset Income 0.75% 0.30% USD
Equity PortfoliosThreadneedle (Lux) - Emerging Market ESG Equities* 0.75% 0.30% USDThreadneedle (Lux) - Global Focus 0.75% 0.30% USDThreadneedle (Lux) - Global Emerging Market Equities 0.75% 0.30% USDThreadneedle (Lux) - Global Equity Income 0.75% 0.30% USDThreadneedle (Lux) - Global Select 0.75% 0.30% USDThreadneedle (Lux) - Global Smaller Companies 0.75% 0.30% EURThreadneedle (Lux) - American 0.75% 0.25% USDThreadneedle (Lux) - American Select 0.75% 0.35% USDThreadneedle (Lux) - American Smaller Companies 0.75% 0.30% USDThreadneedle (Lux) - Asia Contrarian Equity 0.75% 0.30% USDThreadneedle (Lux) - Asia Equities 0.75% 0.30% USDThreadneedle (Lux) - US Contrarian Core Equities 0.75% 0.35% USDThreadneedle (Lux) - US Disciplined Core Equities 0.30% 0.15% USDThreadneedle (Lux) - Pan European ESG Equities* 0.75% 0.25%4 EURThreadneedle (Lux) - Pan European Equity Dividend 0.75% 0.30% EURThreadneedle (Lux) - Pan European Small Cap Opportunities 0.75% 0.35% EURThreadneedle (Lux) - Pan European Smaller Companies 0.75% 0.35% EURThreadneedle (Lux) - European Select 0.75% 0.30% EURThreadneedle (Lux) - European Smaller Companies 0.75% 0.35% EURThreadneedle (Lux) - Asian Equity Income 0.75% 0.30% USDThreadneedle (Lux) - Global Technology 0.85% 0.30% USDThreadneedle (Lux) - UK Equities 0.75% 0.30% GBPThreadneedle (Lux) - UK Equity Income 0.75% 0.30% GBPThreadneedle (Lux) - STANLIB Africa Equity 1.25% 0.35% USD
5 RELATED PARTY TRANSACTIONS (continued)
Notes to the Financial Statements(continued)
256
Threadneedle (Lux) Annual Report and Audited Financial Statements March 2021
Portfolio Type
Name of Portfolio
Asset Management Fee
Operating Expenses
Base Currency
Absolute Return PortfoliosThreadneedle (Lux) - American Absolute Alpha 0.75% 0.30% USDThreadneedle (Lux) - Credit Opportunities 0.55% 0.25% EURThreadneedle (Lux) - Global Investment Grade Credit Opportunities 0.45% 0.25% EURThreadneedle (Lux) - Pan European Absolute Alpha 0.75% 0.30% EUR
Extended Alpha PortfoliosThreadneedle (Lux) - American Extended Alpha 0.75% 0.30% USDThreadneedle (Lux) - Global Extended Alpha 0.75% 0.30% USD
Initial Sales Charge as a % of the amount invested Exchange Fee
Each Portfolio listed below 5.00% N/A
Sales charges are maximums, which distributors or sub-distributors are allowed to waive in whole or in part, depending on the size of the subscription or upon local market considerations.
Portfolio Type
Name of Portfolio
Asset Management Fee
Operating Expenses
Base Currency
Bond PortfoliosThreadneedle (Lux) - European Corporate Bond 1.00% 0.19% EURThreadneedle (Lux) - European High Yield Bond 1.20% 0.18% EUR
Equity PortfoliosThreadneedle (Lux) - Global Emerging Market Equities 1.50% 0.21% USDThreadneedle (Lux) - Global Equity Income 1.50% 0.18% USDThreadneedle (Lux) - Global Select 1.50% 0.18% USDThreadneedle (Lux) - American 1.50% 0.17% USDThreadneedle (Lux) - American Select 1.50% 0.17% USDThreadneedle (Lux) - American Smaller Companies 1.50% 0.18% USDThreadneedle (Lux) - Asia Equities 1.50% 0.20% USDThreadneedle (Lux) - Pan European ESG Equities* 1.30%3 0.23% EURThreadneedle (Lux) - Pan European Equity Dividend 1.50% 0.20% EURThreadneedle (Lux) - Pan European Smaller Companies 1.50% 0.22% EURThreadneedle (Lux) - European Select 1.50% 0.15% EURThreadneedle (Lux) - European Smaller Companies 1.50% 0.22% EURThreadneedle (Lux) - UK Equity Income 1.50% 0.14% GBP
Extended Alpha PortfoliosThreadneedle (Lux) - American Extended Alpha 0.75% 0.08% USDThreadneedle (Lux) - Global Extended Alpha 0.75% 0.08% USD
3 SHARES:
Portfolio (s)
Initial Sales Charge as a % of the amount invested Exchange Fee
Each Portfolio listed below Maximum 3.00% N/A
Sales charges are maximums, which distributors or sub-distributors are allowed to waive in whole or in part, depending on the size of the subscription or upon local market considerations.
Portfolio Type
Name of Portfolio
Asset Management Fee
Operating Expenses
Base Currency
Bond PortfoliosThreadneedle (Lux) - European Corporate Bond 0.50% 0.19% EURThreadneedle (Lux) - European High Yield Bond 0.60% 0.17% EUR
Equity PortfoliosThreadneedle (Lux) - Global Equity Income 0.75% 0.18% USDThreadneedle (Lux) - Global Select 0.75% 0.15% USDThreadneedle (Lux) - American 0.75% 0.13% USDThreadneedle (Lux) - American Select 0.75% 0.12% USDThreadneedle (Lux) - American Smaller Companies 0.75% 0.18% USD
5 RELATED PARTY TRANSACTIONS (continued)
Notes to the Financial Statements(continued)
258
Threadneedle (Lux) Annual Report and Audited Financial Statements March 2021
Portfolio Type
Name of Portfolio
Asset Management Fee
Operating Expenses
Base Currency
Equity Portfolios (continued)
Threadneedle (Lux) - Asia Equities 0.75% 0.20% USDThreadneedle (Lux) - Pan European ESG Equities* 0.75% 0.19% EURThreadneedle (Lux) - Pan European Equity Dividend 0.75% 0.20% EURThreadneedle (Lux) - Pan European Smaller Companies 0.75% 0.16% EURThreadneedle (Lux) - European Select 0.75% 0.13% EURThreadneedle (Lux) - European Smaller Companies 0.75% 0.18% EURThreadneedle (Lux) - UK Equities 0.75% 0.12% GBPThreadneedle (Lux) - UK Equity Income 0.75% 0.13% GBP
Initial Sales Charge as a % of the amount invested Exchange Fee
Each Portfolio listed below N/A N/A
Portfolio Type
Name of Portfolio
Operating Expenses
Base Currency
Bond PortfoliosThreadneedle (Lux) - European Corporate Bond 0.08% EURThreadneedle (Lux) - European High Yield Bond 0.07% EUR
Equity PortfoliosThreadneedle (Lux) - Pan European ESG Equities* 0.08% EURThreadneedle (Lux) - Pan European Equity Dividend 0.09% EURThreadneedle (Lux) - Pan European Smaller Companies 0.07% EUR
*See note 1.11.25% until September 30, 2020.20.30% until September 30, 2020.31.50% until October 1, 2020.40.30% until October 1, 2020.51.45% until September 30, 2020.61.85% until October 1, 2020.70.40% until August 31, 2020.80.60% until September 30, 2020.90.20% until September 30, 2020.100.75% until October 1, 2020.110.20% until October 1, 2020.
5 RELATED PARTY TRANSACTIONS (continued)
Notes to the Financial Statements(continued)
260
Threadneedle (Lux) Annual Report and Audited Financial Statements March 2021
6 COMMISSION SHARING ARRANGEMENTS
The Management Company and certain Sub-Advisors may enter into commission sharing arrangements with broker-dealers under which certain business services are obtained from such broker-dealers directly or from third parties and are paid for by the broker-dealers out of the commissions they receive on transactions for the SICAV. Consistent with obtaining best execution, brokerage commissions on portfolio transactions for the SICAV may be specifically allocated by the Management Company or each relevant Sub-Advisor to broker-dealers in consideration of any research services rendered as well as for services rendered in the execution of orders by such broker-dealers. Additional information on each Sub-Advisor’s practices with respect to commission sharing arrangements is detailed in the section of the Prospectus with the heading “Investment Advisory Arrangements”.
Any commission sharing arrangement entered into by the Management company or a Sub-Advisor will operate under the following conditions: (i) the Management Company or the Sub-Advisor will act at all times in the best interest of the SICAV and of its Shareholders when entering into commission sharing arrangements; (ii) the services provided will be in direct relationship to the activities of the Management Company or Sub-Advisor; (iii) brokerage commissions on portfolio transactions for the SICAV will be allocated by the Management Company or the Sub-Advisor to broker-dealers that are entities and not to individuals; (iv) commission sharing arrangements are not a determining factor in the selection of the broker-dealers; (v) the Management Company or the Sub-Advisor will provide reports to the Directors with respect to commission sharing arrangements including the nature of the services it receives; (vi) neither the Management Company, the Sub-Advisor nor any of their connected persons may retain cash or other rebates from broker-dealers; (vii) the goods or services received are of demonstrable benefit to the Shareholders.; and (viii) periodic disclosure will be made in the SICAV’s annual report in the form of statement describing any such commission sharing arrangements, including a description of the goods and services received. The goods and services received may include: research that can add value to a Sub-Advisor’s decision making process and execution services that enhance the Sub-Advisor’s ability to execute transactions.
Only the Sub-Advisors Columbia Management Investment Advisors, LLC and STANLIB Asset Management (Pty) Limited may enter into commission sharing arrangements.
7 DIVIDENDS
The SICAV declared the following dividends during the year ended March 31, 2021:
Portfolio Share Class Ex-Date CurrencyAmount
per ShareTotal
Amount
Threadneedle (Lux) - Global Corporate Bond Class AEC 24/06/2020 USD 0.097 35,066 Class AEC 24/09/2020 USD 0.089 60,779 Class AEC 22/12/2020 USD 0.084 97,387 Class AEC 25/03/2021 USD 0.076 122,093 Class AUP 24/06/2020 USD 0.093 373 Class AUP 24/09/2020 USD 0.087 3,837 Class AUP 22/12/2020 USD 0.083 5,052 Class AUP 25/03/2021 USD 0.069 6,440 Class DEC 24/06/2020 USD 0.089 361 Class DEC 24/09/2020 USD 0.082 3,728 Class DEC 22/12/2020 USD 0.078 6,372 Class DEC 25/03/2021 USD 0.073 7,593 Class DUP 24/06/2020 USD 0.089 2,108 Class DUP 24/09/2020 USD 0.078 3,147 Class DUP 22/12/2020 USD 0.072 5,076 Class DUP 25/03/2021 USD 0.067 4,309 Class IEC 24/06/2020 USD 0.094 9 Class IEC 24/09/2020 USD 0.086 1,173 Class IEC 22/12/2020 USD 0.083 89,680 Class IEC 25/03/2021 USD 0.082 97,141 Class IEP 24/06/2020 USD 0.107 11 Class IEP 24/09/2020 USD 0.092 9 Class IEP 22/12/2020 USD 0.085 9 Class IEP 25/03/2021 USD 0.086 82 Class IGC 24/06/2020 USD 0.108 11 Class IGC 24/09/2020 USD 0.098 17,506 Class IGC 22/12/2020 USD 0.089 17,230 Class IGC 25/03/2021 USD 0.096 19,823 Class IUP 24/06/2020 USD 0.091 9
Notes to the Financial Statements(continued)
261
Threadneedle (Lux) Annual Report and Audited Financial Statements March 2021
Portfolio Share Class Ex-Date CurrencyAmount
per ShareTotal
Amount
Threadneedle (Lux) - Global Corporate Bond (continued) Class IUP 24/09/2020 USD 0.080 6,180
Class IUP 22/12/2020 USD 0.068 8,010 Class IUP 25/03/2021 USD 0.062 11,161 Class NEC 24/06/2020 USD 0.096 19,905 Class NEC 24/09/2020 USD 0.088 17,468 Class NEC 22/12/2020 USD 0.083 16,808 Class NEC 25/03/2021 USD 0.085 17,588 Class NGC 24/06/2020 USD 0.106 500,867 Class NGC 24/09/2020 USD 0.096 640,393 Class NGC 22/12/2020 USD 0.083 678,943 Class NGC 25/03/2021 USD 0.089 858,610 Class NUP 24/06/2020 USD 0.092 2,308 Class NUP 24/09/2020 USD 0.081 3,418 Class NUP 22/12/2020 USD 0.075 5,562 Class NUP 25/03/2021 USD 0.069 6,132
USD 3,399,767
Threadneedle (Lux) - European High Yield Bond Class IEP 25/03/2021 EUR 0.365 1,776,394 Class ZEP 25/03/2021 EUR 0.371 139,958 Class 1EP 25/03/2021 EUR 0.373 467,107 Class 1GP 25/03/2021 EUR 0.411 9,699 Class 1UT 24/04/2020 EUR 0.028 7,064 Class 1UT 22/05/2020 EUR 0.029 7,423 Class 1UT 24/06/2020 EUR 0.032 8,329 Class 1UT 27/07/2020 EUR 0.030 7,917 Class 1UT 24/08/2020 EUR 0.025 6,474 Class 1UT 24/09/2020 EUR 0.030 7,884 Class 1UT 26/10/2020 EUR 0.027 7,109 Class 1UT 23/11/2020 EUR 0.024 6,433 Class 1UT 22/12/2020 EUR 0.026 7,460 Class 1UT 25/01/2021 EUR 0.027 7,770 Class 1UT 22/02/2021 EUR 0.025 5,481 Class 1UT 25/03/2021 EUR 0.030 6,416 Class 2EP 25/03/2021 EUR 0.372 37 Class 2GP 25/03/2021 EUR 0.414 41 Class 3EP 25/03/2021 EUR 0.375 1,188,222 Class 3FC 25/03/2021 EUR 0.345 4,517 Class 3GP 25/03/2021 EUR 0.413 40,652 Class 8EP 25/03/2021 EUR 0.374 2,077,735 Class 8GP 25/03/2021 EUR 0.415 2,189 Class 9EP 25/03/2021 EUR 0.376 2,854 Class 9FC 25/03/2021 EUR 0.347 1,104 Class 9GP 25/03/2021 EUR 0.414 41
EUR 5,796,310
7 DIVIDENDS (continued)
Notes to the Financial Statements(continued)
262
Threadneedle (Lux) Annual Report and Audited Financial Statements March 2021
Portfolio Share Class Ex-Date CurrencyAmount
per ShareTotal
Amount
Threadneedle (Lux) - European Short-Term High Yield Bond Class AEP 25/03/2021 EUR 3.475 586
Class IEP 25/03/2021 EUR 3.467 35 Class IGC 25/03/2021 EUR 3.954 40 Class XGC 25/03/2021 EUR 4.009 287,858
EUR 288,519
Threadneedle (Lux) - European Social Bond Class AEP 24/09/2020 EUR 0.002 0** Class AEP 22/12/2020 EUR 0.029 87 Class AEP 25/03/2021 EUR 0.029 87 Class ASC 25/03/2021 EUR 0.005 1 Class AUC 25/03/2021 EUR 0.008 1 Class IEP 24/06/2020 EUR 0.032 72,976 Class IEP 24/09/2020 EUR 0.033 76,441 Class IEP 22/12/2020 EUR 0.027 70,760 Class IEP 25/03/2021 EUR 0.030 93,021 Class ISC 25/03/2021 EUR 0.005 1 Class IUC 25/03/2021 EUR 0.008 1 Class NEP 24/06/2020 EUR 3.199 259,953 Class NEP 24/09/2020 EUR 3.370 274,705 Class NEP 22/12/2020 EUR 2.743 252,516 Class NEP 25/03/2021 EUR 3.040 280,569 Class ZEP 24/06/2020 EUR 0.029 7,652 Class ZEP 24/09/2020 EUR 0.032 9,425 Class ZEP 22/12/2020 EUR 0.028 9,002 Class ZEP 25/03/2021 EUR 0.030 9,821 Class ZGC 24/06/2020 EUR 0.034 3 Class ZGC 24/09/2020 EUR 0.038 4 Class ZGC 22/12/2020 EUR 0.034 13,345 Class ZGC 25/03/2021 EUR 0.035 41,030
EUR 1,471,401
Threadneedle (Lux) - European Strategic Bond Class AEP 24/04/2020 EUR 0.028 12,947 Class AEP 22/05/2020 EUR 0.028 12,822 Class AEP 24/06/2020 EUR 0.038 17,581 Class AEP 27/07/2020 EUR 0.038 18,233 Class AEP 24/08/2020 EUR 0.038 18,463 Class AEP 24/09/2020 EUR 0.041 20,221 Class AEP 26/10/2020 EUR 0.041 20,911 Class AEP 23/11/2020 EUR 0.041 25,101 Class AEP 22/12/2020 EUR 0.036 22,384 Class AEP 25/01/2021 EUR 0.036 22,647 Class AEP 22/02/2021 EUR 0.036 25,178 Class AEP 25/03/2021 EUR 0.032 23,383 Class DEP 24/04/2020 EUR 0.021 14,591 Class DEP 22/05/2020 EUR 0.021 14,719 Class DEP 24/06/2020 EUR 0.029 19,939 Class DEP 27/07/2020 EUR 0.029 21,843
7 DIVIDENDS (continued)
Notes to the Financial Statements(continued)
263
Threadneedle (Lux) Annual Report and Audited Financial Statements March 2021
Portfolio Share Class Ex-Date CurrencyAmount
per ShareTotal
Amount
Threadneedle (Lux) - European Strategic Bond (continued) Class DEP 24/08/2020 EUR 0.029 21,810
Class DEP 24/09/2020 EUR 0.031 24,943 Class DEP 26/10/2020 EUR 0.031 29,292 Class DEP 23/11/2020 EUR 0.031 30,883 Class DEP 22/12/2020 EUR 0.027 28,993 Class DEP 25/01/2021 EUR 0.027 32,439 Class DEP 22/02/2021 EUR 0.027 36,429 Class DEP 25/03/2021 EUR 0.024 36,990
Class AEC 22/05/2020 USD 0.048 17,680 Class AEC 24/06/2020 USD 0.060 23,856 Class AEC 27/07/2020 USD 0.062 25,595 Class AEC 24/08/2020 USD 0.062 28,009 Class AEC 24/09/2020 USD 0.061 27,883 Class AEC 26/10/2020 USD 0.062 28,876 Class AEC 23/11/2020 USD 0.062 29,579 Class AEC 22/12/2020 USD 0.062 30,574 Class AEC 25/01/2021 USD 0.062 30,826 Class AEC 22/02/2021 USD 0.062 31,021 Class AEC 25/03/2021 USD 0.051 25,842 Class AUP 24/04/2020 USD 0.028 21,568 Class AUP 22/05/2020 USD 0.028 21,765 Class AUP 24/06/2020 USD 0.034 26,719 Class AUP 27/07/2020 USD 0.034 26,991 Class AUP 24/08/2020 USD 0.034 26,542 Class AUP 24/09/2020 USD 0.033 25,897 Class AUP 26/10/2020 USD 0.033 27,035 Class AUP 23/11/2020 USD 0.033 26,914 Class AUP 22/12/2020 USD 0.032 26,563 Class AUP 25/01/2021 USD 0.032 26,933 Class AUP 22/02/2021 USD 0.032 27,010 Class AUP 25/03/2021 USD 0.028 23,042 Class DEC 24/04/2020 USD 0.035 1,793 Class DEC 22/05/2020 USD 0.035 1,821 Class DEC 24/06/2020 USD 0.044 2,271 Class DEC 27/07/2020 USD 0.045 2,253 Class DEC 24/08/2020 USD 0.046 2,186 Class DEC 24/09/2020 USD 0.043 1,786 Class DEC 26/10/2020 USD 0.044 1,810 Class DEC 23/11/2020 USD 0.044 1,813 Class DEC 22/12/2020 USD 0.045 2,173 Class DEC 25/01/2021 USD 0.045 2,280 Class DEC 22/02/2021 USD 0.045 2,463 Class DEC 25/03/2021 USD 0.038 2,078 Class IEC 25/03/2021 USD 0.039 4 Class XUP 24/06/2020 USD 0.145 15 Class XUP 24/09/2020 USD 0.138 14
7 DIVIDENDS (continued)
Notes to the Financial Statements(continued)
264
Threadneedle (Lux) Annual Report and Audited Financial Statements March 2021
Threadneedle (Lux) - Emerging Market Debt Class AEC 24/04/2020 USD 0.038 3,742 Class AEC 22/05/2020 USD 0.038 3,460 Class AEC 24/06/2020 USD 0.047 4,149 Class AEC 27/07/2020 USD 0.049 4,288 Class AEC 24/08/2020 USD 0.049 4,334 Class AEC 24/09/2020 USD 0.043 3,543 Class AEC 26/10/2020 USD 0.044 3,565 Class AEC 23/11/2020 USD 0.044 3,458 Class AEC 22/12/2020 USD 0.048 3,706 Class AEC 25/01/2021 USD 0.047 3,517 Class AEC 22/02/2021 USD 0.047 3,528 Class AEC 25/03/2021 USD 0.041 3,170 Class AUP 24/04/2020 USD 0.043 153,393 Class AUP 22/05/2020 USD 0.043 152,373 Class AUP 24/06/2020 USD 0.052 181,552 Class AUP 27/07/2020 USD 0.052 180,604 Class AUP 24/08/2020 USD 0.052 178,811 Class AUP 24/09/2020 USD 0.045 153,074 Class AUP 26/10/2020 USD 0.045 151,660 Class AUP 23/11/2020 USD 0.045 149,525 Class AUP 22/12/2020 USD 0.048 157,120 Class AUP 25/01/2021 USD 0.048 155,101 Class AUP 22/02/2021 USD 0.048 154,276 Class AUP 25/03/2021 USD 0.043 136,804 Class SUP 24/04/2020 USD 0.041 2,412 Class SUP 22/05/2020 USD 0.041 2,412 Class SUP 24/06/2020 USD 0.050 2,941 Class SUP 27/07/2020 USD 0.050 2,941 Class SUP 24/08/2020 USD 0.050 2,941 Class SUP 24/09/2020 USD 0.043 2,529 Class SUP 26/10/2020 USD 0.043 2,529 Class SUP 23/11/2020 USD 0.043 2,529 Class SUP 22/12/2020 USD 0.046 2,704 Class SUP 25/01/2021 USD 0.046 2,695 Class SUP 22/02/2021 USD 0.046 2,695 Class SUP 25/03/2021 USD 0.041 2,157 Class XUP 24/06/2020 USD 0.122 12 Class XUP 24/09/2020 USD 0.129 13 Class XUP 22/12/2020 USD 0.125 13 Class XUP 25/03/2021 USD 0.132 13
USD 1,980,289
7 DIVIDENDS (continued)
Notes to the Financial Statements(continued)
265
Threadneedle (Lux) Annual Report and Audited Financial Statements March 2021
Portfolio Share Class Ex-Date CurrencyAmount
per ShareTotal
Amount
Threadneedle (Lux) - Global Emerging Market Short-Term Bonds Class AEC 24/04/2020 USD 0.023 20,811
Class AEC 22/05/2020 USD 0.023 22,213 Class AEC 24/06/2020 USD 0.027 25,317 Class AEC 27/07/2020 USD 0.028 26,283 Class AEC 24/08/2020 USD 0.028 26,437 Class AEC 24/09/2020 USD 0.027 24,834 Class AEC 26/10/2020 USD 0.027 24,378 Class AEC 23/11/2020 USD 0.027 24,271 Class AEC 22/12/2020 USD 0.028 75,209 Class AEC 25/01/2021 USD 0.028 74,845 Class AEC 22/02/2021 USD 0.028 74,119 Class AEC 25/03/2021 USD 0.025 88,288 Class ASC 24/04/2020 USD 0.020 801 Class ASC 22/05/2020 USD 0.020 800 Class ASC 24/06/2020 USD 0.024 951 Class ASC 27/07/2020 USD 0.024 976 Class ASC 24/08/2020 USD 0.024 1,025 Class ASC 24/09/2020 USD 0.023 1,035 Class ASC 26/10/2020 USD 0.024 1,020 Class ASC 23/11/2020 USD 0.024 1,019 Class ASC 22/12/2020 USD 0.023 979 Class ASC 25/01/2021 USD 0.023 1,013 Class ASC 22/02/2021 USD 0.023 1,081 Class ASC 25/03/2021 USD 0.022 3,024 Class AUP 24/04/2020 USD 0.022 43,534 Class AUP 22/05/2020 USD 0.022 41,507 Class AUP 24/06/2020 USD 0.026 48,760 Class AUP 27/07/2020 USD 0.026 48,323 Class AUP 24/08/2020 USD 0.026 48,130 Class AUP 24/09/2020 USD 0.025 45,876 Class AUP 26/10/2020 USD 0.025 45,527 Class AUP 23/11/2020 USD 0.025 45,309 Class AUP 22/12/2020 USD 0.024 43,249 Class AUP 25/01/2021 USD 0.024 42,801 Class AUP 22/02/2021 USD 0.024 42,448 Class AUP 25/03/2021 USD 0.023 38,474 Class XUP 24/04/2020 USD 0.037 36,889 Class XUP 22/05/2020 USD 0.037 36,889 Class XUP 24/06/2020 USD 0.044 45,272 Class XUP 27/07/2020 USD 0.044 46,382 Class XUP 24/08/2020 USD 0.044 46,382 Class XUP 24/09/2020 USD 0.042 47,626 Class XUP 26/10/2020 USD 0.042 47,626 Class XUP 23/11/2020 USD 0.042 47,626 Class XUP 22/12/2020 USD 0.042 39,597 Class XUP 25/01/2021 USD 0.042 39,598 Class XUP 22/02/2021 USD 0.042 39,598 Class XUP 25/03/2021 USD 0.039 36,770
USD 1,564,922
7 DIVIDENDS (continued)
Notes to the Financial Statements(continued)
266
Threadneedle (Lux) Annual Report and Audited Financial Statements March 2021
Portfolio Share Class Ex-Date CurrencyAmount
per ShareTotal
Amount
Threadneedle (Lux) - US High Yield Bond Class AEC 24/04/2020 USD 0.051 1,839 Class AEC 22/05/2020 USD 0.052 1,867 Class AEC 24/06/2020 USD 0.065 2,409 Class AEC 27/07/2020 USD 0.067 2,250 Class AEC 24/08/2020 USD 0.068 2,252 Class AEC 24/09/2020 USD 0.063 2,078 Class AEC 26/10/2020 USD 0.064 2,106 Class AEC 23/11/2020 USD 0.064 2,077 Class AEC 22/12/2020 USD 0.068 2,317 Class AEC 25/01/2021 USD 0.068 2,200 Class AEC 22/02/2021 USD 0.068 2,028 Class AEC 25/03/2021 USD 0.065 1,913 Class AUP 24/04/2020 USD 0.050 14,599 Class AUP 22/05/2020 USD 0.050 14,504 Class AUP 24/06/2020 USD 0.062 18,068 Class AUP 27/07/2020 USD 0.062 18,339 Class AUP 24/08/2020 USD 0.062 18,322 Class AUP 24/09/2020 USD 0.057 17,175 Class AUP 26/10/2020 USD 0.057 17,238 Class AUP 23/11/2020 USD 0.057 17,219 Class AUP 22/12/2020 USD 0.059 17,556 Class AUP 25/01/2021 USD 0.059 17,498 Class AUP 22/02/2021 USD 0.059 17,494 Class AUP 25/03/2021 USD 0.059 17,294 Class DEC 24/04/2020 USD 0.038 1,368 Class DEC 22/05/2020 USD 0.038 1,389 Class DEC 24/06/2020 USD 0.049 1,786 Class DEC 27/07/2020 USD 0.051 1,808 Class DEC 24/08/2020 USD 0.052 1,558 Class DEC 24/09/2020 USD 0.047 1,404 Class DEC 26/10/2020 USD 0.047 1,423 Class DEC 23/11/2020 USD 0.047 1,425 Class DEC 22/12/2020 USD 0.051 1,539 Class DEC 25/01/2021 USD 0.051 1,534 Class DEC 22/02/2021 USD 0.051 1,529 Class DEC 25/03/2021 USD 0.049 1,456 Class IEC 24/04/2020 USD 0.037 4 Class IEC 22/05/2020 USD 0.037 4 Class IEC 24/06/2020 USD 0.047 5 Class IEC 27/07/2020 USD 0.049 5 Class IEC 24/08/2020 USD 0.049 5 Class IEC 24/09/2020 USD 0.046 5 Class IEC 26/10/2020 USD 0.046 5 Class IEC 23/11/2020 USD 0.046 5 Class IEC 22/12/2020 USD 0.050 5 Class IEC 25/01/2021 USD 0.050 5 Class IEC 22/02/2021 USD 0.050 5 Class IEC 25/03/2021 USD 0.047 5 Class XUP 24/06/2020 USD 0.154 15 Class XUP 24/09/2020 USD 0.145 15
7 DIVIDENDS (continued)
Notes to the Financial Statements(continued)
267
Threadneedle (Lux) Annual Report and Audited Financial Statements March 2021
Portfolio Share Class Ex-Date CurrencyAmount
per ShareTotal
Amount
Threadneedle (Lux) - US High Yield Bond (continued) Class XUP 22/12/2020 USD 0.143 14
Class XUP 25/03/2021 USD 0.150 15
USD 248,978
Threadneedle (Lux) - Flexible Asian Bond Class ASC 24/04/2020 USD 0.023 304 Class ASC 22/05/2020 USD 0.023 318 Class ASC 24/06/2020 USD 0.027 372 Class ASC 27/07/2020 USD 0.027 359 Class ASC 24/08/2020 USD 0.028 420 Class ASC 24/09/2020 USD 0.028 369 Class ASC 26/10/2020 USD 0.029 310 Class ASC 23/11/2020 USD 0.029 289 Class ASC 22/12/2020 USD 0.026 224 Class ASC 25/01/2021 USD 0.026 219 Class ASC 22/02/2021 USD 0.026 227 Class ASC 25/03/2021 USD 0.024 319 Class AUP 24/04/2020 USD 0.035 1,094 Class AUP 22/05/2020 USD 0.035 1,907 Class AUP 24/06/2020 USD 0.040 3,570 Class AUP 27/07/2020 USD 0.040 5,215 Class AUP 24/08/2020 USD 0.040 13,792 Class AUP 24/09/2020 USD 0.041 24,642 Class AUP 26/10/2020 USD 0.041 35,692 Class AUP 23/11/2020 USD 0.041 44,904 Class AUP 22/12/2020 USD 0.036 45,871 Class AUP 25/01/2021 USD 0.036 46,181 Class AUP 22/02/2021 USD 0.036 46,299 Class AUP 25/03/2021 USD 0.033 42,632 Class AVC 24/04/2020 USD 0.020 2 Class AVC 22/05/2020 USD 0.021 2 Class AVC 24/06/2020 USD 0.026 3 Class AVC 27/07/2020 USD 0.026 3 Class AVC 24/08/2020 USD 0.026 3 Class AVC 24/09/2020 USD 0.027 3 Class AVC 26/10/2020 USD 0.027 3 Class AVC 23/11/2020 USD 0.028 3 Class AVC 22/12/2020 USD 0.025 2 Class AVC 25/01/2021 USD 0.025 3 Class AVC 22/02/2021 USD 0.026 3 Class AVC 25/03/2021 USD 0.024 2 Class ZUP 24/04/2020 USD 0.033 3 Class ZUP 22/05/2020 USD 0.033 3 Class ZUP 24/06/2020 USD 0.038 4 Class ZUP 27/07/2020 USD 0.038 4 Class ZUP 24/08/2020 USD 0.038 4 Class ZUP 24/09/2020 USD 0.039 4 Class ZUP 26/10/2020 USD 0.039 4 Class ZUP 23/11/2020 USD 0.039 4 Class ZUP 22/12/2020 USD 0.035 4
7 DIVIDENDS (continued)
Notes to the Financial Statements(continued)
268
Threadneedle (Lux) Annual Report and Audited Financial Statements March 2021
Portfolio Share Class Ex-Date CurrencyAmount
per ShareTotal
Amount
Threadneedle (Lux) - Flexible Asian Bond (continued) Class ZUP 25/01/2021 USD 0.035 4
Class ZUP 22/02/2021 USD 0.035 4 Class ZUP 25/03/2021 USD 0.032 3
USD 315,606
Threadneedle (Lux) - Euro Dynamic Real Return Class AEP 24/09/2020 EUR 0.009 1 Class AEP 25/03/2021 EUR 0.002 0** Class IEP 24/09/2020 EUR 0.009 1 Class IEP 25/03/2021 EUR 0.002 0** Class LEP 24/09/2020 EUR 0.009 1 Class LEP 25/03/2021 EUR 0.002 0** Class ZEP 24/09/2020 EUR 0.009 1 Class ZEP 25/03/2021 EUR 0.002 0**
EUR 4
Threadneedle (Lux) - Global Dynamic Real Return Class AEC 24/04/2020 USD 0.016 2,111 Class AEC 22/05/2020 USD 0.016 2,129 Class AEC 24/06/2020 USD 0.021 2,816 Class AEC 27/07/2020 USD 0.022 2,910 Class AEC 24/08/2020 USD 0.022 2,415 Class AEC 24/09/2020 USD 0.020 1,772 Class AEC 26/10/2020 USD 0.020 1,797 Class AEC 23/11/2020 USD 0.020 1,800 Class AEC 22/12/2020 USD 0.018 1,632 Class AEC 25/01/2021 USD 0.018 1,626 Class AEC 22/02/2021 USD 0.018 1,242 Class AEC 25/03/2021 USD 0.014 908 Class AUP 24/04/2020 USD 0.017 7,427 Class AUP 22/05/2020 USD 0.017 7,389 Class AUP 24/06/2020 USD 0.022 9,485 Class AUP 27/07/2020 USD 0.022 9,431 Class AUP 24/08/2020 USD 0.022 9,367 Class AUP 24/09/2020 USD 0.019 8,181 Class AUP 26/10/2020 USD 0.019 8,134 Class AUP 23/11/2020 USD 0.019 7,880 Class AUP 22/12/2020 USD 0.017 6,856 Class AUP 25/01/2021 USD 0.017 6,765 Class AUP 22/02/2021 USD 0.017 6,700 Class AUP 25/03/2021 USD 0.014 5,400
USD 116,173
Threadneedle (Lux) - Global Multi Asset Income Class AEC 24/06/2020 USD 0.106 784,842 Class AEC 24/09/2020 USD 0.110 763,324 Class AEC 22/12/2020 USD 0.123 773,770 Class AEC 25/03/2021 USD 0.122 692,978 Class AEP 24/06/2020 USD 0.124 286,976 Class AEP 24/09/2020 USD 0.125 255,186 Class AEP 22/12/2020 USD 0.136 247,324 Class AEP 25/03/2021 USD 0.137 235,449
7 DIVIDENDS (continued)
Notes to the Financial Statements(continued)
269
Threadneedle (Lux) Annual Report and Audited Financial Statements March 2021
Portfolio Share Class Ex-Date CurrencyAmount
per ShareTotal
Amount
Threadneedle (Lux) - Global Multi Asset Income (continued) Class AQM 24/04/2020 USD 0.041 4
Class AQM 22/05/2020 USD 0.041 4 Class AQM 24/06/2020 USD 0.047 5 Class AQM 27/07/2020 USD 0.047 5 Class AQM 24/08/2020 USD 0.047 5 Class AQM 24/09/2020 USD 0.048 5 Class AQM 26/10/2020 USD 0.048 5 Class AQM 23/11/2020 USD 0.048 5 Class AQM 22/12/2020 USD 0.052 5 Class AQM 25/01/2021 USD 0.052 5 Class AQM 22/02/2021 USD 0.052 5 Class ASC 24/06/2020 USD 0.078 990 Class ASC 24/09/2020 USD 0.080 940 Class ASC 22/12/2020 USD 0.088 1,465 Class ASC 25/03/2021 USD 0.089 1,629 Class ASP 24/06/2020 USD 0.080 1,377 Class ASP 24/09/2020 USD 0.081 1,375 Class ASP 22/12/2020 USD 0.087 504 Class ASP 25/03/2021 USD 0.088 555 Class AUM 24/04/2020 USD 0.033 1,345 Class AUM 22/05/2020 USD 0.033 1,345 Class AUM 24/06/2020 USD 0.038 1,549 Class AUM 27/07/2020 USD 0.038 1,549 Class AUM 24/08/2020 USD 0.038 1,549 Class AUM 24/09/2020 USD 0.038 1,549 Class AUM 26/10/2020 USD 0.038 1,549 Class AUM 23/11/2020 USD 0.038 1,549 Class AUM 22/12/2020 USD 0.042 1,712 Class AUM 25/01/2021 USD 0.042 1,712 Class AUM 22/02/2021 USD 0.042 1,712 Class AUM 25/03/2021 USD 0.042 1,712 Class AUP 24/06/2020 USD 0.109 147,991 Class AUP 24/09/2020 USD 0.110 149,644 Class AUP 22/12/2020 USD 0.119 156,095 Class AUP 25/03/2021 USD 0.121 142,852 Class DEC 24/06/2020 USD 0.101 421,767 Class DEC 24/09/2020 USD 0.105 405,405 Class DEC 22/12/2020 USD 0.118 421,130 Class DEC 25/03/2021 USD 0.116 370,210 Class DEP 24/06/2020 USD 0.118 72,629 Class DEP 24/09/2020 USD 0.119 59,528 Class DEP 22/12/2020 USD 0.128 57,924 Class DEP 25/03/2021 USD 0.130 52,701 Class DUP 24/06/2020 USD 0.100 228,523 Class DUP 24/09/2020 USD 0.101 222,839 Class DUP 22/12/2020 USD 0.109 222,525 Class DUP 25/03/2021 USD 0.110 232,488 Class ZEC 24/06/2020 USD 0.116 12 Class ZEC 24/09/2020 USD 0.121 12 Class ZEC 22/12/2020 USD 0.137 14
7 DIVIDENDS (continued)
Notes to the Financial Statements(continued)
270
Threadneedle (Lux) Annual Report and Audited Financial Statements March 2021
Portfolio Share Class Ex-Date CurrencyAmount
per ShareTotal
Amount
Threadneedle (Lux) - Global Multi Asset Income (continued) Class ZEC 25/03/2021 USD 0.134 13
Class ZUP 24/06/2020 USD 0.109 11 Class ZUP 24/09/2020 USD 0.110 11 Class ZUP 22/12/2020 USD 0.119 12 Class ZUP 25/03/2021 USD 0.121 12
Threadneedle (Lux) - Global Focus Class AEP 24/09/2020 USD 0.078 68,771 Class AEP 25/03/2021 USD 0.058 87,876 Class AUP 24/09/2020 USD 0.048 923 Class AUP 25/03/2021 USD 0.050 1,162 Class IUP 24/09/2020 USD 0.039 138 Class IUP 25/03/2021 USD 0.054 1,409 Class ZEP 24/09/2020 USD 0.068 66,973 Class ZEP 25/03/2021 USD 0.053 120,022
USD 347,274
Threadneedle (Lux) - Global Equity Income Class AEC 24/06/2020 USD 0.103 321 Class AEC 24/09/2020 USD 0.091 282 Class AEC 22/12/2020 USD 0.065 201 Class AEC 25/03/2021 USD 0.088 403 Class AUP 24/06/2020 USD 0.099 10 Class AUP 24/09/2020 USD 0.082 8 Class AUP 22/12/2020 USD 0.058 6 Class AUP 25/03/2021 USD 0.077 8 Class DEC 24/06/2020 USD 0.102 10 Class DEC 24/09/2020 USD 0.091 9 Class DEC 22/12/2020 USD 0.065 6 Class DEC 25/03/2021 USD 0.086 9 Class DUP 24/06/2020 USD 0.098 10 Class DUP 24/09/2020 USD 0.082 8 Class DUP 22/12/2020 USD 0.057 6 Class DUP 25/03/2021 USD 0.076 8 Class 1EP 24/06/2020 USD 0.115 200,541 Class 1EP 24/09/2020 USD 0.098 162,644 Class 1EP 22/12/2020 USD 0.067 108,490 Class 1EP 25/03/2021 USD 0.089 140,041 Class 1SC 24/06/2020 USD 0.069 40,129 Class 1SC 24/09/2020 USD 0.060 33,926 Class 1SC 22/12/2020 USD 0.042 23,838 Class 1SC 25/03/2021 USD 0.059 30,800 Class 1ST 24/04/2020 USD 0.019 1,818 Class 1ST 22/05/2020 USD 0.029 2,766
7 DIVIDENDS (continued)
Notes to the Financial Statements(continued)
271
Threadneedle (Lux) Annual Report and Audited Financial Statements March 2021
Portfolio Share Class Ex-Date CurrencyAmount
per ShareTotal
Amount
Threadneedle (Lux) - Global Equity Income (continued) Class 1ST 24/06/2020 USD 0.021 1,997
Class 1ST 27/07/2020 USD 0.020 1,950 Class 1ST 24/08/2020 USD 0.020 2,292 Class 1ST 24/09/2020 USD 0.016 1,804 Class 1ST 26/10/2020 USD 0.013 1,488 Class 1ST 23/11/2020 USD 0.017 1,922 Class 1ST 22/12/2020 USD 0.012 1,348 Class 1ST 25/01/2021 USD 0.009 863 Class 1ST 22/02/2021 USD 0.017 1,587 Class 1ST 25/03/2021 USD 0.033 2,777 Class 1UP 24/06/2020 USD 0.102 53,559 Class 1UP 24/09/2020 USD 0.083 42,770 Class 1UP 22/12/2020 USD 0.064 28,715 Class 1UP 25/03/2021 USD 0.078 34,219 Class 1VT 24/04/2020 USD 0.017 128 Class 1VT 22/05/2020 USD 0.026 198 Class 1VT 24/06/2020 USD 0.019 149 Class 1VT 27/07/2020 USD 0.019 148 Class 1VT 24/08/2020 USD 0.021 165 Class 1VT 24/09/2020 USD 0.016 121 Class 1VT 26/10/2020 USD 0.012 93 Class 1VT 23/11/2020 USD 0.017 124 Class 1VT 22/12/2020 USD 0.011 84 Class 1VT 25/01/2021 USD 0.008 57 Class 1VT 22/02/2021 USD 0.017 122 Class 1VT 25/03/2021 USD 0.033 242 Class 2EP 24/06/2020 USD 0.115 634,505 Class 2EP 24/09/2020 USD 0.096 10 Class 2EP 22/12/2020 USD 0.067 7 Class 2EP 25/03/2021 USD 0.090 9 Class 2UP 24/06/2020 USD 0.100 10 Class 2UP 24/09/2020 USD 0.084 8 Class 2UP 22/12/2020 USD 0.059 6 Class 2UP 25/03/2021 USD 0.078 8 Class 3EP 24/06/2020 USD 0.125 1,446,916 Class 3EP 24/09/2020 USD 0.098 1,102,691 Class 3EP 22/12/2020 USD 0.070 723,731 Class 3EP 25/03/2021 USD 0.091 905,988 Class 3UP 24/06/2020 USD 0.101 4,423 Class 3UP 24/09/2020 USD 0.084 3,679 Class 3UP 22/12/2020 USD 0.061 2,502 Class 3UP 25/03/2021 USD 0.082 3,224 Class 8EP 24/06/2020 USD 0.115 19 Class 8EP 24/09/2020 USD 0.096 16 Class 8EP 22/12/2020 USD 0.067 11 Class 8EP 25/03/2021 USD 0.089 15 Class 8UP 24/06/2020 USD 0.100 7,131 Class 8UP 24/09/2020 USD 0.084 5,990
7 DIVIDENDS (continued)
Notes to the Financial Statements(continued)
272
Threadneedle (Lux) Annual Report and Audited Financial Statements March 2021
Portfolio Share Class Ex-Date CurrencyAmount
per ShareTotal
Amount
Threadneedle (Lux) - Global Equity Income (continued) Class 8UP 22/12/2020 USD 0.059 4,207
Class 8UP 25/03/2021 USD 0.080 4,632 Class 9EP 24/06/2020 USD 0.115 11 Class 9EP 24/09/2020 USD 0.097 10 Class 9EP 22/12/2020 USD 0.067 7 Class 9EP 25/03/2021 USD 0.090 9 Class 9UP 24/06/2020 USD 0.100 10 Class 9UP 24/09/2020 USD 0.084 8 Class 9UP 22/12/2020 USD 0.059 6 Class 9UP 25/03/2021 USD 0.079 8
USD 5,775,027
Threadneedle (Lux) - Global Smaller Companies Class AEP 25/03/2021 EUR 0.090 765,959 Class AUP 25/03/2021 EUR 0.077 2,962 Class IEP 25/03/2021 EUR 0.030 99,185
EUR 868,106
Threadneedle (Lux) - American Class 1EP 25/03/2021 USD 0.213 64,259
USD 64,259
Threadneedle (Lux) - American Select Class 1EP 25/03/2021 USD 0.041 18,680
USD 18,680
Threadneedle (Lux) - American Smaller Companies Class 1EP 25/03/2021 USD 0.174 151,100
USD 151,100
Threadneedle (Lux) - Asia Contrarian Equity Class XUP 24/09/2020 USD 0.223 1,046,567 Class XUP 25/03/2021 USD 0.123 577,254
USD 1,623,821
Threadneedle (Lux) - US Contrarian Core Equities Class AEC 24/09/2020 USD 0.111 5 Class AEC 25/03/2021 USD 0.128 40 Class AUP 24/09/2020 USD 0.101 1,516 Class AUP 25/03/2021 USD 0.130 1,769
USD 3,330
Threadneedle (Lux) - US Disciplined Core Equities Class AUP 24/09/2020 USD 0.124 6,117 Class AUP 25/03/2021 USD 0.123 12 Class IEC 24/09/2020 USD 0.131 23 Class IEC 25/03/2021 USD 0.137 14
USD 6,166
Threadneedle (Lux) - Pan European ESG Equities* Class 1EP 25/03/2021 EUR 0.232 24 Class 1GP 25/03/2021 EUR 0.259 26 Class 3GP 25/03/2021 EUR 0.263 26 Class 9GP 25/03/2021 EUR 0.263 26
EUR 102
7 DIVIDENDS (continued)
Notes to the Financial Statements(continued)
273
Threadneedle (Lux) Annual Report and Audited Financial Statements March 2021
Portfolio Share Class Ex-Date CurrencyAmount
per ShareTotal
Amount
Threadneedle (Lux) - Pan European Equity Dividend Class AEP 24/09/2020 EUR 0.211 897 Class AEP 25/03/2021 EUR 0.131 616 Class AUP 24/09/2020 EUR 0.192 19 Class AUP 25/03/2021 EUR 0.126 13 Class DEP 24/09/2020 EUR 0.210 464 Class DEP 25/03/2021 EUR 0.137 303 Class IEP 24/09/2020 EUR 0.211 1,534 Class IEP 25/03/2021 EUR 0.141 7,064 Class ZEP 24/09/2020 EUR 0.214 21 Class ZEP 25/03/2021 EUR 0.140 1,584 Class 1EP 24/09/2020 EUR 0.021 249,570 Class 1EP 25/03/2021 EUR 0.014 158,778 Class 1GP 24/09/2020 EUR 0.021 7,825 Class 1GP 25/03/2021 EUR 0.014 4,591 Class 2EP 24/09/2020 EUR 0.214 21 Class 2EP 25/03/2021 EUR 0.141 14 Class 2GP 24/09/2020 EUR 0.243 24 Class 2GP 25/03/2021 EUR 0.160 16 Class 3EP 24/09/2020 EUR 0.034 2,407 Class 3EP 25/03/2021 EUR 0.022 1,558 Class 3GP 24/09/2020 EUR 0.039 36,882 Class 3GP 25/03/2021 EUR 0.022 20,083 Class 4GP 24/09/2020 EUR 0.032 269,295 Class 4GP 25/03/2021 EUR 0.021 146,528 Class 8EP 24/09/2020 EUR 0.023 23,163 Class 8EP 25/03/2021 EUR 0.015 14,354 Class 8GP 24/09/2020 EUR 0.023 10,100 Class 8GP 25/03/2021 EUR 0.015 6,719 Class 9EP 24/09/2020 EUR 0.215 22 Class 9EP 25/03/2021 EUR 0.141 1,029 Class 9GP 24/09/2020 EUR 0.244 24 Class 9GP 25/03/2021 EUR 0.160 16
EUR 965,534
Threadneedle (Lux) - Pan European Smaller Companies Class 1EP 25/03/2021 EUR 0.088 80,459
Class 3EP 25/03/2021 EUR 0.089 147,868 Class 3GP 25/03/2021 EUR 0.099 14,315 Class 9EP 25/03/2021 EUR 0.089 9 Class 9GP 25/03/2021 EUR 0.099 10
EUR 242,661
Threadneedle (Lux) - European Select Class 1EP 25/03/2021 EUR 0.151 116,680 Class 2EP 25/03/2021 EUR 0.153 15 Class 8EP 25/03/2021 EUR 0.153 11,672
EUR 128,367
7 DIVIDENDS (continued)
Notes to the Financial Statements(continued)
274
Threadneedle (Lux) Annual Report and Audited Financial Statements March 2021
Portfolio Share Class Ex-Date CurrencyAmount
per ShareTotal
Amount
Threadneedle (Lux) - European Smaller Companies Class 1EP 25/03/2021 EUR 0.121 265,296 Class 3EP 25/03/2021 EUR 0.123 134,617 Class 9EP 25/03/2021 EUR 0.123 77,011
EUR 476,924
Threadneedle (Lux) - Asian Equity Income Class AUP 24/09/2020 USD 0.303 1,915 Class AUP 25/03/2021 USD 0.162 2,318 Class DUP 24/09/2020 USD 0.251 90 Class DUP 25/03/2021 USD 0.160 521 Class IEP 24/09/2020 USD 0.290 29 Class IEP 25/03/2021 USD 0.186 62,135 Class XUP 24/09/2020 USD 0.232 321,416 Class XUP 25/03/2021 USD 0.167 145,565 Class ZGP 24/09/2020 USD 0.300 30 Class ZGP 25/03/2021 USD 0.192 19 Class ZUP 24/09/2020 USD 0.292 986 Class ZUP 25/03/2021 USD 0.187 646
USD 535,670
Threadneedle (Lux) - Global Technology Class AUP 25/03/2021 USD 0.122 1,931
USD 1,931
Threadneedle (Lux) - UK Equities Class AGP 24/09/2020 GBP 0.298 110,781 Class AGP 25/03/2021 GBP 0.238 15,783 Class IGP 24/09/2020 GBP 0.436 433,643 Class IGP 25/03/2021 GBP 0.347 685,416 Class NGP 25/03/2021 GBP 0.119 12 Class TGP 25/03/2021 GBP 0.119 12 Class ZGP 24/09/2020 GBP 0.138 174,245 Class ZGP 25/03/2021 GBP 0.124 157,240 Class 9EP 24/09/2020 GBP 0.107 212,576 Class 9EP 25/03/2021 GBP 0.097 461,592
GBP 2,251,300
Threadneedle (Lux) - UK Equity Income Class AEC 24/06/2020 GBP 0.055 212 Class AEC 24/09/2020 GBP 0.049 213 Class AEC 22/12/2020 GBP 0.064 306 Class AEC 25/03/2021 GBP 0.041 2,051 Class ASC 24/06/2020 GBP 0.050 149 Class ASC 24/09/2020 GBP 0.033 98 Class ASC 22/12/2020 GBP 0.043 8 Class ASC 25/03/2021 GBP 0.026 5 Class AUC 24/06/2020 GBP 0.057 7 Class AUC 24/09/2020 GBP 0.047 6 Class AUC 22/12/2020 GBP 0.060 8 Class AUC 25/03/2021 GBP 0.036 5,155 Class DEC 24/06/2020 GBP 0.056 6 Class DEC 24/09/2020 GBP 0.050 6 Class DEC 22/12/2020 GBP 0.064 7 Class DEC 25/03/2021 GBP 0.039 4 Class DGP 24/06/2020 GBP 0.068 7
7 DIVIDENDS (continued)
Notes to the Financial Statements(continued)
275
Threadneedle (Lux) Annual Report and Audited Financial Statements March 2021
Portfolio Share Class Ex-Date CurrencyAmount
per ShareTotal
Amount
Threadneedle (Lux) - UK Equity Income (continued) Class DGP 24/09/2020 GBP 0.060 6
Class DGP 22/12/2020 GBP 0.077 8 Class DGP 25/03/2021 GBP 0.048 5 Class IGP 24/06/2020 GBP 0.070 85,607 Class IGP 24/09/2020 GBP 0.062 70,164 Class IGP 22/12/2020 GBP 0.080 83,854 Class IGP 25/03/2021 GBP 0.050 52,860 Class LGP 24/06/2020 GBP 0.073 534,197 Class LGP 24/09/2020 GBP 0.061 447,043 Class LGP 22/12/2020 GBP 0.067 628,919 Class LGP 25/03/2021 GBP 0.050 497,316 Class ZGP 24/06/2020 GBP 0.073 351 Class ZGP 24/09/2020 GBP 0.064 308 Class ZGP 22/12/2020 GBP 0.083 399 Class ZGP 25/03/2021 GBP 0.052 335
GBP 2,409,620
Threadneedle (Lux) - Credit Opportunities Class 1EP 25/03/2021 EUR 0.308 32,403 Class 2EP 25/03/2021 EUR 0.331 33 Class 2GC 25/03/2021 EUR 0.378 38 Class 8EP 25/03/2021 EUR 0.340 40,282 Class 8GC 25/03/2021 EUR 0.384 25,950
EUR 98,706
Threadneedle (Lux) - Global Investment Grade Credit Opportunities Class IEP 24/06/2020 EUR 0.110 11
Class IEP 24/09/2020 EUR 0.082 8 Class IEP 22/12/2020 EUR 0.064 6 Class IEP 25/03/2021 EUR 0.065 7 Class LEP 24/06/2020 EUR 0.120 8,593 Class LEP 24/09/2020 EUR 0.079 6,208 Class LEP 22/12/2020 EUR 0.066 5,188 Class LEP 25/03/2021 EUR 0.067 7
EUR 20,028
*See note 1.**Fractional amount rounded to 0.
7 DIVIDENDS (continued)
Notes to the Financial Statements(continued)
276
Threadneedle (Lux) Annual Report and Audited Financial Statements March 2021
8 PERFORMANCE FEES
The Management Company shall receive a performance fee as set forth below with respect to the Share Classes of the Portfolios listed in the table below. Daily provisions shall be set up for the accrual of the performance fee in respect of the performance fee balance (as described below), whereby the amount accrued shall be paid to the Management Company at the end of each calendar year (i.e. December 31). The amount of this performance fee depends on the performance of the Net Asset Value of the relevant Share Class within the relevant Portfolio compared to the performance of the relevant performance index (the “Performance Index”, as per the table below). Accruals will only be made when the performance fee balance is positive and the NAV High Water Mark (defined below) is exceeded.
For the avoidance of doubt, performance of Share Classes includes dividends paid.
Portfolio Share Classes Performance Index Performance Rate
Threadneedle (Lux) - American Absolute Alpha A Shares Higher of 3 month LIBOR (US$)1 plus 1.50% or 1.50% 20%
D SharesI SharesZ Shares
Threadneedle (Lux) - Global Investment Grade Credit Opportunities
J Shares Higher of ICE BofA Euro Currency Deposit Bid Rate Constant Maturity (1M) (Local Total Return) index2 plus 1.00% or 1.00% 10%
Y SharesThreadneedle (Lux) - Pan European Absolute Alpha A Shares Higher of 3 month EURIBOR (EUR)3 plus 1.50%
or 1.50% 20%D SharesI SharesL SharesZ Shares
1 The benchmark is provided by ICE Benchmark Administration Limited, an administrator included in the ESMA register of benchmark administrators. The Management Company maintains a written plan setting out the actions that will be taken in the event of the benchmark materially changing or ceasing to be provided. Prior to August 3, 2020, the Performance Index was the higher of 3 month LIBOR (US$) or zero.
2 The benchmark is provided by ICE Data Indices LLC, an administrator included in the ESMA register of benchmark administrators. The Management Company maintains a written plan setting out the actions that will be taken in the event of the benchmark materially changing or ceasing to be provided.
3 The benchmark is provided by the European Money Markets Institute, an administrator included in the ESMA register of benchmark administrators. The Management Company maintains a written plan setting out the actions that will be taken in the event of the benchmark materially changing or ceasing to be provided. Prior to August 3, 2020, the Performance Index was the higher of 3 Month EURIBOR (EUR) or zero.
The performance of the Threadneedle (Lux) - American Absolute Alpha Portfolio, the Threadneedle (Lux) - Global Investment Grade Credit Opportunities Portfolio and the Threadneedle (Lux) - Pan European Absolute Alpha Portfolio, including the impact of all applicable fees, is compared to the Performance Index.
The performance fee balance shall be calculated on the difference between the performance of the Performance Index and the performance of the Share Class concerned (the “Daily Difference”):
(i) in the event the Daily Difference is positive, the performance fee balance will increase by an amount in respect of the Daily Difference, at the relevant performance rate;
(ii) if the Daily Difference is negative, the performance fee balance will be reduced by an amount in respect of the Daily Difference, at the relevant performance rate.
If the performance fee balance is positive as at the end of the calendar year, i.e. December 31, and the NAV High Water Mark has been exceeded, the accrued amount of the performance fee will be paid to the Management Company within the first quarter of the subsequent calendar year. A performance fee shall only be paid to the Management Company if the Net Asset Value of the relevant Share Class exceeds the NAV High Water Mark.
If at the end of the calendar year the performance fee balance is negative and the NAV High Water Mark has been exceeded, such negative amount will be reset. For the avoidance of doubt, no performance fee would be due in this scenario.
If at the end of the calendar year the performance fee balance is negative and the NAV High Water Mark has not been exceeded, such negative amount will be carried forward and the Management Company shall not receive the payment of a performance fee until the amount of the accrued performance fee is positive and the NAV High Water Mark has been exceeded, at any subsequent calendar year’s end.
In the event that a Portfolio or a Share Class is liquidated or a Portfolio or Share Class becomes dormant, any outstanding performance fee accrual shall be realised and payable to the Management Company. Thereafter, when new Shareholders have invested in such a Portfolio or Share Class, the performance fee balance will be reset.
Notes to the Financial Statements(continued)
277
Threadneedle (Lux) Annual Report and Audited Financial Statements March 2021
8 PERFORMANCE FEES (continued)
NAV High Water Mark: in respect of each Share Class, is the Net Asset Value of a Share of such Share Class as at the last Valuation Date of the last relevant calendar year in which any accrued performance fee was paid, or the negative performance fee balance was reset. If a performance fee has never been paid, the NAV High Water Mark is the inception price of the relevant Share Class.
There is no maximum value on the performance fee that could be taken.
As at March 31, 2021, performance fees amounted to EUR 10 for the Threadneedle (Lux) - Global Investment Grade Credit Opportunities and EUR 109,679 for the Threadneedle (Lux) - Pan European Absolute Alpha.
9 NET UNREALISED GAIN/(LOSS) ON FORWARD CURRENCY EXCHANGE CONTRACTS
As at March 31, 2021, the SICAV has the following forward currency exchange contracts outstanding:
PortfolioMaturity
DateCurrency
PurchasedAmount
PurchasedCurrency
SoldAmount
Sold Purpose Counterparty
Unrealised gain/(loss)
in the portfolio base currency
Threadneedle (Lux) - Global Corporate Bond 19/04/2021 EUR 13,054,884 USD 15,567,113 Hedging JP Morgan Chase New York (217,677)
19/04/2021 EUR 17,449,532 USD 20,807,451 Hedging JP Morgan Chase New York (290,954)19/04/2021 SEK 19,633 USD 2,301 Hedging JP Morgan Chase New York (48)19/04/2021 EUR 3,270,326 USD 3,899,654 Hedging JP Morgan Chase New York (54,529)19/04/2021 EUR 1,027,477 USD 1,225,200 Hedging JP Morgan Chase New York (17,132)19/04/2021 EUR 11,119,130 USD 13,258,851 Hedging JP Morgan Chase New York (185,400)19/04/2021 GBP 25,025,154 USD 34,617,772 Hedging JP Morgan Chase New York (88,389)19/04/2021 SEK 275,052 USD 32,237 Hedging JP Morgan Chase New York (676)19/04/2021 GBP 307,225 USD 424,991 Hedging JP Morgan Chase New York (1,085)19/04/2021 EUR 14,207,777 USD 16,941,865 Hedging JP Morgan Chase New York (236,900)19/04/2021 EUR 1,427,567 USD 1,702,282 Hedging JP Morgan Chase New York (23,803)19/04/2021 GBP 12,344,958 USD 17,077,015 Hedging JP Morgan Chase New York (43,602)19/04/2021 GBP 101,470,938 USD 140,366,676 Hedging JP Morgan Chase New York (358,395)19/04/2021 EUR 12,737,317 USD 15,188,436 Hedging JP Morgan Chase New York (212,382)19/04/2021 GBP 2,248,191 USD 3,109,965 Hedging JP Morgan Chase New York (7,941)19/04/2021 EUR 2,213,722 USD 2,639,721 Hedging JP Morgan Chase New York (36,912)19/04/2021 GBP 104,685,735 USD 144,813,767 Hedging JP Morgan Chase New York (369,750)19/04/2021 NOK 10,678 USD 1,258 Hedging JP Morgan Chase New York (7)19/04/2021 NOK 10,724 USD 1,264 Hedging JP Morgan Chase New York (7)19/04/2021 CHF 982 USD 1,059 Hedging JP Morgan Chase New York (15)19/04/2021 CHF 984 USD 1,061 Hedging JP Morgan Chase New York (15)19/04/2021 EUR 985 USD 1,175 Hedging JP Morgan Chase New York (16)19/04/2021 USD 46,209 EUR 38,749 Hedging JP Morgan Chase New York 64919/04/2021 EUR 55,538 USD 66,229 Hedging JP Morgan Chase New York (930)19/04/2021 EUR 5,644 USD 6,731 Hedging JP Morgan Chase New York (95)19/04/2021 GBP 1,150 USD 1,594 Hedging JP Morgan Chase New York (8)19/04/2021 GBP 295,526 USD 409,755 Hedging JP Morgan Chase New York (1,992)19/04/2021 USD 25,406 EUR 21,304 Hedging JP Morgan Chase New York 35719/04/2021 EUR 15,893 USD 18,917 Hedging JP Morgan Chase New York (231)19/04/2021 EUR 20,094 USD 23,918 Hedging JP Morgan Chase New York (292)19/04/2021 USD 147,644 EUR 124,040 Hedging JP Morgan Chase New York 1,80119/04/2021 USD 11,735 EUR 9,859 Hedging JP Morgan Chase New York 14319/04/2021 USD 3,594 GBP 2,587 Hedging JP Morgan Chase New York 2519/04/2021 GBP 132,384 USD 183,952 Hedging JP Morgan Chase New York (1,290)19/04/2021 USD 33,107 EUR 27,814 Hedging JP Morgan Chase New York 40419/04/2021 EUR 26,574 USD 31,655 Hedging JP Morgan Chase New York (411)19/04/2021 EUR 19,461 USD 23,182 Hedging JP Morgan Chase New York (301)19/04/2021 EUR 8,813 USD 10,498 Hedging JP Morgan Chase New York (136)
Notes to the Financial Statements(continued)
278
Threadneedle (Lux) Annual Report and Audited Financial Statements March 2021
PortfolioMaturity
DateCurrency
PurchasedAmount
PurchasedCurrency
SoldAmount
Sold Purpose Counterparty
Unrealised gain/(loss)
in the portfolio base currency
Threadneedle (Lux) - Global Corporate Bond (continued) 19/04/2021 GBP 287,838 USD 399,750 Hedging JP Morgan Chase New York (2,595)
19/04/2021 USD 3,165,903 EUR 2,657,716 Hedging JP Morgan Chase New York 41,04619/04/2021 GBP 11,475 USD 15,937 Hedging JP Morgan Chase New York (103)19/04/2021 GBP 175,118 USD 243,205 Hedging JP Morgan Chase New York (1,579)19/04/2021 USD 128,426 EUR 107,629 Hedging JP Morgan Chase New York 1,87919/04/2021 EUR 20,161 USD 24,057 Hedging JP Morgan Chase New York (352)19/04/2021 EUR 499 USD 595 Hedging JP Morgan Chase New York (9)19/04/2021 USD 66,105 EUR 55,400 Hedging JP Morgan Chase New York 96719/04/2021 GBP 48,971 USD 68,258 Hedging JP Morgan Chase New York (688)19/04/2021 GBP 100,767 USD 140,453 Hedging JP Morgan Chase New York (1,417)19/04/2021 USD 23,829 EUR 19,996 Hedging JP Morgan Chase New York 31819/04/2021 USD 41,082 EUR 34,475 Hedging JP Morgan Chase New York 54819/04/2021 EUR 7,578 USD 9,031 Hedging JP Morgan Chase New York (120)19/04/2021 USD 28,385 GBP 20,460 Hedging JP Morgan Chase New York 15419/04/2021 USD 10,758 EUR 9,028 Hedging JP Morgan Chase New York 14319/04/2021 USD 7,952 GBP 5,732 Hedging JP Morgan Chase New York 4319/04/2021 GBP 38,163 USD 52,945 Hedging JP Morgan Chase New York (288)19/04/2021 USD 4,569 GBP 3,294 Hedging JP Morgan Chase New York 2519/04/2021 USD 33,409 EUR 27,982 Hedging JP Morgan Chase New York 50819/04/2021 EUR 16,217 USD 19,362 Hedging JP Morgan Chase New York (295)19/04/2021 EUR 4,988 USD 5,955 Hedging JP Morgan Chase New York (91)19/04/2021 EUR 1,460 USD 1,743 Hedging JP Morgan Chase New York (27)19/04/2021 GBP 1,493 USD 2,068 Hedging JP Morgan Chase New York (9)19/04/2021 GBP 94,336 USD 130,712 Hedging JP Morgan Chase New York (549)19/04/2021 USD 13,656 EUR 11,437 Hedging JP Morgan Chase New York 20819/04/2021 EUR 43,678 USD 51,884 Hedging JP Morgan Chase New York (529)19/04/2021 USD 95,794 EUR 80,644 Hedging JP Morgan Chase New York 97619/04/2021 GBP 4,939 USD 6,812 Hedging JP Morgan Chase New York 219/04/2021 USD 41,967 GBP 30,425 Hedging JP Morgan Chase New York (13)19/04/2021 USD 12,027 EUR 10,125 Hedging JP Morgan Chase New York 12319/04/2021 USD 13,497 EUR 11,403 Hedging JP Morgan Chase New York 9019/04/2021 EUR 14,932 USD 17,674 Hedging JP Morgan Chase New York (117)19/04/2021 EUR 2,490 USD 2,947 Hedging JP Morgan Chase New York (20)19/04/2021 USD 169,873 GBP 123,793 Hedging JP Morgan Chase New York (935)19/04/2021 USD 67,371 GBP 49,096 Hedging JP Morgan Chase New York (371)19/04/2021 GBP 92,066 USD 126,336 Hedging JP Morgan Chase New York 69519/04/2021 EUR 3,361 USD 3,978 Hedging JP Morgan Chase New York (26)19/04/2021 USD 18,326 EUR 15,556 Hedging JP Morgan Chase New York 3619/04/2021 USD 230,008 EUR 195,243 Hedging JP Morgan Chase New York 44919/04/2021 USD 46,029 EUR 39,072 Hedging JP Morgan Chase New York 9019/04/2021 EUR 2,340 USD 2,756 Hedging JP Morgan Chase New York (5)19/04/2021 USD 3,301 GBP 2,405 Hedging JP Morgan Chase New York (18)19/04/2021 GBP 21,143 USD 29,014 Hedging JP Morgan Chase New York 15819/04/2021 EUR 25,423 USD 29,950 Hedging JP Morgan Chase New York (58)19/04/2021 USD 5,434 EUR 4,604 Hedging JP Morgan Chase New York 2019/04/2021 EUR 18,872 USD 22,273 Hedging JP Morgan Chase New York (84)19/04/2021 GBP 748 USD 1,031 Hedging JP Morgan Chase New York 0
9 NET UNREALISED GAIN/(LOSS) ON FORWARD CURRENCY EXCHANGE CONTRACTS (continued)
Notes to the Financial Statements(continued)
279
Threadneedle (Lux) Annual Report and Audited Financial Statements March 2021
9 NET UNREALISED GAIN/(LOSS) ON FORWARD CURRENCY EXCHANGE CONTRACTS (continued)
PortfolioMaturity
DateCurrency
PurchasedAmount
PurchasedCurrency
SoldAmount
Sold Purpose Counterparty
Unrealised gain/(loss)
in the portfolio base currency
Threadneedle (Lux) - Global Corporate Bond (continued) 19/04/2021 GBP 41,766 USD 57,608 Hedging JP Morgan Chase New York 21
19/04/2021 EUR 26,528 USD 31,218 Hedging JP Morgan Chase New York (28)19/04/2021 USD 29,653 EUR 25,198 Hedging JP Morgan Chase New York 2619/04/2021 EUR 7,090 USD 8,344 Hedging JP Morgan Chase New York (7)19/04/2021 GBP 119,238 USD 164,210 Hedging JP Morgan Chase New York 31319/04/2021 GBP 4,355 USD 5,998 Hedging JP Morgan Chase New York 1119/04/2021 EUR 46,229 USD 54,229 Hedging JP Morgan Chase New York 12519/04/2021 EUR 29,862 USD 35,030 Hedging JP Morgan Chase New York 8119/04/2021 EUR 4,990 USD 5,854 Hedging JP Morgan Chase New York 1319/04/2021 EUR 6,225 USD 7,302 Hedging JP Morgan Chase New York 1719/04/2021 GBP 2,987 USD 4,096 Hedging JP Morgan Chase New York 2619/04/2021 GBP 107,320 USD 147,158 Hedging JP Morgan Chase New York 92126/04/2021 USD 57,667,674 GBP 42,025,513 Trading Barclays (319,984)26/04/2021 USD 190,321,811 EUR 160,723,027 Trading Barclays 1,321,58926/04/2021 USD 1,477,314 JPY 160,546,194 Trading Barclays 23,99026/04/2021 USD 65,672 AUD 86,115 Trading Barclays 7326/04/2021 USD 1,766,963 CAD 2,221,655 Trading Barclays (763)26/04/2021 USD 25,723 CAD 32,294 Trading Barclays 2726/04/2021 USD 2,699 AUD 3,546 Trading Goldman Sachs (2)26/04/2021 USD 21,849 CAD 27,489 Trading Goldman Sachs (23)26/04/2021 AUD 1,109 USD 845 Trading Barclays 026/04/2021 CAD 33,344 USD 26,468 Trading Barclays 6326/04/2021 USD 847 AUD 1,109 Trading Goldman Sachs 226/04/2021 JPY 802,953 USD 7,330 Trading Goldman Sachs (61)26/04/2021 USD 2,120,314 EUR 1,800,000 Trading Barclays 3,63226/04/2021 CAD 40,856 USD 32,425 Trading Barclays 8426/04/2021 AUD 1,555 USD 1,185 Trading Goldman Sachs 026/04/2021 EUR 550,000 USD 645,629 Trading Barclays 1,13426/04/2021 GBP 200,000 USD 275,037 Trading Barclays 92726/04/2021 AUD 3,970 USD 3,026 Trading Barclays (1)
USD (1,077,556)
Threadneedle (Lux) - European Corporate Bond 19/04/2021 NOK 10,432 EUR 1,031 Hedging JP Morgan Chase New York 9
19/04/2021 NOK 10,513 EUR 1,039 Hedging JP Morgan Chase New York 919/04/2021 CHF 1,009 EUR 912 Hedging JP Morgan Chase New York 019/04/2021 CHF 1,010 EUR 913 Hedging JP Morgan Chase New York 019/04/2021 USD 1,015 EUR 851 Hedging JP Morgan Chase New York 1219/04/2021 GBP 1,014 EUR 1,176 Hedging JP Morgan Chase New York 1422/04/2021 EUR 5,136,577 USD 6,139,367 Trading Barclays (84,746)22/04/2021 EUR 3,401,019 GBP 2,906,798 Trading Barclays (10,013)22/04/2021 EUR 898,945 USD 1,070,520 Trading Barclays (11,494)
EUR (106,209)
Notes to the Financial Statements(continued)
280
Threadneedle (Lux) Annual Report and Audited Financial Statements March 2021
9 NET UNREALISED GAIN/(LOSS) ON FORWARD CURRENCY EXCHANGE CONTRACTS (continued)
PortfolioMaturity
DateCurrency
PurchasedAmount
PurchasedCurrency
SoldAmount
Sold Purpose Counterparty
Unrealised gain/(loss)
in the portfolio base currency
Threadneedle (Lux) - European High Yield Bond 19/04/2021 SEK 10,489 EUR 1,031 Hedging JP Morgan Chase New York (7)
19/04/2021 SEK 10,578 EUR 1,040 Hedging JP Morgan Chase New York (7)19/04/2021 USD 2,277,369 EUR 1,909,846 Hedging JP Morgan Chase New York 27,08319/04/2021 CHF 357,035 EUR 322,824 Hedging JP Morgan Chase New York (6)19/04/2021 CHF 134,862 EUR 121,939 Hedging JP Morgan Chase New York (2)19/04/2021 CHF 566,327 EUR 512,062 Hedging JP Morgan Chase New York (10)19/04/2021 CHF 75,742 EUR 68,485 Hedging JP Morgan Chase New York (1)19/04/2021 CHF 33,032 EUR 29,867 Hedging JP Morgan Chase New York (1)19/04/2021 CHF 25,760 EUR 23,292 Hedging JP Morgan Chase New York 019/04/2021 NOK 10,541 EUR 1,042 Hedging JP Morgan Chase New York 919/04/2021 NOK 10,637 EUR 1,051 Hedging JP Morgan Chase New York 919/04/2021 EUR 99,357 CHF 110,034 Hedging JP Morgan Chase New York (132)19/04/2021 EUR 4,601 CHF 5,103 Hedging JP Morgan Chase New York (13)19/04/2021 EUR 1,124 CHF 1,247 Hedging JP Morgan Chase New York (3)19/04/2021 EUR 5,643 CHF 6,256 Hedging JP Morgan Chase New York (14)22/04/2021 EUR 9,425,686 USD 11,265,820 Trading Barclays (155,509)22/04/2021 EUR 79,207,324 GBP 67,697,264 Trading Barclays (233,203)22/04/2021 USD 28,674 EUR 24,078 Trading Barclays 30822/04/2021 EUR 32,833 USD 38,681 Trading Barclays (64)22/04/2021 EUR 1,643,167 GBP 1,400,000 Trading Lloyds 315
EUR (361,248)
Threadneedle (Lux) - European Short-Term High Yield Bond 19/04/2021 SEK 10,363 EUR 1,019 Hedging JP Morgan Chase New York (7)
19/04/2021 NOK 10,477 EUR 1,035 Hedging JP Morgan Chase New York 919/04/2021 GBP 1,050 EUR 1,218 Hedging JP Morgan Chase New York 1419/04/2021 GBP 1,025 EUR 1,189 Hedging JP Morgan Chase New York 1419/04/2021 GBP 63,033,292 EUR 73,127,184 Hedging JP Morgan Chase New York 844,02319/04/2021 SEK 10,377 EUR 1,020 Hedging JP Morgan Chase New York (7)19/04/2021 NOK 10,447 EUR 1,032 Hedging JP Morgan Chase New York 919/04/2021 GBP 7,396,988 EUR 8,581,511 Hedging JP Morgan Chase New York 99,04619/04/2021 GBP 260,382 EUR 303,967 Hedging JP Morgan Chase New York 1,59919/04/2021 EUR 40 GBP 34 Hedging JP Morgan Chase New York 019/04/2021 EUR 290,226 GBP 248,639 Hedging JP Morgan Chase New York (1,559)22/04/2021 EUR 1,478,315 USD 1,766,920 Trading Barclays (24,390)22/04/2021 EUR 18,659,949 GBP 15,948,368 Trading Barclays (54,939)22/04/2021 EUR 3,818 USD 4,498 Trading Barclays (7)
EUR 863,805
Threadneedle (Lux) - European Social Bond 19/04/2021 CHF 3,439 EUR 3,110 Hedging JP Morgan Chase New York 0
19/04/2021 CHF 19,200 EUR 17,361 Hedging JP Morgan Chase New York 019/04/2021 GBP 6,524,183 EUR 7,568,938 Hedging JP Morgan Chase New York 87,36019/04/2021 SEK 10,098 EUR 993 Hedging JP Morgan Chase New York (7)19/04/2021 NOK 10,252 EUR 1,013 Hedging JP Morgan Chase New York 819/04/2021 GBP 10,340,946 EUR 11,996,902 Hedging JP Morgan Chase New York 138,467
Notes to the Financial Statements(continued)
281
Threadneedle (Lux) Annual Report and Audited Financial Statements March 2021
PortfolioMaturity
DateCurrency
PurchasedAmount
PurchasedCurrency
SoldAmount
Sold Purpose Counterparty
Unrealised gain/(loss)
in the portfolio base currency
Threadneedle (Lux) - European Social Bond (continued) 19/04/2021 USD 21,923 EUR 18,385 Hedging JP Morgan Chase New York 261
19/04/2021 NOK 9,996 EUR 988 Hedging JP Morgan Chase New York 819/04/2021 SEK 9,975 EUR 980 Hedging JP Morgan Chase New York (7)19/04/2021 CHF 1,000 EUR 904 Hedging JP Morgan Chase New York 019/04/2021 USD 1,000 EUR 839 Hedging JP Morgan Chase New York 1219/04/2021 USD 1,000 EUR 839 Hedging JP Morgan Chase New York 1219/04/2021 SGD 1,000 EUR 623 Hedging JP Morgan Chase New York 1019/04/2021 SGD 1,000 EUR 623 Hedging JP Morgan Chase New York 1019/04/2021 USD 1,000 EUR 839 Hedging JP Morgan Chase New York 1219/04/2021 USD 1,000 EUR 839 Hedging JP Morgan Chase New York 1219/04/2021 SGD 1,000 EUR 623 Hedging JP Morgan Chase New York 1019/04/2021 SGD 1,000 EUR 623 Hedging JP Morgan Chase New York 1019/04/2021 GBP 1,000 EUR 1,160 Hedging JP Morgan Chase New York 1319/04/2021 EUR 2,432,074 GBP 2,091,776 Hedging JP Morgan Chase New York (22,687)19/04/2021 GBP 54,197 EUR 63,014 Hedging JP Morgan Chase New York 58819/04/2021 EUR 635,595 GBP 544,460 Hedging JP Morgan Chase New York (3,344)19/04/2021 GBP 19,865 EUR 23,190 Hedging JP Morgan Chase New York 12219/04/2021 EUR 115,538 GBP 99,099 Hedging JP Morgan Chase New York (758)19/04/2021 GBP 143,512 EUR 167,317 Hedging JP Morgan Chase New York 1,09719/04/2021 EUR 383,166 GBP 328,012 Hedging JP Morgan Chase New York (1,765)19/04/2021 GBP 17,658 EUR 20,627 Hedging JP Morgan Chase New York 9519/04/2021 EUR 27,264 GBP 23,418 Hedging JP Morgan Chase New York (218)19/04/2021 GBP 1,885,326 EUR 2,194,937 Hedging JP Morgan Chase New York 17,54219/04/2021 GBP 28,555 EUR 33,140 Hedging JP Morgan Chase New York 37119/04/2021 GBP 19,595 EUR 22,741 Hedging JP Morgan Chase New York 25419/04/2021 GBP 25,563 EUR 29,684 Hedging JP Morgan Chase New York 31519/04/2021 EUR 16 GBP 14 Hedging JP Morgan Chase New York 019/04/2021 GBP 32,681 EUR 37,890 Hedging JP Morgan Chase New York 46219/04/2021 EUR 58,391 GBP 50,364 Hedging JP Morgan Chase New York (712)19/04/2021 GBP 2,014 EUR 2,346 Hedging JP Morgan Chase New York 1719/04/2021 GBP 474,980 EUR 553,296 Hedging JP Morgan Chase New York 4,10519/04/2021 GBP 13,137 EUR 15,353 Hedging JP Morgan Chase New York 6419/04/2021 GBP 48,373 EUR 56,532 Hedging JP Morgan Chase New York 23519/04/2021 GBP 5,440 EUR 6,366 Hedging JP Morgan Chase New York 1819/04/2021 GBP 42,826 EUR 50,118 Hedging JP Morgan Chase New York 14019/04/2021 GBP 10,111 EUR 11,818 Hedging JP Morgan Chase New York 4719/04/2021 GBP 2,038 EUR 2,382 Hedging JP Morgan Chase New York 919/04/2021 EUR 16,530,291 USD 19,704,223 Trading HSBC (228,482)19/04/2021 EUR 485,016 SEK 4,917,615 Trading HSBC 5,08519/04/2021 EUR 32,720,574 GBP 28,013,991 Trading Citigroup Global Markets (154,624)19/04/2021 EUR 1,572,717 USD 1,879,000 Trading HSBC (25,405)19/04/2021 SEK 27,510 EUR 2,705 Trading HSBC (20)19/04/2021 GBP 1,400,000 EUR 1,619,975 Trading HSBC 22,96119/04/2021 EUR 81,827 GBP 70,000 Trading Citigroup Global Markets (320)19/04/2021 EUR 3,483 SEK 35,520 Trading Citigroup Global Markets 17
EUR (158,600)
9 NET UNREALISED GAIN/(LOSS) ON FORWARD CURRENCY EXCHANGE CONTRACTS (continued)
Notes to the Financial Statements(continued)
282
Threadneedle (Lux) Annual Report and Audited Financial Statements March 2021
PortfolioMaturity
DateCurrency
PurchasedAmount
PurchasedCurrency
SoldAmount
Sold Purpose Counterparty
Unrealised gain/(loss)
in the portfolio base currency
Threadneedle (Lux) - European Strategic Bond 19/04/2021 USD 1,169 EUR 980 Hedging JP Morgan Chase New York 14
19/04/2021 USD 1,149 EUR 964 Hedging JP Morgan Chase New York 1419/04/2021 SEK 10,599 EUR 1,042 Hedging JP Morgan Chase New York (7)19/04/2021 NOK 10,696 EUR 1,057 Hedging JP Morgan Chase New York 919/04/2021 NOK 10,814 EUR 1,069 Hedging JP Morgan Chase New York 913/04/2021 EUR 34,700,103 USD 41,905,847 Trading Barclays (946,014)13/04/2021 EUR 112,842 AUD 175,664 Trading Lloyds (975)13/04/2021 EUR 31,855,229 GBP 27,719,334 Trading Barclays (677,665)13/04/2021 USD 198,800 EUR 162,986 Trading UBS 6,11613/04/2021 GBP 100,811 EUR 116,938 Trading Royal Bank of Scotland 1,37813/04/2021 EUR 107,695 GBP 93,262 Trading Barclays (1,762)13/04/2021 USD 168,790 EUR 141,864 Trading HSBC 1,71113/04/2021 EUR 1,585,485 USD 1,887,810 Trading JP Morgan Chase New York (20,326)13/04/2021 USD 157,409 EUR 131,856 Trading Barclays 2,03913/04/2021 EUR 65,452 USD 77,187 Trading JP Morgan Chase New York (205)
EUR (1,635,664)
Threadneedle (Lux) - Emerging Market Corporate Bonds 19/04/2021 EUR 6,490,680 USD 7,739,720 Hedging JP Morgan Chase New York (108,226)
19/04/2021 EUR 2,705,234 USD 3,225,818 Hedging JP Morgan Chase New York (45,107)19/04/2021 EUR 11,387,763 USD 13,579,178 Hedging JP Morgan Chase New York (189,880)19/04/2021 SGD 142,542 USD 105,863 Hedging JP Morgan Chase New York 21619/04/2021 EUR 6,670,523 USD 7,954,172 Hedging JP Morgan Chase New York (111,224)19/04/2021 EUR 160,897 USD 191,860 Hedging JP Morgan Chase New York (2,683)19/04/2021 EUR 521,016 USD 621,278 Hedging JP Morgan Chase New York (8,687)19/04/2021 SEK 10,675 USD 1,251 Hedging JP Morgan Chase New York (26)19/04/2021 NOK 10,766 USD 1,269 Hedging JP Morgan Chase New York (7)19/04/2021 EUR 988 USD 1,178 Hedging JP Morgan Chase New York (16)19/04/2021 EUR 188 USD 225 Hedging JP Morgan Chase New York (3)19/04/2021 USD 772 EUR 648 Hedging JP Morgan Chase New York 1119/04/2021 EUR 2,819 USD 3,362 Hedging JP Morgan Chase New York (47)19/04/2021 EUR 5,991 USD 7,131 Hedging JP Morgan Chase New York (87)19/04/2021 EUR 29,494 USD 35,106 Hedging JP Morgan Chase New York (429)19/04/2021 EUR 19,958 USD 23,755 Hedging JP Morgan Chase New York (290)19/04/2021 EUR 2,089 USD 2,486 Hedging JP Morgan Chase New York (30)19/04/2021 EUR 69,489 USD 82,776 Hedging JP Morgan Chase New York (1,074)19/04/2021 EUR 19,985 USD 23,847 Hedging JP Morgan Chase New York (349)19/04/2021 EUR 235 USD 281 Hedging JP Morgan Chase New York (4)19/04/2021 USD 46,866 EUR 39,329 Hedging JP Morgan Chase New York 62519/04/2021 EUR 44,186 USD 52,655 Hedging JP Morgan Chase New York (703)19/04/2021 EUR 202,160 USD 240,906 Hedging JP Morgan Chase New York (3,214)19/04/2021 USD 47,173 EUR 39,586 Hedging JP Morgan Chase New York 62919/04/2021 EUR 45 USD 53 Hedging JP Morgan Chase New York (1)19/04/2021 USD 25,011 EUR 20,948 Hedging JP Morgan Chase New York 38119/04/2021 EUR 45 USD 54 Hedging JP Morgan Chase New York (1)19/04/2021 EUR 7,000 USD 8,315 Hedging JP Morgan Chase New York (85)19/04/2021 USD 5,703 EUR 4,801 Hedging JP Morgan Chase New York 58
9 NET UNREALISED GAIN/(LOSS) ON FORWARD CURRENCY EXCHANGE CONTRACTS (continued)
Notes to the Financial Statements(continued)
283
Threadneedle (Lux) Annual Report and Audited Financial Statements March 2021
PortfolioMaturity
DateCurrency
PurchasedAmount
PurchasedCurrency
SoldAmount
Sold Purpose Counterparty
Unrealised gain/(loss)
in the portfolio base currency
Threadneedle (Lux) - Emerging Market Corporate Bonds (continued) 19/04/2021 EUR 5,083 USD 6,038 Hedging JP Morgan Chase New York (62)
19/04/2021 USD 8,748 EUR 7,391 Hedging JP Morgan Chase New York 5819/04/2021 USD 1,775 EUR 1,500 Hedging JP Morgan Chase New York 1219/04/2021 EUR 42,950 USD 50,837 Hedging JP Morgan Chase New York (337)19/04/2021 EUR 7,000 USD 8,285 Hedging JP Morgan Chase New York (55)19/04/2021 USD 3,326 EUR 2,824 Hedging JP Morgan Chase New York 619/04/2021 USD 143 EUR 121 Hedging JP Morgan Chase New York 019/04/2021 USD 27 EUR 23 Hedging JP Morgan Chase New York 019/04/2021 EUR 3,988 USD 4,706 Hedging JP Morgan Chase New York (18)19/04/2021 EUR 28,671 USD 33,837 Hedging JP Morgan Chase New York (127)19/04/2021 EUR 12,631 USD 14,907 Hedging JP Morgan Chase New York (56)19/04/2021 USD 51,787 EUR 44,006 Hedging JP Morgan Chase New York 4619/04/2021 EUR 10,150 USD 11,945 Hedging JP Morgan Chase New York (11)19/04/2021 USD 88,610 EUR 75,560 Hedging JP Morgan Chase New York (230)19/04/2021 USD 7,020 EUR 5,986 Hedging JP Morgan Chase New York (18)19/04/2021 USD 13 EUR 11 Hedging JP Morgan Chase New York 019/04/2021 EUR 45 USD 53 Hedging JP Morgan Chase New York 019/04/2021 EUR 60,960 USD 71,510 Hedging JP Morgan Chase New York 16419/04/2021 EUR 11,349 USD 13,313 Hedging JP Morgan Chase New York 3119/04/2021 EUR 4 USD 4 Hedging JP Morgan Chase New York 0
USD (470,850)
Threadneedle (Lux) - Emerging Market Debt 19/04/2021 EUR 290,193 USD 346,036 Hedging JP Morgan Chase New York (4,839)
19/04/2021 EUR 413,846 USD 493,485 Hedging JP Morgan Chase New York (6,900)19/04/2021 EUR 666,641 USD 794,927 Hedging JP Morgan Chase New York (11,116)19/04/2021 EUR 713,430 USD 850,720 Hedging JP Morgan Chase New York (11,896)19/04/2021 SGD 60,731 USD 45,104 Hedging JP Morgan Chase New York 9219/04/2021 SEK 10,145 USD 1,189 Hedging JP Morgan Chase New York (25)19/04/2021 NOK 10,200 USD 1,202 Hedging JP Morgan Chase New York (7)19/04/2021 EUR 21,500 USD 25,591 Hedging JP Morgan Chase New York (312)19/04/2021 EUR 8,472 USD 10,109 Hedging JP Morgan Chase New York (148)19/04/2021 EUR 6,400 USD 7,641 Hedging JP Morgan Chase New York (116)19/04/2021 EUR 745 USD 882 Hedging JP Morgan Chase New York (6)19/04/2021 EUR 250 USD 294 Hedging JP Morgan Chase New York 019/04/2021 USD 11,177 EUR 9,531 Hedging JP Morgan Chase New York (29)19/04/2021 USD 90,997 EUR 77,572 Hedging JP Morgan Chase New York (209)19/04/2021 EUR 98 USD 115 Hedging JP Morgan Chase New York 019/04/2021 USD 7,325 EUR 6,236 Hedging JP Morgan Chase New York (8)09/06/2021 USD 483,563 MXN 10,095,000 Trading UBS (6,011)09/06/2021 USD 1,010,875 EUR 847,876 Trading HSBC 12,846
USD (28,684)
9 NET UNREALISED GAIN/(LOSS) ON FORWARD CURRENCY EXCHANGE CONTRACTS (continued)
Notes to the Financial Statements(continued)
284
Threadneedle (Lux) Annual Report and Audited Financial Statements March 2021
PortfolioMaturity
DateCurrency
PurchasedAmount
PurchasedCurrency
SoldAmount
Sold Purpose Counterparty
Unrealised gain/(loss)
in the portfolio base currency
Threadneedle (Lux) - Global Emerging Market Short-Term Bonds 19/04/2021 EUR 1,559,093 USD 1,859,119 Hedging JP Morgan Chase New York (25,996)
19/04/2021 EUR 3,404,053 USD 4,059,116 Hedging JP Morgan Chase New York (56,759)19/04/2021 EUR 12,035,978 USD 14,352,133 Hedging JP Morgan Chase New York (200,688)19/04/2021 EUR 14,331,704 USD 17,089,640 Hedging JP Morgan Chase New York (238,968)19/04/2021 SGD 300,610 USD 223,258 Hedging JP Morgan Chase New York 45519/04/2021 SGD 1,041,920 USD 773,816 Hedging JP Morgan Chase New York 1,57619/04/2021 SEK 10,143 USD 1,189 Hedging JP Morgan Chase New York (25)19/04/2021 EUR 240,325 USD 286,572 Hedging JP Morgan Chase New York (4,007)19/04/2021 NOK 10,268 USD 1,210 Hedging JP Morgan Chase New York (7)19/04/2021 USD 19,468 SGD 26,212 Hedging JP Morgan Chase New York (39)19/04/2021 USD 11,881 SGD 15,997 Hedging JP Morgan Chase New York (24)19/04/2021 USD 11,522 EUR 9,680 Hedging JP Morgan Chase New York 14119/04/2021 EUR 26,308 USD 31,339 Hedging JP Morgan Chase New York (406)19/04/2021 USD 185,900 EUR 156,060 Hedging JP Morgan Chase New York 2,41019/04/2021 EUR 4,960,581 USD 5,909,104 Hedging JP Morgan Chase New York (76,642)19/04/2021 USD 1,414 SGD 1,905 Hedging JP Morgan Chase New York (4)19/04/2021 SGD 2,975 USD 2,208 Hedging JP Morgan Chase New York 619/04/2021 USD 35,029 EUR 29,356 Hedging JP Morgan Chase New York 51319/04/2021 USD 2,708 SGD 3,637 Hedging JP Morgan Chase New York 119/04/2021 USD 20,336 EUR 17,065 Hedging JP Morgan Chase New York 27119/04/2021 USD 15,039 EUR 12,597 Hedging JP Morgan Chase New York 22819/04/2021 USD 132 EUR 110 Hedging JP Morgan Chase New York 219/04/2021 USD 39,123 EUR 32,935 Hedging JP Morgan Chase New York 39919/04/2021 USD 1,172 EUR 990 Hedging JP Morgan Chase New York 819/04/2021 EUR 20,000 USD 23,672 Hedging JP Morgan Chase New York (157)19/04/2021 USD 1,376 EUR 1,163 Hedging JP Morgan Chase New York 919/04/2021 USD 289,628 EUR 245,631 Hedging JP Morgan Chase New York 82419/04/2021 USD 9,156 SGD 12,333 Hedging JP Morgan Chase New York (22)19/04/2021 EUR 122 USD 144 Hedging JP Morgan Chase New York 019/04/2021 SGD 1,449 USD 1,074 Hedging JP Morgan Chase New York 419/04/2021 USD 3,677 EUR 3,116 Hedging JP Morgan Chase New York 1419/04/2021 USD 22,051 EUR 18,684 Hedging JP Morgan Chase New York 8319/04/2021 SGD 992 USD 735 Hedging JP Morgan Chase New York 319/04/2021 USD 21,269 EUR 18,136 Hedging JP Morgan Chase New York (55)19/04/2021 USD 46,963 EUR 40,047 Hedging JP Morgan Chase New York (122)19/04/2021 USD 158,574 EUR 135,220 Hedging JP Morgan Chase New York (412)19/04/2021 USD 2,247 SGD 3,027 Hedging JP Morgan Chase New York (5)19/04/2021 USD 14 SEK 119 Hedging JP Morgan Chase New York 019/04/2021 USD 3,222 EUR 2,747 Hedging JP Morgan Chase New York (8)19/04/2021 USD 14 NOK 116 Hedging JP Morgan Chase New York 019/04/2021 USD 1,334 EUR 1,137 Hedging JP Morgan Chase New York (3)19/04/2021 EUR 506 USD 593 Hedging JP Morgan Chase New York 119/04/2021 SGD 23 USD 17 Hedging JP Morgan Chase New York 0
USD (597,401)
9 NET UNREALISED GAIN/(LOSS) ON FORWARD CURRENCY EXCHANGE CONTRACTS (continued)
Notes to the Financial Statements(continued)
285
Threadneedle (Lux) Annual Report and Audited Financial Statements March 2021
PortfolioMaturity
DateCurrency
PurchasedAmount
PurchasedCurrency
SoldAmount
Sold Purpose Counterparty
Unrealised gain/(loss)
in the portfolio base currency
Threadneedle (Lux) - US High Yield Bond 19/04/2021 EUR 827,222 USD 986,410 Hedging JP Morgan Chase New York (13,793)
19/04/2021 EUR 657,329 USD 783,823 Hedging JP Morgan Chase New York (10,960)19/04/2021 EUR 64,616,593 USD 77,051,152 Hedging JP Morgan Chase New York (1,077,417)19/04/2021 SGD 511,516 USD 379,894 Hedging JP Morgan Chase New York 77419/04/2021 EUR 368,463 USD 439,369 Hedging JP Morgan Chase New York (6,144)19/04/2021 EUR 284,075 USD 338,741 Hedging JP Morgan Chase New York (4,737)19/04/2021 SEK 10,425 USD 1,222 Hedging JP Morgan Chase New York (26)19/04/2021 SEK 10,564 USD 1,238 Hedging JP Morgan Chase New York (26)19/04/2021 CHF 1,106 USD 1,193 Hedging JP Morgan Chase New York (17)19/04/2021 GBP 1,216 USD 1,683 Hedging JP Morgan Chase New York (4)19/04/2021 EUR 68,594 USD 81,793 Hedging JP Morgan Chase New York (1,144)19/04/2021 EUR 917 USD 1,093 Hedging JP Morgan Chase New York (15)19/04/2021 NOK 10,455 USD 1,232 Hedging JP Morgan Chase New York (7)19/04/2021 NOK 10,601 USD 1,249 Hedging JP Morgan Chase New York (7)19/04/2021 SGD 200 USD 149 Hedging JP Morgan Chase New York 019/04/2021 USD 3,740 EUR 3,142 Hedging JP Morgan Chase New York 4619/04/2021 SGD 50 USD 37 Hedging JP Morgan Chase New York 019/04/2021 USD 655 EUR 550 Hedging JP Morgan Chase New York 919/04/2021 SGD 100 USD 74 Hedging JP Morgan Chase New York 019/04/2021 SGD 100 USD 74 Hedging JP Morgan Chase New York 019/04/2021 EUR 32 USD 38 Hedging JP Morgan Chase New York (1)19/04/2021 EUR 259 USD 309 Hedging JP Morgan Chase New York (5)19/04/2021 SGD 1,000 USD 746 Hedging JP Morgan Chase New York (2)19/04/2021 EUR 32 USD 38 Hedging JP Morgan Chase New York 019/04/2021 EUR 2,267 USD 2,671 Hedging JP Morgan Chase New York (5)19/04/2021 EUR 32 USD 38 Hedging JP Morgan Chase New York 019/04/2021 USD 20,815 EUR 17,637 Hedging JP Morgan Chase New York 7819/04/2021 USD 6,028 SGD 8,112 Hedging JP Morgan Chase New York (10)19/04/2021 USD 2,863 EUR 2,433 Hedging JP Morgan Chase New York 319/04/2021 EUR 2,367 USD 2,777 Hedging JP Morgan Chase New York 6
USD (1,113,404)
Threadneedle (Lux) - Flexible Asian Bond 19/04/2021 EUR 813,756 USD 970,352 Hedging JP Morgan Chase New York (13,569)
19/04/2021 SGD 565,345 USD 419,872 Hedging JP Morgan Chase New York 85619/04/2021 SGD 136,088 USD 101,070 Hedging JP Morgan Chase New York 20619/04/2021 EUR 657,305 USD 783,794 Hedging JP Morgan Chase New York (10,960)19/04/2021 EUR 14,405,325 USD 17,177,428 Hedging JP Morgan Chase New York (240,193)19/04/2021 GBP 2,637 USD 3,647 Hedging JP Morgan Chase New York (9)19/04/2021 SGD 3,435 USD 2,551 Hedging JP Morgan Chase New York 519/04/2021 AUD 1,162 USD 898 Hedging JP Morgan Chase New York (13)19/04/2021 AUD 1,042 USD 805 Hedging JP Morgan Chase New York (11)19/04/2021 SEK 10,291 USD 1,206 Hedging JP Morgan Chase New York (24)19/04/2021 SGD 250 USD 186 Hedging JP Morgan Chase New York 019/04/2021 SGD 7,340 USD 5,451 Hedging JP Morgan Chase New York 1119/04/2021 EUR 485 USD 578 Hedging JP Morgan Chase New York (8)19/04/2021 USD 2,290 EUR 1,920 Hedging JP Morgan Chase New York 3219/04/2021 USD 25,031 EUR 21,029 Hedging JP Morgan Chase New York 306
9 NET UNREALISED GAIN/(LOSS) ON FORWARD CURRENCY EXCHANGE CONTRACTS (continued)
Notes to the Financial Statements(continued)
286
Threadneedle (Lux) Annual Report and Audited Financial Statements March 2021
PortfolioMaturity
DateCurrency
PurchasedAmount
PurchasedCurrency
SoldAmount
Sold Purpose Counterparty
Unrealised gain/(loss)
in the portfolio base currency
Threadneedle (Lux) - Flexible Asian Bond (continued) 19/04/2021 USD 2 SGD 3 Hedging JP Morgan Chase New York 0
19/04/2021 USD 156,340 EUR 131,244 Hedging JP Morgan Chase New York 2,02719/04/2021 EUR 70,214 USD 83,782 Hedging JP Morgan Chase New York (1,227)19/04/2021 USD 157,394 EUR 131,906 Hedging JP Morgan Chase New York 2,30319/04/2021 EUR 87,289 USD 104,019 Hedging JP Morgan Chase New York (1,388)19/04/2021 SGD 2,500 USD 1,865 Hedging JP Morgan Chase New York (5)19/04/2021 EUR 13,841 USD 16,525 Hedging JP Morgan Chase New York (252)19/04/2021 USD 1,317 EUR 1,108 Hedging JP Morgan Chase New York 1319/04/2021 EUR 9,137 USD 10,815 Hedging JP Morgan Chase New York (72)19/04/2021 USD 8,778 EUR 7,416 Hedging JP Morgan Chase New York 5819/04/2021 USD 2 SGD 3 Hedging JP Morgan Chase New York 019/04/2021 EUR 3,022 USD 3,560 Hedging JP Morgan Chase New York (7)19/04/2021 EUR 10,696 USD 12,624 Hedging JP Morgan Chase New York (48)19/04/2021 USD 6,318 EUR 5,369 Hedging JP Morgan Chase New York 619/04/2021 SGD 10 USD 7 Hedging JP Morgan Chase New York 019/04/2021 EUR 12,610 USD 14,792 Hedging JP Morgan Chase New York 3409/06/2021 USD 2,686 IDR 39,397,419 Trading Barclays 509/06/2021 USD 1,609,387 SGD 2,169,160 Trading Citigroup Global Markets (4,509)09/06/2021 USD 1,676,272 CNY 10,985,618 Trading Barclays 10,96609/06/2021 USD 1,049,468 KRW 1,188,679,389 Trading JP Morgan Chase New York (4,554)09/06/2021 MYR 1,265,571 USD 305,553 Trading Barclays (670)09/06/2021 PHP 24,131,185 USD 490,362 Trading Citigroup Global Markets 3,53109/06/2021 USD 976,698 THB 30,172,944 Trading Citigroup Global Markets 11,439
USD (245,721)
Threadneedle (Lux) - Euro Dynamic Real Return 12/04/2021 EUR 1,988,209 GBP 1,780,000 Trading Barclays (100,939)
Threadneedle (Lux) - Global Dynamic Real Return 19/04/2021 EUR 9,624,936 USD 11,477,120 Hedging JP Morgan Chase New York (160,486)
19/04/2021 EUR 2,284,001 USD 2,723,525 Hedging JP Morgan Chase New York (38,083)19/04/2021 EUR 965,588 USD 1,151,401 Hedging JP Morgan Chase New York (16,100)19/04/2021 GBP 360,485 USD 498,666 Hedging JP Morgan Chase New York (1,273)19/04/2021 EUR 1,132 USD 1,350 Hedging JP Morgan Chase New York (19)19/04/2021 SEK 11,282 USD 1,322 Hedging JP Morgan Chase New York (28)19/04/2021 USD 3,274 EUR 2,746 Hedging JP Morgan Chase New York 4619/04/2021 USD 19,297 EUR 16,212 Hedging JP Morgan Chase New York 23419/04/2021 EUR 144 USD 171 Hedging JP Morgan Chase New York (2)14/04/2021 JPY 464,138,999 USD 4,456,619 Trading Barclays (255,627)19/04/2021 USD 7,493 EUR 6,331 Hedging JP Morgan Chase New York 5019/04/2021 USD 71,397 EUR 60,321 Hedging JP Morgan Chase New York 47419/04/2021 USD 41,159 EUR 34,938 Hedging JP Morgan Chase New York 80
9 NET UNREALISED GAIN/(LOSS) ON FORWARD CURRENCY EXCHANGE CONTRACTS (continued)
Notes to the Financial Statements(continued)
287
Threadneedle (Lux) Annual Report and Audited Financial Statements March 2021
PortfolioMaturity
DateCurrency
PurchasedAmount
PurchasedCurrency
SoldAmount
Sold Purpose Counterparty
Unrealised gain/(loss)
in the portfolio base currency
Threadneedle (Lux) - Global Dynamic Real Return (continued) 06/04/2021 USD 6,007 DKK 38,100 Trading Royal Bank of Scotland (15)
19/04/2021 USD 272 EUR 230 Hedging JP Morgan Chase New York 119/04/2021 EUR 49 USD 57 Hedging JP Morgan Chase New York 0
USD (470,748)
Threadneedle (Lux) - Global Multi Asset Income 19/04/2021 EUR 15,242,073 USD 18,175,196 Hedging JP Morgan Chase New York (254,146)
19/04/2021 SGD 7,074 USD 5,253 Hedging JP Morgan Chase New York 1119/04/2021 EUR 203,036 USD 242,108 Hedging JP Morgan Chase New York (3,386)19/04/2021 CHF 1,074 USD 1,158 Hedging JP Morgan Chase New York (16)19/04/2021 EUR 47,408,805 USD 56,531,966 Hedging JP Morgan Chase New York (790,494)19/04/2021 EUR 25,569,254 USD 30,489,699 Hedging JP Morgan Chase New York (426,342)19/04/2021 EUR 914 USD 1,090 Hedging JP Morgan Chase New York (15)19/04/2021 EUR 3,106,937 USD 3,704,823 Hedging JP Morgan Chase New York (51,805)19/04/2021 SGD 176,587 USD 131,148 Hedging JP Morgan Chase New York 26719/04/2021 USD 13,593 EUR 11,399 Hedging JP Morgan Chase New York 19119/04/2021 USD 55,032 EUR 46,148 Hedging JP Morgan Chase New York 77219/04/2021 USD 131,442 EUR 110,223 Hedging JP Morgan Chase New York 1,84519/04/2021 USD 12,351 EUR 10,357 Hedging JP Morgan Chase New York 17319/04/2021 EUR 54,196 USD 64,508 Hedging JP Morgan Chase New York (787)19/04/2021 USD 135,657 EUR 113,970 Hedging JP Morgan Chase New York 1,65519/04/2021 USD 44,578 EUR 37,451 Hedging JP Morgan Chase New York 54419/04/2021 EUR 40,363 USD 48,081 Hedging JP Morgan Chase New York (624)19/04/2021 USD 5,105 EUR 4,286 Hedging JP Morgan Chase New York 6619/04/2021 USD 129,959 EUR 109,098 Hedging JP Morgan Chase New York 1,68519/04/2021 EUR 20,611 USD 24,594 Hedging JP Morgan Chase New York (360)19/04/2021 EUR 6,673 USD 7,963 Hedging JP Morgan Chase New York (117)19/04/2021 USD 13,126 EUR 11,001 Hedging JP Morgan Chase New York 19219/04/2021 USD 24,307 EUR 20,370 Hedging JP Morgan Chase New York 35619/04/2021 USD 17,830 EUR 14,962 Hedging JP Morgan Chase New York 23819/04/2021 USD 42,021 EUR 35,262 Hedging JP Morgan Chase New York 56019/04/2021 USD 7,526 EUR 6,316 Hedging JP Morgan Chase New York 10019/04/2021 USD 18,582 EUR 15,563 Hedging JP Morgan Chase New York 28319/04/2021 USD 26,174 EUR 21,922 Hedging JP Morgan Chase New York 39819/04/2021 EUR 86 USD 103 Hedging JP Morgan Chase New York (2)19/04/2021 USD 34,095 EUR 28,703 Hedging JP Morgan Chase New York 34719/04/2021 USD 66,372 EUR 55,875 Hedging JP Morgan Chase New York 67619/04/2021 USD 45,742 EUR 38,507 Hedging JP Morgan Chase New York 46619/04/2021 USD 66 EUR 55 Hedging JP Morgan Chase New York 019/04/2021 USD 24,396 EUR 20,611 Hedging JP Morgan Chase New York 16219/04/2021 USD 18,291 EUR 15,454 Hedging JP Morgan Chase New York 12119/04/2021 USD 7,429 EUR 6,277 Hedging JP Morgan Chase New York 4919/04/2021 USD 43,199 EUR 36,670 Hedging JP Morgan Chase New York 8419/04/2021 USD 11,133 EUR 9,450 Hedging JP Morgan Chase New York 2219/04/2021 USD 97,493 EUR 82,757 Hedging JP Morgan Chase New York 190
9 NET UNREALISED GAIN/(LOSS) ON FORWARD CURRENCY EXCHANGE CONTRACTS (continued)
Notes to the Financial Statements(continued)
288
Threadneedle (Lux) Annual Report and Audited Financial Statements March 2021
PortfolioMaturity
DateCurrency
PurchasedAmount
PurchasedCurrency
SoldAmount
Sold Purpose Counterparty
Unrealised gain/(loss)
in the portfolio base currency
Threadneedle (Lux) - Global Multi Asset Income (continued) 19/04/2021 SGD 256 USD 190 Hedging JP Morgan Chase New York 1
19/04/2021 USD 88,063 EUR 74,617 Hedging JP Morgan Chase New York 33219/04/2021 USD 60,544 EUR 51,299 Hedging JP Morgan Chase New York 22819/04/2021 USD 12,074 EUR 10,260 Hedging JP Morgan Chase New York 1119/04/2021 EUR 21,649 USD 25,477 Hedging JP Morgan Chase New York (22)19/04/2021 USD 36,997 EUR 31,438 Hedging JP Morgan Chase New York 3319/04/2021 EUR 29,862 USD 35,030 Hedging JP Morgan Chase New York 8119/04/2021 USD 388,012 EUR 330,768 Hedging JP Morgan Chase New York (892)19/04/2021 USD 9,082 EUR 7,743 Hedging JP Morgan Chase New York (21)19/04/2021 SGD 1,298 USD 963 Hedging JP Morgan Chase New York 313/04/2021 CNY 3,315,095 USD 511,226 Trading JP Morgan Chase New York (6,473)13/04/2021 USD 33,654 CNY 217,187 Trading Barclays 58613/04/2021 KRW 184,454,512 USD 167,369 Trading Credit Suisse (3,806)13/04/2021 NOK 65,310 USD 7,705 Trading Barclays (54)13/04/2021 EUR 516,350 USD 623,559 Trading Barclays (16,529)13/04/2021 JPY 64,536,479 USD 608,977 Trading Barclays (24,854)13/04/2021 CAD 12,955 USD 10,200 Trading Barclays 10813/04/2021 GBP 14,929 USD 20,720 Trading JP Morgan Chase New York (121)13/04/2021 CHF 32,695 USD 36,555 Trading HSBC (1,803)13/04/2021 NZD 16,534 USD 11,895 Trading HSBC (316)13/04/2021 MXN 1,109,931 USD 54,481 Trading Royal Bank of Scotland (310)13/04/2021 AUD 29,003 USD 22,499 Trading Royal Bank of Scotland (407)13/04/2021 SEK 261,810 USD 31,469 Trading Goldman Sachs (1,429)13/04/2021 GBP 55,463 USD 77,040 Trading HSBC (514)13/04/2021 USD 2,142 CNY 13,893 Trading JP Morgan Chase New York 2713/04/2021 EUR 4,282 USD 5,199 Trading Lloyds (165)13/04/2021 USD 2,727 JPY 287,972 Trading Royal Bank of Scotland 12113/04/2021 USD 1,899 KRW 2,098,790 Trading UBS 3713/04/2021 USD 26,443 GBP 18,754 Trading HSBC 56713/04/2021 GBP 2,706 USD 3,829 Trading HSBC (95)13/04/2021 EUR 1,895 USD 2,311 Trading UBS (84)13/04/2021 USD 35,175 MXN 738,432 Trading Royal Bank of Scotland (865)13/04/2021 JPY 382,640 USD 3,592 Trading UBS (129)13/04/2021 CAD 4,094 USD 3,225 Trading HSBC 3313/04/2021 AUD 3,615 USD 2,802 Trading HSBC (49)13/04/2021 USD 72,575 GBP 51,995 Trading UBS 83413/04/2021 EUR 58,164 USD 70,320 Trading UBS (1,941)13/04/2021 USD 63,750 GBP 45,643 Trading UBS 77413/04/2021 USD 3,622 CNY 23,494 Trading Barclays 4513/04/2021 USD 12,868 KRW 14,685,655 Trading Credit Suisse (153)13/04/2021 USD 113,700 EUR 95,519 Trading Barclays 1,40613/04/2021 USD 7,420 AUD 9,621 Trading Barclays 9113/04/2021 USD 2,061 SEK 17,544 Trading HSBC 4813/04/2021 USD 33,055 CNY 215,822 Trading JP Morgan Chase New York 19413/04/2021 USD 3,060 CHF 2,849 Trading JP Morgan Chase New York 3213/04/2021 USD 13,331 CAD 16,858 Trading HSBC (82)
9 NET UNREALISED GAIN/(LOSS) ON FORWARD CURRENCY EXCHANGE CONTRACTS (continued)
Notes to the Financial Statements(continued)
289
Threadneedle (Lux) Annual Report and Audited Financial Statements March 2021
PortfolioMaturity
DateCurrency
PurchasedAmount
PurchasedCurrency
SoldAmount
Sold Purpose Counterparty
Unrealised gain/(loss)
in the portfolio base currency
Threadneedle (Lux) - Global Multi Asset Income (continued) 13/04/2021 USD 69,588 JPY 7,556,059 Trading Royal Bank of Scotland 1,197
Threadneedle (Lux) - Emerging Market ESG Equities* 19/04/2021 EUR 1,326 USD 1,582 Hedging JP Morgan Chase New York (22)
19/04/2021 EUR 100,111 USD 119,376 Hedging JP Morgan Chase New York (1,670)19/04/2021 EUR 1,332 USD 1,588 Hedging JP Morgan Chase New York (22)19/04/2021 EUR 1,331 USD 1,587 Hedging JP Morgan Chase New York (22)19/04/2021 EUR 1,331 USD 1,587 Hedging JP Morgan Chase New York (22)19/04/2021 EUR 4,988 USD 5,952 Hedging JP Morgan Chase New York (87)19/04/2021 EUR 6,946 USD 8,277 Hedging JP Morgan Chase New York (111)19/04/2021 USD 47 EUR 40 Hedging JP Morgan Chase New York 019/04/2021 USD 3,969 EUR 3,360 Hedging JP Morgan Chase New York 1819/04/2021 USD 47 EUR 40 Hedging JP Morgan Chase New York 019/04/2021 USD 47 EUR 40 Hedging JP Morgan Chase New York 019/04/2021 USD 47 EUR 40 Hedging JP Morgan Chase New York 019/04/2021 EUR 2,442 USD 2,879 Hedging JP Morgan Chase New York (7)19/04/2021 EUR 29 USD 34 Hedging JP Morgan Chase New York 019/04/2021 EUR 29 USD 34 Hedging JP Morgan Chase New York 0
USD (1,945)
9 NET UNREALISED GAIN/(LOSS) ON FORWARD CURRENCY EXCHANGE CONTRACTS (continued)
Notes to the Financial Statements(continued)
290
Threadneedle (Lux) Annual Report and Audited Financial Statements March 2021
PortfolioMaturity
DateCurrency
PurchasedAmount
PurchasedCurrency
SoldAmount
Sold Purpose Counterparty
Unrealised gain/(loss)
in the portfolio base currency
Threadneedle (Lux) - Global Focus 19/04/2021 EUR 80,327,432 USD 95,785,322 Hedging JP Morgan Chase New York (1,339,380)
19/04/2021 EUR 12,689,398 USD 15,131,295 Hedging JP Morgan Chase New York (211,583)19/04/2021 EUR 36,984,388 USD 44,101,516 Hedging JP Morgan Chase New York (616,677)19/04/2021 EUR 32,218 USD 38,418 Hedging JP Morgan Chase New York (537)19/04/2021 CHF 1,779,480 USD 1,918,662 Hedging JP Morgan Chase New York (26,930)19/04/2021 EUR 50,082 USD 59,723 Hedging JP Morgan Chase New York (839)19/04/2021 EUR 485 USD 578 Hedging JP Morgan Chase New York (8)19/04/2021 USD 712,915 EUR 598,942 Hedging JP Morgan Chase New York 8,69919/04/2021 EUR 16,947 USD 20,172 Hedging JP Morgan Chase New York (246)19/04/2021 EUR 197,491 USD 235,072 Hedging JP Morgan Chase New York (2,869)19/04/2021 EUR 156,418 USD 186,326 Hedging JP Morgan Chase New York (2,417)19/04/2021 USD 1,839 EUR 1,544 Hedging JP Morgan Chase New York 2419/04/2021 EUR 200,316 USD 238,619 Hedging JP Morgan Chase New York (3,095)19/04/2021 EUR 81,665 USD 97,445 Hedging JP Morgan Chase New York (1,427)19/04/2021 EUR 4,784 USD 5,709 Hedging JP Morgan Chase New York (84)19/04/2021 USD 15,184 EUR 12,725 Hedging JP Morgan Chase New York 22219/04/2021 EUR 72,300 USD 86,158 Hedging JP Morgan Chase New York (1,150)19/04/2021 EUR 435 USD 518 Hedging JP Morgan Chase New York (7)19/04/2021 USD 60,908 EUR 51,014 Hedging JP Morgan Chase New York 92719/04/2021 EUR 12,667 USD 15,124 Hedging JP Morgan Chase New York (230)19/04/2021 EUR 208,675 USD 247,878 Hedging JP Morgan Chase New York (2,526)19/04/2021 USD 1,185 EUR 997 Hedging JP Morgan Chase New York 1219/04/2021 EUR 4,691 USD 5,553 Hedging JP Morgan Chase New York (37)19/04/2021 USD 4,664 EUR 3,940 Hedging JP Morgan Chase New York 3119/04/2021 USD 2,875 EUR 2,429 Hedging JP Morgan Chase New York 1919/04/2021 USD 298,291 EUR 253,205 Hedging JP Morgan Chase New York 58219/04/2021 EUR 770 USD 907 Hedging JP Morgan Chase New York (2)19/04/2021 USD 3,350,315 EUR 2,843,921 Hedging JP Morgan Chase New York 6,53819/04/2021 EUR 68,373 USD 80,694 Hedging JP Morgan Chase New York (304)19/04/2021 USD 2,547 EUR 2,158 Hedging JP Morgan Chase New York 1019/04/2021 USD 232,282 EUR 197,384 Hedging JP Morgan Chase New York 20519/04/2021 EUR 895 USD 1,053 Hedging JP Morgan Chase New York (1)19/04/2021 EUR 970 USD 1,141 Hedging JP Morgan Chase New York (1)19/04/2021 EUR 11,437 USD 13,416 Hedging JP Morgan Chase New York 3119/04/2021 EUR 12,915 USD 15,151 Hedging JP Morgan Chase New York 3519/04/2021 USD 71,614 EUR 61,049 Hedging JP Morgan Chase New York (165)06/04/2021 USD 210,764 DKK 1,336,900 Trading Royal Bank of Scotland (523)06/04/2021 USD 505,774 EUR 431,000 Trading UBS (841)
USD (2,194,544)
Threadneedle (Lux) - Global Emerging Market Equities 19/04/2021 EUR 997,250 USD 1,189,157 Hedging JP Morgan Chase New York (16,628)
19/04/2021 EUR 1,566,828 USD 1,868,342 Hedging JP Morgan Chase New York (26,125)19/04/2021 EUR 710,470 USD 847,190 Hedging JP Morgan Chase New York (11,846)19/04/2021 EUR 20,159 USD 24,039 Hedging JP Morgan Chase New York (338)19/04/2021 USD 2,771 EUR 2,326 Hedging JP Morgan Chase New York 3619/04/2021 USD 14 EUR 11 Hedging JP Morgan Chase New York 0
9 NET UNREALISED GAIN/(LOSS) ON FORWARD CURRENCY EXCHANGE CONTRACTS (continued)
Notes to the Financial Statements(continued)
291
Threadneedle (Lux) Annual Report and Audited Financial Statements March 2021
PortfolioMaturity
DateCurrency
PurchasedAmount
PurchasedCurrency
SoldAmount
Sold Purpose Counterparty
Unrealised gain/(loss)
in the portfolio base currency
Threadneedle (Lux) - Global Emerging Market Equities(continued) 19/04/2021 EUR 3,146 USD 3,754 Hedging JP Morgan Chase New York (55)
19/04/2021 EUR 35,185 USD 41,929 Hedging JP Morgan Chase New York (559)19/04/2021 USD 15,904 EUR 13,320 Hedging JP Morgan Chase New York 24219/04/2021 USD 36,500 EUR 30,907 Hedging JP Morgan Chase New York 16119/04/2021 USD 59,446 EUR 50,337 Hedging JP Morgan Chase New York 26119/04/2021 USD 27,499 EUR 23,285 Hedging JP Morgan Chase New York 12119/04/2021 EUR 12,778 USD 15,124 Hedging JP Morgan Chase New York (100)19/04/2021 EUR 13 USD 15 Hedging JP Morgan Chase New York 019/04/2021 USD 41,001 EUR 34,804 Hedging JP Morgan Chase New York 8019/04/2021 EUR 20,617 USD 24,303 Hedging JP Morgan Chase New York (63)19/04/2021 EUR 32,574 USD 38,399 Hedging JP Morgan Chase New York (99)19/04/2021 EUR 15,980 USD 18,838 Hedging JP Morgan Chase New York (49)19/04/2021 USD 1,250 EUR 1,059 Hedging JP Morgan Chase New York 519/04/2021 EUR 897 USD 1,056 Hedging JP Morgan Chase New York (1)19/04/2021 EUR 2,413 USD 2,831 Hedging JP Morgan Chase New York 7
USD (54,950)
Threadneedle (Lux) - Global Equity Income 19/04/2021 SGD 5,964,425 USD 4,429,675 Hedging JP Morgan Chase New York 9,020
19/04/2021 SGD 942,524 USD 699,996 Hedging JP Morgan Chase New York 1,42519/04/2021 SGD 404,385 USD 300,330 Hedging JP Morgan Chase New York 61219/04/2021 AUD 81,873 USD 63,249 Hedging JP Morgan Chase New York (883)19/04/2021 EUR 50,331 USD 60,017 Hedging JP Morgan Chase New York (839)19/04/2021 EUR 1,081 USD 1,290 Hedging JP Morgan Chase New York (18)19/04/2021 USD 441 SGD 593 Hedging JP Morgan Chase New York (1)19/04/2021 USD 243,951 SGD 329,129 Hedging JP Morgan Chase New York (985)19/04/2021 SGD 26 USD 20 Hedging JP Morgan Chase New York 019/04/2021 USD 82,054 SGD 110,526 Hedging JP Morgan Chase New York (200)19/04/2021 USD 28,959 SGD 38,976 Hedging JP Morgan Chase New York (47)19/04/2021 SGD 964 USD 715 Hedging JP Morgan Chase New York 319/04/2021 SGD 157 USD 116 Hedging JP Morgan Chase New York 019/04/2021 SGD 112 USD 83 Hedging JP Morgan Chase New York 019/04/2021 SGD 8,430 USD 6,254 Hedging JP Morgan Chase New York 20
USD 8,107
Threadneedle (Lux) - Global Select 06/04/2021 USD 92,463 DKK 586,500 Trading Royal Bank of Scotland (230)
USD (230)
Threadneedle (Lux) - Global Smaller Companies 19/04/2021 CHF 1,151 EUR 1,041 Hedging JP Morgan Chase New York 0
19/04/2021 GBP 2,753,518 EUR 3,194,455 Hedging JP Morgan Chase New York 36,87019/04/2021 CHF 17,735,711 EUR 16,036,297 Hedging JP Morgan Chase New York (319)19/04/2021 GBP 2,360 EUR 2,738 Hedging JP Morgan Chase New York 32
9 NET UNREALISED GAIN/(LOSS) ON FORWARD CURRENCY EXCHANGE CONTRACTS (continued)
Notes to the Financial Statements(continued)
292
Threadneedle (Lux) Annual Report and Audited Financial Statements March 2021
PortfolioMaturity
DateCurrency
PurchasedAmount
PurchasedCurrency
SoldAmount
Sold Purpose Counterparty
Unrealised gain/(loss)
in the portfolio base currency
Threadneedle (Lux) - Global Smaller Companies(continued) 19/04/2021 GBP 3,480 EUR 4,046 Hedging JP Morgan Chase New York 38
19/04/2021 GBP 4,796 EUR 5,599 Hedging JP Morgan Chase New York 2919/04/2021 EUR 22,885 CHF 25,203 Hedging JP Morgan Chase New York 9819/04/2021 GBP 665 EUR 775 Hedging JP Morgan Chase New York 519/04/2021 CHF 45,169 EUR 40,911 Hedging JP Morgan Chase New York (70)19/04/2021 EUR 5,905 GBP 5,055 Hedging JP Morgan Chase New York (27)19/04/2021 EUR 33,857 GBP 29,081 Hedging JP Morgan Chase New York (271)19/04/2021 EUR 42,719 GBP 36,809 Hedging JP Morgan Chase New York (478)19/04/2021 EUR 21 CHF 24 Hedging JP Morgan Chase New York 019/04/2021 EUR 64,495 GBP 55,736 Hedging JP Morgan Chase New York (912)19/04/2021 EUR 331,366 CHF 366,738 Hedging JP Morgan Chase New York (225)19/04/2021 EUR 55 GBP 48 Hedging JP Morgan Chase New York (1)19/04/2021 GBP 27,696 EUR 32,161 Hedging JP Morgan Chase New York 34219/04/2021 GBP 31,226 EUR 36,203 Hedging JP Morgan Chase New York 44219/04/2021 GBP 31,476 EUR 36,666 Hedging JP Morgan Chase New York 27219/04/2021 EUR 15,584 GBP 13,335 Hedging JP Morgan Chase New York (65)19/04/2021 GBP 1,854 EUR 2,169 Hedging JP Morgan Chase New York 619/04/2021 EUR 20 GBP 17 Hedging JP Morgan Chase New York 006/04/2021 EUR 2,921,890 USD 3,426,633 Trading Royal Bank of Scotland 6,70307/04/2021 USD 6,846,394 EUR 5,834,096 Trading UBS (9,708)
EUR 32,761
Threadneedle (Lux) - American 19/04/2021 EUR 76,864,908 USD 91,656,484 Hedging JP Morgan Chase New York (1,281,645)
19/04/2021 EUR 2,382,002 USD 2,840,385 Hedging JP Morgan Chase New York (39,718)19/04/2021 EUR 25,887,305 USD 30,868,954 Hedging JP Morgan Chase New York (431,645)19/04/2021 EUR 17,924,777 USD 21,374,149 Hedging JP Morgan Chase New York (298,878)19/04/2021 EUR 2,695,411 USD 3,214,105 Hedging JP Morgan Chase New York (44,943)19/04/2021 EUR 266,242 USD 317,476 Hedging JP Morgan Chase New York (4,439)19/04/2021 EUR 1,440 USD 1,717 Hedging JP Morgan Chase New York (24)19/04/2021 EUR 97,242 USD 115,961 Hedging JP Morgan Chase New York (1,628)19/04/2021 EUR 3,907 USD 4,660 Hedging JP Morgan Chase New York (65)19/04/2021 EUR 28,514 USD 34,003 Hedging JP Morgan Chase New York (477)19/04/2021 EUR 17,792 USD 21,217 Hedging JP Morgan Chase New York (298)19/04/2021 EUR 799,172 USD 951,247 Hedging JP Morgan Chase New York (11,611)19/04/2021 USD 4,372 EUR 3,673 Hedging JP Morgan Chase New York 5319/04/2021 EUR 325,586 USD 387,842 Hedging JP Morgan Chase New York (5,030)19/04/2021 EUR 2,119 USD 2,525 Hedging JP Morgan Chase New York (33)19/04/2021 USD 11,522 EUR 9,673 Hedging JP Morgan Chase New York 14919/04/2021 EUR 129,187 USD 154,150 Hedging JP Morgan Chase New York (2,257)19/04/2021 USD 13,499 EUR 11,313 Hedging JP Morgan Chase New York 19819/04/2021 EUR 2,873 USD 3,428 Hedging JP Morgan Chase New York (50)19/04/2021 EUR 290,380 USD 346,034 Hedging JP Morgan Chase New York (4,617)19/04/2021 EUR 12,150 USD 14,479 Hedging JP Morgan Chase New York (193)19/04/2021 USD 2,346 EUR 1,968 Hedging JP Morgan Chase New York 3119/04/2021 EUR 227,507 USD 271,629 Hedging JP Morgan Chase New York (4,135)19/04/2021 EUR 8,424 USD 10,058 Hedging JP Morgan Chase New York (153)
9 NET UNREALISED GAIN/(LOSS) ON FORWARD CURRENCY EXCHANGE CONTRACTS (continued)
Notes to the Financial Statements(continued)
293
Threadneedle (Lux) Annual Report and Audited Financial Statements March 2021
PortfolioMaturity
DateCurrency
PurchasedAmount
PurchasedCurrency
SoldAmount
Sold Purpose Counterparty
Unrealised gain/(loss)
in the portfolio base currency
Threadneedle (Lux) - American (continued) 19/04/2021 EUR 20,343 USD 24,288 Hedging JP Morgan Chase New York (370)
19/04/2021 USD 25,155 EUR 21,069 Hedging JP Morgan Chase New York 38319/04/2021 EUR 187,288 USD 222,473 Hedging JP Morgan Chase New York (2,267)19/04/2021 EUR 1,545 USD 1,835 Hedging JP Morgan Chase New York (19)19/04/2021 USD 2,263,111 EUR 1,916,314 Hedging JP Morgan Chase New York 9,97819/04/2021 USD 68,984 EUR 58,413 Hedging JP Morgan Chase New York 30419/04/2021 USD 740,823 EUR 627,300 Hedging JP Morgan Chase New York 3,26619/04/2021 USD 514,220 EUR 435,422 Hedging JP Morgan Chase New York 2,26719/04/2021 USD 77,794 EUR 65,873 Hedging JP Morgan Chase New York 34319/04/2021 USD 7,615 EUR 6,448 Hedging JP Morgan Chase New York 3419/04/2021 USD 41 EUR 35 Hedging JP Morgan Chase New York 019/04/2021 EUR 384,641 USD 455,267 Hedging JP Morgan Chase New York (3,021)19/04/2021 EUR 1,434 USD 1,697 Hedging JP Morgan Chase New York (11)19/04/2021 EUR 9,290 USD 10,996 Hedging JP Morgan Chase New York (73)19/04/2021 EUR 120,949 USD 142,485 Hedging JP Morgan Chase New York (278)19/04/2021 EUR 1,596 USD 1,881 Hedging JP Morgan Chase New York (4)19/04/2021 USD 15,882 EUR 13,482 Hedging JP Morgan Chase New York 3119/04/2021 EUR 100 USD 118 Hedging JP Morgan Chase New York 019/04/2021 EUR 109,300 USD 128,762 Hedging JP Morgan Chase New York (251)19/04/2021 EUR 1,741,098 USD 2,052,413 Hedging JP Morgan Chase New York (5,297)19/04/2021 EUR 52,159 USD 61,485 Hedging JP Morgan Chase New York (159)19/04/2021 EUR 569,157 USD 670,925 Hedging JP Morgan Chase New York (1,732)19/04/2021 EUR 394,586 USD 465,140 Hedging JP Morgan Chase New York (1,200)19/04/2021 EUR 59,026 USD 69,580 Hedging JP Morgan Chase New York (180)19/04/2021 EUR 7,884 USD 9,294 Hedging JP Morgan Chase New York (24)19/04/2021 EUR 32 USD 37 Hedging JP Morgan Chase New York 019/04/2021 EUR 280,531 USD 331,085 Hedging JP Morgan Chase New York (1,248)19/04/2021 EUR 155 USD 183 Hedging JP Morgan Chase New York (1)19/04/2021 EUR 178,621 USD 210,810 Hedging JP Morgan Chase New York (795)19/04/2021 EUR 305,950 USD 360,042 Hedging JP Morgan Chase New York (317)19/04/2021 EUR 3,564 USD 4,194 Hedging JP Morgan Chase New York (4)19/04/2021 EUR 207 USD 244 Hedging JP Morgan Chase New York 019/04/2021 EUR 50,499 USD 59,239 Hedging JP Morgan Chase New York 13619/04/2021 EUR 6,417 USD 7,528 Hedging JP Morgan Chase New York 1719/04/2021 USD 3,889 EUR 3,315 Hedging JP Morgan Chase New York (9)
USD (2,131,909)
Threadneedle (Lux) - American Select 19/04/2021 EUR 885,029 USD 1,055,340 Hedging JP Morgan Chase New York (14,757)
19/04/2021 EUR 406,873 USD 485,170 Hedging JP Morgan Chase New York (6,784)19/04/2021 EUR 817,846 USD 975,229 Hedging JP Morgan Chase New York (13,637)19/04/2021 EUR 16,998 USD 20,269 Hedging JP Morgan Chase New York (283)19/04/2021 EUR 324,055 USD 386,415 Hedging JP Morgan Chase New York (5,404)19/04/2021 EUR 1,497 USD 1,785 Hedging JP Morgan Chase New York (25)19/04/2021 EUR 728,715 USD 868,946 Hedging JP Morgan Chase New York (12,151)19/04/2021 EUR 81 USD 97 Hedging JP Morgan Chase New York (1)19/04/2021 EUR 9,712 USD 11,588 Hedging JP Morgan Chase New York (170)
9 NET UNREALISED GAIN/(LOSS) ON FORWARD CURRENCY EXCHANGE CONTRACTS (continued)
Notes to the Financial Statements(continued)
294
Threadneedle (Lux) Annual Report and Audited Financial Statements March 2021
PortfolioMaturity
DateCurrency
PurchasedAmount
PurchasedCurrency
SoldAmount
Sold Purpose Counterparty
Unrealised gain/(loss)
in the portfolio base currency
Threadneedle (Lux) - American Select (continued) 19/04/2021 USD 77,827 EUR 65,310 Hedging JP Morgan Chase New York 1,038
19/04/2021 USD 1,148 EUR 962 Hedging JP Morgan Chase New York 1719/04/2021 USD 21,989 EUR 18,620 Hedging JP Morgan Chase New York 9719/04/2021 USD 10,182 EUR 8,621 Hedging JP Morgan Chase New York 4519/04/2021 USD 19,856 EUR 16,813 Hedging JP Morgan Chase New York 8819/04/2021 USD 419 EUR 355 Hedging JP Morgan Chase New York 219/04/2021 USD 8,039 EUR 6,807 Hedging JP Morgan Chase New York 3519/04/2021 USD 17,957 EUR 15,205 Hedging JP Morgan Chase New York 7919/04/2021 USD 15,014 EUR 12,685 Hedging JP Morgan Chase New York 10019/04/2021 USD 8,217 EUR 6,975 Hedging JP Morgan Chase New York 1619/04/2021 EUR 250 USD 294 Hedging JP Morgan Chase New York 0
USD (51,695)
Threadneedle (Lux) - American Smaller Companies 19/04/2021 EUR 660,968 USD 788,162 Hedging JP Morgan Chase New York (11,021)
19/04/2021 EUR 327,479 USD 390,497 Hedging JP Morgan Chase New York (5,460)19/04/2021 EUR 70,193 USD 83,701 Hedging JP Morgan Chase New York (1,170)19/04/2021 EUR 23,285 USD 27,766 Hedging JP Morgan Chase New York (388)19/04/2021 USD 26,734 EUR 22,390 Hedging JP Morgan Chase New York 40919/04/2021 USD 13,261 EUR 11,106 Hedging JP Morgan Chase New York 20319/04/2021 USD 2,833 EUR 2,373 Hedging JP Morgan Chase New York 4319/04/2021 USD 940 EUR 787 Hedging JP Morgan Chase New York 1419/04/2021 EUR 15,243 USD 18,199 Hedging JP Morgan Chase New York (277)19/04/2021 USD 19,800 EUR 16,744 Hedging JP Morgan Chase New York 11219/04/2021 USD 9,538 EUR 8,066 Hedging JP Morgan Chase New York 5419/04/2021 USD 2,030 EUR 1,717 Hedging JP Morgan Chase New York 1219/04/2021 USD 673 EUR 569 Hedging JP Morgan Chase New York 419/04/2021 EUR 291,216 USD 345,926 Hedging JP Morgan Chase New York (3,527)19/04/2021 USD 1,142 EUR 961 Hedging JP Morgan Chase New York 1219/04/2021 EUR 4,992 USD 5,892 Hedging JP Morgan Chase New York (22)19/04/2021 USD 57,388 EUR 48,625 Hedging JP Morgan Chase New York 21619/04/2021 EUR 5,774 USD 6,798 Hedging JP Morgan Chase New York (9)19/04/2021 USD 7,446 EUR 6,337 Hedging JP Morgan Chase New York (5)19/04/2021 USD 6,013 EUR 5,109 Hedging JP Morgan Chase New York 519/04/2021 EUR 6,589 USD 7,730 Hedging JP Morgan Chase New York 1819/04/2021 EUR 1,869,760 USD 2,193,350 Hedging JP Morgan Chase New York 5,042
USD (15,735)
Threadneedle (Lux) - Asia Contrarian Equity 19/04/2021 SGD 1,029,572 USD 764,645 Hedging JP Morgan Chase New York 1,557
19/04/2021 SGD 12,145 USD 9,020 Hedging JP Morgan Chase New York 1819/04/2021 EUR 587,681 USD 700,772 Hedging JP Morgan Chase New York (9,799)19/04/2021 SGD 2,850 USD 2,117 Hedging JP Morgan Chase New York 419/04/2021 USD 23 EUR 19 Hedging JP Morgan Chase New York 019/04/2021 SGD 540 USD 401 Hedging JP Morgan Chase New York 1
9 NET UNREALISED GAIN/(LOSS) ON FORWARD CURRENCY EXCHANGE CONTRACTS (continued)
Notes to the Financial Statements(continued)
295
Threadneedle (Lux) Annual Report and Audited Financial Statements March 2021
PortfolioMaturity
DateCurrency
PurchasedAmount
PurchasedCurrency
SoldAmount
Sold Purpose Counterparty
Unrealised gain/(loss)
in the portfolio base currency
Threadneedle (Lux) - Asia Contrarian Equity (continued) 19/04/2021 USD 173 EUR 146 Hedging JP Morgan Chase New York 2
19/04/2021 EUR 4,346 USD 5,186 Hedging JP Morgan Chase New York (75)19/04/2021 SGD 200 USD 149 Hedging JP Morgan Chase New York 019/04/2021 USD 428 EUR 359 Hedging JP Morgan Chase New York 619/04/2021 USD 1,008 EUR 844 Hedging JP Morgan Chase New York 1519/04/2021 SGD 150 USD 112 Hedging JP Morgan Chase New York 019/04/2021 USD 20,008 SGD 26,965 Hedging JP Morgan Chase New York (59)19/04/2021 USD 233 SGD 314 Hedging JP Morgan Chase New York (1)19/04/2021 USD 18,162 EUR 15,379 Hedging JP Morgan Chase New York 8019/04/2021 SGD 125 USD 93 Hedging JP Morgan Chase New York 019/04/2021 USD 205 EUR 173 Hedging JP Morgan Chase New York 119/04/2021 USD 649 EUR 551 Hedging JP Morgan Chase New York 119/04/2021 SGD 21,404 USD 15,887 Hedging JP Morgan Chase New York 4219/04/2021 SGD 252 USD 187 Hedging JP Morgan Chase New York 119/04/2021 EUR 12,170 USD 14,347 Hedging JP Morgan Chase New York (37)19/04/2021 USD 3,204 SGD 4,313 Hedging JP Morgan Chase New York (5)19/04/2021 EUR 480 USD 567 Hedging JP Morgan Chase New York (2)19/04/2021 SGD 500 USD 371 Hedging JP Morgan Chase New York 219/04/2021 USD 1,585 EUR 1,347 Hedging JP Morgan Chase New York 119/04/2021 USD 23 EUR 19 Hedging JP Morgan Chase New York 0
USD (8,247)
Threadneedle (Lux) - US Contrarian Core Equities 19/04/2021 EUR 1,032,126 USD 1,230,744 Hedging JP Morgan Chase New York (17,210)
19/04/2021 EUR 8,745,916 USD 10,428,945 Hedging JP Morgan Chase New York (145,829)19/04/2021 CHF 3,657 USD 3,943 Hedging JP Morgan Chase New York (55)19/04/2021 GBP 3,868 USD 5,351 Hedging JP Morgan Chase New York (14)19/04/2021 EUR 5,529 USD 6,593 Hedging JP Morgan Chase New York (92)19/04/2021 SGD 133,381,775 USD 99,060,339 Hedging JP Morgan Chase New York 201,71019/04/2021 USD 1,656 EUR 1,388 Hedging JP Morgan Chase New York 2319/04/2021 USD 23,007 EUR 19,329 Hedging JP Morgan Chase New York 28119/04/2021 USD 28,118 EUR 23,604 Hedging JP Morgan Chase New York 36519/04/2021 USD 7,823 EUR 6,556 Hedging JP Morgan Chase New York 11419/04/2021 EUR 8,385 USD 9,992 Hedging JP Morgan Chase New York (134)19/04/2021 EUR 1,774 USD 2,118 Hedging JP Morgan Chase New York (32)19/04/2021 USD 25,484 EUR 21,552 Hedging JP Morgan Chase New York 14519/04/2021 USD 218,782 EUR 185,021 Hedging JP Morgan Chase New York 1,24119/04/2021 USD 83 CHF 78 Hedging JP Morgan Chase New York 019/04/2021 USD 112 GBP 82 Hedging JP Morgan Chase New York (1)19/04/2021 USD 140 EUR 118 Hedging JP Morgan Chase New York 119/04/2021 USD 2,059,146 SGD 2,775,024 Hedging JP Morgan Chase New York (6,014)19/04/2021 USD 253 EUR 213 Hedging JP Morgan Chase New York 319/04/2021 USD 8,172 EUR 6,937 Hedging JP Morgan Chase New York 1619/04/2021 USD 8,141 EUR 6,898 Hedging JP Morgan Chase New York 31
9 NET UNREALISED GAIN/(LOSS) ON FORWARD CURRENCY EXCHANGE CONTRACTS (continued)
Notes to the Financial Statements(continued)
296
Threadneedle (Lux) Annual Report and Audited Financial Statements March 2021
PortfolioMaturity
DateCurrency
PurchasedAmount
PurchasedCurrency
SoldAmount
Sold Purpose Counterparty
Unrealised gain/(loss)
in the portfolio base currency
Threadneedle (Lux) - US Contrarian Core Equities (continued) 19/04/2021 EUR 2,935 USD 3,454 Hedging JP Morgan Chase New York (3)
19/04/2021 EUR 5,672 USD 6,653 Hedging JP Morgan Chase New York 15USD 34,561
Threadneedle (Lux) - US Disciplined Core Equities 19/04/2021 EUR 2,517 USD 3,001 Hedging JP Morgan Chase New York (42)
19/04/2021 EUR 4,547 USD 5,422 Hedging JP Morgan Chase New York (76)19/04/2021 EUR 2,546 USD 3,036 Hedging JP Morgan Chase New York (42)19/04/2021 CHF 2,322 USD 2,504 Hedging JP Morgan Chase New York (35)19/04/2021 EUR 2,540 USD 3,029 Hedging JP Morgan Chase New York (42)19/04/2021 CHF 2,311 USD 2,492 Hedging JP Morgan Chase New York (34)19/04/2021 EUR 2,375 USD 2,832 Hedging JP Morgan Chase New York (40)19/04/2021 USD 1,290 EUR 1,086 Hedging JP Morgan Chase New York 1319/04/2021 USD 1,281 EUR 1,078 Hedging JP Morgan Chase New York 1319/04/2021 USD 1,306 EUR 1,099 Hedging JP Morgan Chase New York 1319/04/2021 USD 950 CHF 886 Hedging JP Morgan Chase New York 819/04/2021 USD 1,302 EUR 1,096 Hedging JP Morgan Chase New York 1319/04/2021 USD 946 CHF 882 Hedging JP Morgan Chase New York 819/04/2021 USD 1,218 EUR 1,025 Hedging JP Morgan Chase New York 1219/04/2021 EUR 42 USD 49 Hedging JP Morgan Chase New York 019/04/2021 EUR 89 USD 105 Hedging JP Morgan Chase New York 019/04/2021 EUR 43 USD 50 Hedging JP Morgan Chase New York 019/04/2021 CHF 40 USD 43 Hedging JP Morgan Chase New York 019/04/2021 EUR 42 USD 50 Hedging JP Morgan Chase New York 019/04/2021 CHF 40 USD 43 Hedging JP Morgan Chase New York 019/04/2021 EUR 28 USD 33 Hedging JP Morgan Chase New York 0
USD (231)
Threadneedle (Lux) - Pan European ESG Equities* 19/04/2021 SGD 5,448,496 EUR 3,393,374 Hedging JP Morgan Chase New York 55,236
19/04/2021 USD 48,471 EUR 40,649 Hedging JP Morgan Chase New York 57619/04/2021 USD 241,326 EUR 202,380 Hedging JP Morgan Chase New York 2,87019/04/2021 EUR 43,839 SGD 70,390 Hedging JP Morgan Chase New York (715)19/04/2021 EUR 5,706 SGD 9,140 Hedging JP Morgan Chase New York (79)19/04/2021 SGD 1,024 EUR 638 Hedging JP Morgan Chase New York 1019/04/2021 EUR 2,971 SGD 4,762 Hedging JP Morgan Chase New York (43)19/04/2021 SGD 7,804 EUR 4,876 Hedging JP Morgan Chase New York 6419/04/2021 EUR 1,032 SGD 1,651 Hedging JP Morgan Chase New York (14)19/04/2021 EUR 1,282 SGD 2,045 Hedging JP Morgan Chase New York (13)19/04/2021 EUR 299 SGD 476 Hedging JP Morgan Chase New York (2)19/04/2021 EUR 672 SGD 1,069 Hedging JP Morgan Chase New York (4)19/04/2021 SGD 8,794 EUR 5,536 Hedging JP Morgan Chase New York 3019/04/2021 EUR 1,082 SGD 1,717 Hedging JP Morgan Chase New York (5)19/04/2021 SGD 123,042 EUR 77,937 Hedging JP Morgan Chase New York (59)19/04/2021 USD 1,122 EUR 957 Hedging JP Morgan Chase New York (2)
9 NET UNREALISED GAIN/(LOSS) ON FORWARD CURRENCY EXCHANGE CONTRACTS (continued)
Notes to the Financial Statements(continued)
297
Threadneedle (Lux) Annual Report and Audited Financial Statements March 2021
PortfolioMaturity
DateCurrency
PurchasedAmount
PurchasedCurrency
SoldAmount
Sold Purpose Counterparty
Unrealised gain/(loss)
in the portfolio base currency
Threadneedle (Lux) - Pan European ESG Equities* (continued) 19/04/2021 USD 5,531 EUR 4,716 Hedging JP Morgan Chase New York (12)
19/04/2021 SGD 66 EUR 42 Hedging JP Morgan Chase New York 006/04/2021 EUR 76,599 DKK 569,700 Trading JP Morgan Chase New York 1
EUR 57,839
Threadneedle (Lux) - Pan European Small Cap Opportunities 19/04/2021 SGD 29,429,486 EUR 18,328,957 Hedging JP Morgan Chase New York 298,350
19/04/2021 CHF 478,952 EUR 433,060 Hedging JP Morgan Chase New York (9)19/04/2021 USD 449,051 EUR 376,583 Hedging JP Morgan Chase New York 5,34019/04/2021 USD 1,379 EUR 1,157 Hedging JP Morgan Chase New York 1619/04/2021 SGD 65,050 EUR 40,513 Hedging JP Morgan Chase New York 66019/04/2021 CHF 24,813 EUR 22,435 Hedging JP Morgan Chase New York 019/04/2021 SGD 48,764 EUR 30,442 Hedging JP Morgan Chase New York 42419/04/2021 SGD 97,538 EUR 60,771 Hedging JP Morgan Chase New York 96519/04/2021 SGD 82,182 EUR 51,275 Hedging JP Morgan Chase New York 74219/04/2021 SGD 19,587 EUR 12,237 Hedging JP Morgan Chase New York 16019/04/2021 SGD 26,095 EUR 16,308 Hedging JP Morgan Chase New York 20919/04/2021 SGD 17,084 EUR 10,705 Hedging JP Morgan Chase New York 10819/04/2021 SGD 34,817 EUR 21,864 Hedging JP Morgan Chase New York 17419/04/2021 EUR 10,989 SGD 17,465 Hedging JP Morgan Chase New York (66)19/04/2021 EUR 3,402 SGD 5,403 Hedging JP Morgan Chase New York (18)19/04/2021 SGD 108,625 EUR 68,417 Hedging JP Morgan Chase New York 33719/04/2021 SGD 67,098 EUR 42,439 Hedging JP Morgan Chase New York 3119/04/2021 EUR 64,904 CHF 71,784 Hedging JP Morgan Chase New York (1)
EUR 307,422
Threadneedle (Lux) - Pan European Smaller Companies 19/04/2021 CHF 2,515,679 EUR 2,274,630 Hedging JP Morgan Chase New York (45)
19/04/2021 USD 26,097,252 EUR 21,885,663 Hedging JP Morgan Chase New York 310,37019/04/2021 CHF 8,127,586 EUR 7,348,810 Hedging JP Morgan Chase New York (146)19/04/2021 USD 15,235,969 EUR 12,777,180 Hedging JP Morgan Chase New York 181,19919/04/2021 CHF 192,447 EUR 174,007 Hedging JP Morgan Chase New York (3)19/04/2021 USD 2,954,239 EUR 2,477,482 Hedging JP Morgan Chase New York 35,13419/04/2021 CHF 40,499 EUR 36,617 Hedging JP Morgan Chase New York 019/04/2021 EUR 55,072 USD 65,674 Hedging JP Morgan Chase New York (785)19/04/2021 CHF 61,894 EUR 55,962 Hedging JP Morgan Chase New York 119/04/2021 CHF 9,000 EUR 8,172 Hedging JP Morgan Chase New York (35)19/04/2021 CHF 140,295 EUR 127,395 Hedging JP Morgan Chase New York (545)19/04/2021 USD 620,000 EUR 520,881 Hedging JP Morgan Chase New York 6,43719/04/2021 CHF 59,895 EUR 54,249 Hedging JP Morgan Chase New York (93)19/04/2021 USD 39,498 EUR 33,158 Hedging JP Morgan Chase New York 43619/04/2021 CHF 12,660 EUR 11,467 Hedging JP Morgan Chase New York (20)19/04/2021 EUR 14,695 CHF 16,264 Hedging JP Morgan Chase New York (10)
9 NET UNREALISED GAIN/(LOSS) ON FORWARD CURRENCY EXCHANGE CONTRACTS (continued)
Notes to the Financial Statements(continued)
298
Threadneedle (Lux) Annual Report and Audited Financial Statements March 2021
PortfolioMaturity
DateCurrency
PurchasedAmount
PurchasedCurrency
SoldAmount
Sold Purpose Counterparty
Unrealised gain/(loss)
in the portfolio base currency
Threadneedle (Lux) - Pan European Smaller Companies (continued) 19/04/2021 CHF 153,795 EUR 138,961 Hedging JP Morgan Chase New York 95
19/04/2021 USD 22,109 EUR 18,528 Hedging JP Morgan Chase New York 27519/04/2021 CHF 74,586 EUR 67,349 Hedging JP Morgan Chase New York 8919/04/2021 CHF 6,294 EUR 5,683 Hedging JP Morgan Chase New York 819/04/2021 CHF 101 EUR 91 Hedging JP Morgan Chase New York 019/04/2021 CHF 168,124 EUR 152,621 Hedging JP Morgan Chase New York (610)19/04/2021 CHF 18,937 EUR 17,099 Hedging JP Morgan Chase New York 2219/04/2021 CHF 2,000 EUR 1,806 Hedging JP Morgan Chase New York 219/04/2021 EUR 423,730 USD 501,534 Hedging JP Morgan Chase New York (2,831)19/04/2021 CHF 20,000 EUR 18,077 Hedging JP Morgan Chase New York 719/04/2021 EUR 924,402 USD 1,094,136 Hedging JP Morgan Chase New York (6,177)19/04/2021 CHF 10,000 EUR 9,041 Hedging JP Morgan Chase New York 019/04/2021 USD 2,500,000 EUR 2,122,129 Hedging JP Morgan Chase New York 4,15119/04/2021 CHF 171,421 EUR 154,989 Hedging JP Morgan Chase New York 319/04/2021 EUR 518,154 USD 610,418 Hedging JP Morgan Chase New York (1,014)19/04/2021 CHF 177,578 EUR 160,173 Hedging JP Morgan Chase New York 38619/04/2021 CHF 13,720 EUR 12,376 Hedging JP Morgan Chase New York 3019/04/2021 CHF 38,972 EUR 35,293 Hedging JP Morgan Chase New York (55)19/04/2021 CHF 85,737 EUR 77,642 Hedging JP Morgan Chase New York (121)19/04/2021 CHF 101 EUR 91 Hedging JP Morgan Chase New York 019/04/2021 CHF 1,860 EUR 1,682 Hedging JP Morgan Chase New York 019/04/2021 CHF 425,340 EUR 384,573 Hedging JP Morgan Chase New York 4
EUR 526,159
Threadneedle (Lux) - European Select 19/04/2021 USD 457,809 EUR 383,927 Hedging JP Morgan Chase New York 5,445
19/04/2021 USD 1,364 EUR 1,144 Hedging JP Morgan Chase New York 1619/04/2021 GBP 4,983 EUR 5,781 Hedging JP Morgan Chase New York 6719/04/2021 GBP 9,264,413 EUR 10,747,978 Hedging JP Morgan Chase New York 124,05219/04/2021 SGD 26,841,977 EUR 16,717,432 Hedging JP Morgan Chase New York 272,11819/04/2021 USD 5,018,302 EUR 4,208,446 Hedging JP Morgan Chase New York 59,68219/04/2021 GBP 5,631 EUR 6,547 Hedging JP Morgan Chase New York 6119/04/2021 SGD 298 EUR 185 Hedging JP Morgan Chase New York 319/04/2021 EUR 25,998 GBP 22,270 Hedging JP Morgan Chase New York (137)19/04/2021 EUR 116,248 SGD 186,215 Hedging JP Morgan Chase New York (1,616)19/04/2021 EUR 126,933 SGD 203,729 Hedging JP Morgan Chase New York (2,017)19/04/2021 GBP 2,988 EUR 3,490 Hedging JP Morgan Chase New York 1619/04/2021 EUR 32,049 SGD 51,366 Hedging JP Morgan Chase New York (464)19/04/2021 EUR 84 GBP 72 Hedging JP Morgan Chase New York (1)19/04/2021 EUR 17,546 GBP 15,119 Hedging JP Morgan Chase New York (195)19/04/2021 GBP 509 EUR 591 Hedging JP Morgan Chase New York 619/04/2021 EUR 4,925 GBP 4,248 Hedging JP Morgan Chase New York (60)19/04/2021 EUR 12,550 SGD 19,986 Hedging JP Morgan Chase New York (100)19/04/2021 EUR 80,802 GBP 69,365 Hedging JP Morgan Chase New York (600)19/04/2021 EUR 31,074 GBP 26,589 Hedging JP Morgan Chase New York (129)19/04/2021 EUR 8,818 SGD 14,007 Hedging JP Morgan Chase New York (48)
9 NET UNREALISED GAIN/(LOSS) ON FORWARD CURRENCY EXCHANGE CONTRACTS (continued)
Notes to the Financial Statements(continued)
299
Threadneedle (Lux) Annual Report and Audited Financial Statements March 2021
PortfolioMaturity
DateCurrency
PurchasedAmount
PurchasedCurrency
SoldAmount
Sold Purpose Counterparty
Unrealised gain/(loss)
in the portfolio base currency
Threadneedle (Lux) - European Select(continued) 19/04/2021 GBP 1,882 EUR 2,202 Hedging JP Morgan Chase New York 6
19/04/2021 SGD 1,110 EUR 699 Hedging JP Morgan Chase New York 319/04/2021 EUR 29,276 GBP 25,046 Hedging JP Morgan Chase New York (116)19/04/2021 SGD 3,174 EUR 2,007 Hedging JP Morgan Chase New York 106/04/2021 EUR 462,473 DKK 3,439,600 Trading JP Morgan Chase New York 5
EUR 455,998
Threadneedle (Lux) - European Smaller Companies 19/04/2021 CHF 400,765 EUR 362,364 Hedging JP Morgan Chase New York (7)
19/04/2021 CHF 8,470,062 EUR 7,658,471 Hedging JP Morgan Chase New York (152)19/04/2021 CHF 2,088 EUR 1,888 Hedging JP Morgan Chase New York 019/04/2021 EUR 65,354 CHF 72,157 Hedging JP Morgan Chase New York 11219/04/2021 CHF 588,891 EUR 531,747 Hedging JP Morgan Chase New York 70619/04/2021 CHF 331,664 EUR 300,347 Hedging JP Morgan Chase New York (469)
EUR 190
Threadneedle (Lux) - Asian Equity Income 19/04/2021 EUR 1,906,787 USD 2,273,721 Hedging JP Morgan Chase New York (31,794)
19/04/2021 EUR 953,886 USD 1,137,448 Hedging JP Morgan Chase New York (15,905)19/04/2021 GBP 194,641 USD 269,251 Hedging JP Morgan Chase New York (687)19/04/2021 EUR 402 USD 479 Hedging JP Morgan Chase New York (7)19/04/2021 USD 20,014 EUR 16,815 Hedging JP Morgan Chase New York 24519/04/2021 EUR 30,000 USD 35,736 Hedging JP Morgan Chase New York (464)19/04/2021 EUR 3,146 USD 3,754 Hedging JP Morgan Chase New York (55)19/04/2021 EUR 8,096 USD 9,648 Hedging JP Morgan Chase New York (129)19/04/2021 EUR 5,988 USD 7,149 Hedging JP Morgan Chase New York (109)19/04/2021 EUR 402 USD 480 Hedging JP Morgan Chase New York (7)19/04/2021 USD 46,362 EUR 39,208 Hedging JP Morgan Chase New York 26319/04/2021 USD 22,269 EUR 18,833 Hedging JP Morgan Chase New York 12619/04/2021 USD 5,277 GBP 3,856 Hedging JP Morgan Chase New York (44)19/04/2021 EUR 100 USD 119 Hedging JP Morgan Chase New York (1)19/04/2021 EUR 150 USD 177 Hedging JP Morgan Chase New York 0
USD (48,568)
Threadneedle (Lux) - Global Technology 19/04/2021 EUR 839,600 USD 1,001,169 Hedging JP Morgan Chase New York (13,999)
19/04/2021 EUR 34,851,019 USD 41,557,610 Hedging JP Morgan Chase New York (581,106)19/04/2021 EUR 57,772,015 USD 68,889,431 Hedging JP Morgan Chase New York (963,291)19/04/2021 EUR 959,182 USD 1,143,763 Hedging JP Morgan Chase New York (15,993)19/04/2021 CHF 2,469,791 USD 2,662,965 Hedging JP Morgan Chase New York (37,377)19/04/2021 EUR 4,015 USD 4,788 Hedging JP Morgan Chase New York (67)19/04/2021 USD 44,128 EUR 37,005 Hedging JP Morgan Chase New York 62019/04/2021 USD 138,648 EUR 116,482 Hedging JP Morgan Chase New York 1,69219/04/2021 EUR 293,496 USD 349,346 Hedging JP Morgan Chase New York (4,264)19/04/2021 USD 40,031 EUR 33,605 Hedging JP Morgan Chase New York 51919/04/2021 USD 727 EUR 611 Hedging JP Morgan Chase New York 9
9 NET UNREALISED GAIN/(LOSS) ON FORWARD CURRENCY EXCHANGE CONTRACTS (continued)
Notes to the Financial Statements(continued)
300
Threadneedle (Lux) Annual Report and Audited Financial Statements March 2021
PortfolioMaturity
DateCurrency
PurchasedAmount
PurchasedCurrency
SoldAmount
Sold Purpose Counterparty
Unrealised gain/(loss)
in the portfolio base currency
Threadneedle (Lux) - Global Technology (continued) 19/04/2021 USD 22,620 EUR 18,945 Hedging JP Morgan Chase New York 346
19/04/2021 USD 932,877 EUR 781,290 Hedging JP Morgan Chase New York 14,26119/04/2021 USD 1,557,796 EUR 1,304,662 Hedging JP Morgan Chase New York 23,81419/04/2021 USD 25,735 EUR 21,553 Hedging JP Morgan Chase New York 39319/04/2021 USD 60,138 CHF 55,632 Hedging JP Morgan Chase New York 99619/04/2021 EUR 6,990 USD 8,341 Hedging JP Morgan Chase New York (122)19/04/2021 EUR 46,064 USD 54,965 Hedging JP Morgan Chase New York (804)19/04/2021 EUR 12,282 USD 14,655 Hedging JP Morgan Chase New York (215)19/04/2021 USD 49,558 EUR 41,587 Hedging JP Morgan Chase New York 66119/04/2021 EUR 29,259 USD 34,867 Hedging JP Morgan Chase New York (465)19/04/2021 USD 44,932 EUR 37,633 Hedging JP Morgan Chase New York 68419/04/2021 USD 39,653 EUR 33,212 Hedging JP Morgan Chase New York 60319/04/2021 EUR 56,131 USD 66,676 Hedging JP Morgan Chase New York (680)19/04/2021 USD 701 EUR 590 Hedging JP Morgan Chase New York 719/04/2021 USD 34,427 EUR 29,087 Hedging JP Morgan Chase New York 22819/04/2021 EUR 50,429 USD 59,688 Hedging JP Morgan Chase New York (396)19/04/2021 USD 63,438 EUR 53,850 Hedging JP Morgan Chase New York 12419/04/2021 USD 1,001 EUR 850 Hedging JP Morgan Chase New York 219/04/2021 EUR 19,842 USD 23,390 Hedging JP Morgan Chase New York (60)19/04/2021 EUR 814,465 USD 960,095 Hedging JP Morgan Chase New York (2,478)19/04/2021 EUR 1,378,444 USD 1,624,916 Hedging JP Morgan Chase New York (4,194)19/04/2021 EUR 22,720 USD 26,783 Hedging JP Morgan Chase New York (69)19/04/2021 CHF 58,336 USD 62,159 Hedging JP Morgan Chase New York (144)19/04/2021 USD 113,940 EUR 96,542 Hedging JP Morgan Chase New York 42919/04/2021 EUR 959 USD 1,132 Hedging JP Morgan Chase New York (4)19/04/2021 EUR 149 USD 175 Hedging JP Morgan Chase New York 019/04/2021 USD 109,306 EUR 92,884 Hedging JP Morgan Chase New York 9619/04/2021 EUR 3,919 USD 4,612 Hedging JP Morgan Chase New York (4)19/04/2021 EUR 89,996 USD 105,572 Hedging JP Morgan Chase New York 24319/04/2021 USD 407 EUR 347 Hedging JP Morgan Chase New York (1)
USD (1,580,006)
Threadneedle (Lux) - UK Equities 19/04/2021 CHF 161,709 GBP 126,085 Hedging JP Morgan Chase New York (1,493)
19/04/2021 EUR 2,187,447 GBP 1,885,509 Hedging JP Morgan Chase New York (21,514)19/04/2021 EUR 5,716,884 GBP 4,927,771 Hedging JP Morgan Chase New York (56,227)19/04/2021 USD 272,831 GBP 197,229 Hedging JP Morgan Chase New York 50419/04/2021 EUR 1,204,835 GBP 1,038,529 Hedging JP Morgan Chase New York (11,850)19/04/2021 CHF 70,529 GBP 54,992 Hedging JP Morgan Chase New York (651)19/04/2021 EUR 25,295 GBP 21,804 Hedging JP Morgan Chase New York (249)19/04/2021 EUR 3,157,670 GBP 2,721,810 Hedging JP Morgan Chase New York (31,056)19/04/2021 CHF 57,077 GBP 44,503 Hedging JP Morgan Chase New York (527)19/04/2021 USD 3,265,727 GBP 2,360,791 Hedging JP Morgan Chase New York 6,04219/04/2021 EUR 97,837 GBP 84,333 Hedging JP Morgan Chase New York (962)19/04/2021 CHF 64,570 GBP 50,345 Hedging JP Morgan Chase New York (597)19/04/2021 USD 307,670 GBP 222,414 Hedging JP Morgan Chase New York 56919/04/2021 EUR 1,242 GBP 1,070 Hedging JP Morgan Chase New York (12)
9 NET UNREALISED GAIN/(LOSS) ON FORWARD CURRENCY EXCHANGE CONTRACTS (continued)
Notes to the Financial Statements(continued)
301
Threadneedle (Lux) Annual Report and Audited Financial Statements March 2021
PortfolioMaturity
DateCurrency
PurchasedAmount
PurchasedCurrency
SoldAmount
Sold Purpose Counterparty
Unrealised gain/(loss)
in the portfolio base currency
Threadneedle (Lux) - UK Equities (continued) 19/04/2021 CHF 1,242 GBP 968 Hedging JP Morgan Chase New York (11)
19/04/2021 USD 1,248 GBP 902 Hedging JP Morgan Chase New York 219/04/2021 EUR 1,242 GBP 1,070 Hedging JP Morgan Chase New York (13)19/04/2021 CHF 1,241 GBP 968 Hedging JP Morgan Chase New York (11)19/04/2021 USD 1,248 GBP 902 Hedging JP Morgan Chase New York 219/04/2021 EUR 3,200 GBP 2,752 Hedging JP Morgan Chase New York (25)19/04/2021 EUR 69,025 GBP 59,367 Hedging JP Morgan Chase New York (548)19/04/2021 EUR 2,060 GBP 1,772 Hedging JP Morgan Chase New York (16)19/04/2021 EUR 2,700 GBP 2,313 Hedging JP Morgan Chase New York (12)19/04/2021 EUR 3,066 GBP 2,626 Hedging JP Morgan Chase New York (14)19/04/2021 EUR 9,200 GBP 7,891 Hedging JP Morgan Chase New York (51)19/04/2021 EUR 109,985 GBP 94,336 Hedging JP Morgan Chase New York (615)19/04/2021 EUR 2,260 GBP 1,938 Hedging JP Morgan Chase New York (13)19/04/2021 EUR 10,900 GBP 9,331 Hedging JP Morgan Chase New York (43)19/04/2021 EUR 26,999 GBP 23,113 Hedging JP Morgan Chase New York (106)19/04/2021 EUR 2,873 GBP 2,460 Hedging JP Morgan Chase New York (11)19/04/2021 EUR 85,448 GBP 73,395 Hedging JP Morgan Chase New York (582)19/04/2021 EUR 14,696 GBP 12,623 Hedging JP Morgan Chase New York (100)19/04/2021 EUR 1,600 GBP 1,379 Hedging JP Morgan Chase New York (15)19/04/2021 EUR 29,430 GBP 25,358 Hedging JP Morgan Chase New York (280)19/04/2021 EUR 17,046 GBP 14,688 Hedging JP Morgan Chase New York (162)19/04/2021 USD 8,899 GBP 6,422 Hedging JP Morgan Chase New York 2719/04/2021 EUR 201,800 GBP 173,787 Hedging JP Morgan Chase New York (1,827)19/04/2021 EUR 13,200 GBP 11,368 Hedging JP Morgan Chase New York (119)19/04/2021 EUR 1,319 GBP 1,136 Hedging JP Morgan Chase New York (12)19/04/2021 GBP 32,952 EUR 38,263 Hedging JP Morgan Chase New York 34619/04/2021 GBP 20,558 USD 28,357 Hedging JP Morgan Chase New York 619/04/2021 EUR 12,300 GBP 10,609 Hedging JP Morgan Chase New York (128)19/04/2021 EUR 9,726 GBP 8,389 Hedging JP Morgan Chase New York (101)19/04/2021 GBP 2,435 EUR 2,823 Hedging JP Morgan Chase New York 2919/04/2021 USD 124,967 GBP 91,068 Hedging JP Morgan Chase New York (498)19/04/2021 EUR 1,850 GBP 1,588 Hedging JP Morgan Chase New York (12)19/04/2021 EUR 975 GBP 837 Hedging JP Morgan Chase New York (6)19/04/2021 GBP 7,861 CHF 10,128 Hedging JP Morgan Chase New York 5819/04/2021 USD 1,000 GBP 729 Hedging JP Morgan Chase New York (4)19/04/2021 EUR 4,600 GBP 3,936 Hedging JP Morgan Chase New York (16)19/04/2021 EUR 100 GBP 86 Hedging JP Morgan Chase New York 019/04/2021 USD 625,527 GBP 453,511 Hedging JP Morgan Chase New York (161)19/04/2021 EUR 9,928 GBP 8,495 Hedging JP Morgan Chase New York (35)19/04/2021 EUR 1,550 GBP 1,325 Hedging JP Morgan Chase New York (4)19/04/2021 EUR 6,741 GBP 5,760 Hedging JP Morgan Chase New York (16)19/04/2021 EUR 3,275 GBP 2,798 Hedging JP Morgan Chase New York (8)19/04/2021 EUR 650 GBP 556 Hedging JP Morgan Chase New York (2)19/04/2021 GBP 2,204 EUR 2,577 Hedging JP Morgan Chase New York 9
GBP (123,121)
9 NET UNREALISED GAIN/(LOSS) ON FORWARD CURRENCY EXCHANGE CONTRACTS (continued)
Notes to the Financial Statements(continued)
302
Threadneedle (Lux) Annual Report and Audited Financial Statements March 2021
PortfolioMaturity
DateCurrency
PurchasedAmount
PurchasedCurrency
SoldAmount
Sold Purpose Counterparty
Unrealised gain/(loss)
in the portfolio base currency
Threadneedle (Lux) - UK Equity Income 19/04/2021 EUR 2,374,942 GBP 2,047,124 Hedging JP Morgan Chase New York (23,358)
19/04/2021 EUR 27,903 GBP 24,052 Hedging JP Morgan Chase New York (274)19/04/2021 EUR 2,309,560 GBP 1,990,767 Hedging JP Morgan Chase New York (22,715)19/04/2021 CHF 134,134 GBP 104,585 Hedging JP Morgan Chase New York (1,239)19/04/2021 USD 1,217,544 GBP 880,161 Hedging JP Morgan Chase New York 2,25319/04/2021 SGD 1,681 GBP 903 Hedging JP Morgan Chase New York 419/04/2021 EUR 432,125 GBP 372,478 Hedging JP Morgan Chase New York (4,250)19/04/2021 EUR 1,021 GBP 880 Hedging JP Morgan Chase New York (10)19/04/2021 EUR 140,527 GBP 121,130 Hedging JP Morgan Chase New York (1,383)19/04/2021 USD 902,231 GBP 652,222 Hedging JP Morgan Chase New York 1,67019/04/2021 USD 1,172 GBP 847 Hedging JP Morgan Chase New York 219/04/2021 EUR 2,123,393 GBP 1,830,297 Hedging JP Morgan Chase New York (20,884)19/04/2021 CHF 305,677 GBP 238,337 Hedging JP Morgan Chase New York (2,823)19/04/2021 USD 522,249 GBP 377,533 Hedging JP Morgan Chase New York 96619/04/2021 CHF 276,456 GBP 215,553 Hedging JP Morgan Chase New York (2,553)19/04/2021 CHF 1,070 GBP 835 Hedging JP Morgan Chase New York (10)19/04/2021 USD 2,922,486 GBP 2,112,662 Hedging JP Morgan Chase New York 5,40719/04/2021 EUR 2,144,230 GBP 1,848,258 Hedging JP Morgan Chase New York (21,089)19/04/2021 USD 1,134 GBP 820 Hedging JP Morgan Chase New York 219/04/2021 EUR 454,625 GBP 391,872 Hedging JP Morgan Chase New York (4,471)19/04/2021 GBP 26,196 EUR 30,458 Hedging JP Morgan Chase New York 24219/04/2021 EUR 267 GBP 230 Hedging JP Morgan Chase New York (2)19/04/2021 EUR 10,000 GBP 8,601 Hedging JP Morgan Chase New York (79)19/04/2021 GBP 56,968 EUR 66,236 Hedging JP Morgan Chase New York 52619/04/2021 EUR 7,599 GBP 6,509 Hedging JP Morgan Chase New York (34)19/04/2021 EUR 78,152 GBP 66,946 Hedging JP Morgan Chase New York (350)19/04/2021 GBP 6,205 CHF 7,977 Hedging JP Morgan Chase New York 5919/04/2021 USD 20,726 GBP 14,916 Hedging JP Morgan Chase New York 10519/04/2021 EUR 90,590 GBP 77,701 Hedging JP Morgan Chase New York (506)19/04/2021 EUR 100,411 GBP 85,958 Hedging JP Morgan Chase New York (394)19/04/2021 EUR 24,896 GBP 21,384 Hedging JP Morgan Chase New York (170)19/04/2021 EUR 65,005 GBP 55,836 Hedging JP Morgan Chase New York (443)19/04/2021 USD 50,000 GBP 36,040 Hedging JP Morgan Chase New York 19719/04/2021 EUR 200,000 GBP 172,237 Hedging JP Morgan Chase New York (1,810)19/04/2021 USD 150,000 GBP 108,746 Hedging JP Morgan Chase New York (33)19/04/2021 EUR 10,945 GBP 9,425 Hedging JP Morgan Chase New York (99)19/04/2021 USD 50,000 GBP 36,437 Hedging JP Morgan Chase New York (199)19/04/2021 EUR 36,160 GBP 31,189 Hedging JP Morgan Chase New York (376)19/04/2021 EUR 26,256 GBP 22,539 Hedging JP Morgan Chase New York (166)19/04/2021 EUR 10,000 GBP 8,585 Hedging JP Morgan Chase New York (63)19/04/2021 EUR 16,659 GBP 14,255 Hedging JP Morgan Chase New York (59)19/04/2021 GBP 865 EUR 1,011 Hedging JP Morgan Chase New York 419/04/2021 EUR 61,891 GBP 52,959 Hedging JP Morgan Chase New York (219)19/04/2021 GBP 1,208 EUR 1,412 Hedging JP Morgan Chase New York 519/04/2021 USD 100,000 GBP 72,613 Hedging JP Morgan Chase New York (138)19/04/2021 EUR 1,264 GBP 1,080 Hedging JP Morgan Chase New York (3)19/04/2021 EUR 20,363 GBP 17,420 Hedging JP Morgan Chase New York (68)19/04/2021 EUR 50,000 GBP 42,775 Hedging JP Morgan Chase New York (168)
9 NET UNREALISED GAIN/(LOSS) ON FORWARD CURRENCY EXCHANGE CONTRACTS (continued)
Notes to the Financial Statements(continued)
303
Threadneedle (Lux) Annual Report and Audited Financial Statements March 2021
PortfolioMaturity
DateCurrency
PurchasedAmount
PurchasedCurrency
SoldAmount
Sold Purpose Counterparty
Unrealised gain/(loss)
in the portfolio base currency
Threadneedle (Lux) - UK Equity Income (continued) 19/04/2021 CHF 50,000 GBP 38,676 Hedging JP Morgan Chase New York (153)
19/04/2021 EUR 25,753 GBP 22,032 Hedging JP Morgan Chase New York (87)
GBP (99,236)
Threadneedle (Lux) - American Absolute Alpha 19/04/2021 EUR 704,862 USD 840,503 Hedging JP Morgan Chase New York (11,753)
19/04/2021 CHF 8,672 USD 9,351 Hedging JP Morgan Chase New York (131)19/04/2021 GBP 19,128 USD 26,460 Hedging JP Morgan Chase New York (68)19/04/2021 EUR 114,973 USD 137,098 Hedging JP Morgan Chase New York (1,917)19/04/2021 EUR 1,332,068 USD 1,588,406 Hedging JP Morgan Chase New York (22,211)19/04/2021 GBP 1,851,427 USD 2,561,114 Hedging JP Morgan Chase New York (6,539)19/04/2021 GBP 68,366,282 USD 94,572,376 Hedging JP Morgan Chase New York (241,470)19/04/2021 GBP 52,418 USD 72,510 Hedging JP Morgan Chase New York (185)19/04/2021 EUR 972 USD 1,159 Hedging JP Morgan Chase New York (16)19/04/2021 EUR 500 USD 596 Hedging JP Morgan Chase New York (8)19/04/2021 USD 9,774 EUR 8,191 Hedging JP Morgan Chase New York 14419/04/2021 USD 125 GBP 90 Hedging JP Morgan Chase New York 119/04/2021 USD 6,477 EUR 5,425 Hedging JP Morgan Chase New York 9919/04/2021 USD 161,874 EUR 135,580 Hedging JP Morgan Chase New York 2,46319/04/2021 USD 19,613 GBP 14,219 Hedging JP Morgan Chase New York (6)19/04/2021 GBP 492 USD 678 Hedging JP Morgan Chase New York 119/04/2021 USD 14,743 EUR 12,568 Hedging JP Morgan Chase New York (34)19/04/2021 USD 5,011 EUR 4,272 Hedging JP Morgan Chase New York (12)19/04/2021 USD 1,978 EUR 1,686 Hedging JP Morgan Chase New York (5)
USD (281,647)
Threadneedle (Lux) - Credit Opportunities 19/04/2021 USD 3,176,398 EUR 2,663,789 Hedging JP Morgan Chase New York 37,776
19/04/2021 GBP 670,866 EUR 778,296 Hedging JP Morgan Chase New York 8,98319/04/2021 GBP 13,064,109 EUR 15,156,141 Hedging JP Morgan Chase New York 174,93019/04/2021 GBP 2,577,458 EUR 2,990,202 Hedging JP Morgan Chase New York 34,51219/04/2021 GBP 1,488,565 EUR 1,726,938 Hedging JP Morgan Chase New York 19,93219/04/2021 GBP 989 EUR 1,147 Hedging JP Morgan Chase New York 1319/04/2021 GBP 146,900 EUR 170,424 Hedging JP Morgan Chase New York 1,96719/04/2021 GBP 375 EUR 436 Hedging JP Morgan Chase New York 419/04/2021 EUR 3 GBP 3 Hedging JP Morgan Chase New York 019/04/2021 EUR 36,854 GBP 31,569 Hedging JP Morgan Chase New York (194)19/04/2021 EUR 30,042 GBP 25,768 Hedging JP Morgan Chase New York (197)19/04/2021 EUR 175,966 GBP 150,930 Hedging JP Morgan Chase New York (1,155)19/04/2021 GBP 5,084 EUR 5,939 Hedging JP Morgan Chase New York 2719/04/2021 EUR 626 GBP 537 Hedging JP Morgan Chase New York (5)19/04/2021 EUR 30 GBP 26 Hedging JP Morgan Chase New York 019/04/2021 EUR 33,189 GBP 28,597 Hedging JP Morgan Chase New York (372)19/04/2021 EUR 19 GBP 16 Hedging JP Morgan Chase New York 019/04/2021 EUR 2,009 GBP 1,731 Hedging JP Morgan Chase New York (21)19/04/2021 EUR 23,053 GBP 19,884 Hedging JP Morgan Chase New York (281)
9 NET UNREALISED GAIN/(LOSS) ON FORWARD CURRENCY EXCHANGE CONTRACTS (continued)
Notes to the Financial Statements(continued)
304
Threadneedle (Lux) Annual Report and Audited Financial Statements March 2021
PortfolioMaturity
DateCurrency
PurchasedAmount
PurchasedCurrency
SoldAmount
Sold Purpose Counterparty
Unrealised gain/(loss)
in the portfolio base currency
Threadneedle (Lux) - Credit Opportunities (continued) 19/04/2021 EUR 77,121 GBP 66,519 Hedging JP Morgan Chase New York (941)
19/04/2021 EUR 26,963 GBP 23,099 Hedging JP Morgan Chase New York (145)19/04/2021 EUR 39 GBP 34 Hedging JP Morgan Chase New York 019/04/2021 GBP 388 EUR 451 Hedging JP Morgan Chase New York 319/04/2021 EUR 41,287 GBP 35,443 Hedging JP Morgan Chase New York (306)19/04/2021 GBP 1,000 EUR 1,165 Hedging JP Morgan Chase New York 919/04/2021 EUR 57,974 GBP 49,607 Hedging JP Morgan Chase New York (241)19/04/2021 EUR 160 GBP 137 Hedging JP Morgan Chase New York (1)19/04/2021 EUR 82 GBP 70 Hedging JP Morgan Chase New York 019/04/2021 GBP 13 EUR 15 Hedging JP Morgan Chase New York 019/04/2021 EUR 24,374 GBP 20,852 Hedging JP Morgan Chase New York (96)19/04/2021 EUR 11 GBP 10 Hedging JP Morgan Chase New York 022/04/2021 EUR 241,098,152 GBP 206,504,593 Trading Goldman Sachs (1,228,435)22/04/2021 EUR 146,184,461 USD 174,496,882 Trading Lloyds (2,219,073)22/04/2021 EUR 577,981 USD 688,810 Trading Citigroup Global Markets (7,827)22/04/2021 USD 692,616 EUR 582,066 Trading JP Morgan Chase New York 6,975
EUR (3,174,159)
Threadneedle (Lux) - Global Investment Grade Credit Opportunities 19/04/2021 CHF 1,917 EUR 1,733 Hedging JP Morgan Chase New York 0
19/04/2021 USD 1,090 EUR 914 Hedging JP Morgan Chase New York 1319/04/2021 GBP 1,505 EUR 1,746 Hedging JP Morgan Chase New York 2019/04/2021 USD 1,109 EUR 930 Hedging JP Morgan Chase New York 1319/04/2021 GBP 1,505 EUR 1,746 Hedging JP Morgan Chase New York 2019/04/2021 USD 1,103 EUR 925 Hedging JP Morgan Chase New York 1319/04/2021 GBP 1,498 EUR 1,738 Hedging JP Morgan Chase New York 2119/04/2021 USD 1,098 EUR 921 Hedging JP Morgan Chase New York 1319/04/2021 CHF 1,942 EUR 1,756 Hedging JP Morgan Chase New York 019/04/2021 GBP 1,501 EUR 1,742 Hedging JP Morgan Chase New York 2019/04/2021 USD 1,105 EUR 926 Hedging JP Morgan Chase New York 1319/04/2021 GBP 1,511 EUR 1,753 Hedging JP Morgan Chase New York 2019/04/2021 SEK 10,234 EUR 1,006 Hedging JP Morgan Chase New York (7)19/04/2021 NOK 10,365 EUR 1,024 Hedging JP Morgan Chase New York 819/04/2021 NOK 10,397 EUR 1,027 Hedging JP Morgan Chase New York 819/04/2021 GBP 39,704,080 EUR 46,062,128 Hedging JP Morgan Chase New York 531,64419/04/2021 USD 61,270 EUR 51,383 Hedging JP Morgan Chase New York 72919/04/2021 EUR 25,692 USD 30,656 Hedging JP Morgan Chase New York (382)22/04/2021 EUR 8,728,229 USD 10,432,202 Trading Barclays (144,001)22/04/2021 EUR 11,506,505 GBP 9,834,430 Trading Barclays (33,878)22/04/2021 EUR 352,686 USD 420,000 Trading Barclays (4,509)22/04/2021 EUR 25,174 USD 30,000 Trading JP Morgan Chase New York (340)22/04/2021 EUR 50,955 USD 60,725 Trading Citigroup Global Markets (690)22/04/2021 USD 62,267 EUR 52,681 Trading JP Morgan Chase New York 274
EUR 349,022
9 NET UNREALISED GAIN/(LOSS) ON FORWARD CURRENCY EXCHANGE CONTRACTS (continued)
Notes to the Financial Statements(continued)
305
Threadneedle (Lux) Annual Report and Audited Financial Statements March 2021
PortfolioMaturity
DateCurrency
PurchasedAmount
PurchasedCurrency
SoldAmount
Sold Purpose Counterparty
Unrealised gain/(loss)
in the portfolio base currency
Threadneedle (Lux) - Pan European Absolute Alpha 19/04/2021 USD 53,335 EUR 44,728 Hedging JP Morgan Chase New York 634
19/04/2021 GBP 991,522 EUR 1,150,300 Hedging JP Morgan Chase New York 13,27719/04/2021 GBP 65,350,628 EUR 75,815,608 Hedging JP Morgan Chase New York 875,05219/04/2021 GBP 2,547 EUR 2,954 Hedging JP Morgan Chase New York 3419/04/2021 CHF 75,829 EUR 68,563 Hedging JP Morgan Chase New York (1)19/04/2021 GBP 8,000 EUR 9,284 Hedging JP Morgan Chase New York 10419/04/2021 GBP 230 EUR 267 Hedging JP Morgan Chase New York 319/04/2021 GBP 140 EUR 162 Hedging JP Morgan Chase New York 207/04/2021 EUR 471,098 DKK 3,503,980 Trading JP Morgan Chase New York (24)
EUR 889,081
Threadneedle (Lux) - American Extended Alpha 19/04/2021 EUR 3,573,286 USD 4,260,915 Hedging JP Morgan Chase New York (59,581)
19/04/2021 EUR 1,475 USD 1,759 Hedging JP Morgan Chase New York (25)19/04/2021 EUR 1,459 USD 1,740 Hedging JP Morgan Chase New York (24)19/04/2021 EUR 660 USD 787 Hedging JP Morgan Chase New York (11)19/04/2021 EUR 39 USD 46 Hedging JP Morgan Chase New York (1)19/04/2021 USD 89,260 EUR 74,756 Hedging JP Morgan Chase New York 1,36419/04/2021 USD 37 EUR 31 Hedging JP Morgan Chase New York 119/04/2021 USD 36 EUR 31 Hedging JP Morgan Chase New York 119/04/2021 USD 25 EUR 21 Hedging JP Morgan Chase New York 019/04/2021 USD 9,516 EUR 7,985 Hedging JP Morgan Chase New York 12719/04/2021 EUR 2,490 USD 2,958 Hedging JP Morgan Chase New York (30)19/04/2021 EUR 71,625 USD 84,432 Hedging JP Morgan Chase New York (218)19/04/2021 EUR 30 USD 35 Hedging JP Morgan Chase New York 019/04/2021 USD 6,336 EUR 5,384 Hedging JP Morgan Chase New York 6
USD (58,391)
Threadneedle (Lux) - Global Extended Alpha 19/04/2021 EUR 2,165,454 USD 2,582,165 Hedging JP Morgan Chase New York (36,107)
19/04/2021 EUR 265,522 USD 316,619 Hedging JP Morgan Chase New York (4,427)19/04/2021 EUR 20,188 USD 24,030 Hedging JP Morgan Chase New York (293)19/04/2021 EUR 24,990 USD 29,768 Hedging JP Morgan Chase New York (386)19/04/2021 EUR 10,490 USD 12,501 Hedging JP Morgan Chase New York (167)19/04/2021 USD 53,214 EUR 45,059 Hedging JP Morgan Chase New York 23519/04/2021 USD 7,776 EUR 6,585 Hedging JP Morgan Chase New York 3419/04/2021 EUR 192,422 USD 226,685 Hedging JP Morgan Chase New York (443)19/04/2021 EUR 14,990 USD 17,691 Hedging JP Morgan Chase New York (67)06/04/2021 USD 31,136 DKK 197,500 Trading Royal Bank of Scotland (77)
USD (41,698)
9 NET UNREALISED GAIN/(LOSS) ON FORWARD CURRENCY EXCHANGE CONTRACTS (continued)
Notes to the Financial Statements(continued)
306
Threadneedle (Lux) Annual Report and Audited Financial Statements March 2021
PortfolioMaturity
DateCurrency
PurchasedAmount
PurchasedCurrency
SoldAmount
Sold Purpose Counterparty
Unrealised gain/(loss)
in the portfolio base currency
Threadneedle (Lux) - Enhanced Commodities 19/04/2021 EUR 2,138,410 USD 2,549,917 Hedging JP Morgan Chase New York (35,656)
19/04/2021 CHF 1,078,517 USD 1,162,873 Hedging JP Morgan Chase New York (16,322)19/04/2021 GBP 451,910 USD 625,136 Hedging JP Morgan Chase New York (1,596)19/04/2021 EUR 1,107,455 USD 1,320,570 Hedging JP Morgan Chase New York (18,466)19/04/2021 EUR 6,947,461 USD 8,284,403 Hedging JP Morgan Chase New York (115,842)19/04/2021 GBP 60,282,584 USD 83,390,044 Hedging JP Morgan Chase New York (212,918)19/04/2021 SGD 1,577,649 USD 1,171,693 Hedging JP Morgan Chase New York 2,38619/04/2021 GBP 1,140,571 USD 1,577,774 Hedging JP Morgan Chase New York (4,029)19/04/2021 EUR 208,215 USD 248,283 Hedging JP Morgan Chase New York (3,472)19/04/2021 CHF 26,836 USD 28,935 Hedging JP Morgan Chase New York (405)19/04/2021 USD 13,081 EUR 10,969 Hedging JP Morgan Chase New York 18419/04/2021 CHF 2,020 USD (2,178) Hedging JP Morgan Chase New York (31)19/04/2021 GBP 15,000 USD 20,798 Hedging JP Morgan Chase New York (101)19/04/2021 EUR 3,375 USD 4,024 Hedging JP Morgan Chase New York (57)19/04/2021 USD 19,015 GBP 13,714 Hedging JP Morgan Chase New York 9319/04/2021 SGD 88,938 USD 66,054 Hedging JP Morgan Chase New York 13319/04/2021 USD 7,715 GBP 5,564 Hedging JP Morgan Chase New York 3819/04/2021 CHF 39,507 USD 42,701 Hedging JP Morgan Chase New York (702)19/04/2021 EUR 1,111 USD 1,322 Hedging JP Morgan Chase New York (16)19/04/2021 USD 8,135 GBP 5,855 Hedging JP Morgan Chase New York 5719/04/2021 SGD 131,621 USD 97,804 Hedging JP Morgan Chase New York 14819/04/2021 GBP 1,499 USD 2,082 Hedging JP Morgan Chase New York (15)19/04/2021 EUR 104 USD 124 Hedging JP Morgan Chase New York (2)19/04/2021 GBP 3,050 USD 4,236 Hedging JP Morgan Chase New York (28)19/04/2021 USD 4,117 EUR 3,456 Hedging JP Morgan Chase New York 5319/04/2021 GBP 902 USD 1,253 Hedging JP Morgan Chase New York (8)19/04/2021 SGD 138,202 USD 102,573 Hedging JP Morgan Chase New York 27719/04/2021 USD 27,734 GBP 19,970 Hedging JP Morgan Chase New York 18019/04/2021 USD 65,979 EUR 55,258 Hedging JP Morgan Chase New York 1,00919/04/2021 USD 31,502 CHF 29,141 Hedging JP Morgan Chase New York 52219/04/2021 USD 16,956 GBP 12,154 Hedging JP Morgan Chase New York 18719/04/2021 USD 34,399 EUR 28,809 Hedging JP Morgan Chase New York 52619/04/2021 USD 214,804 EUR 179,899 Hedging JP Morgan Chase New York 3,28419/04/2021 USD 2,169,314 GBP 1,554,854 Hedging JP Morgan Chase New York 23,94519/04/2021 USD 37,058 SGD 49,707 Hedging JP Morgan Chase New York 6719/04/2021 USD 40,296 GBP 28,882 Hedging JP Morgan Chase New York 44519/04/2021 USD 6,437 EUR 5,391 Hedging JP Morgan Chase New York 9819/04/2021 USD 753 CHF 697 Hedging JP Morgan Chase New York 1219/04/2021 EUR 245 USD 292 Hedging JP Morgan Chase New York (4)19/04/2021 EUR 8,608 USD 10,271 Hedging JP Morgan Chase New York (150)19/04/2021 GBP 317 USD 442 Hedging JP Morgan Chase New York (4)19/04/2021 SGD 151,590 USD 112,858 Hedging JP Morgan Chase New York (45)19/04/2021 GBP 1,800 USD 2,509 Hedging JP Morgan Chase New York (25)19/04/2021 CHF 2,314 USD 2,490 Hedging JP Morgan Chase New York (30)19/04/2021 EUR 5,844 USD 6,964 Hedging JP Morgan Chase New York (93)19/04/2021 USD 4,263 GBP 3,073 Hedging JP Morgan Chase New York 2319/04/2021 SGD 74,601 USD 55,541 Hedging JP Morgan Chase New York (24)
9 NET UNREALISED GAIN/(LOSS) ON FORWARD CURRENCY EXCHANGE CONTRACTS (continued)
Notes to the Financial Statements(continued)
307
Threadneedle (Lux) Annual Report and Audited Financial Statements March 2021
PortfolioMaturity
DateCurrency
PurchasedAmount
PurchasedCurrency
SoldAmount
Sold Purpose Counterparty
Unrealised gain/(loss)
in the portfolio base currency
Threadneedle (Lux) - Enhanced Commodities (continued) 19/04/2021 GBP 10,939 USD 15,177 Hedging JP Morgan Chase New York (83)
19/04/2021 EUR 21,390 USD 25,482 Hedging JP Morgan Chase New York (333)19/04/2021 CHF 11,232 USD 12,112 Hedging JP Morgan Chase New York (171)19/04/2021 GBP 4,764 USD 6,597 Hedging JP Morgan Chase New York (23)19/04/2021 EUR 11,073 USD 13,191 Hedging JP Morgan Chase New York (172)19/04/2021 EUR 70,739 USD 84,274 Hedging JP Morgan Chase New York (1,101)19/04/2021 GBP 617,747 USD 855,394 Hedging JP Morgan Chase New York (3,034)19/04/2021 SGD 21,348 USD 15,915 Hedging JP Morgan Chase New York (28)19/04/2021 GBP 11,476 USD 15,891 Hedging JP Morgan Chase New York (56)19/04/2021 EUR 2,116 USD 2,520 Hedging JP Morgan Chase New York (33)19/04/2021 CHF 272 USD 293 Hedging JP Morgan Chase New York (4)19/04/2021 USD 140 GBP 101 Hedging JP Morgan Chase New York 119/04/2021 EUR 500 USD 597 Hedging JP Morgan Chase New York (9)19/04/2021 EUR 43,542 USD 51,987 Hedging JP Morgan Chase New York (791)19/04/2021 USD 11 GBP 8 Hedging JP Morgan Chase New York 019/04/2021 GBP 10,605 USD 14,694 Hedging JP Morgan Chase New York (62)19/04/2021 USD 41,502 EUR 35,098 Hedging JP Morgan Chase New York 23519/04/2021 USD 19,884 CHF 18,608 Hedging JP Morgan Chase New York 10219/04/2021 USD 10,586 GBP 7,736 Hedging JP Morgan Chase New York (88)19/04/2021 USD 21,626 EUR 18,289 Hedging JP Morgan Chase New York 12319/04/2021 USD 136,465 EUR 115,407 Hedging JP Morgan Chase New York 77419/04/2021 USD 1,355,557 GBP 990,563 Hedging JP Morgan Chase New York (11,208)19/04/2021 USD 26,446 SGD 35,640 Hedging JP Morgan Chase New York (77)19/04/2021 USD 25,651 GBP 18,744 Hedging JP Morgan Chase New York (212)19/04/2021 USD 4,055 EUR 3,429 Hedging JP Morgan Chase New York 2319/04/2021 USD 475 CHF 444 Hedging JP Morgan Chase New York 219/04/2021 GBP 201 USD 277 Hedging JP Morgan Chase New York 019/04/2021 EUR 2,609 USD 3,099 Hedging JP Morgan Chase New York (32)19/04/2021 USD 326 GBP 236 Hedging JP Morgan Chase New York 019/04/2021 USD 460 SGD 617 Hedging JP Morgan Chase New York 019/04/2021 EUR 25,841 USD 30,517 Hedging JP Morgan Chase New York (135)19/04/2021 CHF 13,630 USD 14,555 Hedging JP Morgan Chase New York (66)19/04/2021 GBP 5,702 USD 7,801 Hedging JP Morgan Chase New York 6719/04/2021 EUR 13,439 USD 15,871 Hedging JP Morgan Chase New York (70)19/04/2021 EUR 85,351 USD 100,797 Hedging JP Morgan Chase New York (445)19/04/2021 GBP 732,824 USD 1,002,535 Hedging JP Morgan Chase New York 8,60719/04/2021 SGD 26,349 USD 19,551 Hedging JP Morgan Chase New York 5819/04/2021 GBP 13,864 USD 18,967 Hedging JP Morgan Chase New York 16319/04/2021 EUR 2,535 USD 2,993 Hedging JP Morgan Chase New York (13)19/04/2021 CHF 327 USD 349 Hedging JP Morgan Chase New York (2)19/04/2021 EUR 98 USD 116 Hedging JP Morgan Chase New York (1)19/04/2021 EUR 250 USD 296 Hedging JP Morgan Chase New York (2)19/04/2021 EUR 46,934 USD 55,551 Hedging JP Morgan Chase New York (369)19/04/2021 GBP 270 USD 371 Hedging JP Morgan Chase New York 219/04/2021 GBP 1,538 USD 2,111 Hedging JP Morgan Chase New York 1219/04/2021 USD 39,575 EUR 33,563 Hedging JP Morgan Chase New York 113
9 NET UNREALISED GAIN/(LOSS) ON FORWARD CURRENCY EXCHANGE CONTRACTS (continued)
Notes to the Financial Statements(continued)
308
Threadneedle (Lux) Annual Report and Audited Financial Statements March 2021
PortfolioMaturity
DateCurrency
PurchasedAmount
PurchasedCurrency
SoldAmount
Sold Purpose Counterparty
Unrealised gain/(loss)
in the portfolio base currency
Threadneedle (Lux) - Enhanced Commodities (continued) 19/04/2021 USD 18,833 CHF 17,712 Hedging JP Morgan Chase New York 4
19/04/2021 USD 10,126 GBP 7,356 Hedging JP Morgan Chase New York (23)19/04/2021 USD 20,626 EUR 17,493 Hedging JP Morgan Chase New York 5919/04/2021 USD 131,059 EUR 111,150 Hedging JP Morgan Chase New York 37319/04/2021 USD 1,296,116 GBP 941,525 Hedging JP Morgan Chase New York (2,987)19/04/2021 USD 25,260 SGD 34,024 Hedging JP Morgan Chase New York (60)19/04/2021 USD 24,560 GBP 17,841 Hedging JP Morgan Chase New York (57)19/04/2021 USD 3,867 EUR 3,279 Hedging JP Morgan Chase New York 1119/04/2021 USD 450 CHF 423 Hedging JP Morgan Chase New York 019/04/2021 EUR 16,229 USD 19,118 Hedging JP Morgan Chase New York (37)19/04/2021 CHF 67,691 USD 72,102 Hedging JP Morgan Chase New York (141)19/04/2021 GBP 6,100 USD 8,371 Hedging JP Morgan Chase New York 4619/04/2021 EUR 901 USD 1,062 Hedging JP Morgan Chase New York (2)19/04/2021 USD 1,386 GBP 1,010 Hedging JP Morgan Chase New York (8)19/04/2021 USD 10,534 SGD 14,211 Hedging JP Morgan Chase New York (43)19/04/2021 GBP 1,241 USD 1,704 Hedging JP Morgan Chase New York 919/04/2021 EUR 27,047 USD 31,884 Hedging JP Morgan Chase New York (82)19/04/2021 CHF 15,025 USD 16,009 Hedging JP Morgan Chase New York (37)19/04/2021 GBP 6,020 USD 8,289 Hedging JP Morgan Chase New York 1719/04/2021 EUR 13,958 USD 16,454 Hedging JP Morgan Chase New York (42)19/04/2021 EUR 89,236 USD 105,192 Hedging JP Morgan Chase New York (271)19/04/2021 GBP 763,352 USD 1,051,083 Hedging JP Morgan Chase New York 2,17919/04/2021 SGD 27,256 USD 20,230 Hedging JP Morgan Chase New York 5319/04/2021 GBP 14,478 USD 19,936 Hedging JP Morgan Chase New York 4119/04/2021 EUR 2,632 USD 3,102 Hedging JP Morgan Chase New York (8)19/04/2021 CHF 339 USD 361 Hedging JP Morgan Chase New York (1)19/04/2021 EUR 1,320 USD 1,558 Hedging JP Morgan Chase New York (6)19/04/2021 USD 19,689 GBP 14,274 Hedging JP Morgan Chase New York (7)19/04/2021 GBP 2,430 USD 3,352 Hedging JP Morgan Chase New York 119/04/2021 CHF 264 USD 281 Hedging JP Morgan Chase New York (1)19/04/2021 GBP 410 USD 565 Hedging JP Morgan Chase New York 119/04/2021 EUR 19,083 USD 22,456 Hedging JP Morgan Chase New York (20)19/04/2021 GBP 20 USD 27 Hedging JP Morgan Chase New York 019/04/2021 USD 4,158 SGD 5,610 Hedging JP Morgan Chase New York (17)19/04/2021 GBP 9,783 USD 13,473 Hedging JP Morgan Chase New York 2619/04/2021 USD 38,620 EUR 32,932 Hedging JP Morgan Chase New York (100)19/04/2021 USD 19,488 CHF 18,371 Hedging JP Morgan Chase New York (42)19/04/2021 USD 10,031 GBP 7,295 Hedging JP Morgan Chase New York (35)19/04/2021 USD 20,022 EUR 17,073 Hedging JP Morgan Chase New York (52)19/04/2021 USD 126,538 EUR 107,902 Hedging JP Morgan Chase New York (329)19/04/2021 USD 1,258,688 GBP 915,372 Hedging JP Morgan Chase New York (4,330)19/04/2021 USD 24,191 SGD 32,583 Hedging JP Morgan Chase New York (58)19/04/2021 USD 24,116 GBP 17,539 Hedging JP Morgan Chase New York (83)19/04/2021 USD 3,724 EUR 3,176 Hedging JP Morgan Chase New York (10)19/04/2021 USD 435 CHF 411 Hedging JP Morgan Chase New York (1)19/04/2021 USD 3,108 EUR 2,649 Hedging JP Morgan Chase New York (7)
9 NET UNREALISED GAIN/(LOSS) ON FORWARD CURRENCY EXCHANGE CONTRACTS (continued)
Notes to the Financial Statements(continued)
309
Threadneedle (Lux) Annual Report and Audited Financial Statements March 2021
PortfolioMaturity
DateCurrency
PurchasedAmount
PurchasedCurrency
SoldAmount
Sold Purpose Counterparty
Unrealised gain/(loss)
in the portfolio base currency
Threadneedle (Lux) - Enhanced Commodities (continued) 19/04/2021 USD 6,892 GBP 5,026 Hedging JP Morgan Chase New York (43)
19/04/2021 EUR 3,645 USD 4,276 Hedging JP Morgan Chase New York 1019/04/2021 GBP 394 USD 541 Hedging JP Morgan Chase New York 319/04/2021 USD 54,694 GBP 39,887 Hedging JP Morgan Chase New York (342)
USD (391,161)
*See note 1.
9 NET UNREALISED GAIN/(LOSS) ON FORWARD CURRENCY EXCHANGE CONTRACTS (continued)
Notes to the Financial Statements(continued)
310
Threadneedle (Lux) Annual Report and Audited Financial Statements March 2021
CDS Morgan Stanley ITRAXX Europe Series 34 Sell EUR 30,520,000 20/12/2025 808,111 0.35CDS Morgan Stanley CDX.NA.IG.35 Sell USD 8,730,000 20/12/2025 177,718 0.08CDS Morgan Stanley ITRAXX FINUB 35 Buy EUR 4,340,000 20/06/2026 20,096 0.01CDS Morgan Stanley ITRAXX FINUB 34 Sell EUR 5,100,000 20/12/2025 12,023 0.01
EUR (3,597,437) (1.52)
As at March 31, 2021, Threadneedle (Lux) - Global Dynamic Real Return had the following Credit Default Swaps contracts outstanding:
CDS Morgan Stanley CDX.NA.IG.35 Sell USD 3,890,000 20/12/2025 93,071 0.16CDS Morgan Stanley ITRAXX Europe Crossover
Series 34Sell EUR 3,551,976 20/12/2025 510,482 0.88
CDS Morgan Stanley CDX.NA.IG.35 Buy USD 3,890,000 20/12/2025 (93,071) (0.16)CDS Morgan Stanley CDX.NA.IG.36 Sell USD 3,890,000 20/06/2026 91,042 0.16CDS Morgan Stanley ITRAXX Europe Crossover
Series 34Buy EUR 3,551,976 20/12/2025 (510,482) (0.88)
CDS Morgan Stanley ITRAXX Europe Crossover Series 35
Sell EUR 3,600,000 20/06/2026 501,993 0.87
USD 593,035 1.03
As at March 31, 2021, Threadneedle (Lux) - Global Multi Asset Income had the following Credit Default Swaps contracts outstanding:
CDS Morgan Stanley ITRAXX Europe Crossover Series 34
Sell EUR 750,000 20/12/2025 23,340 0.01
CDS Morgan Stanley ITRAXX Europe Crossover Series 34
Buy EUR 500,000 20/12/2025 (15,560) (0.01)
CDS Morgan Stanley CDX.NA.IG.35 Sell USD 1,000,000 20/12/2025 23,926 0.01CDS Morgan Stanley CDX.NA.IG.35 Buy USD 1,200,000 20/12/2025 (28,711) (0.02)CDS Morgan Stanley ITRAXX Europe Crossover
Series 34Buy EUR 800,000 20/12/2025 (24,896) (0.01)
CDS Morgan Stanley CDX.NA.IG.35 Buy USD 900,000 20/12/2025 (21,533) (0.01)CDS Morgan Stanley CDX.NA.IG.35 Buy USD 1,000,000 20/12/2025 (23,926) (0.01)CDS Morgan Stanley ITRAXX Europe Crossover
Series 34Buy EUR 98,666 20/12/2025 (14,180) (0.01)
CDS Morgan Stanley ITRAXX Europe Crossover Series 34
Sell EUR 98,666 20/12/2025 14,180 0.01
CDS Morgan Stanley ITRAXX Europe Crossover Series 35
Buy EUR 100,000 20/06/2026 (13,944) (0.01)
CDS Morgan Stanley ITRAXX Europe Crossover Series 35
Buy EUR 3,150,000 20/06/2026 (92,531) (0.05)
CDS Morgan Stanley CDX.NA.IG.36 Buy USD 2,100,000 20/06/2026 (49,149) (0.03)CDS Morgan Stanley ITRAXX Europe Crossover
Series 34Sell EUR 3,150,000 20/12/2025 98,027 0.06
CDS Morgan Stanley CDX.NA.IG.35 Sell USD 2,100,000 20/12/2025 50,244 0.03CDS Morgan Stanley ITRAXX Europe Crossover
Series 35Sell EUR 870,000 20/06/2026 25,556 0.01
CDS Morgan Stanley ITRAXX Europe Crossover Series 34
Buy EUR 870,000 20/12/2025 (27,075) (0.02)
CDS Morgan Stanley CDX.NA.IG.36 Sell USD 2,100,000 20/06/2026 49,149 0.03CDS Morgan Stanley ITRAXX Europe Crossover
Series 35Buy EUR 75,000 20/06/2026 (10,458) (0.01)
CDS Citigroup Global Markets
SSE plc Buy EUR 70,000 20/12/2025 (2,213) (0.00)
USD (121,117) (0.07)
10 NET UNREALISED GAIN/(LOSS) ON SWAPS (continued)
Notes to the Financial Statements(continued)
315
Threadneedle (Lux) Annual Report and Audited Financial Statements March 2021
As at March 31, 2021, Threadneedle (Lux) - American Absolute Alpha had the following Total Return Swaps contracts outstanding:
Pay US-1M-LIBOR +0.30% and receive performance of the underlying basket of 4 equities. Pay performance of the underlying basket of 19 equities and receive US-1M-LIBOR.
USD 22,472,826 20/04/2022 (321,194) (0.31)
TRS UBS North America Equity Basket
Pay performance of the underlying basket of 2 equities and receive US-1M-LIBOR.
USD 1,677,982 26/06/2023 (29,840) (0.03)
USD (351,034) (0.34)
As at March 31, 2021, Threadneedle (Lux) - Credit Opportunities had the following Credit Default Swaps contracts outstanding:
Series 34Buy EUR 100,000,000 16/06/2021 96,471 0.01
CDS JPMorgan ITRAXX Europe Crossover Series 34
Buy EUR 100,000,000 16/06/2021 (40,749) (0.00)
CDS JPMorgan Lloyds Banking Group Buy EUR 24,700,000 20/06/2026 (196,636) (0.02)CDS JPMorgan Barclays plc Buy EUR 10,590,000 20/06/2026 12,563 0.00CDS JPMorgan TDC A/s Buy EUR 17,000,000 20/06/2026 555,937 0.05CDS JPMorgan Henkel AG & Co. Buy EUR 17,700,000 20/06/2026 (734,506) (0.07)CDS Morgan Stanley ITRAXX Europe SNR FIN Buy EUR 52,000,000 20/06/2021 (112,618) (0.01)CDS Morgan Stanley ITRAXX Europe SNR FIN Buy EUR 2,900,000 20/06/2021 (6,281) (0.00)CDS Morgan Stanley ITRAXX Europe SNR FIN Buy EUR 500,000 20/06/2021 (1,083) (0.00)CDS Morgan Stanley ITRAXX Europe SNR FIN Buy EUR 900,000 20/06/2021 (1,949) (0.00)CDS Morgan Stanley CDX.NA.IG.35 Buy USD 268,650,000 20/12/2025 (5,468,951) (0.49)CDS Morgan Stanley CDX.NA.IG.35 Sell USD 6,000,000 20/12/2025 122,143 0.01CDS Morgan Stanley ITRAXX Europe Crossover
Series 34Buy EUR 67,586,210 20/12/2025 (8,264,557) (0.75)
CDS Morgan Stanley ITRAXX FINSR 34 Buy EUR 27,000,000 20/12/2025 (597,400) (0.05)CDS Morgan Stanley ITRAXX FINUB 34 Buy EUR 29,520,000 20/12/2025 (69,592) (0.01)CDS Morgan Stanley ITRAXX Europe Crossover
Series 34Buy EUR 140,850,000 20/12/2025 (3,729,437) (0.34)
CDS Morgan Stanley ITRAXX Europe Crossover Series 34
Sell EUR 56,000,000 20/12/2025 1,482,772 0.13
CDS Morgan Stanley ITRAXX Europe Crossover Series 34
Buy EUR 57,000,000 20/12/2025 (1,509,250) (0.14)
CDS Morgan Stanley ITRAXX Europe Crossover Series 34
Sell EUR 14,100,000 20/12/2025 373,341 0.03
10 NET UNREALISED GAIN/(LOSS) ON SWAPS (continued)
Notes to the Financial Statements(continued)
317
Threadneedle (Lux) Annual Report and Audited Financial Statements March 2021
CDS Morgan Stanley ITRAXX Europe Crossover Series 34
Sell EUR 153,573,629 20/12/2025 18,779,246 1.70
CDS Morgan Stanley ITRAXX Europe Crossover Series 35
Buy EUR 97,450,000 20/06/2026 (2,435,630) (0.22)
CDS Morgan Stanley ITRAXX Europe Crossover Series 34
Sell EUR 97,450,000 20/12/2025 2,580,288 0.23
CDS Morgan Stanley CDX.NA.IG.35 Sell USD 262,650,000 20/12/2025 5,346,808 0.48CDS Morgan Stanley CDX.NA.IG.36 Buy USD 262,650,000 20/06/2026 (5,230,222) (0.47)CDS Morgan Stanley ITRAXX FINUB 35 Buy EUR 25,090,000 20/06/2026 116,178 0.01CDS Morgan Stanley ITRAXX FINUB 34 Sell EUR 29,520,000 20/12/2025 69,592 0.01CDS Morgan Stanley ITRAXX FINSR 35 Buy EUR 22,180,000 20/06/2026 (461,590) (0.04)CDS Morgan Stanley ITRAXX FINSR 34 Sell EUR 27,000,000 20/12/2025 597,400 0.05CDS Bank of America
Sanofi SA Buy EUR 1,100,000 20/06/2026 (42,261) (0.08)
CDS JPMorgan Swedbank AB Buy EUR 850,000 20/06/2025 (27,379) (0.05)CDS JPMorgan BP plc Sell EUR 280,000 20/06/2025 6,807 0.01CDS JPMorgan Airbus SE Sell EUR 350,000 20/06/2025 6,122 0.01CDS JPMorgan Bayerische Motoren Werke
AGBuy EUR 600,000 20/12/2025 (17,554) (0.03)
CDS JPMorgan Electricite DE Buy EUR 400,000 20/12/2025 (10,165) (0.02)CDS JPMorgan Altria Group Inc Buy USD 1,000,000 20/12/2025 (22,595) (0.04)CDS JPMorgan Westpac Banking Corp Buy USD 1,700,000 20/12/2025 (52,664) (0.10)CDS JPMorgan Veolia Environment Buy EUR 830,000 20/12/2025 (24,023) (0.05)CDS JPMorgan Lloyds Banking Group Buy EUR 2,600,000 20/06/2026 (20,698) (0.04)CDS JPMorgan Barclays plc Buy EUR 1,090,000 20/06/2026 1,293 0.00CDS JPMorgan Naturgy Energy Group SA Buy EUR 800,000 20/06/2026 (19,513) (0.04)CDS JPMorgan Henkel AG & Co Buy EUR 1,300,000 20/06/2026 (53,947) (0.10)CDS Morgan Stanley ITRAXX Europe Crossover
Series 34Buy EUR 1,835,188 20/12/2025 (224,410) (0.42)
CDS Morgan Stanley ITRAXX Europe Crossover Series 34
Buy EUR 1,035,993 20/12/2025 (126,683) (0.24)
CDS Morgan Stanley CDX.NA.IG.35 Buy USD 10,350,000 20/12/2025 (291,042) (0.55)CDS Morgan Stanley CDX.NA.IG.35 Buy USD 600,000 20/12/2025 16,873 0.03CDS Morgan Stanley ITRAXX FINUB 34 Buy EUR 4,480,000 20/12/2025 (10,561) (0.02)CDS Morgan Stanley ITRAXX Europe Crossover
Series 34Buy EUR 11,220,000 20/12/2025 (297,084) (0.56)
10 NET UNREALISED GAIN/(LOSS) ON SWAPS (continued)
Notes to the Financial Statements(continued)
319
Threadneedle (Lux) Annual Report and Audited Financial Statements March 2021
CDS Morgan Stanley ITRAXX Europe Crossover Series 34
Buy EUR 2,000,000 20/12/2025 (52,956) (0.10)
CDS Morgan Stanley ITRAXX Europe Crossover Series 34
Sell EUR 1,200,000 20/12/2025 31,774 0.06
CDS Morgan Stanley ITRAXX Europe Crossover Series 34
Sell EUR 1,000,000 20/12/2025 26,478 0.05
CDS Morgan Stanley ITRAXX Europe Crossover Series 34
Sell EUR 600,000 20/12/2025 15,887 0.03
CDS Morgan Stanley ITRAXX Europe Crossover Series 34
Sell EUR 400,000 20/12/2025 10,591 0.02
CDS Morgan Stanley ITRAXX Europe Crossover Series 34
Sell EUR 1,900,000 20/12/2025 50,308 0.09
CDS Morgan Stanley ITRAXX Europe Crossover Series 34
Sell EUR 800,000 20/12/2025 21,182 0.04
CDS Morgan Stanley ITRAXX Europe Crossover Series 35
Buy EUR 2,910,000 20/06/2026 (345,255) (0.65)
CDS Morgan Stanley ITRAXX Europe Crossover Series 34
Sell EUR 2,871,181 20/12/2025 351,093 0.66
CDS Morgan Stanley ITRAXX Europe Crossover Series 35
Buy EUR 7,320,000 20/06/2026 (182,953) (0.34)
CDS Morgan Stanley ITRAXX Europe Crossover Series 34
Sell EUR 7,320,000 20/12/2025 193,820 0.36
CDS Morgan Stanley CDX.NA.IG.35 Sell USD 9,750,000 20/12/2025 274,169 0.51CDS Morgan Stanley CDX.NA.IG.36 Buy USD 9,750,000 20/06/2026 (194,155) (0.36)CDS Morgan Stanley ITRAXX FINUB 35 Buy EUR 3,810,000 20/06/2026 17,642 0.03CDS Morgan Stanley ITRAXX FINUB 34 Sell EUR 4,480,000 20/12/2025 10,561 0.02CDS Bank of America
Merrill LynchING Group Buy EUR 1,840,000 20/06/2026 (8,902) (0.02)
CDS Bank of America Merrill Lynch
Lloyds Banking Group Buy EUR 930,000 20/06/2026 (26,200) (0.05)
Pay US-1M-LIBOR +0.30% and receive performance of the underlying basket of 14 equities. Pay performance of the underlying basket of 17 equities and receive US-1M-LIBOR.
USD 37,924,189 20/04/2022 (74,049) (0.07)
TRS UBS North America Equity Basket
Pay performance of the underlying basket of 2 equities and receive US-1M-LIBOR.
USD 1,440,543 26/06/2023 (24,944) (0.02)
USD (98,993) (0.09)
10 NET UNREALISED GAIN/(LOSS) ON SWAPS (continued)
Notes to the Financial Statements(continued)
321
Threadneedle (Lux) Annual Report and Audited Financial Statements March 2021
10 NET UNREALISED GAIN/(LOSS) ON SWAPS (continued)
As at March 31, 2021, Threadneedle (Lux) - Global Extended Alpha had the following Total Return Swaps contracts outstanding:
TRS UBS Equity Basket Pay performance of the underlying equity and receive AUD 1M LIBOR +0.40%.
AUD 3,224,066 24/01/2022 9,942 0.00
TRS UBS Equity Basket Pay 1M CIBOR +0.35% and receive performance of the underlying equiy.
CHF 2,358,287 01/12/2022 172,100 0.08
TRS UBS Equity Basket Pay DKDRA +0.30% and receive performance of the underlying equiy.
DKK 2,657,416 24/01/2022 2,606 0.00
TRS UBS Equity Basket Pay 1M EURIBOR +0.35% and receive performance of the underlying equity. Pay performance of the underlying equity and receive 1M-EONIA.
EUR 2,837,803 24/01/2022 74,237 0.04
TRS UBS Equity Basket Pay GBP 1M LIBOR +0.35% and receive performance of the underlying equity. Pay performance of the underlying basket of 3 equities and receive GBP 1M-LIBOR.
GBP 7,332,571 24/01/2022 (313,030) (0.15)
TRS UBS Equity Basket Pay JPY 1M LIBOR and receive performance of the underlying basket of 2 equities.
HKD 18,346,034 24/01/2022 (97,091) (0.05)
TRS UBS Equity Basket Pay US 1M LIBOR +0.35% and receive performance of the underlying basket of 20 equities. Pay performance of the underlying basket of 21 equities and receive US 1M LIBOR.
USD 102,698,567 24/01/2022 637,963 0.30
USD 486,727 0.22
As at March 31, 2021, Threadneedle (Lux) - Enhanced Commodities had the following Total Return Swaps contracts outstanding:
Options on FuturesCall S&P 500 Index UBS 4,020.000 USD (89) 16/04/2021 35,778,000* (224,013) (0.13)Call DJ Euro Stoxx 50 UBS 3,950.000 EUR (155) 16/04/2021 7,195,774* (47,547) (0.02)Call FTSE 100 Index UBS 6,900.000 GBP (49) 16/04/2021 4,664,766* (10,817) (0.01)
USD (282,377) (0.16)
*The commitment on short call positions is unlimited.
13 POOLING
The SICAV may invest and manage all or any part of the assets established for two or more Portfolios (“Participating Portfolios”) on a pooled basis. Any such asset pool shall be formed by transferring to it cash or other assets (subject to such assets being appropriate in respect of the investment policy of the pool concerned) from each of the Participating Portfolios.
The share of a Participating Portfolio in an asset pool shall be measured by reference to notional units of equal value in the asset pool.
As at March 31, 2021 the SICAV had no pooling of assets, however the Threadneedle (Lux) - Global Dynamic Real Return Portfolio, for investment management purposes, is split by asset class into multiple baskets solely held by itself.
14 CHANGES IN PORTFOLIO STATEMENTS COMPOSITION
Changes in the Portfolio Statements are available to Shareholders upon request and free of charge at the registered office of the SICAV.
15 DILUTION ADJUSTMENT
The Portfolios may suffer reduction of the Net Asset Value per Share due to dealing spreads, transaction costs and tax charges that arise when purchases and sales of underlying investments are undertaken by the Sub-Advisor to accommodate cash inflows and outflows; this is known as “dilution”. A dilution adjustment may be applied to protect the Shareholders of the Portfolios by countering the impact of dilution (the “Dilution Adjustment”). If the net capital activity (including subscriptions, redemptions and conversions into a given Portfolio) on a given Valuation Date exceeds the threshold set by the Management Company from time to time for that Portfolio, the Net Asset Value of the Portfolio may be adjusted upwards or downwards to reflect the net inflows and net outflows respectively.
The Net Asset Value per Share of each Share Class in the Portfolio is calculated separately but any Dilution Adjustment will have an identical effect on the Net Asset Value per Share of each Share Class of the Portfolio. The amount of Dilution Adjustment will be set by the Management Company to reflect the estimated dealing spreads, transaction costs and tax charges that may be incurred by the Portfolio; these costs can vary with market conditions and the portfolio composition. The Dilution Adjustment may therefore be amended from time to time. Such Dilution Adjustments may vary from Portfolio to Portfolio and between daily net inflows and outflows but will not exceed 2% of the original Net Asset Value per Share (with the exception of the Threadneedle (Lux) - STANLIB Africa Equity Portfolio, for which the amount of Dilution Adjustment will not exceed 5% of the original Net Asset Value per Share). A periodic review is undertaken in order to verify the appropriateness of the Dilution Adjustments being applied. In the usual course of business the application of Dilution Adjustment will be triggered mechanically and on a consistent basis, however the Management Company reserves the right to make a discretionary Dilution Adjustment if, in its opinion, it is in the interests of existing Shareholders to do so, including in the event of exceptional circumstances. Such exceptional circumstances include, but are not limited to, periods of elevated market volatility, and periods of depressed market liquidity.
The Dilution Adjustment may be applied across all Portfolios with the exception of the Threadneedle (Lux) - Enhanced Commodities Portfolio.
Estimates of the amount of Dilution Adjustment based on securities held in each Portfolio and market conditions at the time of the Prospectus dated March 2021 as well as the number of occasions on which the Dilution Adjustment is applied is published on the website www.columbiathreadneedle.com.
As at March 31, 2021, the following Dilution Adjustment has been applied:
Portfolio NAV before Dilution Dilution Adjustment NAV after DilutionThreadneedle (Lux) - UK Equity Income 203,529,182 1,180,480 204,709,662
12 OPTIONS AT MARKET VALUE
Notes to the Financial Statements(continued)
329
Threadneedle (Lux) Annual Report and Audited Financial Statements March 2021
16 TRANSACTION COSTS
For the reporting year, the SICAV incurred transaction costs relating to purchase or sale of transferable securities or money market instruments as follows:
Threadneedle (Lux) - Global Corporate Bond1 USD n/a Threadneedle (Lux) - European Corporate Bond1 EUR n/a Threadneedle (Lux) - European High Yield Bond EUR 47,684 Threadneedle (Lux) - European Short-Term High Yield Bond1 EUR n/a Threadneedle (Lux) - European Social Bond1 EUR n/a Threadneedle (Lux) - European Strategic Bond1 EUR n/a Threadneedle (Lux) - Emerging Market Corporate Bonds1 USD n/a Threadneedle (Lux) - Emerging Market Debt1 USD n/a Threadneedle (Lux) - Global Emerging Market Short-Term Bonds1 USD n/a Threadneedle (Lux) - US High Yield Bond1 USD n/a Threadneedle (Lux) - Flexible Asian Bond USD 53,041 Threadneedle (Lux) - Euro Dynamic Real Return1 EUR n/a Threadneedle (Lux) - Global Dynamic Real Return USD 14,298 Threadneedle (Lux) - Global Multi Asset Income USD 178,140 Threadneedle (Lux) - Emerging Market ESG Equities2 USD 8,698 Threadneedle (Lux) - Global Focus USD 1,022,201 Threadneedle (Lux) - Global Emerging Market Equities USD 105,758 Threadneedle (Lux) - Global Equity Income USD 353,492 Threadneedle (Lux) - Global Select USD 233,733 Threadneedle (Lux) - Global Smaller Companies EUR 1,532,953 Threadneedle (Lux) - American USD 295,412 Threadneedle (Lux) - American Select USD 43,573 Threadneedle (Lux) - American Smaller Companies USD 227,110 Threadneedle (Lux) - Asia Contrarian Equity USD 377,906 Threadneedle (Lux) - Asia Equities USD 276,865 Threadneedle (Lux) - US Contrarian Core Equities USD 190,916 Threadneedle (Lux) - US Disciplined Core Equities USD 8,485 Threadneedle (Lux) - Pan European ESG Equities2 EUR 632,913 Threadneedle (Lux) - Pan European Equity Dividend EUR 127,258 Threadneedle (Lux) - Pan European Small Cap Opportunities EUR 953,661 Threadneedle (Lux) - Pan European Smaller Companies EUR 1,452,362 Threadneedle (Lux) - European Select EUR 1,322,711 Threadneedle (Lux) - European Smaller Companies EUR 434,665 Threadneedle (Lux) - Asian Equity Income USD 100,772 Threadneedle (Lux) - Global Technology USD 221,164 Threadneedle (Lux) - UK Equities GBP 520,395 Threadneedle (Lux) - UK Equity Income GBP 249,983 Threadneedle (Lux) - STANLIB Africa Equity USD 24,251 Threadneedle (Lux) - American Absolute Alpha USD 20,714 Threadneedle (Lux) - Credit Opportunities1 EUR n/a Threadneedle (Lux) - Global Investment Grade Credit Opportunities1 EUR n/a Threadneedle (Lux) - Pan European Absolute Alpha EUR 1,112,925 Threadneedle (Lux) - American Extended Alpha USD 18,961 Threadneedle (Lux) - Global Extended Alpha USD 95,074 Threadneedle (Lux) - Enhanced Commodities USD 209 Threadneedle (Lux) - Gatehouse Shariah Global Equity2 USD 6,711
Transaction costs are included in the total cost of investment disclosed in the Portfolio Statements. The amount of transaction costs supported by the SICAV during the reporting year is included in the Statement of Operations and Changes in Net Assets under the heading ‘‘Net realised gain/(loss) on sales of investments’’ and ‘‘Change in net unrealised gain/(loss) on investments’’.1For fixed income securities, transaction costs are not separately identifiable from the purchase price of the security and therefore cannot be disclosed separately.2See note 1.
Notes to the Financial Statements(continued)
330
Threadneedle (Lux) Annual Report and Audited Financial Statements March 2021
17 COLLATERAL INFORMATION
The table below provides the cash collateral balances due from and due to brokers as at March 31, 2021:
Portfolios Counterparty Investment Type CurrencyCash
Collateral
Due from brokers - Collateral paidThreadneedle (Lux) - Global Corporate Bond Citigroup Global
MarketsSwaps USD 110,000
Threadneedle (Lux) - Global Corporate Bond JPM Securities Swaps USD 400,000Threadneedle (Lux) - Global Corporate Bond JPM Chase Forwards and swaps USD 4,410,000Threadneedle (Lux) - European Corporate Bond Barclays Forwards EUR 10,000Threadneedle (Lux) - European High Yield Bond JPM Chase Forwards EUR 10,000Threadneedle (Lux) - European High Yield Bond Barclays Forwards EUR 160,000Threadneedle (Lux) - European Social Bond HSBC Forwards EUR 180,000Threadneedle (Lux) - European Strategic Bond Citigroup Global
MarketsSwaps EUR 10,000
Threadneedle (Lux) - European Strategic Bond Goldman Sachs Swaps EUR 110,000Threadneedle (Lux) - European Strategic Bond JPM Securities Swaps EUR 360,000Threadneedle (Lux) - European Strategic Bond Barclays Forwards and swaps EUR 1,540,000Threadneedle (Lux) - Emerging Market Corporate Bonds JPM Chase Forwards USD 550,000Threadneedle (Lux) - Global Emerging Market Short-Term Bonds JPM Chase Forwards USD 700,000Threadneedle (Lux) - US High Yield Bond JPM Chase Forwards USD 1,670,000Threadneedle (Lux) - Flexible Asian Bond JPM Chase Forwards USD 250,000Threadneedle (Lux) - Euro Dynamic Real Return Barclays Forwards EUR 110,000Threadneedle (Lux) - Global Dynamic Real Return Barclays Swaps USD 220,000Threadneedle (Lux) - Global Dynamic Real Return JPM Chase Forwards USD 260,000Threadneedle (Lux) - Global Multi Asset Income Barclays Forwards and swaps USD 10,000Threadneedle (Lux) - Global Multi Asset Income JPM Securities Swaps USD 20,000Threadneedle (Lux) - Global Multi Asset Income JPM Chase Forwards and swaps USD 1,750,000Threadneedle (Lux) - Global Focus JPM Chase Forwards USD 2,530,000Threadneedle (Lux) - Global Smaller Companies JPM Chase Forwards EUR 20,000Threadneedle (Lux) - American JPM Chase Forwards USD 2,470,000Threadneedle (Lux) - US Contrarian Core Equities JPM Chase Forwards USD 1,840,000Threadneedle (Lux) - Pan European ESG Equities* JPM Chase Forwards EUR 20,000Threadneedle (Lux) - European Smaller Companies JPM Chase Forwards EUR 20,000Threadneedle (Lux) - Global Technology JPM Chase Forwards USD 2,350,000Threadneedle (Lux) - UK Equities JPM Chase Forwards GBP 50,000Threadneedle (Lux) - American Absolute Alpha UBS Forwards and swaps USD 60,000Threadneedle (Lux) - American Absolute Alpha JPM Chase Swaps USD 890,000Threadneedle (Lux) - Credit Opportunities Citigroup Global
MarketsForwards and swaps EUR 550,000
Threadneedle (Lux) - Credit Opportunities Bank of America Merrill Lynch
Threadneedle (Lux) - Global Investment Grade Credit Opportunities JPM Securities Swaps EUR 360,000Threadneedle (Lux) - Pan European Absolute Alpha Goldman Sachs Swaps EUR 200,000Threadneedle (Lux) - Pan European Absolute Alpha UBS Swaps EUR 5,010,000Threadneedle (Lux) - American Extended Alpha UBS Swaps USD 50,000Threadneedle (Lux) - Enhanced Commodities JPM Chase Forwards and swaps USD 4,370,000Threadneedle (Lux) - Enhanced Commodities Macquarie Swaps USD 5,340,000Threadneedle (Lux) - Enhanced Commodities Goldman Sachs Swaps USD 6,300,000Due to brokers - Collateral receivedThreadneedle (Lux) - Global Corporate Bond Barclays Forwards and swaps USD 900,000Threadneedle (Lux) - European Short-Term High Yield Bond JPM Securities Swaps EUR 50,000Threadneedle (Lux) - European Short-Term High Yield Bond JPM Chase Forwards and swaps EUR 620,000
Notes to the Financial Statements(continued)
331
Threadneedle (Lux) Annual Report and Audited Financial Statements March 2021
Portfolios Counterparty Investment Type CurrencyCash
Collateral
Threadneedle (Lux) - European Social Bond JPM Chase Forwards EUR 150,000Threadneedle (Lux) - Global Multi Asset Income UBS Forwards USD 100,000Threadneedle (Lux) - Global Multi Asset Income Lloyds Forwards USD 810,000Threadneedle (Lux) - Pan European Small Cap Opportunities JPM Chase Forwards EUR 290,000Threadneedle (Lux) - Pan European Smaller Companies JPM Chase Forwards EUR 620,000Threadneedle (Lux) - European Select JPM Chase Forwards EUR 410,000Threadneedle (Lux) - American Absolute Alpha Bank of America
Merrill LynchSwaps USD 410,000
Threadneedle (Lux) - Credit Opportunities JPM Chase Forwards and swaps EUR 220,000Threadneedle (Lux) - Global Investment Grade Credit Opportunities JPM Chase Forwards and swaps EUR 340,000Threadneedle (Lux) - Pan European Absolute Alpha JPM Chase Forwards EUR 680,000Threadneedle (Lux) - American Extended Alpha Bank of America
Merrill LynchSwaps USD 290,000
Threadneedle (Lux) - Global Extended Alpha UBS Swaps USD 1,370,000
The table below provides the securities due from brokers as collateral as at March 31, 2021:
Portfolios CounterpartyInvestment Type
Type of collateral
Issuer of collateral Currency
Amount of collateral
Due from brokers - Collateral paidThreadneedle (Lux) - Enhanced Commodities Credit Suisse Swaps Bond US Government USD 1,656,000Threadneedle (Lux) - Enhanced Commodities Citigroup Global
MarketsSwaps Bond US Government USD 1,444,000
*See note 1.
18 CROSS INVESTMENT IN PORTFOLIOS
As at March 31, 2021, the Threadneedle (Lux) - Euro Dynamic Real Return Portfolio invests in shares of the following Portfolios:
Cross Investment Portfolio Currency Market Value
% of Net Assets in Base Currency of the Cross
Investment PortfolioThreadneedle (Lux) - Asia Contrarian Equity EUR 68,948 0.04 Threadneedle (Lux) - Enhanced Commodities EUR 1,577,112 0.35 Threadneedle (Lux) - European Corporate Bond EUR 3,072,677 1.94 Threadneedle (Lux) - European High Yield Bond EUR 2,169,440 0.36 Threadneedle (Lux) - European Short-Term High Yield Bond EUR 2,607,552 2.97 Threadneedle (Lux) - Global Emerging Market Short-Term Bonds EUR 724,344 0.74 Threadneedle (Lux) - Global Focus EUR 2,287,324 0.16 Threadneedle (Lux) - Global Investment Grade Credit Opportunities EUR 3,293,708 6.17 Threadneedle (Lux) - Pan European Smaller Companies EUR 1,158,015 0.06
As at March 31, 2021, the Threadneedle (Lux) - Global Dynamic Real Return Portfolio invests in shares of the following Portfolios:
Cross Investment Portfolio Currency Market Value
% of Net Assets in Base Currency of the Cross
Investment PortfolioThreadneedle (Lux) - Enhanced Commodities USD 2,958,707 0.56 Threadneedle (Lux) - European Short-Term High Yield Bond USD 1,051,179 1.02 Threadneedle (Lux) - Global Emerging Market Short-Term Bonds USD 649,610 0.56 Threadneedle (Lux) - Global Investment Grade Credit Opportunities USD 29,577 0.05
As at March 31, 2021, the Threadneedle (Lux) - Global Multi Asset Income Portfolio invests in shares of the following Portfolios:
Cross Investment Portfolio Currency Market Value
% of Net Assets in Base Currency of the Cross
Investment PortfolioThreadneedle (Lux) - Asian Equity Income USD 6,415,103 12.14 Threadneedle (Lux) - Global Emerging Market Short-Term Bonds USD 5,700,785 4.93
The impact of the cross investment transactions has been eliminated from the aggregated Statement of Net Assets and the Statement of Changes in Net Assets.
Please also refer to note 2 xi) on asset management fee rebates.
17 COLLATERAL INFORMATION (continued)
Notes to the Financial Statements(continued)
332
Threadneedle (Lux) Annual Report and Audited Financial Statements March 2021
19 TERM DEPOSITS
The table below provides the term deposits amounts held by the SICAV as at March 31, 2021:
Portfolios Counterparty Currency
Term Deposit Amount (in the portfolio base
currency)
Threadneedle (Lux) - Flexible Asian BondBNP Paribas Paris USD 1,300,242 Mitsubishi UFJ Securities USD 1,500,060 Total USD 2,800,302
Threadneedle (Lux) - Euro Dynamic Real ReturnSumitomo Bank Ltd London EUR 995,665 BNP Paribas Paris EUR 797,484 Total EUR 1,793,149
Threadneedle (Lux) - Global Dynamic Real ReturnRabobank Nederland Utrecht USD 500,001 Mitsubishi UFJ Securities USD 500,002 Total USD 1,000,003
Threadneedle (Lux) - American Select Sumitomo Bank Ltd London USD 6,000,020 Total USD 6,000,020
Threadneedle (Lux) - American Absolute AlphaBNP Paribas Paris USD 2,000,000 National Bank of Abu Dhabi USD 6,000,089 BNP Paribas Paris USD 4,000,420 Total USD 12,000,509
Threadneedle (Lux) - Credit Opportunities Sumitomo Bank Ltd London EUR 14,998,813 Total EUR 14,998,813
20 OTHER ASSETS/LIABILITIES
Other assets/liabilities include any fair value adjustment applied when certain markets were closed at year-end to avoid market timing, based on the fund level pricing procedure in place.
Notes to the Financial Statements(continued)
333
Threadneedle (Lux) Annual Report and Audited Financial Statements March 2021
21 TOTAL EXPENSE RATIO (TER)
The Total Expense Ratio is calculated following the Swiss Funds & Asset Management Association (SFAMA) guideline.The formula applied is the following:The TER expresses the sum of all costs and commissions charged on an ongoing basis to each class of shares (Operating Expenses) taken retrospectively as a percentage of their net assets, and is calculated using the following formula:
TER % =Total Operating Expenses
x 100Average net assets
Where a fund invests more than 10% in other collective investment schemes (target funds), the calculation includes the fund’s share of the expenses of the target funds less any rebates received.
The Total Expense Ratios for the year ended March 31, 2021 are as follows:
Portfolio Class TER/TER1 CommentsThreadneedle (Lux) - Global Corporate Bond AEC 0.85%
AEH 0.85%AKH 0.85%ANH 0.85%AU 0.85%AUP 0.85%DEC 1.60%DEH 1.60%DU 1.60%DUP 1.60%IEC 0.65%IEH 0.65%IEP 0.65%IGC 0.65%IGH 0.65%IKH 0.65%INH 0.65%IU 0.65%IUP 0.65%NEC 0.45%NEH 0.45%NGC 0.45%NGH 0.45%NU 0.45%NUP 0.45%XEH 0.15%XFH 0.05% The current TER differs from the full year expected TER
due to the small size and the recent launch of the class.XGH 0.15%XU 0.06% The current TER differs from the full year expected TER
due to the small size and the recent launch of the class.ZEH 0.60%ZFH 0.60%ZGH 0.60%ZU 0.60%
Threadneedle (Lux) - European Corporate Bond AE 1.20%ANH 1.20%IE 0.60%INH 0.66% The current TER differs from the full year expected TER due to
the small size of the class.XE 0.06% The current TER differs from the full year expected TER due to
the small size and the recent launch of the class.XFH 0.06% The current TER differs from the full year expected TER due to
the small size and the recent launch of the class.XGH 0.05% The current TER differs from the full year expected TER due to
the small size and the recent launch of the class.XUH 0.06% The current TER differs from the full year expected TER due to
the small size and the recent launch of the class.ZE 0.70%
Notes to the Financial Statements(continued)
334
Threadneedle (Lux) Annual Report and Audited Financial Statements March 2021
Portfolio Class TER/TER1 CommentsThreadneedle (Lux) - European Corporate Bond (continued)
Threadneedle (Lux) - European High Yield Bond AE 1.62% The current TER differs from the full year expected TER due to the small size of the class.
AKH 1.55%ANH 1.55%IE 0.85%IEP 0.85%IKH 0.98% The current TER differs from the full year expected TER due to
the small size of the class.INH 0.95% The current TER differs from the full year expected TER due to
the small size of the class.XE 0.15%ZE 0.90%ZEP 0.90%1E 1.38%1EP 1.38%1G 1.38%1GP 1.38%1UT 1.38%2E 0.82%2EP 0.82%2FH 0.82%2G 0.82%2GP 0.74% The current TER differs from the full year expected TER due to
the small size of the class.3E 0.77%3EP 0.77%3FC 0.77%3FH 0.77%3G 0.77%3GP 0.77%4E 0.07%4G 0.07%8E 0.86%8EP 0.86%8FH 0.86%8G 0.86%8GP 0.86%9E 0.73%9EP 0.73%9FC 0.73%9FH 0.73%9G 0.66% The current TER differs from the full year expected TER due to
the small size of the class.9GP 0.68% The current TER differs from the full year expected TER due to
the small size of the class.
21 TOTAL EXPENSE RATIO (TER) (continued)
Notes to the Financial Statements(continued)
335
Threadneedle (Lux) Annual Report and Audited Financial Statements March 2021
Portfolio Class TER/TER1 Comments
Threadneedle (Lux) - European Short-Term High Yield Bond
AE 0.90%
AEP 0.90%AKH 0.81% The current TER differs from the full year expected TER due to
the small size of the class.ANH 0.82% The current TER differs from the full year expected TER due to
the small size of the class.IE 0.50%IEP 0.43% The current TER differs from the full year expected TER due to
the small size of the class.IGC 0.50%IGH 0.41% The current TER differs from the full year expected TER due to
the small size of the class.IKH 0.44% The current TER differs from the full year expected TER due to
the small size of the class.INH 0.44% The current TER differs from the full year expected TER due to
the small size of the class.XE 0.10%XGC 0.10%XGH 0.10%ZE 0.55%
Threadneedle (Lux) - European Social Bond AE 0.55%AEP 0.55%AFH 0.47% The current TER differs from the full year expected TER
due to the small size and the recent launch of the class.AKH 0.43% The current TER differs from the full year expected TER
due to the small size and the recent launch of the class.ANH 0.44% The current TER differs from the full year expected TER
due to the small size and the recent launch of the class.ASC 0.60% The current TER differs from the full year expected TER
due to the small size and the recent launch of the class.ASH 0.60% The current TER differs from the full year expected TER
due to the small size and the recent launch of the class.AUC 0.50% The current TER differs from the full year expected TER
due to the small size and the recent launch of the class.AUH 0.55%ID 0.40%IE 0.40%IEP 0.40%IFH 0.45% The current TER differs from the full year expected TER
due to the reduction of fees applied to this share class on September 1, 2020 and to the small size of the class.
IGH 0.40%IKH 0.40%INH 0.40%ISC 0.58% The current TER differs from the full year expected TER
due to the small size and the recent launch of the class.ISH 0.60% The current TER differs from the full year expected TER
due to the small size and the recent launch of the class.IUC 0.40%IUH 0.40%LE 0.40%NEP 0.40%ZD 0.45%ZE 0.45%
21 TOTAL EXPENSE RATIO (TER) (continued)
336
Threadneedle (Lux) Annual Report and Audited Financial Statements March 2021
Portfolio Class TER/TER1 CommentsThreadneedle (Lux) - European Social Bond (continued)
ZEP 0.45%
ZFH 0.45%ZGC 0.45%ZGH 0.45%ZUH 0.45%
Threadneedle (Lux) - European Strategic Bond AE 1.15%AEP 1.15%AKH 1.15%ANH 1.15%AUH 1.15%DE 1.70%DEP 1.70%DUH 1.81% The current TER differs from the full year expected TER due to
the small size of the class.IE 0.55%INH 0.43% The current TER differs from the full year expected TER due to
the small size of the class.Threadneedle (Lux) - Emerging Market Corporate Bonds
AEC 1.65%
AEH 1.65%AKH 1.65%ANH 1.65%ASH 1.65%AU 1.65%AUP 1.65%DEC 1.75%DEH 1.75%DU 1.75%IEC 0.85%IEH 0.85%IU 0.85%W 1.30%WEH 1.30%XUP 0.05% The current TER differs from the full year expected TER due to
the small size of the class.Threadneedle (Lux) - Emerging Market Debt AEC 1.65%
AEH 1.65%AKH 1.65%ANH 1.65%ASH 1.65%AU 1.65%AUP 1.65%DEH 1.75%DU 1.75%IEH 0.85%IU 0.95% The current TER differs from the full year expected TER due to
the small size of the class.SU 1.80%SUP 1.80%W 1.30%XUP 0.05% The current TER differs from the full year expected TER due to
the small size of the class.ZU 0.90%
21 TOTAL EXPENSE RATIO (TER) (continued)
Notes to the Financial Statements(continued)
Notes to the Financial Statements(continued)
337
Threadneedle (Lux) Annual Report and Audited Financial Statements March 2021
Portfolio Class TER/TER1 Comments
Threadneedle (Lux) - Global Emerging Market Short-Term Bonds
Threadneedle (Lux) - US High Yield Bond AEC 1.55%AEH 1.55%AKH 1.55%ANH 1.55%ASH 1.55%AU 1.55%AUP 1.55%DEC 1.75%DEH 1.75%DU 1.75%IEC 0.65%IEH 0.65%IKH 0.65%INH 0.65%IU 0.65%TEH 0.65%XUP 0.05% The current TER differs from the full year expected TER due to
the small size of the class.ZFH 0.90%ZGH 0.90%ZU 0.90%
Threadneedle (Lux) - Flexible Asian Bond AEH 1.31% The current TER differs from the full year expected TER due to the reduction of fees applied to this share class on October 1, 2020.
AKH 1.36% The current TER differs from the full year expected TER due to the reduction of fees applied to this share class on October 1, 2020 and to the small size of the class.
AS 1.55% The current TER differs from the full year expected TER due to the reduction of fees applied to this share class on October 1, 2020.
ASC 1.37% The current TER differs from the full year expected TER due to the reduction of fees applied to this share class on October 1, 2020.
ASH 1.36% The current TER differs from the full year expected TER due to the reduction of fees applied to this share class on October 1, 2020.
AU 1.33% The current TER differs from the full year expected TER due to the reduction of fees applied to this share class on October 1, 2020.
AUP 1.15%
21 TOTAL EXPENSE RATIO (TER) (continued)
Notes to the Financial Statements(continued)
338
Threadneedle (Lux) Annual Report and Audited Financial Statements March 2021
Portfolio Class TER/TER1 CommentsThreadneedle (Lux) - Flexible Asian Bond (continued)
AVC 1.46% The current TER differs from the full year expected TER due to the reduction of fees applied to this share class on October 1, 2020 and to the small size of the class.
AVH 1.42% The current TER differs from the full year expected TER due to the reduction of fees applied to this share class on October 1, 2020 and to the small size of the class.
DEH 1.56% The current TER differs from the full year expected TER due to the reduction of fees applied to this share class on October 1, 2020.
IEH 0.65% The current TER differs from the full year expected TER due to the reduction of fees applied to this share class on October 1, 2020.
IGH 0.67% The current TER differs from the full year expected TER due to the reduction of fees applied to this share class on October 1, 2020 and to the small size of the class.
ISH 0.66% The current TER differs from the full year expected TER due to the reduction of fees applied to this share class on October 1, 2020 and to the small size of the class.
IU 0.55%XU 0.15%ZU 0.65%
ZUP 0.81% The current TER differs from the full year expected TER due to the reduction of fees applied to this share class on October 1, 2020 and to the small size of the class.
Threadneedle (Lux) - Euro Dynamic Real Return AE 1.63% The Swiss TER includes the synthetic cost of holding underlying investments which during the period under review equates to 8bp’s annualised.
AEP 1.68% The Swiss TER includes the synthetic cost of holding underlying investments which during the period under review equates to 8bp’s annualised.
DE 2.38% The Swiss TER includes the synthetic cost of holding underlying investments which during the period under review equates to 8bp’s annualised.
IE 0.93% The Swiss TER includes the synthetic cost of holding underlying investments which during the period under review equates to 8bp’s annualised.
IEP 0.93% The Swiss TER includes the synthetic cost of holding underlying investments which during the period under review equates to 8bp’s annualised.
LE 0.78% The Swiss TER includes the synthetic cost of holding underlying investments which during the period under review equates to 8bp’s annualised.
LEP 0.78% The Swiss TER includes the synthetic cost of holding underlying investments which during the period under review equates to 8bp’s annualised.
ZE 1.13% The Swiss TER includes the synthetic cost of holding underlying investments which during the period under review equates to 8bp’s annualised.
ZEP 1.13% The Swiss TER includes the synthetic cost of holding underlying investments which during the period under review equates to 8bp’s annualised.
Threadneedle (Lux) - Global Dynamic Real Return
AEC 1.65%
AEH 1.65%AKH 1.65%AU 1.65%AUP 1.65%
21 TOTAL EXPENSE RATIO (TER) (continued)
Notes to the Financial Statements(continued)
339
Threadneedle (Lux) Annual Report and Audited Financial Statements March 2021
Portfolio Class TER/TER1 Comments
Threadneedle (Lux) - Global Dynamic Real Return (continued)
DEH 2.30%
DU 2.30%IEH 1.02%IGH 0.95%IU 0.95%W 1.75%
Threadneedle (Lux) - Global Multi Asset Income
AE 1.55%
AEC 1.55%AEH 1.55%AEP 1.55%AS 1.68% The current TER differs from the full year expected TER due to
the small size of the class.ASC 1.55%ASH 1.55%ASP 1.55%AU 1.55%AUM 1.55%AUP 1.55%DEC 2.30%DEH 2.30%DEP 2.30%DU 2.30%DUP 2.30%ZE 1.05%ZEC 1.05%ZEH 1.05%ZFH 1.05%ZU 1.05%ZUP 1.13% The current TER differs from the full year expected TER due to
the small size of the class.Threadneedle (Lux) - Emerging Market ESG Equities*
AE 1.80%
AEC 1.75% The current TER differs from the full year expected TER due to the small size of the class.
AEH 1.80%AU 1.80%AUP 1.80%IE 0.85% The current TER differs from the full year expected TER due to
the small size of the class.IEH 0.85% The current TER differs from the full year expected TER due to
the small size of the class.IG 0.80%IU 0.80%LE 0.50%LG 0.55% The current TER differs from the full year expected TER due to
the small size of the class.XU 0.15%ZE 1.05%ZEC 1.05%ZEH 1.05%ZU 1.05%ZUP 1.05%
Threadneedle (Lux) - Global Focus AEH 1.80%AEP 1.80%
21 TOTAL EXPENSE RATIO (TER) (continued)
Notes to the Financial Statements(continued)
340
Threadneedle (Lux) Annual Report and Audited Financial Statements March 2021
Threadneedle (Lux) - American AEH 1.80%AU 1.80%DEH 2.15%DU 2.15%IEH 0.90%IU 0.90%W 1.50%ZE 1.05% The current TER differs from the full year expected TER
due to the big variation of the average NAV.ZEH 1.00%ZU 1.00%1E 1.67%
21 TOTAL EXPENSE RATIO (TER) (continued)
Notes to the Financial Statements(continued)
342
Threadneedle (Lux) Annual Report and Audited Financial Statements March 2021
Portfolio Class TER/TER1 Comments
Threadneedle (Lux) - American (continued) 1EH 1.67%
1EP 1.67%1U 1.67%2E 1.06%2U 1.06%3EH 0.88%3U 0.88%8E 1.10%8U 1.10%9EH 0.92% The current TER differs from the full year expected TER
due to the big variation of the average NAV.9U 0.84%
AEH 1.70% The current TER differs from the full year expected TER due to the big variation of the average NAV.
AU 1.72% The current TER differs from the full year expected TER due to the big variation of the average NAV.
DEH 2.30%DU 2.24% The current TER differs from the full year expected TER
due to the big variation of the average NAV.IE 0.89% The current TER differs from the full year expected TER
due to the big variation of the average NAV.IU 0.95%ZU 1.05%1E 1.68%1EP 1.68%1U 1.68%2U 1.07%3EH 0.88% The current TER differs from the full year expected TER
due to the big variation of the average NAV.
21 TOTAL EXPENSE RATIO (TER) (continued)
Notes to the Financial Statements(continued)
343
Threadneedle (Lux) Annual Report and Audited Financial Statements March 2021
Portfolio Class TER/TER1 Comments
Threadneedle (Lux) - American Smaller Companies (continued)
3U 0.93%
8U 1.11%9EH 0.89%9U 0.89%
Threadneedle (Lux) - Asia Contrarian Equity AE 1.80%AF 1.80%AS 1.80%ASH 1.80%AU 1.80%DE 2.49% The current TER differs from the full year expected TER
due to the big variation of the average NAV.IF 0.95%ISH 0.95%IU 0.95%XU 0.15%XUP 0.15%ZE 1.05%ZEH 1.05%ZF 1.05%ZG 1.05%ZU 1.05%
Threadneedle (Lux) - Asia Equities IE 0.95%IU 0.95%ZU 0.98% The current TER differs from the full year expected TER
due to the big variation of the average NAV and to the small size of the class.
1E 1.70%1U 1.70%2E 1.09%2U 1.09%3U 0.95%8E 1.13%8U 1.13%9U 0.91%
Threadneedle (Lux) Annual Report and Audited Financial Statements March 2021
Portfolio Class TER/TER1 Comments
Threadneedle (Lux) - US Disciplined Core Equities (continued)
DU 0.90%
IE 0.35%IEC 0.35%IEH 0.35%IFH 0.35%IG 0.29% The current TER differs from the full year expected TER due to
the small size of the class.IU 0.35%NE 0.08% The current TER differs from the full year expected TER due to
the small size of the class.NG 0.20%NU 0.14% The current TER differs from the full year expected TER due to
the small size of the class.XG 0.10%ZEH 0.45%ZFH 0.45%ZU 0.45%
Threadneedle (Lux) - Pan European ESG Equities*
AE 1.66% The current TER differs from the full year expected TER due to the reduction of fees applied to this share class on October 2, 2020.
ASH 1.66% The current TER differs from the full year expected TER due to the reduction of fees applied to this share class on October 2, 2020.
AUH 1.74% The current TER differs from the full year expected TER due to the reduction of fees applied to this share class on October 2, 2020.
DE 1.93% The current TER differs from the full year expected TER due to the reduction of fees applied to this share class on October 2, 2020.
IE 0.80%W 1.75%XE 0.15%ZUH 1.00%1E 1.62% The current TER differs from the full year expected TER
due to the reduction of fees applied to this share class on October 2, 2020.
1EP 1.66% The current TER differs from the full year expected TER due to the reduction of fees applied to this share class on October 2, 2020 and to the small size of the class.
1G 1.62% The current TER differs from the full year expected TER due to the reduction of fees applied to this share class on October 2, 2020.
1GP 1.66% The current TER differs from the full year expected TER due to the reduction of fees applied to this share class on October 2, 2020 and to the small size of the class.
Threadneedle (Lux) Annual Report and Audited Financial Statements March 2021
Portfolio Class TER/TER1 Comments
Threadneedle (Lux) - Pan European ESG Equities* (continued)
8U 1.05% The current TER differs from the full year expected TER due to the small size of the class.
9E 0.81% The current TER differs from the full year expected TER due to the small size of the class.
9G 0.90%9GP 0.90%
Threadneedle (Lux) - Pan European Equity Dividend
AE 1.80%
AEP 1.80%AUP 1.85% The current TER differs from the full year expected TER due to
the small size of the class.DE 2.15%DEP 2.15%IE 0.95%IEP 0.95%ZE 1.05%ZEP 1.05%1E 1.70%1EP 1.70%1G 1.70%1GP 1.70%2E 1.09%2EP 1.09%2G 1.04% The current TER differs from the full year expected TER due to
the small size of the class.2GP 1.04% The current TER differs from the full year expected TER due to
the small size of the class.3EP 0.95%3G 0.95%3GP 0.95%4GP 0.09%8E 1.13%8EP 1.13%8G 1.13%8GP 1.13%9EP 0.91%9G 0.91%9GP 0.91%
Threadneedle (Lux) - Pan European Small Cap Opportunities
AE 1.85%
ASH 1.85%AUH 1.79% The current TER differs from the full year expected TER
due to the big variation of the average NAV.DE 2.75%DUH 2.75%IE 1.10%W 1.90%ZE 1.10%ZFH 1.10%
Threadneedle (Lux) - Pan European Smaller Companies
IE 0.95%
ZE 1.10%1E 1.72%1EP 1.72%1FH 1.72%1G 1.72%
21 TOTAL EXPENSE RATIO (TER) (continued)
Notes to the Financial Statements(continued)
346
Threadneedle (Lux) Annual Report and Audited Financial Statements March 2021
Portfolio Class TER/TER1 Comments
Threadneedle (Lux) - Pan European Smaller Companies (continued)
1UH 1.72%
2E 1.07%2G 1.07%3E 0.91%3EP 0.91%3FH 0.91%3G 0.91%3GP 0.91%3UH 0.91%4E 0.07%4G 0.07%8E 1.11%8G 1.11%9E 0.87%9EP 0.79% The current TER differs from the full year expected TER due to
the small size of the class.9FH 0.87%9G 0.87%9GP 0.79% The current TER differs from the full year expected TER due to
the small size of the class.9UH 0.87%
Threadneedle (Lux) - European Select AE 1.80%AGH 1.80%AUH 1.80%DUH 2.35%IE 0.95%ZG 1.05%ZGH 1.05%1E 1.65%1EP 1.65%1SH 1.65%1U 1.65%1UH 1.65%2E 1.06%2EP 1.06%3E 0.88%3U 0.88%8E 1.10%8EP 1.10%9E 0.84%9U 0.76% The current TER differs from the full year expected TER due to
the small size of the class.Threadneedle (Lux) - European Smaller Companies
Threadneedle (Lux) Annual Report and Audited Financial Statements March 2021
Portfolio Class TER/TER1 Comments
Threadneedle (Lux) - European Smaller Companies (continued)
9EP 0.89%
9FH 0.89%Threadneedle (Lux) - Asian Equity Income AEH 1.80%
AU 1.80%AUP 1.80%DEH 2.55%DU 2.55%DUP 2.49% The current TER differs from the full year expected TER
due to the big variation of the average NAV.IEP 0.95%IU 0.95%W 2.00%XU 0.15%XUP 0.15%ZG 1.05%ZGH 1.05%ZGP 1.05%ZUP 1.12% The current TER differs from the full year expected TER
due to the big variation of the average NAV.Threadneedle (Lux) - Global Technology AEH 1.95%
AS 1.95%AU 1.95%AUP 1.95%BU 2.35%DEH 2.30%DU 2.30%IE 1.05%IEH 1.05%IG 0.95% The current TER differs from the full year expected TER
due to the big variation of the average NAV.IU 1.05%ZEH 1.15%ZFH 1.15%ZG 1.15%ZU 1.15%
Threadneedle (Lux) - UK Equities AE 1.80%AEH 1.80%AFH 1.80%AG 1.80%AGP 1.80%DEH 2.60%DG 2.60%IE 0.85%IEH 0.85%IG 0.85%IGP 0.85%NEH 0.68%NFH 0.73% The current TER differs from the full year expected TER
due to the recent launch of the class.NG 0.68%NGP 0.68%NUH 0.55% The current TER differs from the full year expected TER
due to the small size and the recent launch of the class.TEH 0.72%TFH 0.72%
21 TOTAL EXPENSE RATIO (TER) (continued)
Notes to the Financial Statements(continued)
348
Threadneedle (Lux) Annual Report and Audited Financial Statements March 2021
Portfolio Class TER/TER1 CommentsThreadneedle (Lux) - UK Equities (continued) TG 0.66% The current TER differs from the full year expected TER
due to the small size and the recent launch of the class.TGP 0.66% The current TER differs from the full year expected TER
due to the small size and the recent launch of the class.TUH 0.56% The current TER differs from the full year expected TER
due to the small size and the recent launch of the class.ZE 1.05%ZEH 1.05%ZFH 1.05%ZG 1.05%ZGP 1.05%ZUH 0.88% The current TER differs from the full year expected TER
due to the big variation of the average NAV and the recent relaunch of the class.
Threadneedle (Lux) - UK Equity Income AE 1.80%AEC 1.74% The current TER differs from the full year expected TER
due to the big variation of the average NAV.AEH 1.80%AG 1.80%ASC 1.80%AUC 1.68% The current TER differs from the full year expected TER
due to the big variation of the average NAV.DE 2.55%DEC 2.60% The current TER differs from the full year expected TER due to
the small size of the class.DEH 2.55%DG 2.55%DGP 2.55%IE 0.85%IEH 0.85%IG 0.85%IGP 0.85%IU 0.85%IUH 0.65% The current TER differs from the full year expected TER due to
the small size of the class.LG 0.70%LGP 0.70%ZE 1.05%ZEH 1.05%ZFH 1.05%ZG 1.05%ZGP 1.05%ZUH 1.05%1EH 1.64%1FH 1.64%1UH 1.64%3EH 0.88%3FH 0.88%3UH 0.88%
21 TOTAL EXPENSE RATIO (TER) (continued)
Notes to the Financial Statements(continued)
349
Threadneedle (Lux) Annual Report and Audited Financial Statements March 2021
Portfolio Class TER/TER1 CommentsThreadneedle (Lux) - UK Equity Income (continued)
9EH 0.84%
9FH 0.84%9G 0.84%9UH 0.89% The current TER differs from the full year expected TER due to
the small size of the class.Threadneedle (Lux) - STANLIB Africa Equity IU 1.60%
ZU 1.60%Threadneedle (Lux) - American Absolute Alpha AEH 1.80%
AFH 1.80%AGH 1.80%AU 1.80%DEH 2.30%DU 2.30%IEH 0.95%IGH 0.95%IU 0.95%XGH 0.15%ZE 0.98% The current TER differs from the full year expected TER due to
the small size of the class.ZEH 1.05%ZGH 1.05%ZU 1.05%
Threadneedle (Lux) - Credit Opportunities ZE 0.80%1E 1.17%1EP 1.17%1GH 1.17%1UH 1.17%2E 0.56%2EP 0.45% The current TER differs from the full year expected TER due to
the small size of the class.2GC 0.49% The current TER differs from the full year expected TER due to
the small size of the class.2GH 0.56%4GH 0.06%8E 0.60%8EP 0.60%8GC 0.60%8GH 0.60%
Threadneedle (Lux) - Global Investment Grade Credit Opportunities
AE 1.20%
AFH 1.11% The current TER differs from the full year expected TER due to the small size of the class.
AKH 1.20%ANH 1.20%AUH 1.20%DE 1.75%IE 0.55%IEP 0.70% The current TER differs from the full year expected TER due to
the small size of the class.IGH 0.63% The current TER differs from the full year expected TER due to
the small size of the class.INH 0.66% The current TER differs from the full year expected TER due to
the small size of the class.IU 0.55%IUH 0.60% The current TER differs from the full year expected TER
due to the big variation of the average NAV.JE 0.60%/0.69% The current TER differs from the full year expected TER due to
the small size of the class.JGH 0.45%/0.60%
21 TOTAL EXPENSE RATIO (TER) (continued)
Notes to the Financial Statements(continued)
350
Threadneedle (Lux) Annual Report and Audited Financial Statements March 2021
21 TOTAL EXPENSE RATIO (TER) (continued)
Portfolio Class TER/TER1 CommentsThreadneedle (Lux) - Global Investment Grade Credit Opportunities (continued)
JUH 0.55%/0.73% The current TER differs from the full year expected TER due to the small size of the class.
LE 0.40%LEP 0.40%LGH 0.40%XE 0.15%XGH 0.15%XUH 0.15%YE 0.66%/0.75% The current TER differs from the full year expected TER due to
the small size of the class.YGH 0.60%/0.78%YUH 0.72%/0.88% The current TER differs from the full year expected TER due to
the small size of the class.ZE 0.70%ZFH 0.70%ZGH 0.70%ZUH 0.70%
Threadneedle (Lux) Annual Report and Audited Financial Statements March 2021
Portfolio Class TER/TER1 CommentsThreadneedle (Lux) - Enhanced Commodities (continued)
AGH 2.05%
ASH 2.05%AU 2.05%DEH 2.55%DU 2.55%IEH 1.00%IG 1.06% The current TER differs from the full year expected TER due to
the small size of the class.IGH 1.00%IU 1.00%NG 0.65%XU 0.15%ZEH 1.05%ZFH 1.05%ZGH 1.05%ZU 1.05%
1The TER is inclusive of performance fee.*See note 1.
22 SUBSEQUENT EVENT
With effect from May 21, 2021 the Threadneedle (Lux) - STANLIB Africa Equity Portfolio was put into liquidation.
23 OTHER INFORMATION
The coronavirus disease 2019 (COVID-19) public health crisis has become a pandemic that has resulted in, and may continue to result in, significant global economic and societal disruption and market volatility due to disruptions in market access, resource availability, facilities operations, imposition of tariffs, export controls and supply chain disruption, among others. Such disruptions may be caused, or exacerbated by, quarantines and travel restrictions, workforce displacement and loss in human and other resources. The uncertainty surrounding the magnitude, duration, reach, costs and effects of the global pandemic, as well as actions that have been or could be taken by governmental authorities or other third parties, present unknowns that are yet to unfold. The impacts, as well as the uncertainty over impacts to come, of COVID-19 - and any other infectious illness outbreaks, epidemics and pandemics that may arise in the future - could negatively affect global economies and markets in ways that cannot necessarily be foreseen. In addition, the impact of infectious illness outbreaks and epidemics in emerging market countries may be greater due to generally less established healthcare systems, governments and financial markets. Public health crises caused by the COVID-19 outbreak may exacerbate other pre-existing political, social and economic risks in certain countries or globally. The disruptions caused by COVID-19 could prevent the funds from executing advantageous investment decisions in a timely manner and negatively impact the funds’ ability to achieve their investment objectives. Any such event(s) could have a significant adverse impact on the value and risk profile of the funds.
21 TOTAL EXPENSE RATIO (TER) (continued)
Global Risk Exposure (unaudited)
352
Threadneedle (Lux) Annual Report and Audited Financial Statements March 2021
Global Exposure and LeverageThe UCITS global exposure is managed under a commitment approach, an absolute Value at Risk (absolute VaR) approach or a relative Value at Risk (relative VaR) approach. The global market risk exposure information for the year ended March 31, 2021 is as follows:
Commitment approach In order to monitor and measure the global exposure, all the portfolios which are not under in the VaR approach use the commitment approach. The global exposure of the sub-funds is calculated based on the commitment approach in accordance with the methodology described in the ESMA’s guidelines 10-788. Using the period April 2020 - March 2021:
1-year RollingSub Funds Using VaR Basis
Calculation Method*
VaR Model*
Reference Portfolio
VaR Internal Guidelines (%)
VaR Legal and Contractual Limit (%)
Lowest Utilisation of VaR Limit
Highest Utilisation of VaR Limit
Average Utilisation of VaR Limit
Average Commitment Exposure
Average Sum of notionals
Threadneedle (Lux) - Global Corporate Bond
Relative VaR Covariance Bloomberg Barclays Global Aggregate Corporates Index Hedged to USD
1.5 x bmk VaR
2.0 x bmk VaR
62.26% 118.12% 108.44% 56.14% 113.91%
Threadneedle (Lux) - European Short-Term High Yield Bond
Relative VaR Covariance ICE BofA Custom Index 0-4yrs European Currency High Yield, BB-B, 3% constrained, excluding Subordinated Debt, 100% € Hedged
1.5 x bmk VaR
2.0 x bmk VaR
68.74% 106.84% 86.54% 2.10% 27.98%
Threadneedle (Lux) - European Strategic Bond
Relative VaR Covariance 20% ICE BofA 1-7 Year All Euro Government (20%), 40% ICE BofA 1-10 Year Euro Corporate (40%), 40% ICE BofA European Currency High Yield Constrained (40%)
1.8 x bmk VaR
2.0 x bmk VaR
90.89% 115.44% 99.89% 81.77% 120.06%
Threadneedle (Lux) Flexible Asian Bond
Relative VaR Covariance J.P. Morgan Asia Credit Index Diversified**
Relative VaR Covariance MSCI All Countries World Index
1.6 x bmk VaR
2.0 x bmk VaR
86.27% 107.65% 97.25% 85.99% 85.99%
Threadneedle (Lux) - American Extended Alpha
Relative VaR Covariance S&P 500 Index 1.6 x bmk VaR
2.0 x bmk VaR
91.62% 115.20% 101.29% 66.32% 66.32%
Threadneedle (Lux) - Enhanced Commodities
Relative VaR Historical BloombergCommodity Index
1.3 x bmk VaR
1.3 x bmk VaR
73.12% 114.20% 94.08% 52.59% 386.81%
*Calculation method. The VaR model is based on a 99% Confidence interval over a 1-month holding period. The covariance model uses 2 years of data, weighted with a 6 month half-life, and is updated daily. The historical method uses 1 year of daily data.**JPMorgan JADE Global Index (50%) and JPM JACI Sovereign (Hard CCY) (50%) until September 30, 2020.
Shareholders’ Information (unaudited)
353
Threadneedle (Lux) Annual Report and Audited Financial Statements March 2021
The SICAV is an investment company organised as a “Société d’Investissement à Capital Variable” in the Grand Duchy of Luxembourg under the Law of August 10, 1915, as amended, and qualifies as an Undertaking for Collective Investment in Transferable Securities (“UCITS”) under Part I of the law of December 17, 2010, as amended.
The SICAV was incorporated on February 10, 1995 for an unlimited period. The SICAV’s articles of incorporation were first published in the Recueil des Sociétés et Associations of the Grand Duchy of Luxembourg on March 31, 1995 and were last amended effective on September 14, 2018.
The SICAV is registered under the Number R.C.S. Luxembourg B-50216.
The annual general meeting of Shareholders of the SICAV is held in Luxembourg as may be specified in the notice of meeting, within six months of the accounting year end. The annual general meeting may be held abroad if, in the absolute and final judgment of the Board, exceptional circumstances so require. Other meetings of Shareholders may be held at such place and period of notice as may be specified in the respective notices of meeting. Notices of general meetings are given in accordance with Luxembourg law and in accordance with applicable rules in the relevant countries where Shares are publicly offered for sale. Notices will specify the place and time of the meeting, the conditions of admission, the agenda, the quorum and voting requirements.
The accounting year of the SICAV terminates on March 31 in each year.
The annual report and audited financial statements and the unaudited semi-annual report are available at the registered office of the SICAV and at the principal office of each paying agent and distributor. The combined accounts of the SICAV are expressed in U.S. Dollars.
The Net Asset Value and the offer and redemption prices of the shares of the SICAV are made public at the registered office of the SICAV.
This report does not constitute an offer or a solicitation of an offer to buy shares in the SICAV. Subscriptions are accepted on the basis of the Prospectus and of the latest available annual report containing the audited financial statements as at March 31 and of the latest available semi-annual report as at September 30, if published thereafter.
Certain Portfolios and/or share classes contained within this report may not be authorised or offered for sale in every jurisdiction at this time.
Key Investor Information Document (“KIID”) - Subscription requirementsThe KIID is a pre-contractual document and investors will have to confirm that they have read the latest KIID before making a subscription. The Management Company has the right to reject a subscription if the investor does not confirm that they have read the latest KIID at the time of application. The latest KIID may be obtained from www.columbiathreadneedle.com.
Remuneration DisclosuresThis disclosure is made in respect of the remuneration policy of Threadneedle Asset Management Sàrl (“TAM Sàrl” or “the Group”), as it applies to Manager (“the Manager”) in respect of the Undertakings for Collective Investment in Transferable Securities (“UCITS”) Directive and other applicable rules and guidance. The Remuneration Policy applies to all its subsidiary entities to which the UCITS Directives requirements apply, and was last approved by the Remuneration Committee in June 2020.
1. The Remuneration Committee
The Remuneration Committee of TAM Sàrl is a sub-committee of the TAM Sàrl Board with the responsibility to establish the philosophy and objectives that will govern the Group’s compensation and benefit programmes; review and approve compensation and benefit plans, policies, and practices; and oversee and approve the Group’s remuneration. It has been determined to be independent of the day-to-day executive management of the Group, its Members being Directors of the Group who are nominated by Ameriprise Financial, and the Group’s parent company.
Current Committee Members are Mr Walter Berman, Mr Ted Truscott and Mr William Turner. Meetings are normally held in January, March, June, September and December. The Global Head of Reward acts as Secretary to the Committee. The Committee may invite the attendance of any Group employee or functional expert from the parent company as deemed appropriate, to allow it to fulfil its responsibilities including ensuring remuneration is consistent with effective risk management and does not encourage excessive risk taking.
354
Threadneedle (Lux) Annual Report and Audited Financial Statements March 2021
2. Determining Incentive Remuneration Pools
The Manager made its annual Total Incentive Award decisions from separate pools covering the Real Estate business, Distribution unit, Investments business and Support functions, ultimately aggregated for governance and oversight at the EMEA regional level. Those pools are determined at the Company’s discretion, subject to final oversight and approval from the Remuneration Committee. The pools for Real Estate, Distribution and Investments Special Incentive Plans (the “SIPs”) are determined with reference to four un-weighted factors being a ‘Top-Down’ assessment of market practice, legal and regulatory requirements and any other internal or external contextual factors; a ‘Bottom-Up’ calculation based on business performance against Plan and Target Incentive level for the firm (see ‘Pay for Performance’ below); the overall financial and strategic performance of the Group; and the financial and strategic performance of Ameriprise Financial as the Group’s parent company and shareholder. The funding for support roles forms part of the global Annual Incentive Award (‘AIA’) plan, with funding to each region and business determined by a comprehensive balanced Business Unit Assessment in context of the overall Ameriprise Financial group’s performance. All pools are set in context of the risk and control environment maintained during the year and may be adjusted top-down to reflect any material issues in that regard. The Committee also receives ongoing reports through the year from the Risk function regarding risk assessments and any themes or areas of note related to risk control or risk-related behavioural concerns.
The Committee takes all of these factors into account in order to make a balanced decision on the Total Incentive pool for the year in question.
3. Determining Individual Total Incentive Awards
Individual reward decisions under all incentive plans are wholly discretionary, although strongly informed by the annual performance appraisal and by known market remuneration levels for equivalent jobs as well as by the pool funding available. Risk and Compliance provide a critical input to final performance rating setting, ensuring that any risk and relevant behavioural concerns are reflected in performance appraisals and subsequently in remuneration recommendations. The EMEA Heads of Risk and Compliance also report directly to the Remuneration Committee of the award process to ensure that the Committee receives a direct report on which to base its final risk adjustment decisions.
Base salaries are maintained at a market-competitive level in order to ensure that, if required, it is possible to award zero incentive.
Pay for Performance
The bottom-up element of the SIP pool determination process measures team and wider business performance against key business targets for each area of the Group, including longer-term investment performance for the Investments and Real Estate divisions and a mix of gross and net sales for Distribution. Investment performance is assessed against each fund’s benchmarks and its risk profile. All such assessments’ impacts on the bottom-up calculation are capped, and weighted more heavily to longer time periods, so as not to incentivise managers to take excessive risk in order to deliver higher incentive pools. While the Group and parent company financial and strategic results are important factors in pool determination, the model is set up to ensure that delivery of the business’ core goals, including delivering investment performance to its customers, is an explicit and significant driver in pool determination for those divisions.
Individual discretionary awards from the available funding, in context of market-competitive reward levels for the job in question, are driven strongly by each individual’s ratings against Goals (objectives) and the Group’s behavioural Leadership expectations (our Values), each of which is separately rated on a 5-point scale to ensure the behavioural assessment is given due prominence. Goals focus on the key deliverables for the role that year, in particular on the delivery of investment performance for Investments employees and for the Property division: all employees are also managed against a mandatory Risk Management Goal. Investment performance, where relevant to the role, is assessed against each fund’s benchmark and its risk profile.
Ratings are consistency-checked across the business with the input of the EMEA Heads of Risk and Compliance providing input as required to ensure balance and due reflection of risk management. For Sales, Real Estate and Investment incentives there is no pre-determined grid or formula driving awards, which are discretionary in order to be able to account for and reflect all relevant factors.
Delivery of Total Incentives
Threadneedle believes that deferred awards for higher earners and risk takers are a matter of good practice and an important part of aligning key staff’s interests with the long-term interests of customers and shareholders. To that end, Total Incentive awards for all employees in the Group may be delivered partly in deferred awards through the Ameriprise Financial Long-Term Incentive Award (“LTIA”) programme and, for Code Staff and those in the Investments division, through a fund deferral programme. Deferrals, and delivery of awards in instruments, will comply with relevant regulatory requirements in force from time to time.
Staff qualifying as Code Staff/Identified employees and those of a comparable level of seniority are subject to a higher rate of deferral. 50% of the overall incentive award is delivered in fund-linked units subject to a holding period after delivery. The fund linked units are designed to reflect the performance of a cross section of products and asset classes within the region.
Shareholders’ Information (unaudited)(continued)
Shareholders’ Information (unaudited)(continued)
355
Threadneedle (Lux) Annual Report and Audited Financial Statements March 2021
4. Identified Staff
Code Staff/Identified employees are classified as Senior Management, individuals with a material impact on the risk profile of UCITS, individuals within control functions and other employees whose total remuneration takes them in to the same bracket as senior management and risk takers, whose professional activities have a material impact on the risk profiles of the Manager or of the funds it manages. In practice, this will include the named Fund Managers of the Manager’s funds.
5. Remuneration Payment Disclosure
The performance period for remuneration operate on a calendar year basis.
Total remuneration paid by the Management Company to 14 UCITS V Remuneration Code Staff Senior Managers in respect of its UCITS activities in the 2020 performance year was £1.13m, of which £0.50m was fixed and £0.63m was variable. Total remuneration paid to other members of the UCITS Remuneration Code Staff whose actions had a material impact on the risk profile of the Manager was £7.54m, of which £3.27m was fixed and £4.27m was variable. Total Remuneration paid to delegated managers of UCITS regulated funds was £0.55m, of which £0.15m was fixed and £0.40m was variable.
Information for Investors in Switzerland (unaudited)
356
Threadneedle (Lux) Annual Report and Audited Financial Statements March 2021
The annual report and audited financial statements, the unaudited semi-annual report, the report on changes in the Portfolio holdings for the year, the articles of incorporation, the Prospectus (Swiss version) and the KIID can be obtained upon simple request and free of charge at the offices of the Swiss Representative and paying agent of the SICAV, RBC Investor Services Bank S.A., Esch-sur-Alzette, Zurich Branch, Bleicherweg 7, 8027 Zurich, Switzerland, or at the registered office of the SICAV.
Past performance is no indication of current or future performance, and the performance data do not take account of the commissions and costs incurred on the issue and redemption of shares.
Share Class Performance (unaudited)
357
Threadneedle (Lux) Annual Report and Audited Financial Statements March 2021
Share Class Benchmark Name Comments
December 31, 2020 December 31, 2019 December 31, 2018
BenchmarkPortfolio
Return BenchmarkPortfolio
Return BenchmarkPortfolio
Return
Threadneedle (Lux) - Global Corporate Bond AEC Barclays Global Aggregate Corporates -
USD Hedged8.26% 9.67% 12.51% 9.06% -1.00% -4.54%
AEH Barclays Global Aggregate Corporates - USD Hedged
8.26% 9.71% 12.51% 9.09% -1.00% -4.57%
AKH Barclays Global Aggregate Corporates - USD Hedged
8.26% 9.87% 12.51% 9.31% -1.00% -4.63%
ANH Barclays Global Aggregate Corporates - USD Hedged
Performance since launch October 18, 2019
8.26% 10.06% 1.13% 0.68% n/a n/a
AU Barclays Global Aggregate Corporates - USD Hedged
8.26% 11.36% 12.51% 12.32% -1.00% -1.75%
AUP Barclays Global Aggregate Corporates - USD Hedged
8.26% 11.36% 12.51% 12.33% -1.00% -1.82%
DEC Barclays Global Aggregate Corporates - USD Hedged
8.26% 8.90% 12.51% 8.07% -1.00% -5.22%
DEH Barclays Global Aggregate Corporates - USD Hedged
8.26% 8.85% 12.51% 8.27% -1.00% -5.29%
DU Barclays Global Aggregate Corporates - USD Hedged
8.26% 10.53% 12.51% 11.46% -1.00% -2.54%
DUP Barclays Global Aggregate Corporates - USD Hedged
8.26% 10.53% 12.51% 11.32% -1.00% -2.67%
IEC Barclays Global Aggregate Corporates - USD Hedged
Performance since launch May 25, 2018
8.26% 9.92% 12.51% 9.21% 1.09% -1.01%
IEH Barclays Global Aggregate Corporates - USD Hedged
8.26% 9.86% 12.51% 9.25% -1.00% -4.48%
IEP Barclays Global Aggregate Corporates - USD Hedged
Performance since launch June 13, 2018
8.26% 2.20% 12.51% 14.56% 1.16% 3.76%
IGC Barclays Global Aggregate Corporates - USD Hedged
Performance since launch May 25, 2018
8.26% 10.24% 12.51% 10.47% 1.09% -0.39%
IGH Barclays Global Aggregate Corporates - USD Hedged
8.26% 10.25% 12.51% 10.55% -1.00% -3.30%
IKH Barclays Global Aggregate Corporates - USD Hedged
8.26% 10.10% 12.51% 9.40% -1.00% -4.51%
INH Barclays Global Aggregate Corporates - USD Hedged
Performance since launch October 18, 2019
8.26% 10.39% 1.13% 0.79% n/a n/a
IU Barclays Global Aggregate Corporates - USD Hedged
8.26% 11.58% 12.51% 12.52% -1.00% -1.55%
IUP Barclays Global Aggregate Corporates - USD Hedged
Performance since launch June 13, 2018
8.26% 11.61% 12.51% 12.74% 1.16% 0.72%
NEC Barclays Global Aggregate Corporates - USD Hedged
Performance since launch May 25, 2018
8.26% 10.16% 12.51% 9.47% 1.09% -0.81%
NEH Barclays Global Aggregate Corporates - USD Hedged
Performance since launch January 29, 2018
8.26% 10.08% 12.51% 9.54% -0.50% -3.60%
NGC Barclays Global Aggregate Corporates - USD Hedged
Performance since launch January 29, 2018
8.26% 10.51% 12.51% 10.87% -0.50% -2.52%
NGH Barclays Global Aggregate Corporates - USD Hedged
Performance since launch January 29, 2018
8.26% 10.49% 12.51% 10.84% -0.50% -2.60%
NU Barclays Global Aggregate Corporates - USD Hedged
Performance since launch January 29, 2018
8.26% 11.80% 12.51% 12.80% -0.50% -1.00%
NUP Barclays Global Aggregate Corporates - USD Hedged
Performance since launch May 23, 2018
8.26% 11.82% 12.51% 12.80% 1.48% 1.31%
Note: Total performance is historical and is not a guarantee of future results. The net asset value of shares classes may go up or down. Performance is net of all applicable fees as well as distributions made during the calendar year ended December 31, 2020 (but does not reflect a sales charge as stated in the note 5 to the financial statements). The performance is different across share classes depending on applicable asset management and shareholder servicing fees as disclosed in the note 5 to the financial statements. In addition, currency fluctuations may also affect performance depending on the currency of denomination of the share class and the base currency of the Portfolio. The returns are stated in the currency in which the portfolios are denominated.
Share Class Performance (unaudited)(continued)
358
Threadneedle (Lux) Annual Report and Audited Financial Statements March 2021
Note: Total performance is historical and is not a guarantee of future results. The net asset value of shares classes may go up or down. Performance is net of all applicable fees as well as distributions made during the calendar year ended December 31, 2020 (but does not reflect a sales charge as stated in the note 5 to the financial statements). The performance is different across share classes depending on applicable asset management and shareholder servicing fees as disclosed in the note 5 to the financial statements. In addition, currency fluctuations may also affect performance depending on the currency of denomination of the share class and the base currency of the Portfolio. The returns are stated in the currency in which the portfolios are denominated.
Share Class Benchmark Name Comments
December 31, 2020 December 31, 2019 December 31, 2018
BenchmarkPortfolio
Return BenchmarkPortfolio
Return BenchmarkPortfolio
Return
Threadneedle (Lux) - Global Corporate Bond (continued)XEH Barclays Global Aggregate Corporates -
USD HedgedPerformance since launch October 16, 2020
2.18% 2.27% n/a n/a n/a n/a
XFH Barclays Global Aggregate Corporates - USD Hedged
Performance since launch October 16, 2020
2.18% 2.21% n/a n/a n/a n/a
XGH Barclays Global Aggregate Corporates - USD Hedged
Performance since launch May 17, 2019
8.26% 10.81% 6.56% 5.91% n/a n/a
XU Barclays Global Aggregate Corporates - USD Hedged
Performance since launch October 16, 2020
2.18% 2.48% n/a n/a n/a n/a
ZEH Barclays Global Aggregate Corporates - USD Hedged
8.26% 9.97% 12.51% 9.30% -1.00% -4.40%
ZFH Barclays Global Aggregate Corporates - USD Hedged
Performance since launch October 14, 2020
2.17% 2.11% n/a n/a n/a n/a
ZGH Barclays Global Aggregate Corporates - USD Hedged
8.26% 10.32% 12.51% 10.67% -1.00% -3.32%
ZU Barclays Global Aggregate Corporates - USD Hedged
8.26% 11.63% 12.51% 12.60% -1.00% -1.55%
Threadneedle (Lux) - European Corporate BondAE iBoxx Euro Corporates Performance since launch
September 22, 2018 2.73% 3.76% 6.29% 5.91% -0.80% -1.00%
ANH iBoxx Euro Corporates Performance since launch October 18, 2019
2.73% 4.48% 0.00% 0.30% n/a n/a
IE iBoxx Euro Corporates Performance since launch September 22, 2018
2.73% 4.39% 6.29% 6.46% -0.80% -0.80%
INH iBoxx Euro Corporates Performance since launch October 18, 2019
2.73% 5.04% 0.00% 0.41% n/a n/a
XE iBoxx Euro Corporates Performance since launch October 16, 2020
1.13% 1.53% n/a n/a n/a n/a
XFH iBoxx Euro Corporates Performance since launch October 16, 2020
1.13% 1.48% n/a n/a n/a n/a
XGH iBoxx Euro Corporates Performance since launch October 16, 2020
1.13% 1.65% n/a n/a n/a n/a
XUH iBoxx Euro Corporates Performance since launch October 16, 2020
1.13% 1.72% n/a n/a n/a n/a
ZE iBoxx Euro Corporates Performance since launch September 22, 2018
2.73% 4.29% 6.29% 6.33% -0.80% -0.80%
ZFH iBoxx Euro Corporates Performance since launch October 14, 2020
1.27% 1.51% n/a n/a n/a n/a
1E iBoxx Euro Corporates Performance since launch September 24, 2018
2.73% 3.78% 6.29% 5.91% -0.80% -0.74%
1G iBoxx Euro Corporates Performance since launch September 24, 2018
2.73% 9.62% 6.29% -0.43% -0.80% 0.00%
2E iBoxx Euro Corporates Performance since launch September 22, 2018
2.73% 4.41% 6.29% 6.53% -0.80% -0.80%
2G iBoxx Euro Corporates Performance since launch September 22, 2018
2.73% 10.26% 6.29% 0.55% -0.80% -0.90%
3G iBoxx Euro Corporates Performance since launch September 24, 2018
2.73% 10.18% 6.29% 0.15% -0.80% 0.00%
4E iBoxx Euro Corporates Performance since launch April 8, 2020
9.46% 10.73% n/a n/a n/a n/a
Share Class Performance (unaudited)(continued)
359
Threadneedle (Lux) Annual Report and Audited Financial Statements March 2021
Share Class Benchmark Name Comments
December 31, 2020 December 31, 2019 December 31, 2018
BenchmarkPortfolio
Return BenchmarkPortfolio
Return BenchmarkPortfolio
Return
Threadneedle (Lux) - European Corporate Bond (continued)4G iBoxx Euro Corporates Performance since launch
April 4, 2019 2.73% 10.85% 2.82% 2.95% n/a n/a
8E iBoxx Euro Corporates Performance since launch September 24, 2018
2.73% 4.37% 6.29% 6.75% -0.80% -1.19%
8G iBoxx Euro Corporates Performance since launch September 24, 2018
2.73% 10.26% 6.29% 0.21% -0.80% 0.00%
9G iBoxx Euro Corporates Performance since launch September 22, 2018
2.73% 10.22% 6.29% 0.48% -0.80% -0.90%
Threadneedle (Lux) - European High Yield BondAE ICE BofA European Currency High Yield
Excluding Subordinated Financials (Hedged to Euro)
Performance since launch May 6, 2020
14.26% 11.30% n/a n/a n/a n/a
AKH ICE BofA European Currency High Yield Excluding Subordinated Financials (Hedged to Euro)
Performance since launch October 18, 2019
2.82% 2.71% 2.12% 1.32% n/a n/a
ANH ICE BofA European Currency High Yield Excluding Subordinated Financials (Hedged to Euro)
Performance since launch October 18, 2019
2.82% 2.68% 2.12% 1.71% n/a n/a
IE ICE BofA European Currency High Yield Excluding Subordinated Financials (Hedged to Euro)
Performance since launch August 30, 2018
2.82% 3.43% 10.95% 9.68% -3.73% -2.50%
IEP ICE BofA European Currency High Yield Excluding Subordinated Financials (Hedged to Euro)
Performance since launch August 30, 2018
2.82% 3.43% 10.95% 9.53% -3.73% -2.60%
IKH ICE BofA European Currency High Yield Excluding Subordinated Financials (Hedged to Euro)
Performance since launch October 18, 2019
2.82% 3.32% 2.12% 1.42% n/a n/a
INH ICE BofA European Currency High Yield Excluding Subordinated Financials (Hedged to Euro)
Performance since launch October 18, 2019
2.82% 3.36% 2.12% 1.85% n/a n/a
XE ICE BofA European Currency High Yield Excluding Subordinated Financials (Hedged to Euro)
Performance since launch July 18, 2019
2.82% 4.15% 2.73% 2.65% n/a n/a
ZE ICE BofA European Currency High Yield Excluding Subordinated Financials (Hedged to Euro)
Performance since launch August 30, 2018
2.82% 3.38% 10.95% 9.67% -3.73% -2.60%
ZEP ICE BofA European Currency High Yield Excluding Subordinated Financials (Hedged to Euro)
Performance since launch August 30, 2018
2.82% 3.36% 10.95% 9.49% -3.73% -2.60%
1E ICE BofA European Currency High Yield Excluding Subordinated Financials (Hedged to Euro)
Performance since launch August 30, 2018
2.82% 2.88% 10.95% 9.13% -3.73% -2.70%
1EP ICE BofA European Currency High Yield Excluding Subordinated Financials (Hedged to Euro)
Performance since launch August 30, 2018
2.82% 2.88% 10.95% 9.11% -3.73% -2.70%
1G ICE BofA European Currency High Yield Excluding Subordinated Financials (Hedged to Euro)
Performance since launch August 30, 2018
2.82% 8.68% 10.95% 3.09% -3.73% -3.00%
Note: Total performance is historical and is not a guarantee of future results. The net asset value of shares classes may go up or down. Performance is net of all applicable fees as well as distributions made during the calendar year ended December 31, 2020 (but does not reflect a sales charge as stated in the note 5 to the financial statements). The performance is different across share classes depending on applicable asset management and shareholder servicing fees as disclosed in the note 5 to the financial statements. In addition, currency fluctuations may also affect performance depending on the currency of denomination of the share class and the base currency of the Portfolio. The returns are stated in the currency in which the portfolios are denominated.
Share Class Performance (unaudited)(continued)
360
Threadneedle (Lux) Annual Report and Audited Financial Statements March 2021
Share Class Benchmark Name Comments
December 31, 2020 December 31, 2019 December 31, 2018
BenchmarkPortfolio
Return BenchmarkPortfolio
Return BenchmarkPortfolio
Return
Threadneedle (Lux) - European High Yield Bond (continued)1GP ICE BofA European Currency High Yield
Excluding Subordinated Financials (Hedged to Euro)
Performance since launch August 30, 2018
2.82% 8.65% 10.95% 3.07% -3.73% -3.00%
1UT ICE BofA European Currency High Yield Excluding Subordinated Financials (Hedged to Euro)
Performance since launch August 30, 2018
2.82% 4.25% 10.95% 12.25% -3.73% -1.83%
2E ICE BofA European Currency High Yield Excluding Subordinated Financials (Hedged to Euro)
Performance since launch August 30, 2018
2.82% 3.46% 10.95% 9.71% -3.73% -2.50%
2EP ICE BofA European Currency High Yield Excluding Subordinated Financials (Hedged to Euro)
Performance since launch August 30, 2018
2.82% 3.50% 10.95% 9.74% -3.73% -2.50%
2FH ICE BofA European Currency High Yield Excluding Subordinated Financials (Hedged to Euro)
Performance since launch August 30, 2018
2.82% 3.12% 10.95% 9.26% -3.73% -2.70%
2G ICE BofA European Currency High Yield Excluding Subordinated Financials (Hedged to Euro)
Performance since launch August 30, 2018
2.82% 9.29% 10.95% 3.71% -3.73% -2.80%
2GP ICE BofA European Currency High Yield Excluding Subordinated Financials (Hedged to Euro)
Performance since launch August 30, 2018
2.82% 9.36% 10.95% 3.68% -3.73% -2.80%
3E ICE BofA European Currency High Yield Excluding Subordinated Financials (Hedged to Euro)
Performance since launch August 30, 2018
2.82% 3.51% 10.95% 9.82% -3.73% -2.50%
3EP ICE BofA European Currency High Yield Excluding Subordinated Financials (Hedged to Euro)
Performance since launch August 30, 2018
2.82% 3.51% 10.95% 9.80% -3.73% -2.50%
3FC ICE BofA European Currency High Yield Excluding Subordinated Financials (Hedged to Euro)
Performance since launch August 30, 2018
2.82% 3.16% 10.95% 9.36% -3.73% -2.70%
3FH ICE BofA European Currency High Yield Excluding Subordinated Financials (Hedged to Euro)
Performance since launch August 30, 2018
2.82% 3.18% 10.95% 9.32% -3.73% -2.70%
3G ICE BofA European Currency High Yield Excluding Subordinated Financials (Hedged to Euro)
Performance since launch August 30, 2018
2.82% 9.35% 10.95% 3.62% -3.73% -2.70%
3GP ICE BofA European Currency High Yield Excluding Subordinated Financials (Hedged to Euro)
Performance since launch August 30, 2018
2.82% 9.32% 10.95% 3.68% -3.73% -2.80%
4E ICE BofA European Currency High Yield Excluding Subordinated Financials (Hedged to Euro)
Performance since launch August 30, 2018
2.82% 4.24% 10.95% 10.61% -3.73% -2.30%
4G ICE BofA European Currency High Yield Excluding Subordinated Financials (Hedged to Euro)
Performance since launch August 30, 2018
2.82% 10.12% 10.95% 4.40% -3.73% -0.30%
4GP ICE BofA European Currency High Yield Excluding Subordinated Financials (Hedged to Euro)
Performance since launch August 30, 2018 until dormant June 17, 2020
-4.31% 2.36% 10.95% 4.36% -3.73% -2.50%
Note: Total performance is historical and is not a guarantee of future results. The net asset value of shares classes may go up or down. Performance is net of all applicable fees as well as distributions made during the calendar year ended December 31, 2020 (but does not reflect a sales charge as stated in the note 5 to the financial statements). The performance is different across share classes depending on applicable asset management and shareholder servicing fees as disclosed in the note 5 to the financial statements. In addition, currency fluctuations may also affect performance depending on the currency of denomination of the share class and the base currency of the Portfolio. The returns are stated in the currency in which the portfolios are denominated.
Share Class Performance (unaudited)(continued)
361
Threadneedle (Lux) Annual Report and Audited Financial Statements March 2021
Share Class Benchmark Name Comments
December 31, 2020 December 31, 2019 December 31, 2018
BenchmarkPortfolio
Return BenchmarkPortfolio
Return BenchmarkPortfolio
Return
Threadneedle (Lux) - European High Yield Bond (continued)8E ICE BofA European Currency High Yield
Excluding Subordinated Financials (Hedged to Euro)
Performance since launch August 30, 2018
2.82% 3.42% 10.95% 9.76% -3.73% -2.60%
8EP ICE BofA European Currency High Yield Excluding Subordinated Financials (Hedged to Euro)
Performance since launch August 30, 2018
2.82% 3.42% 10.95% 9.66% -3.73% -2.50%
8FH ICE BofA European Currency High Yield Excluding Subordinated Financials (Hedged to Euro)
Performance since launch August 30, 2018
2.82% 3.09% 10.95% 9.28% -3.73% -2.80%
8G ICE BofA European Currency High Yield Excluding Subordinated Financials (Hedged to Euro)
Performance since launch August 30, 2018
2.82% 9.25% 10.95% 3.60% -3.73% -2.80%
8GP ICE BofA European Currency High Yield Excluding Subordinated Financials (Hedged to Euro)
Performance since launch August 30, 2018
2.82% 9.22% 10.95% 3.57% -3.73% -2.50%
9E ICE BofA European Currency High Yield Excluding Subordinated Financials (Hedged to Euro)
Performance since launch August 30, 2018
2.82% 3.55% 10.95% 9.84% -3.73% -2.50%
9EP ICE BofA European Currency High Yield Excluding Subordinated Financials (Hedged to Euro)
Performance since launch August 30, 2018
2.82% 3.55% 10.95% 9.85% -3.73% -2.60%
9FC ICE BofA European Currency High Yield Excluding Subordinated Financials (Hedged to Euro)
Performance since launch August 30, 2018
2.82% 3.19% 10.95% 9.32% -3.73% -2.60%
9FH ICE BofA European Currency High Yield Excluding Subordinated Financials (Hedged to Euro)
Performance since launch August 30, 2018
2.82% 3.22% 10.95% 9.30% -3.73% -2.60%
9G ICE BofA European Currency High Yield Excluding Subordinated Financials (Hedged to Euro)
Performance since launch August 30, 2018
2.82% 9.44% 10.95% 3.69% -3.73% -2.70%
9GP ICE BofA European Currency High Yield Excluding Subordinated Financials (Hedged to Euro)
Performance since launch August 30, 2018
2.82% 9.41% 10.95% 3.64% -3.73% -2.70%
Threadneedle (Lux) - European Short-Term High Yield BondAE ICE BofA Custom Index 0-4yrs
European Currency High Yield, BB-B, 3% constrained, excluding Subordinated Debt, 100% € Hedged
Performance since launch July 18, 2019
0.62% 1.31% 1.65% 1.21% n/a n/a
AEP ICE BofA Custom Index 0-4yrs European Currency High Yield, BB-B, 3% constrained, excluding Subordinated Debt, 100% € Hedged
Performance since launch July 18, 2019
0.62% 1.31% 1.65% 1.21% n/a n/a
AKH ICE BofA Custom Index 0-4yrs European Currency High Yield, BB-B, 3% constrained, excluding Subordinated Debt, 100% € Hedged
Performance since launch July 18, 2019
0.62% 1.43% 1.65% 1.27% n/a n/a
ANH ICE BofA Custom Index 0-4yrs European Currency High Yield, BB-B, 3% constrained, excluding Subordinated Debt, 100% € Hedged
Performance since launch July 18, 2019
0.62% 1.64% 1.65% 2.08% n/a n/a
Note: Total performance is historical and is not a guarantee of future results. The net asset value of shares classes may go up or down. Performance is net of all applicable fees as well as distributions made during the calendar year ended December 31, 2020 (but does not reflect a sales charge as stated in the note 5 to the financial statements). The performance is different across share classes depending on applicable asset management and shareholder servicing fees as disclosed in the note 5 to the financial statements. In addition, currency fluctuations may also affect performance depending on the currency of denomination of the share class and the base currency of the Portfolio. The returns are stated in the currency in which the portfolios are denominated.
Share Class Performance (unaudited)(continued)
362
Threadneedle (Lux) Annual Report and Audited Financial Statements March 2021
Share Class Benchmark Name Comments
December 31, 2020 December 31, 2019 December 31, 2018
BenchmarkPortfolio
Return BenchmarkPortfolio
Return BenchmarkPortfolio
Return
Threadneedle (Lux) - European Short-Term High Yield Bond (continued)IE ICE BofA Custom Index 0-4yrs
European Currency High Yield, BB-B, 3% constrained, excluding Subordinated Debt, 100% € Hedged
Performance since launch July 18, 2019
0.62% 1.72% 1.65% 1.39% n/a n/a
IEP ICE BofA Custom Index 0-4yrs European Currency High Yield, BB-B, 3% constrained, excluding Subordinated Debt, 100% € Hedged
Performance since launch July 18, 2019
0.62% 1.67% 1.65% 1.38% n/a n/a
IGC ICE BofA Custom Index 0-4yrs European Currency High Yield, BB-B, 3% constrained, excluding Subordinated Debt, 100% € Hedged
Performance since launch July 18, 2019
0.62% 2.11% 1.65% 1.87% n/a n/a
IGH ICE BofA Custom Index 0-4yrs European Currency High Yield, BB-B, 3% constrained, excluding Subordinated Debt, 100% € Hedged
Performance since launch July 18, 2019
0.62% 2.04% 1.65% 1.90% n/a n/a
IKH ICE BofA Custom Index 0-4yrs European Currency High Yield, BB-B, 3% constrained, excluding Subordinated Debt, 100% € Hedged
Performance since launch October 18, 2019
0.62% 1.82% 1.63% 0.94% n/a n/a
INH ICE BofA Custom Index 0-4yrs European Currency High Yield, BB-B, 3% constrained, excluding Subordinated Debt, 100% € Hedged
Performance since launch October 18, 2019
0.62% 2.02% 1.63% 1.34% n/a n/a
XE ICE BofA Custom Index 0-4yrs European Currency High Yield, BB-B, 3% constrained, excluding Subordinated Debt, 100% € Hedged
Performance since launch July 18, 2019
0.62% 2.13% 1.65% 1.58% n/a n/a
XGC ICE BofA Custom Index 0-4yrs European Currency High Yield, BB-B, 3% constrained, excluding Subordinated Debt, 100% € Hedged
Performance since launch November 27, 2019
0.62% 2.48% 0.95% 0.76% n/a n/a
XGH ICE BofA Custom Index 0-4yrs European Currency High Yield, BB-B, 3% constrained, excluding Subordinated Debt, 100% € Hedged
Performance since launch July 18, 2019
0.62% 2.52% 1.65% 2.04% n/a n/a
ZE ICE BofA Custom Index 0-4yrs European Currency High Yield, BB-B, 3% constrained, excluding Subordinated Debt, 100% € Hedged
Performance since launch July 18, 2019
0.62% 1.66% 1.65% 1.38% n/a n/a
Threadneedle (Lux) - European Social BondAE ICE BofA Euro Non-Sovereign (50%), ICE
BofA Euro Corp Euroland Issuers (50%)Performance since launch September 18, 2020
1.52% 1.36% n/a n/a n/a n/a
AEP ICE BofA Euro Non-Sovereign (50%), ICE BofA Euro Corp Euroland Issuers (50%)
Performance since launch September 18, 2020
1.52% 1.36% n/a n/a n/a n/a
AKH ICE BofA Euro Non-Sovereign (50%), ICE BofA Euro Corp Euroland Issuers (50%)
Performance since launch October 14, 2020
1.04% 1.03% n/a n/a n/a n/a
ANH ICE BofA Euro Non-Sovereign (50%), ICE BofA Euro Corp Euroland Issuers (50%)
Performance since launch October 14, 2020
1.04% 1.12% n/a n/a n/a n/a
ID ICE BofA Euro Non-Sovereign (50%), ICE BofA Euro Corp Euroland Issuers (50%)
Performance since launch November 15, 2019
2.74% 2.77% -0.19% -0.20% n/a n/a
Note: Total performance is historical and is not a guarantee of future results. The net asset value of shares classes may go up or down. Performance is net of all applicable fees as well as distributions made during the calendar year ended December 31, 2020 (but does not reflect a sales charge as stated in the note 5 to the financial statements). The performance is different across share classes depending on applicable asset management and shareholder servicing fees as disclosed in the note 5 to the financial statements. In addition, currency fluctuations may also affect performance depending on the currency of denomination of the share class and the base currency of the Portfolio. The returns are stated in the currency in which the portfolios are denominated.
Share Class Performance (unaudited)(continued)
363
Threadneedle (Lux) Annual Report and Audited Financial Statements March 2021
Share Class Benchmark Name Comments
December 31, 2020 December 31, 2019 December 31, 2018
BenchmarkPortfolio
Return BenchmarkPortfolio
Return BenchmarkPortfolio
Return
Threadneedle (Lux) - European Social Bond (continued)IE ICE BofA Euro Non-Sovereign (50%), ICE
DE 40% ICE BofA EUR High Yield, 40% ICE BofA EMU Corp (1-10y), 20% ICE BofA EUR Govt (1-7y)
2.23% 4.80% 7.00% 6.17% -1.77% -2.85%
Note: Total performance is historical and is not a guarantee of future results. The net asset value of shares classes may go up or down. Performance is net of all applicable fees as well as distributions made during the calendar year ended December 31, 2020 (but does not reflect a sales charge as stated in the note 5 to the financial statements). The performance is different across share classes depending on applicable asset management and shareholder servicing fees as disclosed in the note 5 to the financial statements. In addition, currency fluctuations may also affect performance depending on the currency of denomination of the share class and the base currency of the Portfolio. The returns are stated in the currency in which the portfolios are denominated.
Share Class Performance (unaudited)(continued)
364
Threadneedle (Lux) Annual Report and Audited Financial Statements March 2021
Share Class Benchmark Name Comments
December 31, 2020 December 31, 2019 December 31, 2018
BenchmarkPortfolio
Return BenchmarkPortfolio
Return BenchmarkPortfolio
Return
Threadneedle (Lux) - European Strategic Bond(continued)DEP 40% ICE BofA EUR High Yield, 40% ICE
ANH JPM EMBI Global Performance since launch June 27, 2019
5.88% 4.87% 3.58% 1.90% n/a n/a
ASH JPM EMBI Global 5.88% 6.61% 14.42% 12.16% -4.61% -8.63%AU JPM EMBI Global 5.88% 7.29% 14.42% 13.04% -4.61% -7.70%AUP JPM EMBI Global 5.88% 7.29% 14.42% 13.06% -4.61% -7.73%DEH JPM EMBI Global 5.88% 5.44% 14.42% 9.54% -4.61% -10.58%DU JPM EMBI Global 5.88% 7.18% 14.42% 12.93% -4.61% -7.86%IEH JPM EMBI Global 5.88% 6.41% 14.42% 10.50% -4.61% -9.71%IU JPM EMBI Global Performance since launch
May 22, 2019 5.88% 7.98% 7.09% 5.79% n/a n/a
Note: Total performance is historical and is not a guarantee of future results. The net asset value of shares classes may go up or down. Performance is net of all applicable fees as well as distributions made during the calendar year ended December 31, 2020 (but does not reflect a sales charge as stated in the note 5 to the financial statements). The performance is different across share classes depending on applicable asset management and shareholder servicing fees as disclosed in the note 5 to the financial statements. In addition, currency fluctuations may also affect performance depending on the currency of denomination of the share class and the base currency of the Portfolio. The returns are stated in the currency in which the portfolios are denominated.
Share Class Performance (unaudited)(continued)
365
Threadneedle (Lux) Annual Report and Audited Financial Statements March 2021
Share Class Benchmark Name Comments
December 31, 2020 December 31, 2019 December 31, 2018
BenchmarkPortfolio
Return BenchmarkPortfolio
Return BenchmarkPortfolio
Return
Threadneedle (Lux) - Emerging Market Debt(continued)SU JPM EMBI Global 5.88% 7.12% 14.42% 12.89% -4.61% -7.85%SUP JPM EMBI Global 5.88% 7.13% 14.42% 12.84% -4.61% -7.86%W JPM EMBI Global 5.88% 7.66% 14.42% 13.43% -4.61% -7.37%XUP JPM EMBI Global 5.88% 8.91% 14.42% 14.79% -4.61% -6.20%ZU JPM EMBI Global 5.88% 8.07% 14.42% 13.89% -4.61% -7.04%Threadneedle (Lux) - Global Emerging Market Short-Term BondsAEC JPM EMBI Global 3-5 Yrs 4.79% 2.68% 10.54% 3.91% -1.56% -5.89%AEH JPM EMBI Global 3-5 Yrs 4.79% 2.69% 10.54% 4.01% -1.56% -5.99%AKH JPM EMBI Global 3-5 Yrs Performance since launch
June 27, 2019 4.79% 2.65% 2.70% -0.66% n/a n/a
ANH JPM EMBI Global 3-5 Yrs Performance since launch June 27, 2019
4.79% 2.90% 2.70% 0.24% n/a n/a
ASC JPM EMBI Global 3-5 Yrs 4.79% 3.71% 10.54% 6.34% -1.56% -4.03%ASH JPM EMBI Global 3-5 Yrs 4.79% 3.70% 10.54% 6.36% -1.56% -4.10%AU JPM EMBI Global 3-5 Yrs 4.79% 4.22% 10.54% 7.23% -1.56% -3.27%AUP JPM EMBI Global 3-5 Yrs 4.79% 4.22% 10.54% 7.20% -1.56% -3.24%DEH JPM EMBI Global 3-5 Yrs 4.79% 2.54% 10.54% 3.81% -1.56% -6.17%DU JPM EMBI Global 3-5 Yrs 4.79% 4.07% 10.54% 6.99% -1.56% -3.37%IE JPM EMBI Global 3-5 Yrs Performance since launch
November 27, 2019 4.79% -3.68% 1.34% -0.83% n/a n/a
IEH JPM EMBI Global 3-5 Yrs 4.79% 3.45% 10.54% 4.74% -1.56% -5.26%XU JPM EMBI Global 3-5 Yrs Performance since launch
November 14, 2018 4.79% 5.75% 10.54% 8.79% 0.60% -0.20%
XUP JPM EMBI Global 3-5 Yrs Performance since launch August 1, 2018
4.79% 5.75% 10.54% 8.80% -0.31% -1.09%
ZEH JPM EMBI Global 3-5 Yrs 4.79% 3.38% 10.54% 4.67% -1.56% -5.30%Threadneedle (Lux) - US High Yield BondAEC ICE BofA US High Yield Cash Pay
Note: Total performance is historical and is not a guarantee of future results. The net asset value of shares classes may go up or down. Performance is net of all applicable fees as well as distributions made during the calendar year ended December 31, 2020 (but does not reflect a sales charge as stated in the note 5 to the financial statements). The performance is different across share classes depending on applicable asset management and shareholder servicing fees as disclosed in the note 5 to the financial statements. In addition, currency fluctuations may also affect performance depending on the currency of denomination of the share class and the base currency of the Portfolio. The returns are stated in the currency in which the portfolios are denominated.
Share Class Performance (unaudited)(continued)
366
Threadneedle (Lux) Annual Report and Audited Financial Statements March 2021
Share Class Benchmark Name Comments
December 31, 2020 December 31, 2019 December 31, 2018
BenchmarkPortfolio
Return BenchmarkPortfolio
Return BenchmarkPortfolio
Return
Threadneedle (Lux) - US High Yield Bond(continued)IEC ICE BofA US High Yield Cash Pay
AKH Blended Benchmark (50% JPM JACI Sovereign Hard CCY, 50% JPM JADE Global Index)
Performance since launch August 13, 2019
5.67% 2.68% 3.14% 1.89% n/a n/a
AS Blended Benchmark (50% JPM JACI Sovereign Hard CCY, 50% JPM JADE Global Index)
5.67% 2.32% 14.12% 13.55% -1.67% -0.79%
ASC Blended Benchmark (50% JPM JACI Sovereign Hard CCY, 50% JPM JADE Global Index)
5.67% 3.65% 14.12% 14.19% -1.67% -3.61%
ASH Blended Benchmark (50% JPM JACI Sovereign Hard CCY, 50% JPM JADE Global Index)
5.67% 3.61% 14.12% 14.13% -1.67% -3.67%
AU Blended Benchmark (50% JPM JACI Sovereign Hard CCY, 50% JPM JADE Global Index)
5.67% 4.10% 14.12% 15.13% -1.67% -2.82%
AUP Blended Benchmark (50% JPM JACI Sovereign Hard CCY, 50% JPM JADE Global Index)
5.67% 4.10% 14.12% 15.16% -1.67% -2.82%
AVC Blended Benchmark (50% JPM JACI Sovereign Hard CCY, 50% JPM JADE Global Index)
5.67% 3.16% 14.12% 13.66% -1.67% -3.13%
AVH Blended Benchmark (50% JPM JACI Sovereign Hard CCY, 50% JPM JADE Global Index)
5.67% 3.10% 14.12% 13.62% -1.67% -3.17%
Note: Total performance is historical and is not a guarantee of future results. The net asset value of shares classes may go up or down. Performance is net of all applicable fees as well as distributions made during the calendar year ended December 31, 2020 (but does not reflect a sales charge as stated in the note 5 to the financial statements). The performance is different across share classes depending on applicable asset management and shareholder servicing fees as disclosed in the note 5 to the financial statements. In addition, currency fluctuations may also affect performance depending on the currency of denomination of the share class and the base currency of the Portfolio. The returns are stated in the currency in which the portfolios are denominated.
Share Class Performance (unaudited)(continued)
367
Threadneedle (Lux) Annual Report and Audited Financial Statements March 2021
Share Class Benchmark Name Comments
December 31, 2020 December 31, 2019 December 31, 2018
IEH Blended Benchmark (50% JPM JACI Sovereign Hard CCY, 50% JPM JADE Global Index)
5.67% 3.15% 14.12% 12.51% -1.67% -4.80%
IGH Blended Benchmark (50% JPM JACI Sovereign Hard CCY, 50% JPM JADE Global Index)
5.67% 3.60% 14.12% 13.86% -1.67% -3.82%
ISH Blended Benchmark (50% JPM JACI Sovereign Hard CCY, 50% JPM JADE Global Index)
5.67% 4.34% 14.12% 14.96% -1.67% -2.84%
IU Blended Benchmark (50% JPM JACI Sovereign Hard CCY, 50% JPM JADE Global Index)
5.67% 4.80% 14.12% 16.01% -1.67% -2.17%
XU Blended Benchmark (50% JPM JACI Sovereign Hard CCY, 50% JPM JADE Global Index)
5.67% 5.46% 14.12% 16.69% -1.67% -1.36%
ZU Blended Benchmark (50% JPM JACI Sovereign Hard CCY, 50% JPM JADE Global Index)
5.67% 4.70% 14.12% 15.86% -1.67% -2.17%
ZUP Blended Benchmark (50% JPM JACI Sovereign Hard CCY, 50% JPM JADE Global Index)
Performance since launch August 1, 2018
5.67% 4.63% 14.12% 15.71% 1.75% 1.28%
Threadneedle (Lux) - Euro Dynamic Real ReturnAE MUICP (EU CPI) Performance since launch
April 25, 2018 -0.25% 5.21% 1.33% 12.23% 0.79% -6.20%
AEP MUICP (EU CPI) Performance since launch April 25, 2018
-0.25% 5.16% 1.33% 12.19% 0.79% -6.16%
DE MUICP (EU CPI) Performance since launch April 25, 2018
-0.25% 4.43% 1.33% 11.42% 0.79% -6.70%
IE MUICP (EU CPI) Performance since launch April 25, 2018
-0.25% 5.95% 1.33% 12.97% 0.79% -5.70%
IEP MUICP (EU CPI) Performance since launch April 25, 2018
-0.25% 5.92% 1.33% 13.04% 0.79% -5.76%
LE MUICP (EU CPI) Performance since launch April 25, 2018
-0.25% 6.11% 1.33% 13.14% 0.79% -5.60%
LEP MUICP (EU CPI) Performance since launch April 25, 2018
-0.25% 6.10% 1.33% 13.20% 0.79% -5.66%
ZE MUICP (EU CPI) Performance since launch April 25, 2018
-0.25% 5.74% 1.33% 12.82% 0.79% -5.90%
ZEP MUICP (EU CPI) Performance since launch April 25, 2018
-0.25% 5.75% 1.33% 12.78% 0.79% -5.86%
Threadneedle (Lux) - Global Dynamic Real ReturnAEC NO OFFICIAL BENCHMARK n/a 9.60% n/a 8.90% n/a -9.79%AEH NO OFFICIAL BENCHMARK n/a 9.60% n/a 8.90% n/a -9.80%AKH NO OFFICIAL BENCHMARK Performance since launch
August 13, 2019 n/a 9.59% n/a 3.22% n/a n/a
AU NO OFFICIAL BENCHMARK n/a 11.46% n/a 12.28% n/a -7.22%
Note: Total performance is historical and is not a guarantee of future results. The net asset value of shares classes may go up or down. Performance is net of all applicable fees as well as distributions made during the calendar year ended December 31, 2020 (but does not reflect a sales charge as stated in the note 5 to the financial statements). The performance is different across share classes depending on applicable asset management and shareholder servicing fees as disclosed in the note 5 to the financial statements. In addition, currency fluctuations may also affect performance depending on the currency of denomination of the share class and the base currency of the Portfolio. The returns are stated in the currency in which the portfolios are denominated.
Share Class Performance (unaudited)(continued)
368
Threadneedle (Lux) Annual Report and Audited Financial Statements March 2021
Share Class Benchmark Name Comments
December 31, 2020 December 31, 2019 December 31, 2018
BenchmarkPortfolio
Return BenchmarkPortfolio
Return BenchmarkPortfolio
Return
Threadneedle (Lux) - Global Dynamic Real Return(continued)AUP NO OFFICIAL BENCHMARK n/a 11.46% n/a 12.30% n/a -7.26%DEH NO OFFICIAL BENCHMARK n/a 8.89% n/a 8.19% n/a -10.41%DU NO OFFICIAL BENCHMARK n/a 10.74% n/a 11.55% n/a -7.86%IEH NO OFFICIAL BENCHMARK Performance since launch
June 26, 2019 n/a 10.26% n/a 2.91% n/a n/a
IGH NO OFFICIAL BENCHMARK n/a 10.78% n/a 10.85% n/a -8.24%IU NO OFFICIAL BENCHMARK n/a 12.24% n/a 13.08% n/a -6.56%W NO OFFICIAL BENCHMARK n/a 11.35% n/a 12.15% n/a -7.30%Threadneedle (Lux) - Global Multi Asset IncomeAE US 3 Month Libor 0.66% -6.12% 2.39% 16.37% 2.31% -3.91%AEC US 3 Month Libor 0.66% 0.64% 2.39% 10.88% 2.31% -11.21%AEH US 3 Month Libor 0.66% 0.61% 2.39% 10.90% 2.31% -11.18%AEP US 3 Month Libor 0.66% -6.12% 2.39% 16.38% 2.31% -3.88%AQ US 3 Month Libor Performance since launch
January 10, 2020 1.97% 1.86% n/a n/a n/a n/a
AQM US 3 Month Libor Performance since launch January 10, 2020
0.61% 1.81% n/a n/a n/a n/a
AS US 3 Month Libor Performance since launch June 22, 2018
0.66% 0.33% 2.39% 12.44% 1.30% -5.60%
ASC US 3 Month Libor Performance since launch June 27, 2018
0.66% 1.53% 2.39% 13.35% 1.27% -7.49%
ASH US 3 Month Libor Performance since launch June 27, 2018
0.66% 1.46% 2.39% 13.35% 1.27% -6.10%
ASP US 3 Month Libor Performance since launch June 22, 2018
0.66% 0.57% 2.39% 12.74% 1.30% -5.59%
AU US 3 Month Libor 0.66% 2.33% 2.39% 14.27% 2.31% -8.48%AUM US 3 Month Libor Performance since launch
September 6, 2019 0.66% 2.32% 0.63% 4.50% n/a n/a
AUP US 3 Month Libor 0.66% 2.33% 2.39% 14.30% 2.31% -8.53%DEC US 3 Month Libor 0.66% -0.14% 2.39% 9.99% 2.31% -11.78%DEH US 3 Month Libor 0.66% -0.14% 2.39% 10.11% 2.31% -11.85%DEP US 3 Month Libor 0.66% -6.82% 2.39% 15.56% 2.31% -4.65%DU US 3 Month Libor 0.66% 1.56% 2.39% 13.45% 2.31% -9.21%DUP US 3 Month Libor 0.66% 1.56% 2.39% 13.50% 2.31% -9.22%ZE US 3 Month Libor 0.66% -5.65% 2.39% 17.04% 2.31% -3.40%ZEC US 3 Month Libor Performance since launch
May 25, 2018 0.66% 1.08% 2.39% 11.39% 1.48% -7.79%
ZEH US 3 Month Libor 0.66% 1.11% 2.39% 11.40% 2.31% -10.81%ZFH US 3 Month Libor Performance since launch
June 29, 2018 0.66% 0.89% 2.39% 10.95% 1.26% -6.30%
ZU US 3 Month Libor 0.66% 2.84% 2.39% 14.90% 2.31% -8.04%ZUP US 3 Month Libor Performance since launch
August 1, 2018 0.66% 2.72% 2.39% 14.79% 1.05% -7.64%
Note: Total performance is historical and is not a guarantee of future results. The net asset value of shares classes may go up or down. Performance is net of all applicable fees as well as distributions made during the calendar year ended December 31, 2020 (but does not reflect a sales charge as stated in the note 5 to the financial statements). The performance is different across share classes depending on applicable asset management and shareholder servicing fees as disclosed in the note 5 to the financial statements. In addition, currency fluctuations may also affect performance depending on the currency of denomination of the share class and the base currency of the Portfolio. The returns are stated in the currency in which the portfolios are denominated.
*See note 1.
Share Class Performance (unaudited)(continued)
369
Threadneedle (Lux) Annual Report and Audited Financial Statements March 2021
Share Class Benchmark Name Comments
December 31, 2020 December 31, 2019 December 31, 2018
AEH MSCI Emerging Markets Performance since launch September 24, 2020
20.31% 29.65% n/a n/a n/a n/a
AU MSCI Emerging Markets Performance since launch September 24, 2020
20.31% 30.12% n/a n/a n/a n/a
AUP MSCI Emerging Markets Performance since launch September 24, 2020
20.31% 30.12% n/a n/a n/a n/a
IE MSCI Emerging Markets Performance since launch September 24, 2020
20.31% 24.47% n/a n/a n/a n/a
IEH MSCI Emerging Markets Performance since launch September 24, 2020
20.31% 29.96% n/a n/a n/a n/a
IG MSCI Emerging Markets Performance since launch September 24, 2020
20.31% 21.79% n/a n/a n/a n/a
IU MSCI Emerging Markets Performance since launch September 24, 2020
20.31% 30.48% n/a n/a n/a n/a
LE MSCI Emerging Markets Performance since launch September 24, 2020
20.31% 24.58% n/a n/a n/a n/a
LG MSCI Emerging Markets Performance since launch September 24, 2020
20.31% 21.90% n/a n/a n/a n/a
XU MSCI Emerging Markets Performance since launch September 24, 2020
20.31% 30.71% n/a n/a n/a n/a
ZE MSCI Emerging Markets Performance since launch September 24, 2020
20.31% 24.40% n/a n/a n/a n/a
ZEC MSCI Emerging Markets Performance since launch September 24, 2020
20.31% 29.89% n/a n/a n/a n/a
ZEH MSCI Emerging Markets Performance since launch September 24, 2020
20.31% 29.89% n/a n/a n/a n/a
ZU MSCI Emerging Markets Performance since launch September 24, 2020
20.31% 30.39% n/a n/a n/a n/a
ZUP MSCI Emerging Markets Performance since launch September 24, 2020
20.31% 30.38% n/a n/a n/a n/a
Threadneedle (Lux) - Global FocusAEH MSCI AC World 16.82% 24.63% 27.30% 29.89% -8.93% -4.85%AEP MSCI AC World 16.82% 16.31% 27.30% 36.40% -8.93% 2.91%AU MSCI AC World 16.82% 26.78% 27.30% 33.90% -8.93% -2.03%AUP MSCI AC World Performance since launch
June 22, 2018 16.82% 26.78% 27.30% 33.86% -9.48% -8.07%
DEH MSCI AC World 16.82% 23.70% 27.30% 28.94% -8.93% -5.57%DU MSCI AC World 16.82% 25.84% 27.30% 32.90% -8.93% -2.79%IE MSCI AC World 16.82% 17.30% 27.30% 37.49% -8.93% 3.77%IEH MSCI AC World Performance since launch
June 27, 2018 16.82% 25.69% 27.30% 31.69% -8.71% -7.80%
IU MSCI AC World 16.82% 27.86% 27.30% 35.01% -8.93% -1.23%IUP MSCI AC World Performance since launch
June 22, 2018 16.82% 27.82% 27.30% 34.94% -9.48% -7.67%
W MSCI AC World 16.82% 26.85% 27.30% 33.96% -8.93% -1.98%XU MSCI AC World 16.82% 28.89% 27.30% 36.15% -8.93% -0.39%
Note: Total performance is historical and is not a guarantee of future results. The net asset value of shares classes may go up or down. Performance is net of all applicable fees as well as distributions made during the calendar year ended December 31, 2020 (but does not reflect a sales charge as stated in the note 5 to the financial statements). The performance is different across share classes depending on applicable asset management and shareholder servicing fees as disclosed in the note 5 to the financial statements. In addition, currency fluctuations may also affect performance depending on the currency of denomination of the share class and the base currency of the Portfolio. The returns are stated in the currency in which the portfolios are denominated.
*See note 1.
Share Class Performance (unaudited)(continued)
370
Threadneedle (Lux) Annual Report and Audited Financial Statements March 2021
Share Class Benchmark Name Comments
December 31, 2020 December 31, 2019 December 31, 2018
BenchmarkPortfolio
Return BenchmarkPortfolio
Return BenchmarkPortfolio
Return
Threadneedle (Lux) - Global Focus(continued)ZE MSCI AC World 16.82% 17.19% 27.30% 37.44% -8.93% 3.68%ZEH MSCI AC World Performance since launch
September 16, 2020 12.83% 9.88% n/a n/a n/a n/a
ZEP MSCI AC World 16.82% 17.19% 27.30% 37.42% -8.93% 3.70%ZFH MSCI AC World Performance since launch
ZU MSCI Emerging Markets 18.69% 34.80% 18.88% 31.40% -14.24% -20.02%1E MSCI Emerging Markets Performance since launch
November 26, 2018 18.69% 22.86% 18.88% 32.53% 0.00% -0.94%
1U MSCI Emerging Markets Performance since launch November 26, 2018
18.69% 33.92% 18.88% 30.89% 0.00% -0.77%
2E MSCI Emerging Markets Performance since launch November 24, 2018
18.69% 23.61% 18.88% 33.89% 0.00% -1.30%
2U MSCI Emerging Markets Performance since launch November 24, 2018
18.69% 34.80% 18.88% 31.49% 0.00% -0.50%
8E MSCI Emerging Markets Performance since launch November 26, 2018
18.69% 23.56% 18.88% 34.03% 0.00% -1.44%
8U MSCI Emerging Markets Performance since launch November 26, 2018
18.69% 34.69% 18.88% 31.50% 0.00% -0.60%
Threadneedle (Lux) - Global Equity IncomeAEC MSCI AC World Performance since launch
October 24, 2018 16.82% 1.52% 27.30% 18.13% -6.12% -7.40%
AUP MSCI AC World Performance since launch October 24, 2018
16.82% 3.23% 27.30% 21.98% -6.12% -6.37%
DEC MSCI AC World Performance since launch October 24, 2018
16.82% 0.97% 27.30% 17.54% -6.12% -7.40%
DUP MSCI AC World Performance since launch October 24, 2018
16.82% 2.71% 27.30% 21.13% -6.12% -6.37%
IU MSCI AC World Performance since launch October 24, 2018
16.82% 4.09% 27.30% 22.87% -6.12% -6.20%
TE MSCI AC World Performance since launch October 24, 2018
16.82% -4.66% 27.30% 25.08% -6.12% -6.00%
ZU MSCI AC World Performance since launch October 24, 2018
16.82% 4.02% 27.30% 22.82% -6.12% -6.20%
Note: Total performance is historical and is not a guarantee of future results. The net asset value of shares classes may go up or down. Performance is net of all applicable fees as well as distributions made during the calendar year ended December 31, 2020 (but does not reflect a sales charge as stated in the note 5 to the financial statements). The performance is different across share classes depending on applicable asset management and shareholder servicing fees as disclosed in the note 5 to the financial statements. In addition, currency fluctuations may also affect performance depending on the currency of denomination of the share class and the base currency of the Portfolio. The returns are stated in the currency in which the portfolios are denominated.
Share Class Performance (unaudited)(continued)
371
Threadneedle (Lux) Annual Report and Audited Financial Statements March 2021
Share Class Benchmark Name Comments
December 31, 2020 December 31, 2019 December 31, 2018
BenchmarkPortfolio
Return BenchmarkPortfolio
Return BenchmarkPortfolio
Return
Threadneedle (Lux) - Global Equity Income(continued)1E MSCI AC World Performance since launch
October 24, 2018 16.82% -5.14% 27.30% 24.34% -6.12% -6.10%
1EP MSCI AC World Performance since launch October 24, 2018
16.82% -5.14% 27.30% 24.27% -6.12% -6.05%
1SC MSCI AC World Performance since launch October 24, 2018
16.82% 2.22% 27.30% 20.86% -6.12% -6.46%
1SH MSCI AC World Performance since launch October 24, 2018
16.82% 2.18% 27.30% 21.00% -6.12% -6.50%
1ST MSCI AC World Performance since launch October 24, 2018
16.82% 2.19% 27.30% 20.88% -6.12% -6.46%
1U MSCI AC World Performance since launch October 24, 2018
16.82% 3.40% 27.30% 22.09% -6.12% -6.30%
1UP MSCI AC World Performance since launch October 24, 2018
16.82% 3.40% 27.30% 22.01% -6.12% -6.25%
1VT MSCI AC World Performance since launch October 24, 2018
16.82% 0.40% 27.30% 20.44% -6.12% -6.55%
2E MSCI AC World Performance since launch October 24, 2018
16.82% -4.56% 27.30% 25.02% -6.12% -4.20%
2EP MSCI AC World Performance since launch October 24, 2018
16.82% -4.53% 27.30% 25.09% -6.12% -5.98%
2U MSCI AC World Performance since launch October 24, 2018
16.82% 4.04% 27.30% 22.81% -6.12% -6.20%
2UP MSCI AC World Performance since launch October 24, 2018
16.82% 4.03% 27.30% 22.76% -6.12% -6.15%
3E MSCI AC World Performance since launch October 24, 2018
16.82% -4.43% 27.30% 25.19% -6.12% -5.90%
3EP MSCI AC World Performance since launch October 24, 2018
16.82% -4.42% 27.30% 25.28% -6.12% -5.96%
3U MSCI AC World Performance since launch October 24, 2018
16.82% 4.18% 27.30% 23.04% -6.12% -6.20%
3UP MSCI AC World Performance since launch October 24, 2018
16.82% 4.18% 27.30% 22.97% -6.12% -6.16%
8E MSCI AC World Performance since launch October 24, 2018
16.82% -4.60% 27.30% 25.00% -6.12% -6.00%
8EP MSCI AC World Performance since launch October 24, 2018
16.82% -4.63% 27.30% 24.97% -6.12% -5.91%
8U MSCI AC World Performance since launch October 24, 2018
16.82% 3.99% 27.30% 22.76% -6.12% -6.20%
8UP MSCI AC World Performance since launch October 24, 2018
16.82% 3.99% 27.30% 22.71% -6.12% -6.15%
9E MSCI AC World Performance since launch October 24, 2018
16.82% -4.33% 27.30% 25.36% -6.12% -5.90%
9EP MSCI AC World Performance since launch October 24, 2018
16.82% -4.31% 27.30% 25.41% -6.12% -5.86%
9U MSCI AC World Performance since launch October 24, 2018
16.82% 4.33% 27.30% 23.25% -6.12% -6.20%
9UP MSCI AC World Performance since launch October 24, 2018
16.82% 4.27% 27.30% 23.19% -6.12% -6.17%
Note: Total performance is historical and is not a guarantee of future results. The net asset value of shares classes may go up or down. Performance is net of all applicable fees as well as distributions made during the calendar year ended December 31, 2020 (but does not reflect a sales charge as stated in the note 5 to the financial statements). The performance is different across share classes depending on applicable asset management and shareholder servicing fees as disclosed in the note 5 to the financial statements. In addition, currency fluctuations may also affect performance depending on the currency of denomination of the share class and the base currency of the Portfolio. The returns are stated in the currency in which the portfolios are denominated.
Share Class Performance (unaudited)(continued)
372
Threadneedle (Lux) Annual Report and Audited Financial Statements March 2021
Share Class Benchmark Name Comments
December 31, 2020 December 31, 2019 December 31, 2018
BenchmarkPortfolio
Return BenchmarkPortfolio
Return BenchmarkPortfolio
Return
Threadneedle (Lux) - Global SelectIU MSCI AC World Performance since launch
January 26, 2019 16.82% 21.20% 19.61% 24.55% n/a n/a
ZU MSCI AC World Performance since launch January 26, 2019
16.82% 21.08% 19.61% 24.48% n/a n/a
1E MSCI AC World Performance since launch January 28, 2019
16.82% 10.40% 19.61% 25.50% n/a n/a
1U MSCI AC World Performance since launch January 28, 2019
16.82% 20.34% 19.61% 23.81% n/a n/a
2E MSCI AC World Performance since launch January 26, 2019
16.82% 11.10% 19.61% 24.60% n/a n/a
2U MSCI AC World Performance since launch January 26, 2019
16.82% 21.07% 19.61% 24.47% n/a n/a
3U MSCI AC World Performance since launch January 28, 2019
16.82% 21.28% 19.61% 24.52% n/a n/a
8E MSCI AC World Performance since launch January 28, 2019
16.82% 11.03% 19.61% 26.25% n/a n/a
8U MSCI AC World Performance since launch January 28, 2019
16.82% 21.03% 19.61% 24.54% n/a n/a
9U MSCI AC World Performance since launch January 26, 2019
16.82% 21.33% 19.61% 24.70% n/a n/a
Threadneedle (Lux) - Global Smaller CompaniesAE MSCI World Small Cap 6.85% 27.53% 29.12% 38.43% -9.12% -3.14%AEP MSCI World Small Cap Performance since launch
August 1, 2018 6.85% 27.53% 29.12% 38.50% -15.03% -13.70%
AK MSCI World Small Cap Performance since launch January 10, 2020
5.98% 19.04% n/a n/a n/a n/a
AUP MSCI World Small Cap Performance since launch June 13, 2018
6.85% 39.00% 29.12% 35.77% -15.82% -15.80%
DE MSCI World Small Cap 6.85% 26.89% 29.12% 37.71% -9.12% -3.61%IE MSCI World Small Cap 6.85% 28.62% 29.12% 39.61% -9.12% -2.33%IEP MSCI World Small Cap Performance since launch
July 29, 2020 22.69% 25.47% n/a n/a n/a n/a
NE MSCI World Small Cap Performance since launch July 3, 2019
6.85% 28.88% 9.42% 11.22% n/a n/a
XE MSCI World Small Cap Performance since launch May 23, 2018
6.85% 29.65% 29.12% 40.80% -14.24% -9.60%
XFH MSCI World Small Cap Performance since launch November 11, 2020
8.50% 9.06% n/a n/a n/a n/a
XG MSCI World Small Cap Performance since launch May 23, 2018
6.85% 36.89% 29.12% 32.70% -14.24% -7.50%
XGH MSCI World Small Cap 6.85% 28.85% 29.12% 42.02% -9.12% -0.89%XU MSCI World Small Cap Performance since launch
November 11, 2020 8.50% 12.89% n/a n/a n/a n/a
ZE MSCI World Small Cap Performance since launch May 23, 2018
6.85% 28.49% 29.12% 39.43% -14.24% -10.10%
ZFH MSCI World Small Cap Performance since launch May 25, 2018
6.85% 28.16% 29.12% 38.92% -14.41% -10.60%
ZG MSCI World Small Cap Performance since launch May 23, 2018
6.85% 35.73% 29.12% 31.71% -14.24% -8.10%
ZGH MSCI World Small Cap 6.85% 27.70% 29.12% 40.75% -9.12% -1.66%
Note: Total performance is historical and is not a guarantee of future results. The net asset value of shares classes may go up or down. Performance is net of all applicable fees as well as distributions made during the calendar year ended December 31, 2020 (but does not reflect a sales charge as stated in the note 5 to the financial statements). The performance is different across share classes depending on applicable asset management and shareholder servicing fees as disclosed in the note 5 to the financial statements. In addition, currency fluctuations may also affect performance depending on the currency of denomination of the share class and the base currency of the Portfolio. The returns are stated in the currency in which the portfolios are denominated.
Share Class Performance (unaudited)(continued)
373
Threadneedle (Lux) Annual Report and Audited Financial Statements March 2021
Share Class Benchmark Name Comments
December 31, 2020 December 31, 2019 December 31, 2018
BenchmarkPortfolio
Return BenchmarkPortfolio
Return BenchmarkPortfolio
Return
Threadneedle (Lux) - Global Smaller Companies(continued)ZU MSCI World Small Cap Performance since launch
May 23, 2018 6.85% 40.06% 29.12% 36.82% -14.24% -12.80%
AU S&P 500 18.40% 24.22% 31.49% 32.67% -4.38% -7.36%
Note: Total performance is historical and is not a guarantee of future results. The net asset value of shares classes may go up or down. Performance is net of all applicable fees as well as distributions made during the calendar year ended December 31, 2020 (but does not reflect a sales charge as stated in the note 5 to the financial statements). The performance is different across share classes depending on applicable asset management and shareholder servicing fees as disclosed in the note 5 to the financial statements. In addition, currency fluctuations may also affect performance depending on the currency of denomination of the share class and the base currency of the Portfolio. The returns are stated in the currency in which the portfolios are denominated.
Share Class Performance (unaudited)(continued)
374
Threadneedle (Lux) Annual Report and Audited Financial Statements March 2021
Share Class Benchmark Name Comments
December 31, 2020 December 31, 2019 December 31, 2018
W S&P 500 18.40% 24.28% 31.49% 32.76% -4.38% -7.34%ZEH S&P 500 Performance since launch
June 15, 2018 18.40% 23.14% 31.49% 29.68% -8.95% -12.90%
ZU S&P 500 Performance since launch June 20, 2018
18.40% 25.09% 31.49% 33.67% -8.95% -11.59%
1E S&P 500 Performance since launch November 12, 2018
18.40% 14.11% 31.49% 35.39% -9.57% -10.38%
1EH S&P 500 Performance since launch November 12, 2018
18.40% 22.39% 31.49% 28.63% -9.57% -10.07%
1EP S&P 500 Performance since launch November 12, 2018
18.40% 14.11% 31.49% 35.33% -9.57% -10.33%
1U S&P 500 Performance since launch November 12, 2018
18.40% 24.38% 31.49% 32.98% -9.57% -9.79%
2EH S&P 500 Performance since launch November 10, 2018
18.40% 23.19% 31.49% 29.56% -9.57% -10.00%
2U S&P 500 Performance since launch November 10, 2018
18.40% 25.16% 31.49% 33.57% -9.57% -9.60%
3E S&P 500 Performance since launch November 12, 2018
18.40% 15.02% 31.49% 36.21% -9.57% -10.10%
3U S&P 500 Performance since launch November 12, 2018
18.40% 25.37% 31.49% 33.71% -9.57% -9.46%
8EH S&P 500 Performance since launch November 12, 2018
18.40% 23.12% 31.49% 29.78% -9.57% -10.26%
8U S&P 500 Performance since launch November 12, 2018
18.40% 25.09% 31.49% 33.63% -9.57% -9.64%
9E S&P 500 Performance since launch November 10, 2018
18.40% 15.12% 31.49% 36.42% -9.57% -10.20%
9U S&P 500 Performance since launch November 10, 2018
18.40% 25.46% 31.49% 34.01% -9.57% -9.60%
Threadneedle (Lux) - American Smaller CompaniesAEH Russell 2500 Performance since launch
October 24, 2018 19.99% 28.44% 27.77% 26.00% -10.08% -11.30%
AU Russell 2500 Performance since launch October 24, 2018
19.99% 30.64% 27.77% 30.06% -10.08% -10.80%
DEH Russell 2500 Performance since launch October 24, 2018
19.99% 27.81% 27.77% 25.40% -10.08% -11.40%
DU Russell 2500 Performance since launch October 24, 2018
19.99% 30.06% 27.77% 29.42% -10.08% -10.90%
IE Russell 2500 Performance since launch June 26, 2019
19.99% 20.86% 9.14% 8.53% n/a n/a
Note: Total performance is historical and is not a guarantee of future results. The net asset value of shares classes may go up or down. Performance is net of all applicable fees as well as distributions made during the calendar year ended December 31, 2020 (but does not reflect a sales charge as stated in the note 5 to the financial statements). The performance is different across share classes depending on applicable asset management and shareholder servicing fees as disclosed in the note 5 to the financial statements. In addition, currency fluctuations may also affect performance depending on the currency of denomination of the share class and the base currency of the Portfolio. The returns are stated in the currency in which the portfolios are denominated.
Share Class Performance (unaudited)(continued)
375
Threadneedle (Lux) Annual Report and Audited Financial Statements March 2021
Share Class Benchmark Name Comments
December 31, 2020 December 31, 2019 December 31, 2018
BenchmarkPortfolio
Return BenchmarkPortfolio
Return BenchmarkPortfolio
Return
Threadneedle (Lux) - American Smaller Companies(continued)IU Russell 2500 Performance since launch
October 24, 2018 19.99% 31.79% 27.77% 31.07% -10.08% -10.60%
ZU Russell 2500 Performance since launch October 24, 2018
19.99% 31.71% 27.77% 31.12% -10.08% -10.70%
1E Russell 2500 Performance since launch October 24, 2018
19.99% 20.05% 27.77% 32.57% -10.08% -10.40%
1EP Russell 2500 Performance since launch October 24, 2018
19.99% 20.06% 27.77% 32.70% -10.08% -10.60%
1U Russell 2500 Performance since launch October 24, 2018
19.99% 30.86% 27.77% 30.30% -10.08% -10.80%
2U Russell 2500 Performance since launch October 24, 2018
19.99% 31.66% 27.77% 30.96% -10.08% -10.60%
3EH Russell 2500 Performance since launch October 24, 2018
19.99% 29.63% 27.77% 27.18% -10.08% -11.20%
3U Russell 2500 Performance since launch October 24, 2018
19.99% 31.84% 27.77% 31.15% -10.08% -10.60%
8U Russell 2500 Performance since launch October 24, 2018
19.99% 31.61% 27.77% 30.96% -10.08% -10.60%
9EH Russell 2500 Performance since launch October 24, 2018
19.99% 29.69% 27.77% 27.31% -10.08% -11.10%
9U Russell 2500 Performance since launch October 24, 2018
19.99% 31.89% 27.77% 31.25% -10.08% -10.60%
Threadneedle (Lux) - Asia Contrarian EquityAE MSCI AC Asia Pacific ex Japan 22.75% 13.91% 19.48% 24.85% -13.68% -15.27%AF MSCI AC Asia Pacific ex Japan 22.75% 13.34% 19.48% 20.39% -13.68% -18.42%AS MSCI AC Asia Pacific ex Japan 22.75% 21.97% 19.48% 20.69% -13.68% -17.75%ASH MSCI AC Asia Pacific ex Japan 22.75% 22.68% 19.48% 21.25% -13.68% -20.33%AU MSCI AC Asia Pacific ex Japan 22.75% 24.14% 19.48% 22.53% -13.68% -19.31%DE MSCI AC Asia Pacific ex Japan 22.75% 13.04% 19.48% 23.87% -13.68% -15.92%IF MSCI AC Asia Pacific ex Japan 22.75% 14.26% 19.48% 21.41% -13.68% -17.81%ISH MSCI AC Asia Pacific ex Japan 22.75% 23.72% 19.48% 22.24% -13.68% -19.69%IU MSCI AC Asia Pacific ex Japan 22.75% 25.20% 19.48% 23.64% -13.68% -18.69%XU MSCI AC Asia Pacific ex Japan Performance since launch
May 17, 2019 22.75% 26.21% 10.94% 12.45% n/a n/a
XUP MSCI AC Asia Pacific ex Japan 22.75% 26.21% 19.48% 24.64% -13.68% -18.02%ZE MSCI AC Asia Pacific ex Japan 22.75% 14.75% 19.48% 25.78% -13.68% -14.66%ZEH MSCI AC Asia Pacific ex Japan 22.75% 22.88% 19.48% 19.64% -13.68% -21.25%ZF MSCI AC Asia Pacific ex Japan 22.75% 14.21% 19.48% 21.33% -13.68% -17.85%ZG MSCI AC Asia Pacific ex Japan Performance since launch
June 13, 2018 22.75% 21.19% 19.48% 18.76% -15.26% -19.10%
ZU MSCI AC Asia Pacific ex Japan 22.75% 25.08% 19.48% 23.46% -13.68% -18.74%Threadneedle (Lux) - Asia EquitiesIE MSCI AC Asia Pacific ex Japan Performance since launch
June 26, 2019 22.75% 17.53% 6.89% 13.26% n/a n/a
IU MSCI AC Asia Pacific ex Japan Performance since launch January 26, 2019
22.75% 28.11% 12.84% 19.48% n/a n/a
ZU MSCI AC Asia Pacific ex Japan Performance since launch January 26, 2019
22.75% 27.99% 12.84% 19.41% n/a n/a
Note: Total performance is historical and is not a guarantee of future results. The net asset value of shares classes may go up or down. Performance is net of all applicable fees as well as distributions made during the calendar year ended December 31, 2020 (but does not reflect a sales charge as stated in the note 5 to the financial statements). The performance is different across share classes depending on applicable asset management and shareholder servicing fees as disclosed in the note 5 to the financial statements. In addition, currency fluctuations may also affect performance depending on the currency of denomination of the share class and the base currency of the Portfolio. The returns are stated in the currency in which the portfolios are denominated.
Share Class Performance (unaudited)(continued)
376
Threadneedle (Lux) Annual Report and Audited Financial Statements March 2021
Share Class Benchmark Name Comments
December 31, 2020 December 31, 2019 December 31, 2018
BenchmarkPortfolio
Return BenchmarkPortfolio
Return BenchmarkPortfolio
Return
Threadneedle (Lux) - Asia Equities(continued)1E MSCI AC Asia Pacific ex Japan Performance since launch
January 28, 2019 22.75% 16.65% 12.84% 20.60% n/a n/a
1U MSCI AC Asia Pacific ex Japan Performance since launch January 28, 2019
22.75% 27.15% 12.84% 18.94% n/a n/a
2E MSCI AC Asia Pacific ex Japan Performance since launch January 26, 2019
22.75% 17.36% 12.84% 21.27% n/a n/a
2U MSCI AC Asia Pacific ex Japan Performance since launch January 26, 2019
22.75% 27.93% 12.84% 19.43% n/a n/a
3U MSCI AC Asia Pacific ex Japan Performance since launch January 28, 2019
22.75% 28.11% 12.84% 19.53% n/a n/a
8E MSCI AC Asia Pacific ex Japan Performance since launch January 28, 2019
22.75% 17.25% 12.84% 21.04% n/a n/a
8U MSCI AC Asia Pacific ex Japan Performance since launch January 28, 2019
22.75% 27.88% 12.84% 19.43% n/a n/a
9U MSCI AC Asia Pacific ex Japan Performance since launch January 26, 2019
IU S&P 500 18.40% 8.35% 31.49% 24.07% -4.38% -3.79%
Note: Total performance is historical and is not a guarantee of future results. The net asset value of shares classes may go up or down. Performance is net of all applicable fees as well as distributions made during the calendar year ended December 31, 2020 (but does not reflect a sales charge as stated in the note 5 to the financial statements). The performance is different across share classes depending on applicable asset management and shareholder servicing fees as disclosed in the note 5 to the financial statements. In addition, currency fluctuations may also affect performance depending on the currency of denomination of the share class and the base currency of the Portfolio. The returns are stated in the currency in which the portfolios are denominated.
Share Class Performance (unaudited)(continued)
377
Threadneedle (Lux) Annual Report and Audited Financial Statements March 2021
Share Class Benchmark Name Comments
December 31, 2020 December 31, 2019 December 31, 2018
BenchmarkPortfolio
Return BenchmarkPortfolio
Return BenchmarkPortfolio
Return
Threadneedle (Lux) - US Disciplined Core Equities(continued)NE S&P 500 Performance since launch
September 18, 2020 12.39% 7.24% n/a n/a n/a n/a
NG S&P 500 Performance since launch September 18, 2020
12.39% 5.28% n/a n/a n/a n/a
NU S&P 500 Performance since launch September 18, 2020
12.39% 11.13% n/a n/a n/a n/a
XG S&P 500 Performance since launch May 20, 2020
29.86% 5.63% n/a n/a n/a n/a
ZEH S&P 500 18.40% 6.44% 31.49% 20.21% -4.38% -6.77%ZFH S&P 500 18.40% 6.24% 31.49% 19.88% -4.38% -7.14%ZU S&P 500 18.40% 8.24% 31.49% 23.98% -4.38% -3.96%Threadneedle (Lux) - Pan European ESG Equities*AE MSCI Europe -2.82% 6.41% 26.88% 31.29% -10.00% -15.66%ASH MSCI Europe -2.82% 6.82% 26.88% 33.85% -10.00% -14.18%AUH MSCI Europe -2.82% 7.77% 26.88% 35.07% -10.00% -13.57%DE MSCI Europe -2.82% 6.08% 26.88% 30.85% -10.00% -15.98%IE MSCI Europe -2.82% 7.29% 26.88% 32.39% -10.00% -14.93%W MSCI Europe -2.82% 6.40% 26.88% 31.36% -10.00% -15.61%XE MSCI Europe -2.82% 8.12% 26.88% 33.46% -10.00% -14.23%ZUH MSCI Europe -2.82% 8.53% 26.88% 36.01% -10.00% -12.93%1E MSCI Europe Performance since launch
August 30, 2018 -2.82% 6.47% 26.88% 31.39% -11.82% -17.50%
1EP MSCI Europe Performance since launch August 30, 2018
-2.82% 6.41% 26.88% 31.26% -11.82% -17.50%
1G MSCI Europe Performance since launch August 30, 2018
-2.82% 12.48% 26.88% 24.03% -11.82% -17.70%
1GP MSCI Europe Performance since launch August 30, 2018
-2.82% 12.43% 26.88% 23.95% -11.82% -17.70%
2E MSCI Europe Performance since launch August 30, 2018
-2.82% 7.11% 26.88% 32.24% -11.82% -17.30%
2G MSCI Europe Performance since launch August 30, 2018
-2.82% 13.15% 26.88% 24.82% -11.82% -17.50%
2U MSCI Europe Performance since launch August 30, 2018
-2.82% 16.81% 26.88% 29.92% -11.82% -19.10%
3E MSCI Europe Performance since launch August 30, 2018
-2.82% 7.26% 26.88% 32.47% -11.82% -17.30%
3G MSCI Europe Performance since launch August 30, 2018
-2.82% 13.31% 26.88% 25.05% -11.82% -17.50%
3GP MSCI Europe Performance since launch August 30, 2018
-2.82% 13.26% 26.88% 24.98% -11.82% -17.50%
4E MSCI Europe Performance since launch August 30, 2018
-2.82% 8.19% 26.88% 33.53% -11.82% -17.00%
4G MSCI Europe Performance since launch August 30, 2018
-2.82% 14.32% 26.88% 26.13% -11.82% -17.20%
8E MSCI Europe Performance since launch August 30, 2018
-2.82% 7.07% 26.88% 32.11% -11.82% -17.30%
Note: Total performance is historical and is not a guarantee of future results. The net asset value of shares classes may go up or down. Performance is net of all applicable fees as well as distributions made during the calendar year ended December 31, 2020 (but does not reflect a sales charge as stated in the note 5 to the financial statements). The performance is different across share classes depending on applicable asset management and shareholder servicing fees as disclosed in the note 5 to the financial statements. In addition, currency fluctuations may also affect performance depending on the currency of denomination of the share class and the base currency of the Portfolio. The returns are stated in the currency in which the portfolios are denominated.
*See note 1.
Share Class Performance (unaudited)(continued)
378
Threadneedle (Lux) Annual Report and Audited Financial Statements March 2021
Share Class Benchmark Name Comments
December 31, 2020 December 31, 2019 December 31, 2018
BenchmarkPortfolio
Return BenchmarkPortfolio
Return BenchmarkPortfolio
Return
Threadneedle (Lux) - Pan European ESG Equities*(continued)8G MSCI Europe Performance since launch
August 30, 2018 -2.82% 13.11% 26.88% 24.76% -11.82% -17.50%
8U MSCI Europe Performance since launch August 30, 2018
-2.82% 16.78% 26.88% 29.89% -11.82% -19.20%
9E MSCI Europe Performance since launch August 30, 2018
-2.82% 7.45% 26.88% 32.57% -11.82% -17.20%
9G MSCI Europe Performance since launch August 30, 2018
-2.82% 13.41% 26.88% 25.21% -11.82% -17.40%
9GP MSCI Europe Performance since launch August 30, 2018
-2.82% 13.41% 26.88% 25.21% -11.82% -17.40%
Threadneedle (Lux) - Pan European Equity DividendAE MSCI Europe Performance since launch
October 6, 2018 -2.82% 0.02% 26.88% 24.76% -9.76% -9.40%
AEP MSCI Europe Performance since launch October 6, 2018
-2.82% 0.05% 26.88% 24.75% -9.76% -9.40%
AUP MSCI Europe Performance since launch November 14, 2018
-2.82% 8.99% 26.88% 22.51% -7.12% -5.90%
DE MSCI Europe Performance since launch October 6, 2018
-2.82% -0.35% 26.88% 24.33% -9.76% -9.50%
DEP MSCI Europe Performance since launch October 6, 2018
-2.82% -0.32% 26.88% 24.36% -9.76% -9.50%
IE MSCI Europe Performance since launch October 6, 2018
-2.82% 0.86% 26.88% 25.72% -9.76% -9.20%
IEP MSCI Europe Performance since launch October 6, 2018
-2.82% 0.89% 26.88% 25.72% -9.76% -9.20%
ZE MSCI Europe Performance since launch October 6, 2018
-2.82% 0.80% 26.88% 25.79% -9.76% -9.30%
ZEP MSCI Europe Performance since launch October 6, 2018
-2.82% 0.76% 26.88% 25.79% -9.76% -9.30%
1E MSCI Europe Performance since launch October 8, 2018
-2.82% 0.15% 26.88% 25.22% -9.76% 9.82%
1EP MSCI Europe Performance since launch October 8, 2018
-2.82% 0.15% 26.88% 24.77% -9.76% -9.09%
1G MSCI Europe Performance since launch October 8, 2018
-2.82% 5.79% 26.88% 18.14% -9.76% -7.69%
1GP MSCI Europe Performance since launch October 8, 2018
-2.82% 5.78% 26.88% 17.46% -9.76% -6.90%
2E MSCI Europe Performance since launch October 6, 2018
-2.82% 0.76% 26.88% 25.72% -9.76% -9.30%
2EP MSCI Europe Performance since launch October 6, 2018
-2.82% 0.78% 26.88% 25.73% -9.76% -9.30%
2G MSCI Europe Performance since launch October 6, 2018
-2.82% 6.50% 26.88% 18.76% -9.76% -7.50%
2GP MSCI Europe Performance since launch October 6, 2018
-2.82% 6.48% 26.88% 18.76% -9.76% -7.50%
3EP MSCI Europe Performance since launch October 8, 2018
-2.82% 0.90% 26.88% 25.82% -9.76% -9.49%
3G MSCI Europe Performance since launch October 8, 2018
-2.82% 6.59% 26.88% 19.07% -9.76% -7.41%
*See note 1.
Note: Total performance is historical and is not a guarantee of future results. The net asset value of shares classes may go up or down. Performance is net of all applicable fees as well as distributions made during the calendar year ended December 31, 2020 (but does not reflect a sales charge as stated in the note 5 to the financial statements). The performance is different across share classes depending on applicable asset management and shareholder servicing fees as disclosed in the note 5 to the financial statements. In addition, currency fluctuations may also affect performance depending on the currency of denomination of the share class and the base currency of the Portfolio. The returns are stated in the currency in which the portfolios are denominated.
Share Class Performance (unaudited)(continued)
379
Threadneedle (Lux) Annual Report and Audited Financial Statements March 2021
Share Class Benchmark Name Comments
December 31, 2020 December 31, 2019 December 31, 2018
BenchmarkPortfolio
Return BenchmarkPortfolio
Return BenchmarkPortfolio
Return
Threadneedle (Lux) - Pan European Equity Dividend(continued)3GP MSCI Europe Performance since launch
October 8, 2018 -2.82% 6.58% 26.88% 19.11% -9.76% -7.91%
4GP MSCI Europe Performance since launch October 8, 2018
-2.82% 7.50% 26.88% 20.56% -9.76% -7.56%
8E MSCI Europe Performance since launch October 8, 2018
-2.82% 0.72% 26.88% 25.58% -9.76% -9.09%
8EP MSCI Europe Performance since launch October 8, 2018
-2.82% 0.71% 26.88% 25.60% -9.76% -9.43%
8G MSCI Europe Performance since launch October 8, 2018
-2.82% 6.40% 26.88% 18.33% -9.76% -7.10%
8GP MSCI Europe Performance since launch October 8, 2018
-2.82% 6.38% 26.88% 18.82% -9.76% -7.53%
9EP MSCI Europe Performance since launch October 6, 2018
-2.82% 1.04% 26.88% 26.06% -9.76% -9.20%
9G MSCI Europe Performance since launch October 6, 2018
-2.82% 6.65% 26.88% 18.80% -9.76% -7.40%
9GP MSCI Europe Performance since launch October 6, 2018
-2.82% 6.69% 26.88% 18.85% -9.76% -7.40%
Threadneedle (Lux) - Pan European Small Cap OpportunitiesAE EMIX Smaller European Companies 7.78% 13.08% 29.30% 37.00% -14.05% -12.43%ASH EMIX Smaller European Companies 7.78% 13.61% 29.30% 39.80% -14.05% -10.92%AUH EMIX Smaller European Companies Performance since launch
July 4, 2018 7.78% 14.73% 29.30% 40.82% -15.00% 11.60%
DE EMIX Smaller European Companies 7.78% 12.07% 29.30% 35.76% -14.05% -13.22%DUH EMIX Smaller European Companies Performance since launch
July 4, 2018 7.78% 13.74% 29.30% 39.55% -15.00% 12.60%
IE EMIX Smaller European Companies 7.78% 13.93% 29.30% 38.01% -14.05% -11.75%W EMIX Smaller European Companies 7.78% 13.03% 29.30% 36.92% -14.05% -12.47%ZE EMIX Smaller European Companies Performance since launch
June 8, 2018 7.78% 13.93% 29.30% 38.01% -17.28% 13.60%
ZFH EMIX Smaller European Companies Performance since launch June 15, 2018
7.78% 13.72% 29.30% 37.40% -18.49% 14.60%
Threadneedle (Lux) - Pan European Smaller CompaniesIE EMIX Smaller European Companies Performance since launch
June 26, 2019 7.78% 9.80% 13.26% 13.84% n/a n/a
ZE EMIX Smaller European Companies Performance since launch August 30, 2018
7.78% 9.63% 29.30% 37.23% -16.04% -19.20%
1E EMIX Smaller European Companies Performance since launch August 30, 2018
7.78% 8.96% 29.30% 36.47% -16.04% -19.40%
1EP EMIX Smaller European Companies Performance since launch August 30, 2018
7.78% 8.96% 29.30% 36.46% -16.04% -19.40%
1FH EMIX Smaller European Companies Performance since launch August 30, 2018
7.78% 8.77% 29.30% 36.04% -16.04% -19.50%
1G EMIX Smaller European Companies Performance since launch August 30, 2018
7.78% 15.10% 29.30% 28.81% -16.04% -19.60%
1UH EMIX Smaller European Companies Performance since launch August 30, 2018
7.78% 10.56% 29.30% 40.45% -16.04% -18.80%
2E EMIX Smaller European Companies Performance since launch August 30, 2018
7.78% 9.67% 29.30% 37.30% -16.04% -19.20%
Note: Total performance is historical and is not a guarantee of future results. The net asset value of shares classes may go up or down. Performance is net of all applicable fees as well as distributions made during the calendar year ended December 31, 2020 (but does not reflect a sales charge as stated in the note 5 to the financial statements). The performance is different across share classes depending on applicable asset management and shareholder servicing fees as disclosed in the note 5 to the financial statements. In addition, currency fluctuations may also affect performance depending on the currency of denomination of the share class and the base currency of the Portfolio. The returns are stated in the currency in which the portfolios are denominated.
Share Class Performance (unaudited)(continued)
380
Threadneedle (Lux) Annual Report and Audited Financial Statements March 2021
Share Class Benchmark Name Comments
December 31, 2020 December 31, 2019 December 31, 2018
BenchmarkPortfolio
Return BenchmarkPortfolio
Return BenchmarkPortfolio
Return
Threadneedle (Lux) - Pan European Smaller Companies(continued)2G EMIX Smaller European Companies Performance since launch
August 30, 2018 7.78% 15.91% 29.30% 29.63% -16.04% -19.40%
3E EMIX Smaller European Companies Performance since launch August 30, 2018
7.78% 9.84% 29.30% 37.61% -16.04% -19.20%
3EP EMIX Smaller European Companies Performance since launch August 30, 2018
7.78% 9.84% 29.30% 37.56% -16.04% -19.20%
3FH EMIX Smaller European Companies Performance since launch August 30, 2018
7.78% 9.65% 29.30% 37.19% -16.04% -19.30%
3G EMIX Smaller European Companies Performance since launch August 30, 2018
7.78% 16.03% 29.30% 29.86% -16.04% -19.40%
3GP EMIX Smaller European Companies Performance since launch August 30, 2018
7.78% 16.02% 29.30% 29.85% -16.04% -19.24%
3UH EMIX Smaller European Companies Performance since launch August 30, 2018
7.78% 11.45% 29.30% 41.40% -16.04% -18.50%
4E EMIX Smaller European Companies Performance since launch August 30, 2018
7.78% 10.77% 29.30% 38.65% -16.04% -18.90%
4G EMIX Smaller European Companies Performance since launch August 30, 2018
7.78% 17.01% 29.30% 30.91% -16.04% -9.50%
8E EMIX Smaller European Companies Performance since launch August 30, 2018
7.78% 9.62% 29.30% 37.25% -16.04% -19.20%
8G EMIX Smaller European Companies Performance since launch August 30, 2018
7.78% 15.80% 29.30% 29.54% -16.04% -19.40%
9E EMIX Smaller European Companies Performance since launch August 30, 2018
7.78% 9.89% 29.30% 37.70% -16.04% -19.20%
9EP EMIX Smaller European Companies Performance since launch August 30, 2018
7.78% 9.99% 29.30% 37.79% -16.04% -19.20%
9FH EMIX Smaller European Companies Performance since launch August 30, 2018
7.78% 9.72% 29.30% 37.27% -16.04% -19.30%
9G EMIX Smaller European Companies Performance since launch August 30, 2018
7.78% 16.08% 29.30% 29.98% -16.04% -19.40%
9GP EMIX Smaller European Companies Performance since launch August 30, 2018
7.78% 16.16% 29.30% 29.98% -16.04% -19.14%
9UH EMIX Smaller European Companies Performance since launch August 30, 2018
7.78% 11.48% 29.30% 41.58% -16.04% -18.50%
Threadneedle (Lux) - European SelectAE FTSE World Europe ex UK 2.83% 8.47% 27.59% 32.63% -10.45% -11.91%AGH FTSE World Europe ex UK 2.83% 8.30% 27.59% 33.91% -10.45% -11.11%AUH FTSE World Europe ex UK 2.83% 9.89% 27.59% 36.39% -10.45% -9.63%DUH FTSE World Europe ex UK Performance since launch
June 27, 2018 2.83% 9.28% 27.59% 35.65% -8.90% -11.10%
IE FTSE World Europe ex UK 2.83% 9.40% 27.59% 33.76% -10.45% -11.14%ZG FTSE World Europe ex UK 2.83% 15.45% 27.59% 26.21% -10.45% -10.28%ZGH FTSE World Europe ex UK 2.83% 9.08% 27.59% 34.89% -10.45% -10.53%1E FTSE World Europe ex UK Performance since launch
October 17, 2018 2.83% 8.63% 27.59% 32.85% -7.23% -7.60%
1EP FTSE World Europe ex UK Performance since launch October 17, 2018
2.83% 8.63% 27.59% 32.84% -7.23% -7.60%
1SH FTSE World Europe ex UK Performance since launch October 17, 2018
2.83% 9.20% 27.59% 35.47% -7.23% -7.20%
Note: Total performance is historical and is not a guarantee of future results. The net asset value of shares classes may go up or down. Performance is net of all applicable fees as well as distributions made during the calendar year ended December 31, 2020 (but does not reflect a sales charge as stated in the note 5 to the financial statements). The performance is different across share classes depending on applicable asset management and shareholder servicing fees as disclosed in the note 5 to the financial statements. In addition, currency fluctuations may also affect performance depending on the currency of denomination of the share class and the base currency of the Portfolio. The returns are stated in the currency in which the portfolios are denominated.
Share Class Performance (unaudited)(continued)
381
Threadneedle (Lux) Annual Report and Audited Financial Statements March 2021
Share Class Benchmark Name Comments
December 31, 2020 December 31, 2019 December 31, 2018
BenchmarkPortfolio
Return BenchmarkPortfolio
Return BenchmarkPortfolio
Return
Threadneedle (Lux) - European Select(continued)1U FTSE World Europe ex UK Performance since launch
October 17, 2018 2.83% 18.41% 27.59% 30.47% -7.23% -8.80%
1UH FTSE World Europe ex UK Performance since launch October 17, 2018
2.83% 10.09% 27.59% 36.62% -7.23% -7.00%
2E FTSE World Europe ex UK Performance since launch October 17, 2018
2.83% 9.28% 27.59% 33.65% -7.23% -7.50%
2EP FTSE World Europe ex UK Performance since launch October 17, 2018
2.83% 9.35% 27.59% 33.70% -7.23% -7.50%
3E FTSE World Europe ex UK Performance since launch October 17, 2018
2.83% 9.47% 27.59% 33.80% -7.23% -7.40%
3U FTSE World Europe ex UK Performance since launch October 17, 2018
2.83% 19.33% 27.59% 31.38% -7.23% -8.60%
8E FTSE World Europe ex UK Performance since launch October 17, 2018
2.83% 9.23% 27.59% 33.59% -7.23% -7.50%
8EP FTSE World Europe ex UK Performance since launch October 17, 2018
2.83% 9.23% 27.59% 33.58% -7.23% -7.50%
9E FTSE World Europe ex UK Performance since launch October 17, 2018
2.83% 9.52% 27.59% 33.86% -7.23% -7.40%
9U FTSE World Europe ex UK Performance since launch October 17, 2018
2.83% 19.47% 27.59% 31.49% -7.23% -8.60%
Threadneedle (Lux) - European Smaller CompaniesIE EMIX Smaller European Companies ex UK Performance since launch
June 26, 2019 12.55% 14.97% 11.00% 9.26% n/a n/a
ZE EMIX Smaller European Companies ex UK Performance since launch October 24, 2018
12.55% 14.80% 27.77% 31.09% -6.13% -7.00%
1E EMIX Smaller European Companies ex UK Performance since launch October 24, 2018
12.55% 14.09% 27.77% 30.28% -6.13% -7.10%
1EP EMIX Smaller European Companies ex UK Performance since launch October 24, 2018
12.55% 14.09% 27.77% 30.28% -6.13% -7.10%
1FH EMIX Smaller European Companies ex UK Performance since launch October 24, 2018
12.55% 13.84% 27.77% 29.85% -6.13% -7.10%
2E EMIX Smaller European Companies ex UK Performance since launch October 24, 2018
12.55% 14.83% 27.77% 31.03% -6.13% -6.90%
3E EMIX Smaller European Companies ex UK Performance since launch October 24, 2018
12.55% 14.99% 27.77% 31.21% -6.13% -7.10%
3EP EMIX Smaller European Companies ex UK Performance since launch October 24, 2018
12.55% 14.99% 27.77% 31.23% -6.13% -6.90%
3FH EMIX Smaller European Companies ex UK Performance since launch October 24, 2018
12.55% 14.74% 27.77% 30.83% -6.13% -6.90%
8E EMIX Smaller European Companies ex UK Performance since launch October 24, 2018
12.55% 14.78% 27.77% 31.13% -6.13% -7.00%
9E EMIX Smaller European Companies ex UK Performance since launch October 24, 2018
12.55% 15.04% 27.77% 31.28% -6.13% -6.90%
9EP EMIX Smaller European Companies ex UK Performance since launch October 24, 2018
12.55% 15.04% 27.77% 31.35% -6.13% -6.90%
9FH EMIX Smaller European Companies ex UK Performance since launch October 24, 2018
12.55% 14.77% 27.77% 30.77% -6.13% -6.90%
Threadneedle (Lux) - Asian Equity IncomeAEH MSCI AC Asia Pacific ex Japan 22.75% 21.55% 19.48% 22.20% -13.68% -15.80%
Note: Total performance is historical and is not a guarantee of future results. The net asset value of shares classes may go up or down. Performance is net of all applicable fees as well as distributions made during the calendar year ended December 31, 2020 (but does not reflect a sales charge as stated in the note 5 to the financial statements). The performance is different across share classes depending on applicable asset management and shareholder servicing fees as disclosed in the note 5 to the financial statements. In addition, currency fluctuations may also affect performance depending on the currency of denomination of the share class and the base currency of the Portfolio. The returns are stated in the currency in which the portfolios are denominated.
Share Class Performance (unaudited)(continued)
382
Threadneedle (Lux) Annual Report and Audited Financial Statements March 2021
Share Class Benchmark Name Comments
December 31, 2020 December 31, 2019 December 31, 2018
BenchmarkPortfolio
Return BenchmarkPortfolio
Return BenchmarkPortfolio
Return
Threadneedle (Lux) - Asian Equity Income (continued)AU MSCI AC Asia Pacific ex Japan 22.75% 23.68% 19.48% 26.13% -13.68% -13.22%AUP MSCI AC Asia Pacific ex Japan 22.75% 23.68% 19.48% 26.13% -9.33% -13.25%DEH MSCI AC Asia Pacific ex Japan 22.75% 20.64% 19.48% 21.28% -13.68% -16.46%DU MSCI AC Asia Pacific ex Japan 22.75% 22.76% 19.48% 25.21% -13.68% -13.92%DUP MSCI AC Asia Pacific ex Japan 22.75% 22.76% 19.48% 25.15% -9.33% -13.88%IEP MSCI AC Asia Pacific ex Japan 22.75% 14.36% 19.48% 29.48% -9.33% -8.07%IU MSCI AC Asia Pacific ex Japan Performance since launch
November 27, 2019 22.75% 24.68% 5.07% 6.59% n/a n/a
W MSCI AC Asia Pacific ex Japan 22.75% 23.43% 19.48% 25.89% -13.68% -13.41%XU MSCI AC Asia Pacific ex Japan Performance since launch
May 17, 2019 22.75% 25.74% 10.94% 16.94% n/a n/a
XUP MSCI AC Asia Pacific ex Japan Performance since launch November 14, 2018
22.75% 25.74% 19.48% 28.27% -0.61% -1.50%
ZG MSCI AC Asia Pacific ex Japan Performance since launch August 1, 2018
22.75% 20.82% 19.48% 22.09% -11.05% -8.70%
ZGH MSCI AC Asia Pacific ex Japan 22.75% 21.94% 19.48% 24.37% -13.68% -14.40%ZGP MSCI AC Asia Pacific ex Japan Performance since launch
August 1, 2018 22.75% 20.76% 19.48% 22.11% -11.05% -8.70%
ZUP MSCI AC Asia Pacific ex Japan 22.75% 24.61% 19.48% 27.12% -13.68% -12.57%Threadneedle (Lux) - Global TechnologyAEH MSCI World - Information Technology 44.26% 40.63% 48.15% 48.44% -2.25% -12.49%AS MSCI World - Information Technology 44.26% 40.53% 48.15% 51.03% -2.25% -7.93%AU MSCI World - Information Technology 44.26% 42.98% 48.15% 53.08% -2.25% -9.66%AUP MSCI World - Information Technology Performance since launch
June 8, 2018 44.26% 42.98% 48.15% 53.09% -13.57% -17.90%
BU MSCI World - Information Technology 44.26% 42.41% 48.15% 52.46% -2.25% -10.02%DEH MSCI World - Information Technology Performance since launch
June 29, 2018 44.26% 40.18% 48.15% 48.06% -10.68% -15.30%
DU MSCI World - Information Technology 44.26% 42.48% 48.15% 52.54% -2.25% -9.99%IE MSCI World - Information Technology Performance since launch
January 10, 2020 40.01% 27.46% n/a n/a n/a n/a
IEH MSCI World - Information Technology 44.26% 41.91% 48.15% 49.71% -2.25% -11.54%IG MSCI World - Information Technology Performance since launch
June 8, 2018 44.26% 39.81% 48.15% 48.40% -13.57% -13.00%
IU MSCI World - Information Technology Performance since launch January 10, 2020
40.01% 40.48% n/a n/a n/a n/a
ZEH MSCI World - Information Technology Performance since launch June 15, 2018
44.26% 41.73% 48.15% 49.68% -14.42% -19.70%
ZFH MSCI World - Information Technology 44.26% 41.68% 48.15% 49.21% -2.25% -11.87%ZG MSCI World - Information Technology Performance since launch
June 8, 2018 44.26% 39.67% 48.15% 48.45% -13.57% -13.10%
ZU MSCI World - Information Technology 44.26% 44.12% 48.15% 54.29% -2.25% -8.92%Threadneedle (Lux) - UK EquitiesAE FTSE All Share Performance since launch
February 12, 2020 -9.32% -15.31% n/a n/a n/a n/a
AEH FTSE All Share -9.82% -11.08% 19.17% 20.61% -9.47% -13.97%AFH FTSE All Share -9.82% -11.06% 19.17% 20.15% -9.47% -14.27%
Note: Total performance is historical and is not a guarantee of future results. The net asset value of shares classes may go up or down. Performance is net of all applicable fees as well as distributions made during the calendar year ended December 31, 2020 (but does not reflect a sales charge as stated in the note 5 to the financial statements). The performance is different across share classes depending on applicable asset management and shareholder servicing fees as disclosed in the note 5 to the financial statements. In addition, currency fluctuations may also affect performance depending on the currency of denomination of the share class and the base currency of the Portfolio. The returns are stated in the currency in which the portfolios are denominated.
Share Class Performance (unaudited)(continued)
383
Threadneedle (Lux) Annual Report and Audited Financial Statements March 2021
Share Class Benchmark Name Comments
December 31, 2020 December 31, 2019 December 31, 2018
BenchmarkPortfolio
Return BenchmarkPortfolio
Return BenchmarkPortfolio
Return
Threadneedle (Lux) - UK Equities (continued)AG FTSE All Share -9.82% -11.26% 19.17% 22.05% -9.47% -12.94%AGP FTSE All Share -9.82% -11.26% 19.17% 22.06% -9.47% -12.94%DEH FTSE All Share -9.82% -11.77% 19.17% 19.58% -9.47% -14.66%DG FTSE All Share -9.82% -11.97% 19.17% 21.01% -9.47% -13.62%IE FTSE All Share Performance since launch
November 27, 2019 -9.82% -15.11% 3.00% 5.47% n/a n/a
IEH FTSE All Share -9.82% -10.24% 19.17% 21.79% -9.47% -13.09%IG FTSE All Share -9.82% -10.41% 19.17% 23.21% -9.47% -12.10%IGP FTSE All Share -9.82% -10.41% 19.17% 23.24% -9.47% -12.10%NEH FTSE All Share Performance since launch
October 28, 2020 14.13% 18.52% n/a n/a n/a n/a
NFH FTSE All Share Performance since launch October 28, 2020
14.13% 18.55% n/a n/a n/a n/a
NG FTSE All Share Performance since launch October 28, 2020
14.13% 18.66% n/a n/a n/a n/a
NGP FTSE All Share Performance since launch October 28, 2020
14.13% 18.66% n/a n/a n/a n/a
NUH FTSE All Share Performance since launch October 28, 2020
14.13% 18.86% n/a n/a n/a n/a
TEH FTSE All Share Performance since launch October 28, 2020
14.13% 18.52% n/a n/a n/a n/a
TFH FTSE All Share Performance since launch October 28, 2020
14.13% 18.55% n/a n/a n/a n/a
TG FTSE All Share Performance since launch October 28, 2020
14.13% 18.66% n/a n/a n/a n/a
TGP FTSE All Share Performance since launch October 28, 2020
14.13% 18.66% n/a n/a n/a n/a
TUH FTSE All Share Performance since launch October 28, 2020
14.13% 18.86% n/a n/a n/a n/a
ZE FTSE All Share Performance since launch February 12, 2020
-9.32% -14.76% n/a n/a n/a n/a
ZEH FTSE All Share -9.82% -10.44% 19.17% 21.52% -9.47% -13.33%ZFH FTSE All Share -9.82% -10.43% 19.17% 21.21% -9.47% -13.60%ZG FTSE All Share -9.82% -10.59% 19.17% 22.97% -9.47% -12.28%ZGP FTSE All Share -9.82% -10.59% 19.17% 23.02% -9.47% -12.31%ZUH FTSE All Share Was dormant from
September 24, 2020 to November 20, 2020
2.92% 4.04% 19.17% 25.38% -9.47% -11.02%
3EH FTSE All Share Performance since launch November 12, 2018
-9.82% -10.25% 19.17% 22.35% -5.37% -7.51%
3FH FTSE All Share Performance since launch November 12, 2018 for year 2018, until closure November 29, 2019 and since November 24, 2020 for year 2020
2.80% 4.44% 15.33% 16.60% -5.37% -7.39%
3UH FTSE All Share Performance since launch November 12, 2018
-9.82% -8.79% 19.17% 25.25% -5.37% -6.81%
9EH FTSE All Share Performance since launch November 10, 2018
-9.82% -10.27% 19.17% 21.75% -5.37% -7.30%
Note: Total performance is historical and is not a guarantee of future results. The net asset value of shares classes may go up or down. Performance is net of all applicable fees as well as distributions made during the calendar year ended December 31, 2020 (but does not reflect a sales charge as stated in the note 5 to the financial statements). The performance is different across share classes depending on applicable asset management and shareholder servicing fees as disclosed in the note 5 to the financial statements. In addition, currency fluctuations may also affect performance depending on the currency of denomination of the share class and the base currency of the Portfolio. The returns are stated in the currency in which the portfolios are denominated.
Share Class Performance (unaudited)(continued)
384
Threadneedle (Lux) Annual Report and Audited Financial Statements March 2021
Share Class Benchmark Name Comments
December 31, 2020 December 31, 2019 December 31, 2018
BenchmarkPortfolio
Return BenchmarkPortfolio
Return BenchmarkPortfolio
Return
Threadneedle (Lux) - UK Equities (continued)9EP FTSE All Share Performance since launch
November 10, 2018 -9.82% -15.17% 19.17% 30.60% -5.37% -9.90%
9FH FTSE All Share Performance since launch November 10, 2018 until closure November 29, 2019
-9.82% -10.23% 19.17% 21.47% -5.37% -7.30%
9G FTSE All Share Performance since launch April 25, 2019
-9.82% -10.40% 4.96% 7.27% n/a n/a
9UH FTSE All Share Performance since launch November 10, 2018
-9.82% -8.85% 19.17% 25.30% -5.37% -6.90%
Threadneedle (Lux) - UK Equity IncomeAE FTSE All Share -9.82% -12.97% 19.17% 25.82% -9.47% -8.75%AEC FTSE All Share -9.82% -8.16% 19.17% 17.16% -9.47% -8.62%AEH FTSE All Share -9.82% -8.19% 19.17% 17.27% -9.47% -8.71%AG FTSE All Share -9.82% -8.07% 19.17% 18.75% -9.47% -7.63%ASC FTSE All Share -9.82% -7.63% 19.17% 19.65% -9.47% -6.78%AUC FTSE All Share -9.82% -6.82% 19.17% 20.54% -9.47% -6.23%DE FTSE All Share -9.82% -13.62% 19.17% 24.90% -9.47% -9.41%DEC FTSE All Share -9.82% -8.95% 19.17% 16.20% -9.47% -9.36%DEH FTSE All Share -9.82% -8.86% 19.17% 16.37% -9.47% -9.37%DG FTSE All Share -9.82% -8.76% 19.17% 17.87% -9.47% -8.37%DGP FTSE All Share -9.82% -8.79% 19.17% 17.83% -9.47% -8.39%IE FTSE All Share -9.82% -12.14% 19.17% 26.91% -9.47% -7.71%IEH FTSE All Share -9.82% -7.33% 19.17% 18.31% -9.47% -7.76%IG FTSE All Share -9.82% -7.19% 19.17% 19.84% -9.47% -6.70%IGP FTSE All Share -9.82% -7.19% 19.17% 19.90% -9.47% -6.78%IU FTSE All Share -9.82% -4.23% 19.17% 24.64% -9.47% -12.19%IUH FTSE All Share -9.82% -5.72% 19.17% 21.96% -9.47% -5.33%LG FTSE All Share -9.82% -7.05% 19.17% 20.01% -9.47% -6.59%LGP FTSE All Share -9.82% -7.05% 19.17% 19.99% -9.47% -6.54%ZE FTSE All Share -9.82% -12.32% 19.17% 26.69% -9.47% -7.92%ZEH FTSE All Share -9.82% -7.49% 19.17% 18.09% -9.47% -7.96%ZFH FTSE All Share -9.82% -7.62% 19.17% 17.71% -9.47% -8.29%ZG FTSE All Share -9.82% -7.38% 19.17% 19.68% -9.47% -7.00%ZGP FTSE All Share -9.82% -7.38% 19.17% 19.61% -9.47% -6.94%ZUH FTSE All Share -9.82% -6.85% 19.17% 21.67% -9.47% -5.65%1EH FTSE All Share Performance since launch
October 17, 2018 -9.82% -8.07% 19.17% 17.41% -4.82% -5.90%
1FH FTSE All Share Performance since launch October 17, 2018
-9.82% -8.17% 19.17% 17.00% -4.82% -5.90%
1UH FTSE All Share Performance since launch October 17, 2018
-9.82% -6.65% 19.17% 20.78% -4.82% -5.30%
3EH FTSE All Share Performance since launch October 17, 2018
-9.82% -7.32% 19.17% 18.25% -4.82% -5.70%
3FH FTSE All Share Performance since launch October 17, 2018
-9.82% -7.46% 19.17% 17.93% -4.82% -5.80%
Note: Total performance is historical and is not a guarantee of future results. The net asset value of shares classes may go up or down. Performance is net of all applicable fees as well as distributions made during the calendar year ended December 31, 2020 (but does not reflect a sales charge as stated in the note 5 to the financial statements). The performance is different across share classes depending on applicable asset management and shareholder servicing fees as disclosed in the note 5 to the financial statements. In addition, currency fluctuations may also affect performance depending on the currency of denomination of the share class and the base currency of the Portfolio. The returns are stated in the currency in which the portfolios are denominated.
Share Class Performance (unaudited)(continued)
385
Threadneedle (Lux) Annual Report and Audited Financial Statements March 2021
Share Class Benchmark Name Comments
December 31, 2020 December 31, 2019 December 31, 2018
BenchmarkPortfolio
Return BenchmarkPortfolio
Return BenchmarkPortfolio
Return
Threadneedle (Lux) - UK Equity Income (continued)3UH FTSE All Share Performance since launch
October 17, 2018 -9.82% -5.91% 19.17% 21.79% -4.82% -5.20%
9EH FTSE All Share Performance since launch October 17, 2018
-9.82% -7.29% 19.17% 18.24% -4.82% -5.70%
9FH FTSE All Share Performance since launch October 17, 2018
-9.82% -7.44% 19.17% 17.88% -4.82% -5.80%
9G FTSE All Share Performance since launch April 25, 2019
-9.82% -7.18% 4.96% 7.41% n/a n/a
9UH FTSE All Share Performance since launch October 17, 2018
-9.82% -5.90% 19.17% 21.76% -4.82% -5.20%
Threadneedle (Lux) - STANLIB Africa EquityIU MSCI EFM Africa ex-ZA 10/40 0.95% -7.63% 17.01% 14.72% -12.58% -10.15%ZU MSCI EFM Africa ex-ZA 10/40 0.95% -7.63% 17.01% 14.74% -12.58% -10.15%Threadneedle (Lux) - American Absolute AlphaAEH US 3 Month Libor 0.66% -1.27% 2.39% -0.01% 2.31% -3.36%AFH US 3 Month Libor 0.66% -1.50% 2.39% -0.35% 2.31% -3.72%AGH US 3 Month Libor 0.66% -0.78% 2.39% 1.21% 2.31% -2.36%AU US 3 Month Libor 0.66% 0.00% 2.39% 3.09% 2.31% -0.64%DEH US 3 Month Libor 0.66% -1.74% 2.39% -0.51% 2.31% -3.88%DU US 3 Month Libor 0.66% -0.51% 2.39% 2.57% 2.31% -1.12%IEH US 3 Month Libor 0.66% -0.41% 2.39% 0.85% 2.31% -2.52%IGH US 3 Month Libor 0.66% 0.01% 2.39% 2.04% 2.31% -1.47%IU US 3 Month Libor 0.66% 0.85% 2.39% 3.66% 2.31% 0.25%XGH US 3 Month Libor 0.66% 0.79% 2.39% 2.92% 2.31% -0.68%ZE US 3 Month Libor Performance since launch
June 20, 2018 0.66% -7.50% 2.39% 5.11% 1.31% 1.00%
ZEH US 3 Month Libor Performance since launch June 15, 2018
0.66% -0.47% 2.39% 0.75% 1.35% -1.70%
ZGH US 3 Month Libor 0.66% -0.07% 2.39% 1.92% 2.31% -1.53%ZU US 3 Month Libor Performance since launch
June 20, 2018 0.66% 0.76% 2.39% 3.86% 1.31% -0.20%
Note: Total performance is historical and is not a guarantee of future results. The net asset value of shares classes may go up or down. Performance is net of all applicable fees as well as distributions made during the calendar year ended December 31, 2020 (but does not reflect a sales charge as stated in the note 5 to the financial statements). The performance is different across share classes depending on applicable asset management and shareholder servicing fees as disclosed in the note 5 to the financial statements. In addition, currency fluctuations may also affect performance depending on the currency of denomination of the share class and the base currency of the Portfolio. The returns are stated in the currency in which the portfolios are denominated.
Share Class Performance (unaudited)(continued)
386
Threadneedle (Lux) Annual Report and Audited Financial Statements March 2021
Share Class Benchmark Name Comments
December 31, 2020 December 31, 2019 December 31, 2018
Note: Total performance is historical and is not a guarantee of future results. The net asset value of shares classes may go up or down. Performance is net of all applicable fees as well as distributions made during the calendar year ended December 31, 2020 (but does not reflect a sales charge as stated in the note 5 to the financial statements). The performance is different across share classes depending on applicable asset management and shareholder servicing fees as disclosed in the note 5 to the financial statements. In addition, currency fluctuations may also affect performance depending on the currency of denomination of the share class and the base currency of the Portfolio. The returns are stated in the currency in which the portfolios are denominated.
Share Class Performance (unaudited)(continued)
387
Threadneedle (Lux) Annual Report and Audited Financial Statements March 2021
Share Class Benchmark Name Comments
December 31, 2020 December 31, 2019 December 31, 2018
BenchmarkPortfolio
Return BenchmarkPortfolio
Return BenchmarkPortfolio
Return
Threadneedle (Lux) - Global Investment Grade Credit Opportunities (continued)XE ICE BofA Euro Currency Deposit Bid Rate
Constrant Maturity (1M)Performance since launch April 8, 2020
June 29, 2018 -0.43% 0.43% -0.36% 19.37% -0.16% -2.70%
ZGH EURIBOR 3M -0.43% 1.31% -0.36% 21.13% -0.32% 1.79%Threadneedle (Lux) - American Extended AlphaAEH S&P 500 Performance since launch
January 26, 2019 18.40% 21.51% 23.57% 17.88% n/a n/a
AU S&P 500 Performance since launch January 26, 2019
18.40% 23.40% 23.57% 21.24% n/a n/a
DEH S&P 500 Performance since launch January 26, 2019
18.40% 20.92% 23.57% 17.33% n/a n/a
DU S&P 500 Performance since launch January 26, 2019
18.40% 22.78% 23.57% 20.61% n/a n/a
IU S&P 500 Performance since launch January 26, 2019
18.40% 24.50% 23.57% 22.29% n/a n/a
ZU S&P 500 Performance since launch January 26, 2019
18.40% 24.34% 23.57% 22.08% n/a n/a
Note: Total performance is historical and is not a guarantee of future results. The net asset value of shares classes may go up or down. Performance is net of all applicable fees as well as distributions made during the calendar year ended December 31, 2020 (but does not reflect a sales charge as stated in the note 5 to the financial statements). The performance is different across share classes depending on applicable asset management and shareholder servicing fees as disclosed in the note 5 to the financial statements. In addition, currency fluctuations may also affect performance depending on the currency of denomination of the share class and the base currency of the Portfolio. The returns are stated in the currency in which the portfolios are denominated.
Share Class Performance (unaudited)(continued)
388
Threadneedle (Lux) Annual Report and Audited Financial Statements March 2021
Share Class Benchmark Name Comments
December 31, 2020 December 31, 2019 December 31, 2018
BenchmarkPortfolio
Return BenchmarkPortfolio
Return BenchmarkPortfolio
Return
Threadneedle (Lux) - American Extended Alpha (continued)1E S&P 500 Performance since launch
January 28, 2019 18.40% 13.32% 23.57% 23.20% n/a n/a
1EH S&P 500 Performance since launch January 28, 2019
18.40% 21.57% 23.57% 18.04% n/a n/a
1U S&P 500 Performance since launch January 28, 2019
18.40% 23.52% 23.57% 21.42% n/a n/a
2E S&P 500 Performance since launch January 26, 2019
18.40% 14.30% 23.57% 24.23% n/a n/a
2U S&P 500 Performance since launch January 26, 2019
18.40% 24.65% 23.57% 22.40% n/a n/a
3U S&P 500 Performance since launch January 28, 2019
18.40% 24.45% 23.57% 22.08% n/a n/a
8E S&P 500 Performance since launch January 28, 2019
18.40% 14.25% 23.57% 23.79% n/a n/a
8U S&P 500 Performance since launch January 28, 2019
18.40% 24.53% 23.57% 21.93% n/a n/a
9U S&P 500 Performance since launch January 26, 2019
18.40% 24.48% 23.57% 22.39% n/a n/a
Threadneedle (Lux) - Global Extended AlphaAEH MSCI AC World Performance since launch
January 26, 2019 16.82% 21.19% 19.61% 22.96% n/a n/a
AU MSCI AC World Performance since launch January 26, 2019
16.82% 23.11% 19.61% 25.94% n/a n/a
DEH MSCI AC World Performance since launch January 26, 2019
16.82% 20.47% 19.61% 23.45% n/a n/a
DU MSCI AC World Performance since launch January 26, 2019
16.82% 22.56% 19.61% 25.97% n/a n/a
IU MSCI AC World Performance since launch January 26, 2019
16.82% 24.22% 19.61% 28.28% n/a n/a
ZU MSCI AC World Performance since launch January 26, 2019
16.82% 24.08% 19.61% 27.20% n/a n/a
1E MSCI AC World Performance since launch January 28, 2019
16.82% 13.07% 19.61% 29.80% n/a n/a
1U MSCI AC World Performance since launch January 28, 2019
16.82% 23.25% 19.61% 27.83% n/a n/a
2E MSCI AC World Performance since launch January 26, 2019
16.82% 14.04% 19.61% 29.09% n/a n/a
2U MSCI AC World Performance since launch January 26, 2019
16.82% 24.31% 19.61% 27.26% n/a n/a
8E MSCI AC World Performance since launch January 28, 2019
16.82% 13.99% 19.61% 30.28% n/a n/a
8U MSCI AC World Performance since launch January 28, 2019
16.82% 24.26% 19.61% 30.04% n/a n/a
Threadneedle (Lux) - Enhanced CommoditiesAEH Bloomberg Commodity Index -3.12% -3.93% 7.69% 3.20% -11.25% -17.28%AFH Bloomberg Commodity Index -3.12% -4.10% 7.69% 2.88% -11.25% -17.56%AGH Bloomberg Commodity Index -3.12% -3.80% 7.69% 4.45% -11.25% -16.44%ASH Bloomberg Commodity Index -3.12% -3.11% 7.69% 5.46% -11.25% -15.55%AU Bloomberg Commodity Index -3.12% -2.37% 7.69% 6.49% -11.25% -14.68%
Note: Total performance is historical and is not a guarantee of future results. The net asset value of shares classes may go up or down. Performance is net of all applicable fees as well as distributions made during the calendar year ended December 31, 2020 (but does not reflect a sales charge as stated in the note 5 to the financial statements). The performance is different across share classes depending on applicable asset management and shareholder servicing fees as disclosed in the note 5 to the financial statements. In addition, currency fluctuations may also affect performance depending on the currency of denomination of the share class and the base currency of the Portfolio. The returns are stated in the currency in which the portfolios are denominated.
Share Class Performance (unaudited)(continued)
389
Threadneedle (Lux) Annual Report and Audited Financial Statements March 2021
Share Class Benchmark Name Comments
December 31, 2020 December 31, 2019 December 31, 2018
BenchmarkPortfolio
Return BenchmarkPortfolio
Return BenchmarkPortfolio
Return
Threadneedle (Lux) - Enhanced Commodities (continued)DEH Bloomberg Commodity Index -3.12% -4.41% 7.69% 2.71% -11.25% -17.75%DU Bloomberg Commodity Index -3.12% -2.85% 7.69% 6.04% -11.25% -15.23%IEH Bloomberg Commodity Index -3.12% -2.91% 7.69% 4.31% -11.25% -16.46%IG Bloomberg Commodity Index Performance since launch
April 5, 2018 -3.12% -4.55% 7.69% 3.34% -10.89% -3.40%
IGH Bloomberg Commodity Index -3.12% -2.79% 7.69% 5.48% -11.25% -15.46%IU Bloomberg Commodity Index -3.12% -1.34% 7.69% 7.66% -11.25% -13.84%NG Bloomberg Commodity Index Performance since launch
June 22, 2018 -3.12% -4.05% 7.69% 3.80% -14.35% -8.00%
XU Bloomberg Commodity Index -3.12% -0.49% 7.69% 8.54% -11.25% -13.02%ZEH Bloomberg Commodity Index -3.12% -2.96% 7.69% 4.12% -11.25% -16.47%ZFH Bloomberg Commodity Index -3.12% -3.15% 7.69% 3.80% -11.25% -16.70%ZGH Bloomberg Commodity Index -3.12% -2.85% 7.69% 5.47% -11.25% -15.62%ZU Bloomberg Commodity Index -3.12% -1.38% 7.69% 7.65% -11.25% -13.94%
Note: Total performance is historical and is not a guarantee of future results. The net asset value of shares classes may go up or down. Performance is net of all applicable fees as well as distributions made during the calendar year ended December 31, 2020 (but does not reflect a sales charge as stated in the note 5 to the financial statements). The performance is different across share classes depending on applicable asset management and shareholder servicing fees as disclosed in the note 5 to the financial statements. In addition, currency fluctuations may also affect performance depending on the currency of denomination of the share class and the base currency of the Portfolio. The returns are stated in the currency in which the portfolios are denominated.
390
Threadneedle (Lux) Annual Report and Audited Financial Statements March 2021
The Securities Financing Transaction Regulation (“SFTR”) introduces reporting requirements for securities financing transactions (“SFTs”) and total return swaps. A SFT is defined as per Article 3(11) of the SFTR as:
• a repurchase/reverse repurchase agreement;• securities or commodities lending and securities or commodities borrowing;• a buy-sell back transaction or sell-buy back transaction; or• a margin lending transaction.
As at March 31, 2021, the SICAV held total return swaps (“TRS”) as type of instruments in scope of the SFTR.
Global data
Name of Portfolio Type of assetUnrealised gain and loss in the portfolio
base currency and in absolute value % of Net Assets
Threadneedle (Lux) - American Absolute Alpha TRS 351,034 0.34 Threadneedle (Lux) - Pan European Absolute Alpha TRS 2,287,372 0.97 Threadneedle (Lux) - American Extended Alpha TRS 98,993 0.09 Threadneedle (Lux) - Global Extended Alpha TRS 1,306,969 0.62 Threadneedle (Lux) - Enhanced Commodities TRS 13,885,073 2.63
Data on collateral reuseThere was no collateral reuse during the year ended March 31, 2021.
Concentration dataAll collateral received in respect of TRS as of March 31, 2021 is cash collateral. The ten largest issuers disclosure is therefore not applicable.
The following table provides details of the top ten counterparties (based on gross volume of outstanding transactions) in respect of TRS held per Portfolio as at March 31, 2021:
Name of Portfolio Type of asset Counterparty
Unrealised gain and loss in the portfolio base
currency and in absolute value
Threadneedle (Lux) - American Absolute Alpha TRSBank of America Merrill Lynch 321,194 UBS 29,840
Threadneedle (Lux) - Pan European Absolute Alpha TRSUBS 2,066,943 Goldman Sachs 220,429
Threadneedle (Lux) - American Extended Alpha TRSBank of America Merrill Lynch 74,049 UBS 24,944
Threadneedle (Lux) - Global Extended Alpha TRS UBS 1,306,969
Return/CostsReturn and costs of TRS transactions as at March 31, 2021 are disclosed in the Statement of Operations and Changes in Net Assets of the relevant Portfolio under the headings “Interest expense on swaps”, “Net realised gain/(loss) on swaps” and “Change in net unrealised gain/(loss) on swaps”.*This collateral amount may be related to transactions other than TRS which are not covered by SFTR disclosure.
Management CompanyThreadneedle Management Luxembourg S.A.44, rue de la ValléeL-2661 LuxembourgGrand Duchy of Luxembourg
Columbia Management Threadneedle (Lux) - US High Yield BondInvestment Advisers, LLC Threadneedle (Lux) - Emerging Market ESG Equities2,3
225 Franklin Street Threadneedle (Lux) - Global Emerging Market Equities3
Boston MA 02110 Threadneedle (Lux) - US Contrarian Core EquitiesUnited States of America Threadneedle (Lux) - US Disciplined Core Equities Threadneedle (Lux) - Global Technology
Threadneedle Asset Threadneedle (Lux) - Global Corporate Bond4
Management Limited Threadneedle (Lux) - European Corporate BondCannon Place Threadneedle (Lux) - European High Yield Bond78 Cannon Street Threadneedle (Lux) - European Short-Term High Yield BondLondon EC4N 6AG Threadneedle (Lux) - European Social BondUnited Kingdom Threadneedle (Lux) - European Strategic Bond Threadneedle (Lux) - Emerging Market Corporate Bonds4
Threadneedle (Lux) - Emerging Market Debt4
Threadneedle (Lux) - Global Emerging Market Short-Term Bonds4
Threadneedle (Lux) - Flexible Asian Bond5
Threadneedle (Lux) - Euro Dynamic Real Return Threadneedle (Lux) - Global Dynamic Real Return Threadneedle (Lux) - Global Multi Asset Income6
Threadneedle (Lux) - Global Focus Threadneedle (Lux) - Global Equity Income Threadneedle (Lux) - Global Select Threadneedle (Lux) - Global Smaller Companies Threadneedle (Lux) - American6
Threadneedle (Lux) - American Select6
Threadneedle (Lux) - American Smaller Companies6
Threadneedle (Lux) - Asia Equities5
Threadneedle (Lux) - Pan European ESG Equities2,6
Threadneedle (Lux) - Pan European Equity Dividend Threadneedle (Lux) - Pan European Small Cap Opportunities Threadneedle (Lux) - Pan European Smaller Companies Threadneedle (Lux) - European Select Threadneedle (Lux) - European Smaller Companies Threadneedle (Lux) - Asian Equity Income5
Threadneedle (Lux) - UK Equities Threadneedle (Lux) - UK Equity Income Threadneedle (Lux) - American Absolute Alpha6
Threadneedle (Lux) - Credit Opportunities Threadneedle (Lux) - Global Investment Grade Credit Opportunities Threadneedle (Lux) - Pan European Absolute Alpha Threadneedle (Lux) - American Extended Alpha Threadneedle (Lux) - Global Extended Alpha Threadneedle (Lux) - Enhanced Commodities Threadneedle (Lux) - Gatehouse Shariah Global Equity2,7
393
Directory(continued)
Threadneedle (Lux) Annual Report and Audited Financial Statements March 2021
Threadneedle Investments Threadneedle (Lux) - Asia Contrarian Equity8
STANLIB Asset Management Threadneedle (Lux) - STANLIB Africa Equity(Pty.) Limited17 Melrose BoulevardMelrose Arch 2196JohannesburgSouth Africa
1Subject to the responsibility and oversight of Threadneedle Management Luxembourg S.A. 2See note 1 on page 242. 3Threadneedle Asset Management Limited makes investment recommendations to Columbia Management Investment Advisers, LLC and, therefore provides investment advice supported by research, to Columbia Management Investment Advisers, LLC. 4Threadneedle Asset Management Limited may, subject to its own liability, delegate the discretionary investment management of part of the assets of the Portfolio to Columbia Management Investment Advisers,LLC.5Threadneedle Asset Management Limited may, subject to its own liability, delegate the discretionary investment management of part of the assets of the Portfolio to Threadneedle Investments Singapore (Pte.) Limited.6Columbia Management Investment Advisers, LLC makes investment recommendations to Threadneedle Asset Management Limited and, therefore provides investment advice supported by research, to Threadneedle Asset Management Limited. 7The Management Company has appointed a Shariah Supervisory Board to monitor the Shariah Portfolio’s compliance with Shariah Guidelines and Gatehouse Bank plc, with its address at 14 Grosvenor Street, London, W1K 4PS, United Kingdom, as Shariah Advisor. 8Columbia Management Investment Advisers, LLC makes investment recommendations to Threadneedle Investments Singapore (Pte.) Limited and, therefore provides investment advice supported by research, to Threadneedle Investments Singapore (Pte.) Limited.
394
Directory(continued)
Threadneedle (Lux) Annual Report and Audited Financial Statements March 2021
Depositary, Domiciliary, Administrative and Paying Agent Citibank Europe plc, Luxembourg Branch 31, Z.A. Bourmicht L-8070 Bertrange Grand Duchy of Luxembourg
Registrar and Transfer Agent International Financial Data Services (Luxembourg) S.A. 47, Avenue John F. Kennedy L-1855 Luxembourg Grand Duchy of Luxembourg
Distributor (delegated to a variety of distributors) Threadneedle Management Luxembourg S.A. 44, rue de la Vallée L-2661 Luxembourg Grand Duchy of Luxembourg
Representative and Paying Agents
In Austria Erste Bank der oesterreichischen Sparkassen AG Graben 21 A-1010 Vienna Austria
In Belgium CACEIS Belgium S.A Avenue du Port 86 C b 320 B-1000 Brussels Belgium
In France CACEIS Bank France 1/3 Place Valhubert F-75206 Paris Cedex 13 France
In Germany J.P. Morgan AG Junghofstrasse 14 D-60311 Frankfurt am Main Germany
In Hong Kong HSBC Institutional Trust Services (Asia) Limited 17/F Tower 2 & 3 HSBC Centre 1 Sham Mong Road Kowloon Hong Kong
In Switzerland RBC Investor Services Bank S.A., Esch-sur-Alzette Zurich Branch Bleicherweg 7 CH-8027 Zurich Switzerland
Auditor PricewaterhouseCoopers, Société coopérative 2, rue Gerhard Mercator, B.P. 1443 L-1014 Luxembourg Grand Duchy of Luxembourg
Legal Advisors in Luxembourg Linklaters LLP, Luxembourg 35 Avenue John F. Kennedy, B.P. 1107 L-1011 Luxembourg Grand Duchy of Luxembourg
To find out more visit columbiathreadneedle.comIssued by Threadneedle Management Luxembourg S.A. Registered with the Registre de Commerce et des Societes (Luxembourg), Registered No. B 110242, 44, rue de la Vallée, L-2661 Luxembourg, Grand Duchy of Luxembourg. In the UK issued by Threadneedle Asset Management Limited (TAML) Registered in England and Wales, Registered No. 573204, Cannon Place, 78 Cannon Street, London EC4N 6AG, United Kingdom. Authorised and regulated in the UK by the Financial Conduct Authority. Columbia Threadneedle Investments is the global brand name of the Columbia and Threadneedle group of companies. columbiathreadneedle.com 390433