CAPSTONE – IT 4444 Threats to Information A Study of SANS and Educause Brady Martin, Thomas Graham, Kezron Caines 4/13/2011 This paper discusses the trends and lifecycles of “threats” to information and systems over the past 10 years, with an eye towards analyzing” where we came from”, ”where we are”, and “where we are going”. Using data recorded by SANS and Educause correlated with statistics, the analysis will compare what threats were, and are, when and why they became important, when they were downgraded, and why. This paper will pay primary attention to the factors that pushed each of these threats to the top of the lists making them noteworthy.
Transcript
Capstone – it 4444
Threats to Information
A Study of SANS and Educause
Brady Martin, Thomas Graham, Kezron Caines
4/13/2011
This paper discusses the trends and lifecycles of “threats” to information and systems over the past 10 years, with an eye towards analyzing” where we came from”, ”where we are”, and “where we are going”. Using data recorded by SANS and Educause correlated with statistics, the analysis will compare what threats were, and are, when and why they became important, when they were downgraded, and why. This paper will pay primary attention to the factors that pushed each of these threats to the top of the lists making them noteworthy.
It is a well-accepted fact that our world is becoming more and more globalized. As our
economies and cultures merge, there is an ever increasing need to connect to one another.
Competition for finite resources has become intense. Competition between corporations for
market share and profitability is also fierce. New markets are opening in areas once considered
to be Third World. This explosive market expansion is accompanied by new consumers, hungry
to enter the world stage.
In simplest terms, globalization can be defined as the blending of economies, cultures,
and traditions across the globe. It is evidenced by increased communication and the
intermingling and exchange of ideas between various countries across the world. It is a
continuous socio economic process; a major step towards the development of a country. The
primary aspect of globalization is the mutually beneficial establishment of business and trade
links between countries that has given rise to the globalization of markets. (MapsOfIndia.com,
2004)
The business of providing consumer electronics in these emerging markets has become
big business. Companies producing devices capable of Internet connectivity are tapping into
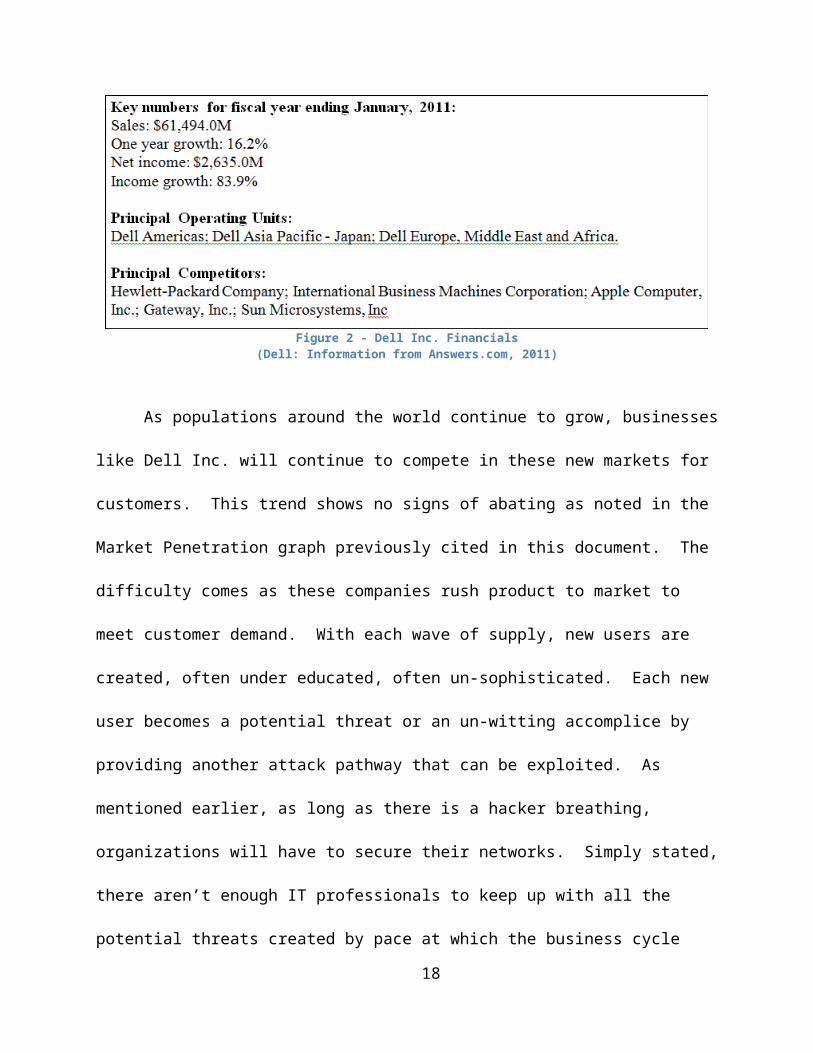
these emerging markets. Of note is Dell Inc. with numbers listed on the next page:
12
Figure 8 - Dell Inc. Financials(Dell: Information from Answers.com, 2011)
As populations around the world continue to grow, businesses like Dell Inc. will continue
to compete in these new markets for customers. This trend shows no signs of abating as noted in
the Market Penetration graph previously cited in this document. The difficulty comes as these
companies rush product to market to meet customer demand. With each wave of supply, new
users are created, often under educated, often un-sophisticated. Each new user becomes a
potential threat or an un-witting accomplice by providing another attack pathway that can be
exploited. As mentioned earlier, as long as there is a hacker breathing, organizations will have to
secure their networks. Simply stated, there aren’t enough IT professionals to keep up with all the
potential threats created by pace at which the business cycle operates. It generally takes four
years of higher education to train an IT professional and a lifetime of continuous learning to be
effective in the field. With a two to three year life cycle for mobile devices and three to four
years for desktop, replacing old technology with new happens faster than the education system
can produce newly trained professionals to manage and secure them.
13
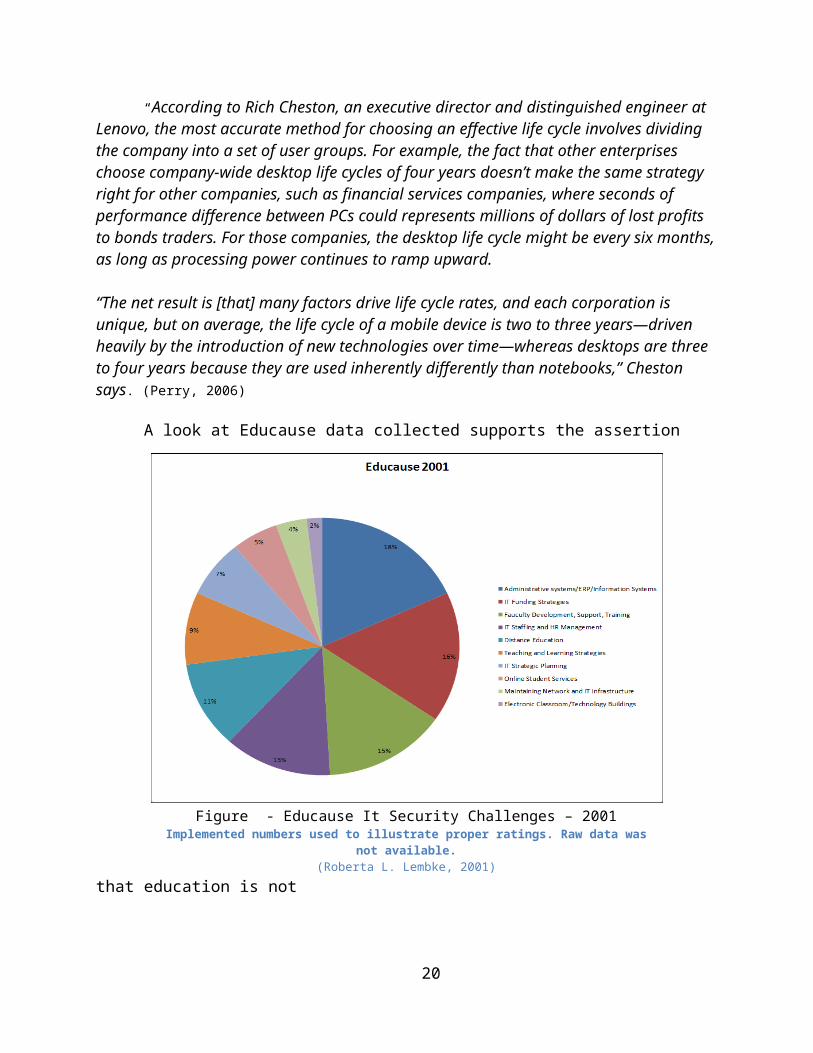
“According to Rich Cheston, an executive director and distinguished engineer at Lenovo, the most accurate method for choosing an effective life cycle involves dividing the company into a set of user groups. For example, the fact that other enterprises choose company-wide desktop life cycles of four years doesn’t make the same strategy right for other companies, such as financial services companies, where seconds of performance difference between PCs could represents millions of dollars of lost profits to bonds traders. For those companies, the desktop life cycle might be every six months, as long as processing power continues to ramp upward.
“The net result is [that] many factors drive life cycle rates, and each corporation is unique, but on average, the life cycle of a mobile device is two to three years—driven heavily by the introduction of new technologies over time—whereas desktops are three to four years because they are used inherently differently than notebooks,” Cheston says. (Perry, 2006)
A look at Educause data collected supports the assertion that education is not
14
Figure 9 - Educause It Security Challenges – 2001Implemented numbers used to illustrate proper ratings. Raw data was not available.
(Roberta L. Lembke, 2001)
There hasn’t been much change in the focus of Educators over the past 10 years. The
majority of their assessment centers on funding strategy, personnel, and the management of both.
Therefore, it is a fair assumption that this trend will not abate and the insufficient numbers of IT
professional will not be able to keep up with the globalization process. We believe that this will
continue into the foreseeable future because the education system simply cannot keep pace with
the business cycle producing devices and software.
Barring any changes to the current climate or some new breakthrough in computer
security, managing threats to information will continue to be a tenuous process of maintaining a
balance priorities and assumption of risk. With limited resources, IT professionals will continue
to be called upon to provide management with the capability to make informed decisions about
which assets require heightened vigilance.
15
Figure 10 - Educause It Security Challenges – 2010Implemented numbers used to illustrate proper ratings. Raw data was not available.
(Bret L. Ingerman, 2010)
Conclusion
In this paper we looked at SANS, Educause, Internet Usage world statistics to chart and
find trends prevailing in the Information Technology industry. For research purposes, we
maintained the simple premise that the desires of consumer far outpace the abilities of IT
professionals to deliver and secure the internet and associated products. We paid special attention
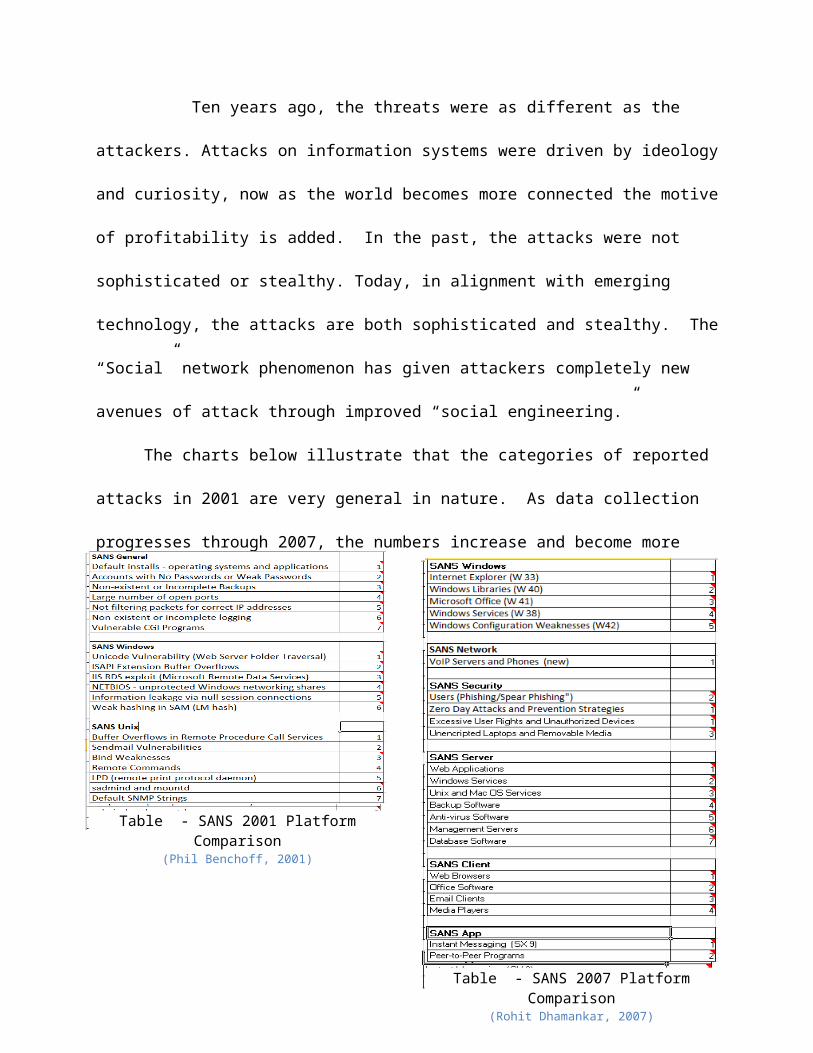
paid to “where we were”, “where we are”, and “where we are going”. Looking at the type of
attacks starting in 2000 (Table 1) to 2007 (Table 2) and evaluating the most current data
available in similar, useable formats, we noticed the breakdown and classifications of the
problem had grown increasingly complex. This is what we face as IT professionals in today’s
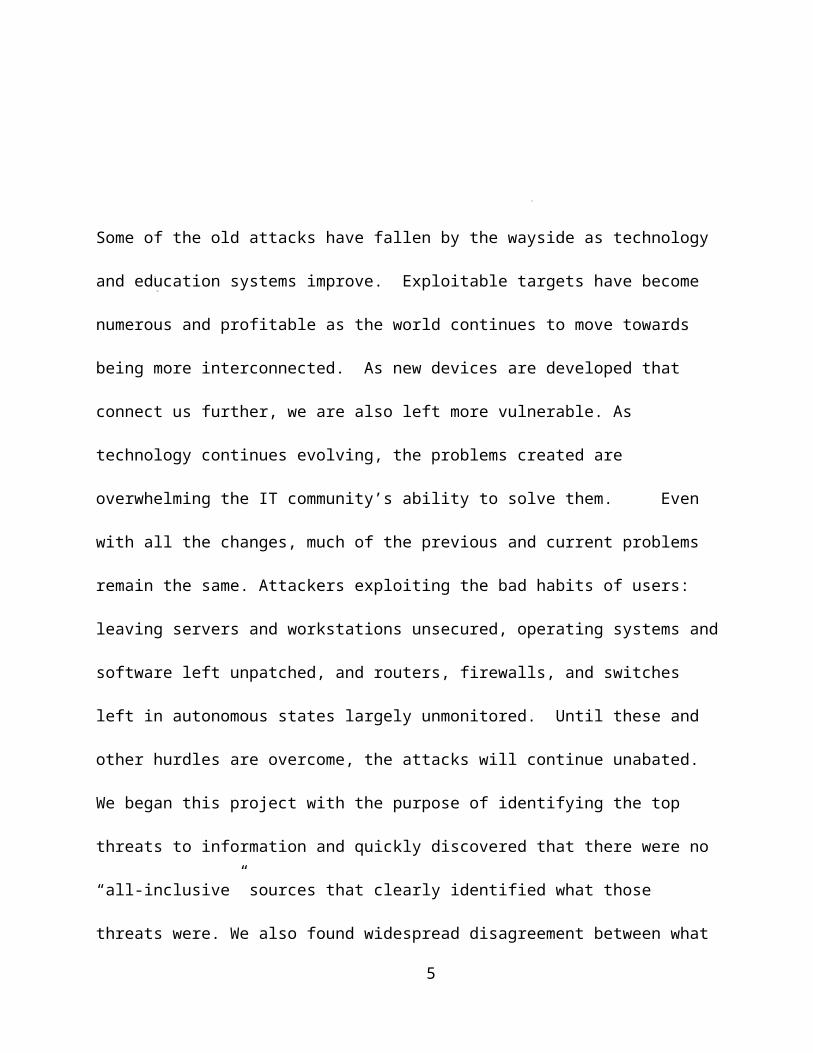
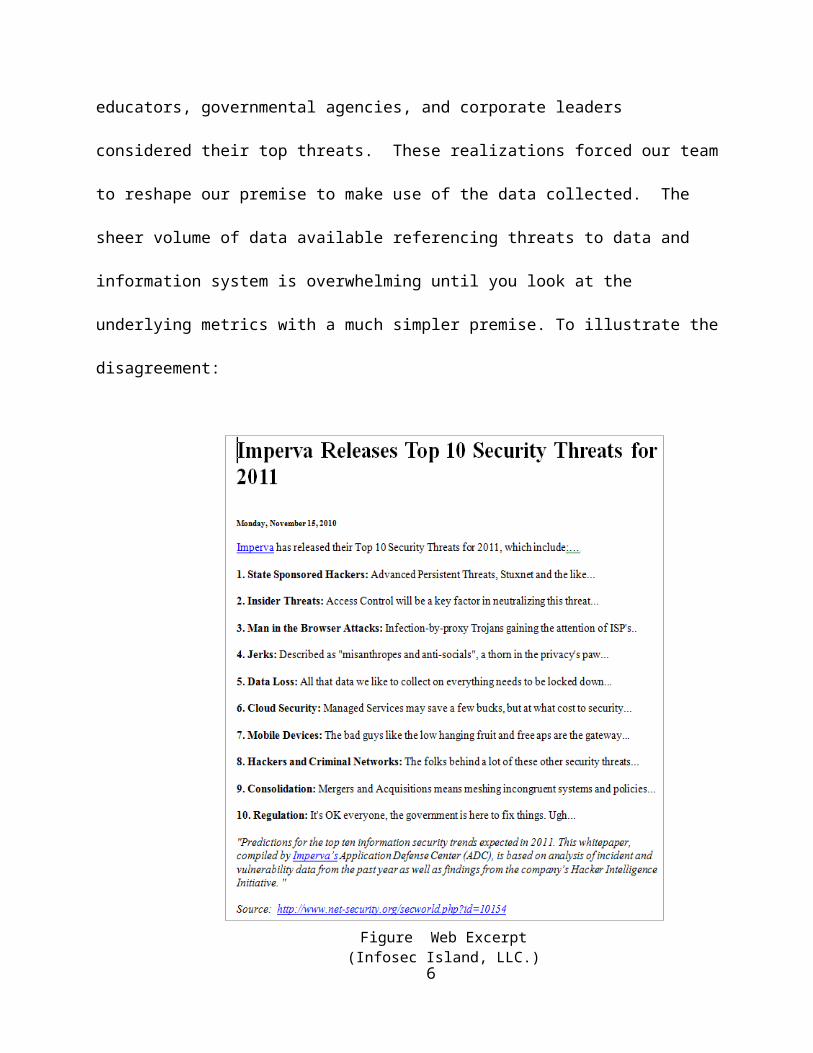
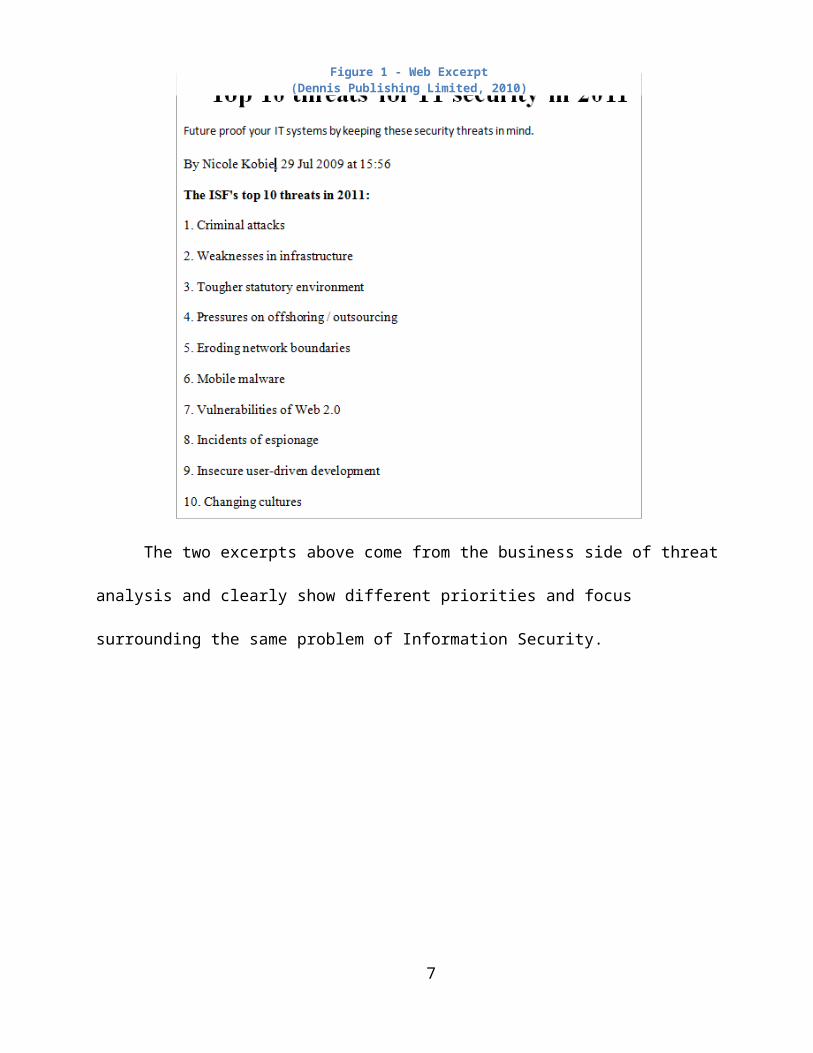
market. Continuing on, we took a snapshot of two different websites claiming top 10 issues in
information technology (Figure 1 Web Excerpt and Figure 2 - Web Excerpt to illustrate the lack
of standardization. We wrap up our introduction by showing that even organization of a similar
purpose cannot agree on a list of top threats to information and systems.
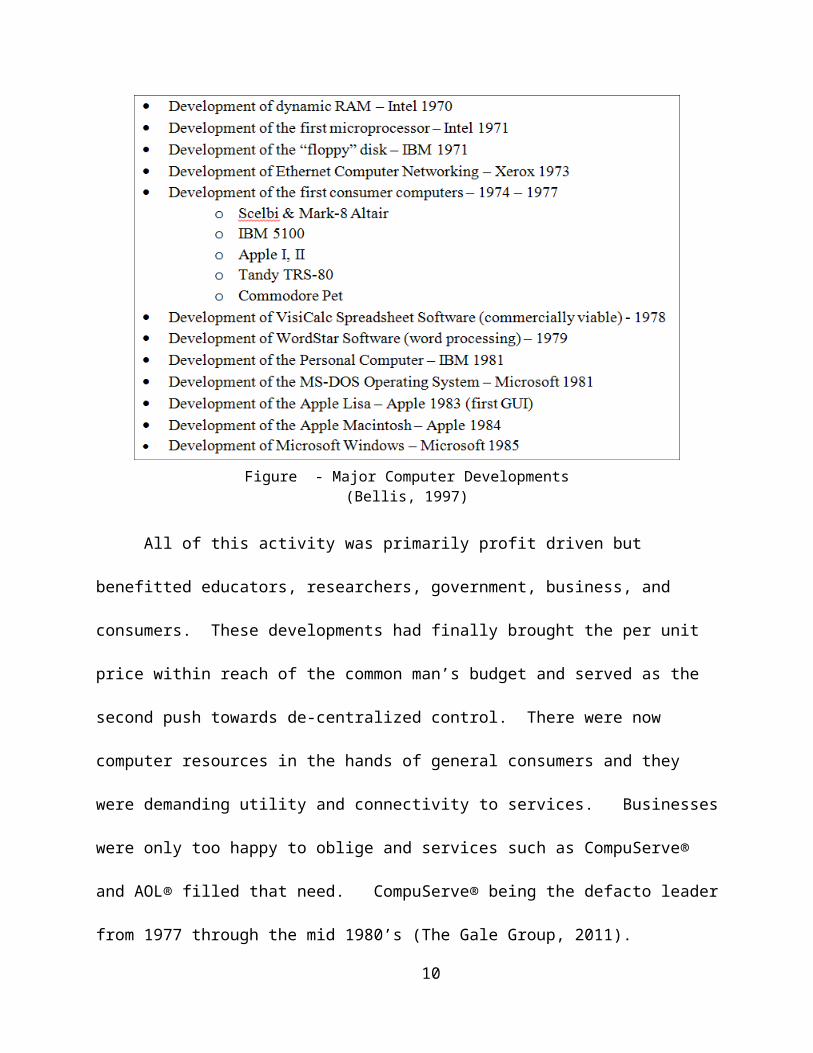
The “where we came from” section is based on a mini timeline of significant
developments to illustrate what that we believe helped shape a lot of the issues today (Figure 3 -
Major Computer Developments). Without the creation of connectivity and affordable equipment,
there would be no discussion about information security.
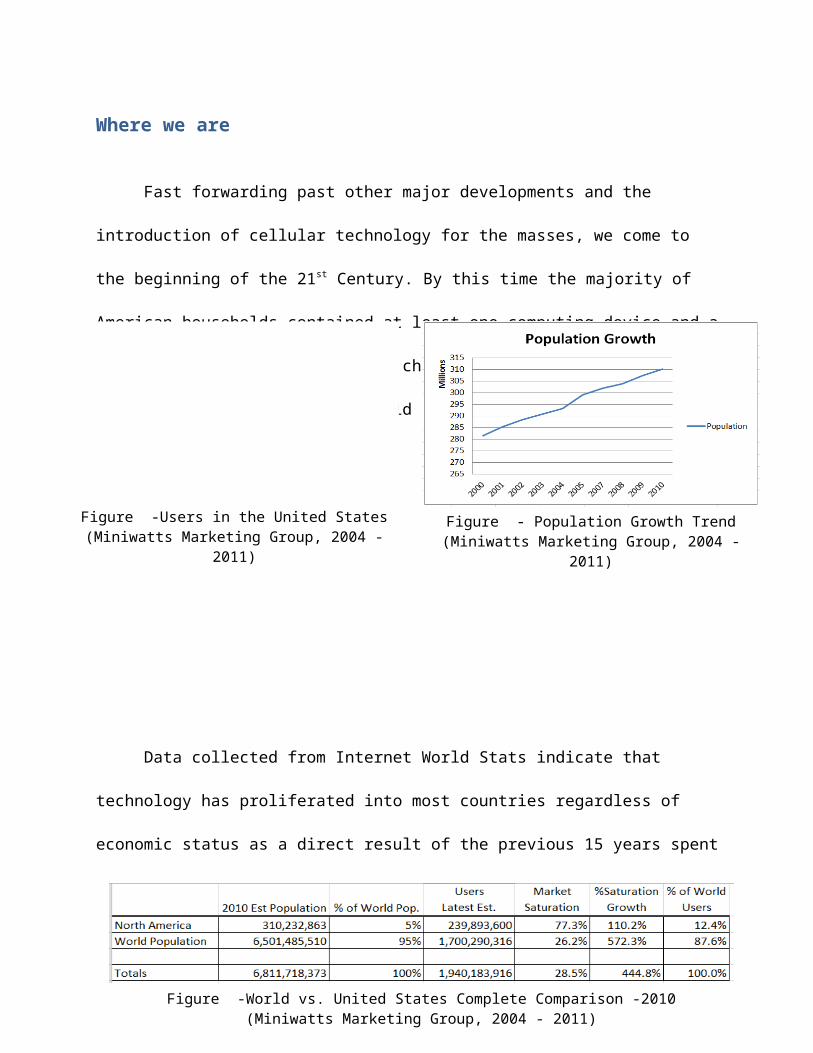
The “where we are” section looks at past trends showing how population data (Figure 5 -
Population Growth Trend) and market penetration (Figure 4) for North America compare. We
demonstrated that these trends have a Pearson’s correlation coefficient of 0.972 which supports a
strongly positive correlation, and therefore, are directly related to each other. This explosive,
continued growth of users has outpaced the IT communities’ ability to fix the issues. In Figure 6,
16
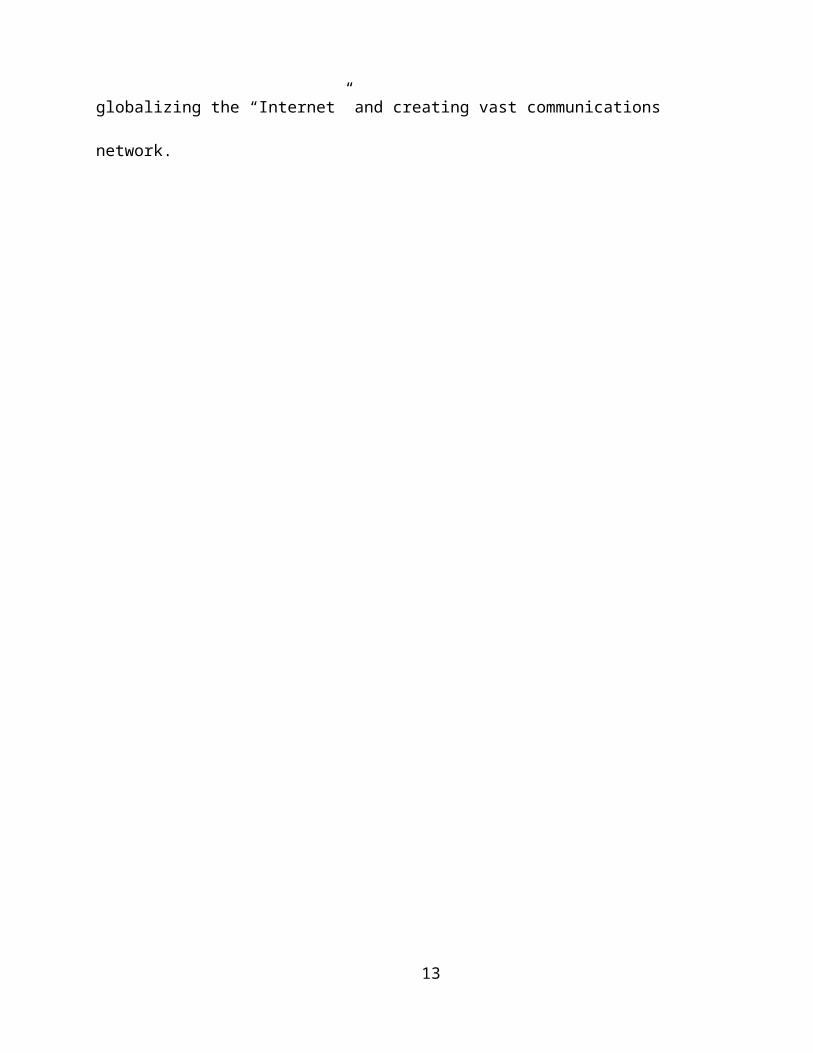
we assert that the disproportionate population of users in the United States as opposed to the rest
of the world has created an environment where the U.S. has become a target of both access and
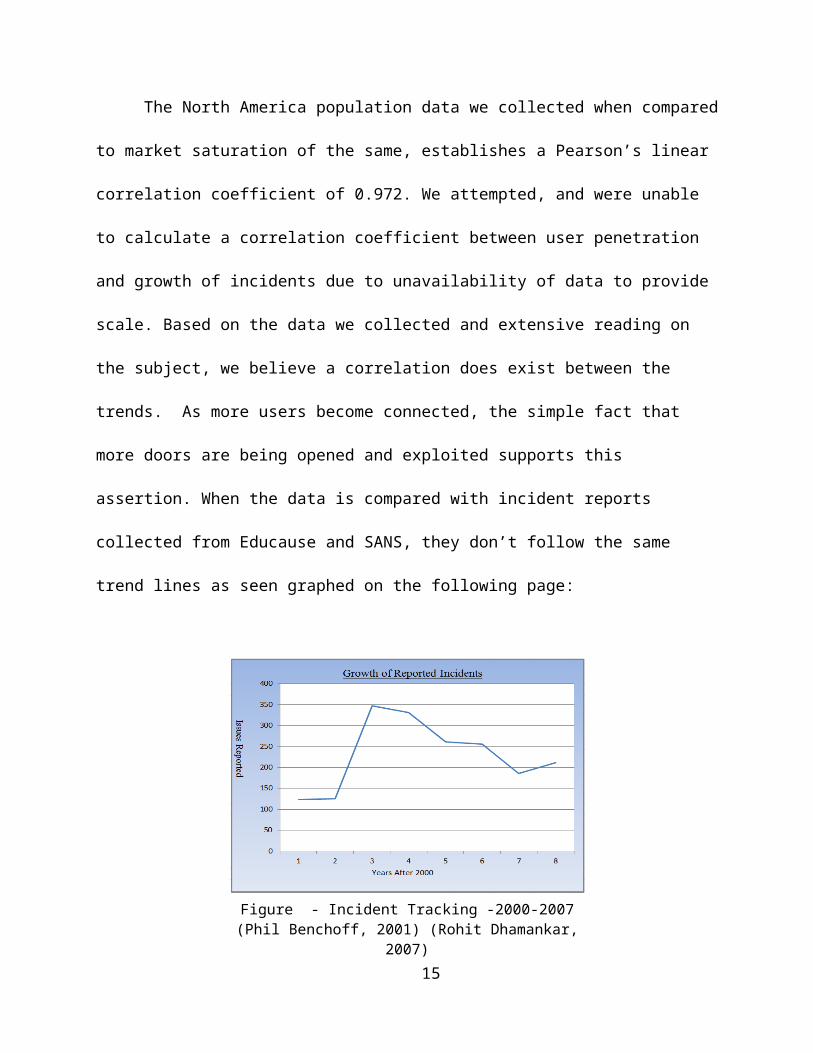
opportunity. In simplest terms we are outnumbered. In Figure 7 we attempt chart the actual
number of Common Vulnerabilities and Exposures (CVE) and Candidates for CVE (CAN) from
2000 to 2007. We do not actually address the number of specific attacks, instead choosing to
represent them as the number of issues found in each heading.
The “where we are going section,” globalization is addressed. Globalization coupled with
the vast profits companies are posting (Figure 8), provide opportunity and motivation to threaten
information and the trend is ever increasing.
Figure 9 and Figure 10 addresses the education side of the house to balance out the
government and business interest previously shown and we see is that very little has changed in
the way of thinking about how best to attack the problem of securing information assets in
respect to how the education community views things. All in all, the data collected for this
project reflect problems that have been with us for a very long time. Overall the issues addressed
within have enjoyed little in the way of progress towards solution. The individual communities
(Government, Educators, and Business) seem stuck in the defining stage of problem solving with
little progress towards real solutions. We conclude that there is no real interface between all the
parties and the problems will remain until real communication between them is realized.
As a final illustration we offer Figure 11 and Figure 12 gathered from the 2009 Sans
report to reinforce the point that both vulnerabilities and frequency of attacks are on the rise.
17
18
Figure 11 - Number of Vulnerabilities in Network, OS, and Applications(SANS Institute, 2009)
Figure 12 - Attacks on Critical Microsoft Vulnerabilities (last 6 months)(SANS Institute, 2009)
References
Timeline of Microcomputers(1977-1980). (2002, 03 05). Retrieved 04 13, 2011, from Timeline of Microcomputers(1977-1980): http://pcmuseum.tripod.com/comphis3.html
Dell: Information from Answers.com. (2011). Retrieved April 3, 2011, from Answers.com: http://www.answers.com/topic/dell-technology
Admin. (2010, 09 26). America Online (AOL) ENGLISH ARTICLES. Retrieved 04 13, 2011, from America Online (AOL) ENGLISH ARTICLES: http://www.englisharticles.info/2010/09/26/america-online-aol/
Alshboul, A. (2010). Information Systems Security Measures and Countermeasures: Protecting Organizational Assests from Malicious Attacks. IBIMA Publishing, 2010(Article ID 486878), 9.
Bellis, M. (1997). The History of Computers - Computer History Timeline. Retrieved March 15, 2011, from About.com, Inventors: http://inventors.about.com/library/blcoindex.htm
Bret L. Ingerman, C. Y. (2010, June). Top 10 IT Issues - 2010. Retrieved February 15, 2011, from Educause Review: http://net.educause.edu/ir/library/pdf/ERM1032.pdf
Dennis Publishing Limited. (2010). Top 10 Threats for IT Security - 2011. Retrieved April 13, 2011, from IT PRO - Fit for Business: http://www.itpro.co.uk/613333/top-10-threats-for-it-security-in-2011
Infosec Island, LLC. (n.d.). Imperva Releases Top 10 Security Threats for 2011. Retrieved April 13, 2011, from Infosec Island: https://www.infosecisland.com/blogview/9613-Imperva-Releases-Top-10-Security-Threats-for-2011.html
Leonard Kleinrock. (2009). Leonard Kleinrock's Home Page - History. Retrieved Apr 1, 2011, from University of California Los Angeles: http://www.lk.cs.ucla.edu/internet_first_words.html
MapsOfIndia.com. (2004). Globalization of Markets. Retrieved April 3, 2011, from MapsOfIndia.com: http://business.mapsofindia.com/globalization/market.html
Matteo. (2009, 10 14). Brief History of AOL and its Instant Messenger Program. Retrieved 04 13, 2011, from Brief History of AOL and its Instant Messenger Program: http://www.brighthub.com/office/collaboration/articles/4107.aspx
Miniwatts Marketing Group. (2004 - 2011). North America Internet Usage, Population and Telecommunication Report. Retrieved March 27, 2011, from Internet World Stats: http://www.internetworldstats.com/stats14.htm
Nelson B. Heller & Associates. (2001, August). bNet - The CBS interactive business network. Retrieved February 15, 2011, from EDUCAUSE identifies campus IT challenges:
Perry, C. (2006, October 13). Processor Editorial Article - Hardware Life Cycles Enter a New Era. Retrieved March 13, 2011, from Processor - Products, News & Information Data Centers Can Trust: http://www.processor.com/editorial/article.asp?article=articles/P2841/23p41/23p41.asp
Phil Benchoff, e. a. (2001, October 1). The Top 20 Most Critical Internet Security Vulnerabilities - 2001-2002 Archive. Retrieved February 10, 2011, from SANS: http://www.sans.org/top20/2001
Roberta L. Lembke, J. A. (2001). Top Campus IT Challenges for 2001. Retrieved February 15, 2011, from Educause: http://net.educause.edu/ir/library/pdf/eqm01211.pdf
Rohit Dhamankar, e. a. (2007, November 28). Top 2o Internet Security Problems, Threats and Risks. Retrieved February 10, 2011, from SANS: http://www.sans.org/top20/2007/
SANS Institute. (2009, September). SANS: Top Cyber Security Risks - Vulnerability Exploitation Trends. Retrieved April 10, 2011, from SANS: The most trusted site for computer security training, certification and research: http://www.sans.org/top-cyber-security-risks/trends.php
The Gale Group, I. (2011, 04 13). H & R Block, Incorporated -- Company History. Retrieved 04 13, 2011, from H & R Block, Incorporated -- Company History: http://www.fundinguniverse.com/company-histories/H-amp;-R-Block-Incorporated-Company-History.html