Page 1
The
Jou
rnal
of
Exp
erim
enta
l Bio
logy
– A
CC
EPT
ED
AU
TH
OR
MA
NU
SCR
IPT
Three cone opsin genes determine the properties of the visual spectra 1
in the Japanese anchovy Engraulis japonicus (Engraulidae, Teleostei) 2
3
Sergei L. Kondrashev1,*, Taeko Miyazaki2, Nina E. Lamash1,4 and Tohru Tsuchiya3 4
5
1A.V. Zhirmunsky Institute of Marine Biology, Far East Branch, Russian Academy of 6
Sciences, 690059 Vladivostok, Russia. 7
2Graduate Graduate School of Bioresources, Mie University, Kurimamachiya 1577, 8
Tsu, Mie, Japan 514-8507. 9
3Center for Molecular Biology and Genetics, Mie University, Kurimamachiya 1577, 10
Tsu, Mie, Japan 514-8507. 11
4Far Eastern Federal University, Sukhanova 8, 690950 Vladivostok, Russia 12
13
*Author for correspondence: Sergei L. Kondrashev. 14
A.V. Zhirmunsky Institute of Marine Biology, Far East Branch, Russian Academy of 15
Sciences, Palchevsky str. 17, 690059 Vladivostok, Russia. 16
Tel.: +7-423-2311150; Fax: +7-423-2310900. 17
E-mail address: [email protected] 18
19
20
21
22
23
24
25
26
27
28
29
30
http://jeb.biologists.org/lookup/doi/10.1242/jeb.078980Access the most recent version at J Exp Biol Advance Online Articles. First posted online on 29 November 2012 as doi:10.1242/jeb.078980
Copyright (C) 2012. Published by The Company of Biologists Ltd
http://jeb.biologists.org/lookup/doi/10.1242/jeb.078980Access the most recent version at First posted online on 29 November 2012 as 10.1242/jeb.078980
Page 2
The
Jou
rnal
of
Exp
erim
enta
l Bio
logy
– A
CC
EPT
ED
AU
TH
OR
MA
NU
SCR
IPT
SUMMARY 31
A complement of cone visual pigments was identified in the Japanese anchovy 32
Engraulis japonicus, one of the engraulid fish species that has a retina specialized for 33
polarization and color vision. The nature of the chromophore bound to opsin proteins 34
was investigated using high performance liquid chromatography (HPLC). The opsin 35
genes were then cloned and sequenced, and the absorption spectra of different types 36
of cones were obtained by microspectrophotometry (MSP). Two green (EJ-RH2-1, 37
EJ-RH2-2) and one red (EJ-LWS) cone opsin genes were identified and are 38
presumably related to the Vitamin A1-based visual pigments (i.e., rhodopsins) with 39
λmax values of 492, 474 and 512 nm for EJ-RH2-1, EJ-RH2-2, and EJ-LWS, 40
respectively. The long and short cones from the ventro-temporal retinal zone 41
consisted of a pure population of RH2 class gene-based pigments (λmax value of 492 42
nm). The long and short cones from other retinal areas and the lateral components of 43
the triple cones possessed a mixture of RH2 and LWS class gene-based pigments that 44
exhibited a λmax value approximately 502 nm. The central component of the triple 45
cones contained only RH2 class gene-based pigments (λmax value of 474 nm). Thus, 46
E. japonicus possesses a middle-wave range of spectral sensitivity and acquires 47
different color vision systems in distinct visual fields. 48
49
Key words: fish, HPLC, microspectrophotometry, triple cones, gene expression, 50
visual pigment, color vision, polarization vision. 51
52
53
54
55
56
57
58
59
60
Page 3
The
Jou
rnal
of
Exp
erim
enta
l Bio
logy
– A
CC
EPT
ED
AU
TH
OR
MA
NU
SCR
IPT
INTRODUCTION 61
The aquatic environment is characterized by a great variety of light conditions. It 62
has been shown in many studies and comprehensive reviews (Chiao et al., 2000; 63
Kusmić and Gualtieri, 2000; Lythgoe, 1979; Temple, 2011) that aquatic animals, 64
particularly fish, exhibit numerous adaptations and specializations of their visual 65
systems to match the ambient light properties of the environment. In fish, as in other 66
lower vertebrates studied thus far, specialized mechanisms have been developed at 67
the periphery of the visual system (i.e., the eye and retina) that are highly effective in 68
the selection and processing of visual stimuli, which are relevant to different forms of 69
visually guided behavior (Collin, 1997; Ewert, 1997). 70
In addition to the light intensity changes that occur as a result of dawn and sunset, 71
variations in the spectral properties of the water media are diverse and important, as 72
they influence many life strategies of fishes, including breeding behavior, camouflage 73
and feeding behavior. That is why most diurnal fish have color vision based on 74
several types of cone photoreceptor cells in the retina, which exhibit different visual 75
pigments with diverse spectral properties. The expression of these pigments is 76
encoded by four opsin genes: short-wavelength-sensitive (UV) type 1(SWS1), short-77
wavelength-sensitive (blue) type 2 (SWS2), rhodopsin-like (green) (RH2), and 78
middle and long wavelength-sensitive (red) (LWS) (Bowmaker, 2008; Ebrey and 79
Koutalos, 2001; Yokoyama, 2000). A light-sensitive chromophore, such as 11-cis-80
retinal (in a ”family” of A1-pigments, rhodopsins) or 11-cis-3, 4-dehydroretinal (in an 81
A2-pigments, porphyropsins ), is bound to the opsin protein in a visual pigment 82
molecule. The specific spectral properties of a visual pigment are characterized by the 83
absorbance maximum value (λmax), which is determined by the interplay between 84
the chromophore and the amino acid residues of the opsin (for a review, see 85
Bowmaker, 2008). 86
The specialization of color vision in fish is expressed at the morphological, 87
biochemical and physiological levels of organization and is realized in fish behavior 88
(Collin, 1999). The spectral absorbance of the cones has only been determined in 89
Page 4
The
Jou
rnal
of
Exp
erim
enta
l Bio
logy
– A
CC
EPT
ED
AU
TH
OR
MA
NU
SCR
IPT
three anchovy species. The long and short cones of E. japonicus and the European 90
anchovy E. encrasicolus have the same spectral sensitivity, with a λmax value of 502 91
or 492 nm in different retinal zones (Kondrashev et al., 2012; Zueva and 92
Govardovskii, 1991); additionally, the bay anchovy Anchoa mitchilli possesses long 93
and short cones with a λmax value of approximately 540 nm (Novales Flamarique 94
and Hárosi, 2002). Besides long and short cones, several species of anchovies also 95
possess another type of the photoreceptors: triple cones "combined" of three joining 96
equal or non-equal units (members) with well-developed inner and outer segments 97
(Zueva and Govardovskii, 1991). In several dozen species of fish, they are distributed 98
usually over the whole retinal area randomly, in a small number (Heß, 2009). In 99
contrast, the triple cones of anchovies are numerous regular elements of the 100
photoreceptor mosaic located in relatively extended dorsal and ventral zones of the 101
retina. It was discovered that in two species, E. japonicus and E. encrasicolus, these 102
cones add “color to the scene” because the absorbance of different members of the 103
triple cones exhibit λmax values of 475 and 502 nm (Kondrashev et al., 2012). 104
The anchovy long and short cones possess a remarkable and unique morphology 105
in that the orientation of the photoreceptive lamellae in the outer segments is different 106
from the orientation found not only in fish but also in all other vertebrates. The planes 107
of the lamellae of the long and short cones run parallel to the cell axis in the most 108
retinal areas and the lamellar planes of both types of cones are orthogonal to each 109
other, providing a structural basis for detection of polarized incidental light 110
(Awaiwanont et al., 2001 Fineran and Nichol, 1978; Hárosi and Hawryshyn, 2002; 111
Novales Flamarique, 2011; Novales Flamarique and Hawryshyn; 1998; Zueva, 1981). 112
The triple cones, potentialy involved in color vision, apparently lack polarization 113
sensitivity because their lamellae in the outer segments are in a normal transverse 114
position relative to the cell axis (Zueva and Govardovskii, 1991; Heß, 2009; Novales 115
Flamarique, 2011). Thus, anchovies possess color and polarization vision in the same 116
retina, and these two senses are provided by different combinations of visual 117
pigments. 118
Page 5
The
Jou
rnal
of
Exp
erim
enta
l Bio
logy
– A
CC
EPT
ED
AU
TH
OR
MA
NU
SCR
IPT
There is no clear data on the complement of visual pigments in anchovies. It has 119
been recently shown that the spectral absorbance of the Japanese anchovy cones is 120
determined by three visual pigments; furthermore, the absorbance of most of the long 121
and short cones results from a mixture of at least two pigments, similar to the 122
absorbance of the lateral components of triple cones (Kondrashev et al., 2012). The 123
spectral properties and ratio of the mixtures has not been investigated because of the 124
absence of important data on the nature of the chromophore and opsins of the 125
anchovies, which is needed for the correct approximation of the spectral data by 126
visual pigment templates (Govardovskii et al., 2000). There is a reference in Toyama 127
et al. (2008) that the retina of E. japonicus contains only A1-pigments, but no 128
experimental details were provided in that paper; thus, this question should be 129
examined carefully. Information about the opsin proteins of the clupeid fishes, a fish 130
family that includes anchovies, is scarce, and new data will significantly benefit the 131
understanding of the evolution of visual pigments. 132
In this study, the nature of the chromophore bound to the opsins found in the retina 133
of the Japanese anchovy was determined by high performance liquid chromatography 134
(HPLC). Furthermore, the opsin genes were cloned and sequenced, and the 135
absorption spectra of different types of cones were determined by 136
microspectrophotometry (MSP). These data were used for the accurate approximation 137
of the spectral data by known templates (Govardovskii et al., 2000), which allowed 138
us to speculate on the properties of the visual pigments that provide color and 139
polarization vision in the retina of anchovies. 140
MATERIALS AND METHODS 141
Fish 142
For the histological investigations, MSP and HPLC analyses, adult Japanese 143
anchovy Engraulis japonicus were caught in July-August of 2009-2012 in Vostok 144
Bay (Peter the Great Bay, Sea of Japan) near the Marine Biological Station (“Vostok” 145
of A.V. Zhirmunsky Institute of Marine Biology, FEB RAS). The fish were caught in 146
the night hours with a net, placed in a thermos on ice and delivered to the laboratory 147
within 30 min of being caught. The fish were immobilized in sea water with a high 148
Page 6
The
Jou
rnal
of
Exp
erim
enta
l Bio
logy
– A
CC
EPT
ED
AU
TH
OR
MA
NU
SCR
IPT
concentration of the anesthetic MS222 (Sigma) and decapitated. The eyes were 149
enucleated and dissected in saline (0.9% NaCl solution in 0.06 M phosphate buffer, 150
pH 7.2) under a stereomicroscope. 151
For the molecular experiments, fish samples of the adult Japanese anchovy were 152
obtained from the set-net fishery in May 2010 and August 2011 at Shima-Bay, Mie 153
prefecture, Japan. Specimens were frozen whole immediately after collection. The 154
fish were treated in accordance with the EU Directive of 2010/63/EU and with the 155
approval of the Scientific Council of the Institute of Marine Biology, Far Eastern 156
Branch of the Russian Academy of Sciences (IMB FEB RAS). 157
RNA extraction and cDNA synthesis 158
The retinas of E. japonicus were shaved off from the frozen eyeballs by a scalpel. 159
Total RNA was isolated using a single-step guanidinium thiocyanate-phenol-160
chloroform extraction method, specifically TRIzol reagent (Invitrogen), according to 161
the manufacturer's instructions. First strand cDNA was synthesized using SuperScript 162
II Reverse Transcriptase (Promega) with Poly-T primers designed by Takara Bio 163
(Table).The first strand cDNA was then poly-G-tailed at the 5'-end by terminal 164
deoxynucleotidyl transferase (Invitrogen) as described previously (Miyazaki et al. 165
2008). This single strand cDNA was used as a template for the following polymerase 166
chain reactions (PCRs). 167
Degenerate PCR, Cloning and Sequencing 168
To perform the screening for opsins in E. japonicus, we used a degenerate PCR 169
primer set (HPO-Fw and HPO-Rv, Table) designed by Helvik et al. (2001) that was 170
based on the conserved regions of several vertebrates' opsin sequences. The PCRs 171
were performed with the cycles recommended in Helvik et al. (2001). The expected 172
size of the PCR product was 735 bp; this PCR product was excised from the agarose 173
gel after electrophoresis, gel-purified, and subcloned into the pGEM-T Easy vector 174
(Promega). After the transformation of the vector into E. coli cells, multiple clones 175
were obtained and sequenced on an ABI PRISM 3100 genetic analyzer (Applied 176
Biosystems). A BLAST analysis on the DDBJ server (http://www.ddbj.nig.ac.jp) was 177
used to confirm which opsin class the nucleotide sequences belonged to. 178
Page 7
The
Jou
rnal
of
Exp
erim
enta
l Bio
logy
– A
CC
EPT
ED
AU
TH
OR
MA
NU
SCR
IPT
Green and Red opsin cDNA isolations 179
Our MSP results (Kondrashev et al., 2012) showed that E. japonicus possesses 180
cone visual pigments with λmax values of 474-513 nm; these values can be produced 181
by opsin genes belonging to the green (RH2) and red (LWS) classes of opsins. The 182
degenerate PCR above, however, yielded a single rod opsin class gene (RH1). To 183
isolate green and red opsins in E. japonicus, we designed specific primers (Table), 184
which exhibit high homology, in the forward and reverse directions based on known 185
teleost LWS and RH2 opsin sequences. 186
Rapid amplification of cDNA ends (RACE) PCR was used to generate full-length 187
cDNAs of the green and red opsins. 3'-RACE was performed with a T-amp primer, 188
and the 5'-RACE was carried out with a Poly-C primer (Table); the PCR program 189
consisted of an initial denaturation step of 94°C for 5 min followed by a 30-reaction 190
cycle (94°C for 30 sec, 57°C for 50 sec, and 72°C for 90 sec). In both RACE 191
reactions, a second round PCR was performed using 0.5 µL of the first round PCR 192
product and the same PCR program described above. The T-amp primer was used for 193
the second round of 3'-RACE, and the second round 5' RACE was performed with 194
the C-amp primer (Table). The 3'-RACE reaction produced products with the 195
expected sizes for both the green and red opsins; however, the 5'-RACE yielded only 196
the green opsin. Thus, we designed two new reverse primers for the red opsin 197
amplification (RED-Rv1 and RED-Rv2, Table) specific to the E. japonicus sequence 198
derived from the 3'-RACE product; we then carried out the 5'-RACE reaction again. 199
In addition, during the 5'-RACE amplification of the green opsin gene, another 200
distinct amino acid sequence of green opsin-like cDNA was obtained; thus, we 201
designed gene-specific 3'-RACE primers (GRN-a-Fw1 and GRN-a-Fw2, Table) and 202
conducted additional PCRs. 3'- and 5'-RACE reactions for rhodopsin were also 203
carried out with gene-specific primers that were designed using the fragment 204
sequence determined by the degenerate PCRs. The amplified products were 205
subcloned and sequenced as above. The nucleotide sequences were aligned and 206
translated into amino acid sequences. These amino acid sequences were identified as 207
belonging to the red, green and rod opsin classes. 208
Page 8
The
Jou
rnal
of
Exp
erim
enta
l Bio
logy
– A
CC
EPT
ED
AU
TH
OR
MA
NU
SCR
IPT
Southern blotting 209
To screen for duplications of the red and green opsin genes in the E. japonicus 210
genome, we performed a Southern blot analysis on E. japonicus genomic DNA. The 211
genomic DNA was extracted from E. japonicus muscles using a QuickGene DNA 212
Tissue Kit S (Fujfilm) according to the manufacturer's instructions. Approximately 1 213
µg of genomic DNA was used per lane; the genomic DNA was digested overnight 214
with restriction enzymes, electrophoresed on a 1 % agarose gel, transferred to a 215
positively charged nylon membrane (Roche Applied Science), and immobilized by 216
UV cross-linking. For the red opsin probe preparation, 428 bp of the coding region 217
was generated using the RED-Fw2 and RED-RvA primer set and the initial PCR 218
product amplified with the RED-Fw1 and T-amp primer set (Table). A 498 bp cDNA 219
fragment was amplified with a degenerate primer set (CLPGRN-FwQ and CLPGRN-220
RvQ) to produce the probe for green opsin detection. The cDNA fragments were 221
labeled using the PCR DIG Probe Synthesis Kit (Roche Applied Science) and then 222
hybridized to the membrane-bound DNA in hybridization buffer at 60°C overnight. 223
The membranes were washed twice in low-stringency buffer (2x SSC, 0.1% SDS) at 224
25°C for 5 minutes, washed twice in high-stringency wash buffer (0.5x SSC, 0.1% 225
SDS) at 65°C for 15 minutes, incubated in blocking reagent, and then conjugated 226
with the anti-fluorescein antibody using alkaline phosphatase. The membranes were 227
then incubated in CDP-Star, a chemiluminescent substrate (Roche Applied Science), 228
for 5 min at room temperature. The immunoreactivity was detected by exposure to X-229
ray film. 230
Phylogenetic analysis 231
Complete nucleotide sequences of fish red and green opsins and rod opsin were 232
retrieved from the GenBank. A phylogenetic analysis was performed with the 233
MEGA5 computer program (Tamura et al., 2011). Multiple sequence alignments of 234
the deduced amino acids were carried out using the Clustal W program and were 235
further refined manually. The nucleotide sequences were aligned according to the 236
amino acid alignment. The evolutionary distance values were estimated using the 237
Kimura two-parameter method (Kimura 1980). A phylogenetic tree was constructed 238
Page 9
The
Jou
rnal
of
Exp
erim
enta
l Bio
logy
– A
CC
EPT
ED
AU
TH
OR
MA
NU
SCR
IPT
by applying the neighbor-joining (NJ) method (Saitou and Nei 1987). A bootstrap 239
analysis with 1,000 replicates was performed by using the Seqboot program. 240
High performance liquid chromatography analysis 241
To investigate the nature of the chromophore from the anchovy visual pigments, 242
we used the method described by Suzuki and Makino-Tasaka (1983) with some 243
modifications in consideration of techniques published elsewhere (Groenendijk et. 244
al., 1980; Hasegawa et al., 2002; Hasegawa, 2005). This method has been developed 245
for the retinal and 3-dehydroretinal chromophores to be extracted as oximes and 246
analyzed by HPLC. 247
The retinas from 1-2 fish were isolated in a Petri dish with saline and transferred 248
to an opaque Eppendorf tube. The samples were quick-frozen with liquid nitrogen 249
and stored at -80°C for later use (<3 weeks). The retinas were homogenized using an 250
ultrasonic homogenizer 3 times for 5 s at 4°C in 1 ml phosphate buffer (0.1 M, pH 251
6.8). A 100 µl amount of homogenate was mixed (Vortex) with 200 µl of 1.92 M 252
hydroxylamine sulfate (Fluka) (buffered to pH 6.2 with sodium bicarbonate) and 700 253
µl of methanol to form retinaloxime and 3-dehydroretinaloxime. After the mixture 254
was kept for 15 min on ice, 600 µl of dichloromethane and 200 µl of water were 255
added, and the mixture was shaken vigorously for 10 min. After centrifugation at 256
10000 rpm for 5 min, the organic (lower) layer was carefully collected with a pipette 257
and transferred to another tube. Dichloromethane was again added to the aqueous 258
residue, and the extraction procedure was repeated. The dichloromethane extracts of 259
the two extractions were combined and evaporated under a vacuum using a filter 260
pump. The oximes were dissolved in 50 µl of n-hexane and subjected to HPLC 261
analysis. 262
The HPLC system consisted of a pump and multisolvent delivery system 263
(Shimadzu model LC-20 Prominence, Japan), a photodiode array detector with 264
thermostatic flow cell (SPD-M20A) and a 5 µm YMC-Pack Silica 2.1 X 250 mm 265
column (YMC America, Inc). The isocratic mobile phase was 7% diethylether in n-266
hexane containing 0.075% ethanol (v/v) with a flow rate of 0.4 ml/min. A 10 µl 267
sample of each extract was injected into the column. The absorbances at 360 and 400 268
Page 10
The
Jou
rnal
of
Exp
erim
enta
l Bio
logy
– A
CC
EPT
ED
AU
TH
OR
MA
NU
SCR
IPT
nm were monitored with an SPD-M20A detector in full scale at 0.01 OD, and each 269
peak area was determined by integration with the Shimadzu LC Solution 1.24 SP1 270
software. 271
A commercial all-trans-retinal (Sigma) and retinal extracts from wild goldfish 272
Carassius gibelio and carp Cyprinus carpio from the aquaculture pond were used as 273
standards. Standards were created using the same method described previously 274
(Provencio et al., 1992). The peaks of the oximes were identified by the retention 275
time of standard solutions using the same Shimadzu HPLC equipment and close 276
working regime described above (Hasegawa et al., 2002; Hasegawa, 2005; Hasegawa 277
et al., 2008). The relative quantity of oximes was evaluated by the amplitude or 278
square of the chromatographic peaks at 360 and 400 nm. 279
Microspectrophotometry (MSP) 280
The methods and additional protocols of the MSP research of retinal 281
photoreceptors were described in detail elsewhere (Bowmaker et al., 1991; 282
Bowmaker et al., 1994; Govardovskii et al., 2000; Govardovskii and Zueva, 2000; 283
Kondrashev, 2008; Kondrashev and Gnyubkina, 2011). 284
After enucleation of the eye, the cornea, lens and vitreous humor were removed, 285
and the retina was separated from the eyecup and placed in chilled saline. All 286
operations and visual observations were conducted in infrared light (LED array) 287
using a WAT-902B video camera (Watec Co., Japan) mounted on a stereomicroscope 288
and a video monitor screened by a dark red acrylic glass filter. A small piece of the 289
retina that did not include the pigment epithelium was torn up into tiny fragments 290
using sharp needles on a glass slide in several drops of saline. Then, a drop of 291
methylcellulose (Mr 4000) solution was added to 1-2 drops of the saline containing 292
suspended photoreceptors to increase the viscosity of the solution and prevent cell 293
movement. The mixed solution containing the photoreceptors was placed between 294
two cover glasses and then sealed with silicone Vaseline. 295
The absorbance spectra of visual pigments from the outer segments of the isolated 296
cones were measured with a Govardovskii single-beam microspectrophotometer 297
(Govardovskii and Zueva, 1988; Govardovskii et al., 2000). This same instrument 298
Page 11
The
Jou
rnal
of
Exp
erim
enta
l Bio
logy
– A
CC
EPT
ED
AU
TH
OR
MA
NU
SCR
IPT
was used in earlier MSP studies and is based on a system containing a grating 299
monochromator and a microscope equipped with a quartz-mirror condenser 300
(Bowmaker et al. 1994; Kondrashev, 2010; Kondrashev and Gnyubkina, 2011). To 301
avoid the potential bleaching of the pigments, only one measurement was performed 302
in the range of 350-750 nm; the readings were taken every 1 nm beginning from 750 303
nm at a scanning speed of 20 nm/s. The outgoing measuring beam from the 304
monochromator varied in dimension from 2 x 10 to 1.5 x 3 μm. With a proper 305
selection of the intensity of the measuring beam, the level of bleaching was thus 306
solely dependent upon the total exposure. With our instrument settings, in-scan 307
bleaching was estimated at <=5 % based on two subsequent scans of the same cell. 308
As for the possible shift in the λmax value, we relied on the MacNichol (1986) and 309
Govardovskii et al. (2000) fitting of a template to the long-wave slope of the 310
absorbance curve, which is minimally affected by the accumulation of bleaching 311
products. 312
Fragments of 20 retinae from 16 different fish specimens were used for the MSP. 313
We measured the spectral sensitivity of 96 long, 46 short and 50 triple cones. The 314
data was imported into a personal computer via an AC/DC converter, saved as text 315
files and subjected to further processing. The results obtained for 160 cells met the 316
main acceptance criteria (Bowmaker et. al., 1991) and were selected for further 317
analysis. 318
Differential bleaching 319
To determine the properties of the supposed pigment mixtures, MSP experiments 320
using differential bleaching (Douglas and Partridge, 1997) were performed. After 321
recording the initial curve, the outer segment of the cone was bleached for 40-60 sec 322
using a monochromator beam at 610 nm, namely a wavelength, which is in the range 323
of absorbance for a presumptive long wave-sensitive component of the pigment 324
mixture; however, this wavelength is out of the range of the spectral absorbance for 325
the presumptive short wave-sensitive component. After bleaching, a second recording 326
from the same spot of the outer segment was performed, and the difference between 327
Page 12
The
Jou
rnal
of
Exp
erim
enta
l Bio
logy
– A
CC
EPT
ED
AU
TH
OR
MA
NU
SCR
IPT
the two data sets resulted in the absorbance of the long-wave pigment. 328
MSP data processing 329
To estimate the value of the spectral peak, the experimental data for every cell was 330
smoothed by a single algorithm using the TABLECURVE 2D software (SYSTAT 331
Software Inc.). The raw data were then summarized, averaged and processed using 332
the MSP-PROC software, which was generously provided to us by V.I. Govardovskii 333
(Institute of Evolutionary Physiology and Biochemistry, St.-Petersburg, Russia). This 334
program’s main functions were outlined in previous studies (Bowmaker et al., 1994; 335
Govardovskii et al., 2000); it generates templates for A1 and A2 visual pigments at a 336
given λmax value and fits the experimental data to the templates for the visual 337
pigments. 338
RESULTS 339
The screening for opsin class genes 340
A degenerate PCR approach was used to screen for opsin class genes in E. 341
japonicus. Thirty clones were sequenced and all corresponded to the rod opsin gene. 342
By aligning these fragment sequences, a 680 base rod opsin gene fragments encoding 343
226 amino acid residues were obtained. 344
The nucleotide and amino acid sequences of the opsin genes 345
To generate red and green opsin genes, we performed standard RACE reactions 346
with gene specific primers and obtained two cDNAs belonging to the green opsin 347
class and one cDNA corresponding to the red opsin class. The RACE reactions for 348
rod opsin yielded the 5'- and 3'-end sequences of this gene; these fragments were then 349
aligned with the 680 base rod opsin gene fragments determined by the degenerate 350
PCR experiment described above. The full coding lengths of both green opsins (EJ-351
RH2-1, EJ-RH2-2) were 1035 bases, which predicts a 345 amino acid residue protein. 352
The red opsin cDNA (EJ-LWS) was 1002 bases long and encoded a 334 amino acid 353
protein, while the rod opsin cDNA (EJ-RH1) was 1056 bases long and encoded a 352 354
amino acid protein (Fig. 1; GenBank accession nos. AB731899, AB731900, 355
AB731901, and AB731902, respectively). The deduced amino acid sequences of EJ-356
Page 13
The
Jou
rnal
of
Exp
erim
enta
l Bio
logy
– A
CC
EPT
ED
AU
TH
OR
MA
NU
SCR
IPT
RH2-1, EJ-RH2-2, EJ-LWS and EJ-RH1 showed a 67-73%, 75-84%, 82-85% and 81-357
85% identity, respectively, to corresponding opsins in goldfish (Carassius auratus), 358
salmon (Salmo salar), tilapia (Oreochromis niloticus), medaka (Oryzias latipes), 359
halibut (Hippoglossus hippoglossus), and fugu (Takifugu rubripes). 360
Southern blotting of the cone opsins 361
Southern blot analyses were used to determine whether duplications of the LWS 362
and RH2 genes had occurred in the genomic DNA. The LWS probe showed a single 363
band in the lane in which genomic DNA was digested with EcoRI at approximate 4.0 364
kb (Fig. 2A-2), however a clear band and a weak band were observed approximately 365
8.0 kb and 2.5 kb, respectively, in the lane which was BamHI digested (Fig. 2A-1). 366
These results indicate that at least one copy of the LWS gene is present in the 367
genomic DNA of E. japonicus. As for the analysis of the RH2 gene, EJ-RH2-1 and 368
EJ-RH2-2 are 79% identical in the coding region, and it was expected that both of the 369
RH2 genes would be detected when the 498 base cDNA fragment of EJ-RH2-1 was 370
used as the probe. As expected, the probe detected two bands in the lane that was 371
digested by HindIII and SacI, which strongly suggests that E. japonicus has more 372
than two copies of the RH2 gene (Fig. 2B). 373
HPLC 374
The results of the chromatography are presented in Fig. 3. The chromatogram for 375
the anchovy (Fig. 3A) does not show any traces of 3-dehydroretinal and its isomeres 376
and contains only one main peak corresponding to the retention time of the all-trans-377
retinal oxime standard (Fig. 3B). In contrast, the chromatograms of the carp and 378
goldfish contained an additional main peak at a slightly longer retention time (carp) 379
or at the peak (goldfish) corresponding to the all-trans-3-dehydroretinal oxime (Fig. 380
3C,D). Moreover, these chromatographs exhibited a peak 4 of smaller amplitude, 381
indicating the presence of the anti-3-dehydroretinal oxime. The chromatogram of the 382
carp at 400 nm showed sharp increases in peaks 2 and 3 relative to anti-peaks 1 and 383
4, respectively (Fig. 3D). 384
It is well known that the visual pigments of the cyprinid fish contain exclusively 385
(goldfish) or predominantly (carp) porphyropsin based on a 3-dehydroretinal oxime 386
Page 14
The
Jou
rnal
of
Exp
erim
enta
l Bio
logy
– A
CC
EPT
ED
AU
TH
OR
MA
NU
SCR
IPT
(Bowmaker, 2008; Toyama et al., 2008), which is characterized by maximums of 387
absorbance spectra that are shifted to longer wavelengths, as well as longer retention 388
times, in comparison with the products of retinal (Groenendijk et al., 1980; Suzuki 389
and Makino-Tasaka, 1983; Kondrashev, 2008.). These data, in addition to the absence 390
of a characteristic peak 2 on the anchovy chromatogram (Fig. 3A), convincingly 391
show that anchovy visual pigments are based only on retinal. 392
MSP 393
Different types of cones could be easily recognized under the light microscope. 394
The morphology and ultrastructure of photoreceptors of the adult Japanese anchovy 395
and other representatives of the genus Engraulis were detailed in several publications 396
(Awaiwanont et al., 2001; Kondrashev et al., 2012); therefore, we only provide a 397
short description here of our observations to make the results of the MSP more 398
transparent. 399
The cones in the retina of the E. japonicus are arranged regularly in parallel rows 400
(Fig. 4A). In the dorsal and ventral regions of the retina, the rows consist exclusively 401
of triple cones, but in the central, nasal and temporal regions, the rows are composed 402
of alternating long and short cones. Under the light microscope, the long cones look 403
similar to the long cones seen in ordinary vertebrates, but the short cones are unusual 404
because of their short, bi-lobed outer segment. When isolated from the retina, the 405
long and short cones are always coupled in so called “polycones” (Fineran and Nicol, 406
1998), which are small units consisting of 3-10 cells that often have melanin- and 407
guanine-containing pigment cells inserted between the cone outer segments (Fig. 4B). 408
The cones from different retinal zones exhibit different morphologies. The long 409
and short cones isolated from the ventro-temporal zone, presumably from the area 410
temporalis, are more slender than the cones from the central retina. In the central and 411
nasal retina, the ellipsoids of all the cones are positioned at almost the same level 412
(Fig. 4C). In contrast, in the ventro-temporal zone, the short cones are displaced 413
vitreally relative to the long cones (Fig. 4B). 414
The triple cones are composed of two large lateral components with one smaller 415
central component between them (Fig. 4D). The ellipsoid of the central component is 416
Page 15
The
Jou
rnal
of
Exp
erim
enta
l Bio
logy
– A
CC
EPT
ED
AU
TH
OR
MA
NU
SCR
IPT
thinner, and the outer segment of the central component is significantly shorter than 417
similar elements of the lateral components. During retinal preparation, these 418
components were separated as a single triple unit. 419
The absorbance curves for the long and short cones obtained from the ventro-420
temporal retinal zone were identical and were best fitted by the template for the 421
rhodopsin pigment at λmax = 492 nm (Kondrashev et al., 2012). The λmax values of 422
the long and short cones isolated outside the ventro-temporal retina and of the lateral 423
members of the triple cones was approximately 502 nm. It was hypothesized 424
(Kondrashev et al., 2012) that the cones contain a mixture of at least two visual 425
pigments as the experimental data did not correspond to the template for a single 426
pigment. Our HPLC data indicates the sole presence of the retinal chromophore, and 427
our molecular experiments demonstrate the presence of three different cone opsins. 428
Thus, a superposition of two rhodopsin templates with different maximums was 429
combined to fit normalized data for the pigment mixture. This matching was made by 430
the superposition of the rhodopsin templates generated using the MSC-PROC 431
software (Govardovskii et al., 2000), MS Excel and SigmaPlot v9.01 (Systat 432
Software, Inc.). The best fit of the recorded and calculated data was obtained at a 433
given maximum of the smoothed spectrum. It was found that the long and short cones 434
as well as the lateral components of the triple cones contain a mixture of two 435
rhodopsins with λmax values at 492 and 512 nm (Fig. 5A,C,D). The content ratio of 436
these pigments is close to 50:50% over the area of the retina except for the ventro-437
temporal zone; however, this ratio may vary from 30:70% to 60:40% in different 438
individuals and retinal areas (Fig. 5A,D). 439
We performed experiments using differential bleaching to support the determined 440
properties of the supposed pigment mixture. Both experiments revealed spectral 441
components that best fit with the rhodopsin templates at the long wave slopes of the 442
curves and corresponded with the maximums derived from the calculated 443
superposition of the templates (A1_492 and A1_512 nm), specifically A1_494 and 444
A1_513 nm for the long cones, 489 and 513 nm for the short cones and A1_496 and 445
A1_516 nm for the lateral components of the triple cones (Fig. 5B-D). 446
Page 16
The
Jou
rnal
of
Exp
erim
enta
l Bio
logy
– A
CC
EPT
ED
AU
TH
OR
MA
NU
SCR
IPT
The absorbance curve of the central member of the triple cones exhibited a λmax 447
value of 474 nm and showed a good fit with the rhodopsin template (Fig. 5E).The 448
orientation of cones in the MSP preparation is always a matter of consideration, and 449
the components of the triple cone are densely packed (Fig. 4D); therefore, special 450
attention was given to certain cases during the recording when the beam of the 451
microspectrophotometer touched the border of the adjacent lateral component, which 452
exhibits a much longer wave absorbance with a λmax value approximately 502 nm. 453
The result was a distortion and minute long wave (4-6 nm) shift of the spectral curve. 454
In the experiments with differential bleaching, this long wave spectral 455
“contamination” was isolated, and the data did not fit the rhodopsin template that 456
runs far below these data points in the range of 540-600 nm (Fig. 5E). 457
DISCUSSION 458
Opsin types and visual pigment correspondence 459
We found two RH2, one LWS and one RH1 opsin in the retina of E. japonicus. 460
Although we performed trials of (RACE) PCR using the SWS2 gene-specific primer 461
sets, which have provided data for many fish species, no product encoding an SWS2 462
class gene from E. japonicus was obtained. In our experience, a primer is often 463
inapplicable for isolating genes from some fish even when the fish belongs to the 464
same order or family as other fish for which the primer was successful. It is possible 465
that the primers, which we used for SWS2 isolation, were unsuitable to the sequence 466
of the opsin gene in E. japonicus. 467
Visual pigments of the A1-type were revealed in the rods (Kondrashev et al., 2012) 468
and three types of cones with λmax values at 502, 474, 492 and 512 nm; they 469
correspond to the RH1, both sub-classes of RH2 (RH2-1 and RH2-2) and LWS opsin 470
genes, respectively. 471
Numerous RH1 genes of Clupeiformes are found in the GenBank; however, there 472
are only two entries of partial RH2 genes of Clupea harengus for cone opsins. A 473
homology search on the BLAST server indicated the highest score value for Clupea 474
harengus for EJ-RH2-1 and EJ-RH2-2 and for Engraulis encrasicolus and Sardina 475
pilchardus for EJ-RH1. 476
Page 17
The
Jou
rnal
of
Exp
erim
enta
l Bio
logy
– A
CC
EPT
ED
AU
TH
OR
MA
NU
SCR
IPT
In the southern hybridization analysis (Fig. 2), the EJ-RH2-1 probe detected double 477
bands in the genomic DNA. This result corresponds with our MSP results and the 478
molecular cloning of opsin cDNA, it also strongly suggests that the RH2 gene has 479
been duplicated in E. japonicus. The blotting analysis with the EJ-LWS probe 480
produced two bands, one weak and one clear. The weakly hybridized signal is 481
frequently observed when hybridization and washing are carried out under low-482
stringency conditions. Although there are many fish species that have duplicate LWS 483
genes, our current results suggest that E. japonicus has only one gene of LWS. 484
The full-length amino acid sequence of the E. japonicus LWS gene was determined 485
(Fig. 1) to be 334 amino acids long, which is 22-23 residues shorter than the LWS 486
gene of other fish species. When we conducted a homology search for a region of 33 487
nucleotides upstream from the start codon, no gene corresponding to the opsin class 488
was found on the GenBank. We carried out PCRs using a forward primer designed for 489
a conserved coding region in the 5'-end of the LWS gene of teleosts 490
(ATGGCAGAGCAGTGGGGAGATG) coupled with our reverse primers; no product 491
was amplified with a cDNA or genomic DNA template. We expect the 334 amino 492
acid sequence to fully encode the LWS gene of E. japonicus, although we still need to 493
investigate the LWS genomic sequence. Nevertheless, there is no doubt that a 494
functional LWS gene is present in the retina of E. japonicus. 495
Takenaka and Yokoyama (2007) proposed that RH2 λmaxs currently known are 496
generated by eight amino acid key sites (49, 52, 83, 97, 122, 164, 207 and 292). 497
These eight sites are occupied by CLGTQAMA in EJ-RH2-1. In goldfish RH2b 498
(L11866) having λmax of 505 nm, A1 based (Johnson et al., 1993); these key sites 499
were arranged as CLGTEAMA. The effect of amino acid change of Q122E is known 500
to cause 13-16-nm red-shift (Takenaka and Yokoyama, 2007), so EJ-RH2-1 was 501
expected to have 489-492 nm peak absorbance. On the other hand, EJ-RH2-2 has 502
CFGSQAMA at the critical eight sites. The amino acid composition of tilapia 503
Oreochromis niloticus RH2b (DQ235681) is IFGSQAMS, and this pigment is known 504
to have λmax value of 472 nm, A1 based (Spady et al., 2006). Two amino acid 505
changes, I49C and S292A, are found in EJ-RH2-2 when compared to the tilapia 506
Page 18
The
Jou
rnal
of
Exp
erim
enta
l Bio
logy
– A
CC
EPT
ED
AU
TH
OR
MA
NU
SCR
IPT
RH2b. Chinen et al. (2005) report that mutation of I49C causes 4-nm blue-shift, and 507
Takenaka and Yokoyama (2007) have found that 7-nm red-shift is caused by amino 508
acid replacement of S292A. Therefore, it was predicted that the EJ-RH2-2 has λmax 509
value of 475 nm. Thus, it can be concluded that the central component of the triple 510
cones contain EJ-RH2-2 gene, and the lateral components of the triple cones co-511
express EJ-RH2-1 and EJ-LWS genes. 512
With respect to the molecular mechanisms of spectral tuning in the LWS pigments, 513
the five amino acid key sites (180, 197, 277, 285, and 308) are well known to tune the 514
λmax value of the LWS pigment class. In the EJ-LWS, these sites were occupied by 515
residues of AHYTA and the predicted λmax was given as 553 nm, being longer than 516
our measurement. Davies et al. (2009; 2012) report that the λmax value of the 517
elephant shark Callorhinchus milii LWS1 (EF565165) expressed by in vitro 518
experiment was not consistent with the "five-site" rule, because of inactivating of the 519
chloride ion positive charge of H197 caused by amino acid substitution of A308S. 520
The EJ-LWS has H197/A308 combination and our present knowledge could not 521
explain the blue-shift molecular mechanisms. The co-expression of RH2-1 and LWS 522
genes in the same cell may involve other interactions in peak sensitivity tuning of the 523
visual pigment. 524
Despite good correspondence of many experimental data with the predicted 525
λmax, caution is needed when applying these calculations, as recent molecular 526
studies on a variety of species provide clear evidence of the inconsistence of the 527
“site”-rules in some cases. For example, according to our data, the Pacific saury 528
Cololabis saira having the same sites with AHYTA residues (AB761214) as in E. 529
japonicus possesses A1-based visual pigment with λmax = 565 nm in double cones 530
(Kondrashev and Gnyubkina, 2011) in comparison to the predicted λmax 553nm. 531
More examples of “discrepancy” in other vertebrate classes could be found in 532
literature (Yokoyama, 2008). 533
The spectral absorbancies of the photoreceptors of the Japanese anchovy are 534
similar to the European anchovy (Kondrashev et al., 2012), and thus both species 535
may have the same complement of visual opsins. It is worth to note that in both 536
Page 19
The
Jou
rnal
of
Exp
erim
enta
l Bio
logy
– A
CC
EPT
ED
AU
TH
OR
MA
NU
SCR
IPT
species a retinal region rich of polycones specialized for polarization vision appear to 537
be monochromatic (hence color blind). Other retinal regions containing triple cones 538
obviously lack polarization sensitivity, but have color discrimination property owing 539
to different spectral absorbances of three outer segments. Such segregation of 540
polarization and colour sensitivity between several specialized regions of the retina in 541
anchovies is analogous to insects in many aspects (Labhart and Meyer, 1999; 542
Kamermans and Hawryshyn, 2011). 543
It was reported that the cones of Anchoa mitchilli exhibit longer wave sensitivity 544
at a λmax value approximately 540 nm (Flamarique and Hárosi, 2002). Judging from 545
the value of the spectrum half-bandwidth, the authors concluded that the cone 546
pigments were A1-based; however, according to our estimates, it fits an A2-template 547
rather well with a λmax value at 543 nm (Kondrashev et al., 2012). It is important to 548
note that the λmax difference between an A1/A2 pigment pair for the same opsin is 549
determined by the Whitmore and Bowmaker (1989) or the Hárosi (1994) equations, 550
and it is the A1_512 / A2_543 pigments that satisfy such a relation with good 551
accuracy. Thus, there is a real possibility that the bay anchovy has the same LWS 552
opsin as both species of Engraulis that were previously studied. To provide more 553
evidence of the properties of the LWS opsin in E. japonicus, we need to investigate 554
the peak absorbance of recombinant visual pigments using A1 and A2 chromophores. 555
However, there is no doubt that the LWS opsin gene of E. japonicus produces the 556
shortest LWS pigment in teleosts. 557
The presence of two different visual pigments in the anchovy that utilize retinal as 558
a chromophore in the same outer cone segments is quite rare for vertebrates. Prior to 559
this, the expression of “unpaired” visual pigments in the same photoreceptor was 560
proposed for the guppy (Archer and Lythgoe, 1990) and was found in the guinea pig 561
and some other mammals (Parry and Bowmaker, 2002; Lukátz et al., 2005). 562
Gene expression in different cone types 563
Considering that the distribution map of different cones across the retina is not 564
uniform (Koch et al., 2010; Novales Flamarique, 2011, Zueva and Govardovskii, 565
Page 20
The
Jou
rnal
of
Exp
erim
enta
l Bio
logy
– A
CC
EPT
ED
AU
TH
OR
MA
NU
SCR
IPT
1991) and given our MSP results, a pattern for the gene expression in cones can be 566
outlined. In the central component of the triple cones the short wave subclass of the 567
RH2 gene is expressed; furthermore, in both lateral components of the triple cones a 568
combination of the long wave subclass of RH2 and the LWS genes are expressed. 569
The same combination of RH2 subclass and LWS genes is characteristic for the long 570
and short cones in the lateral retina, which “reduces” up to the same long wave 571
subclass of RH2 in the ventro-temporal retinal zone. The presence of only one type of 572
RH2 pigment in this area may be regarded as a special case of the pigment mixture 573
variability as the ratio of RH2-1/RH2-2 pigment varied in different anchovy 574
specimens (Fig. 5). This was obviously due to the different levels of the gene’s 575
expression as a result of reasons other than seasonal exposure because all of the MSP 576
experiments were performed in a limited period of the summer. 577
The results of the immunochemical labeling of the photoreceptors of closely 578
related species, specifically the northern anchovy Engraulis mordax by RH1 and 579
LWS antibodies (Novales Flamarique, 2011), are in accordance with our conclusions 580
about the opsin content in the lateral components of the triple and long cones, as well 581
as the opsin difference between the central component of triple cones and of the long 582
and lateral cones. The somewhat confusing results of the labeling (i.e., the different 583
response of the long and short cones to the set of applied antibodies) could be 584
explained by the fact that the anti-RH2 opsin antibodies were not used and that no 585
assumption of the existing pigment mixtures was made. The RH1 antibody that was 586
used may have a high level of non-specific binding to the two expressed RH2 opsins, 587
or it may not bind at all to one or either of them. In addition, the level of expression 588
of the RH2 opsins in different retinal zones of E. mordax may vary as it was shown 589
here in E. japonicus. 590
The phylogenetic positions of the opsins of E. japonicus 591
The overall structure of the phylogenetic trees for LWS, RH2 and RH1 contained a 592
branch that separated into two at the root of the tree (Fig. 6). We obtained the same 593
tree topology when using maximum likelihood estimation of evolutionary distances. 594
The fishes analyzed were divided into two clades, Cypriniformes and other fishes 595
Page 21
The
Jou
rnal
of
Exp
erim
enta
l Bio
logy
– A
CC
EPT
ED
AU
TH
OR
MA
NU
SCR
IPT
(i.e., Beloniformes, Perciformes, Pleuronectiformes, and Tetraodontiformes). The E. 596
japonicus opsins clustered with the Cypriniformes opsins in the LWS tree and the 597
RH1 tree, whereas the E. japonicus opsins belonged with the other fishes’ opsins in 598
the RH2 tree. Phylogeny of a given opsin gene does not often follow the presumed 599
phylogenetic tree of the families and/or genera (Yokoyama and Yokoyama, 1990; 600
Sugawara et al., 2002). We believe that the clustering difference among the present 601
trees is presumably due to convergent evolution of opsin gene, as suggested in 602
chichlids’ RH1 evolution (Sugawara et al., 2002). In the RH2 tree, two RH2 genes of 603
E. japonicus were separated from other fishes at the node and formed a cluster with a 604
99% bootstrap support. The RH1 of E. japonicus was clustered with S. pilchardus 605
with a 100% bootstrapping probability (Fig. 6C). The current NJ trees may suggest 606
that the opsin genes of E. japonicus evolved in the Clupeiformes lineage after 607
divergence from the ancestral gene. Again, long branches of two RH2 genes of E. 608
japonicus strongly indicated that the amino acids of these genes have been changed 609
until recently after the duplication, and it may mean that a rapid adaptiogenesis to the 610
light environment of RH2 genes has occurred.There is little data available on the 611
cone opsin sequences of the clupeoid fish. In addition, the molecular evolutionary 612
path of the opsin genes is often different from the evolution of the species. More 613
knowledge of the opsin sequences of the clupeoids is needed to better understand the 614
expression and regulation of the opsin genes in E. japonicus. An in situ hybridization 615
analysis is also required to elucidate the expression and localization of the RH2-1, 616
RH2-2 and LWS genes in the retina; however, our current molecular results indicate 617
that the RH2 and LWS class opsins are dominantly expressed in the retina of this 618
species. 619
ACKNOWLEDGMENTS 620
This work was supported by grants to S.K. from the Russian Foundation for Basic 621
Research (Project No. 10-04-00082) and the Far East Branch of the Russian Academy 622
of Sciences (Project Nos.12-I-P7-03 and 12-III-А-06-091). N.L. was partially 623
supported by the grant from the Russian Government (No. 11.G34.31.0010). T.M. 624
was supported by a Grant-in-Aid for Scientific Research (C) from the JSPS (No. 625
Page 22
The
Jou
rnal
of
Exp
erim
enta
l Bio
logy
– A
CC
EPT
ED
AU
TH
OR
MA
NU
SCR
IPT
23570113) and the Mie University COE-A Program. Two anonymous reviewers are 626
highly appreciated for their critical comments. 627
628
REFERENCES 629
Archer, S.N. and Lythgoe, J.N. (1990). The visual pigment basis for cone 630
polymorphism in the guppy, Poecilia reticulata. Vision Res. 30, 225-233. 631
Awaiwanont, K., Gunarso, W., Sameshima, M., Hayashi, S. and Kawamura, G. 632
(2001). Grouped, stacked rods and tapeta lucida in the retina of Japanese 633
anchovy Engraulis japonicus. Fish. Sci. 67, 804-810. 634
Bowmaker, J.K. (2008). Evolution of vertebrate visual pigments. Vision Res. 48, 635
2022-2041. 636
Bowmaker, J.K., Astell, S., Hunt, D.M. and Mollon, J.D. (1991). Photosensitive and 637
photostable pigments in the retinae of Old-World Monkeys. J. Exp. Biol. 156, 1– 638
19. 639
Bowmaker, J.K., Govardovskii, V.I., Shukolyukov, S.A. Zueva, L.V., Hunt, D.M., 640
Sideleva, V.G. and Smirnova, O.G. (1994). Visual pigments and the photic 641
environment: the cottoid fish of Lake Baikal, Vision Res. 34, 591–605. 642
Chiao, C.C., Cronin, T.W. and Marshall, N.J. (2000). Eye design and color signaling 643
in a stomatopod crustacean Gonodactylus smithii. Brain Behav. Evol. 56, 107-644
122. 645
Chinen, A., Matsumoto, Y. and Kawamura, S. (2005). Reconstitution of ancestral 646
green visual pigments of zebrafish and molecular mechanism of their spectral 647
differentiation. Mol. Biol. Evol. 22, 1001–1010. 648
Collin, S.P. (1997). Specialisations of the teleost visual system: adaptive diversity 649
from shallow-water to deep-sea. Acta Physiol. Scand. 161, Suppl. 638, 5-24. 650
Collin, S.P. (1999). Behavioural ecology and retinal cell topography. In Adaptive 651
Mechanisms in the Ecology of Vision (ed. S.N. Archer et al.), pp. 509-535, 652
Dordrecht: Kluwer Ac. Publ. 653
Page 23
The
Jou
rnal
of
Exp
erim
enta
l Bio
logy
– A
CC
EPT
ED
AU
TH
OR
MA
NU
SCR
IPT
Davies, W.L., Carvalho, L.S., Tay, B., Brenner, S., Hunt, D.M. and Venkatesh, B. 654
(2009). Into the blue: gene duplication and loss underlie colour vision adaptations 655
in a deep-sea chimaera, the elephant shark Callorhinchus milii. Genome Research 656
19, 415-426. 657
Davies ,W.I., Wilkie, S.E., Cowing, J.A., Hankins, M.W. and Hunt, D.M. (2012). 658
Anion sensitivity and spectral tuning of middle- and long-wavelength-sensitive 659
(MWS/LWS) visual pigments. Cell Mol. Life Sci. 69, 2455-2464. 660
Douglas, R.H. and Partridge, J.C. (1997). On the visual pigments of deep-sea 661
fish. J Fish Biol. 50, 68-85). 662
Ebrey, T. and Koutalos, Y. (2001). Vertebrate photoreceptors. Progr. Ret. Eye Res. 20, 663
49–94. 664
Ewert, J-P. (1997). Neural correlates of key stimulus and releasing mechanism: a case 665
study and two concepts. Trends Neurosci. 20, 332-339. 666
Fineran, B. and Nicol, J. (1978). Studies on the photoreceptors of Anchoa mitchilli 667
and A. hepsetus (Eugraulidae) with particular reference to the cones. Phil. Trans. 668
Roy. Soc. London (Biol. Sci.) 283, 25-60. 669
Govardovskii, V.I., Fyhrquist, N., Reuter, T., Kuzmin, D.G. and Donner, K. (2000).In 670
search of the visual pigment template. Visual Neurosci. 17, 509–528. 671
Govardovskii, V.I. and Zueva, L.V. (1988). A simple high-sensitive recording 672
microspectrophotometer. Tsitologiya 30, 499–502. 673
Govardovskii, V.I. and Zueva, L.V. (2000). Fast microspectrophotometer for studying 674
the photolysis of visual pigments in situ. Sensornye sistemy 14, 288–296. 675
Groenendijk, G.W., De Grip, W.J. and Daemen, F.J. (1980). Quantitative 676
determination of retinals with complete retention of their geometric configuration. 677
Biochim. Biophys. Acta, 617, 430-438. 678
Hárosi, F.I. (1994). An analysis of two spectral properties of vertebrate visual 679
pigments. Vision Res. 34, 1359–1367. 680
Hasegawa, E.I., Saito, T., and Seki, J. (2002). Composition changes in retinal 681
pigments according to habitat of chum and pink salmon. J. Fish Biol. 61, 1305-682
1308. 683
Page 24
The
Jou
rnal
of
Exp
erim
enta
l Bio
logy
– A
CC
EPT
ED
AU
TH
OR
MA
NU
SCR
IPT
Hasegawa, E. (2005). Changes in rhodopsin-porphyropsin ratio of chum and pink 684
salmon. Fish. Sci. 71, 1091-1097. 685
Hasegawa, E.I., Sawada, K., Abe, K., Watanabe, K., Uchikawa, K., Okazaki, Y., 686
Toyama, M. and Douglas, R.H. (2008). The visual pigments of a deep-sea 687
myctophid fish Myctophum nitidulum Garman; an HPLC and spectroscopic 688
description of a non-paired rhodopsin-porphyropsin system. J. Fish Biol. 72, 937-689
945. 690
Heß, M. (2009). Triple cones in the retinae of three anchovy species: Engraulis 691
encrasicolus, Cetengraulis mysticetus and Anchovia macrolepidota 692
(Engraulididae, Teleostei). Vision Res. 49, 1569-1582. 693
Helvik, J.V., Drivenes, Ø., Næss, T.H., Fjose. A. and Seo, H. (2001). Molecular 694
cloning and characterization of five opsin genes from the marine flatfish Atlantic 695
halibut (Hippoglossus hippoglossus). Visual Neurosci. 18: 767–780. 696
Kamermans, M. and Hawryshyn, C.W. (2011). Teleost polarisation vision: how it 697
might work and what it might be good for. Phil. Trans. Roy. Soc. London (Biol. 698
Sci.) 366, 742-756 699
Kimura, M. (1980). A simple method for estimating evolutionary rates of base 700
substitutions through comparative studies of nucleotide sequences. J. Mol. Evol. 701
16, 111–120. 702
Kondrashev, S.L. (2008). Long-wave sensitivity in the masked greenling 703
(Hexagrammos octogrammus), a shallow-water marine fish. Vision Res. 48, 2269-704
2274. 705
Kondrashev, S.L. (2010). Spectral sensitivity and visual pigments of retinal 706
photoreceptors in near-shore fishes of the Sea of Japan. Rus. J. Mar. Biol. 36, 707
443-451. 708
Kondrashev, S.L. and Gnyubkina, V.P. (2011). Peculiarities of the eye morphology 709
and the spectral sensitivity of the retinal photoreceptors of the Pacific saury 710
Cololabis saira. Rus. J. Mar. Biol. 37, 143-150. 711
Page 25
The
Jou
rnal
of
Exp
erim
enta
l Bio
logy
– A
CC
EPT
ED
AU
TH
OR
MA
NU
SCR
IPT
Kondrashev, S.L., Gnyubkina, V.P. and Zueva, L.V. (2012). Structure and spectral 712
sensitivity of photoreceptors of two anchovy species: Engraulis japonicus and 713
Engraulis encrasicolus.Vision Res. 68, 19-27. 714
Kusmić, C. and Gualtieri, P. (2000). Morphology and spectral sensitivities of retinal 715
and extraretinal photoreceptors in freshwater teleosts. Micron 31, 183-200. 716
Labhart, T. and Meyer, E.P. (1999). Detectors for polarized skylight in insects: a 717
survey of ommatidial specializations in the dorsal rim area of the compound eye. 718
Microscopy Res. Tech. 47, 368-379. 719
Lukáts, A., Szabу, A., Röhlich, P., Vígh, B. and Szél, A. (2005). Photopigment 720
coexpression in mammals: comparative and developmental aspects. Histol. 721
Histopathol. 20, 551-574. 722
Lythgoe, J.N. (1979). The Ecology of Vision. Clarendon Press, Oxford. 723
MacNichol, E.F., Jr. (1986). A unifying presentation of photopigment spectra. Vision 724
Res. 26, 1543–1556. 725
Miyazaki, T., Kohbara, J., Takii, K., Ishibashi, Y. and Kumai, H. (2008). Three cone 726
opsin genes and cone cell arrangement in the retina of juvenile Pacific bluefin 727
tunaThunnus orientalis. Fish. Sci. 74, 314-321. 728
Novales Flamarique, I. (2011). Unique photoreceptor arrangements in a fish with 729
polarized light discrimination. J. Comp. Neurol. 519, 714-737. 730
Novales Flamarique, I.N. and Hárosi, F.I. (2002). Visual pigments and dichroism of 731
anchovy cones: A model system for polarization detection. Visual Neurosci.19, 732
467-473. 733
Novales Flamarique, I. and Hawryshyn, C.W. (1998). Photoreceptor types and their 734
relation to the spectral and polarization sensitivities of clupeid fishes. J. Comp. 735
Physiol. A 182:793-803. 736
Parry, J.W. and Bowmaker, J.K. (2002). Visual pigment coexpression in guinea pig 737
cones: a microspectrophotometric study. Invest. Ophthalmol. Vis. Sci. 43, 1662-738
1665. 739
Provencio, I., Loew, E.R. and Foster, R.G. (1992). Vitamin A2-based visual pigments 740
in fully terrestrial vertebrates. Vision Res.32, 2201-2208. 741
Page 26
The
Jou
rnal
of
Exp
erim
enta
l Bio
logy
– A
CC
EPT
ED
AU
TH
OR
MA
NU
SCR
IPT
Saitou, N. and Nei, M. (1987). The neighbor-joining method: a new method for 742
reconstructing phylogenetic trees. Mol. Biol. Evol. 4, 406-425. 743
Spady, T.C., Parry, J.W.L., Robinson, P.R., Hunt, D.M., Bowmaker, J.M. and 744
Carleton, K.M. (2006). Evolution of the cichlid visual palette through ontogenetic 745
subfunctionalization of the opsin gene arrays. Mol. Biol. Evol. 23,1538–1547. 746
Sugawara, T., Terai, Y. and Okada, N. (2002). Natural selection of the rhodopsin gene 747
during the adaptive radiation of East African great lakes cichlid fishes. Mol. 748
Biol. Evol. 19, 1807-1811. 749
Suzuki, T. and Makino-Tasaka, M. (1983). Analysis of retinal and 3-dehydroretinal in 750
the retina by high-pressure liquid chromatography. Anal. Biochem. 129, 111-119. 751
Takenaka, N. and Yokoyama, S. (2007). Mechanisms of spectral tuning in the RH2 752
pigments of Tokay gecko and American chameleon. Gene 399, 26-32. 753
Tamura, K., Peterson, D., Peterson, N., Stecher, G., Nei, M. and Kumar, S. (2011). 754
MEGA5: Molecular evolutionary genetics analysis using maximum likelihood, 755
evolutionary distance, and maximum parsimony methods. Mol. Biol. Evol. 28, 756
2731-2739. 757
Temple, S.E. (2011). Why different regions of the retina have different spectral 758
sensitivities: A review of mechanisms and functional significance of intraretinal 759
variability in spectral sensitivity in vertebrates. Visual Neurosci. 28, 281-293. 760
Toyama, M., Hironaka, M., Yamahama, Y., Horiguchi, H., Tsukada, O., Uto, N., 761
Ueno, Y., Tokunaga, F., Seno, K. and Hariyama, T. (2008). Presence of 762
rhodopsin and porphyropsin in the eyes of 164 fishes, representing marine, 763
diadromous, coastal and freshwater species - a qualitative and comparative study. 764
Photochem. Photobiol. 84, 996-1002. 765
Whitmore, A.V. and Bowmaker, J.K. (1989). Seasonal variation in cone sensitivity 766
and short-wave absorbing visual pigments in the rudd Scardinius 767
erythrophthalmus. J. Comp. Physiol. A 166, 103–115. 768
Yokoyama, S. (2000). Molecular evolution of vertebrate visual pigments. Progr. Ret. 769
Eye Res. 9, 385–419. 770
Yokoyama, S. (2008). Evolution of Dim-Light and Color Vision Pigments. Annu. 771
Page 27
The
Jou
rnal
of
Exp
erim
enta
l Bio
logy
– A
CC
EPT
ED
AU
TH
OR
MA
NU
SCR
IPT
Rev. Genomics Hum. Genet. 9, 259–282 772
Yokoyama, R. and Yokoyama, S. 1990. Convergent evolution of the red- and green-773
like visual pigment genes in fish, Astyanax fasciatus. Proc. Natl. Acad. Sci. U S 774
A. 87, 9315-9318. 775
Zueva, L.V. (1981). Retinal cones of the Black Sea anchovy Engraulis encrasicholus 776
- an analyzer of polarized light in vertebrates. J. Evol. Bioch. Physiol. 17, 420- 777
425. 778
Zueva, L.V. and Govardovskii, V.I. (1991). Photoreceptors and visual pigments in the 779
retina of the anchovy Engraulis encrasicholus. Zh. Evol. Fiziol. Biokh. 27, 780
506-512. 781
782
LIST OF SYMBOLS AND ABBREVIATIONS 783
λmax wavelength of maximal absorption 784
PCR polymerase chain reaction 785
RH1 rod opsin or rhodopsin 786
RH2 RH2-like or green 787
SWS2 short wavelength-sensitive type 2 or blue 788
LWS long wavelength-sensitive or red 789
RACE rapid amplification of cDNA ends 790
SSC saline-sodium citrate buffer 791
SDS sodium dodecyl sulfate 792
NJ neighbor joining 793
kbp kilo base pare 794
LED light emitting diods 795
Single letter codes for amino acids. C - cysteine, L - leucine, G -glycine, T - 796
threonine, E - glutamic acid, A - alanine, M- methionine, Q - glutamine, F - 797
phenylalanine, 798
S - serine, I -isoleucine. 799
800
801
Page 28
The
Jou
rnal
of
Exp
erim
enta
l Bio
logy
– A
CC
EPT
ED
AU
TH
OR
MA
NU
SCR
IPT
FIGURE LEGENDS 802
Fig. 1. Amino acid alignment of E. japonicus opsin sequences. Symbols indicate 803
functionally important residues for the Schiff-base linkage to the chromophore 804
(lysine, K), the Schiff-base counter ion (glutamate, E), and stabilizing disulfide bond 805
(cysteine, C). 806
Fig. 2. Southern hybridization of the E. japonica genomic DNA to the EJ-LWS (A) 807
and EJ-RH2-1 (B) probes. The genomic DNA in the A1, A2, B1 and B2 track is 808
digested with BamHI, EcoRI, HindII and SacI respectively. The sizes of markers are 809
indicated on the left. 810
Fig. 3. HPLC analysis of the retina of E. japonicus (A), (Carassius gibelio (C) and 811
Cyprinus carpio (D). (B) - chromatogram of a standart all-trans-retinal oxime. 812
1 - all-trans-retinal oxime, 2 - all-trans-3-dehydroretinal oxime, 3 – anti-trans-retinal 813
oxime, 4 – anti-trans-3-dehydroretinal oxime, 5 – unknown peak. Abscissae – 814
retention time, min. Solid curve – absorbtion at 360 nm, dotted curve – absorbtion at 815
400 nm. 816
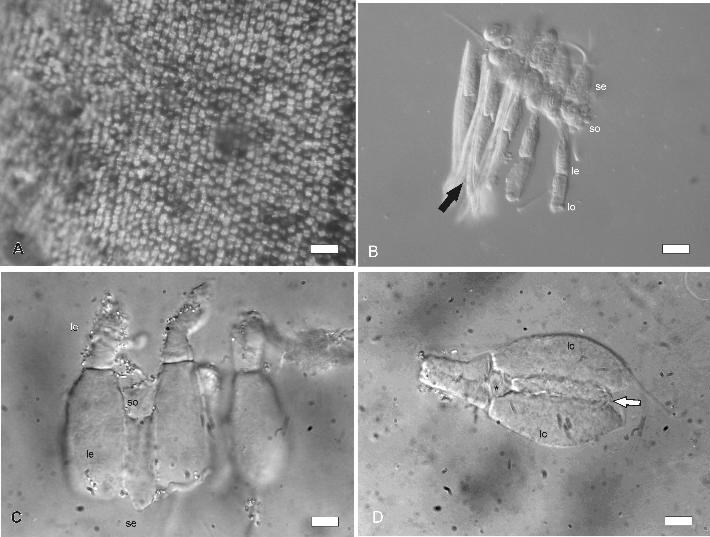
Fig. 4. Light microscopy photographs of cones of E. japonicus. 817
A - retinal flatmount cleaned from the retinal epithelium, B –D – isolated cones, 818
Nomarski optics. (A) The rows of cones in the ventro-temporal retina. (B) Lateral 819
view of a fragment of a polycone row from the ventro-temporal retina. se: short cone 820
ellipsoids, so: short cone outer segments, le: long cone ellipsoids, lo: long cone outer 821
segments, arrow: processes of pigment cells with guanine platelets. (C) Lateral view 822
of part of a polycone from the central retina, designations see (B). (D) Isolated triple 823
cone from the dorsal retina. lc: lateral component, arrow: central component, asterisk: 824
outer segment of the central component. Scale bars: A = 20 µm; B = 10 µm, C and D 825
= 5 µm. 826
Fig. 5. The absorbance spectra of the photoreceptors of E. japonicus. The spectra are 827
the means of records obtained from single cone outer segments. Symbols are the 828
recorded and calculated data, solid lines are the best fit of the rhodopsin pigments 829
single template curves (B – E) and a superposition of two rhodopsin templates (λmax 830
= 492 and 512 nm) (A and D). The number of records (n) is presented below in 831
Page 29
The
Jou
rnal
of
Exp
erim
enta
l Bio
logy
– A
CC
EPT
ED
AU
TH
OR
MA
NU
SCR
IPT
brackets. (A) Variation in the absorbance of the long cones from different regions of 832
the nasal retina. Triangles and circles: A1_492+A1_512 pigment mixture at the ratio 833
of 40:60% (λmax = 503 nm, n=10) and 60:40% (λmax = 500 nm, n=12), 834
accordingly. (B - E) Differential bleaching of different cone types. Filled circles - 835
first recording, triangles - recording after bleaching, open circles - difference between 836
the first and second spectral data. Solid curves fitting triangles and circles are, 837
accordingly, the rhodopsin templates for two A1-visual pigments. (B) Long cones 838
(n=16, λmax = 503 nm; λmax of spectral components – 494 and 513 nm ). (C) Short 839
cones (n=12, λmax = 502 nm; λmax of spectral components – 490 and 513 nm ). (D) 840
Lateral components of the triple cones; solid line - the fit by the combination of two 841
A1-pigment templates (n=10, λmax = 504 nm; λmax of spectral components – 496 842
and 516 nm ). (E) Central component of the triple cones (n=14). Solid line – template 843
for A1_480 pigment. Triangles correspond to the true spectral absorbance of this 844
component fitted by the A1- template at the λmax = 474 nm, Open circles – data 845
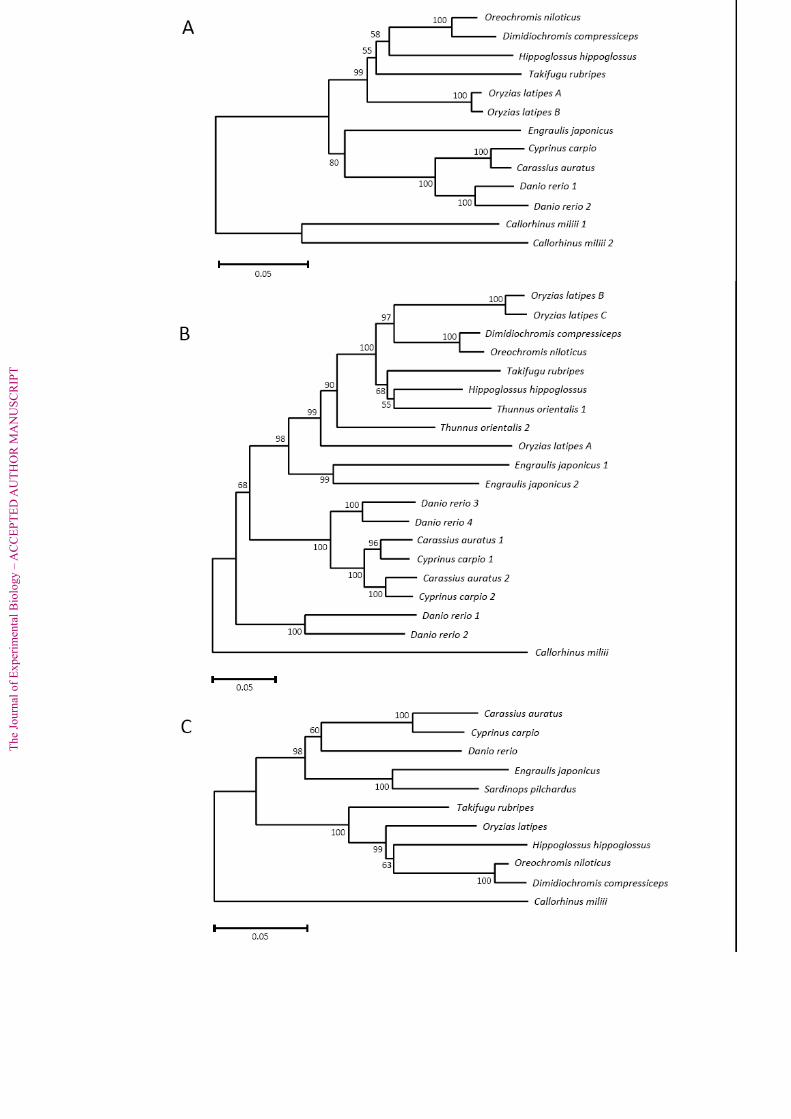
records of the difference spectrum (λmax = 503 nm). 846
Fig. 6. Neighbor joining tree of LWS (A), RH2 (B) and RH1(C) opsin genes based on 847
their nucleotide sequences. The genes of E. japonicus are highlighted. Callorhinchus 848
milii LWS1, LWS2, RH2 and RH1 (Gene accession no., EF565165, EF565166, 849
EF565168, EF565167) was used as the outgroup for LWS, RH2 and RH1 tree, 850
respectively. The bootstrap probabilities are given to each node. Scale bars indicate 851
five substitutions per 100 sites. The nucleotide sequences of fish opsin genes were 852
obtained from GenBank: Carassius auratus LWS (L11867), RH2-1 (L11865), RH2-2 853
(L11866), RH1 (L11863); Cyprinus carpio LWS (AB055656), RH2-1 (AB110602), 854
RH2-2 (AB110603), RH1 (Z71999); Danio rerio LWS-1 (AB087803), LWS-2 855
(AB087804), RH2-1 (AB087805),RH2-2 (AB087806), RH2-3 (AB087807),RH2-4 856
(AB087808), RH1 (AB087811); Oryzias latipes LWS-A (AB223051), LWS-B 857
(AB223052), RH2-A (AB223053),RH2-B (AB223054), RH2-C (AB223055), RH1 858
(AB180742); Takifugu rubripes LWS (AY598942), RH2 (AF226989), RH1 859
(AF201471); Hippoglossus hippoglossus LWS (AF316498), RH2 (AF156263), RH1 860
(AF156265); Oreochromis niloticus LWS (AF247128), RH2 (AF247124), RH1 861
Page 30
The
Jou
rnal
of
Exp
erim
enta
l Bio
logy
– A
CC
EPT
ED
AU
TH
OR
MA
NU
SCR
IPT
(AY775108); Dimidiochromis compressiceps LWS (AF247131), RH2 (AF247130), 862
RH1 (AY775059); Thunnus orientalis RH2-1 (AB290451), RH2-2 (AB290452); 863
Sardina pilchardus RH1 (Y18677). 864
Page 31
The
Jou
rnal
of
Exp
erim
enta
l Bio
logy
– A
CC
EPT
ED
AU
TH
OR
MA
NU
SCR
IPT
EJ RH2-1 M N G T E G E N F Y I P M S N K T G V V R S P Y E Y P Q Y Y L A N V W I Y R L Q A L Y M F F L I C A G L P I N V L T L A 60EJ RH2-2 M N G T E G S N F Y I P M S N R T G L V R S P F E Y P R Y Y L A P P W Q F Y L L A F Y M F C L I C F G F P I N G L T L A 60EJ LWS M F T Y T N A N N T R D P F E G P N Y H I A P R W V Y N I S T L W M F F V V I A S V F T N G L V L V 50EJ RH1 M N G T E G P F F Y I P M S N A T G V V R S P Y E Y P Q Y Y L V A P W G F A C L A A Y M F F L I L V G F P V N F L T L Y 60
▼ ▼
EJ RH2-1 V T A M H K K L R Q P L N F I L V N L A V A G T I M C L C G F T V T F I T A L C G Y F V F G P M G C A I E G F S A T L G 120EJ RH2-2 V T A L H K K L R Q P L N F I L V N L A V A G M I M V L F G F T I T I T S A L N G Y F V F G A M G C A I E G F M A T L G 120EJ LWS A T A K F K K L R H P L N W I L V N L A I A D L G E T V L A S T I S V I N Q F F G Y F I L G H P M C V F E G Y T V S T C 110EJ RH1 V T I E H K K L R S P L N Y I L L N L A V A N L F M V I G G F T T T M W T S L N G Y F V F G R M G C N I E G F F A T L G 120
EJ RH2-1 G Q V A L W S L V V L A V E R Y M V V C K P M G N I K F G T P A A T V G V L F T W V M A F S C A A P P L F G W S R Y M P 180EJ RH2-2 G Q V A L W S L V V L A V E R Y I V V C K P M G S F K F G T A H A G A G V A F T W V M A M S C A A P P L F G W S R Y I P 180EJ LWS G I A A L W S L T V I S W E R W V V V C K P F G N V K F D A K W A T G G I V F S W V W A A V W C A P P V F G W S R Y W P 170EJ RH1 G E I A L W S L V V L S I E R W L V V C K P I S S F R F T E T H A I G G V A F S W I M A A A C A V P P L V G W S R Y I P 180
▼
EJ RH2-1 E G L Q T S C G P D Y Y T L N P V Y D N E N Y V I Y M F T F H F C V P V C T I F F T Y G C L V L T V K A A A A Q Q Q D S 240EJ RH2-2 E G M Q C S C G P D Y Y T L S P E F N N E S Y V I Y M F T C H F C A P V F I I F F T Y G S L V L T V K A A A A Q Q Q D S 240EJ LWS H G L K T S C G P D V F S G S D D P G V K S Y M I V L M V T C C F L P L A I I I L C Y I A V W M A I R A V A A Q Q K D S 230EJ RH1 E G M Q C S C G I D Y Y T R A E G F N N E S F V I Y M F V V H F M C P F F I I T F C Y G N L V C A V K A A A A A Q Q E S 240
▼
EJ RH2-1 A S T Q K A E K E V T R M C V L M V L G F I V A W T P Y A S M A A W I F F N R G A A F S A V Q M A V P A F F S K T S A V 300EJ RH2-2 E S T Q K A E R E V T R M C V L M V L G F L V A W T P Y A S F A A W I F F N K G A A F S A Q S M A I P A F F S K S S A L 300EJ LWS E S T Q K A E K E V S R M V V V T I L A Y C V C W G P Y T V F A C F A A A N P G Y A F H P L A A A M P A Y F A K S A T I 290EJ RH1 E T T Q R A E R E V T R M V V I M F I A F L V C W V P Y A S V A W F I F C N Q G S E F G P V F M T M P A F F A K S S A I 300
EJ RH2-1 F N P V I Y I G L N Q Q F P W M H D A D S Y G I T P E D E T S V S Q S K T E V S S V A P A 345EJ RH2-2 F N P I I Y I G M N K Q F R G C M M Q T V F G K T P E D E T S V S T S K T E V S S V G P A 345EJ LWS Y N P I I Y V F M N R Q F R S C I M Q L F G K A G D D A S E V S T S K T E V S S V S P S 334EJ RH1 Y N P L I Y V C M N K Q F R H C M I T T L C C G K N P F E E E E G A S T T A S K T E A S S V S S V S P A 352
Page 32
The
Jou
rnal
of
Exp
erim
enta
l Bio
logy
– A
CC
EPT
ED
AU
TH
OR
MA
NU
SCR
IPT (kbp)
8.0
3.0
2.0
6.0
4.05.0
A1 2
B1 2
Page 33
The
Jou
rnal
of
Exp
erim
enta
l Bio
logy
– A
CC
EPT
ED
AU
TH
OR
MA
NU
SCR
IPT
Page 34
The
Jou
rnal
of
Exp
erim
enta
l Bio
logy
– A
CC
EPT
ED
AU
TH
OR
MA
NU
SCR
IPT
Page 35
The
Jou
rnal
of
Exp
erim
enta
l Bio
logy
– A
CC
EPT
ED
AU
TH
OR
MA
NU
SCR
IPT
Page 36
The
Jou
rnal
of
Exp
erim
enta
l Bio
logy
– A
CC
EPT
ED
AU
TH
OR
MA
NU
SCR
IPT
Page 37
The
Jou
rnal
of
Exp
erim
enta
l Bio
logy
– A
CC
EPT
ED
AU
TH
OR
MA
NU
SCR
IPT
Application Primer name Primer sequence RT-PCR Poly-T CTGATCTAGAGGTACCGGATCCT17 Degenerate PCR HPO-Fw AAGAAGYTCMGTCMACCTCTYAAYT HPO-Rv GTTCATGAAGACRTAGATDAYAGGGTTRTA 5'-RACE GRN-Rv1 GGTGTAGTAGTCTGGTCCAGCAGGAG GRN-Rv2 CCTCAGGGATGTACCTTGACCAGCC RED-Rv1 ACACAGTAGGCCAGGATCGTGACAACCAC RED-Rv2 TATAGCAGAGGATGATGATAGCGAGGGG RHOD-Rv ATGGGCTTGCAGACGACCAACCACCTC Poly C-amp GCGCATGCAGTACTAAGCTTC17 C-amp GCGCATGCAGTACTAAGCTT 3'-RACE GRN-Fw1 TGGTCACTGGTGGTTCTTGCTGTCG GRN-Fw2 ACATTGTTGTGTGCAAGCCTATGGG GRN-a-Fw1 AGCAAATGTGTGGATCTACAGGTTG GRN-a-Faw2 TGCTTATGTGGATTTACTGTCACTTTC RED-Fw1 TGTGGTCCCTGACTGTCATCTCTTG RED-Fw2 GAAACGTCAAGTTTGATGCCAAATGG RHOD-Fw TGCTCGTGCGGAATCGACTACTAC T-amp CTGATCTAGAGGTACCGGATCC Southern blotting probe CLPGRN-FwQ AACTTYTACATCCCCATGTCYAACARG CLPGRN-RvQ AGGGTGTAGTARTCAGGTCCACAGGAG RED-RvA GGGTTGTATATGGTGGCGCTCTTG