Three-Dimensional Atomic Force Microscopy: Interaction ForceVector by Direct Observation of Tip TrajectoryKrishna P. Sigdel,† Justin S. Grayer,† and Gavin M. King*,†,‡
†Department of Physics and Astronomy and ‡Joint with the Department of Biochemistry, University of Missouri-Columbia,Columbia, Missouri 65211
*S Supporting Information
ABSTRACT: The prospect of a robust three-dimensional atomic force microscope(AFM) holds significant promise in nanoscience. Yet, in conventional AFM, the tip−sample interaction force vector is not directly accessible. We scatter a focused laserdirectly off an AFM tip apex to rapidly and precisely measure the tapping tiptrajectory in three-dimensional space. This data also yields three-dimensionalcantilever spring constants, effective masses, and hence, the tip−sample interactionforce components via Newton’s second law. Significant lateral forces representing 49and 13% of the normal force (Fz = 152 ± 17 pN) were observed in common tappingmode conditions as a silicon tip intermittently contacted a glass substrate in aqueous solution; as a consequence, the direction ofthe force vector tilted considerably more than expected. When addressing the surface of a lipid bilayer, the behavior of the forcecomponents differed significantly from that observed on glass. This is attributed to the lateral mobility of the lipid membranecoupled with its elastic properties. Direct access to interaction components Fx, Fy, and Fz provides a more complete view of tipdynamics that underlie force microscope operation and can form the foundation of a three-dimensional AFM in a plurality ofconditions.
KEYWORDS: AFM, 3D, pointing noise, normal, lateral, back scattered
The atomic force microscope (AFM) is a ubiquitous toolacross nanoscience.1,2 The technique owes its popularity
to its combination of high-resolution coupled with highversatility; it can operate equally well in vacuum and in liquidenvironments, as well as on conducting and insulatingspecimens. The heart of an AFM consists of a sharp tip affixedto the end of a compliant cantilever. In conventional AFM, thelocal three-dimensional (3D) position of the tip is notobservable; instead, the vertical deflection (bending) ΔZ ofthe cantilever away from its equilibrium position is measured.3,4
This observable yields force.In most imaging and spectroscopy applications, force
measurements are made in the z direction, that is, normal tothe sample surface. However, torsional deflection (twisting) ofthe cantilever can also be monitored, as in frictional forcemicroscopy.5 In both cases, tip motion, which occurs in threedimensions, is convolved into angular displacements of thecantilever. It is challenging to infer 3D tip trajectories from thisreduced coordinate system, even if the geometry of the tip andits orientation relative to the sample are known. This is becausetip and cantilever dynamics are not always in lock-step witheach other as transient excitations can propagate along theflexible cantilever, especially during fast scanning.6,7 Further-more, frictional coupling between the tip and sample causescomplex dynamics, such as cantilever bowing and tip slippingthat are convolved with the ΔZ signal.8−10
Despite limitations, researchers have utilized the conven-tional AFM observables to achieve numerous powerful insights.Three-dimensional AFM11−17 represents an exciting capability
which, for example, has recently been utilized to measure theforce required to move a single atom on a surface in vacuum13
and map surface hydration layers in fluid.14 In a powerfulimplementation, a large amount of frequency shift data arecollected at various lateral positions and then analyzed, leadingto the assignment of 3D interaction force vectors with atomicprecision.13,17 This process can take hours to complete, whichlimits the types of samples that can be studied as well as theexperimental conditions. An alternative approach has reducedthe acquisition time scale significantly;14,18 however, themethod still relies on an inherently one-dimensional observable.In this Letter, we report 3D force measurements based on a
3D local observable, rather than on cantilever deflection alone.By directly observing the three-dimensional tapping mode tiptrajectory, we rapidly (10 ms) and precisely (σ ≤ 17 pN)measure the interaction force components at arbitrary points inspace in a room-temperature fluid. The approach yields the 3Dforce components without the need for lateral scanning. Thus,it places minimal restrictions on experiments.Our measurements build upon ultrastable AFM,19 a recently
developed technique that was inspired by surface-coupledoptical trapping microscopy methods. Ultrastable AFMemploys a focused laser that backscatters off the tip itself torapidly yield tip position with high spatial precision in 3D. Inprevious work, this tip-position data was used to stabilize the tip
Received: June 20, 2013Revised: October 2, 2013Published: October 7, 2013
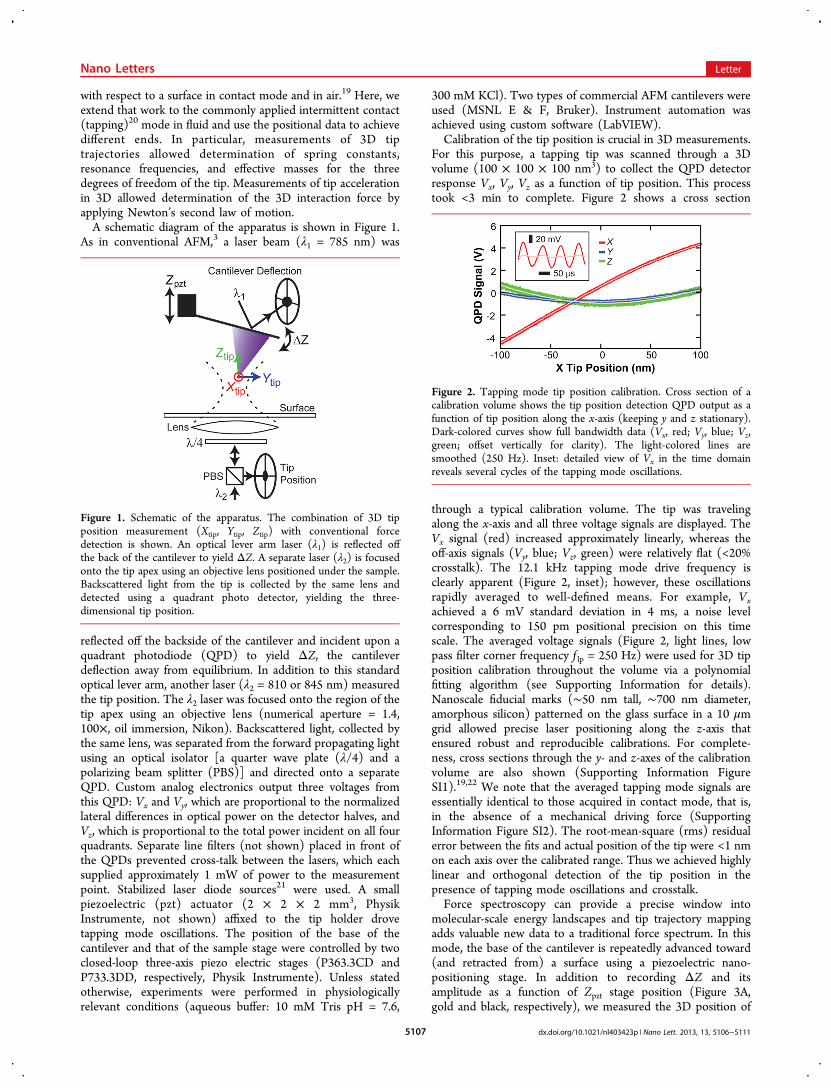
with respect to a surface in contact mode and in air.19 Here, weextend that work to the commonly applied intermittent contact(tapping)20 mode in fluid and use the positional data to achievedifferent ends. In particular, measurements of 3D tiptrajectories allowed determination of spring constants,resonance frequencies, and effective masses for the threedegrees of freedom of the tip. Measurements of tip accelerationin 3D allowed determination of the 3D interaction force byapplying Newton’s second law of motion.A schematic diagram of the apparatus is shown in Figure 1.
As in conventional AFM,3 a laser beam (λ1 = 785 nm) was
reflected off the backside of the cantilever and incident upon aquadrant photodiode (QPD) to yield ΔZ, the cantileverdeflection away from equilibrium. In addition to this standardoptical lever arm, another laser (λ2 = 810 or 845 nm) measuredthe tip position. The λ2 laser was focused onto the region of thetip apex using an objective lens (numerical aperture = 1.4,100×, oil immersion, Nikon). Backscattered light, collected bythe same lens, was separated from the forward propagating lightusing an optical isolator [a quarter wave plate (λ/4) and apolarizing beam splitter (PBS)] and directed onto a separateQPD. Custom analog electronics output three voltages fromthis QPD: Vx and Vy, which are proportional to the normalizedlateral differences in optical power on the detector halves, andVz, which is proportional to the total power incident on all fourquadrants. Separate line filters (not shown) placed in front ofthe QPDs prevented cross-talk between the lasers, which eachsupplied approximately 1 mW of power to the measurementpoint. Stabilized laser diode sources21 were used. A smallpiezoelectric (pzt) actuator (2 × 2 × 2 mm3, PhysikInstrumente, not shown) affixed to the tip holder drovetapping mode oscillations. The position of the base of thecantilever and that of the sample stage were controlled by twoclosed-loop three-axis piezo electric stages (P363.3CD andP733.3DD, respectively, Physik Instrumente). Unless statedotherwise, experiments were performed in physiologicallyrelevant conditions (aqueous buffer: 10 mM Tris pH = 7.6,
300 mM KCl). Two types of commercial AFM cantilevers wereused (MSNL E & F, Bruker). Instrument automation wasachieved using custom software (LabVIEW).Calibration of the tip position is crucial in 3D measurements.
For this purpose, a tapping tip was scanned through a 3Dvolume (100 × 100 × 100 nm3) to collect the QPD detectorresponse Vx, Vy, Vz as a function of tip position. This processtook <3 min to complete. Figure 2 shows a cross section
through a typical calibration volume. The tip was travelingalong the x-axis and all three voltage signals are displayed. TheVx signal (red) increased approximately linearly, whereas theoff-axis signals (Vy, blue; Vz, green) were relatively flat (<20%crosstalk). The 12.1 kHz tapping mode drive frequency isclearly apparent (Figure 2, inset); however, these oscillationsrapidly averaged to well-defined means. For example, Vxachieved a 6 mV standard deviation in 4 ms, a noise levelcorresponding to 150 pm positional precision on this timescale. The averaged voltage signals (Figure 2, light lines, lowpass filter corner frequency f lp = 250 Hz) were used for 3D tipposition calibration throughout the volume via a polynomialfitting algorithm (see Supporting Information for details).Nanoscale fiducial marks (∼50 nm tall, ∼700 nm diameter,amorphous silicon) patterned on the glass surface in a 10 μmgrid allowed precise laser positioning along the z-axis thatensured robust and reproducible calibrations. For complete-ness, cross sections through the y- and z-axes of the calibrationvolume are also shown (Supporting Information FigureSI1).19,22 We note that the averaged tapping mode signals areessentially identical to those acquired in contact mode, that is,in the absence of a mechanical driving force (SupportingInformation Figure SI2). The root-mean-square (rms) residualerror between the fits and actual position of the tip were <1 nmon each axis over the calibrated range. Thus we achieved highlylinear and orthogonal detection of the tip position in thepresence of tapping mode oscillations and crosstalk.Force spectroscopy can provide a precise window into
molecular-scale energy landscapes and tip trajectory mappingadds valuable new data to a traditional force spectrum. In thismode, the base of the cantilever is repeatedly advanced toward(and retracted from) a surface using a piezoelectric nano-positioning stage. In addition to recording ΔZ and itsamplitude as a function of Zpzt stage position (Figure 3A,gold and black, respectively), we measured the 3D position of
Figure 1. Schematic of the apparatus. The combination of 3D tipposition measurement (Xtip, Ytip, Ztip) with conventional forcedetection is shown. An optical lever arm laser (λ1) is reflected offthe back of the cantilever to yield ΔZ. A separate laser (λ2) is focusedonto the tip apex using an objective lens positioned under the sample.Backscattered light from the tip is collected by the same lens anddetected using a quadrant photo detector, yielding the three-dimensional tip position.
Figure 2. Tapping mode tip position calibration. Cross section of acalibration volume shows the tip position detection QPD output as afunction of tip position along the x-axis (keeping y and z stationary).Dark-colored curves show full bandwidth data (Vx, red; Vy, blue; Vz,green; offset vertically for clarity). The light-colored lines aresmoothed (250 Hz). Inset: detailed view of Vx in the time domainreveals several cycles of the tapping mode oscillations.
Nano Letters Letter
dx.doi.org/10.1021/nl403423p | Nano Lett. 2013, 13, 5106−51115107
the tapping MSNL-F tip as it was advanced at a rate of 50 nm/stoward a clean glass surface in aqueous buffer solution (Figure3B). As expected, the amplitude of ΔZ was reduced uponinteraction with the surface. This dependence forms the basis oftapping mode imaging feedback. We note that the zero point ofZpzt is arbitrary; the tip halted its advance when a
predetermined ΔZ amplitude reduction was achieved. The tipwas then held in intermittent contact with the surface for aperiod of time and retracted and this cycle was repeated (seeSupporting Information Figure SI3 for full cycle data). We notethat we have also observed asymmetric behavior of the ΔZsignal during intermittent contact (Supporting InformationFigure SI4), an issue which has been discussed.23
Simultaneously acquired 3D tip trajectory data during tipadvance are shown (Figure 3B, Xtip, red; Ytip, blue; and Ztip,green). Full bandwidth data (sampling rate: 690 kHz) aredrawn in dark colors; low pass filtered data ( f lp = 1 kHz) areoverlaid in light. The traditional observable ΔZ yields littleinformation when the tip is out of contact with the surface;however, Ztip exhibits a steep linear slope when the tip is abovethe surface and advancing. The commanded tip advance rate(50 nm/s) applied to the Zpzt can be compared to the locallymeasured rate. The disparity between them (10% in this case)becomes increasingly pronounced at low (drift-limited) pullingvelocities, such as 1 nm/s or less, that have been used in state-of-the-art biophysical experiments.24 In terms of average lateraltip positions, no significant motion was detected as the tip cameinto intermittent contact with the surface; however, the lateralamplitudes were altered. Interestingly, significant Ytip “slipping”along the surface was measured in contact mode approachcurves (Supporting Information Figure SI5), an observationwhich portends applications in tribology. To provide aninstantaneous view of tip dynamics, we show the 3D positionof the oscillating tip stationed 30 nm above the surface (Figure3C). The data was filtered in a 1 kHz wide band about the 27.5kHz drive frequency (i.e., high pass cut off f hp = 27 kHz, lowpass cut off f lp = 28 kHz, fifth order). The largest amplitudeobserved was in the z-direction (12 nm), but the Ytip amplitudewas also significant (4.0 nm) owing to the angle (α = 17 ± 1°)built into the tip fixture of our AFM. We note that this angleensures that the tip contacts the surface first; most commercialAFM’s have built-in angles, typically ∼15°. The rms amplitudeof Xtip was 2.8 Å. Though small, this is significantly above thenoise floor of the measurement, which was ∼0.15 Å between 26and 29 kHz, as determined by integrating the power spectraldensity (Supporting Information Figure SI6). We note thatvariations in conditions (e.g., drive frequency, drive amplitude,tip selection) altered the relative amplitudes of the tiptrajectories.Determining force in AFM generally requires knowledge of
the cantilever spring constant. Our apparatus allowed direct
Figure 3. 3D tip trajectory during force spectroscopy. (A) Thetraditional observable ΔZ (gold) and its amplitude (black) plotted as afunction of Zpzt displacement during a tapping-mode advance curveshows the expected decrease in oscillation amplitude near the surface.The horizontal axis is discontinuous at Zpzt = 0 nm, indicating wherethe tip advance was halted. (B) Simultaneously acquired 3D tippositions: Xtip, red; Ytip, blue; and Ztip, green. (C) Bandpass filtered tiptrajectory plotted as a function of time when positioned 30 nm abovethe surface.
Figure 4. Measurement of cantilever spring constants in three dimensions. (A) Power spectral density of the 3D positional fluctuations of athermally driven tip in x (red), y (blue), and z (green). Data acquired approximately 1 μm above the surface in air; the corner frequency of the z-detection electronics (100 kHz) was set lower than the two lateral channels and is clearly visible. The labeled points b, c, and d represent theresonance peaks that are magnified in panels (B), (C), and (D), respectively. The 3D spring constants and resonance frequencies were deduced fromsimple harmonic oscillator fits (B−D, black lines). Illustrations of the corresponding modes of the cantilever are also displayed. Note: all axes arelinear, except the vertical axis of panel (A), which is logarithmic.
Nano Letters Letter
dx.doi.org/10.1021/nl403423p | Nano Lett. 2013, 13, 5106−51115108
measurement of the 3D spring constants kx, ky, and kz. Toachieve this, we monitored the positional fluctuations of athermally driven tip that was stationed 1 μm above a surface atroom temperature. We identified peaks in the power spectraldensity (PSD) of this data corresponding to three principlemodes of the MSNL-E tip (Figure 4). Simple harmonicoscillator fits25 to each of these peaks output 3D springconstants. To optimize acquisition, data was acquiredsequentially on each axis, in air, and a simplified (linear)calibration procedure was used (see Supporting Information fordetails). The experimentally measured spring constants were kx= 17 ± 8 N/m, ky =26 ± 9 N/m, and kz = 0.17 ± 0.01 N/m(average ± σ). We used the cantilever geometry and well-known material parameters to corroborate these measurementsvia analytical calculations26 as well as finite element modeling(COMSOL). In all cases, the theoretical spring constants werewithin a factor of 2 of experimentally determined values.Finally, we deduced the interaction force vector directly from
the measured tip trajectory Xtip(t), Ytip(t), and Ztip(t). Thesecond time derivative of these positions provides a
straightforward means to deduce the interaction forcecomponents via Newton’s second law, for example,Fx = mx Xtip(t). Figure 5A−C displays the 3D acceleration ofan MSNL-E tip when positioned 15 nm above (blue dashed)and in intermittent contact with (red) a glass surface. As before,data was bandpass filtered about the drive frequency: 1 kHzwindow, fifth order. We take the difference betweenacceleration amplitudes to be proportional to the tip−sampleinteraction, although hydrodynamic damping from thesurrounding medium could also contribute (e.g., increasedviscous drag due to the fluid boundary layer).27 An effectivemass for each degree of freedom mx = 1.1 (±0.5) × 10−10 kg,my = 1.4 (±0.5) × 10−10 kg, mz = 5.3 (±0.3) × 10−11 kg,followed directly from a simple harmonic model, for example,mx = kx/ωox
2 , where ωox is the fundamental angular frequency ofthe x mode in fluid (Supporting Information Figure SI7).Because of the fluid, the effective mass is larger than the staticmass of the beam mbeam ≈ 1 × 10⁻¹¹ kg, estimated from thecantilever’s dimensions and density.28
Figure 5. Interaction force vector via tip trajectory on glass and lipid. Measured 3D tip accelerations [(A) x-component, (B) y-component, and (C)z-component; bandpass filtered 1 kHz about the drive frequency: 6 kHz] are shown when in intermittent contact (red) and 15 nm above (bluedashed) a glass surface. (D) The components of the three-dimensional force as a function of the height of the tip’s base, Zpzt. The axis isdiscontinuous after Zpzt = −5 nm, indicating where the tip advance was halted. (E) Angles θ and ϕ characterizing the 3D force vector are plottedversus time. Intermittent contact was established with the surface at t ∼ 340 ms. The tip advance toward the surface was halted at at t = 440 ms. θand ϕ are defined (D, inset) as is the static angle α built into the apparatus. (F−H) The 3D tip acceleration data acquired on and 15 nm above a lipidbilayer surface (bandpass filtered 1 kHz about the drive frequency: 9 kHz). (I) The 3D force components experienced by the tip when advancedtoward the lipid membrane surface are shown. A cross section line scan (red) through an image (I, inset; scale bar = 200 nm) of the lipid sampleconfirms the presence of a 4.5 nm high lipid bilayer. (J) Visualizations of the interaction force vector at locations of decreasing tip−sample heightabove a glass surface (Zpzt = −1, −2, −3, −4, and −5 nm, respectively) showing the rapid suppression of the force pointing noise after initialinteraction with the surface.
Nano Letters Letter
dx.doi.org/10.1021/nl403423p | Nano Lett. 2013, 13, 5106−51115109
To determine the 3D force experienced by the tip, the rmsamplitude of the 3D tip acceleration was averaged for 60 mswith the tip positioned 15 nm above the surface (i.e., point ofclosest tip approach = 15 nm). The amplitudes of this “offsurface” reference vector were 0.59 ± 0.03, 2.85 ± 0.06, and12.1 ± 0.2 m/s2 in x, y, and z, respectively. Subsequently, theaverage acceleration amplitudes (determined in continuous 10ms time windows, ∼60 tip oscillations) were subtracted fromthe “off surface” reference accelerations and multiplied by theappropriate effective masses to yield 3D force components as afunction of Zpzt position during a 50 nm/s advance curve(Figure 5D). Thus, each data point represents the average forcemagnitude ( f lp = 100 Hz) along each axis. Positive forcesindicate a reduction in tip acceleration amplitudes uponinteraction with the surface. When held in intermittent contactwith the glass surface at Zpzt = −5 nm for 0.25 s, the averagemagnitude of the normal force component Fz was 152 pN. Thisvalue is similar to the magnitude estimated using the traditionalobservable (132 pN, based on the change in ΔZ amplitude(1.10 nm) and the ΔZ measured spring constant: k = 0.12 N/m), corroborating our trajectory-based force analysis. We notethat the method is limited to soft tapping applications(desirable in many biological studies) in which the DCdeflection of the tip is negligible. Further, the analysis assumesthat the effective masses and the viscous damping do not varysignificantly over the distance (15 nm) that separates the “offsurface” reference acceleration determination from themeasurement point. We also note that the bandpass filtereddata shown (Figure 5A−C,F−H) appear largely harmonic andsymmetric. However, underlying complexity in the motionbecomes evident when the filtering is relaxed (SupportingInformation Figure SI8). Narrow bandpass filtering excludeshigher harmonic contributions; therefore, nonlinearities are notexpected to contribute to our interaction analysis.29 In terms ofprecision, the rms noise for each force component was σx = 5pN, σy = 9 pN, and σz = 17 pN (Δf = 4−100 Hz). This noisechanged by <10% when calculated above and in intermittentcontact with the surface, thus the internal feedback to thepiezoelectric stages did not contribute substantially to themeasured force noise.Significant forces acted on the tip in both lateral directions.
The force in the y-direction (i.e., nearly parallel to the long axisof the cantilever) achieved a maximum value of ∼74 pN, whichis approximately half of the value of the normal force. This is60% larger than expected based on the angle α = 17° built intothe apparatus (Figure 5D, inset). The x-component of theinteraction rose to 13% of the normal force. Thus the measuredforce vector tilted considerably away from the surface normal.The orientation of a vector in three-dimensional space can be
defined by two angles, a polar angle cos θ = (Fz/F) and anazimuthal angle cos ϕ = Fx/(F sin θ), where F = (Fx
2 + Fy2 +
Fz2)1/2. Therefore we adopted a polar coordinate system with
the origin at the tip apex (Figure 5D, inset). Figure 5E shows atime course of these two angles while the tapping tip wasadvanced toward the glass surface. The advance rate was heldconstant Zpzt = 50 nm/s until t = 440 ms, at which point it washalted (Zpzt = 0). As the data indicate, the direction of theinteraction was ill-defined initially; however, the pointing noiseof the force vector rapidly quenched at t ∼ 340 ms,corresponding to the onset of intermittent contact with thesurface. Thus, the orientation of the force vector wasestablished early upon interacting with the surface and wasrelatively stable thereafter (Figure 5 J). At Zpzt = −5 nm, the
average values of the angles were θ = 28 ± 3° and ϕ = 75 ± 3°,where the uncertainty in direction (pointing noise) of the forcevector is the standard deviation of the angles in a bandwidth Δf= 4−100 Hz. The static geometry built into the apparatusimplied that θ should be equal to α = 17° and likewise that ϕ =90° (the built-in angle in the x-direction equals zero).Surprisingly, our measurements revealed that θ was 11° largerthan expected and ϕ differed by 15°. We note that in thecurrent analysis, which is based on time-averaged accelerationamplitudes, an interaction emanating from the positive x-direction results in an equivalent signal to the same interactionacting from the negative x-direction. Hence, there is a 2-folddegeneracy in the assignment of angle ϕ, it is either 75 or 105°(i.e., specified up to a reflection about the y-axis).As a final application relevant to the biophysics community,
we measured the 3D tip trajectory as a tapping tip encountereda lipid bilayer surface (Figure 5F−I). Lipid vesicles consisting of1-palmitoyl-2-oleoyl-sn-glycero-3-phosphocholine (POPC,Avanti Polar Lipids, Inc.) were extruded and then depositedonto clean glass surfaces (Supporting Information for details).A representative image (Figure 5I, inset) shows a ∼4.5 nm step,confirming the presence of a bilayer.30 Finally, 3D forcespectroscopy was performed in a manner identical to thatdescribed for glass. While the normal force components Fzbehaved similarly on the two samples, the lateral componentson lipid diverged significantly from their previous behavior onglass. Interestingly, in this lipid case, the x and y accelerationamplitudes on the surface were larger than those measured 15nm above (Figure 5F,G, compare dashed and solid lines). Thisgives rise to negative lateral force magnitudes in our analysis(Figure 5I, red and blue). We posit that this phenomenon isdue to cantilever mode mixing facilitated by the unusualmechanical properties of the lipid bilayer, which combine highlateral mobility with significant compressibility [e.g., an effectiveelastic modulus Elipid ∼ 20 MPa,31 leads to a contact stiffnessroughly 2000-fold less than glass (Eglass ∼ 50 GPa)]. We haverepeated these experiments using nominally identical tips, tipholders, and lipid sample preparations. In contrast to glasssurface results, which are generally consistent, the lipidexperiments have yielded rich and varied behavior. In someexperiments Fx goes positive upon interacting with lipid, whileFy goes negative (Supporting Information Figure SI9A); inothers Fx is largely unchanged and Fy goes positive uponinteracting with the lipid (Supporting Information FigureSI9B). Curiously, this diversity of tip−sample interactionbehavior was observed on a relatively simple single-componentlipid bilayer using nominally identical preparations (all at ∼25°C).We studied the three-dimensional trajectory of commercial
AFM tips as they interacted with glass and lipid surfaces in awidespread mode of operation: tapping mode, in aqueoussolution. Upon measuring the 3D spring constants and effectivemasses, we determined the interaction force components as atip came into intermittent contact with the surface. Owing tothe 3D nature of the local observable, the method yielded the3D force rapidly (10 ms, after calibration and referenceacceleration determination) without the need for lateralscanning.Direct measurement of the orthogonal force components in
three dimensions provided insight into the tip−sampleinteraction. Though tapping mode clearly minimizes lateralforces applied to the sample compared to contact mode, ourmeasurements indicate that these forces are still substantial,
Nano Letters Letter
dx.doi.org/10.1021/nl403423p | Nano Lett. 2013, 13, 5106−51115110
reaching about 50% of the normal force, and lead to a tilt angleof the force vector significantly larger than the static geometryof the apparatus. The technique is currently limited totransparent surfaces as the tip position detection laser (810or 845 nm) passes through the substrate; though shifting thiswavelength further into the infrared would enable generalizingto common semiconducting substrates, for example, silicon.32
Furthermore, the method is compatible with high speed AFM;indeed, as cantilevers become increasingly small there isgrowing demand for high numerical aperture optics to replacetraditional optical lever arm detection schemes.33 Directmeasurement of 3D interaction forces can enhance ourunderstanding of common AFM operations and provide afoundation for a robust 3D force probe in perturbativeconditions relevant to numerous biological and chemicalinvestigations. For example, we foresee applications inbiophysics such as mapping trajectories of disordered proteinstructures and flexible loops,34 which are critical facilitators ofprotein−protein interactions.
■ ASSOCIATED CONTENT*S Supporting InformationA detailed description of the sample preparation and tipselection, tip position calibration, and data acquisition as well as3D spring constant determination can be found in theSupporting Information. Further, we show tapping mode tipposition calibrations in y and z, contact and tapping modecalibration comparison, full cycle force spectrum, asymmetricbehavior of ΔZ during intermittent contact, lateral slippingduring contact mode approach, signal-to-noise determinationfor Xtip, resonance frequency dependence on medium, detailedview of tapping tip dynamics on glass, and the diversity of 3Dforce components on lipid bilayers. This material is availablefree of charge via the Internet at http://pubs.acs.org.
■ ACKNOWLEDGMENTSThe authors are grateful to Allison Churnside for LabVIEWsoftware and discussions. This work was supported by theBurroughs Wellcome Fund (Career Award at the ScientificInterface, G.M.K.) and the National Science Foundation(CAREER Award No. 1054832, G.M.K.).
■ REFERENCES(1) Binnig, G.; Quate, C. F.; Gerber, C. Phys. Rev. Lett. 1986, 56 (9),930−933.(2) Bippes, C.; Muller, D. Rep. Prog. Phys. 2011, 74, 086601.(3) Meyer, G.; Amer, N. M. Appl. Phys. Lett. 1988, 53 (12), 1045−1047.(4) Rugar, D.; Mamin, H. J.; Guethner, P. Appl. Phys. Lett. 1989, 55,2588−2590.(5) Meyer, G.; Amer, N. M. Appl. Phys. Lett. 1990, 57, 2089−2091.(6) Howard-Knight, J. P.; Hobbs, J. K. J. Appl. Phys. 2011, 109,074309.(7) Payton, O. D.; Picco, L.; Robert, D.; Raman, A.; Homer, M. E.;Champneys, A. R.; Miles, M. J. Nanotechnology 2012, 23 (20), 205704.(8) Hoh, J. H.; Engel, A. Langmuir 1993, 9, 3310−3312.(9) Pratt, J. R.; Shaw, G. A.; Kumanchik, L.; Burnham, N. A. J. Appl.Phys. 2010, 107, 044305.
(10) Stiernstedt, J.; Rutland, M. W.; Attard, P. Rev. Sci. Instrum. 2005,76, 083710.(11) Radmacher, M.; Cleveland, J. P.; Fritz, M.; Hansma, H.;Hansma, P. Biophys. J. 1994, 66, 2159−2165.(12) Holscher, H.; Langkat, S. M.; Schwarz, A.; Wiesendanger, R.Appl. Phys. Lett. 2002, 81, 4428−4430.(13) Ternes, M.; Lutz, C. P.; Hirjibehedin, C. F.; Giessibl, F. J.;Heinrich, A. J. Science 2008, 319 (5866), 1066−9.(14) Fukuma, T.; Ueda, Y.; Yoshioka, S.; Asakawa, H. Phys. Rev. Lett.2010, 104, 016101.(15) Dai, G.; Hassler-Grohne, W.; Huser, D.; Wolff, H.; Danzebrink,H.-U.; Koenders, L.; Bosse, H. Meas. Sci. Technol. 2011, 22, 094009.(16) Abe, M.; Sugimoto, Y.; Namikawa, T.; Morita, K.; Oyabu, N.;Morita, S. Appl. Phys. Lett. 2007, 90 (20), 203103.(17) Albers, B. J.; Schwendemann, T. C.; Baykara, M. Z.; Pilet, N.;Liebmann, M.; Altman, E. I.; Schwartz, U. D. Nat. Nanotechnol. 2009,4, 307−310.(18) Herruzo, E. T.; Asakawa, H.; Fukuma, T.; Garcia, R. Nanoscale2013, 5 (7), 2678−85.(19) King, G. M.; Carter, A. R.; Churnside, A. B.; Eberle, L. S.;Perkins, T. T. Nano Lett. 2009, 9 (4), 1451.(20) Hansma, P. K.; Cleveland, J. P.; Radmacher, M.; Walters, D. A.;Hillner, P. E.; Bezanilla, M.; Fritz, M.; Vie, D.; Hansma, H. G.; Prater,C. B.; Massie, J.; Fukunaga, L.; Gurley, J.; Elings, V. Appl. Phys. Lett.1994, 64 (13), 1738−1740.(21) Carter, A. R.; King, G. M.; Ulrich, T. A.; Halsey, W.;Alchenberger, D.; Perkins, T. T. Appl. Opt. 2007, 46 (3), 421−7.(22) Churnside, A. B.; King, G. M.; Perkins, T. T. Proc. SPIE 2009,7405, 74050H.(23) Burnham, N. A.; Behrend, O. P.; Oulevey, F.; Gremaud, G.;Gallo, P. J.; Gourdon, D.; Dupas, E.; Kulik, A. J.; Pollock, H. M.;Briggs, G. A. D. Nanotechnology 1997, 8, 67−75.(24) Junker, J. P.; Ziegler, F.; Rief, M. Science 2009, 323 (5914),633−7.(25) te Riet, J.; Katan, A.; Rankl, C.; Stahl, S. W.; Buul, A. M.; Phang,I. Y.; Gomez-Casado, A.; Schon, P.; Gerritsen, J. W.; Cambi, A.;Rowan, A. E.; Vancso, G. J.; Jonkheijm, P.; Huskens, J.; Oosterkamp,T. H.; Gaub, H.; Hinterdorfer, P.; Figdor, C. G.; Speller, S.Ultramicroscopy 2011, 111, 1659.(26) Neumeister, J. M.; Ducker, W. A. Rev. Sci. Instrum. 1994, 65,2527.(27) Svoboda, K.; Block, S. M. Annu. Rev. Biophys. Biomol. Struct.1994, 23, 247−85.(28) In the absence of damping, the ratio of the effective (“lumped”)mass to the distributed mass of a cantilevered beam is 0.23; see Paul,W. J. Mechanical Vibration; John Wiley and Sons, Inc.: New York,2007. On the basis of the measured (3-fold) reduction in resonancefrequency in going from air to fluid, we estimate that the ratio of theeffective mass in water to the distributed beam mass meff
H2O/mbeam =(meff
H2O/meffair) × (meff
air/mbeam) ≈ 10 × 0.23 ≈ 2.(29) Stark, R. W.; Heckl, W. M. Rev. Sci. Instrum. 2003, 74, 5111.(30) Luckey, M., Membrane Structural Biology; Cambridge UniversityPress: Cambridge, UK, 2008.(31) Kunneke, S.; Kruger, D.; Janshoff, A. Biophys. J. 2004, 86 (3),1545−53.(32) Appleyard, D. C.; Lang, M. J. Lab Chip 2007, 7 (12), 1837−40.(33) Antognozzi, M.; Ulcinas, A.; Picco, L.; Simpson, S. H.; Heard, P.J.; Szczelkun, M. D.; Brenner, B.; Miles, M. J. Nanotechnology 2008, 19(38), 384002.(34) Sanganna Gari, R. R.; Frey, N. C.; Mao, C.; Randall, L. L.; King,G. M. J. Biol. Chem. 2013, 288 (23), 16848−54.
Nano Letters Letter
dx.doi.org/10.1021/nl403423p | Nano Lett. 2013, 13, 5106−51115111