34 Three-Dimensional Computerized Tomographic Reconstruction of Instantaneous Distribution of Chemiluminescence of a Turbulent Premixed Flame ∗ Yojiro ISHINO ∗∗ and Norio OHIWA ∗∗ The advanced CT (computerized tomography) reconstruction technique for measuring an instantaneous three-dimensional distribution of chemiluminescence of a turbulent pre- mixed flame is accomplished. In the technique, first, instantaneous two-dimensional images (‘projection’ images) of an objective flame are simultaneously taken from forty horizontal directions with a forty-lens camera. Next four hundred horizontal CT images, which are reconstructed from the ‘projection’ images by MLEM (maximum likelihood expectation maximization) algorithm, are vertically accumulated, resulting in an instantaneous three- dimensional distribution of flame-chemiluminescence. Results for a propane-air fuel-rich- premixed turbulent flame are as follows. The flame front is observed to be a thin wrinkled luminous region of 0.6 mm in thickness. The three-dimensional result clearly shows that the cusps observed in horizontal cross-sections correspond to ridges of the three-dimensional flame front. The luminosity is quenched at the ridges by Lewis number effect. Finally, various types of display of three-dimensional distribution are performed to demonstrate the three-dimensionality of data acquisition. Key Words: Digital Image Processing, Flow Visualization, Turbulent Flow, Combustion, Extinction, Flame, Optical Measurement, Three-Dimensional Measurement, Computerized Tomography 1. Introduction Many experimental and computational studies have been made on the flame structure in turbulent premixed flames (1) – (11) . During the last decade, two-dimensional laser diagnostic techniques, such as particle image ve- locimetry (PIV) and planar laser induced fluorescence (PLIF) technique, have progressively been employed to in- vestigate flame extinction mechanisms in turbulent flames (12) – (19) and in the interacting flames with vortices (20) – (24) . Recently three-dimensional measurement is strongly re- quired for detail investigation of behavior of turbulent flame, since three-dimensional turbulent flame front struc- tures are difficult to analyze from planar measurements solely. Therefore a variety of multi-plane experiments has been conducted. Bingham et al. (25) utilized the crossed-plane laser sheet for conventional tomographic ∗ Received 23rd April, 2004 (No. 04-4097) ∗∗ Graduate School of Engineering, Nagoya Institute of Technology, Gokiso-cho, Showa-ku, Nagoya 466–8555, Japan. E-mail: [email protected]measurement of a turbulent V-flame. Chen and Mansor (26) and O’Young and Bilger (27) obtained data of a two- plane two-dimensional Rayleigh thermometry of a turbu- lent flame using a couple of laser light sheets. More- over, Dinkelacker et al. (28) reported simultaneous two- plane two-dimensional OH and temperature measure- ments for locally quenched highly turbulent lean premixed flames. In addition, Landenfeld et al. (29) measured two- dimensional distributions of temperature and OH concen- tration in three adjacent planes (distance 1 mm) with two excimer lasers and six image-intensified charge-coupled device (CCD) cameras. Although much effort to ob- tain the three-dimensional information have been paid in the multi-plane, so-called ‘three-dimensional’ experi- ments, the thickness of measured volume is considerably restricted owing to complex arrangements of diagnostic systems and their expensive costs. In order to elucidate detail three-dimensional struc- ture of turbulent flame, it is worth obtaining the whole shape of instantaneous reaction zone of turbulent flame. In present study, therefore, another approach, that is, Series B, Vol. 48, No. 1, 2005 JSME International Journal
of Instantaneous Distribution of Chemiluminescence of a
Turbulent Premixed Flame∗
Yojiro ISHINO∗∗ and Norio OHIWA∗∗
The advanced CT (computerized tomography) reconstruction technique for measuringan instantaneous three-dimensional distribution of chemiluminescence of a turbulent pre-mixed flame is accomplished. In the technique, first, instantaneous two-dimensional images(‘projection’ images) of an objective flame are simultaneously taken from forty horizontaldirections with a forty-lens camera. Next four hundred horizontal CT images, which arereconstructed from the ‘projection’ images by MLEM (maximum likelihood expectationmaximization) algorithm, are vertically accumulated, resulting in an instantaneous three-dimensional distribution of flame-chemiluminescence. Results for a propane-air fuel-rich-premixed turbulent flame are as follows. The flame front is observed to be a thin wrinkledluminous region of 0.6 mm in thickness. The three-dimensional result clearly shows thatthe cusps observed in horizontal cross-sections correspond to ridges of the three-dimensionalflame front. The luminosity is quenched at the ridges by Lewis number effect. Finally,various types of display of three-dimensional distribution are performed to demonstrate thethree-dimensionality of data acquisition.
Many experimental and computational studies havebeen made on the flame structure in turbulent premixedflames(1) – (11). During the last decade, two-dimensionallaser diagnostic techniques, such as particle image ve-locimetry (PIV) and planar laser induced fluorescence(PLIF) technique, have progressively been employed to in-vestigate flame extinction mechanisms in turbulent flames(12) – (19) and in the interacting flames with vortices(20) – (24).Recently three-dimensional measurement is strongly re-quired for detail investigation of behavior of turbulentflame, since three-dimensional turbulent flame front struc-tures are difficult to analyze from planar measurementssolely. Therefore a variety of multi-plane experimentshas been conducted. Bingham et al.(25) utilized thecrossed-plane laser sheet for conventional tomographic
∗ Received 23rd April, 2004 (No. 04-4097)∗∗ Graduate School of Engineering, Nagoya Institute of
Technology, Gokiso-cho, Showa-ku, Nagoya 466–8555,Japan. E-mail: [email protected]
measurement of a turbulent V-flame. Chen and Mansor(26) and O’Young and Bilger(27) obtained data of a two-plane two-dimensional Rayleigh thermometry of a turbu-lent flame using a couple of laser light sheets. More-over, Dinkelacker et al.(28) reported simultaneous two-plane two-dimensional OH and temperature measure-ments for locally quenched highly turbulent lean premixedflames. In addition, Landenfeld et al.(29) measured two-dimensional distributions of temperature and OH concen-tration in three adjacent planes (distance 1 mm) with twoexcimer lasers and six image-intensified charge-coupleddevice (CCD) cameras. Although much effort to ob-tain the three-dimensional information have been paidin the multi-plane, so-called ‘three-dimensional’ experi-ments, the thickness of measured volume is considerablyrestricted owing to complex arrangements of diagnosticsystems and their expensive costs.
In order to elucidate detail three-dimensional struc-ture of turbulent flame, it is worth obtaining the wholeshape of instantaneous reaction zone of turbulent flame.In present study, therefore, another approach, that is,
Series B, Vol. 48, No. 1, 2005 JSME International Journal
35
instantaneous three-dimensional emission CT (comput-erized tomography) technique is proposed and accom-plished for a turbulent propane-air fuel-rich premixedflame. First instantaneous two-dimensional images (‘pro-jection’ images) of an objective flame are simultaneouslytaken from forty horizontal directions with a custom-mademulti-lens camera, which has forty lenses and a roll offilm. Next four hundred horizontal CT images, whichare reconstructed from the ‘projection’ images by MLEM(maximum likelihood expectation maximization)-CT al-gorithm(30) – (32), are vertically accumulated, resulting inan instantaneous three-dimensional distribution of flame-chemiluminescence. The results for a propane-air fuel-rich-premixed turbulent flame show that the flame frontis observed to be a thin wrinkled luminous region of0.6 mm in thickness and that the cusps observed in hor-izontal cross-sections correspond to ridges of the three-dimensional flame front. It is found that the luminositydistribution is quenched along the ridges by Lewis num-ber effect.
Tomographic reconstruction techniques, which basedon transmission or emission techniques, have been utilizedin combustion studies. Transmission tomographic recon-struction has been widely used(33) – (39). Correia et al.(40)
made a comparison between transmission and emission to-mographic reconstruction techniques, and mentioned thatthe disadvantage of transmission technique lay in the needfor background light source. Two-dimensional emissionreconstruction of temperature has been made by Leipertzet al.(41) Time averaged three-dimensional emission recon-struction of temperature, which is based on the radiationfrom luminous flame, has been attempted by Correia etal.(40) Most of emission techniques have been applied tothe measurement of local flame temperature fields(40). Ap-plications of emission tomography for internal engine di-agnostic system have been reported by Phillip et al.(42),however, the reconstructed images were ambiguous in or-der to investigate the turbulent flame front structure.
denotes an electronically excited state)(43) – (48) has longbeen a common and largely accepted practice. In thisproposed technique, the chemiluminescence light emittedfrom premixed flame is focused. However Najm et al.(49)
and Rehm and Paul(50) warn recently that such a chemilu-minescence is not universally correlated with heat releaserate and is not adequate indicators of local extinction offlame surface. Najm et al.(49) found that the mole fractionof HCO had excellent correlation with heat release rateover the whole range of unsteady curvature and strain-rateinvestigated in their study. Rehm and Paul(50) proposedthe usage of the product of CO and OH-LIF signals as amarker of local heat release rate or dilatation rate in flamefront. Three-dimensional tomographic reconstruction of
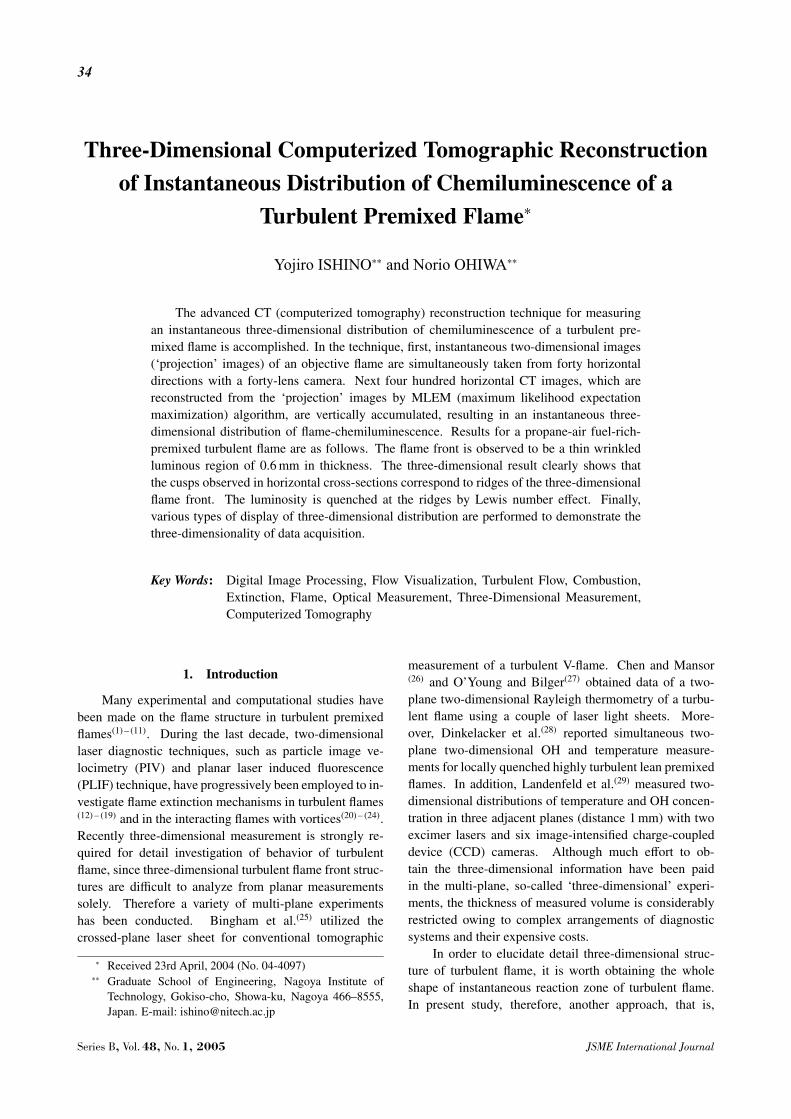
Fig. 1 Schematic diagram of the experimental apparatus andcoordinates system
weak LIF signal seems impossible at present because ofdifficulty in volumetric laser excitation and lack of sensi-tivity of cameras. As alternative way, chemiluminescencefrom premixed flame is selected for present investigation.
2. Experimental Apparatus and Method
2. 1 Instantaneous 3D-CT methodThe schematic diagram of the experimental appara-
tus and coordinates system is shown in Fig. 1. The carte-sian x – y – z coordinate and polar θ – φ coordinate systemare also depicted in the figure. In this method, first, thepipe burner with a turbulent premixed flame is settled atthe center of a custom-made multi-lens camera, which hasforty lenses no.1 – no.40. Instantaneous two-dimensional‘projection’ images (no.1 – no.40) of chemiluminescenceof an objective flame are simultaneously taken from fortydirections using the multi-lens camera. This simultaneousphotographic technique is called as ‘time-slice’ photogra-phy. By use of MLEM-CT algorithm, instantaneous two-dimensional chemiluminescence distributions of each hor-izontal cross-sections are reconstructed from related setsof forty horizontal line data picked up from ‘projection’images. Instantaneous three-dimensional distribution issimply built up by accumulating vertically the numeroushorizontal two-dimensional CT reconstructions. The ob-jective turbulent flame is also monitored simultaneouslyby high speed CCD camera from the reverse direction oflens no.33.
2. 2 ‘Time-slice’ photographic technique2. 2. 1 Multi-lens camera For ‘time-slice’ pho-
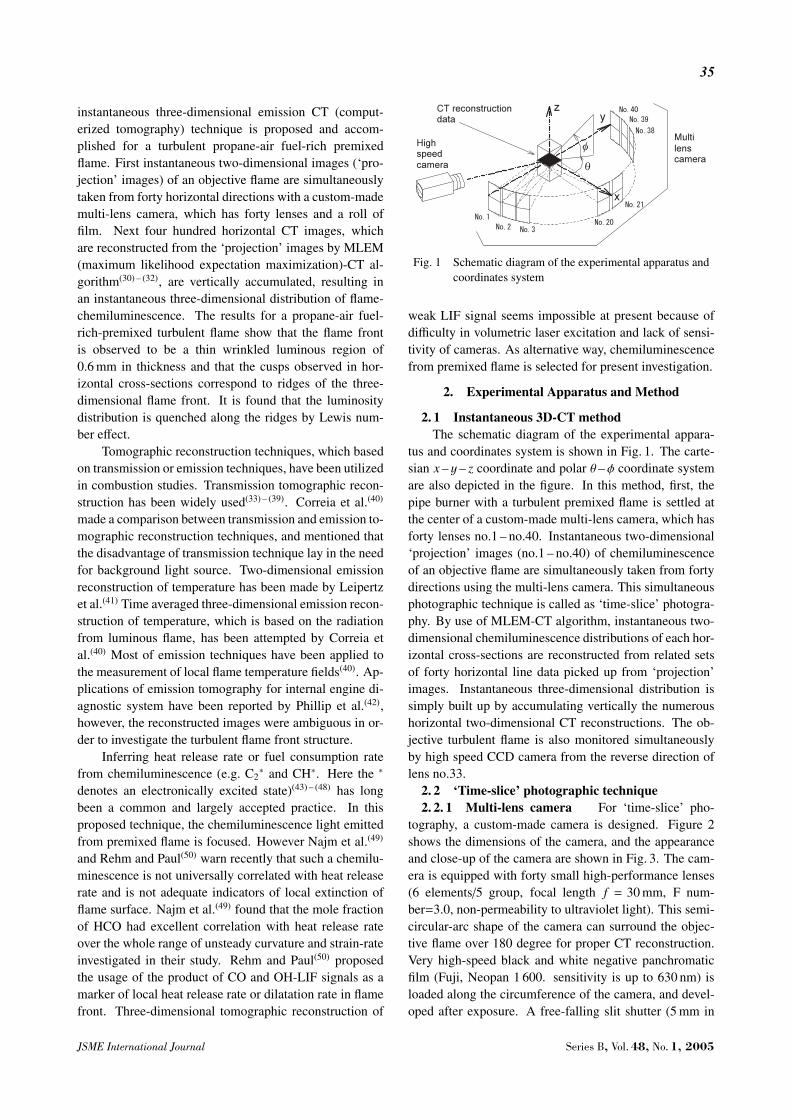
tography, a custom-made camera is designed. Figure 2shows the dimensions of the camera, and the appearanceand close-up of the camera are shown in Fig. 3. The cam-era is equipped with forty small high-performance lenses(6 elements/5 group, focal length f = 30 mm, F num-ber=3.0, non-permeability to ultraviolet light). This semi-circular-arc shape of the camera can surround the objec-tive flame over 180 degree for proper CT reconstruction.Very high-speed black and white negative panchromaticfilm (Fuji, Neopan 1 600. sensitivity is up to 630 nm) isloaded along the circumference of the camera, and devel-oped after exposure. A free-falling slit shutter (5 mm in
JSME International Journal Series B, Vol. 48, No. 1, 2005
36
Fig. 2 Dimensions of custom-made multi-lens camera
Fig. 3 Appearance (left) and close-up (right) of multi-lenscamera which equipped with forty small lenses
slit size), which travels simultaneously in front of everylens, controls exposure time of 1.2 ms. In this system, al-though no interference filter for radical emission is usedin order to ensure the fast-shuttering, the detection wave-length is limited to 400 – 600 nm by combination of thepanchromatic film and the non-UV lenses used. In this in-vestigation, therefore, detected flame images are treated asthose of chemiluminescence.
2. 2. 2 Digital image processing The developednegative film is digitized with a macro lens on a digitalcamera (Nikon, D1) to obtain the forty digital ‘projection’images of a turbulent flame. Alignment of each ‘projec-tion’ image is performed on the basis of burner rim po-sition of each image. The pixel values of the digital im-ages are still qualitative, because no compensation for thecharacteristic curve, which ensures the relation betweenexposure and density of negative film, has been made. Inthis experiment, however, the linear proportion betweenthe pixel values and integrated emission intensity on theline of sight at the pixel is tentatively assumed.
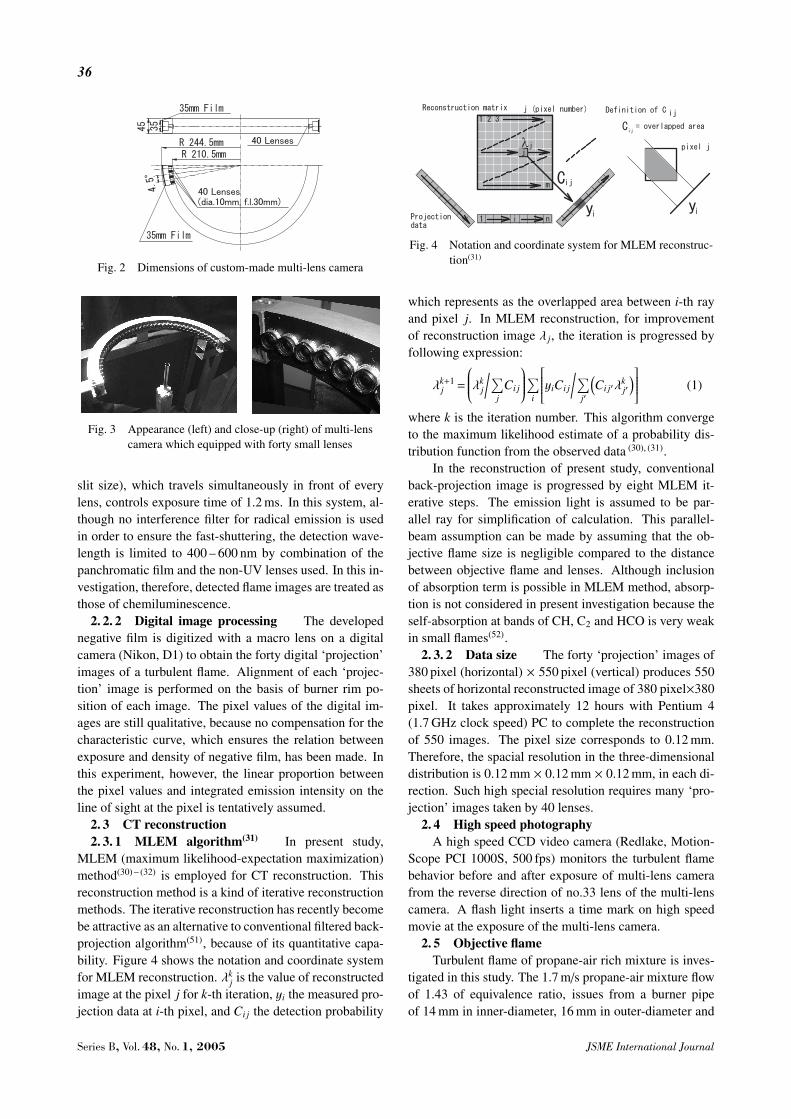
MLEM (maximum likelihood-expectation maximization)method(30) – (32) is employed for CT reconstruction. Thisreconstruction method is a kind of iterative reconstructionmethods. The iterative reconstruction has recently becomebe attractive as an alternative to conventional filtered back-projection algorithm(51), because of its quantitative capa-bility. Figure 4 shows the notation and coordinate systemfor MLEM reconstruction. λk
j is the value of reconstructedimage at the pixel j for k-th iteration, yi the measured pro-jection data at i-th pixel, and Ci j the detection probability
Fig. 4 Notation and coordinate system for MLEM reconstruc-tion(31)
which represents as the overlapped area between i-th rayand pixel j. In MLEM reconstruction, for improvementof reconstruction image λ j, the iteration is progressed byfollowing expression:
λk+1j =
λkj
/∑j
Ci j
∑
i
yiCi j
/∑j′
(Ci j′λ
kj′) (1)
where k is the iteration number. This algorithm convergeto the maximum likelihood estimate of a probability dis-tribution function from the observed data (30), (31).
In the reconstruction of present study, conventionalback-projection image is progressed by eight MLEM it-erative steps. The emission light is assumed to be par-allel ray for simplification of calculation. This parallel-beam assumption can be made by assuming that the ob-jective flame size is negligible compared to the distancebetween objective flame and lenses. Although inclusionof absorption term is possible in MLEM method, absorp-tion is not considered in present investigation because theself-absorption at bands of CH, C2 and HCO is very weakin small flames(52).
2. 3. 2 Data size The forty ‘projection’ images of380 pixel (horizontal) × 550 pixel (vertical) produces 550sheets of horizontal reconstructed image of 380 pixel×380pixel. It takes approximately 12 hours with Pentium 4(1.7 GHz clock speed) PC to complete the reconstructionof 550 images. The pixel size corresponds to 0.12 mm.Therefore, the spacial resolution in the three-dimensionaldistribution is 0.12 mm × 0.12 mm × 0.12 mm, in each di-rection. Such high special resolution requires many ‘pro-jection’ images taken by 40 lenses.
2. 4 High speed photographyA high speed CCD video camera (Redlake, Motion-
Scope PCI 1000S, 500 fps) monitors the turbulent flamebehavior before and after exposure of multi-lens camerafrom the reverse direction of no.33 lens of the multi-lenscamera. A flash light inserts a time mark on high speedmovie at the exposure of the multi-lens camera.
2. 5 Objective flameTurbulent flame of propane-air rich mixture is inves-
tigated in this study. The 1.7 m/s propane-air mixture flowof 1.43 of equivalence ratio, issues from a burner pipeof 14 mm in inner-diameter, 16 mm in outer-diameter and
Series B, Vol. 48, No. 1, 2005 JSME International Journal
37
750 mm in length. The vertical position of burner rim isset 20 mm below the axes of lenses of multi-lens camera.Turbulence intensity of 0.09 m/s is promoted by the gridlocated in the pipe, despite of low Reynolds number of1 526. It is well known that dark ridges appeared alongthe flame surface of rich propane-air mixture(53).
3. Results and Discussion
3. 1 Motion characteristics of objective flameResult of high speed photography of 500 frame/s is
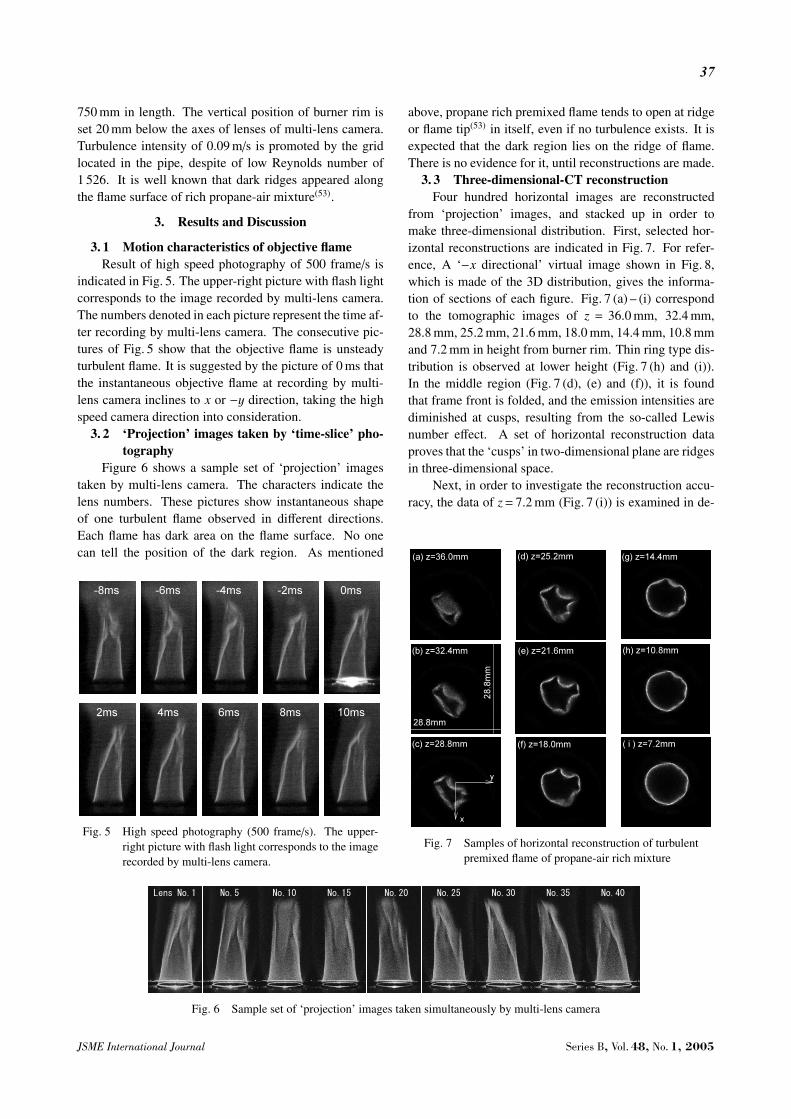
indicated in Fig. 5. The upper-right picture with flash lightcorresponds to the image recorded by multi-lens camera.The numbers denoted in each picture represent the time af-ter recording by multi-lens camera. The consecutive pic-tures of Fig. 5 show that the objective flame is unsteadyturbulent flame. It is suggested by the picture of 0 ms thatthe instantaneous objective flame at recording by multi-lens camera inclines to x or −y direction, taking the highspeed camera direction into consideration.
3. 2 ‘Projection’ images taken by ‘time-slice’ pho-tography
Figure 6 shows a sample set of ‘projection’ imagestaken by multi-lens camera. The characters indicate thelens numbers. These pictures show instantaneous shapeof one turbulent flame observed in different directions.Each flame has dark area on the flame surface. No onecan tell the position of the dark region. As mentioned
Fig. 5 High speed photography (500 frame/s). The upper-right picture with flash light corresponds to the imagerecorded by multi-lens camera.
Fig. 6 Sample set of ‘projection’ images taken simultaneously by multi-lens camera
above, propane rich premixed flame tends to open at ridgeor flame tip(53) in itself, even if no turbulence exists. It isexpected that the dark region lies on the ridge of flame.There is no evidence for it, until reconstructions are made.
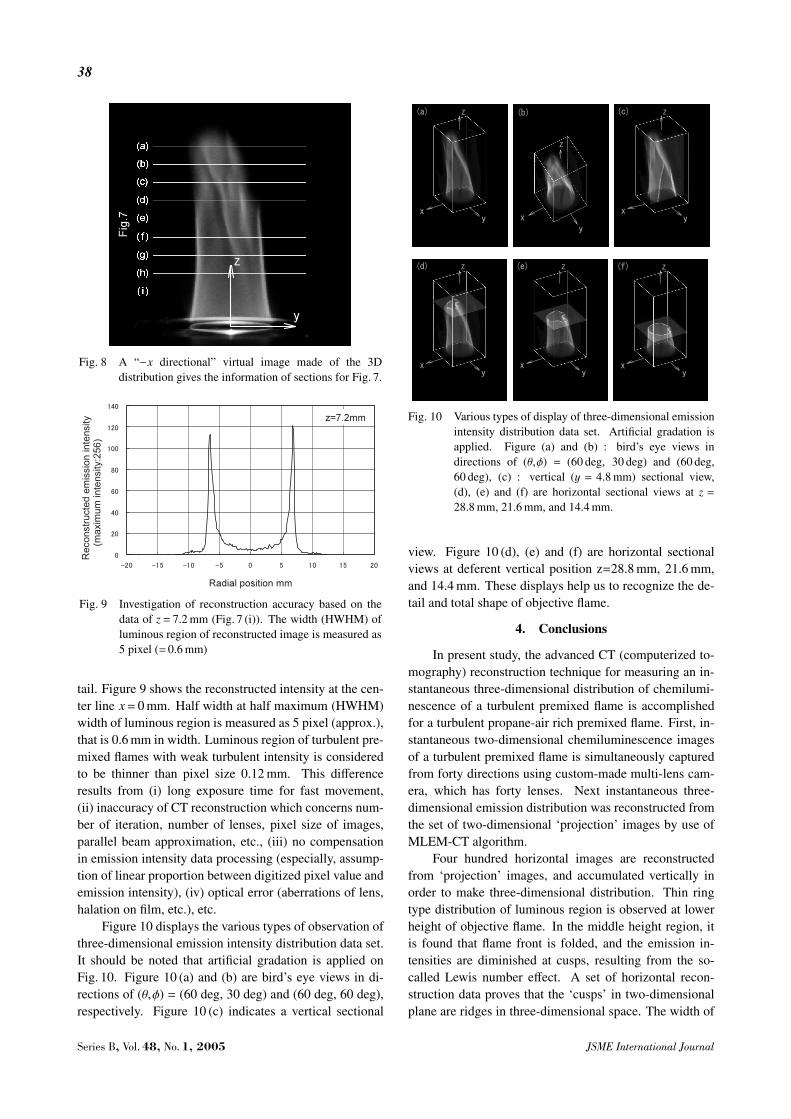
3. 3 Three-dimensional-CT reconstructionFour hundred horizontal images are reconstructed
from ‘projection’ images, and stacked up in order tomake three-dimensional distribution. First, selected hor-izontal reconstructions are indicated in Fig. 7. For refer-ence, A ‘−x directional’ virtual image shown in Fig. 8,which is made of the 3D distribution, gives the informa-tion of sections of each figure. Fig. 7 (a) – (i) correspondto the tomographic images of z = 36.0 mm, 32.4 mm,28.8 mm, 25.2 mm, 21.6 mm, 18.0 mm, 14.4 mm, 10.8 mmand 7.2 mm in height from burner rim. Thin ring type dis-tribution is observed at lower height (Fig. 7 (h) and (i)).In the middle region (Fig. 7 (d), (e) and (f)), it is foundthat frame front is folded, and the emission intensities arediminished at cusps, resulting from the so-called Lewisnumber effect. A set of horizontal reconstruction dataproves that the ‘cusps’ in two-dimensional plane are ridgesin three-dimensional space.
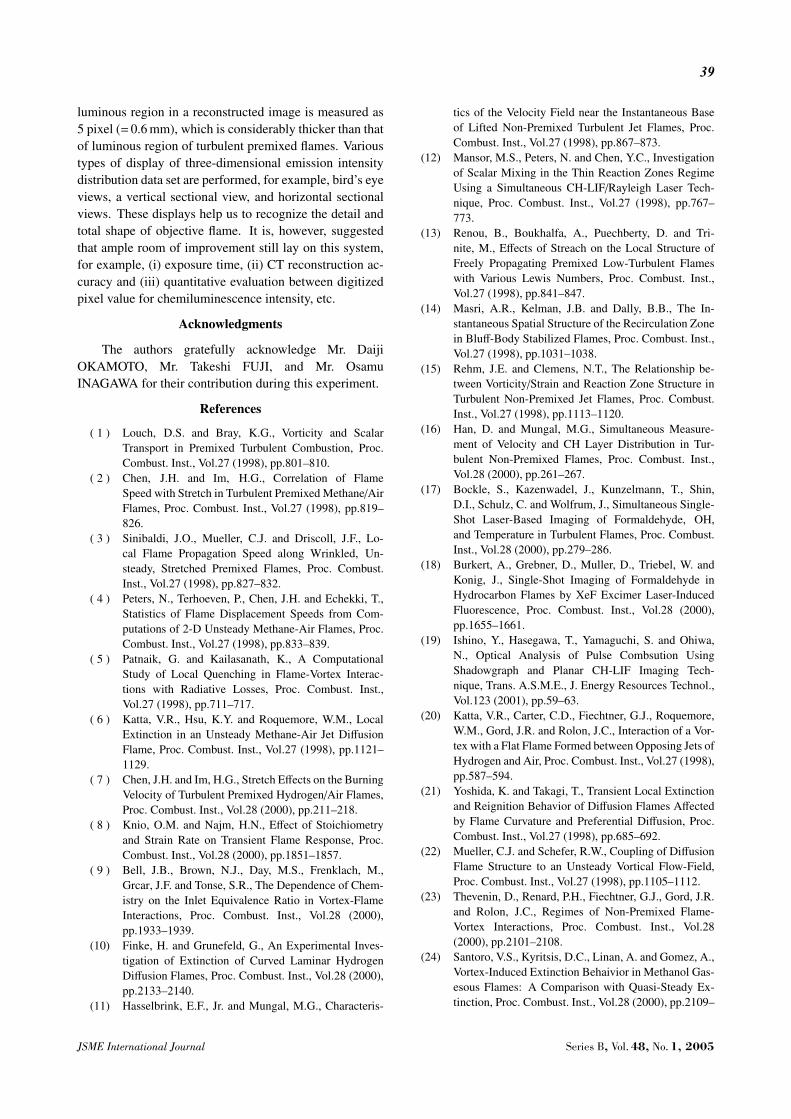
Next, in order to investigate the reconstruction accu-racy, the data of z= 7.2 mm (Fig. 7 (i)) is examined in de-
Fig. 7 Samples of horizontal reconstruction of turbulentpremixed flame of propane-air rich mixture
JSME International Journal Series B, Vol. 48, No. 1, 2005
38
Fig. 8 A “−x directional” virtual image made of the 3Ddistribution gives the information of sections for Fig. 7.
Fig. 9 Investigation of reconstruction accuracy based on thedata of z= 7.2 mm (Fig. 7 (i)). The width (HWHM) ofluminous region of reconstructed image is measured as5 pixel (=0.6 mm)
tail. Figure 9 shows the reconstructed intensity at the cen-ter line x= 0 mm. Half width at half maximum (HWHM)width of luminous region is measured as 5 pixel (approx.),that is 0.6 mm in width. Luminous region of turbulent pre-mixed flames with weak turbulent intensity is consideredto be thinner than pixel size 0.12 mm. This differenceresults from (i) long exposure time for fast movement,(ii) inaccuracy of CT reconstruction which concerns num-ber of iteration, number of lenses, pixel size of images,parallel beam approximation, etc., (iii) no compensationin emission intensity data processing (especially, assump-tion of linear proportion between digitized pixel value andemission intensity), (iv) optical error (aberrations of lens,halation on film, etc.), etc.
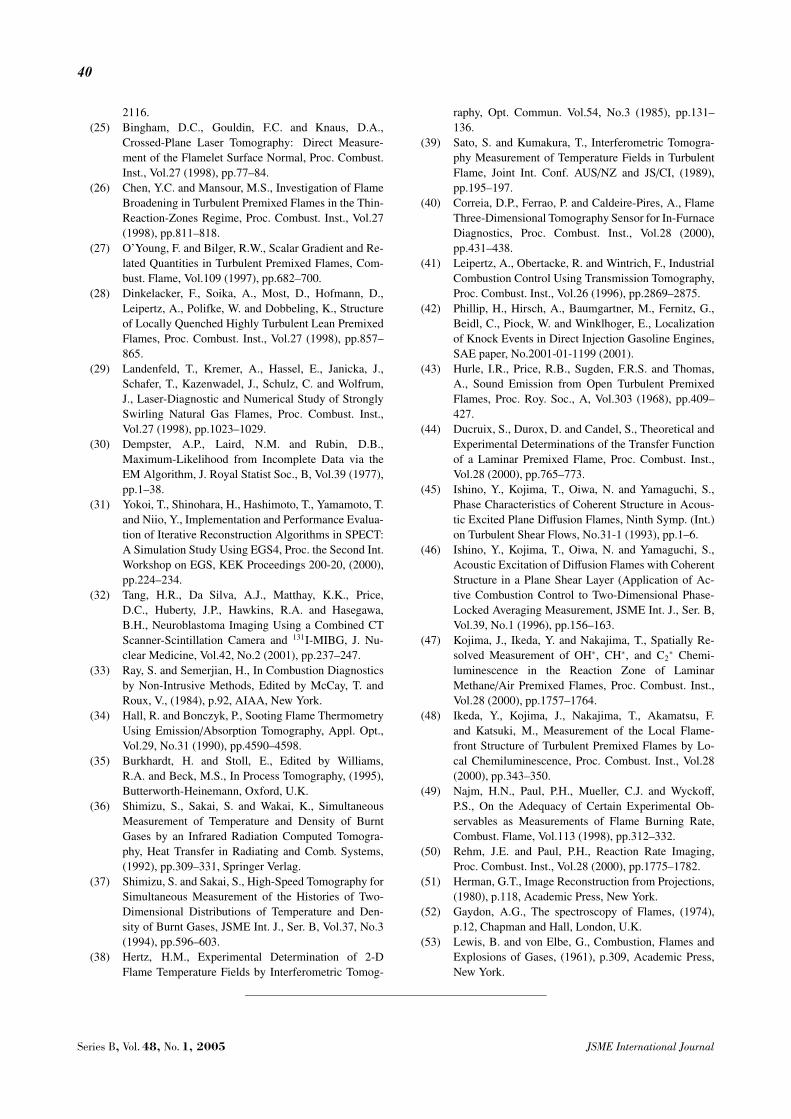
Figure 10 displays the various types of observation ofthree-dimensional emission intensity distribution data set.It should be noted that artificial gradation is applied onFig. 10. Figure 10 (a) and (b) are bird’s eye views in di-rections of (θ,φ) = (60 deg, 30 deg) and (60 deg, 60 deg),respectively. Figure 10 (c) indicates a vertical sectional
Fig. 10 Various types of display of three-dimensional emissionintensity distribution data set. Artificial gradation isapplied. Figure (a) and (b) : bird’s eye views indirections of (θ,φ) = (60 deg, 30 deg) and (60 deg,60 deg), (c) : vertical (y = 4.8 mm) sectional view,(d), (e) and (f) are horizontal sectional views at z =28.8 mm, 21.6 mm, and 14.4 mm.
view. Figure 10 (d), (e) and (f) are horizontal sectionalviews at deferent vertical position z=28.8 mm, 21.6 mm,and 14.4 mm. These displays help us to recognize the de-tail and total shape of objective flame.
4. Conclusions
In present study, the advanced CT (computerized to-mography) reconstruction technique for measuring an in-stantaneous three-dimensional distribution of chemilumi-nescence of a turbulent premixed flame is accomplishedfor a turbulent propane-air rich premixed flame. First, in-stantaneous two-dimensional chemiluminescence imagesof a turbulent premixed flame is simultaneously capturedfrom forty directions using custom-made multi-lens cam-era, which has forty lenses. Next instantaneous three-dimensional emission distribution was reconstructed fromthe set of two-dimensional ‘projection’ images by use ofMLEM-CT algorithm.
Four hundred horizontal images are reconstructedfrom ‘projection’ images, and accumulated vertically inorder to make three-dimensional distribution. Thin ringtype distribution of luminous region is observed at lowerheight of objective flame. In the middle height region, itis found that flame front is folded, and the emission in-tensities are diminished at cusps, resulting from the so-called Lewis number effect. A set of horizontal recon-struction data proves that the ‘cusps’ in two-dimensionalplane are ridges in three-dimensional space. The width of
Series B, Vol. 48, No. 1, 2005 JSME International Journal
39
luminous region in a reconstructed image is measured as5 pixel (=0.6 mm), which is considerably thicker than thatof luminous region of turbulent premixed flames. Varioustypes of display of three-dimensional emission intensitydistribution data set are performed, for example, bird’s eyeviews, a vertical sectional view, and horizontal sectionalviews. These displays help us to recognize the detail andtotal shape of objective flame. It is, however, suggestedthat ample room of improvement still lay on this system,for example, (i) exposure time, (ii) CT reconstruction ac-curacy and (iii) quantitative evaluation between digitizedpixel value for chemiluminescence intensity, etc.
Acknowledgments
The authors gratefully acknowledge Mr. DaijiOKAMOTO, Mr. Takeshi FUJI, and Mr. OsamuINAGAWA for their contribution during this experiment.
References
( 1 ) Louch, D.S. and Bray, K.G., Vorticity and ScalarTransport in Premixed Turbulent Combustion, Proc.Combust. Inst., Vol.27 (1998), pp.801–810.
( 2 ) Chen, J.H. and Im, H.G., Correlation of FlameSpeed with Stretch in Turbulent Premixed Methane/AirFlames, Proc. Combust. Inst., Vol.27 (1998), pp.819–826.
( 3 ) Sinibaldi, J.O., Mueller, C.J. and Driscoll, J.F., Lo-cal Flame Propagation Speed along Wrinkled, Un-steady, Stretched Premixed Flames, Proc. Combust.Inst., Vol.27 (1998), pp.827–832.
( 4 ) Peters, N., Terhoeven, P., Chen, J.H. and Echekki, T.,Statistics of Flame Displacement Speeds from Com-putations of 2-D Unsteady Methane-Air Flames, Proc.Combust. Inst., Vol.27 (1998), pp.833–839.
( 5 ) Patnaik, G. and Kailasanath, K., A ComputationalStudy of Local Quenching in Flame-Vortex Interac-tions with Radiative Losses, Proc. Combust. Inst.,Vol.27 (1998), pp.711–717.
( 6 ) Katta, V.R., Hsu, K.Y. and Roquemore, W.M., LocalExtinction in an Unsteady Methane-Air Jet DiffusionFlame, Proc. Combust. Inst., Vol.27 (1998), pp.1121–1129.
( 7 ) Chen, J.H. and Im, H.G., Stretch Effects on the BurningVelocity of Turbulent Premixed Hydrogen/Air Flames,Proc. Combust. Inst., Vol.28 (2000), pp.211–218.
( 8 ) Knio, O.M. and Najm, H.N., Effect of Stoichiometryand Strain Rate on Transient Flame Response, Proc.Combust. Inst., Vol.28 (2000), pp.1851–1857.
( 9 ) Bell, J.B., Brown, N.J., Day, M.S., Frenklach, M.,Grcar, J.F. and Tonse, S.R., The Dependence of Chem-istry on the Inlet Equivalence Ratio in Vortex-FlameInteractions, Proc. Combust. Inst., Vol.28 (2000),pp.1933–1939.
(10) Finke, H. and Grunefeld, G., An Experimental Inves-tigation of Extinction of Curved Laminar HydrogenDiffusion Flames, Proc. Combust. Inst., Vol.28 (2000),pp.2133–2140.
(11) Hasselbrink, E.F., Jr. and Mungal, M.G., Characteris-
tics of the Velocity Field near the Instantaneous Baseof Lifted Non-Premixed Turbulent Jet Flames, Proc.Combust. Inst., Vol.27 (1998), pp.867–873.
(12) Mansor, M.S., Peters, N. and Chen, Y.C., Investigationof Scalar Mixing in the Thin Reaction Zones RegimeUsing a Simultaneous CH-LIF/Rayleigh Laser Tech-nique, Proc. Combust. Inst., Vol.27 (1998), pp.767–773.
(13) Renou, B., Boukhalfa, A., Puechberty, D. and Tri-nite, M., Effects of Streach on the Local Structure ofFreely Propagating Premixed Low-Turbulent Flameswith Various Lewis Numbers, Proc. Combust. Inst.,Vol.27 (1998), pp.841–847.
(14) Masri, A.R., Kelman, J.B. and Dally, B.B., The In-stantaneous Spatial Structure of the Recirculation Zonein Bluff-Body Stabilized Flames, Proc. Combust. Inst.,Vol.27 (1998), pp.1031–1038.
(15) Rehm, J.E. and Clemens, N.T., The Relationship be-tween Vorticity/Strain and Reaction Zone Structure inTurbulent Non-Premixed Jet Flames, Proc. Combust.Inst., Vol.27 (1998), pp.1113–1120.
(16) Han, D. and Mungal, M.G., Simultaneous Measure-ment of Velocity and CH Layer Distribution in Tur-bulent Non-Premixed Flames, Proc. Combust. Inst.,Vol.28 (2000), pp.261–267.
(17) Bockle, S., Kazenwadel, J., Kunzelmann, T., Shin,D.I., Schulz, C. and Wolfrum, J., Simultaneous Single-Shot Laser-Based Imaging of Formaldehyde, OH,and Temperature in Turbulent Flames, Proc. Combust.Inst., Vol.28 (2000), pp.279–286.
(18) Burkert, A., Grebner, D., Muller, D., Triebel, W. andKonig, J., Single-Shot Imaging of Formaldehyde inHydrocarbon Flames by XeF Excimer Laser-InducedFluorescence, Proc. Combust. Inst., Vol.28 (2000),pp.1655–1661.
(19) Ishino, Y., Hasegawa, T., Yamaguchi, S. and Ohiwa,N., Optical Analysis of Pulse Combsution UsingShadowgraph and Planar CH-LIF Imaging Tech-nique, Trans. A.S.M.E., J. Energy Resources Technol.,Vol.123 (2001), pp.59–63.
(20) Katta, V.R., Carter, C.D., Fiechtner, G.J., Roquemore,W.M., Gord, J.R. and Rolon, J.C., Interaction of a Vor-tex with a Flat Flame Formed between Opposing Jets ofHydrogen and Air, Proc. Combust. Inst., Vol.27 (1998),pp.587–594.
(21) Yoshida, K. and Takagi, T., Transient Local Extinctionand Reignition Behavior of Diffusion Flames Affectedby Flame Curvature and Preferential Diffusion, Proc.Combust. Inst., Vol.27 (1998), pp.685–692.
(22) Mueller, C.J. and Schefer, R.W., Coupling of DiffusionFlame Structure to an Unsteady Vortical Flow-Field,Proc. Combust. Inst., Vol.27 (1998), pp.1105–1112.
(23) Thevenin, D., Renard, P.H., Fiechtner, G.J., Gord, J.R.and Rolon, J.C., Regimes of Non-Premixed Flame-Vortex Interactions, Proc. Combust. Inst., Vol.28(2000), pp.2101–2108.
(24) Santoro, V.S., Kyritsis, D.C., Linan, A. and Gomez, A.,Vortex-Induced Extinction Behaivior in Methanol Gas-esous Flames: A Comparison with Quasi-Steady Ex-tinction, Proc. Combust. Inst., Vol.28 (2000), pp.2109–
JSME International Journal Series B, Vol. 48, No. 1, 2005
40
2116.(25) Bingham, D.C., Gouldin, F.C. and Knaus, D.A.,
Crossed-Plane Laser Tomography: Direct Measure-ment of the Flamelet Surface Normal, Proc. Combust.Inst., Vol.27 (1998), pp.77–84.
(26) Chen, Y.C. and Mansour, M.S., Investigation of FlameBroadening in Turbulent Premixed Flames in the Thin-Reaction-Zones Regime, Proc. Combust. Inst., Vol.27(1998), pp.811–818.
(27) O’Young, F. and Bilger, R.W., Scalar Gradient and Re-lated Quantities in Turbulent Premixed Flames, Com-bust. Flame, Vol.109 (1997), pp.682–700.
(28) Dinkelacker, F., Soika, A., Most, D., Hofmann, D.,Leipertz, A., Polifke, W. and Dobbeling, K., Structureof Locally Quenched Highly Turbulent Lean PremixedFlames, Proc. Combust. Inst., Vol.27 (1998), pp.857–865.
(29) Landenfeld, T., Kremer, A., Hassel, E., Janicka, J.,Schafer, T., Kazenwadel, J., Schulz, C. and Wolfrum,J., Laser-Diagnostic and Numerical Study of StronglySwirling Natural Gas Flames, Proc. Combust. Inst.,Vol.27 (1998), pp.1023–1029.
(30) Dempster, A.P., Laird, N.M. and Rubin, D.B.,Maximum-Likelihood from Incomplete Data via theEM Algorithm, J. Royal Statist Soc., B, Vol.39 (1977),pp.1–38.
(31) Yokoi, T., Shinohara, H., Hashimoto, T., Yamamoto, T.and Niio, Y., Implementation and Performance Evalua-tion of Iterative Reconstruction Algorithms in SPECT:A Simulation Study Using EGS4, Proc. the Second Int.Workshop on EGS, KEK Proceedings 200-20, (2000),pp.224–234.
(32) Tang, H.R., Da Silva, A.J., Matthay, K.K., Price,D.C., Huberty, J.P., Hawkins, R.A. and Hasegawa,B.H., Neuroblastoma Imaging Using a Combined CTScanner-Scintillation Camera and 131I-MIBG, J. Nu-clear Medicine, Vol.42, No.2 (2001), pp.237–247.
(33) Ray, S. and Semerjian, H., In Combustion Diagnosticsby Non-Intrusive Methods, Edited by McCay, T. andRoux, V., (1984), p.92, AIAA, New York.
(34) Hall, R. and Bonczyk, P., Sooting Flame ThermometryUsing Emission/Absorption Tomography, Appl. Opt.,Vol.29, No.31 (1990), pp.4590–4598.
(35) Burkhardt, H. and Stoll, E., Edited by Williams,R.A. and Beck, M.S., In Process Tomography, (1995),Butterworth-Heinemann, Oxford, U.K.
(36) Shimizu, S., Sakai, S. and Wakai, K., SimultaneousMeasurement of Temperature and Density of BurntGases by an Infrared Radiation Computed Tomogra-phy, Heat Transfer in Radiating and Comb. Systems,(1992), pp.309–331, Springer Verlag.
(37) Shimizu, S. and Sakai, S., High-Speed Tomography forSimultaneous Measurement of the Histories of Two-Dimensional Distributions of Temperature and Den-sity of Burnt Gases, JSME Int. J., Ser. B, Vol.37, No.3(1994), pp.596–603.
(38) Hertz, H.M., Experimental Determination of 2-DFlame Temperature Fields by Interferometric Tomog-
(39) Sato, S. and Kumakura, T., Interferometric Tomogra-phy Measurement of Temperature Fields in TurbulentFlame, Joint Int. Conf. AUS/NZ and JS/CI, (1989),pp.195–197.
(40) Correia, D.P., Ferrao, P. and Caldeire-Pires, A., FlameThree-Dimensional Tomography Sensor for In-FurnaceDiagnostics, Proc. Combust. Inst., Vol.28 (2000),pp.431–438.
(41) Leipertz, A., Obertacke, R. and Wintrich, F., IndustrialCombustion Control Using Transmission Tomography,Proc. Combust. Inst., Vol.26 (1996), pp.2869–2875.
(42) Phillip, H., Hirsch, A., Baumgartner, M., Fernitz, G.,Beidl, C., Piock, W. and Winklhoger, E., Localizationof Knock Events in Direct Injection Gasoline Engines,SAE paper, No.2001-01-1199 (2001).
(43) Hurle, I.R., Price, R.B., Sugden, F.R.S. and Thomas,A., Sound Emission from Open Turbulent PremixedFlames, Proc. Roy. Soc., A, Vol.303 (1968), pp.409–427.
(44) Ducruix, S., Durox, D. and Candel, S., Theoretical andExperimental Determinations of the Transfer Functionof a Laminar Premixed Flame, Proc. Combust. Inst.,Vol.28 (2000), pp.765–773.
(45) Ishino, Y., Kojima, T., Oiwa, N. and Yamaguchi, S.,Phase Characteristics of Coherent Structure in Acous-tic Excited Plane Diffusion Flames, Ninth Symp. (Int.)on Turbulent Shear Flows, No.31-1 (1993), pp.1–6.
(46) Ishino, Y., Kojima, T., Oiwa, N. and Yamaguchi, S.,Acoustic Excitation of Diffusion Flames with CoherentStructure in a Plane Shear Layer (Application of Ac-tive Combustion Control to Two-Dimensional Phase-Locked Averaging Measurement, JSME Int. J., Ser. B,Vol.39, No.1 (1996), pp.156–163.
(47) Kojima, J., Ikeda, Y. and Nakajima, T., Spatially Re-solved Measurement of OH∗, CH∗, and C2
∗ Chemi-luminescence in the Reaction Zone of LaminarMethane/Air Premixed Flames, Proc. Combust. Inst.,Vol.28 (2000), pp.1757–1764.
(48) Ikeda, Y., Kojima, J., Nakajima, T., Akamatsu, F.and Katsuki, M., Measurement of the Local Flame-front Structure of Turbulent Premixed Flames by Lo-cal Chemiluminescence, Proc. Combust. Inst., Vol.28(2000), pp.343–350.
(49) Najm, H.N., Paul, P.H., Mueller, C.J. and Wyckoff,P.S., On the Adequacy of Certain Experimental Ob-servables as Measurements of Flame Burning Rate,Combust. Flame, Vol.113 (1998), pp.312–332.