TECHNICAL NOTE Three-dimensional flow visualization with picosecond Mie scattering and streak-camera detection Frederik Ossler, Sara Agrup and Marcus Alde ´n Two-dimensional images of Mie scattered light from a water aerosol have been recorded by a streak camera with a time resolution of a few picoseconds. The laser pulse, which is 35 ps long, is repeatedly reflected and refocused in the probe volume. On the output phosphor screen of the streak camera, the images of the scattering appear as adjacent, separated pictures on the temporal axis of the streak camera. Because the pictures obtained in this way are separated in time by less than 3 ns, which is much shorter than the typical time scales of the turbulent gas flow, and because they are separated in space by fixed intervals, the resulting images can be used to compose a three-dimensional picture of the aerosol distribution. Key words: Three-dimensional imaging, picosecond laser, streak camera, Mie scattering. 1. Introduction During the past decade different laser diagnostic techniques have been developed and applied to stud- ies of a variety of turbulent-flow and combustion phenomena, e.g., Ref. 1 and the references therein. Some of the most promising techniques are those that provide multiple-point information, e.g., Mie and Rayleigh scattering, 2 Raman scattering, 3 laser-in- duced fluorescence, 4 degenerate four-wave mixing, 5 and polarization spectroscopy. 6 For all of these tech- niques it has been demonstrated that instantaneous two-dimensional 12-D2 properties, e.g., densities, tem- peratures, and velocities, can be measured. In real- ity, however, it is often also desirable to obtain three-dimensional 13-D2 information. There have been several demonstrations of 3-D visualization through different approaches. Researchers have re- alized the 3-D visualization of gas jets and flames by sweeping a microsecond laser pulse through the region of interest and using a framing camera for detection. 7 Three-dimensional Mie-scattering experi- ments have been performed with four laser beams at four different wavelengths through the use of Raman shifting. The partially depleted harmonics at 532 and 355 nm and the corresponding Raman–Stokes shifted beams at 630 and 396 nm were aligned parallel to each other in the studied medium. The images were then detected by different areas of a CCD detector that was equipped with proper interference filters. 8 Similar quasi-3-D temperature information has been obtained by two-sheet Rayleigh scattering. 9 Furthermore, 3-D imaging for which the sheets are formed by the optics and the wavelengths are ob- tained by Raman shifting has also been applied to visualization in a spark-ignition engine. 10 Recently a 3-D imaging system that uses femtosecond laser pulses has been described with which the depth resolution was achieved through ultrafast switching with an upconversion process. 11 In this work we describe a 3-D visualization tech- nique that is based on picosecond Mie scattering followed by streak-camera detection. Streak cam- eras have been used primarily for temporally resolved fluorescence measurements at one point 1see, for example, Ref. 122 or along a line. 13 However, a streak camera can also be used to image instant pictures that originate from picosecond laser pulses. The basic idea of the proposed technique is that a picosecond laser induces an instantaneous process: Mie, Rayleigh, or Raman scattering. The probed volume is illuminated by parallel laser sheets that are aligned by a multipass arrangement. The temporal separation between two consecutive laser sheets is The authors are with the Department of Combustion Physics, Lund Institute of Technology, P.O. Box 118, S-221 00 Lund, Sweden. Received 19 May 1994; revised manuscript received 11 October 1994. 0003-6935@95@030537-04$06.00@0. r 1995 Optical Society of America. 20 January 1995 @ Vol. 34, No. 3 @ APPLIED OPTICS 537
Transcript
TECHNICAL NOTE
Three-dimensional flowvisualization with picosecond Mie scatteringand streak-camera detection
Frederik Ossler, Sara Agrup and Marcus Alden
Two-dimensional images of Mie scattered light from a water aerosol have been recorded by a streakcamera with a time resolution of a few picoseconds. The laser pulse, which is 35 ps long, is repeatedlyreflected and refocused in the probe volume. On the output phosphor screen of the streak camera, theimages of the scattering appear as adjacent, separated pictures on the temporal axis of the streakcamera. Because the pictures obtained in this way are separated in time by less than 3 ns, which ismuch shorter than the typical time scales of the turbulent gas flow, and because they are separated inspace by fixed intervals, the resulting images can be used to compose a three-dimensional picture of theaerosol distribution.Key words: Three-dimensional imaging, picosecond laser, streak camera, Mie scattering.
1. Introduction
During the past decade different laser diagnostictechniques have been developed and applied to stud-ies of a variety of turbulent-flow and combustionphenomena, e.g., Ref. 1 and the references therein.Some of the most promising techniques are those thatprovide multiple-point information, e.g., Mie andRayleigh scattering,2 Raman scattering,3 laser-in-duced fluorescence,4 degenerate four-wave mixing,5and polarization spectroscopy.6 For all of these tech-niques it has been demonstrated that instantaneoustwo-dimensional 12-D2 properties, e.g., densities, tem-peratures, and velocities, can be measured. In real-ity, however, it is often also desirable to obtainthree-dimensional 13-D2 information. There havebeen several demonstrations of 3-D visualizationthrough different approaches. Researchers have re-alized the 3-D visualization of gas jets and flames bysweeping a microsecond laser pulse through theregion of interest and using a framing camera fordetection.7 Three-dimensionalMie-scattering experi-ments have been performed with four laser beams atfour different wavelengths through the use of Ramanshifting. The partially depleted harmonics at 532
The authors are with the Department of Combustion Physics,Lund Institute of Technology, P.O. Box 118, S-221 00 Lund, Sweden.Received 19 May 1994; revised manuscript received 11 October
1994.0003-6935@95@030537-04$06.00@0.
r 1995 Optical Society of America.
and 355 nm and the corresponding Raman–Stokesshifted beams at 630 and 396 nm were alignedparallel to each other in the studied medium. Theimages were then detected by different areas of a CCDdetector that was equipped with proper interferencefilters.8Similar quasi-3-D temperature information has
been obtained by two-sheet Rayleigh scattering.9Furthermore, 3-D imaging for which the sheets areformed by the optics and the wavelengths are ob-tained by Raman shifting has also been applied tovisualization in a spark-ignition engine.10 Recentlya 3-D imaging system that uses femtosecond laserpulses has been described with which the depthresolution was achieved through ultrafast switchingwith an upconversion process.11In this work we describe a 3-D visualization tech-
nique that is based on picosecond Mie scatteringfollowed by streak-camera detection. Streak cam-eras have been used primarily for temporally resolvedfluorescence measurements at one point 1see, forexample, Ref. 122 or along a line.13 However, astreak camera can also be used to image instantpictures that originate from picosecond laser pulses.The basic idea of the proposed technique is that apicosecond laser induces an instantaneous process:Mie, Rayleigh, or Raman scattering. The probedvolume is illuminated by parallel laser sheets that arealigned by a multipass arrangement. The temporalseparation between two consecutive laser sheets is
given by the round-trip time needed to reflect thelaser beam back to the probed medium. Imaging theprobed areas onto a photocathode of a streak camerapermits the different scattering images to be alignedand separated on the output phosphor screen of thedetector, and it constitutes a 3-D picture of thestudied volume. In the present work this possibilityis illustrated and applied to a turbulent water aerosolwith water droplets in the micrometer range fordemonstration purposes. The temporal and spatialresolutions of the method are also discussed.
2. Experimental Setup
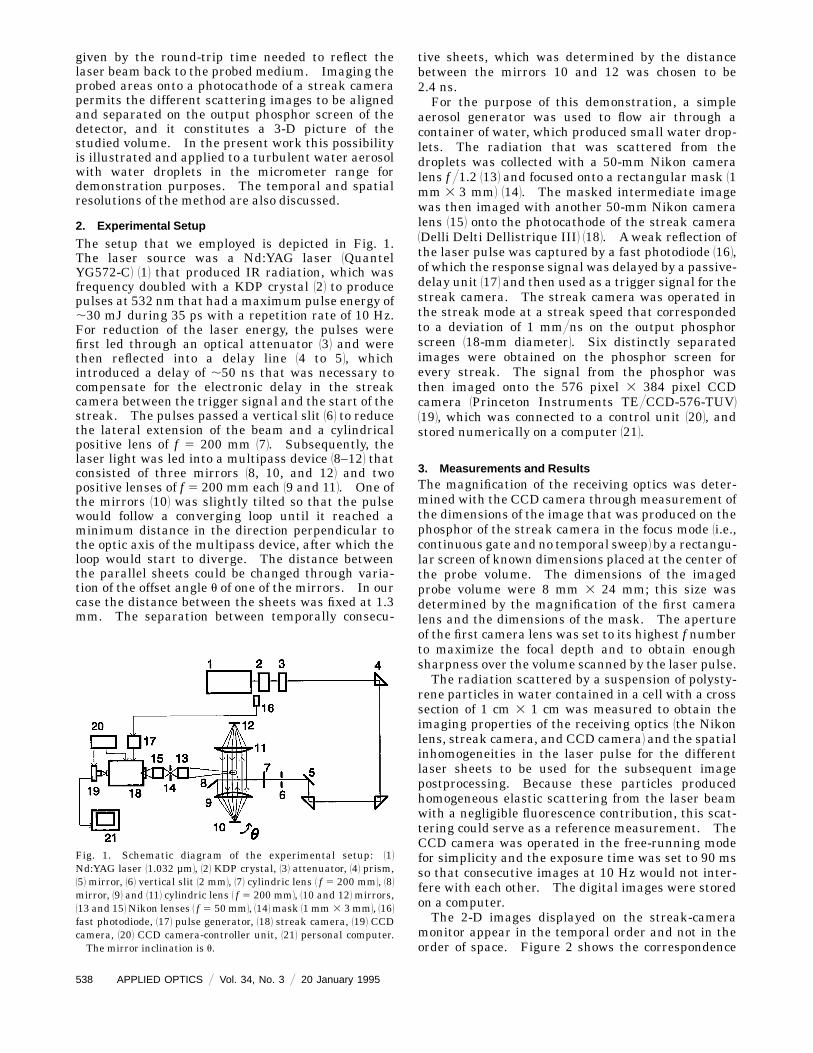
The setup that we employed is depicted in Fig. 1.The laser source was a Nd:YAG laser 1QuantelYG572-C2 112 that produced IR radiation, which wasfrequency doubled with a KDP crystal 122 to producepulses at 532 nm that had amaximum pulse energy of,30 mJ during 35 ps with a repetition rate of 10 Hz.For reduction of the laser energy, the pulses werefirst led through an optical attenuator 132 and werethen reflected into a delay line 14 to 52, whichintroduced a delay of ,50 ns that was necessary tocompensate for the electronic delay in the streakcamera between the trigger signal and the start of thestreak. The pulses passed a vertical slit 162 to reducethe lateral extension of the beam and a cylindricalpositive lens of f 5 200 mm 172. Subsequently, thelaser light was led into a multipass device 18–122 thatconsisted of three mirrors 18, 10, and 122 and twopositive lenses of f 5 200 mm each 19 and 112. One ofthe mirrors 1102 was slightly tilted so that the pulsewould follow a converging loop until it reached aminimum distance in the direction perpendicular tothe optic axis of the multipass device, after which theloop would start to diverge. The distance betweenthe parallel sheets could be changed through varia-tion of the offset angle u of one of the mirrors. In ourcase the distance between the sheets was fixed at 1.3mm. The separation between temporally consecu-
Fig. 1. Schematic diagram of the experimental setup: 112Nd:YAG laser 11.032 µm2, 122 KDP crystal, 132 attenuator, 142 prism,152 mirror, 162 vertical slit 12 mm2, 172 cylindric lens 1 f 5 200 mm2, 182mirror, 192 and 1112 cylindric lens 1 f 5 200 mm2, 110 and 122 mirrors,113 and 152Nikon lenses 1 f 5 50 mm2, 1142mask 11 mm 3 3 mm2, 1162fast photodiode, 1172 pulse generator, 1182 streak camera, 1192 CCDcamera, 1202 CCD camera-controller unit, 1212 personal computer.The mirror inclination is u.
tive sheets, which was determined by the distancebetween the mirrors 10 and 12 was chosen to be2.4 ns.For the purpose of this demonstration, a simple
aerosol generator was used to flow air through acontainer of water, which produced small water drop-lets. The radiation that was scattered from thedroplets was collected with a 50-mm Nikon cameralens f @1.2 1132 and focused onto a rectangular mask 11mm 3 3 mm2 1142. The masked intermediate imagewas then imaged with another 50-mm Nikon cameralens 1152 onto the photocathode of the streak camera1Delli Delti Dellistrique III2 1182. A weak reflection ofthe laser pulse was captured by a fast photodiode 1162,of which the response signal was delayed by a passive-delay unit 1172 and then used as a trigger signal for thestreak camera. The streak camera was operated inthe streak mode at a streak speed that correspondedto a deviation of 1 mm@ns on the output phosphorscreen 118-mm diameter2. Six distinctly separatedimages were obtained on the phosphor screen forevery streak. The signal from the phosphor wasthen imaged onto the 576 pixel 3 384 pixel CCDcamera 1Princeton Instruments TE@CCD-576-TUV21192, which was connected to a control unit 1202, andstored numerically on a computer 1212.
3. Measurements and ResultsThe magnification of the receiving optics was deter-mined with the CCD camera throughmeasurement ofthe dimensions of the image that was produced on thephosphor of the streak camera in the focus mode 1i.e.,continuous gate and no temporal sweep2 by a rectangu-lar screen of known dimensions placed at the center ofthe probe volume. The dimensions of the imagedprobe volume were 8 mm 3 24 mm; this size wasdetermined by the magnification of the first cameralens and the dimensions of the mask. The apertureof the first camera lens was set to its highest f numberto maximize the focal depth and to obtain enoughsharpness over the volume scanned by the laser pulse.The radiation scattered by a suspension of polysty-
rene particles in water contained in a cell with a crosssection of 1 cm 3 1 cm was measured to obtain theimaging properties of the receiving optics 1the Nikonlens, streak camera, and CCD camera2 and the spatialinhomogeneities in the laser pulse for the differentlaser sheets to be used for the subsequent imagepostprocessing. Because these particles producedhomogeneous elastic scattering from the laser beamwith a negligible fluorescence contribution, this scat-tering could serve as a reference measurement. TheCCD camera was operated in the free-running modefor simplicity and the exposure time was set to 90 msso that consecutive images at 10 Hz would not inter-fere with each other. The digital images were storedon a computer.The 2-D images displayed on the streak-camera
monitor appear in the temporal order and not in theorder of space. Figure 2 shows the correspondence
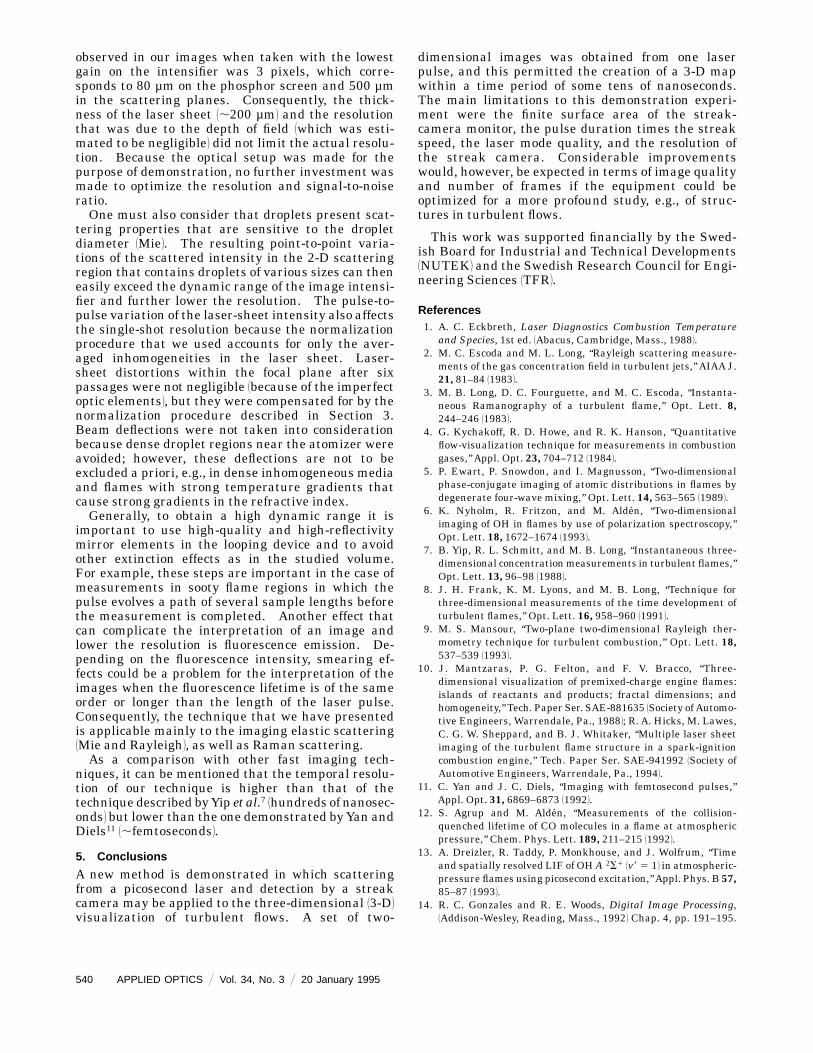
between the spatial order of the sheets and thetemporal order of the monitored frames. The imagesappear in the spatial sequence 1–6–2–5–3–4 1num-bered in order of the decreasing distance to thereceiving optics2 and they are separated by the half-round-trip time in the loop. Figure 3 demonstrates aset of cuts from the compensated CCD image thatdisplay the 2-D images in the spatial sequence 1fromleft to right2 1–2–3–4–5–6. The measurement wasmade under unsteady flow conditions with the aerosolgenerator operating at a high air-flow rate. Thegenerator was placed below and off the center line ofthe sheets, to capture turbulent structures. Thesignal-to-noise ratio in the original image was slightlyhigher than 10. The image postprocessing includedcompensation for the background level as well asnormalization with data from the cell. To increasethe quality of the images we eliminated spikes withspot-removing filtration,14 virtually without affectingthe resolution. A gray scale was chosen that set the
Fig. 2. The correspondence between the spatial order of the focalplanes 1decreasing distance to the receiving optics2 and the order ofthe scattering images displayed on the streak-camera monitor.
threshold above the background-noise level and thusobtained a full range of intensities.
4. Discussion
The method that we have described yields 3-D mea-surements within a period of some tens of nanosec-onds. Sonic waves demand a temporal resolutionbelow 1 µs to achieve a spatial resolution below one 1mm. Thus, this application is well suited for instan-taneous 3-D studies of fast turbulent phenomena.The spatial resolution of the technique is, in principle,limited by the length of the laser pulse and the streakspeed, whereas the number of possible frames pershot to be taken is limited by the level of the imagemagnification and the diameter of the phosphor screenof the streak camera. Implementing the streak cam-era with an additional synchronous vertical sweepwould make it possible to display frames along thevertical axis of the output phosphor and would permitan increased number of frames to be monitored.In our experiment we have used a pulse of 35 ps
1FWHM2 and a streak speed of 1 ns@mm, whichyielded a highest-possible theoretical resolution of 35µm on the phosphor screen, which corresponds to2.5% of a 2-D image. A shorter laser pulse wouldincrease the resolution, as would a decrease of thestreak speed. However, in the latter case the timeperiod of every half-turn of the laser pulse would haveto be increased by the same amount for the images tonot overlap on the phosphor screen, and thus themeasurement time would increase by the same factortimes the number of such half-turns.The resolution of the output of the streak camera
is, according to specifications, lower than that givenabove: 20 lines@mm 150 µm2 at the lowest gain on thegated image intensifier and 10 lines@mm 1100µm2 at the highest gain. The highest resolution
Fig. 3. The complete set of 2-D Mie-scattered pictures of the water aerosol. The single images are cut out from the CCD image 1aftercompensation2 and sequenced in the order of decreasing distance to the receiving optics. The distance between the corresponding lasersheets was set to 1.3 mm.
observed in our images when taken with the lowestgain on the intensifier was 3 pixels, which corre-sponds to 80 µm on the phosphor screen and 500 µmin the scattering planes. Consequently, the thick-ness of the laser sheet 1,200 µm2 and the resolutionthat was due to the depth of field 1which was esti-mated to be negligible2 did not limit the actual resolu-tion. Because the optical setup was made for thepurpose of demonstration, no further investment wasmade to optimize the resolution and signal-to-noiseratio.One must also consider that droplets present scat-
tering properties that are sensitive to the dropletdiameter 1Mie2. The resulting point-to-point varia-tions of the scattered intensity in the 2-D scatteringregion that contains droplets of various sizes can theneasily exceed the dynamic range of the image intensi-fier and further lower the resolution. The pulse-to-pulse variation of the laser-sheet intensity also affectsthe single-shot resolution because the normalizationprocedure that we used accounts for only the aver-aged inhomogeneities in the laser sheet. Laser-sheet distortions within the focal plane after sixpassages were not negligible 1because of the imperfectoptic elements2, but they were compensated for by thenormalization procedure described in Section 3.Beam deflections were not taken into considerationbecause dense droplet regions near the atomizer wereavoided; however, these deflections are not to beexcluded a priori, e.g., in dense inhomogeneous mediaand flames with strong temperature gradients thatcause strong gradients in the refractive index.Generally, to obtain a high dynamic range it is
important to use high-quality and high-reflectivitymirror elements in the looping device and to avoidother extinction effects as in the studied volume.For example, these steps are important in the case ofmeasurements in sooty flame regions in which thepulse evolves a path of several sample lengths beforethe measurement is completed. Another effect thatcan complicate the interpretation of an image andlower the resolution is fluorescence emission. De-pending on the fluorescence intensity, smearing ef-fects could be a problem for the interpretation of theimages when the fluorescence lifetime is of the sameorder or longer than the length of the laser pulse.Consequently, the technique that we have presentedis applicable mainly to the imaging elastic scattering1Mie and Rayleigh2, as well as Raman scattering.As a comparison with other fast imaging tech-
niques, it can be mentioned that the temporal resolu-tion of our technique is higher than that of thetechnique described byYip et al.7 1hundreds of nanosec-onds2 but lower than the one demonstrated byYan andDiels11 1,femtoseconds2.
5. Conclusions
A new method is demonstrated in which scatteringfrom a picosecond laser and detection by a streakcamera may be applied to the three-dimensional 13-D2visualization of turbulent flows. A set of two-
dimensional images was obtained from one laserpulse, and this permitted the creation of a 3-D mapwithin a time period of some tens of nanoseconds.The main limitations to this demonstration experi-ment were the finite surface area of the streak-camera monitor, the pulse duration times the streakspeed, the laser mode quality, and the resolution ofthe streak camera. Considerable improvementswould, however, be expected in terms of image qualityand number of frames if the equipment could beoptimized for a more profound study, e.g., of struc-tures in turbulent flows.
This work was supported financially by the Swed-ish Board for Industrial and Technical Developments1NUTEK2 and the Swedish Research Council for Engi-neering Sciences 1TFR2.
References1. A. C. Eckbreth, Laser Diagnostics Combustion Temperature
and Species, 1st ed. 1Abacus, Cambridge, Mass., 19882.2. M. C. Escoda and M. L. Long, ‘‘Rayleigh scattering measure-
ments of the gas concentration field in turbulent jets,’’ AIAA J.21, 81–84 119832.
3. M. B. Long, D. C. Fourguette, and M. C. Escoda, ‘‘Instanta-neous Ramanography of a turbulent flame,’’ Opt. Lett. 8,244–246 119832.
4. G. Kychakoff, R. D. Howe, and R. K. Hanson, ‘‘Quantitativeflow-visualization technique for measurements in combustiongases,’’ Appl. Opt. 23, 704–712 119842.
5. P. Ewart, P. Snowdon, and I. Magnusson, ‘‘Two-dimensionalphase-conjugate imaging of atomic distributions in flames bydegenerate four-wave mixing,’’ Opt. Lett. 14, 563–565 119892.
6. K. Nyholm, R. Fritzon, and M. Alden, ‘‘Two-dimensionalimaging of OH in flames by use of polarization spectroscopy,’’Opt. Lett. 18, 1672–1674 119932.
7. B. Yip, R. L. Schmitt, and M. B. Long, ‘‘Instantaneous three-dimensional concentrationmeasurements in turbulent flames,’’Opt. Lett. 13, 96–98 119882.
8. J. H. Frank, K. M. Lyons, and M. B. Long, ‘‘Technique forthree-dimensional measurements of the time development ofturbulent flames,’’ Opt. Lett. 16, 958–960 119912.
9. M. S. Mansour, ‘‘Two-plane two-dimensional Rayleigh ther-mometry technique for turbulent combustion,’’ Opt. Lett. 18,537–539 119932.
10. J. Mantzaras, P. G. Felton, and F. V. Bracco, ‘‘Three-dimensional visualization of premixed-charge engine flames:islands of reactants and products; fractal dimensions; andhomogeneity,’’ Tech. Paper Ser. SAE-881635 1Society of Automo-tive Engineers, Warrendale, Pa., 19882; R. A. Hicks, M. Lawes,C. G. W. Sheppard, and B. J. Whitaker, ‘‘Multiple laser sheetimaging of the turbulent flame structure in a spark-ignitioncombustion engine,’’ Tech. Paper Ser. SAE-941992 1Society ofAutomotive Engineers, Warrendale, Pa., 19942.
11. C. Yan and J. C. Diels, ‘‘Imaging with femtosecond pulses,’’Appl. Opt. 31, 6869–6873 119922.
12. S. Agrup and M. Alden, ‘‘Measurements of the collision-quenched lifetime of CO molecules in a flame at atmosphericpressure,’’ Chem. Phys. Lett. 189, 211–215 119922.
13. A. Dreizler, R. Taddy, P. Monkhouse, and J. Wolfrum, ‘‘Timeand spatially resolved LIF of OHA 2S1 1v8 5 12 in atmospheric-pressure flames using picosecond excitation,’’Appl. Phys. B 57,85–87 119932.
14. R. C. Gonzales and R. E. Woods, Digital Image Processing,1Addison-Wesley, Reading, Mass., 19922 Chap. 4, pp. 191–195.