Research ArticleThree-Dimensional Numerical Simulation of Multiscale Fracturesand Multiphase Flow in Heterogeneous UnconventionalReservoirs with Coupled Fractal Characteristics
Hong Li ,1,2 Haiyang Yu ,1 Nai Cao ,3 Shiqing Cheng,1 He Tian,1 and Shiying Di1
1State Key Laboratory of Petroleum Resources and Prospecting, China University of Petroleum, Beijing 102249, China2Mathematics and Cybernetics, SINTEF Digital, P.O. Box 124 Blindern, Oslo 0314, Norway3Sinopec Research Institute of Petroleum Engineering, Beijing 102206, China
A simulated reservoir model, based on the permeability fractal model and three-dimensional (3D) Gaussian filter, was establishedto account for in-layer and interlayer heterogeneity so that the result conforms to the law of geological statistics. Combined withan embedded discrete fracture method (EDFM), a multiscale fracture system was established, forming the numerical simulationmethod of multiphase flow in horizontal wells in heterogeneous reservoirs with complex fractures. The heterogeneity andsaturation of the reservoir mixed five-point pattern of vertical and horizontal wells and the injection and production ofhorizontal wells were discussed. The results show that it is difficult to characterize complex reservoirs using a homogeneouspermeability model. Thus, it is best to use a heterogeneous model that considers permeability differences in tight reservoirs.Formation fluids coexist in multiple phases, and water saturation has a direct effect on the production. Thus, a multiphase flowmodel is needed and can play a greater role in injection and production technology. The mixed five-point pattern of vertical andhorizontal wells can improve productivity to a certain extent, but the dual effects of heterogeneity and fracturing will cause adecline in production by accelerating the communication of injected fluid. The reservoir is heterogeneous between wells, and thereare differing effects on adjacent wells. Therefore, near-well natural microfractures are opened because of fracturing in horizontalwells, and the heterogeneity cannot be ignored, especially when multiple wells are simultaneously injected and produced.
1. Introduction
Unconventional reservoirs are generally heterogeneous andcharacterized by low porosity and permeability and naturalmicrofractures. Horizontal well fracturing is often used toimprove productivity, which makes fractures the main chan-nels for the migration of oil and gas in such reservoirs [1–3].Because of the importance of fractures, it is critical toimprove the accuracy and applicability of numerical simula-tion of porous media with fractures [4–6].
In recent years, many scholars have studied and devel-oped numerical simulation of fractured porous media, andthe most widely used models are equivalent continuum
models and discrete fracture model (DFM) [7]. However,considering that the equivalent continuum model is unableto characterize the differential flows in fractures, the DFMis deficient in the mesh generation of complex fractures[8–10]. Lee et al. [11] and Moinfar et al. [12] proposed theembedded discrete fracture method (EDFM). This methodcan greatly reduce the computational cost and is suitablefor complex fracture modeling by embedding fracturemeshes into matrix meshes and then constructing the flowexchange between a matrix and fracture system throughnonadjacent links. Yan et al. [13] applied the EDFM innumerical simulation with anisotropy of matrix permeabil-ity. Shao and Di [14] developed the integrated EDFM. Based
HindawiGeofluidsVolume 2021, Article ID 8265962, 15 pageshttps://doi.org/10.1155/2021/8265962
on the EDFM, Zhang et al. [15] established a 3D model ofmultistage hydraulic fracturing of horizontal wells in tightreservoirs, accounting for the influence of gravity and stresssensitivity. Fiallos et al. [16] used the EDFM to study theimpact of inter-well interference on productivity. Zhu et al.[17] designed an EDFM based on corner grid and refinedthe near-well zone grid. Rao et al. [18] developed an EDFMpreprocessing algorithm for arbitrary shapes. The EDFM isarguably the most promising method for numerical simula-tion of porous media with fractures, but it still has problems.Many scholars have reported that the effective simulation offractures by the EDFM is suitable for complex fractures,while they commonly ignored the fracture scales. Reservoirmodels and their meshes are usually large in scale (a gridmay represent tens of meters). The use of the EDFM caneffectively represent fractures at a large scale, but consideringnatural microfractures in the reservoir will increase the com-plexity of fracture modeling. In addition, the matrix isregarded as homogeneous in most numerical models, whichis quite different from the real system. Hence, it is of greatimportance to find a method that can reduce calculation dif-ficulty in the numerical simulation of an unconventional res-ervoir while accounting for the complexity of the reservoir.
In general, there is a lack of practical geological models,so most researchers assign different values of permeability todifferent layers or replace them with random numbers lack-ing in physical meaning in the modeling of heterogeneousreservoirs [19]. In practice, reservoir heterogeneity followsthe principles of geo-statistics1. Unfortunately, this is oftenneglected in numerical modeling for the purpose of simplifi-cation. Moreover, many researchers have established verydetailed models to characterize the relationship betweenporosity and permeability of porous media [20–23].However, most models use a theoretical calculation of perme-ability, and the corresponding assumptions are too idealistic.
Fractal geometry was put forward by Mandelbrot andWheeler in the 1970s and developed rapidly after that [24].The research object have three obvious characteristics: (1)it belongs to nature, (2) its morphology is irregular and
unstable, and (3) it has the characteristics of self-similarity[25]. Except for the three features, fractal geometry generallystudies structures in nature that cannot be described by tra-ditional geometry. As a fractal structure, the pore structureof reservoir is very suitable for the study of fractal geometrybecause of its microscopic heterogeneity [26]. Many scholarshave found that the pore microstructure of rocks meets theself-similarity of fractal characteristics, and fractal geometrytheory has been widely used in the study of the transmissioncharacteristics of porous media (such as permeability) [27].Yu and Cheng [28] simplified the complex pore size distri-bution according to the fractal theory and proposed a fractalpermeability model of bidispersed porous media, whichaddressed the defect of equal diameters in the original K–Cequation. Chen and Yao [29] proposed a fractal permeability
500 𝜇m
Figure 1: Microscopic characteristics of natural microfractures intight reservoir.
Create a reservoir: physical size and matrix grid size
Gaussian porosity field & fractal permeability field
Fractures parameters input and grid partition
Fluid parameters & well parameters
Calculate the non-neighboring connection and the operator
Embed the above operator into the black oil model
Initial state and schedule
Iterative calculation
Figure 2: The schematic diagram of the calculation.
0 100 200 300 400 5000
2
4
6
8
10
0
100
200
300
400
500
600
700
q/(m
3 /d)
Daily production [reference 15]Daily productionAccumulative production [preference 15]Accumulative production
Q/(
m3 )
t/d
Figure 3: Comparison of production predicted curves betweenproposed model and reference model.
2 Geofluids
model which was theoretically deduced based on the fractalgeometry theory with considering the irreducible watersaturation. Dong et al. [30] used an improved statisticalalgorithm with binary image data to estimate the geometricparameters of each pore such as the perimeter and area todetermine the fractal parameters of pore microstructure.The traditional relationship model between microporestructure parameters and macropermeability was modified.Therefore, it is a meaningful work to extend the fractal per-meability model to numerical simulation.
The main objective of this work was to combine the het-erogeneity caused by natural microfractures with a fractalpermeability model and a 3D Gaussian filter of the matrix,which results in a model that conforms to statistical laws.Using an EDFM, fractures in large-scale and artificial frac-tures were established to form a multiscale fracture system,the solution of which is determined based on the frameworkof the open-source simulator black-oil model in MATLABReservoir Simulation Toolbox (MRST) [31]. By comparingwith the model established by Zhang, the correctness ofthe simplified homogeneous version of the proposed modelwas verified. The effects of permeability and saturation onthe productivity of fractured horizontal wells were discussedfor homogeneous reservoirs. Then, the effects of areal het-erogeneity and interlayer heterogeneity on horizontal wellproductivity were further discussed. In addition, the injec-tion and production of the mixed five-point pattern of verti-cal and horizontal wells and adjacent horizontal wells undercomplex reservoir conditions were simulated to demonstratethe potential of the proposed model. The influence of het-erogeneity and multiscale fractures on injection-productionwas thereby theoretically analyzed, which provides guidancefor the reverse interpretation of production data and clarifi-cation of the main control factors for production.
2. Mathematical Model
2.1. Governing Equations. Based on the principle of materialbalance and Darcy’s law, the mass equation of multiphaseflow is obtained, which lays a theoretical foundation forthe introduction of embedded discrete fracture model(EDFM).
∂ ϕbαsa½ �∂t
+∇ · bα −kkraμa
∇pa
� �� �= qa, ð1Þ
where a represents different fluids. In this paper, oil phaseand water phase are represented by subscripts o and w,respectively. b = 1/B, B are volume factors; ϕ is porosity(%); S stands for fluid saturation (%); μ for fluid viscosity(mPa·s); k for absolute permeability (μm2); kr for relativepermeability (μm2); p for pressure (MPa); and q for thesource term (m3/s). The saturation of each phase satisfiesthe equation S0 + Sw = 1. The compressibility coefficient ofthe fluid is
ca = −1Bα
∂Bα
∂p, ð2Þ
where c is the isothermal compressibility coefficient of thefluid (1/MPa). Thus, bα in equation (1) can be expressed as
bα =1Bα
= Bαe exp ca p − peð Þð Þ, ð3Þ
where Bαe is the reference volume coefficient and pe is thereference pressure (MPa).
2.2. Embedded Discrete Fracture Model. Due to the influenceof rock mechanical properties, tectonic stress, thickness ofnonrock mechanical layers, and hydraulic fracturing, thefracture system in tight reservoirs usually has multiscaleproperties [32]. The influence of fractures of different scaleson seepage system is obviously different. According to thelength, width, porosity, and permeability of natural frac-tures, they can be divided into large fractures, medium frac-tures, small fractures, and microfractures [33]. Due to thedifficulty of meshes division of microfractures, the physicalproperty differences caused by them are simplified as matrixheterogeneity. Hydraulic fracturing technology can producemultiscale hydraulic fractures. Both natural and hydraulicfractures are characterized by EDFM. This means that frac-tures of different sizes are represented by differentiated set-tings based on physical properties (porosity, permeability,and degree of filling).
By using EDFM, the matrix is directly divided into struc-tural meshes; then, the fractures are embedded into the bed-rock grid system, and nonneighboring connection (NNC) isformed according to the intersection of fractures and matrix,so as to realize the flow exchange between meshes that areadjacent in the physical model but not adjacent in the com-putational one. Because this model avoids refinement of
Horizontal well length (m) 600 Bottom hole pressure (MPa) 20
3Geofluids
00 100 200 300 400 500 600 700 800 900 1000
50
100
150
200
250
300
350
400
450
500
(a)
0 200 400 600 800 1000 1200 1400 1600 18000
5
10
15
20
25
30
0
2000
4000
6000
8000
10000
12000
14000
q/(m
3 /d)
t/d
Q/(
m3 )
q (km = 0.3 mD)q (km = 0.4 mD)q (km = 0.5 mD)
Q (km = 0.3 mD)Q (km = 0.4 mD)Q (km = 0.5 mD)
(b)
00 100 200 300 400 500 600 700 800 900 1000
2.4
2.5
2.6
2.7
2.8
2.9
3
3.1
Pa
×107
50
100
150
200
250
300
350
400
450
500
(c)
Figure 4: Continued.
4 Geofluids
meshes around fractures, its computing speed is greatlyimproved, especially when dealing with complex fracturedistribution, it has more obvious advantages over thediscrete fracture model [4, 7, 12]. Note that the crack isdimensionally reduced, so kf ∈ Rn − 1. With flow exchangebetween matrix and fracture system considered, the follow-ing equation can be obtained [34]:
qmf = Tmf pf − pm� �
, ð4Þ
qf f = T f f pf i − pf j� �
, ð5Þ
where subscript m and f , respectively, represent the matrixand fracture system; qmf is the flow exchange betweenmatrix system and fracture system; qf f is the flow exchangeamong fractures; I and j are the ith and the jth fracture,respectively; Tmf is the conductivity coefficient of matrixand fracture; T f f is the conductivity coefficient of fractures;and the general formula for calculating the conductivitycoefficient of nonadjacent connection is [15]
TNNC =KNNC · ANNC
dNNC, ð6Þ
where KNNC is the permeability of NNC, namely, theeffective permeability (μm2); ANNC is the contact area ofNNC pair, namely, the flow area (m2); and dNNC is therelevant characteristic distance (m). A more detailed theo-retical approach of EDFM can be found in the paper ofMoinfar [35].
2.3. Heterogeneity of Matrix. Figure 1 is a scanning electronmicroscope image of a block in Changqing tight reservoir ofChina. Natural microfractures are widely distributed in thereservoirs, and permeability of tight matrix and naturalmicrofractures is significantly different [36, 37]. EDFM issuitable for fractures in large scale, while natural microfrac-
tures are in relatively small scales and have a complex distri-bution. In this work, permeability differences caused bynatural microfractures are considered while the cost ofnumerical calculation is minimized to the greatest extent.Therefore, the heterogeneity of natural microfractures isequivalent to that of the matrix to establish a heterogeneousreservoir conforming to the permeability difference betweennatural microfractures and tight matrix.
In order to characterize the porosity and permeability ofheterogeneous reservoirs with a certain distribution law,firstly, based on the widely used Gaussian model, theheterogeneous porosity field is established according to theporosity range, average porosity, and standard deviation.Then, in order to characterize the permeability field corre-sponding to the heterogeneous porosity field, the complexpore structure characteristics are described according tothe fractal characteristics. The more detailed the actual
00 100 200 300 400 500 600 700 800 900 1000
2.4
2.5
2.6Pa
2.7
2.8
2.9
3×10⁷
50
100
150
200
250
300
350
400
450
500
2.3
(d)
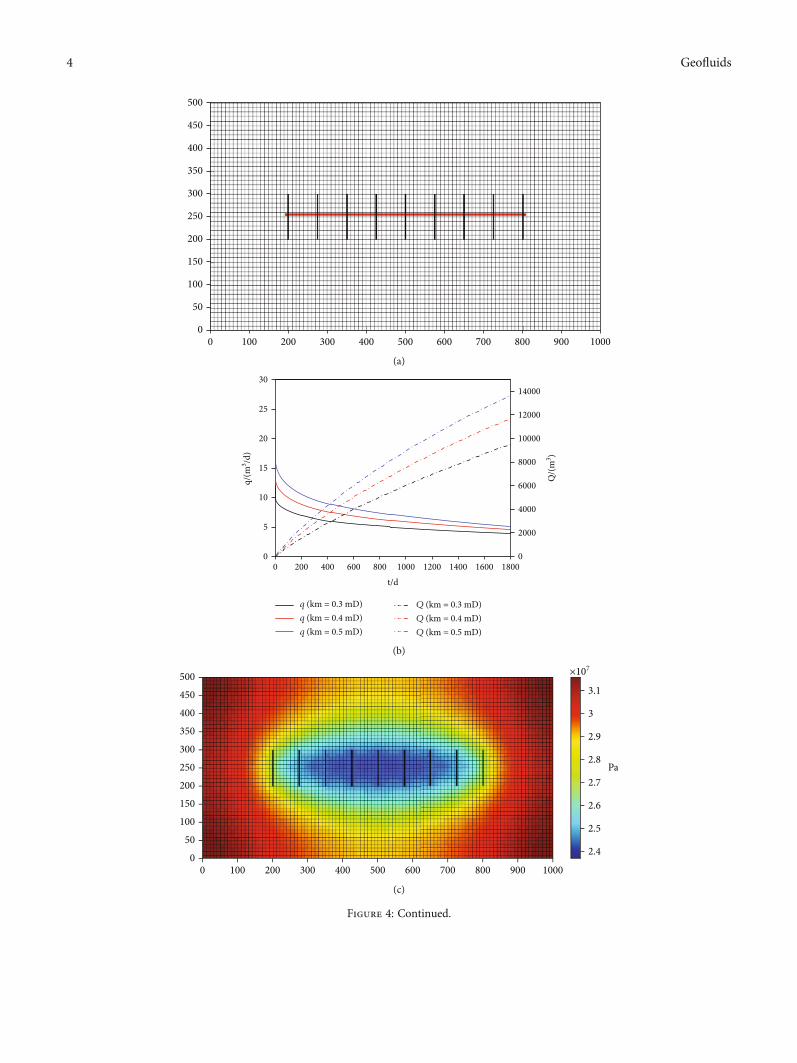
Figure 4: Diagram of meshes, production curve, and pressure distribution: (a) diagram of horizontal well meshes; (b) daily production andaccumulative production under different permeabilities of matrix; (c) pressure distribution when T = 150 d; (d) pressure distribution whenT = 210 d.
0 200 400 600 800 1000 1200 1400 1600 18000
5
10
15
20
t/d
0
2000
4000
6000
8000
10000
12000
14000
q/(m
3 /d)
Q/(
m3 )
Qoso = 0.63
Qoso = 0.6
Qwso = 0.63
Qwso = 0.6
Qoso = 0.63
Qoso = 0.6
Qwso = 0.63
Qwso = 0.6
Figure 5: Daily production and accumulative production underdifferent water saturations.
5Geofluids
reservoir data obtained, the more realistic the establishedheterogeneous field will be. This process is also applicableto other heterogeneous reservoir methods, such as non-Gaussian field.
2.3.1. 3D Gaussian Filter. Gaussian filter is a linear smooth-ing filter, which is widely used in an image noise reducingprocess [38]. The specific operation of Gaussian filtering isto use a template to scan each element in the matrix (hererefers to each mesh) and replace the central mesh value ofthe template with the weighted average value of the meshvalue in the neighborhood determined by the template.
The heterogeneous field established in this work isobtained by convolution of a random normal distribution(template) with Gaussian filter. The 3D Gaussian function is
ϕ x, y, zð Þ = e− x2+y2+z2ð Þ2σ2 , ð7Þ
where σ is standard deviation; the default value in this paperis 0.6. According to Equation (7), the heterogeneous porosityfield can be obtained.
2.3.2. Fractal Permeability Model. It is hard to establish a sat-isfactory model to accurately describe the relationshipbetween the complex pore structure and physical propertiesof reservoir porous media. The Kozeny-Carman (KC) equa-tion is a commonly used empirical formula to express reser-voir permeability, which has been expanded and modified bymany scholars [39, 40]. In this paper, the permeability fractalmodel established by Zheng and Li [41], considering theinfluence of specific surface, is selected to characterize theheterogeneity of reservoir permeability.
K = 2 −Dð Þ32τ2 4 −Dð Þ D − 1ð Þ2 λ
2−2D ϕ3
S2, ð8Þ
where D is the fractal dimension of the porous media porestructure, which reflects the complexity of the pore structure;τ is tortuosity pedantic; λ = rmin/rmax is the ratio of the min-imum and maximum pore radii in a porous medium, repre-senting the difference in equivalent pore radii between tightmatrix and natural microfractures; and S is the porousmedia specific surface (μm2/μm3).
3. Model Validation
The open-source MATLAB Reservoir Simulation Toolbox(MRST) was used to solve the problem [31], and the cou-pling of automatic differential module, black oil model,EDFM fracture module, and fractal model was realized.The governing equations are discretized by the two-pointflux approximate finite volume method. The backward Eulerscheme is used for time discretization. Then, the NNC oper-ator is embedded into the solution frame of the black oilmodel to realize flow simulation. Figure 2 shows the mainframework and solution process.
Firstly, in order to verify the accuracy of the proposedmodel, it is simplified to a single-phase homogeneous ver-sion for comparison with the modeling result in theliterature [15]. The model for verification is a rectangularreservoir of 1000 × 500 × 10m3. The horizontal well wassubjected to constant pressure production after four-stagefracturing. The main parameters are consistent with thosein the literature. Simulation results in Figure 3 show thatthe results of the model established in this paper agree withthose of the conventional homogeneous model, with acomprehensive error of less than 5%. In unconventionalreservoirs, horizontal well fracturing is used to performdepleted development with a low overall recovery, during
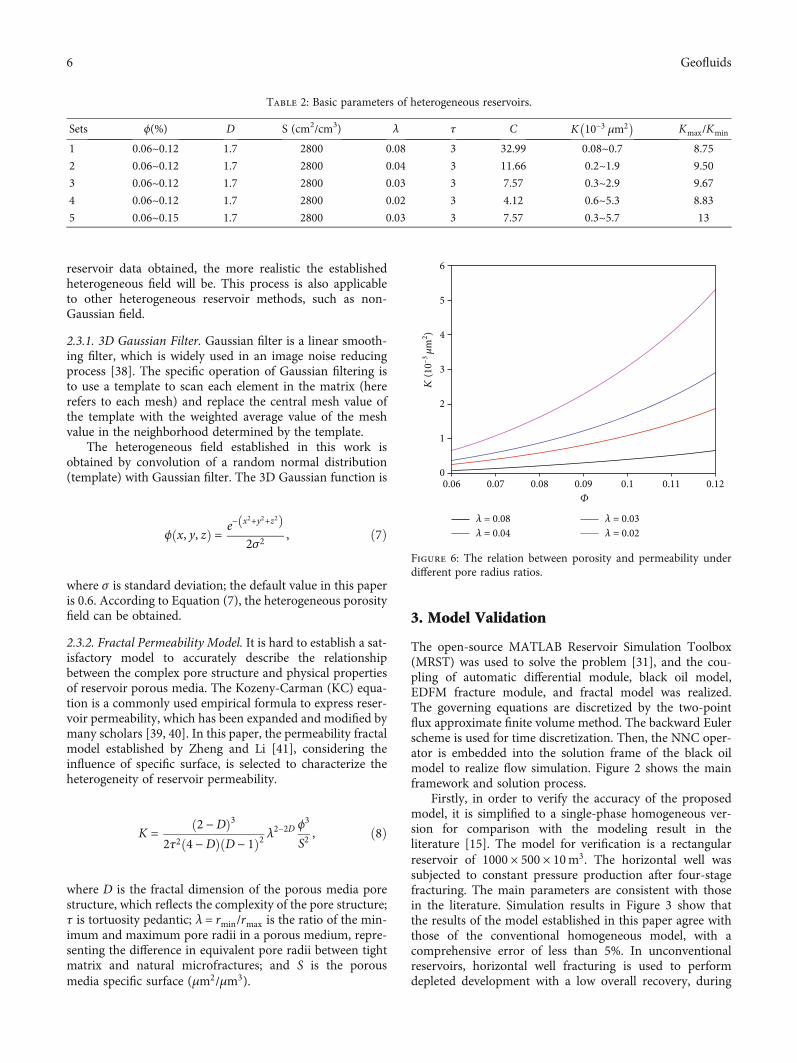
Table 2: Basic parameters of heterogeneous reservoirs.
Sets ϕ(%) D S (cm2/cm3) λ τ C K 10−3 μm2� Kmax/Kmin
1 0.06~0.12 1.7 2800 0.08 3 32.99 0.08~0.7 8.75
2 0.06~0.12 1.7 2800 0.04 3 11.66 0.2~1.9 9.50
3 0.06~0.12 1.7 2800 0.03 3 7.57 0.3~2.9 9.67
4 0.06~0.12 1.7 2800 0.02 3 4.12 0.6~5.3 8.83
5 0.06~0.15 1.7 2800 0.03 3 7.57 0.3~5.7 13
0.060
1
2
3
K (1
0–3 𝜇
m2 ) 4
5
6
0.07 0.08 0.09 0.1 0.11 0.12𝛷
𝜆 = 0.08𝜆 = 0.04
𝜆 = 0.03𝜆 = 0.02
Figure 6: The relation between porosity and permeability underdifferent pore radius ratios.
6 Geofluids
which a rapid decline is shown in the early stage; a low pro-duction is maintained in the later stage.
As a result, some enhanced recovery (EOR) techniques,such as water injection, gas injection huff, and puff, are alsoadopted for production [42]. However, the works reportedin a relevant reference are obviously not applicable for theyonly take consideration of single-phase homogeneousmodel. The model presented in this work could be used forsimulation of homogeneous and heterogeneous reservoirs,
single-phase or multiphase flow and complex EOR technol-ogies, showing a great application potential.
4. Results and Discussion
In this section, both homogeneous and heterogeneous reser-voirs are considered, and there is a deep discussion on phys-ical properties, saturation, in-layer heterogeneity, interlayerheterogeneity, and examples of EOR techniques (the
00100
0.1 0.2 0.3 0.4K (10–3 𝜇m2)
0.5 0.6 0.7
100 200200 300
300 400400 500
50050
0
600700
800900
1000
(a)
K (10–3 𝜇m 2)
00100100 200
200 300300 400
400 500500
500
600700
800900
1000
0.5 1 1.5 2 2.5 3
(b)
0.1 0.2 0.3 0.4 0.5 0.6 0.7 0.8 0.9 10
0.05
0.1
0.15
0.2
0.25
0.3
0.35
0.4
K (10–3𝜇m2)
(c)
0.5 1 1.5 2 2.5 3 3.5 40
0.05
0.1
0.15
0.2
0.25
0.3
0.35
0.4
K (10–3𝜇m2)
(d)
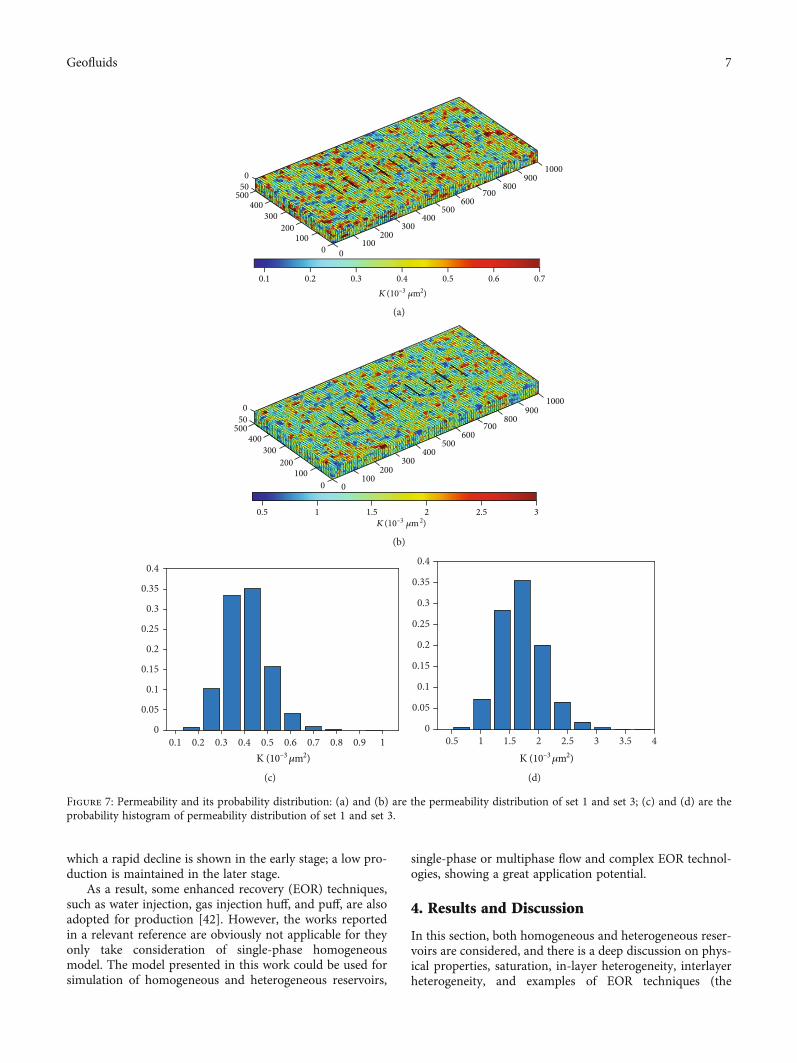
Figure 7: Permeability and its probability distribution: (a) and (b) are the permeability distribution of set 1 and set 3; (c) and (d) are theprobability histogram of permeability distribution of set 1 and set 3.
7Geofluids
injection and production of mixed five-point pattern of ver-tical and horizontal wells and adjacent horizontal wells, etc.)to illustrate the applicability, robustness, and performance ofthe model.
4.1. Homogeneous Reservoir
4.1.1. Different Permeabilities of Matrix. In order to illustratethe necessity of discussing the matrix heterogeneity, theinfluence of matrix permeability in homogeneous reservoirsis first discussed. Basic parameters are set as shown inTable 1. The diagram of horizontal well mesh, productioncurve, and pressure distribution at different times are shownin Figure 4. The effects of three different matrix permeabil-ities with a small difference on the production of fracturedhorizontal wells are discussed in homogeneous reservoirs.It can be seen from the results that although the matrix per-meability difference is small, there is a significant differencein the production of horizontal wells during the early stageof rapid decline. The main reason is that the flow exchangesbetween fracture and matrix and the exchanges betweenfracture and the well bore are the source of energy supplyin this stage. The greater the matrix permeability, the greaterthe production is in the early stage. There is a linear declinein the later stage, in which the main energy supply is fromthe matrix, and the difference gradually decreases. Whenthe permeability difference is small, the adoption of a singlepermeability will cause a large error. When the naturalmicrofractures in tight reservoirs are widely distributed, thelimitations of the characterization by single permeability willbe even more obvious; thus, the heterogeneous model withconsideration of permeability difference is much more inline with the actual situation.
4.1.2. Different Saturations of Matrix. Generally, the fluids inthe reservoir coexist in multiple phases, including oil phase,formation water, and dissolved gas (not considered in thispaper). During the actual production of oil wells, coproduc-tion of water and oil will occur. Therefore, the irreduciblewater saturation set in this section is 35%, and the residualoil saturation is 25%. The oil saturation in the reservoir forcomparison is 63% (scheme 1) and 60% (scheme 2), thematrix permeability of which is set to be 0:5 × 10⁻³μm2,and other parameters are set as shown in Table 1. The pro-duction obtained by simulations is shown in Figure 5.
The initial oil production rate of the two schemes is thesame. The lower the oil saturation, the faster the initial pro-duction decline will be. So that the overall production of lowoil saturation is lower. When the water saturation is higherthan the irreducible water saturation, water production willoccur during oil production. In scheme 1, the water satura-tion is 37%, which is slightly higher than the irreduciblewater saturation. In this case, the movable water is only insmall amount and the water production is small, but withthe increase of water saturation, the water production willsignificantly increase. The average water cut in scheme 1 is10% while the average water cut in scheme 2 is 42%. Inactual reservoirs, water production is also common [43,44]. The effects of saturation and relative permeability of
oil and water on the simulation results cannot be ignored,especially in some EOR methods [45–47]. Thus, the modelproposed can be applied to the complex situation of copro-duction of water and oil during the actual production.
4.2. Heterogeneous Reservoir
4.2.1. In-Layer Heterogeneity. The in-layer heterogeneity ischaracterized according to Equations (7) and (8) and theGaussian filter; the permeability field is established. Themain parameters are set as shown in Table 2.
The relation between porosity and permeability underdifferent ratios of the minimum and maximum pore radiiin porous media ðλ = rmin/rmaxÞ is shown in Figure 6. rminis taken as the pore radius of tight matrix, and rmax is takenas the equivalent pore radius containing natural microfrac-ture characteristics. The stronger the heterogeneity is, thesmaller the value of λ, and the higher the permeability.The Kmax/Kmin in Table 2 stands for permeability difference,the value of which for the four types in the examples canreach about 10 times or even higher, so it can be reasonablyadjusted according to the actual reservoir situation. 3D per-meability distribution field generated by the parameters ofset 1 and set 3 in Table 2, and the corresponding probabilityhistogram is shown in Figure 7.
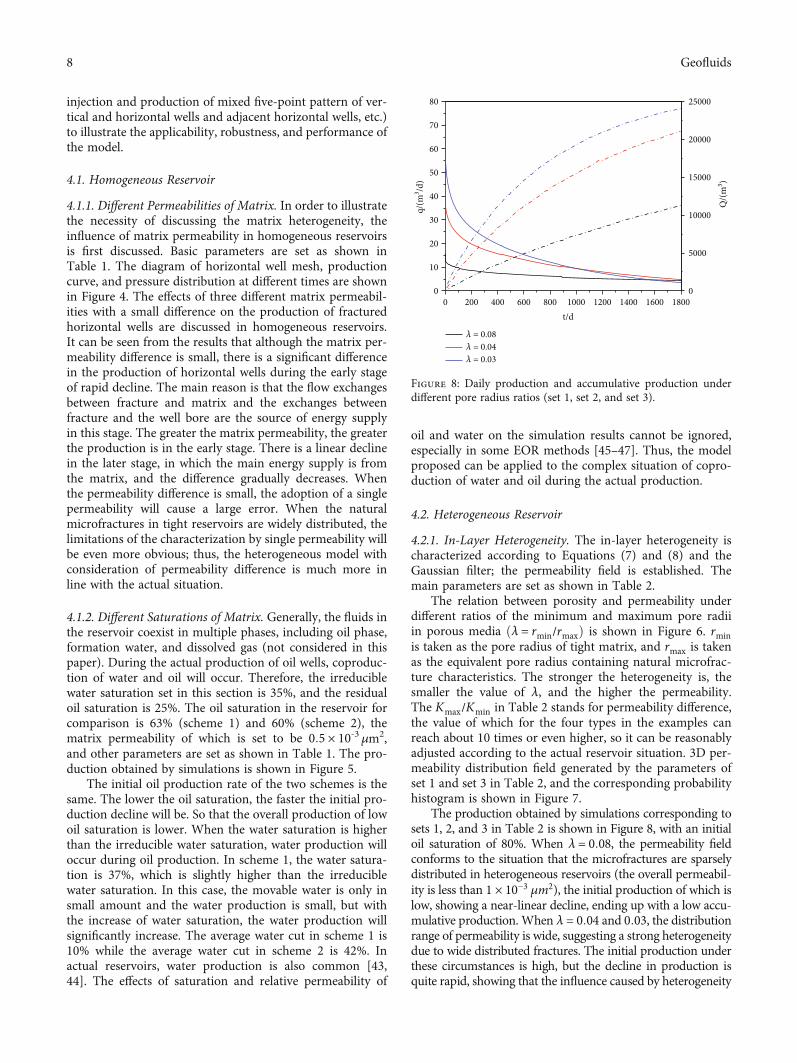
The production obtained by simulations corresponding tosets 1, 2, and 3 in Table 2 is shown in Figure 8, with an initialoil saturation of 80%. When λ = 0:08, the permeability fieldconforms to the situation that the microfractures are sparselydistributed in heterogeneous reservoirs (the overall permeabil-ity is less than 1 × 10⁻³ μm2), the initial production of which islow, showing a near-linear decline, ending up with a low accu-mulative production. When λ = 0:04 and 0:03, the distributionrange of permeability is wide, suggesting a strong heterogeneitydue to wide distributed fractures. The initial production underthese circumstances is high, but the decline in production isquite rapid, showing that the influence caused by heterogeneity
0 200 400 600 800 1000 1200 1400 1600 18000
10
20
30
40
50
60
70
80
t/d
0
5000
10000
15000
20000
25000
q/(m
3 /d)
Q/(
m3 )
𝜆 = 0.08𝜆 = 0.04𝜆 = 0.03
Figure 8: Daily production and accumulative production underdifferent pore radius ratios (set 1, set 2, and set 3).
8 Geofluids
on the production of horizontal well is large in the earlier stageand smaller in the later one.
4.2.2. Interlayer Heterogeneity. The heterogeneity of mono-layer only presents the heterogeneity within one layer, butthe heterogeneity in vertical direction cannot be neglectedeither. Interlayers exist in the vertical direction of actual res-ervoirs (porosity and permeability of which are significantlylower than the upper and lower layers). Effect on productionbrought by the following two kinds of interlayers is dis-cussed in this section:
(a) The vertical direction of reservoir is divided into 10layers of meshes, among which the 1st~3rd and8th~10th layers have strong heterogeneity with naturemicrofractures widely distributed, while the 4th~7thlayers are relatively tight, which altogether is consid-ered the interlayer
(b) The vertical direction of reservoir is divided into 10layers ofmeshes to represent 5 heterogeneous layers thateach contains two layers of meshes. The 1st, 3rd, and 5st
layers in the vertical direction have strong heterogeneitywith nature microfractures widely distributed, while the2nd and 4th layers are considered the tight layers
The permeability distribution of the above two situationsand the production obtained accordingly by simulations areshown in Figures 9 and 10.
Although the reservoir simulated in case (a) has only oneinterlayer, the thickness of which is relatively large and con-centrated. An overall near-linear decline shows in the produc-tion with a small initial production. The total proportion ofthe two interlayers accounting for all the layers in case (b) isthe same as that in case (a), but since the interlayers aredivided into two layers and are alternately arranged with
00 100
1 2 3 4K (10–3𝜇m2)
5 6 8
200200 300 400
400 500
20400
600 700800
9001000
7
(a)
01000
100200
300400
5004020
0
200 300 400 500600 700 800 900 1000
1 2 3 4K (10–3𝜇m2)
5 6 87
(b)
Figure 9: Permeability distribution simultaneously considering in-layer and interlayer heterogeneity: (a) and (b) are the permeabilitydistribution (containing one and two interlayers, respectively).
0 200 400 600 800 1000 1200 1400 1600 18000
10
20
30
40
50
60
70
80
t/d
0
5000
10000
15000
20000
25000
q/(m
3 /d)
Q/(
m3 )
Figure 10: Daily production and accumulative production underdifferent interlayer heterogeneities.
9Geofluids
strong heterogeneous layers, the initial production obviouslyincreases. The later stage of production of these two shows alittle difference.
4.2.3. Waterflooding Simulation Based on Five-Point WellPattern. For the tight reservoir with low porosity and lowpermeability, the recovery percent is low and the production
Injector1
Injector2
5004504003503002502001501005000
100
20100Injector4
200
Injector3
450400350300250200
00
Injector4
(a)
Injector2
Injector1
Injector401020
200100
0 0 50 100 150 200 250 300 350 400 450 500
Injector3
1 2 3 4k (10–3𝜇m 2)
5 6 87
(b)
00
100
200
01020
50 100 150 200 250 300 350 400 450 500
Injector 4
Injector 1
Injector 2
Injector 3
0.2 0.25 0.3 0.35 0.4 0.45Sw
0.5 0.55 0.6 0.65 0.7
(c)
0 200 400 600 800 1000 1200 1400 1600 18000
20
40
60
t/d
0.0
0.2
0.4
0.6
0.8
1.0
q/(m
3 /d)
fw
So = 0.8So = 0.6
fwSo = 0.8
fwSo = 0.6
(d)
Figure 11: Numerical simulation of mixed five-point pattern of vertical well and horizontal well: (a) diagram of mixed five-point pattern ofvertical well and horizontal well; (b) permeability distribution; (c) water saturation distribution when T = 300 d; (d) daily production andwater cut under different oil saturations.
10 Geofluids
0200
400600
8001000
0200
400600
8001000
12001400
16001800
2000
Producer 2
Producer 1Injector 1
4020
0
(a)
Injector1
Injector2Injector4
Injector3
0
0 0
100
200
300
400
5001020
200
100
1 2 3 4K (10–3𝜇m2)
5 6 87
Inector4
Injecttttor3 100
200
300
400
100
(b)
0200
400
800600
10004020
0
0200
400600
8001000
12001400
16001800
0.2
0.25
0.3
0.35
0.4
0.45Sw
0.5
0.55
0.6
0.65
0.7
2000
(c)
Figure 12: Continued.
11Geofluids
drops rapidly by using depleted development of horizontalwell. Water injection and gas injection are commonly usedto improve the productivity.
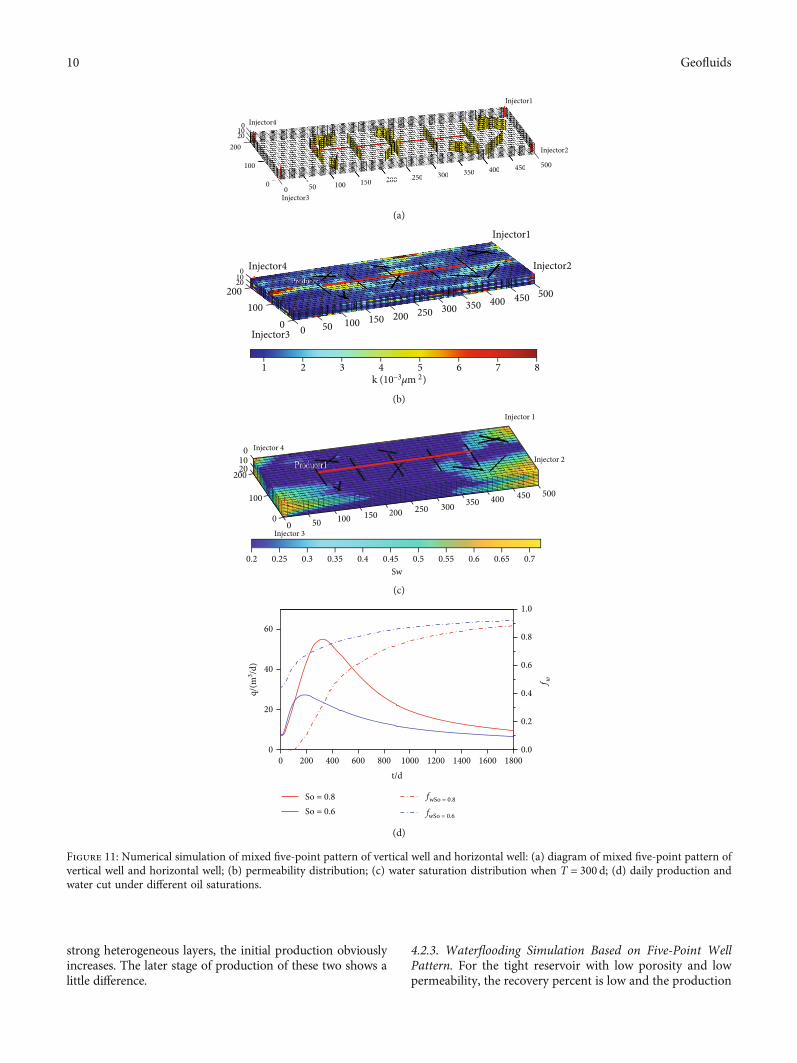
In this section, discussions are made on establishing amultiscale fracture system, which contains microfracture,fracture in large scale, and artificial fractures, based on thefractal multilayer heterogeneous reservoir simulated. Fourinjection wells are set at the four corners (taking waterinjection as an example, with an injection rate of 20m3/d).And the productivity of horizontal wells with externalenergy supply is explored by using a five-point well pattern.The meshes of injection and production, permeability distri-bution, and the water saturation when the initial saturationis 80% after producing for 300 days are shown inFigures 11(a) and 11(b), respectively. It is shown that thedifferences in the front edge of water flooding are large inthe four injection wells due to the heterogeneity. When thewater reaches the fracture in large scale or artificial fracture,it will quickly flow into the fractures, which will directlyaffect the water breakthrough time of the horizontal wells.Figure 11(d) shows the production curves under differentsaturations. Compared with the depleted developing, theproduction curve is hump-shaped due to the injection ofexternal fluid to replenish formation energy. When the ini-tial oil saturation is 80%, there will be a water-free period,the length of which depends on whether the water commu-nicates with the production well by the fracture or fault. Inthis case, fractures are widely distributed; the water cut risesin an S-shaped curve.
When the initial oil saturation is 60%, water productionoccurs from the well opening, and the water cut reaches toaround 43%. Although the production curve is also hump-shaped, it is obviously lower and turns to decline after reachingthe peak, showing no water-free period in the water cut curve.
4.2.4. Injection and Production of Adjacent Horizontal Wells.The cases above are examples using constant pressure pro-duction, in this section, three adjacent horizontal wells are
discussed. The middle one is injection well with a rate of50m3/d, and the other two are in constant production modewith a production rate of 25m3/d. In this case, the main pur-pose to compare the effects of heterogeneity on injection-production connectivity.
Also, two interlayers are arranged. In Figure 12, themeshes are shown in (a); the permeability is shown in (b),suggesting a red section with relatively high permeabilitybetween the injection well and production well 2; the samesection has a relatively higher water saturation shown in(c), suggesting a better connectivity between the injectionwell and production well; the production curves obtainedby simulation are shown in (d); it could be directly observedthat the water breakthrough time of production well 2 is ear-lier than that of production well 1. And because of the influ-ence by heterogeneity, the decline of oil production and therise of water production in curves are fluctuant but not assmooth as those in the previous cases. This illustrates thenecessity to consider heterogeneity in the simulation for wellpatterns, for the communication of the fluid injected will befurther accelerated if there exists a fracture zone with con-nectivity to certain extent.
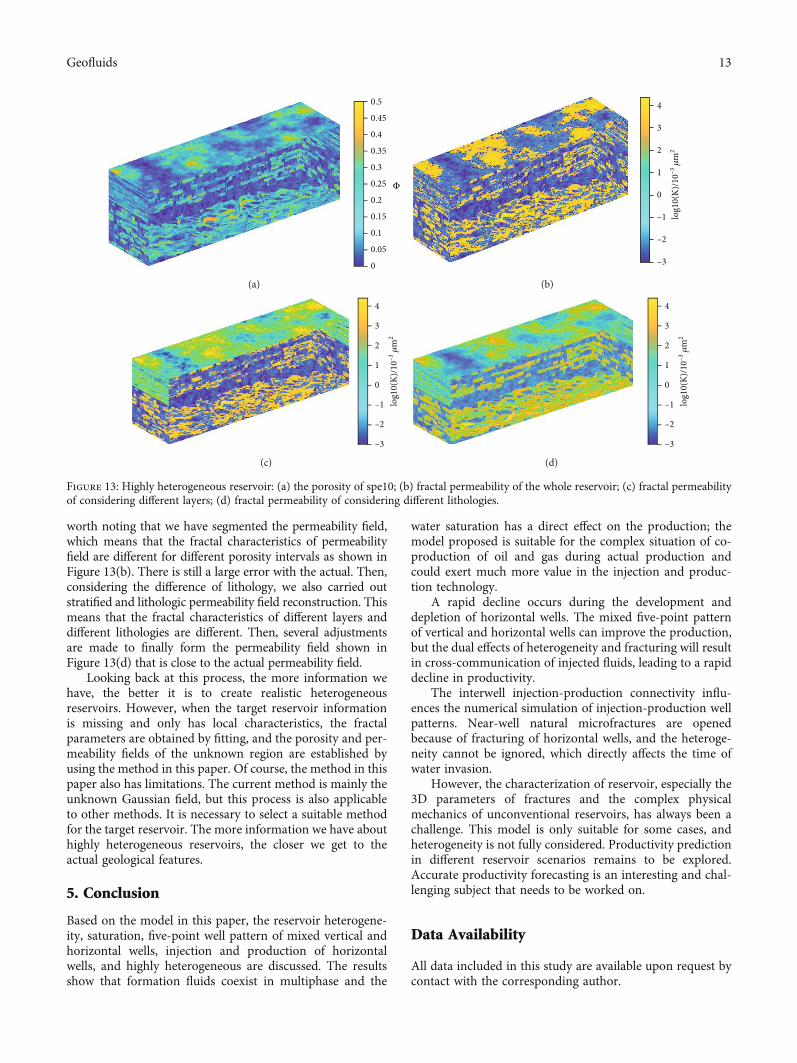
4.2.5. Highly Heterogeneous Reservoir. The previous examplesshow a wealth of cases for unconventional reservoirs, and thissection focuses on how to build reservoirs with highly hetero-geneous reservoirs with differences in permeability that canreach more than 106, which is a common problem in real res-ervoirs. It is well known that reservoir information is usuallylimited. Assuming that information about porosity is known,as in the case of SPE10, and the proposed method was usedto establish the permeability field.
As shown in Figure 13(a), there is a significant differencein physical properties between the upper and lower layers ofthe reservoir, which means a significant difference in perme-ability. In order to understand the fractal characteristics ofthe reservoir, a preliminary permeability field is first estab-lished for the whole reservoir through Equation (8). It is
0 500 1000 1500 2000 250020
21
22
23
24
25
0
2
4
6
t/d
qo2
qo1
qw2
qw1
q o/(m
3 /d)
q w/(m
3 /d)
(d)
Figure 12: Numerical simulation of injection and production of adjacent horizontal wells: (a) diagram of meshes; (b) permeabilitydistribution; (c) diagram of water saturation; (d) daily production and daily water production of different wells.
12 Geofluids
worth noting that we have segmented the permeability field,which means that the fractal characteristics of permeabilityfield are different for different porosity intervals as shown inFigure 13(b). There is still a large error with the actual. Then,considering the difference of lithology, we also carried outstratified and lithologic permeability field reconstruction. Thismeans that the fractal characteristics of different layers anddifferent lithologies are different. Then, several adjustmentsare made to finally form the permeability field shown inFigure 13(d) that is close to the actual permeability field.
Looking back at this process, the more information wehave, the better it is to create realistic heterogeneousreservoirs. However, when the target reservoir informationis missing and only has local characteristics, the fractalparameters are obtained by fitting, and the porosity and per-meability fields of the unknown region are established byusing the method in this paper. Of course, the method in thispaper also has limitations. The current method is mainly theunknown Gaussian field, but this process is also applicableto other methods. It is necessary to select a suitable methodfor the target reservoir. The more information we have abouthighly heterogeneous reservoirs, the closer we get to theactual geological features.
5. Conclusion
Based on the model in this paper, the reservoir heterogene-ity, saturation, five-point well pattern of mixed vertical andhorizontal wells, injection and production of horizontalwells, and highly heterogeneous are discussed. The resultsshow that formation fluids coexist in multiphase and the
water saturation has a direct effect on the production; themodel proposed is suitable for the complex situation of co-production of oil and gas during actual production andcould exert much more value in the injection and produc-tion technology.
A rapid decline occurs during the development anddepletion of horizontal wells. The mixed five-point patternof vertical and horizontal wells can improve the production,but the dual effects of heterogeneity and fracturing will resultin cross-communication of injected fluids, leading to a rapiddecline in productivity.
The interwell injection-production connectivity influ-ences the numerical simulation of injection-production wellpatterns. Near-well natural microfractures are openedbecause of fracturing of horizontal wells, and the heteroge-neity cannot be ignored, which directly affects the time ofwater invasion.
However, the characterization of reservoir, especially the3D parameters of fractures and the complex physicalmechanics of unconventional reservoirs, has always been achallenge. This model is only suitable for some cases, andheterogeneity is not fully considered. Productivity predictionin different reservoir scenarios remains to be explored.Accurate productivity forecasting is an interesting and chal-lenging subject that needs to be worked on.
Data Availability
All data included in this study are available upon request bycontact with the corresponding author.
0
0.05
0.1
0.15
0.2
0.25
0.3
0.35
0.4
0.45
0.5
Ф
(a)
–3
–2
–1
0
log1
0(K)
/10–3
𝜇m
2
1
2
3
4
(b)
–3
–2
–1
0lo
g10(
K)/1
0–3 𝜇
m2
1
2
3
4
(c)
–3
–2
–1
0
log1
0(K)
/10–3
𝜇m
2
1
2
3
4
(d)
Figure 13: Highly heterogeneous reservoir: (a) the porosity of spe10; (b) fractal permeability of the whole reservoir; (c) fractal permeabilityof considering different layers; (d) fractal permeability of considering different lithologies.
13Geofluids
Conflicts of Interest
The authors declare no conflict of interest.
Acknowledgments
The authors are grateful for the financial support from theNational Natural Science Foundation of China (Grant No.51874317 and No. 52074317), the Strategic CooperationTechnology Projects of CNPC and CUPB (ZLZX2020-02),and the Science Foundation of China University of Petro-leum, Beijing (No. 2462020YXZZ028). Special thanks aredue to the China Scholarship Council and the researchersin SINTEF.
References
[1] P. Zhang, Research of Microscopic Pore Structure and ReservoirEvaluation of Dingbian Chang 7 Tight Reservoir in YanchangOilfield, Southwest Petroleum University, 2019.
[2] Y. L. Chen, Y. Ma, F. Pan, and S. T. Wang, “Research progressin multi-scale mechanics of composite materials,” ChineseJournal of Solid Mechanics, vol. 39, no. 1, pp. 1–68, 2018.
[3] H. Tian, L. B. Zeng, X. Xu et al., “Characteristics of naturalfractures in marine shale in Fuling area, Sichuan Basin, andtheir influence on shale gas,” Oil and Gas Geology, vol. 41,no. 3, pp. 474–483, 2020.
[4] J. Yao, Z. S. Wang, Y. Zhang, and Z. Q. Huang, “Numericalsimulation method of discrete fracture network for naturallyfractured reservoirs,” Acta Petrolei Sinica, vol. 31, no. 2,pp. 284–288, 2010.
[5] N. Cao, G. Lei, P. C. Dong, H. Li, Z. S. Wu, and Y. D. Li,“Stress-dependent permeability of fractures in tight reser-voirs,” Energies, vol. 12, no. 1, p. 117, 2019.
[6] L. Li, Study on Numerical Simulation Method for Multi-PhaseFlow in Tight Oil Reservoirs, University of Science and Tech-nology of China, 2020.
[7] J. Yang, X. Lü, and J. Li, “Study on discrete fracture networkrandom generation and numerical simulation of fractured res-ervoirs,” Petroleum Geology and Recovery Efficiency, vol. 18,no. 6, pp. 74–77, 2011.
[8] B. Lepillier, P. O. Bruna, D. F. Bruhn et al., “From outcropscanlines to discrete fracture networks, an integrative work-flow,” Journal of Structural Geology, vol. 133, article 103992,2020.
[9] Y. Ali, “Hydraulic fracturing modeling using a discrete fracturenetwork in the Barnett Shale,” International Journal of RockMechanics and Mining Sciences, vol. 119, pp. 98–108, 2019.
[10] W. L. Yao, S. Mostafa, Z. Yang, and G. Xu, “Role of naturalfractures characteristics on the performance of hydraulic frac-turing for deep energy extraction using discrete fracture net-work (DFN),” Engineering Fracture Mechanics, vol. 230,article 106962, 2020.
[11] S. H. Lee, M. F. Lough, and C. L. Jensen, “Hierarchical model-ing of flow in naturally fractured formations with multiplelength scales,” Water Resources Research., vol. 37, no. 3,pp. 443–455, 2001.
[12] A. Moinfar, A. Varavei, K. Sepehrnoori, and R. T. Johns,“Development of an efficient embedded discrete fracturemodel for 3D compositional reservoir simulation in fracturedreservoirs,” SPE Journal, vol. 19, no. 2, pp. 289–303, 2014.
[13] X. Yan, Z. Q. Huang, J. Yao, Y. Li, and D. Fan, “An efficientembedded discrete fracture model based on mimetic finite dif-ference method,” Journal of Petroleum Science and Engineer-ing, vol. 145, pp. 11–21, 2016.
[14] R. J. Shao and Y. di, “An integrally embedded discrete fracturemodel with a semi-analytic transmissibility calculationmethod,” Energies, vol. 11, no. 12, p. 3491, 2018.
[15] L. H. Zhang, S. Liu, R. Yong, B. Li, and Y. L. Zhao, “EDFM-based numerical simulation of horizontal wells with multi-stage hydraulic fracturing in tight reservoirs,” Journal of South-west Petroleum University (Science & Technology Edition),vol. 41, no. 4, pp. 1–11, 2019.
[16] M. X. Fiallos, W. Yu, R. Ganjdanesh et al., “Modeling interwellinterference due to complex fracture hits in Eagle Ford usingEDFM,” in International Petroleum Technology Conference,Beijing, China, 2019.
[17] D. Zhu, Y. Hu, M. Cui et al., “Productivity simulation ofhydraulically fractured wells based on hybrid local grid refine-ment and embedded discrete fracture model,” PetroleumExploration and Development, vol. 47, no. 2, pp. 365–373,2020.
[18] X. Rao, L. S. Cheng, R. Y. Cao, X. P. An, and Z. D. Lei, “Pre-processing algorithm of three- dimensional embedded discretefracture model for inclined fracture with arbitrary shape,” Sci-ence Technology and Engineering, vol. 20, no. 3, pp. 1035–1043,2020.
[19] J. C. Xu, B. L. Chen, B. J. Sun, and R. Z. Jiang, “Flow behavior ofhydraulic fractured tight formations considering pre-Darcyflow using EDFM,” Fuel, vol. 241, pp. 1145–1163, 2019.
[20] J. C. Qiao, J. H. Zeng, S. Jiang et al., “Heterogeneity of reservoirquality and gas accumulation in tight sandstone reservoirsrevealed by pore structure characterization and physical simu-lation,” Fuel, vol. 253, pp. 1300–1316, 2019.
[21] F. A. Marcondes, L. O. Santos, A. Varavei, and K. Sepehrnoori,“A 3D hybrid element-based finite-volume method for hetero-geneous and anisotropic compositional reservoir simulation,”Journal of Petroleum Science and Engineering, vol. 108,pp. 342–351, 2013.
[22] G. Lei, C. Wang, Z. Wu, H. Wang, andW. Li, “Theory study ofgas-water relative permeability in roughened fractures,” Jour-nal of Mechanical Engineering Science, vol. 232, no. 24,pp. 4615–4625, 2018.
[23] N. Cao and G. Lei, “Stress sensitivity of tight reservoirs duringpressure loading and unloading process,” Petroleum Explora-tion and Development, vol. 46, no. 1, pp. 138–144, 2019.
[24] B. B. Mandelbrot and J. A. Wheeler, “The fractal geometry ofnature,” American Journal of Physics, vol. 51, no. 3, pp. 286-287, 1983.
[25] W. M. Yu, “Application of fractal geometry in the study of res-ervoir microscopic heterogeneity,” Yunnan Chemical Technol-ogy, vol. 44, no. 22, pp. 41–44, 2017.
[26] J. C. Cai, L. H. Zhang, Y. Ju, G. Pia, and Z. Zhang, “An intro-duction to fractal-based approaches in unconventional reser-voirs–part I,” Fractals, vol. 26, no. 2, article 1802001, 2018.
[27] Q. Q. Dai, G. W. Wang, X. Zhao et al., “Fractal model for per-meability estimation in low-permeable porous media with var-iable pore sizes and unevenly adsorbed water lay,”Marine andPetroleum Geology, vol. 130, p. 105135, 2021.
[28] B. M. Yu and P. Cheng, “A fractal permeability model for bi-dispersed porous media,” International Journal of Heat andMass Transfer, vol. 45, no. 14, pp. 2983–2993, 2002.
14 Geofluids
[29] X. J. Chen and G. Q. Yao, “An improved model for permeabil-ity estimation in low permeable porous media based on fractalgeometry and modified Hagen-Poiseuille flow,” Fuel, vol. 210,pp. 748–757, 2017.
[30] S. N. Dong, L. L. Xu, Z. X. Dai et al., “A novel fractal model forestimating permeability in low-permeable sandstone reser-voirs,” Fractals, vol. 28, no. 8, article 2040005, 2020.
[31] K. A. Lie, An Introduction to Reservoir Simulation UsingMATLAB/GNU Octave: User Guide for the MATLAB ReservoirSimulation Toolbox (MRST), Cambridge University Press,2019.
[32] L. B. Zeng, P. Lv, X. F. Qu, and J. M. Fan, “Multi-scale fracturesin tight sandstone reservoirs with low permeability and geo-logical conditions of their development,” Oil & Gas Geology,vol. 41, no. 3, pp. 449–454, 2020.
[33] W. Y. Lv, L. B. Zeng, S. Q. Chen et al., “Characterizationmethods of multi-scale natural fractures in tight and low-permeability sandstone reservoirs,” Geological Review, vol. 67,no. 2, pp. 543–556, 2021.
[34] Q. F. Zhang, C. Q. Huang, J. Yao, Y. Y. Wang, and Y. Li,“Multi-scale embedded discrete fracture method,” ChineseJournal of Computational Mechanics, vol. 35, no. 4, pp. 507–513, 2018.
[35] A. Moinfar, Development of an Efficient Embedded DiscreteFracture Model for 3D Compositional Reservoir Simulation inFractured Reservoirs, The University of Texas at Austin, 2013.
[36] L. Gong, J. Wang, S. Gao et al., “Characterization, controllingfactors and evolution of fracture effectiveness in shale oil reser-voirs,” Journal of Petroleum Science and Engineering, vol. 203,p. 108655, 2021.
[37] G. H. Xu, H. J. Yin, H. F. Yuan, and C. Q. Xing, “Decline curveanalysis for multiple-fractured horizontal wells in tight oil res-ervoirs,” Advances in Geo-Energy Research, vol. 4, no. 3,pp. 296–304, 2020.
[38] Z. Yang, G. L. Li, H. Lin et al., “Improvement on three-dimensional Gaussian and Savitzky-Golay filters in denoisingof Monte Carlo dose distributions,” Chinese Journal of Compu-tational Physics, vol. 26, no. 5, pp. 725–730, 2009.
[39] B. Li, R. C. Wong, and S. A. Heidari, “A modified Kozeny-Carman model for estimating anisotropic permeability of softmudrocks,” Marine and Petroleum Geology, vol. 98, pp. 356–368, 2018.
[40] M. S. L. Amir, “Modifications to the Kozeny-Carman model toenhance petrophysical relationships,” Exploration Geophysics,vol. 49, no. 4, pp. 553–558, 2018.
[41] B. Zheng and J. H. Li, “A new fractal permeability model forporous media based in Kozeny-Carman equation,” NaturalGas Geoscience, vol. 26, no. 1, pp. 193–198, 2015.
[42] H. J. Liu, Z. W. Zhu, W. Patrick, J. F. Liu, H. W. Lei, and L. W.Zhang, “numerical visualization of supercritical CO2 displace-ment in pore-scale porous and fractured media saturated withwater,” Advances in Geo-Energy Research, vol. 4, no. 4,pp. 419–434, 2020.
[43] G. F. Lin and L. M. Luo, “Accelerated Monte Carlo dose distri-bution simulation based on three-dimensional Gaussian filterdenoising,” Chinese Journal of Radiological Medicine and Pro-tection, vol. 26, no. 4, pp. 389-390, 2006.
[44] J. S. Dong, Analysis on the Development Characterization ofTight Oil in Shahejie Formation in Block Fan 154, ChengduUniversity of Technology, 2018.
[45] K. Siarhei and T. W. Patzek, “Three-dimensional simulation oftracer transport dynamics in formations with high-permeabilitychannels or fractures: estimation of oil saturation,” Physics ofFluids, vol. 31, article 113604, 2019.
[46] H. Y. Yu, Z. L. Yang, L. Luo et al., “Application of cumulative-in-situ-injection-production technology to supplement hydro-carbon recovery among fractured tight oil reservoirs: a casestudy in Changqing Oilfield, China,” Fuel, vol. 242, pp. 804–818, 2019.
[47] Y. Wang, S. Q. Cheng, and K. D. Zhang, “Investigation on thepressure behavior of injectors influenced by waterflood-induced fractures: field cases in Huaqing reservoir, ChangqingOilfield, China,” Oil & Gas Science and Technology, vol. 75,no. 20, pp. 1–17, 2020.