Bulletin of the Seismological Society of America, Vol. 88, No. 2, pp. 428-440, April 1998 Three-Dimensional Simulation of the Near-Fault Ground Motion for the 1995 Hyogo-ken Nanbu (Kobe), Japan, Earthquake by Arben Pitarka, Kojiro Irikura, Tornotaka Iwata, and Haruko Sekiguchi Abstract The 17 January 1995 Hyogo-ken Nanb u earthquake is a typical example showing that the ground motions along basin-edge faults can be very destructive. In this study, we simulate the near-fault ground motion from this earthquake based on a kinematic fault model and a simplified 3D velocity structure of the Kobe area. The kinematic earthquake rupture and the wave propagation are modeled using a 3D finite-difference method (FDM). Our simulation identifies the basin-edge effect as an important factor that influenced the ground-motion amplification pattern in the Kobe area. We found that the coupling of the source directivity and basin-edge effects causes impulsive ground motions with extremely high amplitude at periods greater than 1 sec and in a narrow zone offset less than 1 km from the basin edge. The combination of these effects acted to create a fairly continuous band of amplification that extends about 30 km in an elongated zone parallel to the basin-edge boundary. In some areas, localized site effects might have been as important as the above- mentioned effects, but they cannot explain the continuity of the extended east-west zone of damage. Introduction The 17 January 1995 Hyogo-ken Nanbu earthquake was one of the most destructive earthquakes in Japan even though of a moderate magnitude (M = 6.9). The earthquake caused extreme damage in Kobe city and its surrounding area, close to the northern edge of the Osaka basin (Archi- tectural Institute of Japan, 1995). The area of the highest seismic intensity (VII-JMA scale) lies mainly in a densely populated part of Kobe (Fig. 1). The earthquake occurred on a system of predominantly strike-slip faults that form the northern boundary of the Osaka basin (Sekiguchi et al., 1996b). Near-source strong ground motions from the earth- quake, recorded at different sites in the city, and analysis of the damage to the structures show that the damage can be attributed to extremely large ground velocities (Told et al., 1995; Irikura, 1995; Nakashima et al., 1995; Suzuki et al., 1995). The initial hypothesis of the cause of the damage belt was based on the assumption of the existence of an unknown buried fault beneath the damage zone. This hypothesis was abandoned since no surface breaks have been found in the Kobe city area. Furthermore, the fault rupture inversions (Wald, 1995, 1996; Ide et al., 1996; Yoshida et al., 1996; Sekiguchi et al., 1996b; Horikawa et al., 1996) show that the slip beneath Kobe city is not concentrated in the shallow part of the fault. Two-dimensional numerical modeling of the ground motion from the mainshock (Kawase, 1996; Motosaka and Nagano, 1996) and aftershocks (Pitarka et al., 1996a, 1997), based on different techniques, suggests that the cause of the ground-motion amplification in the damage zone is the ba- sin-edge effect. In these studies, it is argued that the width of the damage zone is controlled by the interference between the basin-edge diffracted waves and the primary S wave. Our purpose is to analyze the extension of this phenomena along the northern part of the basin and demonstrate the implica- tion of the interaction between the basin-edge effect and the source effects in the observed near-fault ground motions by using 3D numerical simulation. In general, near-source ground motions are controlled primarily by the source radiation and the directivity effects. However, for cases in which the earthquake occurs on a basin margin fault that forms the basin edge, as the Hyogo- ken Nanbu earthquake, the basin-edge effect becomes very important. The Hyogo-ken Nanbu earthquake is a good ex- ample where the interaction of the source directivity and basin-edge effect causes impulsive ground motions with par- ticularly large-amplitude ground velocities. Since other large cities are constructed on basin margins that are fault con- trolled, like Kobe, it is important to understand how the near- fault ground motions from Hyogo-ken Nanbu earthquake were amplified by the basin-edge effect. Since the pioneering work of Bard and Bouchon (1980a,b) the basin-edge effect has been demonstrated in many 2D and 3D numerical simulations (e.g., Hisada and 428
Transcript
Bulletin of the Seismological Society of America, Vol. 88, No. 2, pp. 428-440, April 1998
Three-Dimensional Simulation of the Near-Fault Ground Motion for
the 1995 Hyogo-ken Nanbu (Kobe), Japan, Earthquake
by Arben Pitarka, Kojiro Irikura, Tornotaka Iwata, and Haruko Sekiguchi
Abstract The 17 January 1995 Hyogo-ken Nanb u earthquake is a typical example showing that the ground motions along basin-edge faults can be very destructive. In this study, we simulate the near-fault ground motion from this earthquake based on a kinematic fault model and a simplified 3D velocity structure of the Kobe area. The kinematic earthquake rupture and the wave propagation are modeled using a 3D finite-difference method (FDM). Our simulation identifies the basin-edge effect as an important factor that influenced the ground-motion amplification pattern in the Kobe area. We found that the coupling of the source directivity and basin-edge effects causes impulsive ground motions with extremely high amplitude at periods greater than 1 sec and in a narrow zone offset less than 1 km from the basin edge. The combination of these effects acted to create a fairly continuous band of amplification that extends about 30 km in an elongated zone parallel to the basin-edge boundary. In some areas, localized site effects might have been as important as the above- mentioned effects, but they cannot explain the continuity of the extended east-west zone of damage.
Introduction
The 17 January 1995 Hyogo-ken Nanbu earthquake was one of the most destructive earthquakes in Japan even though of a moderate magnitude (M = 6.9). The earthquake caused extreme damage in Kobe city and its surrounding area, close to the northern edge of the Osaka basin (Archi- tectural Institute of Japan, 1995). The area of the highest seismic intensity (VII-JMA scale) lies mainly in a densely populated part of Kobe (Fig. 1). The earthquake occurred on a system of predominantly strike-slip faults that form the northern boundary of the Osaka basin (Sekiguchi et al.,
1996b). Near-source strong ground motions from the earth-
quake, recorded at different sites in the city, and analysis of the damage to the structures show that the damage can be attributed to extremely large ground velocities (Told et al., 1995; Irikura, 1995; Nakashima et al., 1995; Suzuki et al., 1995). The initial hypothesis of the cause of the damage belt was based on the assumption of the existence of an unknown buried fault beneath the damage zone. This hypothesis was abandoned since no surface breaks have been found in the Kobe city area. Furthermore, the fault rupture inversions (Wald, 1995, 1996; Ide et al., 1996; Yoshida et al., 1996; Sekiguchi et al., 1996b; Horikawa et al., 1996) show that the slip beneath Kobe city is not concentrated in the shallow part of the fault.
Two-dimensional numerical modeling of the ground motion from the mainshock (Kawase, 1996; Motosaka and
Nagano, 1996) and aftershocks (Pitarka et al., 1996a, 1997), based on different techniques, suggests that the cause of the ground-motion amplification in the damage zone is the ba- sin-edge effect. In these studies, it is argued that the width of the damage zone is controlled by the interference between the basin-edge diffracted waves and the primary S wave. Our purpose is to analyze the extension of this phenomena along the northern part of the basin and demonstrate the implica- tion of the interaction between the basin-edge effect and the source effects in the observed near-fault ground motions by using 3D numerical simulation.
In general, near-source ground motions are controlled primarily by the source radiation and the directivity effects. However, for cases in which the earthquake occurs on a basin margin fault that forms the basin edge, as the Hyogo- ken Nanbu earthquake, the basin-edge effect becomes very important. The Hyogo-ken Nanbu earthquake is a good ex- ample where the interaction of the source directivity and basin-edge effect causes impulsive ground motions with par- ticularly large-amplitude ground velocities. Since other large cities are constructed on basin margins that are fault con- trolled, like Kobe, it is important to understand how the near- fault ground motions from Hyogo-ken Nanbu earthquake were amplified by the basin-edge effect.
Since the pioneering work of Bard and Bouchon (1980a,b) the basin-edge effect has been demonstrated in many 2D and 3D numerical simulations (e.g., Hisada and
428
Three-Dimensional Simulation of the Near-Fault Ground Motion for the 1995 Hyogo-ken Nanbu (Kobe), Japan, Earthquake 429
34'45'
135"00' 135"15' 135"30'
~ 7 Mainshock
• Station
O Area of Intensity VII (JMA-scale) ' ~ '
. . . . . Basin Edge '"
, Fault ."'" 34' 45'
T K T
34-30
Awaj i Is.
0 10 km
135"00' 135"15' 135"30'
Figure 1. Map of Kobe area and station locations. The rectangle shows the location of the basin model used in this study. The dashed line P-P' depicts the profile used tO display the seismic record sections. Also shown are the locations of the heavily dam- aged zone (intensity VII, JMA scale, digitized data from Koketsu, 1997) and fault segments.
34' 30'
Yamamoto, 1996, and references therein). Ground-motion modeling based on 2D techniques has been useful at iden- tifying basin-edge effects (Zahradnik and Hron, 1987; Vi- dale and Helmberger, 1988; Moczo and Bard, 1993; Scriv- her and Helmberger, 1994; Graves, 1995; Hatayama et al., 1995; Pitarka and Irikura, 1996; Kawase, 1996; Pitarka et aL, 1996a,b; Haase et al., 1996). Nevertheless, an accurate quantitative evaluation of the phenomena needs a full 3D approach (e.g., Sanchez-Sesma and Luzon, 1995).
The finite-difference methods have been particularly ef- fective in modeling ground motions by fully integrating the 3D velocity structure with the earthquake rupture on a finite fault (Frankel, 1993; Olsen et al., 1995; Olsen and Archu- leta, 1996; Graves, 1996b; Wald and Graves, 1998). In this study, we apply a similar technique to simulate strong ground motions in the Kobe area from a kinematic model of the fault rupture that generated the Hyogo-ken Nanbu earth- quake.
Our approach is to simulate the near-fault ground-mo- tion amplification pattern at long periods (> 1.25 sec). This period limit was chosen based on computational demands and the source model that is valid only for periods longer than 1 sec. We analyze the effects of the basin structure and the source process by comparing the simulated ground mo- tions with the observed damage distribution and the recorded near-source seismograms. The kinematic earthquake rupture
and the wave propagation are modeled using a 3D staggered- grid finite-difference method (FDM, hereafter).
Geological Structure and Velocity Model of the Region
The area in and around Kobe city is characterized by significant geologic complexity including numerous active faults. In this study, we simulate strong ground motions in a selected region located along the northern edge of the Osaka Basin, which includes the Kobe city area and the fault segments (Fig. 1).
Recent investigations of the subsurface geological struc- ture in the Kobe area, including reflection and refraction profiles, borehole information (Geological Survey of Japan, 1996; Iwata etal., 1996b) and Bouger anomaly analysis (Ko- bayashi et al., 1996), have shown that on a large scale the basin edge beneath Kobe city has uniform horstlike under- ground structure. The basement rocks consist mainly of granite and partly volcanic and sedimentary rocks. They are widely exposed in the surrounding mountainous regions to the north of the city. The shear-wave velocity in the rock is about 3.2 km/sec (Kagawa et al., 1993).
The sedimentary cover overlying the basement rock consists of the Osaka Group, upper Pleistocene, and Holo- cene alluvial deposits (Nakagawa et al., 1996). In the Kobe
430 A. Pitarka, K. Irikura, T. Iwata, and H. Sekiguchi
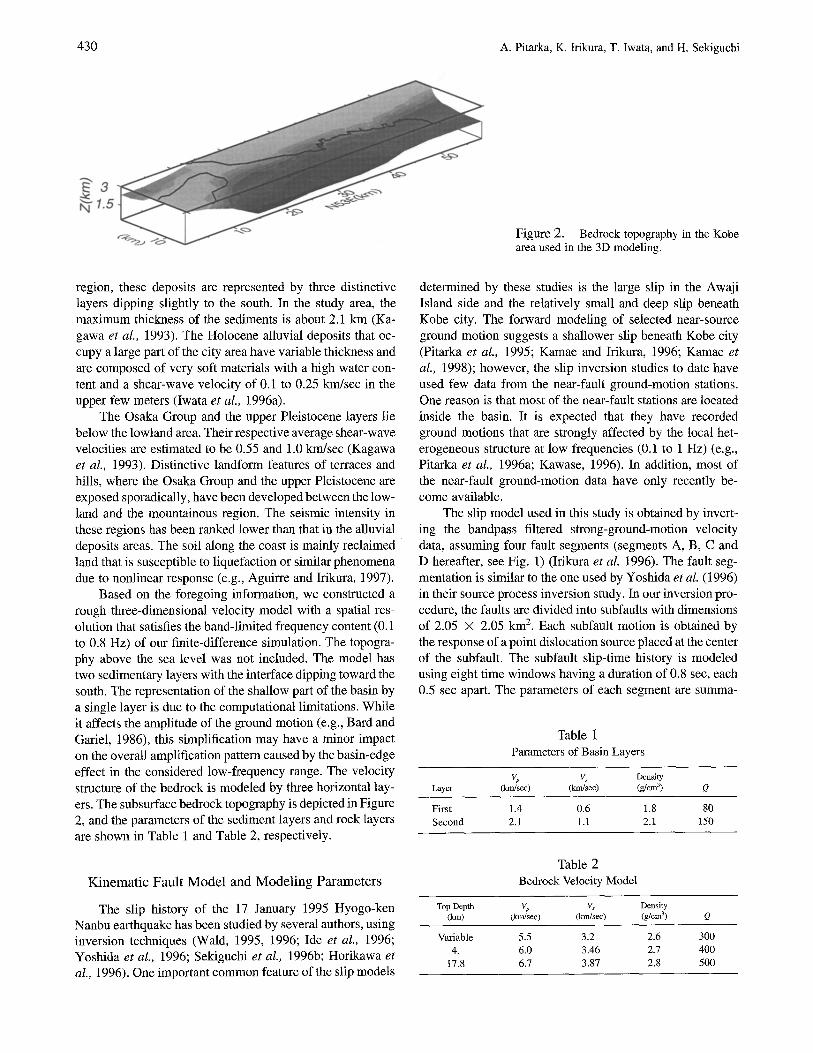
Figure 2. Bedrock topography in the Kobe area used in the 3D modeling.
region, these deposits are represented by three distinctive layers dipping slightly to the south. In the study area, the maximum thickness of the sediments is about 2.1 km (Ka- gawa et al., 1993). The Holocene alluvial deposits that oc- cupy a large part of the city area have variable thickness and are composed of very soft materials with a high water con- tent and a shear-wave velocity of 0.1 to 0.25 km/sec in the upper few meters (Iwata et al., 1996a).
The Osaka Group and the upper Pleistocene layers lie below the lowland area. Their respective average shear-wave velocities are estimated to be 0.55 and 1.0 kin/see (Kagawa et al., 1993). Distinctive landform features of terraces and hills, where the Osaka Group and the upper Pleistocene are exposed sporadically, have been developed between the low- land and the mountainous region. The seismic intensity in these regions has been ranked lower than that in the alluvial deposits areas. The soil along the coast is mainly reclaimed land that is susceptible to liquefaction or similar phenomena due to nonlinear response (e.g., Aguirre and Irikura, 1997).
Based on the foregoing information, we constructed a rough three-dimensional velocity model with a spatial res- olution that satisfies the band-limited frequency content (0.1 to 0.8 Hz) of our finite-difference simulation. The topogra- phy above the sea level was not included. The model has two sedimentary layers with the interface dipping toward the south. The representation of the shallow part of the basin by a single layer is due to the computational limitations. While it affects the amplitude of the ground motion (e.g., Bard and Gariel, 1986), this simplification may have a minor impact on the overall amplification pattern caused by the basin-edge effect in the considered low-frequency range. The velocity structure of the bedrock is modeled by three horizontal lay- ers. The subsurface bedrock topography is depicted in Figure 2, and the parameters of the sediment layers and rock layers are shown in Table 1 and Table 2, respectively.
Kinematic Fault Model and Modeling Parameters
The slip history of the 17 January 1995 Hyogo-ken Nanbu earthquake has been studied by several authors, using inversion techniques (Wald, 1995, 1996; Ide et al., 1996; Yoshida et al., 1996; Sekiguchi et al., 1996b; Horikawa et al., 1996). One important common feature of the slip models
determined by these studies is the large slip in the Awaji Island side and the relatively small and deep slip beneath Kobe city. The forward modeling of selected near-source ground motion suggests a shallower slip beneath Kobe city (Pitarka et al., 1995; Kamae and Irikura, 1996; Kamae et
al., 1998); however, the slip inversion studies to date have used few data from the near-fault ground-motion stations. One reason is that most of the near-fault stations are located inside the basin. It is expected that they have recorded ground motions that are strongly affected by the local het- erogeneous structure at low frequencies (0.1 to 1 Hz) (e.g., Pitarka et al., 1996a; Kawase, 1996). In addition, most of the near-fault ground-motion data have only recently be- come available.
The slip model used in this study is obtained by invert- ing the bandpass filtered strong-ground-motion velocity data, assuming four fault segments (segments A, B, C mad D hereafter, see Fig. 1) (Irikura et al. 1996). The fault seg- mentation is similar to the one used by Yoshida et al. (1996) in their source process inversion study. In our inversion pro- cedure, the faults are divided into subfaults with dimensions of 2.05 × 2.05 km 2. Each subfault motion is obtained by the response of a point dislocation source placed at the center of the subfault. The subfanlt slip-time history is modeled using eight time windows having a duration of 0.8 sec, each 0.5 sec apart. The parameters of each segment are summa-
Table 1 Parameters of Basin Layers
Vp Vs Density Layer (kna/sec) (km/see) (g/cm 3) Q
First 1.4 0.6 1.8 80 Second 2.1 1.1 2.1 150
Table 2 Bedrock Velocity Model
Top Depth Vp V~ Density (kin) (kin/see) (kin/see) (g/cm 3) Q
Variable 5.5 3.2 2.6 300 4. 6.0 3.46 2.7 400
17.8 6.7 3.87 2.8 500
Three-Dimensional Simulation of the Near-Fault Ground Motion for the 1995 Hyogo-ken Nanbu (Kobe), Japan, Earthquake 431
rized in Table 3. The fault is 42.5 km long and 20.5 km down dip. The rupture initiates at a depth of 16.4 km and terminates at a depth of 1.3 km. The slip distribution on the fault is shown in Figure 3. This model shares similar features with the rupture models determined by other investigators from strong-motion data and multiple-fault segment models (e.g., Sekiguchi et al., 1996a,b; Wald, 1995, 1996; Ide et al., 1996; Yoshida et al., 1996). The three asperities that have dominated the source process are located beneath, respec- tively, Akashi Strait, Awaji Island, and Kobe City (see Fig. 3). In this article, we refer to them as the first, second, and third asperities.
For the forward simulation of the ground motion, we retain the complexity of rupture in the slip model obtained by the inversion. We use the same fault segmentation, sub- fault dimensions, slip-time history, and rupture velocity. We have slightly modified the original slip model by reducing the length of segment A (Awaji side) by 4 km on the western edge and segment D by 2 km on the eastern edge where the slip is negligible. These parts of the fault were excluded from the simulation in order to reduce the required computer memory.
The kinematic earthquake rupture with a variable slip velocity is simulated by activating 250 subfaults each having nine point sources mapped onto the predetermined finite- difference (FD) grid. The point source implementation in the FD calculation is done following a procedure similar to that proposed by Graves (1996a). Each point source within a subfault has the same slip-time history that is lagged appro- priately in time to simulate the propagation of the rupture front across each subfault. We use a bell-shaped slip-rate function. Its shape is slightly different from that of the slip-
rate function used in the original inversion. In the FD cal- culations, the bell-shaped function is preferable because of a low content of high frequencies. The differences in the simulated waveforms between the bell-shaped function and the slip-rate function used in the inversion are small in the frequency range discussed here (e.g., Cotton and Campillo, 1994).
The velocity model is discretized with a grid spacing of 0.15 km, and the frequency resolution limit is 0.8 sec. We apply absorbing boundary conditions to reduce the artificial reflection at the boundaries (Stacey, 1988). The 3D-FDM employed in this study solves the stress-velocity equations for elastic wave propagation in a heterogeneous medium. The staggered-grid scheme we use is an extension of the two-dimensional velocity-stress formulation proposed by Levander (1988). Details of the 3D formulations are given by Graves (1996a). The simulation was carried out on Sun Ultra Sparc workstation using approximately 375 Mbytes of computer memory and requiring 43 hours to compute syn- thetics for 2000 time steps.
Simulation Results
We calculated velocity seismograms using the velocity structure and kinematic fault model described in the previous section. All the synthetics are bandpass filtered in the fre- quency range 0.1 to 0.8 Hz to exclude the numerical errors in higher frequencies. We discuss the simulation results in three steps.
In the first step, we analyze the main features of the amplification pattern obtained from the simulated velocity seismograms. Snapshots of the wave field are used to inves-
Figure 3. Cross section of the dislocation model used in this study, viewed from the southeast, showing the total slip vector distri- bution on the four fault segments.
432 A. Pitarka, K. Irikura, T. Iwata, and H. Sekiguchi
tigate the presence of the basin-edge effect. In the second step, we investigate the robustness of the basin-edge effect on ground-motion amplification. This is done by comparing seismic record sections resulting from the three-dimensional basin structure used in this study, and a reference flat-layer structure. Finally, we compare the synthetic and observed ground motions at several near-fault stations. We show that the coupling of the source effects with the basin-edge effects lead to the large-amplitude pulses observed at sites close to the basin edge.
Peak Ampli tude Distribution
The peak velocity distribution of the simulated horizon- tal, fault-normal (N143°E), fault-parallel (N53°E), and ver- tical components of the ground motion are shown in Figure 4. The horizontal component at each time step is the square root of the sum the squares of the horizontal components. Although the simulation indicates large-amplitude ground motions in the Kobe area and in the northern part of the Awaji Island, we concentrate our analysis on ground mo- tions in the Kobe area.
The most important feature that characterizes the sim- ulated peak amplitude distribution is the concentration of the horizontal peak velocities higher than 40 cm/sec within a narrow elongated zone that is located south of the causative fault and offset from the basin edge by about 1 kin. This zone of maximum long-period ground-motion amplification correlates with the damage zone (see Fig. 1) where, as sug- gested by the recorded data, the ground-motion amplitude was large even at low frequencies (>0.4 Hz). The simulated maximum amplification factor from inside to outside the zone is considerable. In general, it reaches the maximum value of about 2.8 in the central part and decays gradually toward the zone boundary. As a consequence of the direc- tivity effects of the strike-slip faulting, the simulated peak amplitude distribution is controlled by the fault-normal mo- tion that dominates over the fault-parallel motion.
To understand the mechanism that causes the concen- tration of the amplification within a limited area, we examine snapshots of the synthetic wave field on the free surface, taken at times between 1 and 12 sec after the origin time. The snapshots are depicted in Figure 5. They show the fault- normal component of the velocity. The rupture propagates radially from the starting point to both segments. The start- ing point is located at the western bottom edge of segment B, coinciding with the hypocenter. At 2 sec into the simu- lation, the rupture is propagating on both segments A and B. At this time, the first and the second asperities are acti- vated. At 3 sec, the S waves generated by the activation of the first asperity appears on the surface. The wave front of S waves radiated from the first asperity contains two dis- tinctive portions. The northern portion propagates in rock with an apparent velocity that is close to the rupture velocity. Therefore, this part of the wave front remains almost per- pendicular to the fault during the rupture propagation, form-
ing a radial curve away from the fault plane. The southern portion, on the other side of the fault, propagates inside the basin.
At 4 sec, the wave front has proceeded into the basin, making an oblique line, as a part of a conical wave. Com- pared to its northern portion, the southern portion has larger amplitude and delays during the propagation because of the low apparent velocity of S waves in the basin sediments. At 5 sec, it divides into two parts. As demonstrated by 2D sim- ulations using velocity models of cross sections normal to the basin boundary (Kawase, 1996; Pitarka et aI., 1997), the fastest wave front represents the direct S wave, and the sec- ond one, the basin-diffracted wave that propagates with a smaller apparent velocity.
The waves diffracted from the basin edge make linear wave fronts and proceed into the basin in a direction almost normal to the basin edge. The wave fronts of the direct S waves and those of the basin-edge-diffracted waves coincide along a narrow zone that is offset from the basin edge. In this zone where the two waves interfere, the amplitude of the ground motion is relatively high. The width of the max- imum amplification zone and its distance from the basin edge depends on the frequency contents of the incident waves, basin-edge geometry, and the velocity contrast be- tween the sediments and the rock (Kawase, 1996). Theoret- ically, the width of the amplification region and its distance from the basin edge increases when the frequency contents of the incident wave decreases.
At 5 sec, a front of waves generated by the third asperity begins to emerge. Again, in later snapshots, the amplification due to the interference of different waves is remarkable in a narrow region close to the basin edge. The basin-diffracted waves are followed by basin reverberations that transform into surface waves as they propagate further into the basin. After 9 sec, the amplitude of the wave fronts becomes smaller due to the geometrical spreading and attenuation in the sediments. The direct wave generated from the first as- perity is followed by multiply reflected waves from the basin structure. Even after 9 sec, the interference of different waves remains effective at amplifying the ground motion in a narrow zone that extends to the east of the Kobe area. Being consistent with damage distribution, this result helps to understand the reasons why the belt of damage extends in the eastern part of the city, away from the fault.
The cause for the eastward extension of the damage has been a subject of several investigations (e.g., Irikura et al., 1996). To explain the large damage around this area, Shi- mamoto (1995) proposed the existence of a small fault seg- ment along the coast line. Although the aftershock distri- bution does not show evidence of such a fault, Yoshida et al. (1996) and Irikura et al. (1996) checked the possibility of its existence by using a five-segment fault model to ana- lyze the rupture process obtained from the inversion of strong-motion waveforms and geodetic data. In both studies, only small and deep slips were obtained on the fifth fault segment. This result implies that even if the proposed fault
Three-Dimensional Simulation of the Near-Fault Ground Motion for the 1995 Hyogo-ken Nanbu (Kobe), Japan, Earthquake 433
10 g v 5
0 0
10 ¸ -g
5
0 0
lO g v 5
0 0
10 g v 5
3 D - F D M a x i m u m Veloc i ty (0 .1-0 .8 H z )
Horizontal
5 10 15 20 25 30 35 40 45 50 55 N58 ° E (km)
Fault Normal
10 15 20 25 30 35 40 45 50 55 N58 a E (kin)
Fault Parallel
10 15 20 25 30 35 40 45 50 55 N58 ° E (km)
Vertical
0 5 t0 15 20 25 30 35 40 45 50 55 N58 o E (kin)
Log lo Velocity (cm/sec) ,.., ;~g~ ~. ....
0.0 0.2 0.4 0.6 0.8 1.0 1.2 1.4 t.6 1,8 2.0
Figure 4. Simulated peak velocity distribution on the surface for different components. The horizontal motion is the mean square root of the fault-normal and fault-parallel components. Note that the particle velocities higher than 40 cm/sec are concentrated along a narrow zone close to the basin edge. The straight lines in each panel indicate the fault segment locations. The diameter of the circles centered at the station locations is proportional to the observed hor- izontal peak velocity.
segment ruptured during the earthquake, it may not have been the main cause of the damage in the eastern part of Kobe city. In the snapshots of our simulation, it is interesting to note that at the easternmost part of the considered area, the two distinct wave fronts generated from the two asperi- ties in segments B and C, respectively, propagate eastward while the third one, generated from the deep slip in segment D, and diffracted at the basin edge, propagates southward (T = 8 sec and T = 9 sec). The interference of these three wave fronts causes the extension of the amplification zone
farther to the east and away from the fourth segment of the fault.
Another way to explain the extension of the damage to the east is to analyze the contribution from each fault seg- ment to the amplification pattern predicted by our modeling. We calculated the ground motion from the four segments separately. The result in terms of horizontal peak amplitude is shown in Figure 6. In the Kobe area, the contribution to the ground motion from segment A is not significant. The amplification pattern indicates that the first asperity (segment B) gives the largest contribution to the seismic energy in the Kobe area. The ground-motion amplification caused mostly by the basin-edge and the source directivity effects is visible along the edge of the basin. Notably, it extends for about 30 km to the east of the fault. The amplification pattern seen in Figure 6, second panel, shows that the effect of the basin edge diminishes to the east of the fault segment where the incidence of the direct waves becomes oblique.
As opposed to segment B, the contribution from seg- ment C is concentrated in a limited area of the basin, close to the fault. This is probably due to the fact that the asperity in this segment is small and relatively deep. Visibly, the ground motion generated from segment D is largely ampli- fied by the basin edge in the eastern part of the basin. To- gether with the ground motion generated from segment B, which is affected by the basin edge, they dominate the am- plification pattern in eastern Kobe. These analyses indicate that the extension of the belt of damage in the eastern part of Kobe city is caused by the basin-edge and source direc- tivity effects.
Coupling of Basin-Edge Effect with the Source Effect
After finding evidence of the basin-edge effect, it is in- structive to further discuss its coupling with the source effect and implication in the simulated ground-motion amplifica- tion pattern in Kobe area.
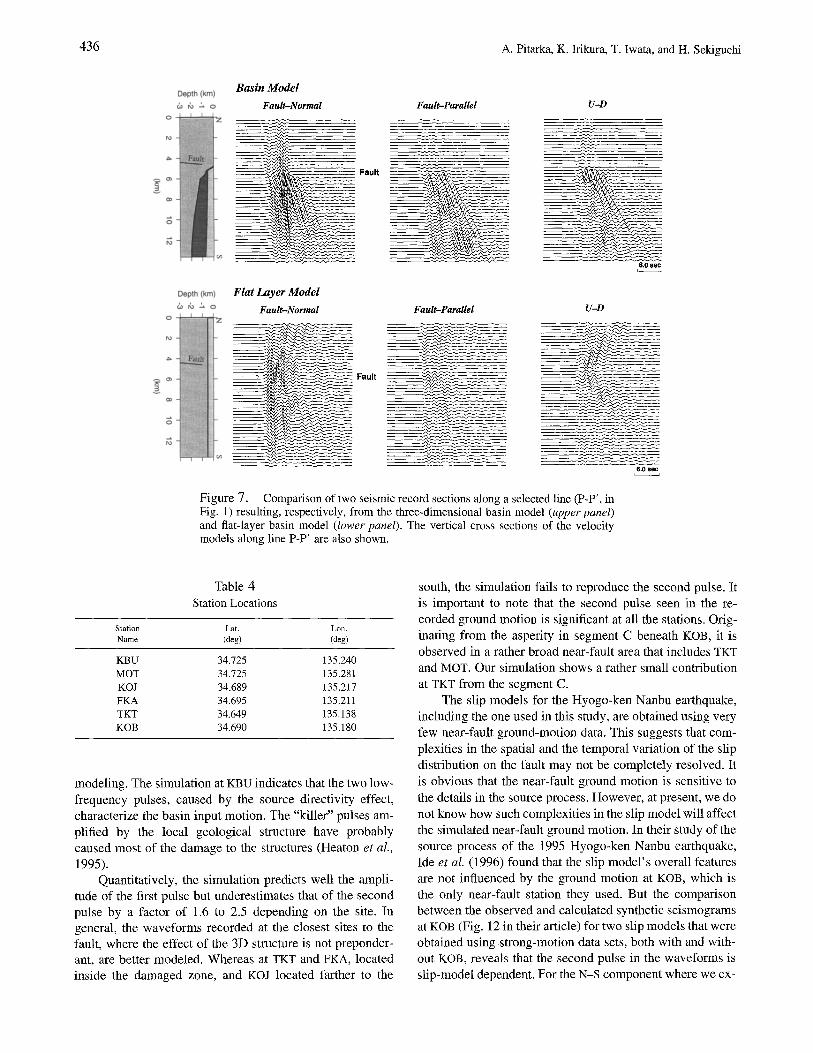
In Figure 7, we compare seismic record sections result- ing from two simulations using, respectively, a reference flat-layer model (see Table 1) and one including the actual three-dimensional basin structure. The record section is located along line P-P' shown in Figure 1. We refer to them as the reference-record section and the basin-record section. The cross section of the three-dimensional structure along the profile is also shown. The profile is 13.6 kin, trending approximately north-south, and the receivers are spaced by 300 m. The flat-layer basin model corresponds to the one- dimensional velocity profile taken from the three-dimen- sional FD velocity model beneath a site located on line P- P', 1 km away from the basin edge.
The waveforms in the reference record section are di- rectly related to the source process and are only affected by ID resonance. The rupture directivity effect in the first and third asperities (segments B and C) creates two pulses having the largest amplitude in the fault-normal component. The
434 A, Pitarka, K. Irikura, T. Iwata, and H. Sekigucbi
Figure 5. Snapshots depicting the absolute value of the particle velocity fault-nor- mal component (N143°E), from 1 to 12 sec after the origin time of the rupture.
(era~see)
70 60 50 40 30 20 10 0
-10 -20 "30 -40 -50 -60 -70
ground motion is fairly simple and is symmetrical on the two sides of the fault, which is expected for the predomi- nantly strike-slip fault mechanism. The amplitude of the sec- ond pulse decays rapidly at receivers toward the south as the source directivity effect decreases.
In contrast, the waveforms in the basin record section are much more complex. Based on the analysis in the pre- vious section (see Fig. 6), the amplification due to the basin- edge effect is expected to be stronger for the second pulse
(segment C) than the first pulse (segment B) at receivers close to the basin edge. The comparison between the basin- record section and the reference-record section shows that at these receivers the amplification due to the basin-edge effect is a factor of 1.6 for the first pulse in the fault-parallel component and about 2.8 for the second pulse in both hor- izontal components. As shown in the next section, such dif- ferences in the peak amplitude between the two pulses can be seen in the observed ground motion.
Three-Dimensional Simulation of the Near-Fault Ground Motion for the 1995 Hyogo-ken Nanbu (Kobe ), Japan, Earthquake 435
10
5
0 0
10-
5 -
0 - 0
I0 g v 5
0-~ 0
10 g
5
3 D - F D Maximum Velocity (0.1-0.8 Hz)
Segment A
5 10 15 20 25 30 35 40 45 50 55 N58 ° E (km)
Segment B
5 10 15 20 25 30 35 N58°E(km)
5 10 15 20 25 30 35 N5~ E(km)
40 45 50 55
Segment C
!1!i 40 45 50 55
Segment D
0 5 10 t5 20 25 30 35 40 45 50 55 N58 ° E (km)
Loglo Velocity (cm/sec)
-0.2 0.0 0.2 0.4 0.6 0.8 1.0 1.2 1.4 1.6 1.8 2.0
Figure 6. Horizontal peak velocity distribution calculated for each of the four fault segments indi- cated by a straight line. Note the large contribution to the ground motion in the Kobe area from the fault segment B.
As demonstrated by Kawase (1996) and Pitarka et al. (1997), the amplification is caused by the constructive in- terference between the horizontally propagating basin-edge- diffracted wave with the primary S wave, coming from the bottom of the basin. Our simulation suggests that this vari- able amplification is caused by the variable effectiveness of the three-dimensional structure at amplifying waves coming from different directions (the third asperity that generated the second phase is located immediately beneath the area considered). It might also be a consequence of the construc- tive interference of the waves originated by the third asperity with the multiple reflections of the waves generated from the first asperity.
The coupling of the basin-edge and source directivity effects characterized by the two large pulses in the wave-
forms is prominent in a relatively narrow zone offset from the basin edge by less than 1 km. It diminishes noticeably at sites to the south where both the basin-edge and source directivity effects are much less significant.
Compar ison of the Observed and Simulated Near-Faul t Ground Motion
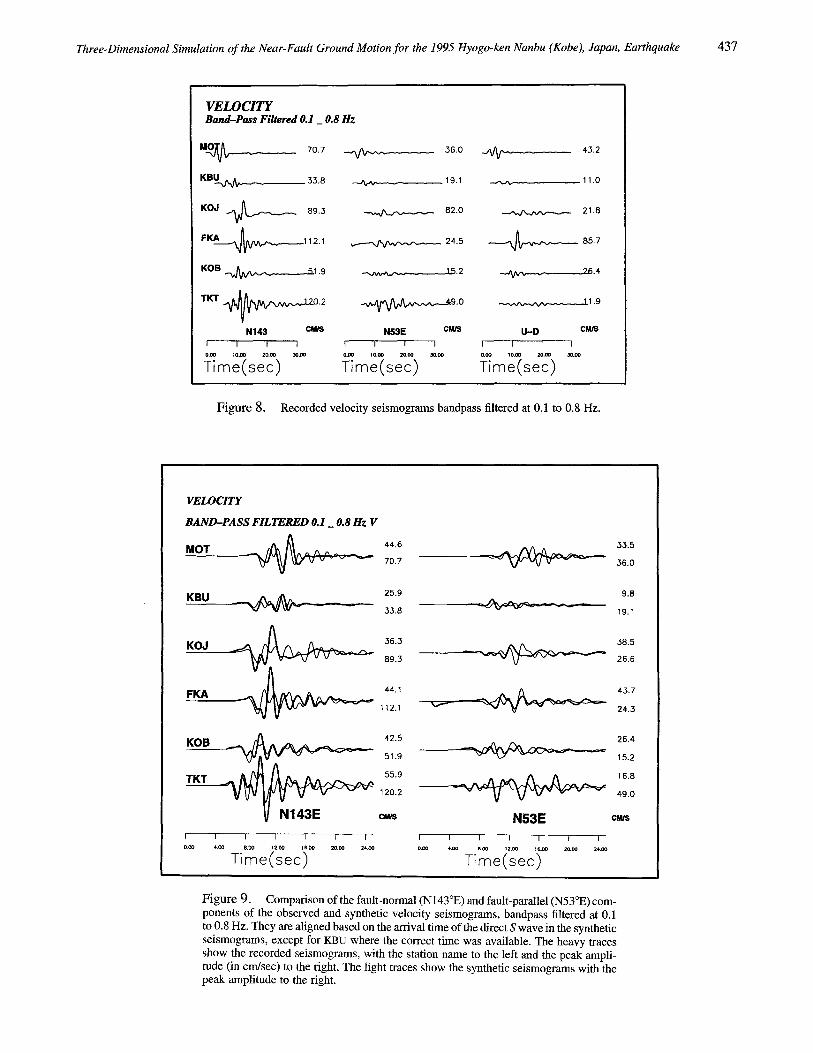
The Hyogo-ken Nanbu earthquake is unique in that it occurred on a basin-edge fault and was also recorded at near- fault sites. Most of the stations that recorded the near-fault ground motions are located in the basin. Because these sites are affected by the basin response in a broad frequency range, they are not used in the inversions of the ground mo- tion for the source process. We simulated the ground motion recorded at six near-fault sites in the Kobe area (Table 4). The station locations are shown in Figure 1, and the recorded velocity seismograms ban@ass filtered (0.1 to 0.8 Hz) are shown in Figure 8. Two sites (TKT and FKA) are located inside the damaged zone where the ground motion is dom- inated by the direct shear waves and basin-edge-diffracted waves. KBU is a weathered rock site, a few hundred meters north of the intersection of the basin bounding fault plane with the Earth's surface. The ground motion at this site is characterized by two distinctive long-period pulses created by the rupture directivity effect. The other sites are on sed- iments along the basin margin. The main characteristic of the recorded ground motion is the existence of two distinc- tive long-period pulses, with the second one being much larger at the basin sites.
The small number of stations located inside or close to the heavily damaged zone and their spatial aperture make it difficult to delineate the spatial distribution of the ground motions from the mainshock in that zone. Nevertheless, we can use them to check the simulated ground motions and to validate our conclusions about the factors that caused the amplification of the ground motion within the narrow zone.
The comparison of the fault-parallel and fault-normal components of the observed and synthetic ground velocity is shown in Figure 9. Both the synthetic and recorded wave- forms are filtered at 0.1 to 0.8 Hz. They are aligned based on the arrival time of the direct S wave in the synthetic seismograms, except for KBU where the absolute time was available.
Qualitatively, the simulation agrees with the observa- tion except for TKT. The fault-normal component in the simulation reproduces the two observed long-period pulses generated by the forward rupture directivity in the two main asperities and amplified by the constructive interference of waves. The similarity between the synthetic and the recorded waveforms at the rock site, KBU, suggests that the model of rupture process obtained by the inversion is adequately rep- resented in the simulation. The small difference in the main phases between the synthetic and the observed waveforms at this station may be due to the differences in the shallow part of the rock models used in the inversion and the 3D
436 A. Pitarka, K. Irikura, T. Iwata, and H. Sekiguchi
to
g 0o
o
r~
4=.
g co
3
Depth (km) Basin Model
Fault-Normal Fault-Parallel U-D
Depth (km)
& rb '.X o
Flat Layer Model
Fault-Normal
Fault
F a u l t
Fault-Parallel
6,0 sec
U-D
6.0 seo
Figure 7. Comparison of two seismic record sections along a selected line (P-P', in Fig. 1) resulting, respectively, from the three-dimensional basin model (upper panel) and flat-layer basin model (lower panel). The vertical cross sections of the velocity models along line P-P' are also shown.
modeling. The simulation at KBU indicates that the two low- frequency pulses, caused by the source directivity effect, characterize the basin input motion. The "killer" pulses am- plified by the local geological structure have probably caused most of the damage to the structures (Heaton et al., 1995).
Quantitatively, the simulation predicts well the ampli- tude of the first pulse but underestimates that of the second pulse by a factor of 1.6 to 2.5 depending on the site. In general, the waveforms recorded at the closest sites to the fault, where the effect of the 3D structure is not preponder- ant, are better modeled. Whereas at TKT and FKA, located inside the damaged zone, and KOJ located farther to the
south, the simulation fails to reproduce the second pulse. It is important to note that the second pulse seen in the re- corded ground motion is significant at all the stations. Orig- inating from the asperity in segment C beneath KOB, it is observed in a rather broad near-fault area that includes TKT and MOT. Our simulation shows a rather small contribution at TKT from the segment C.
The slip models for the Hyogo-ken Nanbu earthquake, including the one used in this study, are obtained using very few near-fault ground-motion data. This suggests that com- plexities in the spatial and the temporal variation of the slip distribution on the fault may not be completely resolved. It is obvious that the near-fault ground motion is sensitive to the details in the source process. However, at present, we do not know how such complexities in the slip model will affect the simulated near-fault ground motion. In their study of the source process of the 1995 Hyogo-ken Nanbu earthquake, Ide et al. (1996) found that the slip model's overall features are not influenced by the ground motion at KOB, which is the only near-fault station they used. But the comparison between the observed and calculated synthetic seismograms at KOB (Fig. 12 in their article) for two slip models that were obtained using strong-motion data sets, both with and with- out KOB, reveals that the second pulse in the waveforms is slip-model dependent. For the N-S component where we ex-
Three-Dimensional Simulation of the Near-Fault Ground Motion for the 1995 Hyogo-ken Nanbu ( Kobe), Japan, Earthquake 437
VELOCITY Band-Pass Filtered 0.1 _ 0.8 Hz
U ~ 70.7 ~ ~ ,36.0
K B . ~ , N . . ~ 33.8 ~ 19.1
KOJ . . ~ . . , . . ~ 89.3 ~ 82.0
F 1 ~ ~ 1 1 2 . 1 ~ 24.5
KOB ~ 51.9 ~ 15,2
N143 CM/S N53E CM/S I I I I I I I I
0.00 10.00 20,0o 30.00 o.0O tO.00 20.00 30.00
Time(sec) Time(sec)
43.2
11.0
21.8
. ~ ~ 85.7
..,.,,aVv.v.....,~ 9R.4
~ _ !1.9
U--D C~US 1 I I I
o.00 10.0o 20.oo ~0.oo
Time(sec)
Figure 8. Recorded velocity seismograms bandpass filtered at 0.1 to 0.8 Hz.
VELOCITY
BAND--PASS FILTERED 0.1 _0.8 Hz V
MOT . ~ ~ ¢ : ~ 44.6
70.7
KBU ~ 25.9 33.8
KOJ ~ 36.3 89.3
FKA 44.1 112.1
KOB
TKT
I
0.00
42.5 51.9 55.9
120.2
CM/S
I I I I I I I
4.0O &O0 12.00 lS.O0 20.00 24.00 0.00
Time(sec)
33.5
- ~ - ~ ~ 36.0
9.8 19.1
26.4 ~ ~ 15.2
~ ~ 16.8 49,0
N53E c ~
I I I I 1 I 4.tin e.oo 12.00 le.co 20.t~ 24.00
Time(sec)
Figure 9. Comparison of the fault-normal (N143°E) and fault-parallel (N53°E) com- ponents of the observed and synthetic velocity seismograms, bandpass filtered at 0.1 to 0.8 Hz. They are aligned based on the arrival time of the direct S wave in the synthetic seismograms, except for KBU where the correct time was available. The heavy traces show the recorded seismograms, with the station name to the left and the peak ampli- tude (in cm/sec) to the right. The light traces show the synthetic seismograms with the peak amplitude to the right.
38.5 26,6
~ ~ =~l~:~=,~ 4..3.7 "v""- 24,5
438 A. Pitarka, K. lrikura, T. Iwata, and H. Sekiguchi
pect much of the directivity effect from the asperity imme- diately below the station, the peak amplitude of the second pulse in their second model is about 2.8 time smaller than in their first model. This result suggests that even small changes in the slip models may substantially affect the near- fault ground motion. Considering the mismatch in the am- plitude between the observed and the simulated second pulse, and our analysis of the simulated ground motion from each fault segment, we concluded that the rupture process in the fault-segment C is not well resolved. As shown by simulations using the empirical Green's function method (Kamae et aL, 1998), shallower slip in fault segment C im- proves the waveform fit at sites considered in this study.
The success of simulating the near-fault ground motion at stations that are located close to the basin edge depends also on the quality of the velocity structure. The 3D model we use represents the underground bedrock topography well, while it assumes a simple two-layer structure for the basin sediments. We showed that the extension of the damage zone for a distance of about 30 km can be explained by the effect of the deep basin-edge structure. Our approximation to the shallow part of the basin structure consists of slightly re- ducing the velocity gradient in the surface sediments, re- suiting in a higher shear-wave velocity at the surface. Based on the comparison between the synthetic and observed ground motion at TKT and KOJ, it appears that the simpli- fications in the structure of the shallow sedimentary layers reduces the amplitude of the basin-induced surface waves. Analysis and modeling of aftershock ground motions are necessary in order to understand the effect of the soft-surface sediments on the amplification of the ground motion and its dependence on the direction of the incident wave in the Kobe region.
Conclusions
Our simulation of the ground motions from the 17 Jan- uary 1995 Hyogo-ken Nanbu earthquake, based on a kine- matic fault model and a simplified 3D velocity structure, suggests the basin-edge effect as an important factor that influenced the ground-motion amplification pattern in the Kobe area. It also indicates that the ground motions recorded at near-fault stations were strongly affected by the basin structure.
The fault-normal ground motions with high-amplitude long-period pulses, observed in a narrow zone offset less than 1 km from the basin edge, were caused by the coupling of source and basin-edge effects, and such effects were re- sponsible for the eastward extension of the damage zone. Similar basin-edge effects led to amplified ground motions and associated damage in the Santa Monica area during the 1994 Northridge earthquake (Graves et al., 1997). However, unlike the case of Kobe, the Northridge event ruptured northward away from the basin edge, thus minimizing the contribution from source directivity effects. Nonetheless, the
potential for other Kobe-like scenarios still exists for many fault-bounded basin structures throughout the world.
Our study is a first attempt to simulate 3D near-fault ground motion from a basin-margin fault based on the ki- nematic earthquake rupture model. We have pointed out the difficulties we face to match the simulated with the observed ground-motion peak amplitude that relate with the fact that the near-fault ground motion in the basin sediments is very sensitive to the details of the source process and the basin- edge structure as well.
Our simulation demonstrates that even moderate size (M < 7.0) earthquakes can cause near-fault ground motions with extremely large amplitudes, when generated by basin margin faults.
Acknowledgments
We thank D. Wald and R. Graves for helpful discussions and the review of the manuscript. We benefited from discussions with H. Kawase, J. Zah- radnik, and T. Kagawa. Two anonymous reviewers provided comments that significantly improved the article. This study was partially supported by a Grant-In-Aide for Scientific Research, Number 08248111, from the Min- istry of Education, Science, Sports, and Culture, Japan.
References
Aguirre, J. and K. Irikura (1997). Nonlinearity, liquefaction, and velocity variation of soft soil layers in Port Island, Kobe, during Hyogo-ken Nanbu earthquake, Bull Seism. Soe. Am. 87, 1244-1258.
Architectural Institute of Japan (MJ) (1995). Preliminary reconnaissance report of the 1995 Hyogoken-Nanbu earthquake, English edition, Ar- chitectural Institute of Japan, Tokyo, Japan.
Bard, P.-Y. and M. Bouchon (1980a). The seismic response of sediment- filled valleys. Part 1. The case of incident SH waves, Bull. Seism. Soc. Am. 70, 1263-1286.
Bard, P.-Y. and M. Bouchon (1980b). The seismic response of the sedi- ment-filled valleys. Part 2. The case of incident P-SV waves, Bull Seism. Soe. Am. 70, 1921-1941.
Bard, P.-Y. and J.-C. Gariel (1986). The seismic response of two-dimen- sional sedimentary deposits with large vertical velocity gradients, BulL Seism. Soc. Am. 76, 343-346.
Cotton, F. and M. Campillo (1994). Application of seismogram synthesis to the study of earthquake source from strong motion records, Ann. Geof. XXXVII, no. 6, 1539-1564.
Frankel, A. (1993). Three-dimensional simulation of ground motions in the San Bernardino valley, California, for hypothetical earthquakes on the San Andreas fault, Bull. Seism. Soc. Am. 83, 1042-1063.
Geological Survey of Japan (1996). Reports on surveys of active fault in 1995, 85 pp. (in Japanese).
Graves, R. W. (1995). Preliminary analysis of long-period basin response in the Los Angeles region from the 1994 Northridge earthquake, Geo- phys. Res. Lett. 22, 101-104.
Graves, R. W. (1996a). Simulating seismic wave propagation in 3D elastic media using staggered-grid finite-differences, Bull Seism. Soc. Am.
86, 1091-1106. Graves, R. W. (1996b). Simulating realistic earthquake ground motions in
regions of deep sedimentary basins, Proc. of the l l th World Confer- ence on Earthquake Engineering, Acapulco.
Graves, R. W., A. Pitarka, and P. Somerville (1997). Effects of basin struc- ture on long period strong ground motion during the 1994 Northridge earthquake (abstract), EOS 78, F430.
Haase, J. S., E. Hauksson, V. Vernon, and A. Edelman (1996). Modeling of ground motion from a 1994 Northridge aftershock using a tomo-
Three-Dimensional Simulation o f the Near-Fault Ground Motion for the 1995 Hyogo-ken Nanbu (Kobe), Japan, Earthquake 439
graphic velocity model of the Los Angeles basin, Bull Seism. Soc. Am. 86, S156-S167.
Hatayama, K., K. Matsunami, T. Iwata, and K. Irikura (1995). Basin-in- duced Love waves in the eastern part of the Osaka basin, J. Phys. Earth 43, 131-155.
Heaton, T. H., J. F. Hall, D. J. Wald, and M. W. Hailing (1995). Response of high-rise and base-isolated buildings to a hypothetical Mw 7.0 blind thrust earthquake, Science 267, 201-211.
Hisada, Y. and S. Yamamoto (1996). One-, two-, and three-dimensional site effects in sediment-filled basins, Proc. of the 11th World Confer- ence on Earthquake Engineering, Acapulco, Mexico.
Horikawa, H., K. Hirahara, Y. Umeda, M. Hashimoto, and F. Kusano (1996). Simultaneous inversion of geodetic and strong motion data for the source process of the Hyogo-ken Nanbu, Japan, earthquake, J. Phys. Earth 44, 455-471.
Ide, S., M. Takeo, and Y. Yoshida (1996). Source process of the 1995 Kobe earthquake: determination of spatio-temporal slip distribution by bay- esian modeling, Bull. Seism. Soc. Am. 86, 547-566.
Irikura, K. (1995). Causative faults, strong ground motions and damages from the 1995 Hyogo-ken Nanbu earthquake, Butsuri-Tansa (Geo- phys. Exploration), 47, 463-489 (in Japanese with English abstract).
lrikura, K., T. Iwata, H. Sekiguchi, A. Pitarka, and K. Kamae (1996). Les- son from the 1995 Hyogo-ken Nanbu earthquake: why were such destructive motions generated to the buildings? J. Natural Dis. Sci. 17, 99-127.
Iwata, T., K. Hatayama, H. Kawase, and K. Irikura (1996a). Site amplifi- cation of ground motions during aftershocks of the 1995 Hyogo-ken- nanbu earthquake in severely damaged zone--array observation of ground motions at Higashinada Ward, Kobe city, Japan, J. Phys. Earth 44, 553-561.
Iwata, T., K. Irikura, K. Told, T. Sasatani, K. Kudo, K. Seo, and T. Yokoi (1996b). Seismic exploration in and around Kobe city, Reports on analysis and verification of Hanshin-Awaji great disaster, granted from the Japanese Ministry of Education, Science and Culture (No. 07300005), Chap. 2, 21-49 (in Japanese).
Kagawa, T., S. Sawada, Y. Iwasaki, and A. Nanso (1993). Modeling of deep sedimentary basin structure beneath the Osaka basin, Proc. 22th JSCE Earthquake Symposium, 199-202 (in Japanese).
Kamae, K. and K. Irikura (1996). A fault rupture model of the 1995 Hy- ogoken-nanbu earthquake (Mjma = 7.2) estimated by empirical Green's function method, J. Natural Dis. Sci. 16, 31-40.
Kamae, K., K./rikura, and A. Pitarka (1998). A technique for simulating strong ground motion using hybrid Green's function, Bull Seism. Soc. Am. 88, 357-367.
Kawase, H. (1996). The cause of the damage belt in Kobe. "The basin- edge effect," constructive interference of the direct S wave with the basin-induced diffracted/Rayleigh waves, Seism. Res. Lett. 67, 25-35.
Kobayashi, S., S. Yoshida, S. Okubo, R. Shichi, T. Shimamoto, and T. Kato (1996). Two-dimensional analysis of gravity anomaly across the Rokko fault system, J. Phys. Earth 44, 357-372.
Koketsu, K. (1998). An overview of the rupture process, Report on the Hanshin-Awaji Earthquake Disaster, Common Series, Vol. 2, Ma- ruzen, Tokyo (in press).
Levander, A. R. (1988). Fourth-order finite-difference P-SV seismograms, Geophysics 53, 1425-1436.
Moczo, P. and P.-Y. Bard (1993). Wave diffraction, amplification and dif- ferential motion near strong lateral discontinuities, Bull Seism. Soc. Am. 83, 85-106.
Motosaka, M. and M. Nagano (1996). Analysis of ground-motion ampli- fication characteristics in Kobe city considering a deep irregular un- derground structure--interpretation of heavily damaged belt zone during the 1995 Hyogo-ken Nanbu earthquake, J. Phys. Earth 44, 577-590.
Nakagawa, K., K. Shiono, N. Inoue, and M. Sano (1996). Geological char- acteristics and problems in and around Osaka basin as a basis for assessment of seismic hazards, Soils Foundations Jan., 15-28.
Nakashima, M., T. Fujiwara, Y. Suzuki, M. Brnnean, S. Iwai, and A. Ki-
tahara (1995). Damage to engineering building from the 1995 Hy- ogoken-nanbu earthquake, J. Natural Dis. Sci. 16, no. 2, 71-78.
Olsen, K. B. and R. J. Archuleta (1996). Three-dimensional simulation of earthquakes on the Los Angeles fault system, Bull Seism. Soc. Am. 86, 575-596.
Olsen, K. B., R. J. Archuleta, and J. R. Matarese (1995). Three-dimensional simulation of a magnitude 7.75 earthquake on the San Andreas fault, Science 270, 1628-1632.
Pitarka, A. and K. Irikura (1996). Basin structure effects on long period strong motions in the San Fernando valley and the Los Angeles Basin from the 1994 Northridge earthquake and an aftershock. Bull. Seism. Soc. Am. 86, S126-S137.
Pitarka, A., K. Irikura, and T. Kagawa (1995). Source complexity of the January 17, 1995 Hyogoken-nanbu earthquake determined by near- field strong motion modeling: preliminary results, J. Natural Dis. Sci. 16, no. 2, 31-37.
Pitarka, A., K. Irikura, T. Iwata, and T. Kagawa (1996a). Basin structure effects in the Kobe area inferred from the modeling of ground motions from two aftershocks of the January 17, 1995 Hyogoken-nanbu earth- quake, J. Phys. Earth 44, 563-576.
Pitarka, A., D. Suetsugu, and H. Takenaka (1996b). Elastic finite-difference modeling of strong motion in Ashigara Valley for the 1990 Odawara, Japan, earthquake, Bull. Seism. Soc. Am. 86, 981-990.
Pitarka, A., K. Irikura, and T. Iwata (1997). Modelling of ground motion in the Higashinada (Kobe) area for an aftershock of the 1995 January 17 Hyogo-ken nanbu, Japan earthquake, Geophys. J. Int. 131, 231- 239.
Sanchez-Sesma, F. J. and F. Luzon (1995). Seismic response of three-di- mensional valleys for incident P, S and Rayleigh waves, Bull. Seism. Soc. Am. 85, 269-284.
Scrivner, C. W. and D. V. Helmberger (1994). Seismic waveform modeling in the Los Angeles Basin, Bull Seism. Soc. Am. 84, 1310-1326.
Seldguchi, H., K. Irikura, T. Iwata, Y. Kakehi, and M. Hoshiba (1996a). Determination of the location of faulting beneath Kobe during the 1995 Hyogo-ken Nanbu, Japan, earthquake from near-source particle motion, Geophys. Res. Lett. 23, 387-390.
Sekiguchi, H., K. Irikura, T. Iwata, Y. Kakehi, and M. Hoshiba (1996b). Minute locating of fault planes and source process of the 1995 Hy- ogoken-nanbu, earthquake from the waveform inversion of strong ground motion, J. Phys. Earth 44, 473-487.
Shimamoto, T. (1995). Earthquake disasters in Kobe and presumed earth- quake-generating faults, Kagaku 65, 195-198 (in Japanese).
Stacey, R. (1988). Improved transparent boundary formulations for the elastic-wave equation, Bull Seism. Soc. Am. 78, 2089-2097.
Suzuki, Y., T. Fujiwara, M. Nakashima, M. Brineau, S. Iwai, and A. Ki- tahara (1995). Overview of building damage and damage to wood houses from the 1995 Hyogoken-nanbu earthquake, J. Natural Dis. Sci. 16, no. 2, 79-88.
Toki, K. Irikura, and T. Kagawa (1995). Strong motion data recorded in the source area of the 1995. Hyogoken-nanbu earthquake, January 17, 1995 Japan, J. Natural Dis. ScL 16, no. 2, 23-30.
Vidale, J. E. and D. V. Helmberger (1988). Elastic finite-difference mod- eling of the 1971 San Fernando, California earthquake, Bull Seism. Soc. Am. 78, 122-141.
Wald, D. J. (1995). A preliminary dislocation model for the 1995 Kobe (Hyogo-ken Nanbu), Japan, earthquake determined from strong mo- tion and teleseismic waveforms, Seism. Res. Lett. 66, 22-28.
Wald, D. J. (1996). Slip history of the 1995 Kobe, Japan, earthquake de- termined from strong motion, teleseismic and geodetic data, J. Phys. Earth 44, 489-503.
Wald, D. J. and R. W. Graves (1998). The seismic response of the Los Angeles Basin, California, Bull. Seism. Soc. Am. 88, 337-356.
Yoshida, S., K. Koketsu, B. Shibazaki, T. Sagiya, T. Kato, and Y. Yoshida (1996). Joint inversion of near- and far-field waveforms and geodetic data for the rupture process of the 1995 Kobe earthquake, J. Phys. Earth 44, 437-454.
440 A. Pitarka, K. Irikura, T. Iwata, and H. Sekiguchi
Zahradnik, J. and F. Hron (1987). Seismic ground motion of sedimentary valleys: example La Molina, Lima, Peru, J. Geophys. 62, 31-37.
Woodward-Clyde Federal Services 566 E1 Dorado Street Pasadena, California 91101 [email protected]
(A.P.)
D.P.R.I. Kyoto University Gokasho, Uji, 611, Japan Tel/Fax: +81-774-33-5866


![[Elearnica.ir]-CompaComparing_response_of_SDF_systems_to_near_fault_and_far_fault_earthquakering Response of SDF Systems to Near Fault and Far Fault Earthquake Mo](https://static.documents.pub/doc/80x56/577cc0681a28aba7118ffee3/elearnicair-compacomparingresponseofsdfsystemstonearfaultandfarfaultearthquakering.jpg)


