Biophysical Journal Volume 72 February 1997 533-544 Three-Dimensional Structure of the Gap Junction Connexon Guy Perkins,* Dan Goodenough,# and Gina Sosinsky*§ Departments of *Neurosciences and §Biology, University of California, San Diego, La Jolla, California 92093-0322, and #Department of Cell Biology, Harvard Medical School, Boston, Massachusetts 02115 USA ABSTRACT The gap junction membrane channel is composed of macular aggregations of intercellular channels permitting the direct intercellular transfer of ions and small molecules. Each intercellular channel is formed by the apposition of two hexameric transmembrane channels (connexons), one from each cell. The interlocking of the two channels occurs extracel- lularly in a narrow 3.5-nm "gap" separating the junctional membranes. The channel-channel interaction is known to be selective between members of the family of proteins, called connexins, which oligomerize into the connexons. In addition to selectivity, the molecular interfaces involved in the extracellular interactions between connexons must be very congruent, since the intercellular channel must provide high resistances to the leakage of small ions between the channel lumen and the extracellular space. By using a recently developed biochemical procedure for obtaining ordered arrays of connexons from gap junctions split in the extracellular gap, (Ghoshroy, S., D. A. Goodenough, and G. E. Sosinsky. 1995. Preparation, characterization, and structure of half gap junctional layers split with urea and EGTA. J. Membr. Biol. 146:15-28) a three-dimensional reconstruction of a connexon has been obtained by electron crystallographic methods. This reconstruction emphasizes the structural asymmetry between the extracellular and cytoplasmic domains and assigns lobed structural features to the extracellular domains of the connexon. The implication of our hemichannel structure is discussed in relation to the in vivo state of unpaired connexons, which have been shown to exist in the plasma membrane. INTRODUCTION Intercellular communication through gap junction channels has functional roles in cell survival, differentiation, metab- olism, morphogenesis, and mutagenesis (Bennett et al., 1991; Dermietzel et al., 1990; Fraser et al., 1987; Gilula et al., 1972; Goodenough et al., 1996; Hooper and Subak- Sharpe, 1981; Revel et al., 1985). Gap junctions are spe- cialized cell-cell contact regions that contain tens to thou- sands of intercellular channels that link two apposed cells. These channels facilitate a form of intercellular communi- cation by permitting the regulated passage of ions and small molecules from one cell to another (Bennett and Goode- nough, 1978). Gap junction intercellular channels are composed of two paired transmembrane protein oligomers (connexons), one from each juxtaposed membrane. Each connexon contains six homomeric or heteromeric subunits made from members of a multigene family of homologous proteins called con- nexins (Beyer et al., 1990; Jiang and Goodenough, 1996; Makowski et al., 1977; Sosinsky, 1995; Stauffer, 1995). The channel-channel interaction is known to be selective be- tween connexins. In addition to selectivity, the molecular interfaces involved in the extracellular interactions between connexons must be congruent, since the intercellular channel must provide high resistances to the leakage of small ions between the channel lumen and the extracellular space. The connexin proteins are designated by the abbreviation Cx fol- Received for publication 28 May 1996 and in final form 16 October 1996. Address reprint requests to Dr. Guy Perkins, NCMIR, University of Cal- ifornia, San Diego, La Jolla, CA 92093-0608. Tel.: 619-534-7968; Fax: 619-534-7497; E-mail: [email protected]. C 1997 by the Biophysical Society 0006-3495/97/02/533/12 $2.00 lowed by the molecular mass in kilodaltons, e.g., rat Cx32 is the predominant connexin found in rat liver connexons. Proteolysis and antibody binding experiments indicate that the family of connexins have a common folding topol- ogy with the peptide chain traversing the membrane four times (Beyer et al., 1987; Goodenough et al., 1988; Hertzberg et al., 1988; Milks et al., 1988; Nicholson et al., 1985; Yancy et al., 1989; Zhang and Nicholson, 1989; Zimmer et al., 1987). The N- and C-termini are located on the cytoplasmic side of the junctional membrane, while the extracellular (or "gap") side of the membrane contains two loops, called El and E2. Comparisons of the amino acid sequences of known connexins have shown that while the amino terminus, the four membrane spanning domains, and the two extracellular loops are relatively conserved, the remainder of the cytoplasmic domains are highly variable. (White et al., 1995). Several lines of evidence imply that the connexon struc- ture at the cytoplasmic surface is disordered (Sosinsky, 1992). The cytoplasmic structure has not been adequately visualized in either the three-dimensional reconstructions from electron microscopy (Sikerwar et al., 1991; Sikerwar and Unwin, 1988; Unwin and Ennis, 1984; Unwin and Zampighi, 1980) or in x-ray diffraction analyses (Makowski et al., 1984; Tibbitts et al., 1990). Fourier averages of images of cardiac gap junctions containing Cx43 at - 16 A resolution are almost identical in projection with liver gap junctions (Yeager and Gilula, 1992) in spite of 1 1-kDa mass difference between Cx43 and Cx32 in the C-terminal tail. Endogenous proteolysis of Cx43 produces a connexin that is missing an - 13-kDa fragment but the Fourier aver- ages of images of the proteolyzed samples are almost iden- tical to the unproteolyzed specimens. Removal of the cyto 533
Transcript
Biophysical Journal Volume 72 February 1997 533-544
Three-Dimensional Structure of the Gap Junction Connexon
Guy Perkins,* Dan Goodenough,# and Gina Sosinsky*§Departments of *Neurosciences and §Biology, University of California, San Diego, La Jolla, California 92093-0322, and #Department ofCell Biology, Harvard Medical School, Boston, Massachusetts 02115 USA
ABSTRACT The gap junction membrane channel is composed of macular aggregations of intercellular channels permittingthe direct intercellular transfer of ions and small molecules. Each intercellular channel is formed by the apposition of twohexameric transmembrane channels (connexons), one from each cell. The interlocking of the two channels occurs extracel-lularly in a narrow 3.5-nm "gap" separating the junctional membranes. The channel-channel interaction is known to beselective between members of the family of proteins, called connexins, which oligomerize into the connexons. In addition toselectivity, the molecular interfaces involved in the extracellular interactions between connexons must be very congruent,since the intercellular channel must provide high resistances to the leakage of small ions between the channel lumen and theextracellular space. By using a recently developed biochemical procedure for obtaining ordered arrays of connexons fromgap junctions split in the extracellular gap, (Ghoshroy, S., D. A. Goodenough, and G. E. Sosinsky. 1995. Preparation,characterization, and structure of half gap junctional layers split with urea and EGTA. J. Membr. Biol. 146:15-28) athree-dimensional reconstruction of a connexon has been obtained by electron crystallographic methods. This reconstructionemphasizes the structural asymmetry between the extracellular and cytoplasmic domains and assigns lobed structuralfeatures to the extracellular domains of the connexon. The implication of our hemichannel structure is discussed in relationto the in vivo state of unpaired connexons, which have been shown to exist in the plasma membrane.
INTRODUCTION
Intercellular communication through gap junction channelshas functional roles in cell survival, differentiation, metab-olism, morphogenesis, and mutagenesis (Bennett et al.,1991; Dermietzel et al., 1990; Fraser et al., 1987; Gilula etal., 1972; Goodenough et al., 1996; Hooper and Subak-Sharpe, 1981; Revel et al., 1985). Gap junctions are spe-cialized cell-cell contact regions that contain tens to thou-sands of intercellular channels that link two apposed cells.These channels facilitate a form of intercellular communi-cation by permitting the regulated passage of ions and smallmolecules from one cell to another (Bennett and Goode-nough, 1978).Gap junction intercellular channels are composed of two
paired transmembrane protein oligomers (connexons), onefrom each juxtaposed membrane. Each connexon containssix homomeric or heteromeric subunits made from membersof a multigene family of homologous proteins called con-nexins (Beyer et al., 1990; Jiang and Goodenough, 1996;Makowski et al., 1977; Sosinsky, 1995; Stauffer, 1995). Thechannel-channel interaction is known to be selective be-tween connexins. In addition to selectivity, the molecularinterfaces involved in the extracellular interactions betweenconnexons must be congruent, since the intercellular channelmust provide high resistances to the leakage of small ionsbetween the channel lumen and the extracellular space. Theconnexin proteins are designated by the abbreviation Cx fol-
Receivedfor publication 28 May 1996 and in finalform 16 October 1996.Address reprint requests to Dr. Guy Perkins, NCMIR, University of Cal-ifornia, San Diego, La Jolla, CA 92093-0608. Tel.: 619-534-7968; Fax:619-534-7497; E-mail: [email protected] 1997 by the Biophysical Society0006-3495/97/02/533/12 $2.00
lowed by the molecular mass in kilodaltons, e.g., rat Cx32 isthe predominant connexin found in rat liver connexons.
Proteolysis and antibody binding experiments indicatethat the family of connexins have a common folding topol-ogy with the peptide chain traversing the membrane fourtimes (Beyer et al., 1987; Goodenough et al., 1988;Hertzberg et al., 1988; Milks et al., 1988; Nicholson et al.,1985; Yancy et al., 1989; Zhang and Nicholson, 1989;Zimmer et al., 1987). The N- and C-termini are located onthe cytoplasmic side of the junctional membrane, while theextracellular (or "gap") side of the membrane contains twoloops, called El and E2. Comparisons of the amino acidsequences of known connexins have shown that while theamino terminus, the four membrane spanning domains, andthe two extracellular loops are relatively conserved, theremainder of the cytoplasmic domains are highly variable.(White et al., 1995).
Several lines of evidence imply that the connexon struc-ture at the cytoplasmic surface is disordered (Sosinsky,1992). The cytoplasmic structure has not been adequatelyvisualized in either the three-dimensional reconstructionsfrom electron microscopy (Sikerwar et al., 1991; Sikerwarand Unwin, 1988; Unwin and Ennis, 1984; Unwin andZampighi, 1980) or in x-ray diffraction analyses (Makowskiet al., 1984; Tibbitts et al., 1990). Fourier averages ofimages of cardiac gap junctions containing Cx43 at - 16 Aresolution are almost identical in projection with liver gapjunctions (Yeager and Gilula, 1992) in spite of 11-kDamass difference between Cx43 and Cx32 in the C-terminaltail. Endogenous proteolysis of Cx43 produces a connexinthat is missing an - 13-kDa fragment but the Fourier aver-ages of images of the proteolyzed samples are almost iden-tical to the unproteolyzed specimens. Removal of the cyto
533
Volume 72 February 1997
plasmic domains from liver gap junctions by proteolysisalso does not significantly change the high-resolution equa-torial reflections in x-ray diffraction patterns, although themass loss was visualized in the electron density profilescalculated from x-ray diffraction meridional data (Ma-kowski et al., 1984).
In contrast, the transmembrane and extracellular domainsof the connexons are more highly ordered in isolated gapjunction specimens, and thus are amenable to Fourier anal-yses. Modeling studies, CD spectra, and analyses of high-angle x-ray diffraction data are consistent with a-helicalsecondary structure in these ordered domains (Cascio et al.1990, 1995; Milks et al., 1988; Tibbitts et al., 1990; Unwin,1986). The model that best fits the x-ray diffraction datacontains a four a-helical bundle with one or two of thehelices tilted -20° with respect to the membrane plane.Analysis of meridional arcs centered at 4.9 A that aresampled by an -80-A interference function locates thea-helical scattering centers in the transmembrane domains;however, the data are not of sufficient resolution to permitthe dissection of specific contributions of each putativehelix from contributions of the extracellular domains (Tib-bitts et al., 1990).The involvement of the connexin extracellular domain in
cell-cell interaction has been studied using several ap-proaches. Biochemically, the El and E2 loops each containthree conserved cysteines, and Dahl et al. (1991, 1992) haveshown that mutation of any of these six cysteine residues inCx32 completely blocks the development of gap junctionalconductances between Xenopus oocyte pairs. Site-specificEl and E2 antisera will stearically interfere with gap junc-tion assembly between certain cells in culture (Meyer et al.,1992). White et al. (1994) showed that the E2 domain is adeterminant of connexin selectivity in heterotypic connexoninteractions. Foote and Nicholson (1997) moved the firstand third cysteines of each E-loop of Cx32 to variouspositions away from their wild-type positions. Only if theCys residues are moved in pairs, such that their relativepositions permit continued disulfide bonding, will func-tional channels result. The least perturbation of channel-forming capacity and biophysical properties are observed ifthe Cys residues are moved precisely two residues in eitherdirection, consistent with a (3-sheet secondary structure.Further experiments by Foote and Nicholson suggest amodel in which the extracellular domains form stacked3-sheets, each with a central reverse turn, which are joinedand held in a rigid conformation by three interloop disulfidebonds.Due to the extremely tight interlocking of the connexons
in the extracellular gap necessary for ionic insulation of theintercellular channel pore, images of the extracellular do-mains of the connexons are difficult to obtain from intactintercellular channels at low resolution. Current connexonmodels, therefore, are based on reconstructions of the entirechannel, which is then divided at the midpoint to produce asingle connexon (for example, see Unwin and Zampighi,
have been obtained by atomic force microscopy (AFM),which show distinct lattice structure and some subunit de-tail, and indicate a rigidity to the extracellular structuresufficient to resist the mechanical dissection performed bythe AFM cantilever (Hoh et al., 1991, 1993). The rigidity ofthe extracellular domain is in agreement with the x-ray dataand evidence for disulfide-bonded (3-sheets reviewed above.
While connexons are known to be present in the nonjunc-tional membranes of cultured cells (Musil and Goodenough,1991), they are not clustered in sufficient density to permita structural analysis. Ghoshroy et al. (1995) refined a pro-tocol developed by Manjunath et al. (1984) for reproduciblyobtaining single connexon layers or "split junctions" withhigh efficiency and good structural integrity. A good exam-ple of a split junction is shown in Fig. 1 A. These splitjunctions offer the opportunity to visualize the extracellularsurface of the connexon. The specimens have permitted athree-dimensional reconstruction of connexons formed fromCx32 and Cx26 from rat liver at a resolution of -20 A bythe technique of 3-D electron crystallography. From thisreconstruction, new information about the topology of theextracellular domain was determined.
MATERIALS AND METHODS
Isolation and splitting of gap junctions
Preparations of isolated gap junctions were made from rat liver using adetergent extraction procedure, which is detailed in Fallon and Goode-nough (1981) and Baker et al. (1985). Purified plaques of gap junctionswere split with urea and EGTA as described by Ghoshroy et al. (1995).SDS-PAGE of both intact and split gap junctions was performed (Good-enough et al., 1988) to check that proteolysis was minimal.
Electron microscopy
Split gap junctions were adsorbed to carbon-coated grids rendered hydro-philic by UV light and stained with 2% uranyl acetate. Low-dose, cryo-EMimages were taken at a nominal magnification of 35,000 on a Philips CM 12electron microscope, operated at 120 kV, and equipped with a Gatan 651anticontaminator and a Gatan 626 cold stage cooled to - - 175°C. Tiltingof the specimens to provide three-dimensional (3-D) data was achievedwith a goniometer stage. Tilt series with tilts up to 620 and tilt angleincrement of either 10 or 200 within each series were collected. Thedefocus was -450 nm (as measured by optical diffraction) which resultedin the first zero in the phase contrast transfer function (PCTF) lying beyondthe 16-A resolution cutoff used in the 3-D reconstruction. Tilt series qualitywas assessed both visually and by optical diffraction. Tilt series of split gapjunction patches were rejected if they did not diffract to at least 20 Aresolution. Typically, these images had distinctly visible connexons. Fivetilt series (41 images) satisfied the resolution criteria and provided an
adequate sampling of Fourier space.
Image analysisFourier methods (Henderson et al., 1986) were used to generate the 3-Dreconstruction of the gap junction connexon. Micrographs were digitizedon an Eikonics CCD model 1412 microdensitometer at a raster of 20 ,um(5.7-A pixel size). The image area that provided the best optical diffractionwas further reduced after digitization to optimize the strength of thestructure factor amplitudes determined from the computed diffractionpattern. This area was computer-processed as shown in the flow chart
534 Biophysical Journal
1980). Topographic images of the extracellular surfaces
Connexon 3-D Structure
FIGURE 1 Electron micrographs recorded at - - 175°C and 120 kV of split gap junctions stained with uranyl acetate. (A) Untilted image of split plaques.Curled edges (arrows) and folds (arrowheads) confirm the presence of single membranes. Individual connexons are visible on a hexagonal lattice andappear as "doughnuts." The digitized area is boxed. (B) Image of the same membrane recorded at 600 tilt. Scale bar = 150 nm. (C) Computed diffractionpattern, after crystal lattice unbending, from an image area in (A) that was boxed to provide a uniform lattice. The lattice constant is 83 A. Third-orderreflections are clearly visible and higher-order reflections can be detected above the background after image processing. (D) Same as (C) but computedfrom a boxed image taken from the 600 image of (B). (E) Magnified subareas of (A) and (B) providing details of the edge views of hemichannel membranesat 00 and 600 tilts. Scale bar = 61 nm. (F) Filtered image generated by masking the reflections of the computed diffraction pattern of (C) with a six-pixelradius circular filter, and then computing the inverse Fourier transform. A smaller region of -6 x 6 connexons is shown. The pore (dark circle at the centerof each connexon) is an outstanding feature. The region between connexons, the lipid bilayer, is also darker than the connexon protein mass, but not asdark as the pore.
provided in Fig. 2. A combination of software packages was used to takeadvantage of the unique capabilities of each. The majority of programsused were from the MRC Electron Microscopy (Crowther et al., 1996) andCCP4 (Collaborative Computational Project 4, 1994) packages. Crystallattice distortions were corrected by the methods described by Hendersonet al. (1986) using the SPECTRA software package (Schmid et al., 1993).Each image was brought to a common phase origin by the programORIGTILT. The structure factor phases were close to 0 or 1800 for thenominally untilted images. Hence the plane group symmetry must becentrosymmetric (e.g., p2, p6). The program ALLSPACE further con-firmed p6 symmetry for 2-D crystals of connexons. The expected resolu-tion in projection was estimated by the program AVRGAMPHS andextends to -15 A.
Calculation and display of 3-D maps
The nominally untilted image data were first combined. Images weresubsequently merged in order of increasing tilt. Merging was performedusing the crystallographic plane group, p6, since it was previously deter-mined that split gap junctions from liver maintain the hexagonal substruc-
ture found in intact gap junctions (Ghoshroy et al., 1995). The tilt anglesand axes were calculated by the Shaw and Hills (1981) procedure. The 3-Dmerging of structure factors (Amos et al., 1982) was accomplished withORIGTILT using p6 symmetry. The 3-D data set contained 37 of 41images that could be merged with low phase residuals. The programLATLINE (Agard, 1983) was used to fit smooth curves along each recip-rocal lattice line. The merged images, ranging in tilt angles from -60° to+62°, sampled the lattice lines sufficiently to follow the continuousvariations in amplitudes and phases. Sampling the curves at intervals of0.005 A-' provided the amplitudes and phases used for calculating the 3-Dconnexon map. The effect of the PCTF on the structure factor amplitudeswas corrected. The program PREPMKMTZ converted LATLINE outputinto the mtz format used by the suite of CCP4 programs and removedunreliable phase measurements. The CCP4 programs were used to calcu-late the 3-D map using Fourier terms sampled along the lattice lines atintervals of 0.005 A- . Figure-of-merit (FOM) weighting was used todownweight unreliable structure factors. Also, a B-factor of -5000 A2 wasemployed to ameliorate the unreasonably high scaling of low-resolutionamplitudes obtained by the PCTF correction. Contour plots of map sectionswere generated using PLUTO. The surface-rendered maps were displayed
535Perkins et al.
N,;w
Volume 72 February 1997
FIGURE 2 Flow chart describing the computer processing of electronmicrographs (see Experimental Procedures for a description of the imageprocessing). The name of the program used at each step in the flow chartis capitalized. Note that a 3-D reconstruction was computed from each tiltseries, which allowed differentiation of split gap junction membranes fromintact membranes.
with the SYNU graphics package (Hessler et al., 1992). The molecularenvelope of the connexon was estimated by the program DALTON, andconfirmed by the program SYNUVOLUME. The point spread function(PSF) (Born and Wolf, 1980; Stevens et al., 1994) was calculated toestimate the 3-D resolution for our 3-D map using the method described byUnger and Schertler (1995).
RESULTS
Specimen characterization
A low-irradiation image of an untilted gap junction plaquethat had been chemically split using the protocol developedby Ghoshroy et al. (1995) is shown in Fig. 1 A. The contrastin this image was quite good, as indicated by the visibilityof the connexon lattice in the original micrograph. Theeffect of the urea and EGTA used in this splitting protocolwas the separation of the two connexon membranes whilemaintaining the structural integrity of the connexon lattice.The two-dimensional, hexagonal lattice observed after split-ting had the same lattice constant and packing arrangementfound in the whole junctions. As with intact junction crys-tals, connexon crystals displayed a relatively high degree of
mosaicity, which limited the useful size of a coherent areafor crystallographic averaging to a small fraction of the totalplaque. Split junctions were generally smaller than intactjunctions, which may have been the result of fracturingalong domain boundaries of the mosaic crystals, as previ-ously postulated (Ghoshroy et al., 1995).
There are three criteria, used at various stages before thefinal 3-D map was generated, that were used to differentiatebetween split and intact gap junctions. First, at the micros-copy stage, the difference in mass density between intactand split junctions, which was seen as a contrast difference,could usually be observed at low magnification. This con-trast difference was even more pronounced when searchingfor suitable junctions in the "defocused diffraction mode."Second, after prints were made from electron micrographs,morphological guides, e.g., folds and edge appearance, wereused to distinguish between single membrane (split) anddouble membrane (intact) junctions (Ghoshroy et al., 1995).The curled edges (single arrows) and folds (double arrows)in Fig. 1 A indicate the presence of a single membrane. Fig.1 B shows the same membrane recorded at 600 tilt. Thishigh-tilt image provides even more pronounced edge viewsconfirming the morphological guides of Fig. 1 A. Fig. 1, Cand D are the computed diffraction patterns, after crystallattice unbending, from areas in Fig. 1, A and B, respec-tively, that were boxed to provide a uniform lattice, i.e., asingle domain of the mosaic crystal. Third-order reflectionswere clearly visible, and fourth-order reflections were de-tected above the background after image processing. In thethird criterion for single membranes, a 3-D reconstructionwas calculated from each of the five tilt series used in thefinal 3-D connexon map. Although a reconstruction com-puted from only seven images is low-resolution, this wassufficient to confirm that these membranes were indeedsingle connexon layers.To detect stain penetration inside the lipid bilayer that
may have resulted from detergent extraction of lipid or fromthe urea extraction procedure, we a) present magnified edgeviews and b) generated a filtered image. Fig. 1 E showsviews looking down the edge of the membrane tilted 00 and60°. If significant stain penetration had occurred, then themembrane would appear darker in the edge view than in theperpendicular view through the stain-excluding (connexon)mass. The edge view of the hemichannel membrane doesindeed appear darker, but not to the extent that we canunequivocally assert that stain significantly penetrated thebilayer. The filtered image, generated by masking the re-flections of the computed diffraction pattern with a 6-pixelradius circular filter, is shown in Fig. 1 F. Filtering elimi-nated noise from the image and resulted in a sharper view ofthe connexons. The darker regions between connexonsmight indicate stain penetration. However, it is equallylikely that these regions indicate disordered areas, e.g.,noncrystalline lipid packing, that were lost upon localaveraging.
536 Biophysical Journal
Connexon 3-D Structure
Improvement in image quality
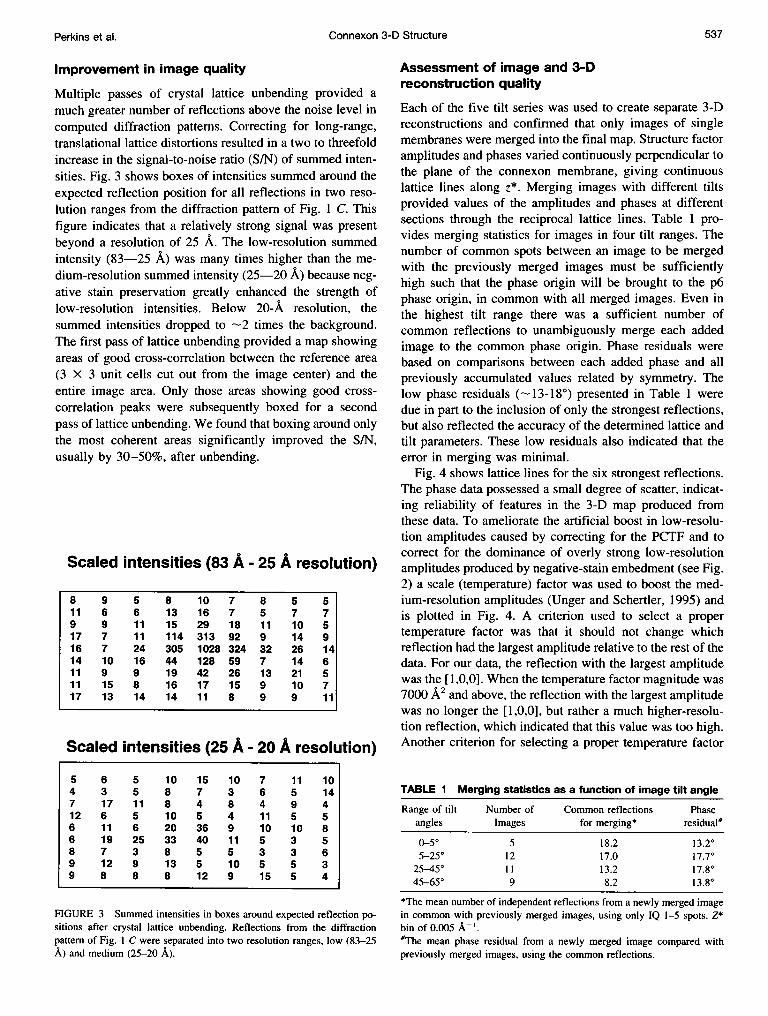
Multiple passes of crystal lattice unbending provided amuch greater number of reflections above the noise level incomputed diffraction patterns. Correcting for long-range,translational lattice distortions resulted in a two to threefoldincrease in the signal-to-noise ratio (S/N) of summed inten-sities. Fig. 3 shows boxes of intensities summed around theexpected reflection position for all reflections in two reso-lution ranges from the diffraction pattern of Fig. 1 C. Thisfigure indicates that a relatively strong signal was presentbeyond a resolution of 25 A. The low-resolution summedintensity (83-25 A) was many times higher than the me-dium-resolution summed intensity (25-20 A) because neg-ative stain preservation greatly enhanced the strength oflow-resolution intensities. Below 20-A resolution, thesummed intensities dropped to -2 times the background.The first pass of lattice unbending provided a map showingareas of good cross-correlation between the reference area(3 X 3 unit cells cut out from the image center) and theentire image area. Only those areas showing good cross-correlation peaks were subsequently boxed for a secondpass of lattice unbending. We found that boxing around onlythe most coherent areas significantly improved the S/N,usually by 30-50%, after unbending.
FIGURE 3 Summed intensities in boxes around expected reflection po-sitions after crystal lattice unbending. Reflections from the diffractionpattern of Fig. 1 C were separated into two resolution ranges, low (83-25A) and medium (25-20 A).
Assessment of image and 3-Dreconstruction quality
Each of the five tilt series was used to create separate 3-Dreconstructions and confirmed that only images of singlemembranes were merged into the final map. Structure factoramplitudes and phases varied continuously perpendicular tothe plane of the connexon membrane, giving continuouslattice lines along z*. Merging images with different tiltsprovided values of the amplitudes and phases at differentsections through the reciprocal lattice lines. Table 1 pro-vides merging statistics for images in four tilt ranges. Thenumber of common spots between an image to be mergedwith the previously merged images must be sufficientlyhigh such that the phase origin will be brought to the p6phase origin, in common with all merged images. Even inthe highest tilt range there was a sufficient number ofcommon reflections to unambiguously merge each addedimage to the common phase origin. Phase residuals werebased on comparisons between each added phase and allpreviously accumulated values related by symmetry. Thelow phase residuals ( 13-180) presented in Table 1 weredue in part to the inclusion of only the strongest reflections,but also reflected the accuracy of the determined lattice andtilt parameters. These low residuals also indicated that theerror in merging was minimal.
Fig. 4 shows lattice lines for the six strongest reflections.The phase data possessed a small degree of scatter, indicat-ing reliability of features in the 3-D map produced fromthese data. To ameliorate the artificial boost in low-resolu-tion amplitudes caused by correcting for the PCTF and tocorrect for the dominance of overly strong low-resolutionamplitudes produced by negative-stain embedment (see Fig.2) a scale (temperature) factor was used to boost the med-ium-resolution amplitudes (Unger and Schertler, 1995) andis plotted in Fig. 4. A criterion used to select a propertemperature factor was that it should not change whichreflection had the largest amplitude relative to the rest of thedata. For our data, the reflection with the largest amplitudewas the [ 1,0,0]. When the temperature factor magnitude was7000 A2 and above, the reflection with the largest amplitudewas no longer the [1,0,0], but rather a much higher-resolu-tion reflection, which indicated that this value was too high.Another criterion for selecting a proper temperature factor
TABLE 1 Merging statistics as a function of image tilt angle
Range of tilt Number of Common reflections Phaseangles Images for merging* residual'
0-50 5 18.2 13.205-250 12 17.0 17.70
25-450 1 1 13.2 17.8045-650 9 8.2 13.80
*The mean number of independent reflections from a newly merged imagein common with previously merged images, using only IQ 1-5 spots. Z*bin of 0.005 A-'.#The mean phase residual from a newly merged image compared withpreviously merged images, using the common reflections.
537Perkins et al.
538 Biophysical Journal
1C Lattice Line [1,0]
1(.) {}C S - -23
-a ------
CC Z*0 0. 005l 0.01 0.015 0)0 2 0.025 0.03
.d- - ... - .......---... .--.-
CZ
9000 Lattice Line [2,0]
-a O
<31000
Z*0 001 002 0.03 0.04
(, ..- ....- - -- - - -----------
Cd - t|1 o.(F1: ) {|:
-CD.- - - . ..
LatcCind20£2 0
1 80C
a)23
E
Volume 72 February 1997
T~~~~- - - ------
.-
U1)Cl
---- -I1>I-- . -*> t<='I(].,t
2:000 Lattice Line [1,2]
02
C).z01vc 2 0}. O) 1 04. i
-1000
C
200~Lattice Line [2,1]
-Q
,1 00(
E - f
... .3. . .. 2 O 4
L
FIGURE 4 Structure factor amplitudes (top) and phases (bottom) for a few representative lattice lines (hk) are plotted versus z*. The phases areconstrained by plane group symmetry (p6) to have phases of 00 or 1800 only at z* = 0.0. The program LATLINE fits a curve to the data points based on
p6 symmetry constraints. Amplitudes and phases were subsequently read from the curve at equal intervals, represented by crosses. Plots of the LATLINEcurves after applying a temperature factor of B = -5000 A? show the scaling performed before generating the 3-D map, represented by X. Temperaturefactors with magnitudes below 5000 A2 did not significantly enhance the features of the unscaled map, while factors above this value introduced artifactsin the map. The result of temperature factor scaling was to sharpen the appearance of features that could already be detected in the unscaled map.
II,C. Lattice Line [1,1]
-1 000
E II. C'
L - Zn[,1
0......1 0 02 l)C)0.3().;.)4
i
Connexon 3-D Structure
was the appearance of the map itself. A value of 7000 A2 ormore produced what appeared to be artifacts in the con-nexon boundary, which were eliminated when a value of5000 A2 was used. The effect of this scaling was to providea more detailed map representing the true resolution con-tained in the merged data.
3-D connexon map and the reliability ofstructural features
The 3-D reconstruction of the gap junction connexon em-phasized the asymmetry between the extracellular and thecytoplasmic domains (Fig. 5, A D). The cytoplasmic andextracellular surfaces of the maps were assigned based onthree lines of evidence. First, the feature at the threefold axiswas previously determined to lie on the cytoplasmic surfacebased upon the distance it moved between tilted and untiltedimages of the same negatively stained intact junctions(Baker and Sosinsky, unpublished results). Second, trypsintreatment of these same specimens (only the cytoplasmicdomains were enzyme-accessible) removed the feature atthe threefold axis and replaced it with a pocket of stain thatalso had the same distance constraints. Third, the six pro-trusions, assigned to the extracellular surface, have also
FIGURE 5 Complementary views ofthe connexon map. Shown here is thep6 unit cell with a central connexonand parts of the surrounding connexonsat the edges of the unit cell. (A) A sideview of the entire map showing theasymmetry of the cytoplasmic and ex-tracellular side. The contours are at90% (yellow) and 80% (blue) of thetheoretical volume. There are six lobesthat protrude from the extracellular sur-face. In contrast, the cytoplasmic sideshows little height modulation. (B)shows a view of the central portion(16-A thick) cut parallel to the x-axisand emphasizes how the channel taperstoward the extracellular side. (C) Aview looking down the cytoplasmicportion of the structure, at a small anglefrom the sixfold axis. The triangle de-notes the threefold axis where stain-excluding mass is observed. The thick-ness of the connexon is 50 A. (D)Connexon reconstruction viewed look-ing down the extracellular side at asmall angle from the sixfold axis, lo-cated at the center of the connexon.
been seen in AFM images of the extracellular surface (Hohet al., 1993).The map shown in Fig. 5 was contoured at 90% and 80%
of the theoretical volume. The observed features remainedstrong even at a display level of 65% of the theoreticalvolume. If all parts of the Cx32 were visible, the cytoplas-mic domains would contribute -47%, the extracellular do-mains -26%, and the transmembrane domains -27%, re-spectively, to the volume. However, these values are onlyapproximations based on current topological models of theprimary sequence (Goodenough et al., 1988). An 81% vol-ume would correspond to a connexon composed solely ofCx26 connexons. Cx32 and Cx26 are found in a 1O:1 ratio,respectively, in isolated rat liver gap junctions (Zhang andNicholson, 1989). However, at this resolution, Cx32, Cx26,and Cx32/Cx26 heteromeric connexons are indistinguishable.
While the extracellular surface had well-defined features(Fig. 5 D), the cytoplasmic side was relatively flat (Fig. 5C), apparently because of peptide flexibility in this region,which was viewed as disorder in the crystallographic ap-proach used (reviewed by Sosinsky, 1992, 1996). Hence,the height of the connexon seen was only -50 A, asdepicted in the central section (Fig. 5 B) perpendicular to themembrane. This height correlated well with the expected
0 0 *0.
00.
0.
.0
539Perkins et al.
Volume 72 February 1997
membrane width of -35-40 A (Makowski et al., 1977;Tibbitts et al., 1990) plus the measured extracellular heightof 14 A (Hoh et al., 1993). The distance that each connexonprotruded into the gap is -15 A, in good agreement withone-half the gap width of negatively stained cross sectionsof intact junctions from grid sections (-30 A thick, Sosin-sky et al., 1988). The shrinkage due to the electron beamand stain drying was reduced by the combination of lowtemperature (- 1750C) and a low number of images in eachtilt series (Sikerwar et al., 1991; Sikerwar and Unwin, 1988;Sosinsky et al., 1988). Initial trial experiments showed thata seven-image exposure series made no discernible differ-ence in image quality between the first and last exposures,as judged by computed diffraction intensities.To obtain information about the topology at the extracel-
lular domains, an estimate of the connexon molecular en-velope was determined. Physiological, biochemical, andstructural results indicate that living organisms assemblechannels containing different connexins (Jiang and Goode-nough, 1996; Sosinsky, 1995; Stauffer, 1995). It has beenhypothesized that plaques with the best crystalline order areselective for homomeric channels (all six connexins in aconnexon of the same type) or heterotypic channels (eachconnexon composed of a different type of connexin)whereas loosely packed maculae are selective for hetero-meric channels (different types of connexins in a singleconnexon, Harris, 1997; Sosinsky, 1996). Since the con-nexon layers used in the reconstruction showed good crys-talline order, it was assumed that homomeric connexonswere present. Therefore, the molecular volume was esti-mated to be 241,000 A3 based on the connexon molecularmass of - 192,000 kDa. Since it is known that portions ofthe cytoplasmic domains are disordered, this molecular vol-ume was an overestimate of the protein density. This vol-ume was then used to contour the density in Fig. 5 to displaythe molecular envelope. A pore ran all the way through thecenter of the connexon and was constricted to a diameter of
16 A on the extracellular end. The connexon had a diam-eter of -65 A and the six density peaks protruding up fromthe extracellular face were presumed to be the portions ofthe six connexon subunits that would dock with an apposingconnexon to form an intercellular channel. The open pore onthe extracellular end and the six density protrusions werealso observed in atomic force microscope (AFM) images ofmechanically dissected connexons (Hoh et al., 1993). Prom-inent stain-excluding density was also observed at the three-fold axis of the unit cell on the cytoplasmic surface (Fig. 5,A and C) which has been reported in the literature (Baker etal. 1983, 1985; Caspar et al., 1988). This feature has beenabsent in other published 3-D reconstructions of the doublemembrane structure. Since this density was discontinuouswith the main connexon body (density center is - 10 A fromthe closest edge of the connexon) it was unclear what thisfeature might represent.
Contour plots of sections parallel to the membrane at thecytoplasmic edge and the extracellular surface are shown inFig. 6, A and B, respectively. These sections provided a
II IC
FIGURE 6 Contour plots of 5-A sections cut from the 3-D map. (A)Section parallel to the membrane plane at a level corresponding to thecytoplasmic edge and (B) the extracellular edge of the connexon. (C)Central section perpendicular to the membrane plane through the pore.Solid contours represent positive density, i.e., stain-excluding regions(ordered protein) and dashed contours represent negative density, i.e.,regions of stain accumulation or nonordered regions.
perspective not easily seen in Fig. 5 C and showed thehexagonality and skewing similar to the Baker et al. (1983)projections. These sections also showed a similar twist ofthe subunits between the cytoplasmic and extracellularsides, as was seen by Unwin and co-workers (Unwin andZampighi, 1980; Unwin and Ennis, 1984). Fig. 6 C is acontour plot viewing the reconstructed connexon perpendic-ular to the pore, hence perpendicular to the contour plots ofFig. 6, A and B. Negative contours are shown to investigatethe possibility that sufficient lipid was removed in thedetergent extraction or perhaps during the urea-EGTA split-ting procedure such that stain had penetrated in the regionbetween connexons. High concentrations of urea (8 M) havebeen used to solubilize the platelet glycoprotein complexIIb.IIIA, an integral membrane protein (Gianazza et al.,1992). Because the negative contours between connexonsare nearly as strong as those in the pore, stain penetrationbetween connexons might have occurred. However, crystal-lographic averaging provides a reconstruction of only thoseareas that are ordered. Thus, an alternative explanation isthat the negative contours represent disordered mass (cf.Fig. 1 F).The effective resolution of the 3-D map was estimated
from the point spread function (PSF, Fig. 7) of the input
540 Biophysical Journal
Connexon 3-D Structure
V V z
x
A plane PSF resolutioncut-offx,y 16
z,y 26 C
FIGURE 7 Sections (x, y) and (x, z) through the point spread function ofthe experimental 3-D data. Solid contour lines are at the peak half-heightand the dotted contour lines are at the zero level. The underlying gridlineshave a spacing of 40 A. The resolution cutoffs, as measured from theseplots, are given to the side.
data (described by Unger and Schertler, 1995). The PSF wasused as a measure of the anisotropic resolution. The PSF-calculated resolution cutoffs were - 16 A in plane and -26A perpendicular to the membrane plane. The reduced reso-lution in the vertical direction was due to incomplete 3-Dsampling; since the highest tilt angle was 620, there was anunsampled wedge of Fourier space. As a check of featurereliability, a comparison of an uncorrected ("raw") map andthe final PCTF/B factor-corrected map showed that theoverall features in each were similar (data not shown).
DISCUSSION
The data gathered from electron micrographs of split gapjunctions have permitted a three-dimensional reconstructionof a single connexon. Previous reconstructions were ob-tained from the double membrane structure and a singleconnexon was estimated by simply dividing the structuredown the center of the extracellular space (Sikerwar andUnwin, 1988; Unwin and Ennis, 1984; Unwin andZampighi, 1980). The reconstruction shown here provides avisualization of the topology at the extracellular surfaceavoiding an arbitrary separation of the paired connexons inthe extracellular space.The key to obtaining the single connexon reconstruction
was the development of a reproducible procedure for split-ting isolated gap junctions with high efficiency, resulting inconnexon plaques of good structural integrity (Ghoshroy etal., 1995). Previous protocols for splitting the membranepair produced variable and partial splitting and/or disor-dered membrane structure. By using a combination of urea,chelating agents, and temperature, >75% split junctionscould be obtained that also maintained a hexagonal crystallattice.
.: 11
...
extracellular end. A broader cytoplasmic opening is consis-
541Perkins et al.
Relevance of uncoupled connexons to isolatedconnexons in vivo
Our hemichannel structure is relevant to the increasinginterest shown in the mechanism of hemichannel assemblybefore reaching the plasma membrane, aggregation in theplasma membrane, and finally docking with a hemichannelfrom an adjacent cell. The oligomerization of connexinsinto a connexon (reviewed by Laird, 1996) is atypical ofintegral membrane proteins in that it occurs in the trans-Golgi network (Musil and Goodenough, 1993) instead oftaking place in the endoplasmic reticulum (Hurtley andHelenius, 1989). Laird postulates that oligomerization oc-curs in such a "late" compartment because "earlier" secre-tory compartments may be unable to prevent connexonpairing. There is also the expectation that hemichannels inthe trans-Golgi network are closed to maintain the integrityof the Golgi membrane. Biochemical studies have providedevidence that unpaired connexons exist in the plasma mem-brane (DeVries and Schwartz, 1992; Evans, 1994; Musiland Goodenough, 1993). In addition, evidence for the pres-ence of functional hemichannels was obtained from expres-sion of rat Cx46, chick Cx56, bovine Cx44, and XenopusCx38 in single Xenopus oocytes. In these studies, channelsform in the nonjunctional plasma membrane and open ondepolarization (Paul et al., 1991; Ebihara and Steiner, 1993;Ebihara et al., 1995; Gupta et al., 1994, Ebihara, 1996).
Comparison with other structural data
Similar to previous reconstructions from intact gap junc-tions (Sikerwar and Unwin, 1988; Unwin and Ennis, 1984;Unwin and Zampighi, 1980) the single connexon recon-struction showed an open pore in the connexon centerrunning completely through the membrane. It was possiblethat the pore was closed within the cytoplasmic domain (notwell-visualized in this reconstruction) which may controlgating (Makowski, 1988). While no major substructure wasvisible at the cytoplasmic surfaces, slight modulations ofsurface structure were seen that were distinctly differentfrom the classic skewed-lobe appearance (compare Fig. 5 Cand Fig. 6 A). It was possible that some of the surfacemodulation seen on the cytoplasmic side may have been dueto contributions from the cytoplasmic loop or base of thecarboxy tail from each of the six connexin molecules. Thehexagonal substructure of the connexon was readily appar-ent (even before imposing sixfold symmetry). An additionalcommon feature was the slight tapering of the molecularenvelope at the extracellular end when viewed parallel tothe membrane plane (best seen in cross section; Fig. 5 B).Since we do not have an accurate estimate of the membraneboundaries, this tapering may lie just outside of the lipidbilayer at the extracellular surface.
Unlike previous reconstructions from intact gap junctions(Unwin and Ennis, 1984; Unwin and Zampighi, 1980), theconnexon pore tapered from the cytoplasmic end to the
Volume 72 February 1997
tent with sucrose accessibility measurements on the pore(Makowski et al., 1984). The pore had a narrowest diameterof -16 A, although this measurement was at the resolutionlimit in the map. Given the considerable experimental ma-nipulation required for the isolation and splitting of the gapjunctions, the two extracellular loops (per connexin) mayhave experienced rearrangements that resulted in the ap-pearance of a constriction. Nevertheless, the connexonstructure remained highly hexagonal after splitting andmaintained the -8° skew from vertical, as previously ob-served by Baker et al. (1983, 1985) and Gogol and Unwin(1988).
It is interesting to note that we see continuous densitythrough the membrane in our map. While this result wasunexpected based on the current dogma of negative staining,it is not unique. Karlsson et al. (1983) and Bottcher et al.(1992) also reported 3-D maps of membrane proteins, cy-tochrome reductase, and photosystem I (PS I), respectively,obtained from negatively stained crystals that showedstrong density through the membrane. In both structures, thehighest densities were those in the transmembrane region.We present three hypotheses for our observations. The firsttwo explanations we have mentioned previously in thepaper, i.e., stain penetration through the membrane due tothe biochemical manipulation of the sample or loss offeatures in the lipid regions due to the crystallographicaveraging process. Stain penetration into a crevasse in thebilayer between protein and surrounding lipids, formed byelectron irradiation, is a possibility in view of a new 3-Dreconstruction of PS I (Karrasch et al., 1996). While theirstructure also shows densities within the membrane, there isweaker contrast through the membrane than in the samearea of the 3-D reconstruction of Bottcher et al. (1992).Karrasch et al. (1996) attributed this lower contrast to usinga much lower electron dose. Stain penetration into crevassesas a result of electron irradiation were first described byUnwin and Klug for tobacco mosaic virus (1974). However,the appearance of cross-sectional views through our mem-branes, fortuitously obtained by folds or membrane edges,do not show significant stain darkening. A third proposal isthat contributions from the transmembrane domains arebeing seen as a result of the stability of the specimen at lowtemperature. In essence, at low temperature, the negativestain may act as a mold to hold the protein in place, allowingenhanced crystallographic averaging. A similar explanationhas been proposed in spot-scan images where the unirradi-ated areas hold irradiated spots in place (Downing, 1991).Rachel et al. (1986) and Valpuesta et al. (1990) have re-ported high-resolution images from negatively stained spec-imens. At higher resolution, these images contain contribu-tions from the protein as well as the stain. In principle, if thestructural preservation is good, then the images obtainedshould be the sum of the stain and protein.AFM images of mechanically split gap junction plaques
(Hoh et al., 1991, 1993) possess both similar and dissimilarfeatures to the 3-D connexon reconstruction. An opening at
cytoplasmic surface are common features. Other features incommon include the protrusions (height modulations) risingabove the membrane on the extracellular side, which mayindicate that the contact surface between connexons inapposing membranes is not flat. Hoh et al. (1993) suggestedthat two connexons may dock in the same fashion as in-termeshing cogs. This hypothesis requires that apposingconnexons be rotated 300 with respect to each other suchthat the peaks on one connexon fit into the valleys of theother connexon. Given the ionically tight interface createdbetween connexons in the assembled intercellular channel,it seems unlikely that the connexons interact at the tips ofthe protrusions, as this would result in a palisade of molec-ular gaps corresponding to the aligned valleys at the con-nexon/connexon interface. Our hemichannel structure pre-sents tantalizing evidence for the intermeshing cogs modelof connexon-connexon interaction.One important dissimilarity between the 3-D map and the
AFM images was the channel pore diameter. AFM imagesprovide a channel pore diameter of 38 A at the extracellularside, which is about twice the diameter (--16 A) in theconnexon reconstruction. Hoh et al. (1993) offered an ex-planation that the AFM tip might have pushed out certainparts of the protein, causing an artificial broadening of thechannel pore.
Connexin secondary structure in the connexon
The x-ray diffraction analysis by Tibbitts et al. (1990)indicated that there was more a-helical content than couldbe accounted for by four transmembrane helices. The Eland E2 loops are thought to be as rigid as the transmem-brane domain (Hoh et al., 1993; Sosinsky, 1992). Hence, theextracellular region is visible with the crystallographic av-eraging used. Each extracellular protrusion may thereforeinclude an extension of the intramembrane a-helical struc-ture (Tibbitts et al., 1990). As reviewed in the introduction,mutagenesis studies have suggested that the extracellularloops contain disulfide-bonded f3-sheet conformation (Footeand Nicholson, 1997), which would be expected to act as arigid domain. Even though the transmembrane structure hasnot been implicated in determining the compatibility ofdocking connexons, it may contribute to the structure of thechannel wall in the gap region of the channel. However, itis possible that the occurrence of a conformational changeupon junctional splitting may give rise to the observedsixfold protrusions seen in both chemically split or mechan-ically split junctions (Hoh et al., 1993).
It is known that hydrogen bonding plays a substantiverole in connexon pairing because urea is required to bio-chemically split connexon pairs (Manjunath et al., 1984;Ghoshroy et al., 1995). The percentage of hydrophobicamino acids in the E2 loop is high, and so hydrophobicinteractions are involved in the extracellular connexon pair-ing. Ghoshroy et al. (1995) also provide evidence that
the extracellular surface and little structural detail at the
542 Biophysical Journal
divalent cations contribute to stabilizing the docking of
Perkins et al. Connexon 3-D Structure 543
apposing connexons. The availability of a 3-D reconstruc-tion of this key appositional interface will permit modelingof the protein-protein interactions involved in the cell-cellinteractions at gap junctional connexon interfaces.
We express our appreciation to Mark Ellisman for the use of his excellentfacilities. We are grateful for the programs and advice given by Terry Frey,Stephan Lamont, David Morgan, and Vinzenz Unger.
This work was funded by National Institutes of Health Grants GM43217(to G.E.S.) and GM 18974 (to D.A.G.). Some of the work included here wasconducted at the National Center for Microscopy and Imaging Research atSan Diego, which is supported by National Institutes of Health GrantRR04050 to Mark H. Ellisman.
REFERENCES
Agard, D. A. 1983. A least-squares method for determining structurefactors in three-dimensional tilted-view reconstructions. J. Mol. Biol.167:849-852.
Amos, L. A., R. Henderson, and P. N. T. Unwin. 1982. Three-dimensionalstructure determination by electron microscopy of two-dimensionalcrystals. Prog. Biophys. Mol. Biol. 39:183-231.
Baker, T. S., D. L. D. Caspar, C. J. Hollingshead, and D. A. Goodenough.1983. Gap junction structures. IV. Asymmetric features revealed bylow-irradiation microscopy. J. Cell Biol. 96:204-216.
Baker, T. S., G. E. Sosinsky, D. L. D. Caspar, C. Gall, and D. A.Goodenough. 1985. Gap junction structures VII. Analysis of connexonimages obtained with cationic and anionic negative stains. J. Mol. Biol.184:81-98.
Bennett, M. V. L., L. C. Barrio, T. A. Bargiello, D. C. Spray, E. Hertzberg,and J. C. Saez. 1991. Gap junctions: new tools, new answers, newquestions. Neuron. 6:305-320.
Bennett, M. V. L., and D. A. Goodenough. 1978. Gap junctions, electroniccoupling, and intercellular communications. Neurosci. Res. Prog. Bull.16:375-486.
Beyer, E. C., D. L. Paul, and D. A. Goodenough. 1987. Connexin43: aprotein from rat heart homologous to a gap junction protein from liver.J. Cell Biol. 105:2621-2629.
Beyer, E. C., D. L. Paul, and D. A. Goodenough. 1990. Connexin familyof gap junction proteins. J. Membr. Biol. 116:187-194.
Born, M., and E. Wolf. 1980. Principles of Optics. Pergamon Press,Oxford.
Bottcher, B., P. Graber, and E. J. Boekema. 1992. The structure ofphotosystem I from the thermophilic cyanobacterium Synechococcus sp.determined by electron microsopy of two-dimensional crystals. Biochim.Biophys. Acta. 1100: 125-136.
Cascio, M., E. Gogol, and B. A. Wallace. 1990. The secondary structure ofgap junctions. Influence of isolation methods and proteolysis. J. Biol.Chem. 265:2358-2364.
Cascio, M., N. M. Kumar, R. Safarik, and N. B. Gilula. 1995. Physicalcharacterization of gap junction membrane connexons (hemi-channels)isolated from rat liver. J. Biol. Chem. 270:18643-18648.
Caspar, D. L. D., G. E. Sosinsky, T. T. Tibbitts, W. C. Phillips, and D. A.Goodenough. 1988. Gap junction structure. In Gap Junctions. E. L.Hertzberg and R. G. Johnson, editors. Alan R. Liss, Inc., New York.117-133.
Collaborative Computational Project 4. 1994. The CCP4 suite: programsfor protein crystallography. Acta Crystallogr. D. 50:760-763.
Crowther, R. A., R. Henderson, and J. M. Smith. 1996. MRC imageprocessing programs. J. Struct. Biol. 116:9-16.
Dahl, G., E. Levine, C. Rabadan-Diehl, and R. Werner. 1991. Cell/cellchannel formation involves disulfide exchange. Eur. J. Biochem. 197:141-144.
Dahl, G., R. Werner, E. Levine, and C. Rabadan-Diehl. 1992. Mutationalanalysis of gap junction formation. Biophys. J. (Discussions) 62:187-195.
Dermietzel, R., T. K. Hwang, and D. S. Spray. 1990. The gap junctionfamily: structure, function, and chemistry. Anat. Embryol. 182:517-528.
DeVries, S. H., and E. A. Schwartz. 1992. Hemi-gap-junction channels insolitary horizontal cells of the catfish retina. J. Physiol. 445:201-230.
Downing, K. H. 1991. Spot-scan imaging in transmission electron micros-copy. Science. 251:53-59.
Ebihara, L. 1996. Xenopus connexin38 forms hemi-gap-junctional chan-nels in the nonjunctional plasma membrane of Xenopus oocytes. Bio-phys. J. 71:742-748.
Ebihara, L., V. M. Berthoud, and E. C. Beyer. 1995. Distinct behavior ofconnexin56 and connexin46 gap junctional channels can be predictedfrom the behavior of their hemi-gap-junctional channels. Biophys. J.68:1796-1803.
Ebihara, L., and E. Steiner. 1993. Properties of a nonjunctional currentexpressed from a rat connexin46 cDNA in Xenopus oocytes. J. Gen.Physiol. 102:59-74.
Evans, W. H. 1994. Assembly of gap junction intercellular communicationchannels. Biochem. Soc. Trans. 22:788-792.
Fallon, R. F., and D. A. Goodenough. 1981. Five-hour half-life of mouseliver gap junction protein. J. Cell Biol. 90:521-526.
Foote, C. I., and B. J. Nicholson. 1997. Determination of disulfide bondpatterns in the extracellular docking domains of gap junctions. J. CellBiol., submitted.
Fraser, S. E., C. R. Green, H. R. Bode, and N. B. Gilula. 1987. Selectivedisruption of gap junctional communication interferes with a patterningprocess in hydra. Science. 237:49-55.
Ghoshroy, S., D. A. Goodenough, G. E. and Sosinsky. 1995. Preparation,characterization, and structure of half gap junctional layers split withurea and EGTA. J. Membr. Biol. 146:15-28.
Gianazza, E., R. Frattini, S. Michelagnoli, M. Cassinotti, and C. R. Sirtori.1992. Isoelectric focusing and immunoblotting of the platelet membraneglycoprotein complex IIb. IIIA following urea solubilization. Electro-phoresis. 13:781-784.
Gilula, N. B., 0. R. Reeves, and A. Steinbach. 1972. Metabolic coupling,ionic coupling, and cell contacts. Nature. 235:262-265.
Gogol, E., and N. Unwin. 1988. Organization of connexons in isolated ratliver gap junctions. Biophys. J. 54:105-112.
Goodenough, D. A., J. A. Goliger, and D. L. Paul. 1996. Connexins,connexons, and intercellular communication. Annu. Rev. Biochem. 65:475-502.
Goodenough, D. A., D. L. Paul, and L. Jesaitis. 1988. Topological distri-bution of two connexin32 antigenic sites in intact and split rodenthepatocyte gap junctions. J. Cell Biol. 107:1817-1824.
Gupta, V. K., V. M. Berthoud, N. Atal, J. A. Jarillo, L. C. Barrio, and E.C. Beyer. 1994. Bovine connexin44, a lens gap junction protein: mo-lecular cloning, immunological characterization, and functional expres-sion. Invest. Ophthalamol. & Visual Sci. 35:3747-3758.
Harris, A. 1997. Connexin structure/function. Quart. Rev. Biophys., inpreparation.
Henderson, R., J. M. Baldwin, K. H. Downing, J. Lepault, and F. Zemlin.1986. Structure of purple membrane from Halobacterium halobium:recording, measurement and evaluation of electron micrographs at 3.5 Aresolution. Ultramicroscopy. 19:147-178.
Hertzberg, E. L., R. M. Disher, A. A. Tiller, Y. Zhou, and R. G. Cook.1988. Topology of the Mr 27,000 liver gap junction protein cytoplasmiclocalization of the amino- and carboxyl termini and a hydrophilic do-main which is protease hypersensitive. J. Bio. Chem. 265:2138-2147.
Hessler, D., S. J. Young, B. 0. Carragher, M. E. Martone, S. Lamont, M.Whittaker, R. A. Milligan, E. Masliah, J. Hinshaw, and M. H. Ellisman.1992. Programs for visualization in three-dimensional microscopy. Neu-roimage. 1:55-67.
Hoh, J. H., R. Lal, S. A. John, J.-P. Revel, and M. F. Arnsdorf. 1991.Atomic force microscopy and dissection of gap junctions. Science.235:1405-1408.
Hoh, J., G. E. Sosinsky, J.-P. Revel, and P. K. Hansma. 1993. Structure ofthe extracellular surface of the gap junction by atomic force microscopy.Biophys. J. 65:149-163.
Hooper, M. L., and J. H. Subak-Sharpe. 1981. Metabolic cooperationbetween cells. Int. Rev. Cytol. 69:45-104.
544 Biophysical Journal Volume 72 February 1997
Hurtley, S. M., and A. Helenius. 1989. Protein oligomerization in theendoplasmic reticulum. Annu. Rev. Cell Biol. 5:277-307.
Jiang, J. X., and D. A. Goodenough. 1996. Heteromeric connexons in lensgap junction channels. Proc. Natl. Acad. Sci. 3:1287-1291.
Karlsson, B., S. Hovmoller, H. Weiss, and K. Leonard. 1983. Structuralstudies of cytochrome reductase: subunit topography determined byelectron microscopy of membrane crystals of a subcomplex. J. Mol.Biol. 165:287-302.
Karrasch, S., D. Typke, T. Walz, M. Miller, G. Tsiotis, and A. Engel. 1996.Highly ordered two-dimensional crystals of photosystem I reactioncenter from Synechococcus sp.: functional and structural analyses.J. Mol. Bio. 262:336-348.
Laird, D. W. 1996. The life cycle of a connexin: Gap junction formation,removal, and degradation. J. Bioenerg. Biomembr. 28:311-318.
Makowski, L. 1988. X-Ray diffraction studies of gap junction structure.Adv. Cell Biol. 2:119-158.
Makowski, L., D. L. D. Caspar, W. C. Phillips, T. S. Baker, and D. A.Goodenough. 1984. Gap junctions structures VI. Variation and conser-vation in connexon conformation and packing. Biophys. J. 45:208-218.
Makowski, L., D. L. D. Caspar, W. C. Phillips, and D. A. Goodenough.1977. Gap junction structure II. Analysis of the X-ray diffraction data.J. Cell Biol. 74:629-645.
Manjunath, C. K., G. E. Going, and E. Page. 1984. Detergent sensitivityand splitting of isolated liver gap junctions. J. Membr. Biol. 78:147-155.
Meyer, R. A., D. W. Laird, J.-P. Revel, and R. G. Johnson. 1992. Inhibitionof gap junction and adherens junction assembly and connexin andN-CAM antibodies. J. Cell Biol. 119:179-189.
Milks, L. C., N. M. Kumar, R. Houghten, N. Unwin, and N. B. Gilula.1988. Topology of the 32-kd liver gap junction protein determined bysite-directed antibody localizations. EMBO J. 7:2967-2975.
Musil, L. M., and D. A. Goodenough. 1991. Biochemical analysis ofconnexin43 intracellular transport, phosphorylation, and assembly intogap junctional plaques. J. Cell Biol. 115:1357-1374.
Musil, L. M., and D. A. Goodenough. 1993. Multisubunit assembly of anintegral plasma membrane channel protein, gap junction connexin43,occurs after exit from the ER. Cell. 74:1065-1077.
Nicholson, B. J., D. B. Gros, S. B. H. Kent, L. E. Hood, and J.-P. Revel.1985. The Mr 28,000 gap junction proteins from rat heart and liver aredifferent but related. J. Bio. Chem. 260:6514-6517.
Paul, D. L., L. Ebihara, L. J. Takemoto, K. I. Swenson, and D. A.Goodenough. 1991. Connexin46, a novel lens gap junction protein,induces voltage-gated currents in nonjunctional plasma membrane ofXenopus oocytes. J. Cell Bio. 115:1077-1089.
Rachel, R., U. Jakubowski, R. Tietz, R. Hegerl, and W. Baumeister. 1986.Projected structure of the surface protein of Deinococcus radioduransdetermined to 8 A resolution by cryomicroscopy. Ultramicroscopy.20:305-316.
Revel, J.-P., B. J. Nicholson, and S. B. Yancy. 1985. Chemistry of gapjunctions. Annu. Rev. Physiol. 47:263-279.
Schmid, M., R. Dargahi, and M. Tam. 1993. SPECTRA: A system forprocessing electron images of crystals. Ultramicroscopy. 48:251-264.
Shaw, P. J., and G. J. Hills. 1981. Tilted specimen in the electronmicroscope: a simple specimen holder and the calculation of tilt anglesfor crystalline specimens. Micron. 12:279-281.
Sikerwar, S. S., K. H. Downing, and R. M. Glaeser. 1991. Three-dimensional structure of an invertebrate intercellular communicatingjunction. J. Struct. Biol. 106:255-263.
Sikerwar, S. S., and N. Unwin. 1988. Three-dimensional structure of gapjunctions in fragmented plasma membranes from rat liver. Biophys. J.54:113-119.
Sosinsky, G. E. 1992. Image analysis of gap junction structures. Electr.Microsc. Rev. 3:59-76.
Sosinsky, G. E. 1995. Mixing of connexins in gap junction membranechannels. Proc. Natl. Acad. Sci. 92:9210-9214.
Sosinsky, G. E. 1996. Molecular organization of gap junction membranechannels. J. Bioenerg. Biomembr. 28:297-310.
Sosinsky, G. E., J. C. Jesior, D. L. D. Caspar, and D. A. Goodenough.1988. Gap junction structures VIII. Membrane cross-sections. Biophys.J. 53:709-722.
Stauffer, K. A. 1995. The gap junction protein j3,-connexin (connexin32)and f32-connexin (connexin26) can form heteromeric hemichannels. J.Biol. Chem. 270:6768-6772.
Stevens, J. K., L. R. Mills, and J. E. Trogadis, editors. 1994. Three-Dimensional Confocal Microscopy: Volume Investigation of BiologicalSystems. Academic Press, San Diego.
Tibbitts, T. T., D. L. D. Caspar, W. C. Phillips, and D. A. Goodenough.1990. Diffraction diagnosis of protein folding in gap junction connex-ons. Biophys. J. 57:1025-1036.
Unger, V. M., and G. F. X. Schertler. 1995. Low resolution structure ofbovine rhodopsin determined by electron cryo-microscopy. Biophys. J.68:1776-1786.
Unwin, N. 1986. Is there a common design for cell membrane channels?Nature. 323:12-13.
Unwin, P. N. T., and P. D. Ennis. 1984. Two configurations of a channel-forming membrane protein. Nature. 307:609-613.
Unwin, P. N. T., and A. Klug. 1974. Electron microscopy of stacked diskaggregate of tobacco mosaic virus protein II. The influence of electronirradiation on the stain distribution. J. Mol. Biol. 262:336-348.
Unwin, P. N. T., and G. Zampighi. 1980. Structure of the junction betweencommunicating cells. Nature. 283:545-549.
Valpuesta, J. M., R. Henderson, and T. G. Frey. 1990. Electron cryo-microscopic analysis of crystalline cytochrome oxidase. J. Mol. Biol.214:237-251.
White, T. W., R. Bruzzone, S. Wolfram, D. L. Paul, and D. A. Good-enough. 1994. Selective interactions among multiple connexin proteinsexpressed in the vertebrate lens: the second extracellular domain is adeterminant of compatibility between connexins. J. Cell Biol. 125:879-892.
White, T., D. Paul, D. A. Goodenough, and R. Bruzzone. 1995. Functionalanalysis of selective interactions among rodent connexins. Mol. Biol.Cell. 6:459-70.
Yancy, S. B., S. A. John, R. Lal, B. J. Austin, and J.-P. Revel. 1989. The43-kD polypeptide of heart gap junctions: immunolocalization, topol-ogy, and functional domains. J. Cell Biol. 108:2241-2254.
Yeager, M., and N. B. Gilula. 1992. Membrane topology and quaternarystructure of cardiac gap junction ion channels. J. Mol. Biol. 223:929-948.
Zhang, J.-T., and B. J. Nicholson. 1989. Sequence and tissue distribution ofa second protein of hepatic gap junctions, Cx26, as deduced from itscDNA. J. Cell Biol. 109:3391-3401.
Zimmer, D. B., C. R. Green, W. H. Evans, and N. B. Gilula 1987.Topological analysis of the major protein in isolated intact rat liver gapjunctions and gap junction-derived single membrane structures. J. Biol.Chem. 262:7751-7763.