HAL Id: tel-01253253 https://hal.archives-ouvertes.fr/tel-01253253 Submitted on 9 Jan 2016 HAL is a multi-disciplinary open access archive for the deposit and dissemination of sci- entific research documents, whether they are pub- lished or not. The documents may come from teaching and research institutions in France or abroad, or from public or private research centers. L’archive ouverte pluridisciplinaire HAL, est destinée au dépôt et à la diffusion de documents scientifiques de niveau recherche, publiés ou non, émanant des établissements d’enseignement et de recherche français ou étrangers, des laboratoires publics ou privés. Copyright THREE ESSAYS ON OPERATING SEGMENT DISCLOSURE Rucsandra Moldovan To cite this version: Rucsandra Moldovan. THREE ESSAYS ON OPERATING SEGMENT DISCLOSURE. Business administration. ESSEC Business School, 2015. English. tel-01253253
Transcript
HAL Id: tel-01253253https://hal.archives-ouvertes.fr/tel-01253253
Submitted on 9 Jan 2016
HAL is a multi-disciplinary open accessarchive for the deposit and dissemination of sci-entific research documents, whether they are pub-lished or not. The documents may come fromteaching and research institutions in France orabroad, or from public or private research centers.
L’archive ouverte pluridisciplinaire HAL, estdestinée au dépôt et à la diffusion de documentsscientifiques de niveau recherche, publiés ou non,émanant des établissements d’enseignement et derecherche français ou étrangers, des laboratoirespublics ou privés.
Copyright
THREE ESSAYS ON OPERATING SEGMENTDISCLOSURERucsandra Moldovan
To cite this version:Rucsandra Moldovan. THREE ESSAYS ON OPERATING SEGMENT DISCLOSURE. Businessadministration. ESSEC Business School, 2015. English. �tel-01253253�
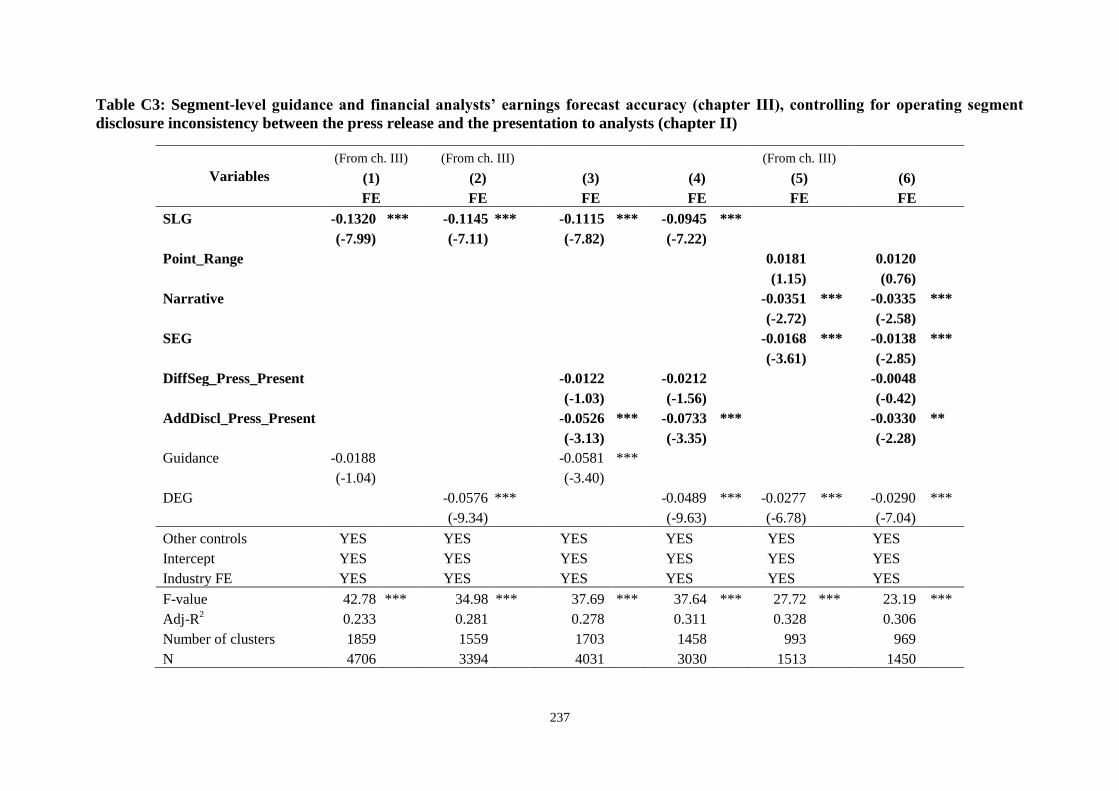
This table presents Pearson (above diagonal) and Spearman correlation coefficients (below diagonal) for the variables used in the determinants analyses. See variable
definitions in appendix I.A. The sample contains 270 firm-observations and is described in table I.2. Statistical significance is based on two-sided t-tests and is indicated as
This table presents Pearson (above diagonal) and Spearman correlation coefficients (below diagonal) for the variables used in the analyst earnings forecast accuracy analyses.
See variable definitions in appendix I.A. The sample contains 7929 firm-analyst observations. Statistical significance is based on two-sided t-tests and is indicated as follows:
*** p-value<0.01; ** p-value<0.05; * p-value<0.1.
108
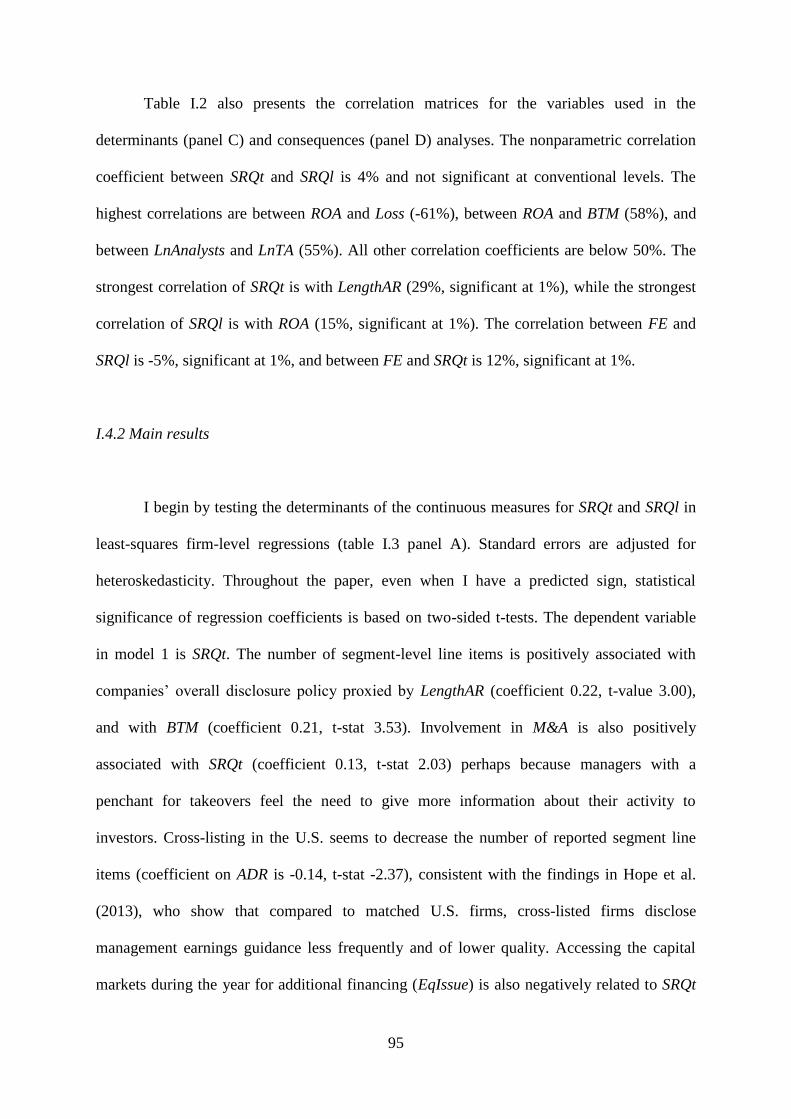
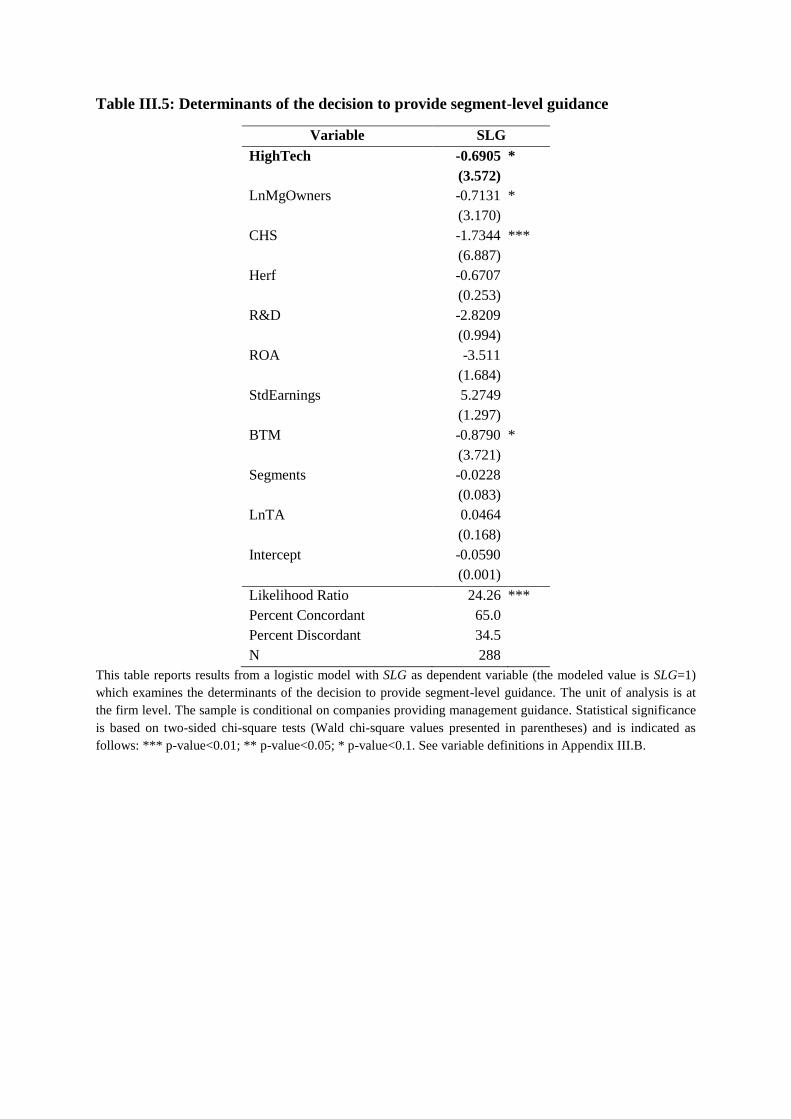
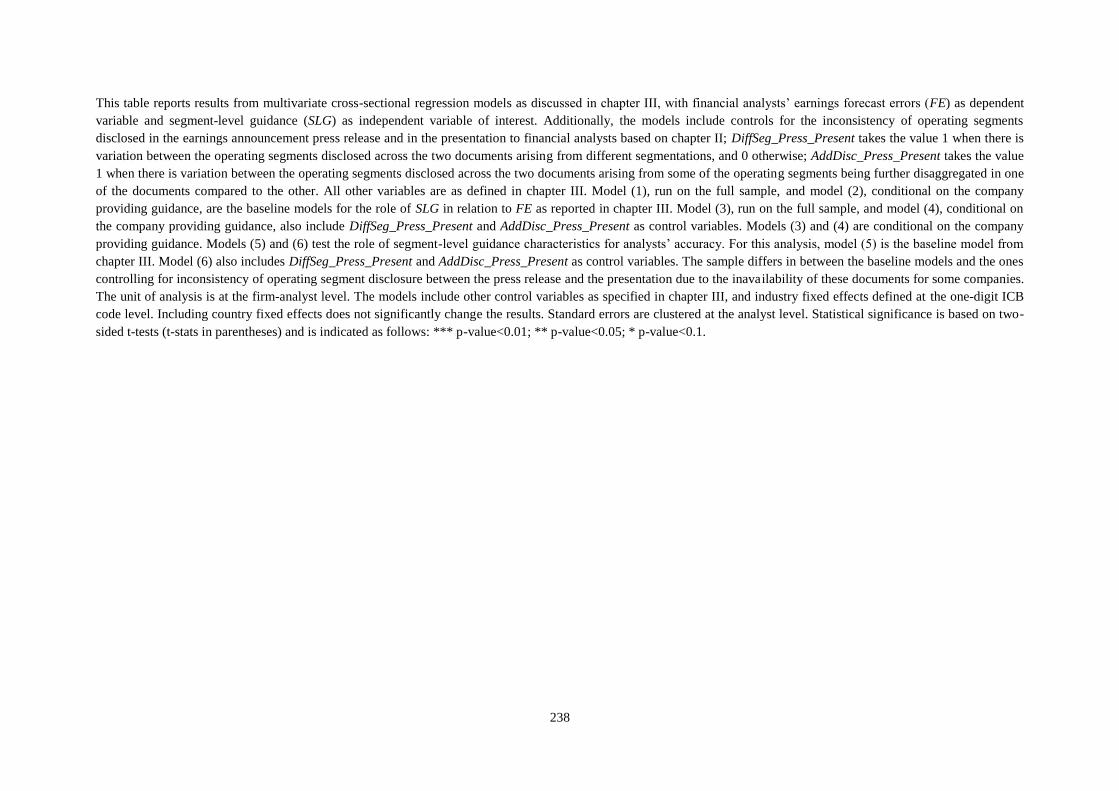
Table I.3: Tests of determinants of segment disclosure quantity (SRQt) and segment
disclosure quality (SRQl)
Panel A: Least-squares analyses for continuous dependent variables
Variables
(1) (2)
SRQt SRQl
Coeff t-stat Coeff t-stat
Herf -0.202 (-0.88) 0.152 (1.55)
R&D -0.455 (-0.87) -0.215 (-1.01)
LnMgOwners -0.058 (-1.03) 0.023 (0.82)
ROA -0.494 (-1.08) 0.513** (2.16)
Loss -0.077 (-0.96) -0.079* (-1.96)
M&A 0.127** (2.03) 0.107*** (2.67)
Big4 0.102 (0.93) 0.106*** (3.51)
LengthAR 0.222*** (3.00) 0.065 (1.16)
ADR -0.138** (-2.37) -0.047 (-1.02)
EqIssue -0.154** (-2.01) -0.028 (-0.86)
BTM 0.205*** (3.53) 0.095* (1.93)
LnTA 0.022 (0.99) -0.020 (-1.48)
Intercept 0.694 (1.25) 0.714** (2.07)
Industry FE YES YES
F-value 3.10*** 3.94***
Adj-R2 0.135 0.179
N 270 270
This table reports results from OLS cross-sectional multivariate models with SRQt as continuous dependent
variable in model (1) and SRQl as continuous dependent variable in model (2). The models include industry
fixed effects. Standard errors are adjusted for heteroskedasticity. The sample contains 270 firm-observations.
Statistical significance is based on two-sided t-tests (t-stats in parentheses) and is indicated as follows: *** p-
value<0.01; ** p-value<0.05; * p-value<0.1. See variable definitions in appendix I.A.
109
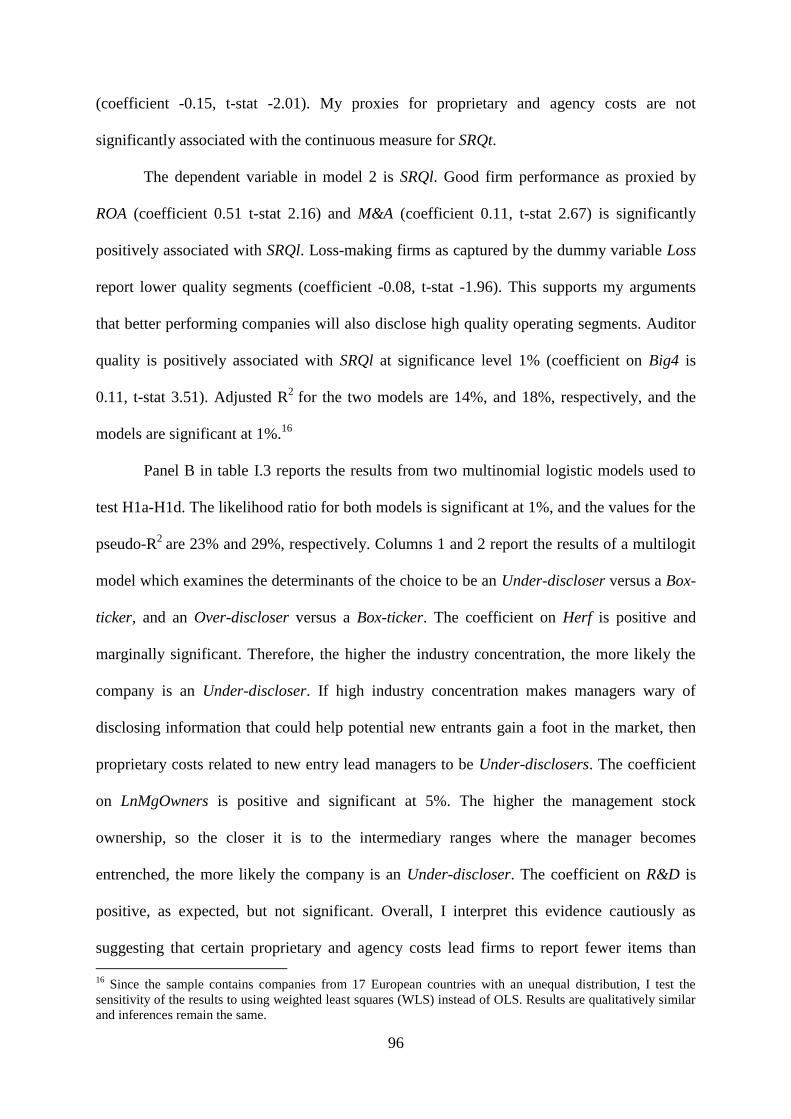
Panel B: Multinomial logistic analyses for deviations from average SRQt and from average SRQl
Variables
(1) (2) (3) (4)
Under-disclosers vs. Box-tickers Over-disclosers vs. Box-tickers LowQl vs. AvgQl HighQl vs. AvgQl
N 270 270 This table reports results from two multinomial logit regressions. For columns (1) and (2), the dependent variable is ordinal and based on whether the company belongs to one
of the three groups of SRQt. Firms in the bottom quartile of SRQt are classified as Under-disclosers, those in the top quartile are classified as Over-disclosers, and those in the
middle two quartiles are classified as the benchmark group (Box-tickers). Column (1) presents the results for a model predicting the likelihood that a company will be in the
Under-disclosers group, while column (2) presents the results for a model predicting the likelihood that a company will be in the Over-disclosers group. For columns (3) and
(4), the dependent variable is ordinal and based on whether the company belongs to one of the three groups of SRQl. Firms in the bottom quartile of SRQl are classified as
LowQl, those in the top quartile are classified as HighQl, and those in the middle two quartiles are classified as the benchmark group (AvgQl). Column (3) presents the results
for a model predicting the likelihood that a company will be in the LowQl group, while model (4) presents the results for a model predicting the likelihood that a company
110
will be in the HighQl group. The models include industry fixed effects. The sample contains 270 firm-observations. Statistical significance is based on two-sided t-tests (t-
stats in parentheses) and is indicated as follows: *** p-value<0.01; ** p-value<0.05; * p-value<0.1. See variable definitions in appendix I.A.
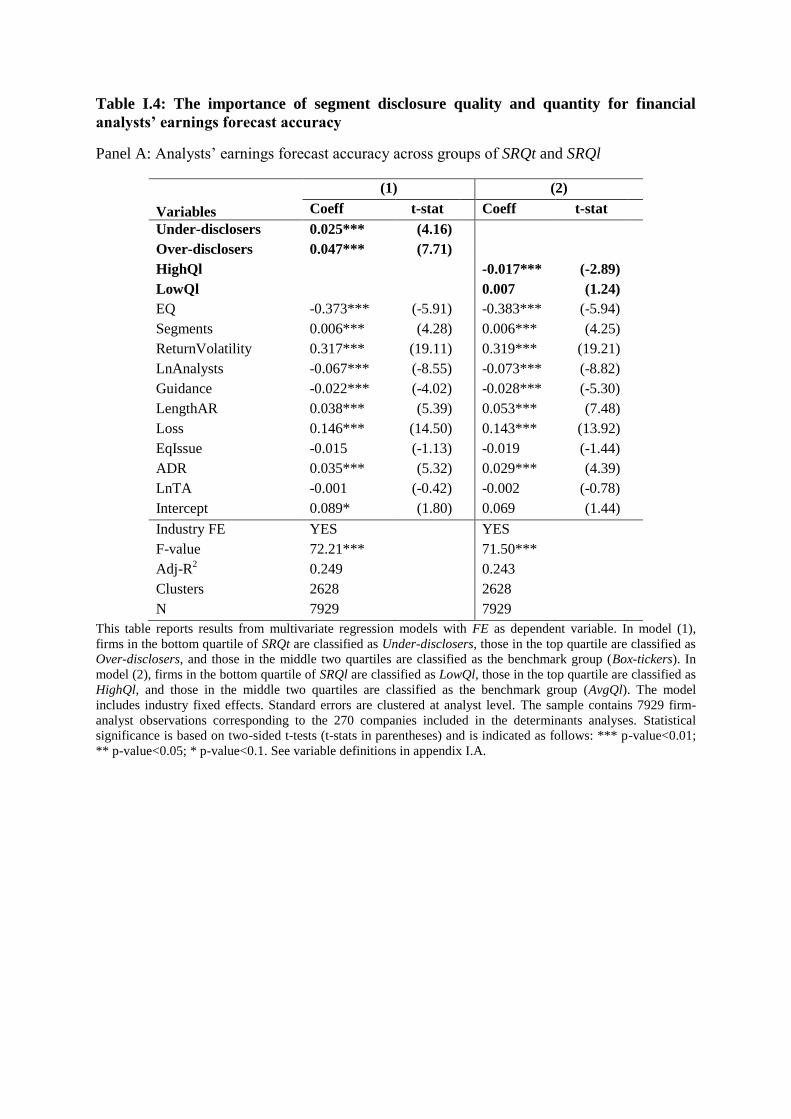
Table I.4: The importance of segment disclosure quality and quantity for financial
analysts’ earnings forecast accuracy
Panel A: Analysts’ earnings forecast accuracy across groups of SRQt and SRQl
by testing the consequences of inconsistency for the tasks performed by a specific category of
users – financial analysts.
By considering disclosures made in an array of documents, this paper takes a step
forward towards improving our understanding of managers’ overall disclosure strategy and
the effects that this strategy has. Besides the financial statements, managers use multiple
other outlets to communicate financial information to capital market participants. I provide
evidence on the role that a characteristic of financial information disclosed across multiple
documents has and how users assess it, which enhances our understanding of the role of
accounting disclosures and the characteristics that make accounting disclosure useful.
The next section provides background information on segment reporting requirements
under IFRS and U.S. GAAP and reviews the booming accounting disclosure characteristics
literature. Section 3 develops the hypotheses. Section 4 describes the sample, research design,
124
and variable measurement. Section 5 discusses the main empirical results and additional
analyses, while section 6 provides a discussion of the robustness tests. Section 7 concludes.
II.2 Institutional background and literature review
Financial analysts and the investor community have expressed their dissatisfaction
with segment reporting over and over again, on both sides of the Atlantic. In 1997, the FASB
replaced SFAS 14 with SFAS 131 following pressures from U.S. financial analysts
(Herrmann & Thomas 2000). Internationally, the IASB has converged segment reporting
under IFRS with segment reporting under U.S. GAAP by issuing IFRS 8 in 2006 (IASB,
2006a). Both SFAS 131 and IFRS 8 require the management approach to segment reporting
which aligns external segment reporting with firms’ internal organization for operating
decision purposes. Operating segments are defined as components of an enterprise (1) that
engage in business activities earning revenues and incurring expenses, (2) that are regularly
reviewed by management, and (3) for which discrete financial information is available. The
basis of segmentation could be products and services, geographic area, legal entity, customer
type, or another basis as long as it is consistent with the internal structure of the firm.
Although supposed to provide more decision-useful information, problems in the way these
standards are applied continue to generate criticism from investors (ESMA, 2011).
One of the main concerns is the aggregation of operating segments into reportable
segments: “ESMA observed that disclosures on aggregation of segments were explicitly
mentioned by 29% of issuers only, although IFRS 8.22(a) refers to this piece of information
as an example that contributes to helping investors understand the entity’s basis of
organization. The level of subjectivity in deciding how aggregation should be applied may
lead to diversity in practice” (ESMA 2011). Moreover, investors and analysts’ views reflect
125
these problems in implementation of segment reporting standards: “the investor community is
generally of the view that the information provided [under IFRS 8] does not provide
meaningful information as it is not reported at a sufficiently low level of granularity” (ESMA
2011).
In this paper, I focus on a set of disclosure outlets and integrate the disclosure made
across the documents considered.5 Recent literature has examined accounting and financial
information disclosure in various outlets from many perspectives. For example, Lang &
Lundholm (2000) examine disclosure frequency as it relates to equity issuance; Doyle &
Magilke (2009) investigate the strategic versus broad dissemination reasons behind earnings
announcement timing; Tang (2014) looks at management guidance consistency over time. A
closely related stream of literature examines the language used in annual reports and public
corporate documents for characteristics such as readability (e.g., Li 2008; 2010) and tone –
(e.g., Davis & Tama-Sweet 2012). Most often, however, disclosure outlets are examined in
isolation from each other. There are a few notable exceptions. Li (2013) examines repetitive
disclosures between the MD&A and the notes. Myers, Scholz & Sharp (2013) examine the
choice of outlet for restatements.
Although regulators have long mentioned inconsistent disclosures as one of the
signals they pick up in their review process, this particular characteristic of disclosure has
received only limited attention in the accounting literature in a survey-based setting. Street,
Nichols & Gray (2000) and Nichols, Street & Cereola (2012) compare the segment note to
the MD&A and provide survey evidence that suggests improved consistency between the two
parts of the annual report upon adoption of SFAS 131 and IFRS 8, respectively.
5 Davis & Tama-Sweet (2012) and Mayew (2012) define a disclosure outlet as “any medium of expression or
publication through which a firm describes its economic condition.” There are many disclosure outlets firms use
- press releases, presentations to analysts and investors, annual reports, marketing materials, corporate website,
social media.
126
II.3 Hypotheses development
Inconsistency across documents means that there is variation in disclosure on the
same topic in different documents issued by the same firm and referring to the same fiscal
period. Inconsistency as a characteristic of disclosures made by management has been studied
previously from a time-series perspective. Tang (2014) examines the regularity, i.e.,
consistency, with which managers provide guidance across years. Differently, my paper
investigates the irregularity, or variation, in information disclosed cross-sectionally, i.e.,
across documents issued by the same company during one fiscal period. I choose to examine
operating segment disclosures since I must necessarily restrict the focus of my investigation
to one topic and since this is primarily a disclosure issue for companies, rather than a
recognition or measurement one (Nichols et al., 2012). Segment information is also important
to capital market participants since it allows investors and financial analysts to understand the
sources of consolidated earnings and the diversification strategy of the management.
Moreover, given the management approach principle that regulates the disclosure of segment
information in the financial statements and aligns external reporting with the internal
organization of the firm, there is no a priori reason to expect variation in the operating
segments disclosed across different documents that refer to the same fiscal period. In other
words, operating segment disclosure should a priori be consistent across the set of documents
considered.
Prior research suggests that receiving consistent information from various sources is
important for investors. Li (2013) finds that repetitive, and thus consistent, disclosures in the
financial statement notes and the MD&A are informative to investors. Her findings are
explained by communication theories which suggest that using repetitive communication
increases the credibility of the information transferred (e.g., Stephan, Stephan, & Gudykunst,
127
1999). Therefore, in light of the evidence and discussion in Li (2013) and based on the
alignment between externally-reported operating segments and internal organization, I
assume that consistency is the benchmark disclosure behavior.
There is ample evidence on the importance of segment reporting for analysts and
investors’ decision-making. Segment earnings have predictive power for future consolidated
earnings (Collins, 1976; Kinney Jr., 1971) and segment revenue is useful for investors’
evaluation of firms’ growth prospects incremental to consolidated data (Tse, 1989). Post-
SFAS 131 segment reporting has more predictive ability for consolidated earnings (Behn et
al., 2002), has improved geographic segment disclosure that reduced the mispricing of
foreign earnings (Hope et al., 2008a), and for companies that no longer disclose geographic
segment earnings after SFAS 131 analysts’ forecasting abilities are not impaired (Hope et al.,
2006). Reporting more segments under SFAS 131 improves forecast consensus
(Venkataraman, 2001; Berger & Hann, 2003), but reliance on publicly available segment
information may in fact increase the uncertainty in analysts’ forecasts (Botosan & Stanford,
2005).
Financial analysts are important and sophisticated users of financial information
(Bradshaw, 2009, 2011). I choose them as subjects for testing the consequences of
inconsistent disclosures for two main reasons. First, they are the users of accounting and
financial information most likely to look at and pay attention to many, if not all, of the
disclosure outlets that companies use, including the whole range of documents considered in
this paper. Even more so since, for example, the presentation during the earnings
announcement conference call is specifically designed for direct interaction between top
management and analysts (Hollander et al., 2010). For each company covered, the analyst has
access to numerous sources of information, including security prices, firm-specific financial
and operating information, industry data, and macroeconomic factors (Bradshaw, 2011).
128
Firm-specific information also comes from various sources – public regulated or unregulated
documents issued by the company, the business community and press, information disclosed
by competitors, or private interactions with the management (Soltes, 2014). The analyst’s job
is to analyze (Bradshaw, 2011) all that information, to put together the “puzzle” that a
company is, and write a report detailing his conclusions. In the case of multi-segment firms,
the “puzzle” is complicated by non-homogenous operations, e.g., across several industries
and/or geographical regions, the performance, risks, and synergies of which the analyst must
understand and assess before drawing conclusions. From this perspective, variation in the
operating segments disclosed in different documents, i.e., sources of information, creates
difficulties for analysts when they piece together the image of the company, requiring more
effort and increased processing costs. In turn, these difficulties translate into lower
forecasting accuracy.
Segment reporting under the management approach does little to confine the way in
which operating segments can be reported. The standard contains quantitative threshold rules
for reporting an operating segment (IASB, 2006a), and the interpretive guidelines mention an
upper limit of ten reportable operating segments (IASB, 2006b). However, the standard
explicitly allows management to disregard such guidelines in the interest of providing
information that is useful to investors. Given this emphasis, regulators and users expect
operating segments disclosed in the notes to financial statements to reflect the internal
organization of the company and to be the same as segments disclosed elsewhere. For this
reason, as part of their review process, the SEC and ESMA go through a range of disclosure
outlets and issue comment letters when there is a mismatch or inconsistency between the
operating segments reported in the notes and the information provided through other
channels, along with requiring the internal reports of the firm (Dixon, 2011; ESMA, 2011;
Johnson, 2010; Pippin, 2009).
129
Two theories provide competing arguments for whether inconsistent disclosure has an
effect on financial analysts. The characteristics of disclosure are irrelevant under the efficient
markets hypothesis. Under this hypothesis, the ways in which information is presented, its
features, or location are irrelevant because there are no costs for users to obtain the data and
extract relevant information. The incomplete revelation hypothesis (Bloomfield, 2002),
however, takes into consideration that there are costs to obtaining data and processing
information and, as a result, the statistics (i.e., useful facts) that are more costly to extract
from public data are less likely to be revealed by market prices. According to this hypothesis,
the costs to extracting and processing data comprise costs necessary to identify and collect
relevant data, and costs generated by increased cognitive difficulty to extract information
from collected data. The main result that flows from the incomplete revelation hypothesis is
that disclosure characteristics or features indeed matter for the users of financial information
because the way in which information is disclosed could make it easier or harder to collect,
process, and interpret data.
Empirical research in experimental and archival settings finds supporting evidence.
For example, using the readability measures introduced to the accounting literature in Li
(2008), Lehavy, Li, & Merkley (2011) find that lower readability scores for the annual report
are significantly associated with lower analyst earnings forecast accuracy. Maines &
McDaniel (2000) use students to proxy for nonprofessional investors and find that disclosure
presentation format matters for their investment decisions. Still in an experimental setting,
Bloomfield, Hodge, Hopkins, & Rennekamp (2015) find that the decision-making of credit
analysts, which are conceivably at least as sophisticated as equity analysts, is influenced by
the disaggregation and location of disclosure in the financial statements.
Based on the incomplete revelation hypothesis, I predict that disclosure inconsistency
has an effect on financial analysts’ forecast accuracy.
130
H1a. Inconsistent segment disclosure across documents affects the magnitude of
analysts’ forecast error.
The direction in which inconsistent disclosure affects financial analysts’ accuracy,
i.e., how inconsistency affects analysts’ accuracy, could depend, however, on the “source” of
inconsistency in disclosure. On the one hand, inconsistency could arise because some of the
operating segments are further disaggregated in some documents. In other words, there is
variation in the operating segments disclosed across the set of documents that the company
publishes, but the way in which the disclosure is made makes it clear how the operating
segments disclosed in each document fit in with the operating segments disclosed in the other
documents. As a result, although there is variation in the operating segments disclosed in the
set of documents, constructing the image of the company from these sources of information is
easy or comes at no additional costs. If the inconsistent disclosure of operating segments
arises from a further disaggregation of the segments in some documents presented such that it
is clear how the sets of disclosed operating segments map into each other, then this is more
information, easy to process or at no significant additional cost which helps analysts forecast
the earnings for that company and decreases their forecast error. If the disaggregated
operating segments in some of the documents add to analysts’ information set and the
operating segments across the documents are easy to piece back together to understand the
“puzzle” of the company, then this type of inconsistent disclosure brings additional
information that is easy to process and interpret, and therefore, I predict to lower analysts’
earnings forecast errors.
H1b. Inconsistent segment disclosure across documents that provides further
disaggregation of operating segments is negatively associated with the magnitude of
analysts’ forecast error.
131
On the other hand, variation in the operating segments disclosed across documents
could arise because the management discloses different sets of operating segments in
different documents such that it is not clear how they fit together and map into each other. I
expect such variation to increase processing and interpretation costs on the part of the analyst,
and increase their forecast error because the different segmentations disclosed make it harder
for the analyst to understand the internal organization of the company. Although the different
segmentation could be more information, I hypothesize that the net effect is dominated by
increased processing costs generated by more effort and time necessary to piece the
information together to arrive at the image of the company’s internal organization.
H1c. Inconsistent segment disclosure across documents that suggests a different
segmentation is positively associated with the magnitude of analysts’ forecast error.
II.4 Sample and research design
II.4.1 Sample and main variable measurement
This paper uses manually-collected data to assess inconsistencies in disclosures made
in four corporate documents: (1) the notes to financial statements, (2) the MD&A, (3) the
earnings announcement press release, and (4) the presentation to analysts during the earnings
announcement conference call. I start from all the firms included in STOXX 600 Europe at
31 December 2009. Since 2009 is the first year of mandatory adoption of the new IFRS 8 for
European companies there might be more inconsistent disclosure related to this year, which
132
makes testing my research questions using 2009 cross-sectional data all the more
meaningful.6
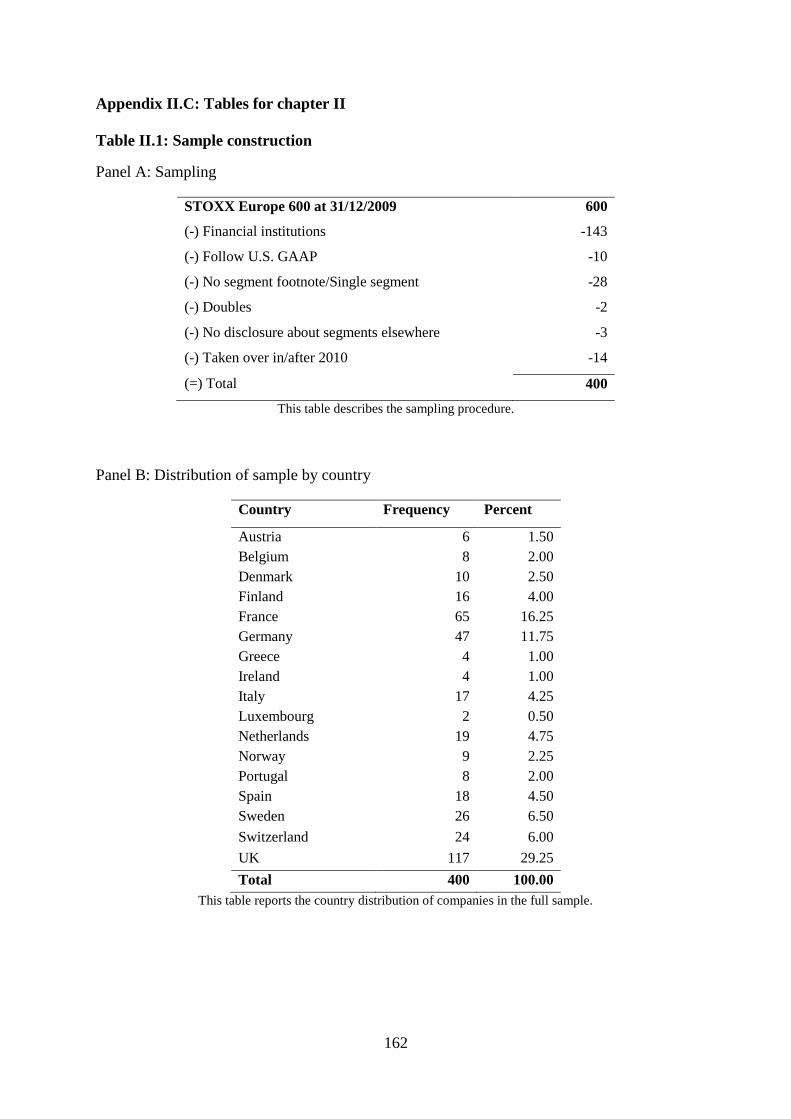
I eliminate 143 financial institutions, 10 firms that follow U.S. GAAP, 28 single-
segment firms, 14 firms that were acquired after 2010 and for which corporate documents are
no longer available, 2 companies counted twice in the market index, and 3 companies that do
not disclose segments except in the segment note.7 The final sample contains a cross-section
of 400 multi-segment European companies. Table II.1 details the sample construction (panel
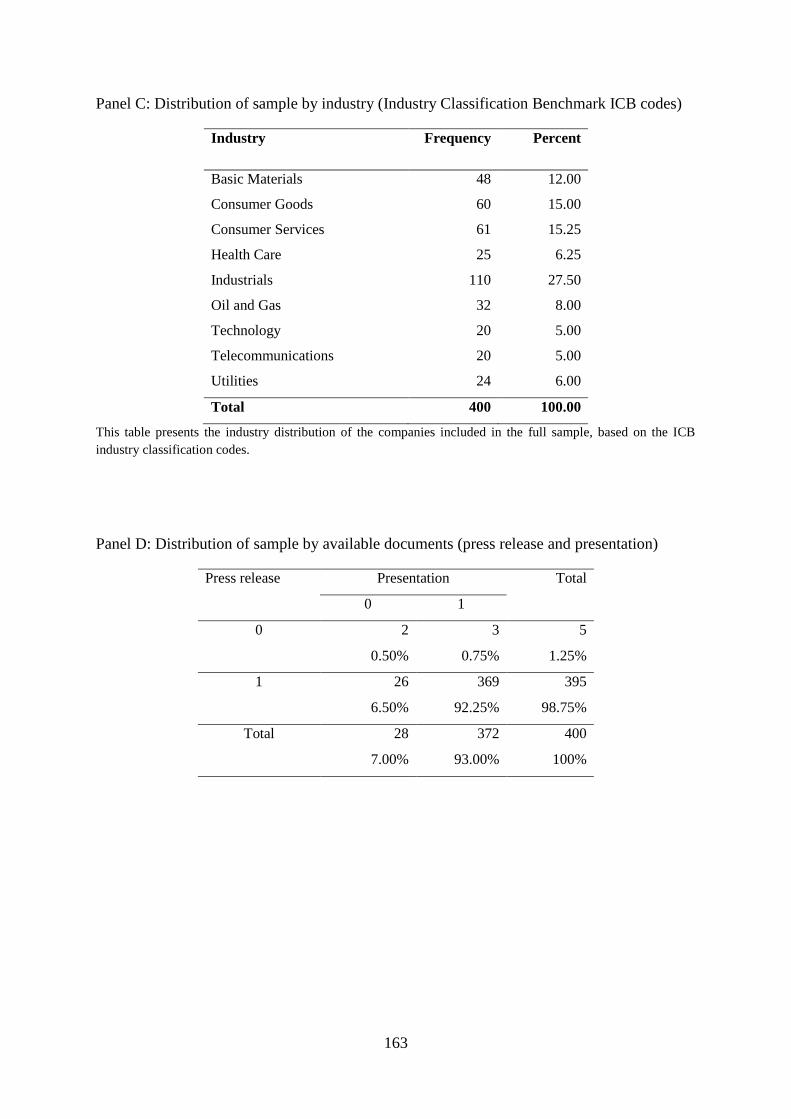
A) and composition by country and industry (panels B and C). As expected, firms from the
UK and France together make up 45% of the sample. Based on their primary ICB code,
27.5% of the sample firms are industrials, followed by consumer services (15.25%) and
consumer goods (15%).
I retrieve the annual reports, fiscal year-end earnings announcement press releases and
presentations to financial analysts during earnings announcement conference call from each
company’s investor relations website. Where the press release and/or presentation are not
available on the website, I contact the investor relations department disclosing the purpose of
this research and asking for the missing document(s).8 Panel D in table II.1 provides details
on the distribution of the sample by available documents. For five firms (1.25%) and 28 firms
(7%) the earnings announcement press release and the presentation to analysts, respectively,
are missing. The set of documents is complete for 369 of the 400 sample firms (92.25%).
6 In the US, SFAS 131 was adopted in 1997 making it much harder to get access to corporate documents from
that point in time and would involve using stale data. 7 Out of the 28 companies that disclose as single-segment in the note to financial statement, three present
disaggregations of their organization in at least one of the other documents that would qualify as operating
segments. Coding the three companies with 1 for Inconsistent and Inc_DiffSegmentation and the other 25 with 0
and adding them back to the sample leaves the results qualitatively unchanged. I do not tabulate this analysis
since I prefer to show the results in a more homogenous, and therefore more stringent, setting in which all
companies self-report as being diversified. 8 I contacted the investor relations department either via e-mail or via the inquiry forms on their websites during
October-November 2013. The rate of response is around 50%, with around 70% of the times actually receiving
the missing document. The two most common reasons for not providing a document are either that the company
does not keep a history of the documents older than a few years or that the company did not issue that document
at all.
133
In order to code the main variables, I first go to the segment note in the financial
statements and collect the number and names of the reported operating segments.9 Next, I go
through each of the other three documents to identify and collect the number and names of
the operating segments disclosed there. I perform this step in the following way: (1) I look for
the operating segments that are reported in the note, (2) I focus mainly on tables and graphs
to avoid any subjective interpretation of management’s narrative to the extent possible, and
(3) I only count an operating segment as mentioned in a document if it is accompanied by an
accounting number such as sales, operating profit, EBIT, capex etc. Considering that
management tends to disclose many operating details – especially in the MD&A –, this last
condition is meant to provide assurance that what I pick up from these documents are parts of
the company that would indeed qualify as operating segments.10,11
The Inconsistent variable is an indicator taking the value 1 if the operating segments
are disclosed inconsistently across the four documents and 0 otherwise. In other words,
Inconsistent is 1 if there is variation in the operating segments disclosed in the four
documents, and 0 if exactly the same operating segments are disclosed across the four
documents.12
Variation could, however, arise either because managers disclose different
segmentations in such a way that makes it difficult, if not impossible, to reconcile the
operating segments disclosed in different documents, or because they disaggregate the
operating segments in some documents compared to the others but do so in a way that makes
9 Using the “old” vocabulary in IAR 14R, this is the “primary” segmentation that companies disclose. At this
point, I also collect the “secondary” segmentation, if disclosed, and the entity-wide information provided based
on IFRS 8 requirements in the note. 10
Based on both IFRS 8 and SFAS 131, the main criteria for a part of the company to be recognized as an
operating segment is whether the chief operating decision maker regularly reviews accounting numbers of that
unit for resource allocation and performance evaluation purposes (FASB, 1997; IASB, 2006a). 11
My coding methodology is very similar to the one used by Street et al. (2000) and Nichols et al. (2012). 12
I also check whether the segments picked up from the MD&A, press release, and presentation and which are
different from the reported operating segments are not in fact disclosed as “secondary” operating segments (in
the lingering spirit of IAS 14R) or as entity-wide information in the segment reporting note. If this were the
case, then the information disclosed outside the note would in fact be consistent with the information in the
segment reporting note. However, this does not seem to be the case for any of the companies disclosing
inconsistently.
134
it clear how the segments can be reconciled. In the first case, presenting difficult-to-reconcile
segmentations in different documents increases the difficulty of putting the segments
“puzzle” back together to arrive at a coherent image of the company. In the second case,
however, the puzzle is easy to piece together and even though there is variation in the
operating segments disclosed, reconciling the operating segments is clear and easy.
Therefore, I refine the group of inconsistent disclosers based on whether inconsistency comes
from disclosing a different segmentation of the company (Inc_DiffSegmentation) or from
further disaggregation of operating segments (Inc_AddDisclosure). These two variables are
also binary. If a document is missing or does not mention any operating segments, I code
these variables based on the other existing documents. Appendix II.A provides two detailed
examples of the coding procedure. A research assistant coded this information a second time
following the instructions provided in advance. The agreement between the two sets of
variables coded is 96%. All cases of mismatch were re-coded a third time.
For the additional tests that I conduct, I code two more sets of indicator variables. The
first set of variables refers to whether segment information is missing from the press release
(MissingSegPressRelease), from the presentation to analysts (MissingSegPresentation), or
from both these documents (MissingSegBoth). The second set of variables captures the
variation in operating segments disclosed across the note to financial statements and the
MD&A, split based on whether this variation suggests a different segmentation
(Note_MDA_DiffSegmentation) or further disaggregation (Note_MDA_AddDisclosure).13
13
If segment information is missing in the MD&A, these variables are set to missing.
135
II.4.2 Main model
In order to test the consequences of inconsistency in disclosures on financial analysts,
I use a multivariate cross-sectional model that regresses the analyst-level forecast error
separately on Inconsistent, Inc_AddDisclosure, and Inc_DiffSegmentation. The dependent
variable is the in-sample range-adjusted earnings forecast error.14
Forecast error is computed
as the absolute difference between the last estimated value of one-year-ahead earnings before
earnings announcement and the actual earnings deflated by the absolute value of actual
earnings.15
I use individual analyst forecasts since the theoretical framework for and
experimental evidence on the relation between disclosure characteristics and users’ decision-
making is at the individual level. Perhaps some individuals are better able to cope with
receiving inconsistent information from different sources while others may find it harder to
do so. Analysts are heterogeneous in terms of, for example, effort, experience, or ability, and
these characteristics are related to the quality of their forecasts and to how investors respond
to their forecast revisions (Clement, 1999; Jacob, Lys, & Neale, 1999; O’Brien, 1990;
Stickel, 1992). Recent evidence also shows that investors use individual analyst forecasts as
additional benchmarks in evaluating reported earnings beyond the consensus number (Kirk,
Reppenhagen, & Tucker, 2014). The sum of these arguments warrants using individual
analyst forecasts as outcome variable.16
There are two companies in my sample that change their fiscal year end during 2010.
In line with prior literature that eliminates companies with changes in their fiscal year ends
from analyses of analyst forecasts, I eliminate these two companies from my sample.17
In
14
Using the logarithmic transformation instead leaves the results and inferences qualitatively unchanged. 15
Examples of recent papers that use the same computation for forecast error are Horton, Serafeim, & Serafeim
(2013) and Cotter, Tarca, & Wee (2012). 16
From a more pragmatic point of view, using analyst-firm observations increases the sample size and thus the
power of the test. 17
AirFrance-KLM and Porsche changed from a 31 March to a 31 December fiscal year end.
136
order to mitigate the influence of outliers, and consistent with prior literature, I truncate the
sample at the 95% extreme of the forecast error variable.18
The variable of interest for testing
H1a is Inconsistent. In order to test H1b and H1c, I replace Inconsistent with
Inc_DiffSegmentation and Inc_AddDisclosure as independent variables of interest.
The model includes a number of control variables that have been shown in prior
research to influence analysts’ accuracy. Following prior research on analyst accuracy and
dispersion at an international level (e.g., Hope 2003a; Hope 2003b; Lang et al. 2003; Bae et
al. 2008; Tan et al. 2011), the model controls for a number of variables. These include each
analysts’ forecasting effort for that company computed as the number of yearly and quarterly
forecasts made during the year (AnalystsEffort), stock return volatility (ReturnVolatility)
computed as the standard deviation of weekly stock returns during the year prior to the
forecasted one as a measure of firm risk; the number of analysts forecasting earnings for year
t+1 (LnAnalysts),19
an indicator variable for whether the management provides guidance in
the fiscal year-end earnings announcement press release for the next year (Guidance), the
length of the annual report (LengthAR) as a proxy for a firm’s overall disclosure policy
(Loughran & McDonald, 2014), an indicator variable for whether a firm’s net income is
18
This causes the loss of two additional companies, further reducing the usable sample to 396 firms. While
winsorizing does not significantly change the results, but I present the results based on truncated data since this
is a “cleaner” method to deal with outliers (Leone, Minutti-Meza, & Wasley, 2014). 19
I use the orthogonalized value of the number of analysts on beginning-of-year market capitalization to reduce
multicollinearity between analyst coverage and firm size.
137
negative during the year prior to the forecast (Loss) because is it harder to value loss firms,
the amount of equity issued during the year relative to lagged market capitalization (EqIssue),
an indicator variable for whether the company is cross-listed in the U.S. (ADR), and firm
complexity and size measured as the number of segments reported in the note (Segments) and
the natural logarithm of lagged total assets (LnTA). An additional specification includes
controls for the quality of operating segment aggregation (SRQuality) and the number of
accounting line items reported in the segment note (SRQuantity). SRQuality is the natural
logarithm of the industry-adjusted range of segment-level ROA (Ettredge et al., 2006). The
sample decreases when controlling for this variable because not all companies report segment
assets. Information for SRQuantity is hand-collected from the companies’ financial
statements. All variables are defined in Appendix II.B.
II.5 Empirical results
II.5.1 Descriptive statistics
Table II.2 reports descriptive statistics for the variables used in the empirical analyses.
A percent of 38.8% of the sample discloses operating segments inconsistently across the four
documents, and 28.3% disclose segments that indicate different internal organizations of the
company. Out of the sample companies, 10.5% provide further disaggregation of operating
segments in some documents. Panel B in table II.2 reports the descriptive statistics for the
analyst-firm observations used in the main analyses.
In table II.3, I report the Pearson and Spearman correlation coefficients for the
variables included in the analyses. The Pearson (Spearman) correlation between Inconsistent
and FE is small, 0.015 (0.015), and insignificant at conventional levels, Inc_DiffSegmentation
138
and FE are correlated at 0.032 (0.035), significant at 1%, while Inc_AddDisclosure and FE
are correlated at -0.023 (-0.026), significant at 1%. These raw correlations are a first-step,
bivariate analysis confirmation of the predictions in H1b and c. In a sense, these results lend
further support to the idea that the relations uncovered in the main analyses are not just an
artificial outcome of the partial correlations structure between the variables included in the
multivariate analyses. Regarding the other variables, the highest correlations are between
Segments and LnTA (0.335 Pearson and 0.359 Spearman) and between ADR and LnTA (0.392
Pearson and 0.380 Spearman). All other correlation coefficients are below 30% which
suggests that multicollinearity is not a particular concern in this setting.
II.5.2 Main results
Table II.4 presents the main analyses. The sample contains 10421 firm-analyst
observations Model 1 has Inconsistent as independent variable of interest. This model,
therefore, compares all the companies for which there is variation in the way operating
segments are disclosed across the four documents with those companies that disclose
consistently. The coefficient estimate is not statistically significant, which suggests that
inconsistency defined in this overall sense has no significant effect on analysts’ forecast error,
providing no support for H1a.
Model 2 shows that the effect of Inc_DiffSegmentation on analysts’ forecast error is
positive and significant at 1% (t-stat 4.89), confirming H1b. Since Inc_DiffSegmentation and
Inc_AddDisclosure are defined such that they are exclusive, the benchmark is the group of
companies that discloses either consistently or further disaggregates operating segments, i.e.,
Inc_AddDisclosure is 1. Therefore, compared to all the other companies, for those that
disclose operating segments across documents in a way that suggests different organizations
139
of their operations financial analysts make larger forecast errors when predicting earnings for
the next year. This result suggests that disclosing in different documents operating segments
that cannot be easily pieced back together decreases analysts’ accuracy, most likely because it
means providing confusing information and increases their information processing costs.
Model 3 shows that the effect of Inc_AddDisclosure on analysts’ forecast error is
negative and significant at 1% (t-stat -4.39), which confirms H1c. Since Inc_AddDisclosure
is included by itself, its coefficient represents the effect that providing further disaggregation
of the firm’s operating segments in some documents has compared to the group of consistent
disclosers and those for which Inc_DiffSegmentation is 1. In other words, compared to the
disclosure of all these other companies, disclosing operating segments inconsistently across
documents but in such a way that makes it easy to put the “pieces of the company” back
together is helping financial analysts more accurately forecast earnings for the next year.
In model 4, I include both Inc_DiffSegmentation and Inc_AddDisclosure as predictor
variables. The benchmark in this case is the group of consistent disclosers. Therefore,
compared to the companies that disclose consistently, those for which Inc_DiffSegmentation
is 1 have significantly higher analyst forecast errors (t-stat 3.96), and those for which
Inc_AddDisclosure is 1 have significantly lower analyst forecast errors (t-stat -3.26).
Although not the focus of this paper, the results discussed above are consistent with
the idea that disclosing different segmentations across documents could be related to
managers’ desire to obfuscate information, while proving further disaggregation arises from a
desire to be more transparent. As desirable as having the “management approach” as
principle for segment reporting under IFRS 8, it nevertheless allows for considerable
discretion related to how managers report operating segments. Since the internal organization
of the company is not readily visible to external users, managers could potentially show
meaningless segmentations in the note to financial statements for which a segment profit or
140
loss measure is required and the “true” internal organization in other documents where the
type of line items to disclose per segment is not mandated. While this also appears to be the
regulators’ rationale when checking consistency between operating segments disclosed in the
note and elsewhere, there are also arguments that could lead us to hypothesize that consistent
disclosers are more likely to be obfuscating information by “sticking” to one, untruthful story
that they repeat in all documents. My results seem to suggest the former, rather than the
latter, but more direct tests for the determinants of inconsistent disclosure would be needed in
order to disentangle between these arguments.
II.5.3 Additional analyses
Considering that segment information disclosed outside the notes to financial
statements is not mandated, is it reasonable to expect companies to disclose this information
voluntarily in documents such as the press release and the presentation to analysts? The
coding of the main variables is not influenced by non-disclosure of operating segments in
some documents; if that is the case, I rely on the documents in which operating segments are
disclosed to assess inconsistency. Nevertheless, the main research question of this paper rests
to some extent on the assumption that users expect managers to disclose segment information
in these documents. In order to evaluate the appropriateness of this assumption, I test the
effect that missing segment information from the press release and the presentation has on
analysts’ earnings forecast accuracy. Table II.5 reports the results. Since the dependent
variable is the forecast error based on the last annual forecast per analyst, the models also
include SRQuantity (model 1) and SRQuality (model 2) to control for the segment
information disclosed in the financial statements. Compared to the companies that disclose
operating segment information in both the press release and the presentation, not disclosing
141
this information increases financial analysts’ forecast errors; the coefficients on
MissingSegPressRelease and MissingSegPresentation are positive and significant at 1%.
Missing segment information in both documents is negatively related to forecast errors, but
only marginally significant. This result suggests that, to some extent, consistently not
disclosing operating segments in the press release and presentation is better for financial
analysts’ accuracy than disclosing segments in only one of these two documents. Overall,
these results also suggest that if segment information is not disclosed, financial analysts are
less accurate. Since analysts aim to build a reputation for forecasting (Hong & Kubik, 2003),
they most likely create a demand for segment information in these “early” documents.
Therefore, although voluntary, it is indeed reasonable to expect operating segment disclosure
in the press release and presentation due to the demand created by financial analysts.
Another related question is whether these documents really matter for financial
analysts, and in particular whether the information in notes to financial statements and in the
MD&A is still relevant considering how late the annual report is issued. If some of the
documents considered are not used by analysts, inconsistent information should not be
expected to have an effect. Models with the change in analyst forecast error and analyst
forecast dispersion between the first and the second quarters regressed on the segment
disclosure inconsistency between the notes and MD&A will tell whether analysts consider the
annual report as information source and whether inconsistency inside the annual report
affects them in any way.20
If analysts read segment information in both the notes and the
MD&A and this information is different across the two documents, I expect an increase in
mean forecast errors and divergence of opinion because information that is hard to piece
together could be interpreted in a multitude of ways. If, however, operating segments are
20
In essence, I compare the change in analyst disagreement triggered by the issuance of the annual report for
inconsistent and consistent disclosers. Companies are interested to reduce analyst forecast dispersion since
opinion divergence may lead to mispricing (Diether, Malloy, & Scherbina, 2002; Miller, 1977). Chief financial
officers surveyed in Graham, Harvey, & Rajgopal (2005) also confirm that “reducing uncertainty about the
firm’s prospects is the most important motivation for making voluntary disclosures.”
142
disclosed in the two documents in a way that makes it easy for analysts to piece them back
together, then I expect this to decrease mean forecast errors and dispersion from before to
after the issuance of the annual report.
I compute ChFE (ChDisp) as the difference between the absolute forecast error
(dispersion) 14 days after the end of the second quarter and the absolute forecast error
(dispersion) 14 days after the end of the first quarter. I assume that by the end of the first
quarter in t+1, the earnings announcement press release and presentation for year t are
available. Similarly, I assume that by the end of the second quarter in year t+1 the annual
report containing the financial statements and the MD&A is available.
In table II.6, the models are regressions of ChFE and ChDisp on segment disclosure
inconsistency between the note to financial statements and the MD&A. The models are run at
the firm level and the sample drops due to the unavailability of forecasts for all companies in
the first two quarters. In order to mitigate the influence of extreme values, I truncate ChFE
and ChDisp at 5 and 95%. I include controls for the number of analysts covering the firm
(LnAnalysts), the return volatility during the second fiscal quarter (ChReturnVolatility), the
length of the annual report (LengthAR), U.S. cross-listing status (ADR), and total assets
(LnTA).21
Consistent with expectations, Note_MDA_DiffSegmentation is positively and
significantly associated with both ChFE and ChDisp meaning that different segmentation
disclosed between the segment note and the MD&A is associated with higher mean analyst
forecast error and dispersion after the annual report is issued (i.e., end of second quarter) than
before (i.e., end of first quarter). Note_MDA_AddDisclosure is not significantly associated
with either ChFE or ChDisp which suggests that further disaggregation of operating segments
in the MD&A compared to the note does not seem to particularly help analysts. Since
changes models are very stringent, these results lend additional support to the main results in
21
Controlling for the change in stock price between quarters one and two similar to Armstrong, Core, & Guay
(2014) does not significantly change the coefficient estimates for the variables of interest.
143
table II.4 related to the effect of disclosing different segmentations across different
documents.
These additional analyses have shown that all the documents considered are important
for financial analysts, and that indeed they demand segment disclosures in these documents.
It is therefore reasonable to examine the effect that inconsistency in the operating segments
disclosed across the set of four documents chosen.
II.6 Robustness tests
II.6.1 Endogeneity concerns
In this setting, endogeneity could arise from unobserved correlated variable bias if
there are unobservable characteristics that are correlated with both Inc_DiffSegmentation
and/or Inc_AddDisclosure and FE.22
If a variable exists that is either unobservable or has not
been included in the set of control variables and determines both the inconsistent disclosure
and analysts’ forecast errors, then the coefficient estimates in the main analyses may be
biased (Larcker & Rusticus, 2010). Since the model is run with industry fixed effects, as well
as country fixed-effects in untabulated analyses, the fixed effects capture the unobservable
characteristics that firms in an industry/country share. Therefore, it is less likely that this
unobservable variable is an industry or country characteristic. Rather, it is more likely that the
unobservable variable is a firm-level characteristic. Including firm fixed effects is not a
solution since the model is a cross-sectional regression with predictor variables at the firm-
level.
22
Simultaneity bias is not a concern since the decisions on disclosure and earnings forecasts are made by
different actors (managers vs. financial analysts) at different times (t vs. t+1).
144
Ideally, a truly exogenous variable that can be theoretically argued to determine
inconsistency without being correlated with analysts’ forecast errors could be used to
instrument for the inconsistency variables. If the instrumental variable is even slightly
endogenous, the estimates will be highly biased (Larcker & Rusticus, 2010). The exogenous
assumption is hard to meet in accounting research which makes finding such variables almost
impossible (Larcker & Rusticus, 2010; Nikolaev & van Lent, 2005). Although not a solution,
existing methodological research on instrumental variables in accounting research proposes
to accompany any attempts of dealing with unobservable correlated variable bias using
instrumental variables by a sensitivity analysis of the model to such unobservable variables
(Larcker & Rusticus, 2010).
Frank (2000) proposes a statistical approach to analyze the impact of unobservable
confounding variables.23
The main idea is to identify how large the endogeneity problem has
to be in order to overturn the OLS estimates (Larcker & Rusticus, 2010). For a confounding
variable to affect the results, it needs to be correlated with both the dependent variable (Y)
and the independent variable of interest (X), controlling for other variables (Larcker &
Rusticus, 2010). The approach relies on identifying the Impact Threshold for a Confounding
Variable (ITCV) as the minimum correlation between CV and Y and between CV and X that
would make the coefficient estimate on X statistically insignificant if CV were included in
the model.24
The ITCV is benchmarked against the distribution of the impact scores of the
control variables already included in the model to assess whether the likelihood that such a
CV that overturns the OLS estimate exists. The impact score of a control variable is
23
See section 7, pp. 202-203 in Larcker & Rusticus (2010) for details and an example of this approach.
24 The ITCV is the result of the following formula based on Frank (2000): 𝐼𝑇𝐶𝑉 =
𝑡2+𝑡√𝑑
−(𝑛−𝑞−1)+ [
−𝑑−𝑡√𝑑
−(𝑛−𝑞−1)] × 𝑟𝑌𝑋
Where t is the t-value for the OLS estimate of the coefficient on X, n is the number of observations, q is the
number of parameters (without the intercept) included in the model, i.e., n-q-1 is the number of degrees of
freedom of the model, d=t2+(n-q-1),and rYX is the sample correlation between the outcome and the predictor of
interest.
145
computed by multiplying its raw (i.e., simple) correlation with Y to its raw correlation with
X.25
Table II.7 panel A reports the results for the sensitivity analysis following Frank
(2000). The threshold value for ITCV for Inc_DiffSegmentation is -0.0039, implying that the
correlations between Inc_DiffSegmentation and FE with the unobserved confounding
variable need to be around 0.062 (=√0.0039) to overturn the OLS result. While this seems as
a low correlation coefficient, it is nevertheless higher than most of the correlations between
Inc_DiffSegmentation and the other variables included in the analyses (table II.3 panel A).
Since Inc_DiffSegmentation is negatively related to FE, one of these two correlations needs to
be negative, otherwise the confounding variable would strengthen rather than weaken the
effect of Inc_DiffSegmentation on FE. The value of ITCV for Inc_DiffSegmentation is closest
to the impact scores of LengthAR and Loss. The confounding variable would have to be
similar in terms of type of relation and magnitude of effect to these two variables in order to
render the effect of Inc_DiffSegmentation on FE insignificant, but nevertheless different from
them since the model already includes these as control variables.
The ITCV value for Inc_AddDisclosure is 0.0421, meaning that the correlations
between Inc_AddDisclosure and FE with the confounding variable would have to be around
0.205 (=√0.0421) to make the coefficient on Inc_AddDisclosure insignificant at
conventional levels and both correlations would have to be either positive or negative to
weaken the OLS estimate. None of the raw impact scores is higher than the ITCV for
Inc_AddDisclosure which suggests that the confounding variable would have to be very
different from any of the control variables.
25
Larcker & Rusticus (2010) note that the raw impact scores are a more conservative measure of impact, so
comparing the ITCV to the raw impact scores instead of the partial correlation impact scores assumes that CV is
relatively distinct from existing control variables and provides a more “negative” view on how sensitive the
results are to endogeneity.
146
Overall, the sensitivity to endogeneity analyses following Frank (2000) suggest that
the main results are reasonably robust to unobservable correlated variable bias, although such
variables might still exist. The large set of controls and numerous other untabulated analyses
with additional controls lend further confidence in the results.
II.6.2 Other robustness tests
I conduct a set of supplementary analyses to check the robustness of the main results.
These tests are presented in table II.8. In panel A, instead of clustering standard errors at the
analyst level, I use clustering by firm since unobservable firm-level characteristics might
cause analysts to consistently forecast in a certain way. In other words, earnings forecasts for
the same firm are not independent observations. Since the model is used on a cross-section,
the number of clusters becomes equal to the number of companies in the sample. The results
suggest that Inc_DiffSegmentation is positively and significantly associated with forecast
error (t-stat 1.75). The coefficient for Inc_AddDisclosure has the expected negative sign but
is statistically weaker. Therefore, taking into account the non-independence (i.e., correlation)
of forecast errors for the same company makes the results weaker which suggests that
analysts covering a firm are similarly affected by the disclosure inconsistency of that
company.
I also control for the influence of country-level institutions given prior evidence that
home-country institutions matter for voluntary disclosure (Shi, Magnan, & Kim, 2012).
Replacing the industry fixed effects with country fixed effects (panel B) leaves the tenor of
the main results unchanged. Inc_DiffSegmentation is positively and strongly associated with
FE (t-stat 4.78), while Inc_AddDisclosure is negatively associated with FE, with a coefficient
significant at 5% (t-stat -2.23). When I include both variables of interest in the same
regression with country fixed effects, Inc_AddDisclosure is negative but no longer
147
statistically significant. This analysis suggests that, to some extent, how much additional
disaggregation of information in different documents matters for analysts may be subsumed
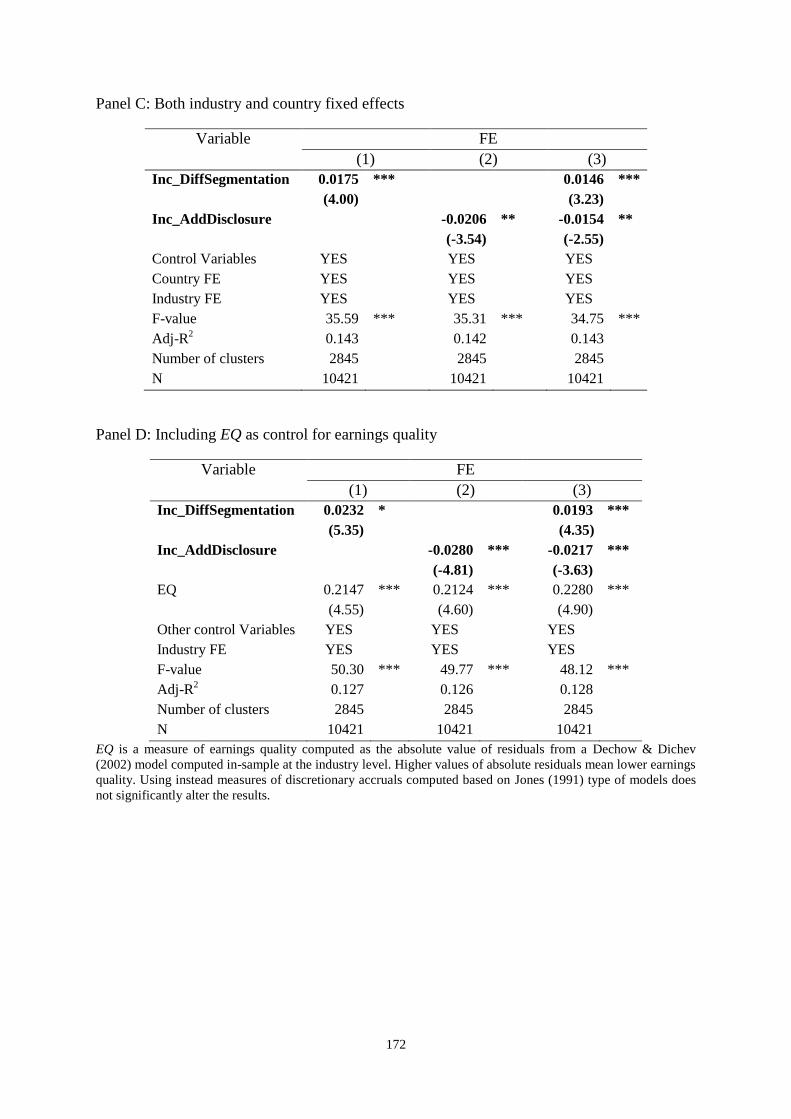
by country-level characteristics. If I include both industry and country fixed effects, both
variables of interest are strongly significant in all models, i.e., included either separately or
together (panel C).
In panel D, I expand the set of control variables by including EQ as a measure of
earnings quality. EQ is computed as the absolute value of residuals from a Dechow & Dichev
(2002) model computed in-sample at the industry level. Higher values of absolute residuals
mean lower earnings quality. As expected based on prior evidence (Bradshaw, Richardson, &
Sloan, 2001; Burgstahler & Eames, 2003), EQ is positively and significantly associated with
FE, meaning that analysts’ forecast errors are higher when there is more earnings
management. The coefficient estimates on the variables of interest remain qualitatively
unchanged even after controlling for EQ. Replacing EQ with measures of discretionary
accruals based on Jones (1991) type of models does not have a different effect.
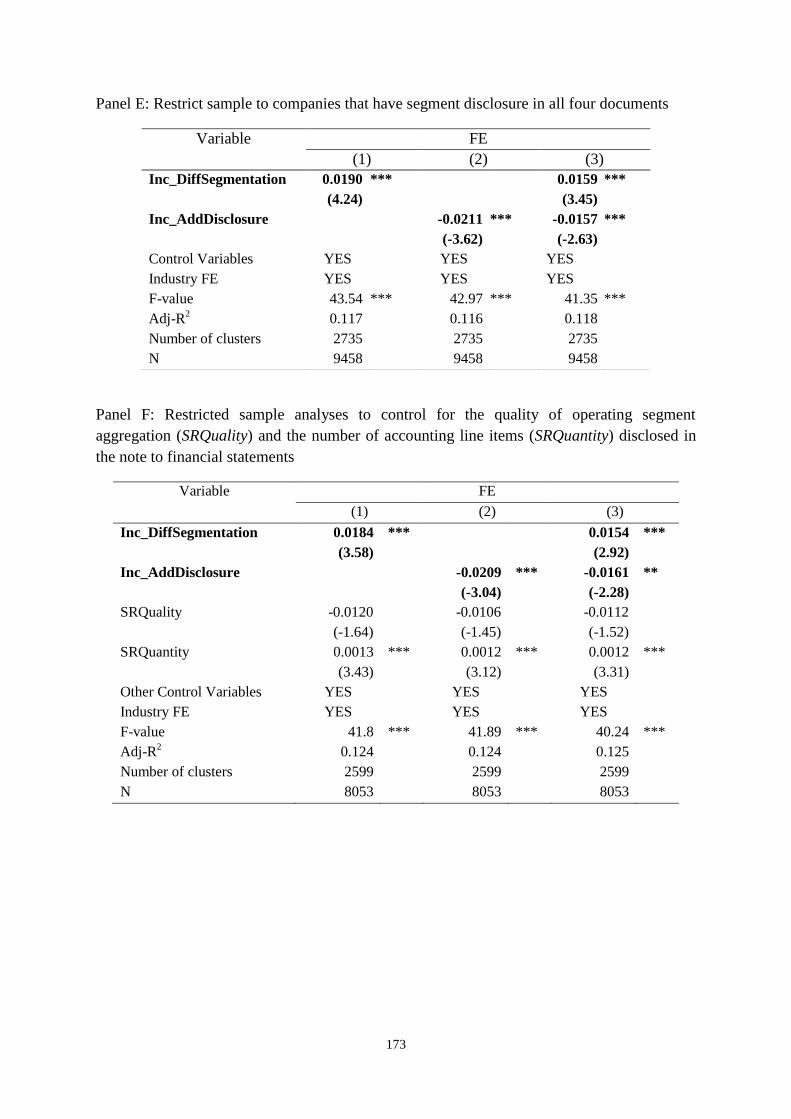
In panel E, I restrict the sample to only those companies that disclose segment
information in all four documents. The dropped companies are those without segment
disclosure in the press release and presentation (the variables MissingSegPressRelease and
MissingSegPresentation describe the sample from this point of view) and one company that
does not mention any segment-related information in the MD&A. All results remain
qualitatively similar and significant at 1%.
I run two sensitivity tests to take into account companies’ disclosure policy in the
segment note. In panel F, I test the sensitivity of the results when controlling for the quality
of operating segment aggregation in the notes to financial statements (SRQuality) and the
number of accounting line items (SRQuantity) provided in the segment note. Controlling for
these variables is meant to mitigate concerns that the inconsistency variables are correlated
148
with some of the characteristics of segment disclosure in the note, and since financial analysts
potentially focus first and foremost on this regulated information, the coefficients of interest
reflect analysts’ processing of the segment information in the note. Including SRQuality as
control variable reduces the sample due to data constraints for computing it. The main results
hold when controlling for SRQuality and SRQuantity, although in model 4 when both
Inc_DiffSegmentation and Inc_AddDisclosure are included, Inc_AddDisclosure is significant
at 5% instead of 1% when not controlling for SRQuality and SRQuantity. Across all four
models, the coefficients for SRQuality are negative suggesting that higher quality of
operating segment aggregation allows a better discrimination of the company’s businesses
and more accurate forecast of future prospects, but not significant at conventional levels. The
coefficients on SRQuantity are positive and strongly significant meaning that the more line
items provided in the segment note, the harder it is for analysts to be accurate in their
earnings forecasts.26
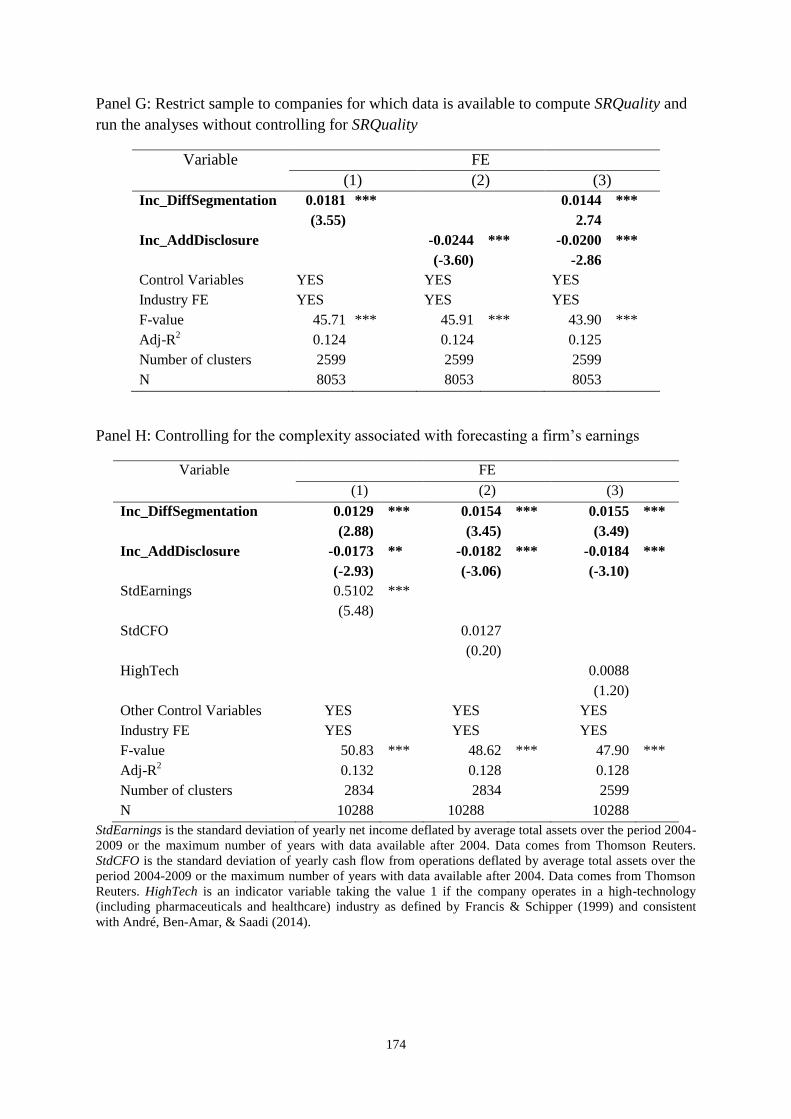
In order to compare across companies with similar disclosure policies, a more
“apples-to-apples” comparison, I also restrict the sample to those companies with available
data to compute SRQuality and run the regressions on this restricted sample but without
including SRQuality as control variable (panel G). The coefficients of interest have the
expected signs and are significant at 1%. Therefore, overall, the robustness tests leave the
tenor of the main results unchanged.
The complexity associated with a company’s businesses may be a reason for which
managers disclose operating segments inconsistently across documents and, at the same time,
may be influencing analysts’ accuracy when forecasting earnings. In other words, business
complexity and uncertainty may be a correlated omitted variable from our model, and could
be a source of endogeneity. In panel H, I use three variables to proxy for this concept. In
26
This result provides support to the disclosure overload arguments, is in line with prior research (Lehavy et al.,
2011), and is consistent with the coefficient on LengthAR in all the models, which is similarly negative and
significant.
149
model (1) I include the standard deviation of earnings for the last five years (StdEarnings), in
model (2), the standard deviation of cash flows for the last five years (StdCFO), and in model
(3) an indicator variable for whether the company has its main operations in a high tech
industry known to have more uncertain cash flows (Barron et al., 2002). The coefficient on
StdEarnings in model (1) is positive and strongly significant, which suggests that analysts
covering firms with more volatile earnings are less accurate. The coefficients for StdCFO and
HighTech in models (2) and (3), respectively, are not statistically significant. The variables of
interest Inc_DiffSegmentation and Inc_AddDisclosure remain strongly significant and have
the predicted signs. Therefore, business complexity and earnings stream uncertainty does not
seem to be an omitted correlated variable that would significantly influence the main results.
II.7 Conclusion
This paper uses hand-collected data on operating segments from four different
corporate documents of 400 multi-segment European firms to analyze the consequences of
inconsistent disclosures for financial analysts’ forecast accuracy. The set of documents I
consider contains (1) the notes to financial statements, (2) the MD&A, (3) the fiscal year-end
earnings announcement press release and (4) the fiscal year-end presentation to analysts that
is part of the earnings announcement conference call. Inconsistent disclosure is defined based
on the Securities and Exchange Commission (SEC) and European Securities and Markets
Authority’s (ESMA) review process guidelines as variation in information disclosed on the
same topic in different documents issued by the same firm, and further refined to account for
potential additional information, i.e., disaggregation of operating segments in some
documents, or hard-to-reconcile different segmentations disclosed in different documents.
150
I show that disclosing inconsistently across documents is a relatively pervasive
practice – almost 39% of the companies in my sample do not disclose exactly the same
operating segments in the four documents considered. Inconsistency that arises from further
disaggregating operating segments seems to bring new information and lowers analysts’
forecast errors. Disclosure of a different segmentation, however, impedes analysts’
information processing such that their forecast errors are larger. These results have practical
implications for managers and financial analysts. Since financial analysts are an important
link between the firm and the capital markets, managers want to understand how to best
communicate with them (Bradshaw, 2011). This paper shows the effects that inconsistency as
a characteristic of disclosure across documents has on analysts’ accuracy, so managers could
use these results to adjust their disclosure strategy.
The results also have implications for regulators and the current debate on a
disclosure framework. I supplement some existing survey evidence that points to the
importance investors and analysts attach to consistency in disclosure with empirical results
from a relatively large sample of firms. Given my findings, regulators and standard setters
may want to assess the need to consider the consistency of disclosure across documents as an
attribute of disclosure quality that companies should be encouraged to adhere to. My findings
also back up regulators’ existing practices of evaluating compliance with disclosure standards
by comparing mandated disclosure with voluntary disclosure on the same topic but in
different documents.
Last, but not least, this paper contributes to the accounting disclosure literature and
this contribution stems from two main aspects. First, the paper identifies a dimension of
corporate accounting disclosure that has not been previously examined and investigates the
consequences of this disclosure characteristic for an important set of users of accounting
information – the financial analysts. Second, by considering disclosures made in more than
151
one document, this paper takes a step forward towards improving our understanding of
managers’ overall disclosure strategy and the effects that this strategy has. The financial
statements are one component of an array of disclosure “weapons” that managers use to
communicate to capital market participants, although financial information is present in most
of the other documents as well. Evidence on the role that financial information plays when
disclosed outside the financial statements and whether and how users assess it in comparison
to the financial statements enhances our understanding of the role of accounting disclosures
and the characteristics that make accounting disclosure useful.
152
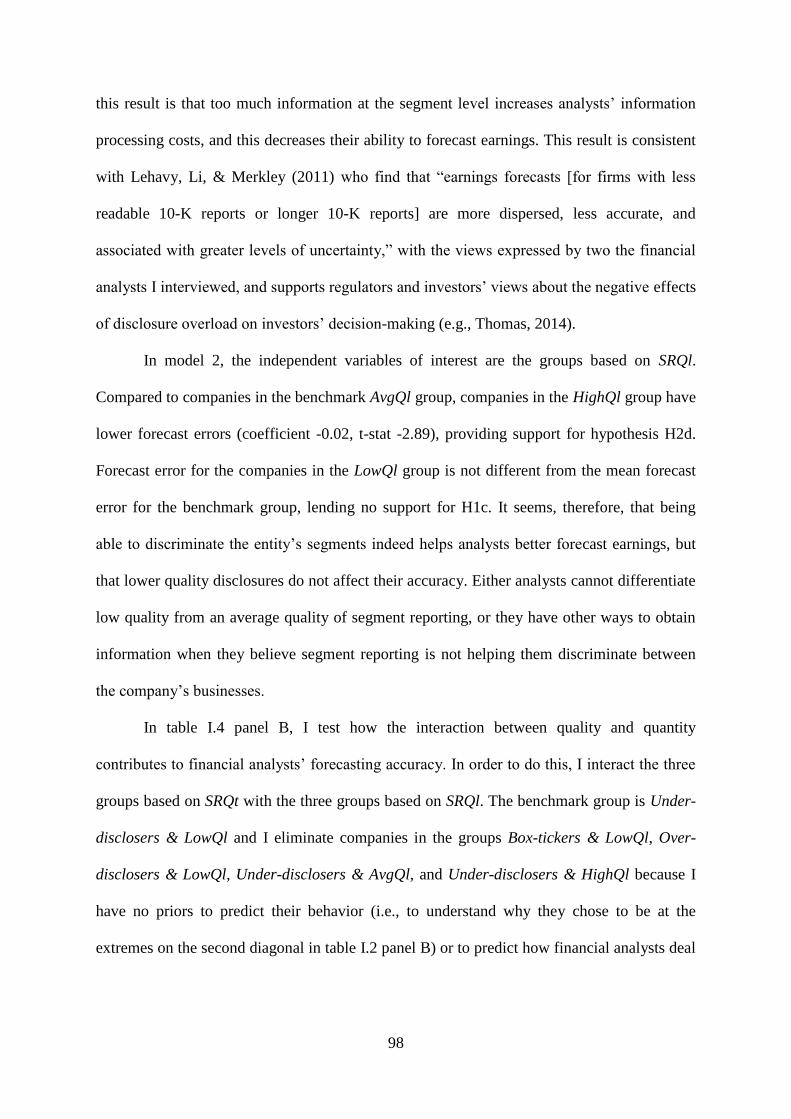
(in € million)
Power
Transport
Corporate
& others
Eliminations
Total
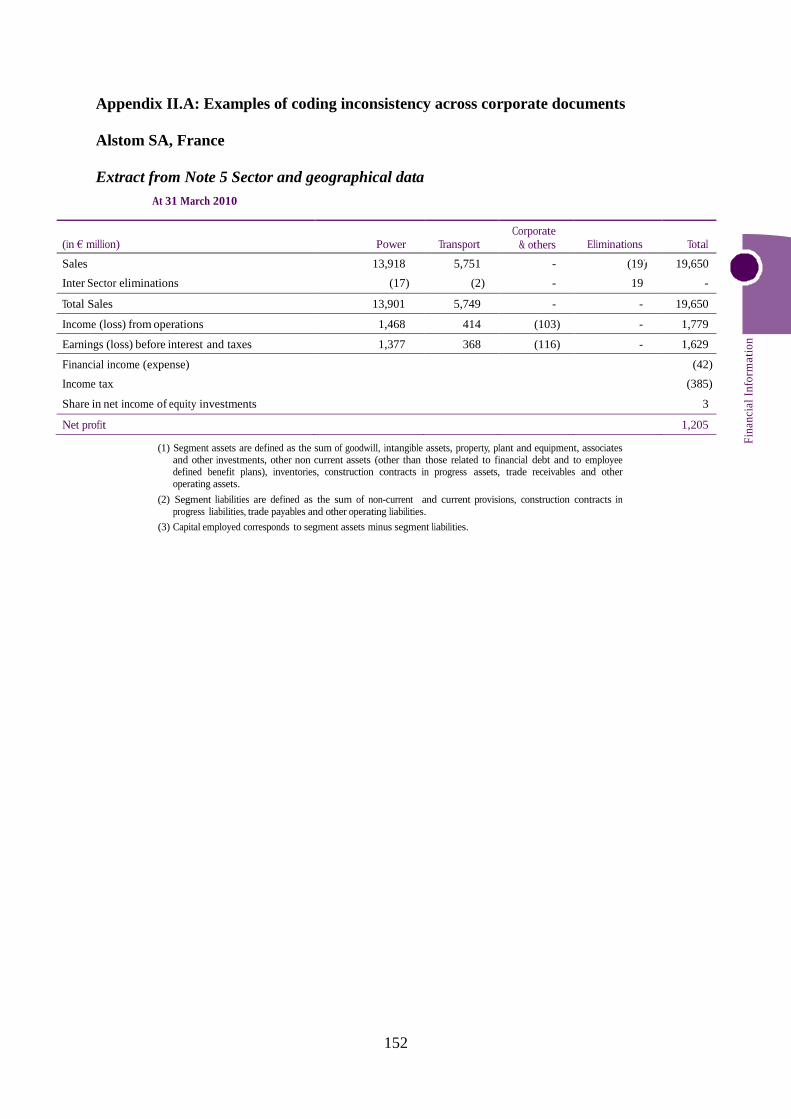
Sales 13,918 5,751 - (19) 19,650
Inter Sector eliminations (17) (2) - 19 -
Total Sales 13,901 5,749 - - 19,650
Income (loss) from operations 1,468 414 (103) - 1,779
Earnings (loss) before interest and taxes 1,377 368 (116) - 1,629
Financial income (expense) (42)
Income tax (385)
Share in net income of equity investments 3
Net profit 1,205
Fin
anci
al
Info
rmati
on
Appendix II.A: Examples of coding inconsistency across corporate documents
Alstom SA, France
Extract from Note 5 Sector and geographical data
At 31 March 2010
2
(1) Segment assets are defined as the sum of goodwill, intangible assets, property, plant and equipment, associates and other investments, other non current assets (other than those related to financial debt and to employee defined benefit plans), inventories, construction contracts in progress assets, trade receivables and other operating assets.
(2) Segment liabilities are defined as the sum of non-current and current provisions, construction contracts in progress liabilities, trade payables and other operating liabilities.
(3) Capital employed corresponds to segment assets minus segment liabilities.
153
The segment note does not contain other entity-wide disclosures.
154
Extract from 2009/2010 Annual report MD&A – Sector information
Power sector
“The Power Sector designs, manufactures, supplies and maintains a broad range of products
in the power generation industry for coal, gas, oil and biomass power plants. It also supplies
wind and hydro equipment as well as conventional islands for nuclear power plants.”
Sales, actual figures
Year ended 31 March (in € million)
2010 2009
Thermal Systems & Products
Thermal Services
Renewables
7,746
4,353
1,802
7,038 10% 10%
4,219 3% 3%
1,797 0% 0%
Power 13,901
Transport sector
“The Transport Sector serves the urban transit, regional/inter-city passenger travel markets
and freight markets all over the world with rail transport products, systems and services.
Alstom designs, develops, manufactures, commissions and maintains trains, and develops and
implements system solutions for rail control. It also designs and manages the creation of new
railway lines, and offers maintenance and renovation programmes to keep customers’ assets
safe and productive. The Sector markets each of these as stand-alone offerings or combined
within turnkey system solutions, according to each customer’s requirements.”
Year ended 31 March (in € million)
2010 2009
Europe
North America
South and Central America
Asia/Pacific
Middle East/Africa
3,778
793
282
525
371
66% 3,961 70% (5%) (4%)
14% 755 13% 5% 5%
5% 289 5% (2%) (4%)
9% 416 7% 26% 25%
6% 264 5% 41% 42%
Sales by destination 5,749
Extract from press release 4 May 2010
“In Power, Thermal Systems & Products received orders for a large gas power plant in the
UK, coal power plants in Slovenia, Germany and India as well as plant management systems
in South Africa. Thermal Services registered a flow of small and medium-sized orders,
particularly in Europe and in the USA, for both retrofit and service and booked three
operation and maintenance long-term contracts during the fourth quarter. In Renewables, the
main orders recorded during the period were for hydro projects in Switzerland. In Transport,
the main contracts recorded during the fiscal year included regional trains in France and
Germany, suburban trains in France, metros in Brazil and the Netherlands, tramways in
Brazil, Morocco and France, as well as various signalling systems and maintenance orders.”
155
Extract from presentation to analysts 4 May 2010
Data collected for Alstom SA:
Document # operating
segments
Name of operating segments disclosed
Note to financial statements 2 Transport; Power
MD&A 4 Power (Thermal systems & products; Thermal
services; Renewables); Transport
Press release 2 Transport; Power
Presentation 4 Power (Thermal systems & products; Thermal
services; Renewables); Transport
Inconsistency variables for Alstom SA:
Variable Value
Inconsistent 1
Inc_DiffSegmentation 0
Inc_AddDisclosure 1
156
Vallourec SA, France
Extract from Note 32 Segment Reporting
The segment note does not contain other entity-wide disclosures.
157
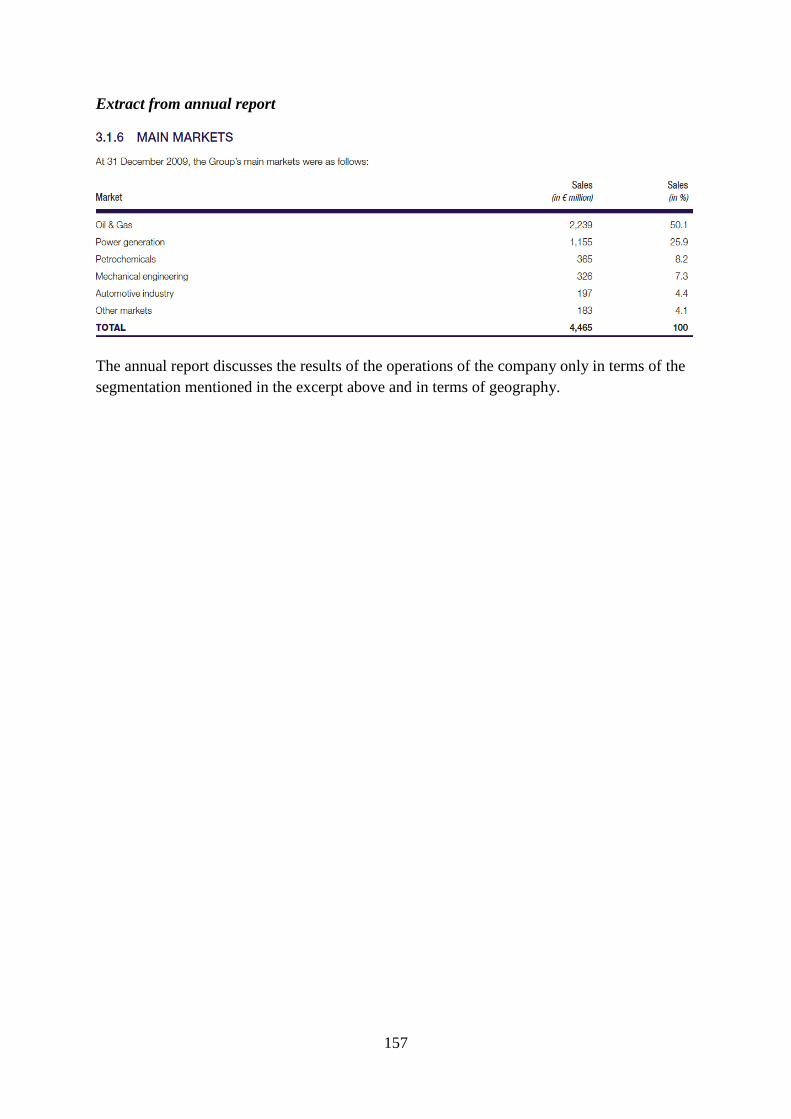
Extract from annual report
The annual report discusses the results of the operations of the company only in terms of the
segmentation mentioned in the excerpt above and in terms of geography.
158
Extract from press release
Extract from presentation to analysts on February 24th
, 2010
Under the heading “3. Review by activity”
159
Data collected for Vallourec SA:
Document # operating
segments
Name of operating segments disclosed
Note to financial statements 2 Seamless tubes; Speciality products
MD&A 5 Oil&Gas; Power Generation; Petrochemicals;
Mechanical Engineering; Automotive; Other
Press release 5 Oil&Gas; Power Generation; Petrochemicals;
Mechanical Engineering; Automotive; Other
Presentation 5 Oil&Gas; Power Generation; Petrochemicals;
Mechanical Engineering; Automotive;
Construction & Other
Inconsistency variables for Vallourec SA:
Variable Value
Inconsistent 1
Inc_DiffSegmentation 1
Inc_AddDisclosure 0
160
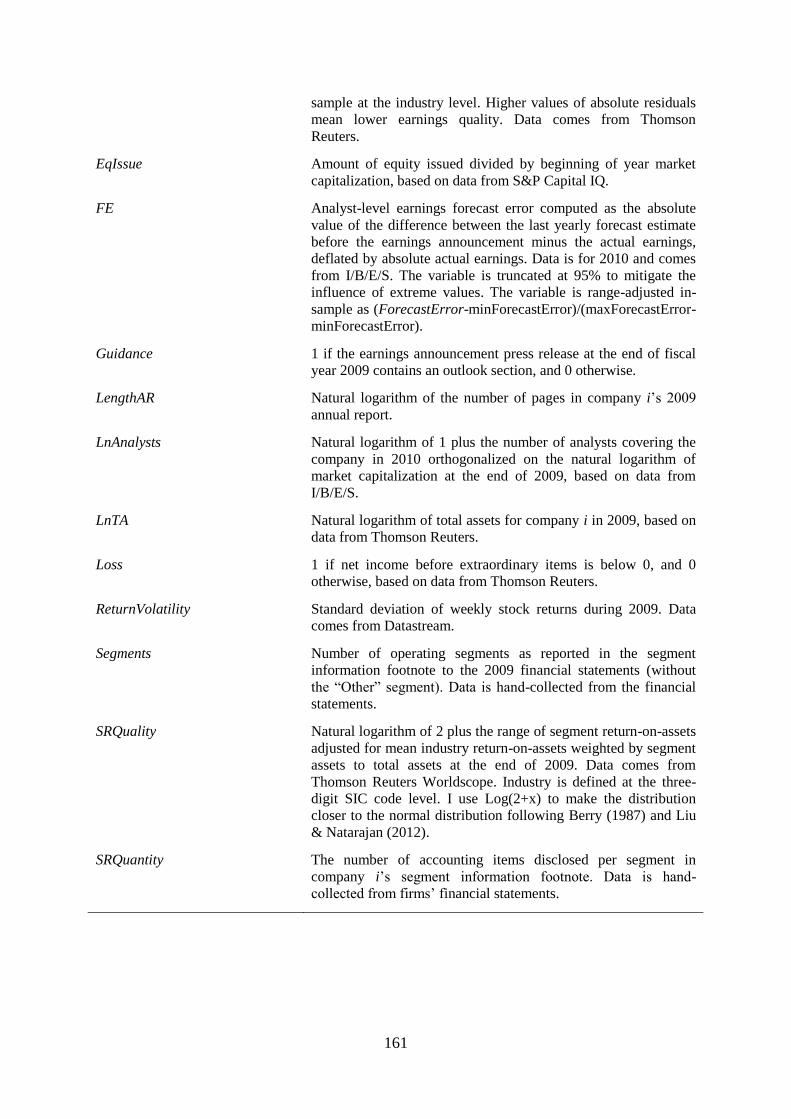
Appendix II.B: Variable definitions
MAIN VARIABLES USED IN THE ANALYSES
Inconsistent 1 if operating segments are disclosed inconsistently across the
four documents (segment note to financial statements, MD&A,
earnings announcement press release, presentation to analysts),
and 0 otherwise. When a document is missing, the variable is
coded based on existing documents.
Inc_DiffSegmentation 1 if operating segments are disclosed inconsistently across the
four documents (segment note to financial statements, MD&A,
earnings announcement press release, presentation to analysts)
such that it suggests a different segmentation, and 0 otherwise.
When a document is missing, the variable is coded based on
existing documents.
Inc_AddDisclosure 1 if operating segments are disclosed inconsistently across the
four documents (segment note to financial statements, MD&A,
earnings announcement press release, presentation to analysts)
such that it further disaggregates one or more of the operating
segments, and 0 otherwise. When a document is missing, the
variable is coded based on existing documents.
Note_MDA_DiffSegmentation 1 if operating segments are disclosed inconsistently across the
segment note to financial statements and the MD&A such that it
suggests different segmentation bases, and 0 otherwise. The
variable is set to missing if the operating segments are not
mentioned in the MD&A.
Note_MDA_AddDisclosure 1 if operating segments are disclosed inconsistently across the
segment note to financial statements and the MD&A such that it
suggests additional disaggregation of the segments, and 0
otherwise. The variable is set to missing if the operating
segments are not mentioned in the MD&A.
MissingSegPresentation 1 if the presentation does not mention any information about the
firm’s segments, and 0 otherwise. The variable is set to missing if
the presentation is not available.
MissingSegPressRelease 1 if the earnings announcement press release does not mention
any information about the firm’s segments, and 0 otherwise. The
variable is set to missing if the press release is not available.
MissingSegBoth 1 if both the presentation and earnings announcement press
release do not mention any information about the firm’s
segments, and 0 otherwise. The variable is set to missing if any
of the two documents are not available.
VARIABLES FOR THE MAIN ANALYSES
ADR 1 if the company is also listed in the U.S., and 0 otherwise, based
on data from Thomson Reuters.
AnalystEffort Range-adjusted number of yearly and quarterly earnings
forecasts an analyst makes for a company before the 2010
earnings announcement date.
EQ Measure of earnings quality computed as the absolute value of
residuals from a (Dechow & Dichev, 2002) model computed in-
161
sample at the industry level. Higher values of absolute residuals
mean lower earnings quality. Data comes from Thomson
Reuters.
EqIssue Amount of equity issued divided by beginning of year market
capitalization, based on data from S&P Capital IQ.
FE Analyst-level earnings forecast error computed as the absolute
value of the difference between the last yearly forecast estimate
before the earnings announcement minus the actual earnings,
deflated by absolute actual earnings. Data is for 2010 and comes
from I/B/E/S. The variable is truncated at 95% to mitigate the
influence of extreme values. The variable is range-adjusted in-
sample as (ForecastError-minForecastError)/(maxForecastError-
minForecastError).
Guidance 1 if the earnings announcement press release at the end of fiscal
year 2009 contains an outlook section, and 0 otherwise.
LengthAR Natural logarithm of the number of pages in company i’s 2009
annual report.
LnAnalysts Natural logarithm of 1 plus the number of analysts covering the
company in 2010 orthogonalized on the natural logarithm of
market capitalization at the end of 2009, based on data from
I/B/E/S.
LnTA Natural logarithm of total assets for company i in 2009, based on
data from Thomson Reuters.
Loss 1 if net income before extraordinary items is below 0, and 0
otherwise, based on data from Thomson Reuters.
ReturnVolatility Standard deviation of weekly stock returns during 2009. Data
comes from Datastream.
Segments Number of operating segments as reported in the segment
information footnote to the 2009 financial statements (without
the “Other” segment). Data is hand-collected from the financial
statements.
SRQuality Natural logarithm of 2 plus the range of segment return-on-assets
adjusted for mean industry return-on-assets weighted by segment
assets to total assets at the end of 2009. Data comes from
Thomson Reuters Worldscope. Industry is defined at the three-
digit SIC code level. I use Log(2+x) to make the distribution
closer to the normal distribution following Berry (1987) and Liu
& Natarajan (2012).
SRQuantity The number of accounting items disclosed per segment in
company i’s segment information footnote. Data is hand-
collected from firms’ financial statements.
162
Appendix II.C: Tables for chapter II
Table II.1: Sample construction
Panel A: Sampling
STOXX Europe 600 at 31/12/2009 600
(-) Financial institutions -143
(-) Follow U.S. GAAP -10
(-) No segment footnote/Single segment -28
(-) Doubles -2
(-) No disclosure about segments elsewhere -3
(-) Taken over in/after 2010 -14
(=) Total 400
This table describes the sampling procedure.
Panel B: Distribution of sample by country
Country Frequency Percent
Austria 6 1.50
Belgium 8 2.00
Denmark 10 2.50
Finland 16 4.00
France 65 16.25
Germany 47 11.75
Greece 4 1.00
Ireland 4 1.00
Italy 17 4.25
Luxembourg 2 0.50
Netherlands 19 4.75
Norway 9 2.25
Portugal 8 2.00
Spain 18 4.50
Sweden 26 6.50
Switzerland 24 6.00
UK 117 29.25
Total 400 100.00
This table reports the country distribution of companies in the full sample.
163
Panel C: Distribution of sample by industry (Industry Classification Benchmark ICB codes)
Industry Frequency Percent
Basic Materials 48 12.00
Consumer Goods 60 15.00
Consumer Services 61 15.25
Health Care 25 6.25
Industrials 110 27.50
Oil and Gas 32 8.00
Technology 20 5.00
Telecommunications 20 5.00
Utilities 24 6.00
Total 400 100.00
This table presents the industry distribution of the companies included in the full sample, based on the ICB
industry classification codes.
Panel D: Distribution of sample by available documents (press release and presentation)
Press release Presentation Total
0 1
0 2 3 5
0.50% 0.75% 1.25%
1 26 369 395
6.50% 92.25% 98.75%
Total 28 372 400
7.00% 93.00% 100%
164
Table II.2: Descriptive statistics
Panel A: Descriptive statistics for the main variables
This table presents Pearson (above diagonal) and Spearman correlation coefficients (below diagonal) for the variables used in the main analyses. See variable definitions in
Appendix II.B. Statistical significance is based on two-sided t-tests and is indicated as follows: *** p-value<0.01; ** p-value<0.05; * p-value<0.1.
Table II.4: The role of inconsistent disclosure of operating segments across corporate
documents for financial analysts’ earnings forecast accuracy
FE Analyst-level earnings forecast error computed as the logarithm of 1
plus the absolute value of the difference between the first yearly
forecast within 30 days after the earnings announcement of 2009
earnings minus the actual earnings, deflated by absolute actual
earnings. Data is for 2010 and comes from I/B/E/S. The variable is
winsorized at 99% to mitigate the influence of extreme values.
Guidance 1 if the earnings announcement press release at the end of fiscal year
2009 contains an outlook section, and 0 otherwise.
Herf Industry competition measure computed as the sum of squared
market shares in 2009, based on data from Thomson Reuters.
HighTech Indicator variable taking the value 1 if the company operates in a
high-technology (including pharmaceuticals and healthcare) industry
as defined by Francis & Schipper (1999) and consistent with André,
Ben-Amar, et al. (2014).
LengthAR Natural logarithm of the number of pages in company i’s 2009
annual report.
Lev Proportion of total debt to total assets in 2009. Data comes from
Thomson Reuters.
LnAnalysts Natural logarithm of 1 plus the number of analysts covering the
company in 2010, based on data from I/B/E/S.
LnFEt Analyst-level earnings forecast error for the previous year (i.e.,
2009) computed as the logarithm of 1 plus the absolute value of the
difference between the last yearly forecast before the earnings
announcement of 2009 earnings minus the actual earnings, deflated
by absolute actual earnings. Data comes from I/B/E/S. The variable
is winsorized at 99% to mitigate the influence of extreme values.
LnMgOwners Following Lennox (2005), management ownership is computed as
the natural logarithm of the percentage of ordinary shareholdings of
current executive directors, and 0 otherwise; computed based on data
from S&P Capital IQ at the end of fiscal year 2009, or the closest
available date.
LnTA Natural logarithm of total assets for company i at the end of 2009,
based on data from Thomson Reuters.
Loss 1 if net income before extraordinary items at the end of 2009 is
below 0, and 0 otherwise, based on data from Thomson Reuters.
OpCycle Natural log of the firm’s operating cycle measured in days, based on
turnover in accounts receivable and inventory computed as:
180*((AR2009+AR2008)/SALES2009+
(INV2009+INV2008)/COGS2009), where AR is accounts receivable,
SALES is net sales revenue, INV is inventory, and COGS is cost of
goods sold. Data comes from Thomson Reuters.
R&D Natural logarithm of 1 plus research and development expenditures
during 2009, multiplied by one million to aid result exposition,
divided by lagged total sales, based on data from Thomson Reuters.
Where research and development expenditures are missing, the value
is set to 0.
210
ReturnVolatility Standard deviation of daily stock return during 2009. Data comes
from Datastream.
ROA Return-on-assets during 2009. Data comes from Thomson Reuters.
Segments Number of operating segments as reported in the segment
information footnote to the 2009 financial statements (without the
“Other” segment). Data is hand-collected from the financial
statements.
StdCFO Standard deviation of yearly cash flow from operations deflated by
average total assets over the period 2004-2009 or the maximum
number of years with data available after 2004. Data comes from
Thomson Reuters.
StdEarnings Standard deviation of yearly net income deflated by average total
assets over the period 2004-2009 or the maximum number of years
with data available after 2004. Data comes from Thomson Reuters.
211
Appendix III.C: Tables for chapter III
Table III.1: Sample construction
Panel A: Sampling
STOXX Europe 600 at 31/12/2009 600
(-) Financial institutions -143
(-) Follow U.S. GAAP -10
(-) No segment footnote/Single segment -28
(-) Doubles -2
(-) No disclosure about segments elsewhere -3
(-) Taken over in/after 2010 -14
(-) No earnings announcement press release -4
(=) Total 396
This table describes the sampling procedure.
Panel B: Distribution of sample by country
Country Frequency Percent
Austria 6 1.52
Belgium 8 2.02
Denmark 9 2.27
Finland 16 4.04
France 64 16.16
Germany 46 11.62
Greece 4 1.01
Ireland 4 1.01
Italy 17 4.29
Luxembourg 2 0.51
Netherlands 19 4.80
Norway 9 2.27
Portugal 8 2.02
Spain 18 4.55
Sweden 26 6.57
Switzerland 24 6.06
UK 116 29.29
Total 396 100.00
This table reports the country distribution of companies in the full sample.
212
Table III.2: Descriptive statistics for the main variables
Panel A: Descriptive statistics on the firms providing management guidance
Category Type of Guidance Frequency % In total
sample
% Conditional
on Guidance
Guidance 288 72.73%
Earnings 155 39.14% 53.82%
Expense Items 30 7.58% 10.42%
Revenue 110 27.78% 38.19%
Cash Flow Items 45 11.36% 15.63%
Only Narrative 105 26.52% 36.46%
Segment-level Guidance 127 32.07% 44.10%
Panel B: Descriptive statistics on the firms providing segment-level guidance
Segment-level guidance Frequency % Conditional on
Segment-level Guidance
Precision of guidance
Point_Range 20 15.75%
Estimate 15 11.81%
Narrative 92 72.44%
Guidance components
Segment Earnings 41 32.28%
Segment Expense Items 2 1.57%
Segment Revenue 35 27.56%
Only Non-financial
Statements
73 57.48%
Panel C: Frequencies of management guidance disaggregation groups (DEG)
Number of guidance
components Frequency
% Conditional on
Guidance
0 (Only Narrative) 105 36.46%
1 69 23.69%
2 78 27.08%
3 31 10.76%
4 (Disaggregating firms) 5 1.74%
Total 288 100%
213
Panel D: Frequencies of segment-level guidance disaggregation groups (SEG)
SEG Frequency
% Conditional on Segment-level
Guidance
0 73 57.48%
1 13 10.24%
2 18 14.17%
3 23 18.11%
Total 127 100%
Panel E: Descriptive statistics for Point_Range, Narrative, Estimate, Precision, SEG, and
DEG
Variable N Mean StdDev Min Median Max
Point_Range 127 0.157 0.366 0 0 1
Estimate 127 0.118 0.324 0 0 1
Narrative 127 0.724 0.449 0 0 1
Precision 127 0.291 0.656 0 0 2
SEG 127 0.929 1.203 0 0 3
DEG 288 1.174 1.094 0 1 4
Panel F: Industry distribution of Guidance and Segment-level Guidance (SLG)
Industry Total Guidance SLG
Basic Materials 48 38 14
(12.12%) (9.60%) (3.54%)
Consumer Goods 59 46 19
(14.90%) (11.62%) (4.80%)
Consumer Services 61 39 21
(15.40%) (9.85%) (5.30%)
Health Care 25 22 7
(6.31%) (5.56%) (1.77%)
Industrials 109 81 43
(27.53%) (20.45%) (10.86%)
Oil and Gas 32 23 13
(8.08%) (5.81%) (3.28%)
Technology 19 13 4
(4.80%) (3.28%) (1.01%)
Telecommunications 19 12 3
(4.80%) (3.03%) (0.76%)
Utilities 24 14 3
(6.06%) (3.54%) (0.76%)
Total 396 288 127
(100%) (72.73%) (32.07%)
Of which: HighTech 57 41 14
(14.39%) (10.35%) (3.54%)
214
This table presents the industry distribution of the companies included in the sample, based on the ICB industry
classification codes. HighTech is and indicator variable taking the value 1 if the company operates in a high-
technology (including pharmaceuticals and healthcare) industry as defined by Francis & Schipper (1999), and 0
otherwise.
215
Table III.3: Descriptive statistics for the other variables used in the analyses
Panel A: Full sample
Variable Mean StdDev Min Median Max
Variables used in the firm-level analyses (N=396)
AbsDA1 0.034 0.033 0.000 0.023 0.181
AbsDA2 0.036 0.042 0.000 0.025 0.502
AbsDRev 0.020 0.018 0.000 0.015 0.141
BTM 0.512 0.371 -1.010 0.433 3.547
CapIntensity 0.274 0.201 0.000 0.227 1.061
CHS 0.221 0.215 0.000 0.189 1.493
Herf 0.124 0.104 0.028 0.081 0.801
HighTech 0.144 0.351 0.000 0.000 1.000
Lev 0.261 0.150 0.000 0.250 0.655
LnMgOwners 0.177 0.539 0.000 0.009 3.258
OpCycle 4.805 1.229 0.708 4.808 24.600
R&D 0.021 0.067 0.000 0.000 0.607
ROA 0.049 0.063 -0.153 0.042 0.456
StdCFO 0.036 0.033 0.000 0.027 0.418
StdEarnings 0.034 0.030 0.001 0.024 0.268
Variables used in the firm-analyst level analyses (N=4706)
FE 0.287 0.458 0.000 0.151 3.276
LnFEt 0.173 0.281 0.000 0.076 1.771
NumberAnalysts 21.775 8.063 1.000 21.000 45.000
LnAnalysts 3.126 0.399 0.693 3.091 3.828
ReturnVolatility 0.215 0.184 0.030 0.166 1.651
LengthAR 5.192 0.388 4.111 5.165 6.687
Loss 0.130 0.337 0.000 0.000 1.000
ADR 0.221 0.415 0.000 0.000 1.000
Segments 4.222 1.865 2.000 4.000 12.000
LnTA 22.981 1.389 20.119 22.809 25.867 This table presents descriptive statistics for the variables used in the empirical analyses. All variables are as
defined in appendix III.B.
216
Panel B: Comparison of variables at the firm-level split based on Guidance
Variable Guidance=0 (N=108) Guidance=1 (N=288) Diff in means
(1-0) Mean StdDev Min Median Max Mean StdDev Min Median Max
The significance of the difference in means is based on two-sided t-tests and is indicated as follows: *** p-value<0.01; ** p-value<0.05; * p-value<0.1. The
assumption of equal or unequal variance is tested in each case. See variable definitions in Appendix III.B.
217
Panel C: Comparison of variables at the analyst-firm level split based on Guidance
Variable Guidance=0 (N=1312) Guidance=1 (N=3394) Diff in means
(1-0) Mean StdDev Min Median Max Mean StdDev Min Median Max
The significance of the difference in means is based on two-sided t-tests and is indicated as follows: *** p-value<0.01; ** p-value<0.05; * p-value<0.1. The
assumption of equal or unequal variance is tested in each case. See variable definitions in Appendix III.B.
218
Panel D: Comparison of variables at the firm-level split based on SLG, conditional on the company providing Guidance
Variable SLG=0 (N=161) SLG=1 (N=127) Diff in means
(1-0) Mean StdDev Min Median Max Mean StdDev Min Median Max
The significance of the difference in means is based on two-sided t-tests and is indicated as follows: *** p-value<0.01; ** p-value<0.05; * p-value<0.1. The
assumption of equal or unequal variance is tested in each case. See variable definitions in Appendix III.B.
219
Panel E: Comparison of variables at the analyst-firm level split based on SLG, conditional on the company providing Guidance
Variable SLG=0 (N=1881) SLG=1 (N=1513) Diff in means
(1-0) Mean StdDev Min Median Max Mean StdDev Min Median Max
The significance of the difference in means is based on two-sided t-tests and is indicated as follows: *** p-value<0.01; ** p-value<0.05; * p-value<0.1. The
assumption of equal or unequal variance is tested in each case. See variable definitions in Appendix III.B.
220
Table III. 4: Correlation matrices
Panel A: Correlation matrix for the variables at firm-level
This table presents Pearson (above diagonal) and Spearman correlation coefficients (below diagonal) for the variables used at firm level. The sample contains 396
observations. See variable definitions in Appendix III.B. Statistical significance is based on two-sided t-tests and is indicated as follows: *** p-value<0.01; ** p-
value<0.05; * p-value<0.1.
221
Panel B: Correlation matrix for the variables at analyst-firm level
This table presents Pearson (above diagonal) and Spearman correlation coefficients (below diagonal) for the variables used at analyst-firm level. The sample
contains 4706 observations. See variable definitions in Appendix III.B. Statistical significance is based on two-sided t-tests and is indicated as follows: *** p-
value<0.01; ** p-value<0.05; * p-value<0.1.
Table III.5: Determinants of the decision to provide segment-level guidance
Variable SLG
HighTech -0.6905 *
(3.572)
LnMgOwners -0.7131 *
(3.170)
CHS -1.7344 ***
(6.887)
Herf -0.6707
(0.253)
R&D -2.8209
(0.994)
ROA -3.511
(1.684)
StdEarnings 5.2749
(1.297)
BTM -0.8790 *
(3.721)
Segments -0.0228
(0.083)
LnTA 0.0464
(0.168)
Intercept -0.0590
(0.001)
Likelihood Ratio 24.26 ***
Percent Concordant 65.0
Percent Discordant 34.5
N 288
This table reports results from a logistic model with SLG as dependent variable (the modeled value is SLG=1)
which examines the determinants of the decision to provide segment-level guidance. The unit of analysis is at
the firm level. The sample is conditional on companies providing management guidance. Statistical significance
is based on two-sided chi-square tests (Wald chi-square values presented in parentheses) and is indicated as
follows: *** p-value<0.01; ** p-value<0.05; * p-value<0.1. See variable definitions in Appendix III.B.
223
Table III.6: Segment-level guidance and financial analysts’ earnings forecast accuracy
Panel A: The role of providing segment-level guidance
This table reports results from regressions of financial analysts’ earnings forecast errors on the inconsistency of operating segments disclosed across corporate documents as
detailed in chapter II (variables of interest are Inc_DiffSegmentation and Inc_AddDisclosure) and including variables for the groups of companies based on the measures of
segment reporting quantity and quality as defined in chapter I as control variables. Model (1) is the baseline model from chapter II. Model (2) includes the continuous
variables of segment reporting quantity (SRQt) and segment reporting quality (SRQl) as controls. Model (3) includes the variables controlling for the group in which the
company is based on segment reporting quantity, i.e., Under-disclosers and Over-disclosers; the benchmark group is Box-tickers. Model (4) includes the variables controlling
for the group in which the company is based on segment reporting quality, i.e., LowQl and HighQl; the benchmark group is AvgQl. Model (5) includes controls for the groups
in which the company is based on both segment reporting quantity and quality. The unit of analysis is at the firm-analyst level for a sample of multi-segment European
companies part of the STOXX Europe 600 market index described in chapter II. The sample here is restricted due to the availability of data necessary to compute SRQl. All
other variables are as defined in chapter II. Standard errors are clustered at analyst level. The models also include industry fixed effects defined at the one-digit ICB code
level. Statistical significance is based on two-sided t-tests (t-values presented in parentheses) and is indicated as follows: *** p-value<0.01; ** p-value<0.05; * p-value<0.1.
234
forecast accurately, and an information overload that impairs analysts’ accuracy in the case of
Over-disclosers. In model (4), when holding the inconsistency across corporate documents
constant, I find significant coefficients on both LowQl and HighQl, compared to AvgQl, in
the expected direction. Lower segment reporting quality is associated with higher forecast
errors (in chapter I, the coefficient on LowQl was positive but insignificant), while higher
quality is associated with lower forecast errors. Including the groups based on both disclosure
quantity and quality in model (5) results in similar inferences. The conclusion of this table is
that including SRQt or SRQl either as continuous variables or as indicator variables based on
the group to which the company belongs on for these two dimensions (Under-disclosers/Box-
tickers/Over-disclosers and LowQl/AvgQl/HighQl), the quantity, quality, and inconsistency
dimensions do not subsume each other.
In table C2, I use a determinants model similar to the one in chapter I to test whether
inconsistency across corporate documents is associated with SRQl for the group of Box-
tickers. I find no significant relations between either Inc_DiffSegmentation or
Inc_AddDisclosure, and SRQl, which suggests that managers’ choice to disclose
inconsistently across corporate documents does not play a significant role for their choice of
aggregating operating segments into reportable segments.
235
Table C2: Test of the inconsistency variables (chapter II) as determinants of segment
reporting quality (SRQl) conditional on the company being a Box-ticker (chapter I)
Variables
(From ch. I)
(1) (2)
SRQl SRQl
Inc_DiffSegmentation 0.0251
(0.51)
Inc_AddDisclosure 0.0422
(0.58)
Herf 0.487 * 0.4691 *
(1.90) (1.81)
R&D -0.661 * -0.7146
(-1.71) (-1.65)
LnMgOwners 0.007 0.0084
(0.15) (0.17)
ROA 0.801 * 0.9207 **
(1.92) (2.22)
Loss -0.092 -0.0917
(-1.53) (-1.50)
M&A 0.181 *** 0.1767 ***
(2.82) (2.66)
Big4 0.124 ** 0.1330 *
(2.45) (2.39)
LengthAR 0.013 -0.0131
(0.17) (-0.17)
ADR -0.019 -0.0256
(-0.29) (-0.35)
EqIssue -0.035 -0.0211
(-0.88) (-0.58)
BTM 0.147 *** 0.1321 *
(2.01) (1.86)
LnTA -0.033 -0.0256
(-1.29) (-1.00)
Intercept 1.178 * 1.1276
(1.75) (1.57)
Industry FE YES YES
F-value 1.92 ** 1.42
Adj-R2 0.124 0.067
N 132 132
This table reports results from an OLS cross-sectional multivariate model discussed in chapter I, with SRQl as
dependent variable and hypothesized determinants as independent variables, conditional on the company being
in the Box-ticker group of SRQt. Additionally, the model includes the inconsistency variables
(Inc_DiffSegmentation and Inc_AddDisclosure) defined in chapter II as independent variables in the model. All
other variables are as defined in chapter I. The model includes industry fixed effects. Standard errors are
adjusted for heteroskedasticity. Statistical significance is based on two-sided t-tests (t-stats in parentheses) and is
indicated as follows: *** p-value<0.01; ** p-value<0.05; * p-value<0.1.
236
The second set of unifying analyses brings together chapters II and III. In chapter III,
the focus is on forward-looking operating segment disclosure made in the earnings
announcement press release and one set of tests there examines financial analysts’ earnings
forecast accuracy after managers release this information. Immediately after (either in the
same day or the next day) issuing the press release, managers usually hold a conference call
with financial analysts and investors to discuss the company’s financial performance and
future prospects. One research question that arises in the context of chapters II and III is
whether the usefulness of segment-level guidance is influenced by the consistency, or
inconsistency, of the operating segments disclosed in the press release and presentation
slides. To test this, in table C3, I run the analyst-firm level analyses in chapter III while
controlling for the inconsistency of operating segments arising from either different
segmentation (DiffSeg_Press_Present) or from the further disaggregation
(AddDiscl_Press_Present) of some operating segments disclosed across these two
documents.
Models (1) and (2) in table C3 are the baseline models, re-stating the results obtained
in chapter III based on the full sample and on sample conditional on companies providing
guidance, respectively, with segment-level guidance (SLG) as independent variable of
interest. Models (3) and (4) mirror the previous two models but also include
DiffSeg_Press_Present and AddDiscl_Press_Present as control variables. The results show
that, even after taking into account the inconsistency of operating segments disclosed across
the press release and presentation, the negative and significant relation between providing
segment-level guidance and earnings forecast errors still holds. In both models, the
coefficients on DiffSeg_Press_Present are not significant suggesting that for the sample of
companies providing segment-level guidance, disclosing different segmentations across these
two documents does not have a significant role for analysts’ accuracy. However,
237
Table C3: Segment-level guidance and financial analysts’ earnings forecast accuracy (chapter III), controlling for operating segment
disclosure inconsistency between the press release and the presentation to analysts (chapter II)
This table reports results from multivariate cross-sectional regression models as discussed in chapter III, with financial analysts’ earnings forecast errors (FE) as dependent
variable and segment-level guidance (SLG) as independent variable of interest. Additionally, the models include controls for the inconsistency of operating segments
disclosed in the earnings announcement press release and in the presentation to financial analysts based on chapter II; DiffSeg_Press_Present takes the value 1 when there is
variation between the operating segments disclosed across the two documents arising from different segmentations, and 0 otherwise; AddDisc_Press_Present takes the value
1 when there is variation between the operating segments disclosed across the two documents arising from some of the operating segments being further disaggregated in one
of the documents compared to the other. All other variables are as defined in chapter III. Model (1), run on the full sample, and model (2), conditional on the company
providing guidance, are the baseline models for the role of SLG in relation to FE as reported in chapter III. Model (3), run on the full sample, and model (4), conditional on
the company providing guidance, also include DiffSeg_Press_Present and AddDisc_Press_Present as control variables. Models (3) and (4) are conditional on the company
providing guidance. Models (5) and (6) test the role of segment-level guidance characteristics for analysts’ accuracy. For this analysis, model (5) is the baseline model from
chapter III. Model (6) also includes DiffSeg_Press_Present and AddDisc_Press_Present as control variables. The sample differs in between the baseline models and the ones
controlling for inconsistency of operating segment disclosure between the press release and the presentation due to the inavailability of these documents for some companies.
The unit of analysis is at the firm-analyst level. The models include other control variables as specified in chapter III, and industry fixed effects defined at the one-digit ICB
code level. Including country fixed effects does not significantly change the results. Standard errors are clustered at the analyst level. Statistical significance is based on two-
sided t-tests (t-stats in parentheses) and is indicated as follows: *** p-value<0.01; ** p-value<0.05; * p-value<0.1.
AddDiscl_Press_Present is negatively and significantly related to forecast errors, which
suggests that providing more disaggregated operating segments in one of these documents
contributes to lower forecast errors by providing more information to financial analysts.
Model (5) represents the baseline model from chapter III that examines the association
between segment-level guidance characteristics, i.e., Point_Range/Estimate/Narrative and
SEG, and forecast error. Model (6) suggests that the relations uncovered in chapter III remain
qualitatively similar even after controlling for the inconsistency of operating segments
disclosed across the press release and the presentation: (1) providing qualitative or narrative
segment-level guidance (Narrative), compared to the benchmark category of low-precision
estimates (Estimate), decreases forecast errors, but providing more precise segment-level
guidance (Point_Range) does not have a significant influence, and (2) more disaggregated
segment-level guidance (SEG) is negatively and significantly associated with forecast errors,
meaning that higher SEG improves analysts’ earnings forecast accuracy.
The overall take-away from these unifying analyses is that the disclosure
characteristics examined in the three chapters do not subsume each other and that the main
inferences in each of the chapters hold even after controlling for additional disclosure
characteristics. Nevertheless, the findings uncovered in this thesis must be interpreted
keeping in mind the inherent limitations of empirical archival methodology and in light of the
research design choices made in each of the essays (e.g., cross-sectional analyses, focus on a
sample of European companies, focus on 2009 as the first year of IFRS 8 adoption etc.)
Future research could extend our understanding of how and why these disclosure
characteristics matter by overcoming some of these limitations.
240
3. Avenues for future research
The analyses conducted in and the findings of this thesis could be used as a starting
point for future research that aims towards a deeper understanding of managers’ overall
disclosure and communication strategy for financial information (Miller & Skinner, 2015), be
it in the annual report or across various other venues that companies use to communicate with
capital markets. Future research that improves the research designs used in the three essays,
for example, in terms of extending the sample by looking at a different economic and legal
environment or by collecting data for additional years, could contribute to the literature by
adding to or confirming my findings. Other future research could explore the
interconnections between the disclosure characteristics investigated in this thesis and
characteristics such as readability (Li, 2008) or tone (e.g., Davis & Tama-Sweet, 2012)
identified in prior literature, the role that auditors play for disclosure, or how exactly financial
analysts use segment information.
3.1 Different economic and legal environment
Although based on a European sample of companies that apply IFRS 8, these findings
extend to the U.S. setting, as well, for two main reasons. First, the segment reporting
standards under IFRS and U.S. GAAP, IFRS 8 and SFAS 131, respectively, are completely
converged (IASB 2006; FASB 1997). Second, the companies in the sample are companies
listed on EU stock exchanges and included in STOXX Europe 600, a pan-European stock
market index similar in the type of composition to the S&P 1500. Therefore, given the
similarity of standard and representativeness of the sample, I believe that this thesis speaks to
the U.S. environment, too. Nevertheless, the differences in standard enforcement, the quality
241
of the financial reporting environment in general, and differences in the business and legal
environment (e.g., litigation risk) raise the question of whether these findings are indeed the
same in the U.S. environment. More interestingly, extensions of the research paper included
in chapter II could tackle the issue of inconsistency of operating segment disclosure in the
U.S. setting. For example, it could be that U.S. managers are more consistent when disclosing
operating segments in various documents than my findings about on the European sample
given the increased litigation risk compared to the European setting, and the SEC’s longer
experience of enforcing SFAS 131.
3.2 Extending the sample across time
Currently, the analyses in the three essays are run in cross-section with 2009, the first
year of adoption of IFRS 8, as the point of focus. This research design choice is discussed
and motivated in each essay, and is mostly due to the time restrictions imposed by manually
collecting the data for the main variables across all three papers. Nevertheless, extending the
sample across time may be a fruitful area of future investigation and may yield interesting,
and potentially complementary, insights to the current findings.
In chapter I, the sample contains one year of data in order to avoid the issue of
disclosure stickiness, and extending the sample to more years makes little sense. We know
from prior literature that disclosure tends to be sticky from one year to the other (Beyer et al.,
2010). Including more than one year of data could potentially limit the variation in our
measures of disclosure due to this phenomenon. Choosing the first year of IFRS 8 adoption as
sample year has the advantage of the “shake-up” that the change in standards brings to
disclosure. This is the time when managers, guided by auditors, need to decide how much
information and what operating segments to disclose under the requirements of the new
242
standard. Therefore, stickiness of disclosure from the previous year is less of a concern for
2009. At the same time, using data for the first year of adoption makes it more likely to find
results for the determinants of quality and quantity, if firm-level characteristics indeed matter.
To corroborate this argument, I compared the segment line item disclosure for 2009 with that
for 2010 for a random subsample of 27 firms (10% of the full sample) and there are no
significant differences in segment reporting quantity between the two years.
Extending the sample across time in the context of chapter II makes more sense and
would potentially complement the current results with a time-trend view of inconsistency in
disclosure. In a time-series, the focus of the research questions would necessarily change
from the current comparison between inconsistent and consistent disclosers to within-firm
investigations of the effects that changing from consistent to inconsistent disclosure has. For
example, it would be interesting to examine whether there is demand from financial analysts
for consistent disclosure in years subsequent to an “inconsistent disclosure” episode. A view
of the pattern of inconsistency across corporate documents in time would also allow an
examination of the reasons for which managers disclose inconsistently, and has the potential
to confirm the intuition that arises from looking at cross-sectional data that inconsistent
disclosure is a strategic choice that managers make in order to avoid disclosing some
sensitive information at the operating segment level.
For chapter III, extending the sample across multiple years is necessary to strengthen
the analyses since currently the sample for some of the tests is small which comes at the
expense of the power of the test. Additionally, prior literature on management guidance
typically employs data on several years, which allows better insights into the determinants of
the choice to provide a particular type of guidance, in this case, segment-level guidance.
243
3.3 The relation between disclosure characteristics
One potential avenue for future research, in the spirit of Francis, LaFond, Olsson, &
Schipper (2004), is to examine the relation between all (or a number of) disclosure
characteristics that prior literature has been looking at, including the ones examined in this
thesis. Francis et al. (2004) examine the relation between the cost of equity capital and seven
attributes of earnings: accrual quality, persistence, predictability, smoothness, value
relevance, timeliness, and conservatism. Their interest is to find which of these attributes has
a stronger relation to an important economic outcome and how these attributes behave when
considered interdependently rather than independently. In a similar fashion, future research
could investigate disclosure quantity, quality, readability, tone, inconsistency etc. in relation
to an outcome variable such as earnings forecast accuracy in an attempt to characterize the
relative importance of these disclosure characteristics, their interdependencies, and the role
each characteristic plays (if any) as part of an obfuscation strategy that managers may be
using, for example, in bad times. For example, is inconsistency used as part of an obfuscation
strategy? From this respect, chapter I represents a first step in this direction by investigating
the interplay between disclosure quantity and quality. The unifying analyses I report above
represent an additional step in this direction.
3.4 How do financial analysts use segment information?
Although there is extensive evidence on the usefulness of historical segment
information for financial analysts, as discussed throughout this thesis, there is little, if any,
direct evidence on exactly what information about a company’s operating segments analysts
use. Although some analyst reports contain earnings forecasts at the operating segment level,
244
there is no prior evidence on how analysts make these forecasts. In the interviews I have
conducted, the financial analysts seem to suggest that the secondary segmentation that some
companies provide in the spirit of the late IAS 14R is equally important to the (main)
operating segments disclosed as it is used to cross-check that forecasts for the operating
segments make sense (e.g., cross-check line-of-business earnings forecasts with geographical
forecasts), and that only a few of the accounting line items disclosed at the operating segment
level (i.e., those that are more likely to be disclosed by all companies, such as revenue and
EBITDA) are used in the valuation models. More insights can be drawn by looking at the
transcripts of a large sample of conference call Q&A sections. These transcripts may reveal
the questions that analysts ask about the firm’s segments, the additional information that
management is willing to give orally, but not in writing, and the areas related to operating
segments about which analysts challenge managers (e.g., questions to which managers do not
respond, or to which they give vague answers.)
3.5 Auditors’ influence on disclosure
Considering the variation in segment information disclosed in the note across
companies that I uncover in chapter I, some companies blatantly non-complying with
standard requirements, one question that arises relates to the role of auditors for disclosure.
For example, how much importance do auditors attach to the information provided in the
notes, and particularly how much importance do they attach to complying with disclosure
standards such as IFRS 8 or SFAS 131? Auditors are also reviewing, although not providing
an opinion on, the MD&A. In chapter II, I find that, in a significant number of cases, the
operating segments disclosed in the MD&A are not the operating segments disclosed in the
note to financial statements, i.e., there is inconsistency between the operating segments
245
disclosed in the annual report. It would be interesting to investigate the role that auditors play
in this matter. In an informal discussion, a former auditor suggested that auditors need “to
pick their battles” with management and oftentimes other aspects of applying financial
accounting take precedence over segment reporting. Litigation risk may also play a role on
auditors’ decision to challenge management on disclosure choices. While prior literature has
extensively investigated the role of auditors for earnings quality, there is less evidence on the
role that auditors play for accounting disclosures.
In conclusion, this thesis focuses on an important type of disclosure, segment
reporting, to provide insights into managers’ disclosure strategy and its usefulness for a
sophisticated category of users, sell-side equity analysts. By looking at the disclosure on
operating segments through an empirical archival lens and using manually-collected data,
from a quantity versus quality perspective, from an across multiple corporate documents
perspective, and from a forward-looking perspective, this thesis contributes to our
understanding of disclosure of operating segment information, in particular, and of financial
information, in general. Nevertheless, many aspects related to how and why managers make
certain choices when disclosing operating segment information remain a “black box.” Future
research could employ other research methodologies such as interviews or experiments with
managers and different categories of users to shed more light on the reasons behind
managers’ disclosure choices and the chain of causality between these choices and users’
decisions, and potentially support and/or complement the findings in this thesis.
246
Abstract
This thesis contains three stand-alone essays on the operating segment disclosures that
European multi-segment companies make under IFRS 8 Operating Segments. Each essay
aims to improve our collective understanding about managers’ disclosure strategy by
examining various characteristics of operating segment disclosure. Chapter I, entitled “The
Interplay between Segment Disclosure Quantity and Quality,” investigates managers’ choices
with respect to both disclosure quantity and disclosure quality, and the usefulness of these
two characteristics for financial analysts. Focusing on segment disclosures under the
management approach, I measure quantity as the number of segment-level line items and
quality as the cross-segment variation in profitability, and argue that greater managerial
discretion can be exercised over quality than over quantity. I hypothesize and find that
managers solve proprietary concerns either by deviating from the suggested line-item
disclosure in the standard, or if following standard guidance, by decreasing segment reporting
quality. Moreover, financial analysts do not always understand the quality of segment
disclosures, which suggests that a business-model type of standard creates difficulties even
for sophisticated users. My results inform standard setters as they start working on a
disclosure framework and as they seem to consider the business model approach to financial
reporting. Chapter II is entitled “Inconsistent Segment Disclosure across Corporate
Documents.” Market regulators in the U.S. and Europe investigate cases of inconsistent
disclosures when a company provides different information on the same topic in different
documents. Focusing on operating segments, this essay uses hand-collected data from four
different corporate documents of multi-segment firms to analyze the impact of inconsistent
disclosure on financial analysts’ earnings forecast accuracy. Inconsistencies that arise from
further disaggregation of operating segments in some documents seem to bring in new
information and increase analyst accuracy. However, when analysts must work with different,
difficult-to-reconcile segmentations, their information processing capacity and forecasts are
less accurate. These findings contribute to our understanding of the effects of managers’
disclosure strategy across multiple documents and have implications for regulators and
standard setters’ work on a disclosure framework. Chapter III is entitled “Management
Guidance at the Segment Level.” Prior research has found that managers add information to
their earnings guidance to justify, explain, or contextualize their forecasts. I identify segment-
level guidance (SLG) as a type of disaggregated information that multi-segment firms
provide with their management guidance, and investigate its usefulness for financial analysts’
earnings forecasting accuracy, as well as its influence on managers’ earnings fixation. I
further characterize the level of precision (point and range, maximum or minimum estimate,
or simply narrative) and of disaggregation of SLG. I find that companies in high tech
industries known for increased uncertainty in future performance are less likely to provide
SLG, and that SLG is associated with better forecasting accuracy. However, while providing
more item-disaggregated SLG improves accuracy, increased precision has no impact on
forecast accuracy. From the manager’s point of view, SLG creates incentives to engage in
earnings management, and the more precise the SLG is the greater the incentive. In contrast,
more item-disaggregated SLG discourages earnings management, perhaps by improving
monitoring. In a context where qualitative, narrative, and disaggregated guidance is regarded
247
as a solution to avoid earnings fixation and short termism, understanding which types of
information achieve this goal, and how, is relevant for managers, investors, and regulators
alike.
248
Résumé
Cette thèse contient trois essais distincts sur la publication d’information sectorielle que les
entreprises européennes ayant plusieurs secteurs opérationnels effectuent en vertu des IFRS 8
Secteurs Opérationnels. Chaque essai vise à améliorer notre compréhension collective sur la
politique de communication financière des cadres dirigeants en examinant diverses
caractéristiques des informations sectorielles. Le chapitre I, “L’interaction entre la qualité et
la quantité des publications sur l’information sectorielle” examine le choix des cadres
dirigeants à l'égard de la quantité et de la qualité, ainsi que l’utilité de ces deux
caractéristiques pour les analystes financiers. J’utilise le nombre de segments opérationnels
publiés comme mesure quantitative et la variation inter-sectorielle de la profitabilité comme
mesure qualitative et soutiens que plus de pouvoir discrétionnaire peut être exercé par les
dirigeants sur la qualité que sur la quantité. Je trouve que les cadres dirigeants résolvent les
préoccupations liées aux renseignements commerciaux de nature exclusive soit en déviant de
la quantité recommandée par la norme, ou, lorsqu’ils suivent la norme, en réduisant la qualité
de l’information sectorielle. Les analystes financiers n’apprécient pas toujours la qualité de
l’information sectorielle, ce qui suggère que le modèle business crée des difficultés même
pour des utilisateurs avertis. Mes résultats informent les normalisateurs lorsque ceux-ci
initient le développement d’un nouveau cadre conceptuel et lorsqu’ils semblent envisager
l’approche du modèle business pour le reporting. Le chapitre II s'intitule «La non-conformité
des secteurs opérationnels à travers des documents d'entreprise. » Les régulateurs de marché
examinent des cas de présentations lorsqu'une entreprise fournit des informations différentes
sur le même sujet dans différents documents. En mettant l’accent sur les secteurs
opérationnels, cet essai utilise des données recueillies manuellement auprès de quatre
documents d’entreprise afin d'analyser l'impact de la publication d’information non-conforme
sur l’exactitude des prévisions de résultat des analystes financiers. La non-conformité qui
découle de la déségrégation supplémentaire des secteurs semble introduire de nouveautés et
contribue à l’exactitude des prévisions. La publication des segmentations difficilement
réconciliables entraine une exactitude réduite des prévisions. Ces résultats contribuent à notre
compréhension des effets de la politique de communication des dirigeants à travers plusieurs
documents et ont des répercussions sur le travail les régulateurs. Le chapitre III s'intitule «
Prévisions managériales au niveau sectoriel. » Je considère les prévisions au niveau sectoriel
(PNS) comme un type d'information désagrégé que les entreprises fournissent ensemble avec
leur stratégie de gestion. J’examine l’utilité de cette information pour l’exactitude des
prévisions de résultat par les analystes ainsi que l’impact de cette information sur la
manipulation du résultat. Je constate que les entreprises de haute technologie réputées pour
l’incertitude supplémentaire liée à profitabilité sont moins susceptibles de fournir des PNS et
que le PNS est associé à une prévision améliorée. Cependant, alors que la communication de
davantage de PNS désagrégé par secteur a tendance à améliorer la précision, plus de
précision ne semble pas avoir d’importance. Du point de vue des cadres dirigeants, les PNS
les incitent à manipuler le résultat comptable, mais le PNS désagrégé par poste semble
décourager la manipulation, fort probablement due à une surveillance supplémentaire. Dans
un contexte où une orientation narrative et désagrégée est considérée comme la solution pour
empêcher la vision à court terme, comprendre quel type d'information permet d’atteindre cet
249
objectif, et de quelle manière, est tout autant pertinent pour les cadres dirigeants, les
investisseurs et les régulateurs.
250
Bibliography
Ajinkya, B. B., & Gift, M. J. (1984). Corporate Managers’ Earnings Forecasts and
Symmetrical Adjustments of Market Expectations. Journal of Accounting Research,
22(2), 425–444.
Akamah, H., Hope, O.-K., & Thomas, W. B. (2014). Tax Havens and Disclosure
Aggregation. Working Paper.
Ali, A., Klasa, S., & Yeung, P. E. (2014). Industry concentration and corporate disclosure
policy. Journal of Accounting and Economics, 58(2-3), 240–264.
André, P., Ben-Amar, W., & Saadi, S. (2014). Family firms and high technology Mergers &
Acquisitions. Journal of Management & Governance, 18(1), 129–158.
André, P., Broye, G., Pong, C., & Schatt, A. (2014). Are Joint Audits Associated with Higher
Fees? Working Paper.
Armstrong, C. S., Core, J. E., & Guay, W. R. (2014). Do independent directors cause
improvements in firm transparency? Journal of Financial Economics, 113(3), 383–403.
Ashbaugh, H., & Pincus, M. (2001). Domestic Accounting Standards, International
Accounting Standards, and the Predictability of Earnings. Journal of Accounting
Research, 39(3), 417–434.
Athanasakou, V. E., Strong, N. C., & Walker, M. (2009). Earnings management or forecast
guidance to meet analyst expectations? Accounting and Business Research, 39(1), 3–35.
Bae, K. H., Tan, H., & Welker, M. (2008). International GAAP Differences: The Impact on
Foreign Analysts. The Accounting Review, 83(3), 593–628.
Baginski, S. P., Conrad, E. J., & Hassell, J. M. (1993). The Effects of Management Forecast
Precision on Equity Pricing and on the Assessment of Earnings Uncertainty. The
Accounting Review, 68(4), 913–927.
Baginski, S. P., Hassell, J. M., & Hillison, W. A. (2000). Voluntary Causal Disclosures:
Tendencies and Capital Market Reaction. Review of Quantitative Finance and
Accounting, 15, 371–389.
Baginski, S. P., Hassell, J. M., & Kimbrough, M. D. (2004). Why do managers explain their
earnings forecasts? Journal of Accounting Research, 42(1), 1–29.
Baginski, S. P., & Rakow, K. C. (2011). Management earnings forecast disclosure policy and
the cost of equity capital. Review of Accounting Studies, 17(2), 279–321.
Baiman, S., & Verrecchia, R. E. (1996). The Relation Among Capital Markets, Financial
Disclosure, Production Efficiency, and Insider Trading. Journal of Accounting
Research, 34(1), 1.
251
Balakrishnan, R., Harris, T. S., & Sen, P. K. (1990). The Predictive Ability of Geographic
Segment Disclosures. Journal of Accounting Research, 28(2), 305–325.
Baldwin, B. A. (1984). Segment Earnings Disclosure and the Ability of Security Analysts to
Forecast Earnings Per Share. The Accounting Review, LIX(3), 376–389.
Ball, R., & Brown, P. (1968). An Empirical Evaluation of Accounting Income Numbers.
Journal of Accounting Research, 1(Autumn), 159–178.
Ball, R., & Shivakumar, L. (2006). The Role of Accruals in Asymmetrically Timely Gain and
Loss Recognition. Journal of Accounting Research, 44(2), 207–242.
Bamber, L. S., & Cheon, Y. S. (1998). Discretionary Management Earnings Forecast
Disclosures: Antecedents and Outcomes Associated with Forecast Venue and Forecast
Specificity Choices. Journal of Accounting Research, 36(2), 167–190.
Barker, R., Barone, E., Birt, J., Gaeremynck, A., Mcgeachin, A., Marton, J., & Moldovan, R.
(2013). Response of the EAA FRSC to the EFRAG/ANC/FRC Discussion Paper:
Towards a Disclosure Framework for the Notes. Accounting in Europe, 10(1), 1–26.
Barron, O. E., Byard, D., Kile, C., & Riedl, E. J. (2002). High-Technology Intangibles and
Analysts’ Forecasts. Journal of Accounting Research, 40(2), 289–312.
Barth, M., & Schipper, K. (2008). Financial reporting transparency. Journal of Accounting,
Auditing & Finance, 173–191.
BDO. (2011). ESMA’s review on the implementation of IFRS 8 - Operating Segments.
International FInancial Reporting Bulletin, 16.
Beattie, V. (2014). Accounting narratives and the narrative turn in accounting research:
Issues, theory, methodology, methods and a research framework. British Accounting
Review, 46(2), 111–134.
Beaver, W. H. (1968). The Information Content of Annual Earnings Announcements. Journal
of Accounting Research, 6, 67–92.
Behn, B. K., Nichols, N. B., & Street, D. L. (2002). The Predictive Ability of Geographic
Segment Disclosures by U.S. Companies: SFAS No. 131 vs. SFAS No. 14. Journal of
International Accounting Research, 1(1), 31–44.
Bens, D. A., Berger, P. G., & Monahan, S. J. (2011). Discretionary Disclosure in Financial
Reporting: An Examination Comparing Internal Firm Data to Externally Reported
Segment Data. The Accounting Review, 86(2), 417–449.
Bens, D. A., & Monahan, S. J. (2004). Disclosure Quality and the Excess Value of
Diversification. Journal of Accounting Research, 42(4), 691–731.
Beretta, S., & Bozzolan, S. (2004). A framework for the analysis of firm risk communication.
The International Journal of Accounting, 39(3), 265–288.
252
Berger, P. G. (2011). Challenges and opportunities in disclosure research—A discussion of
“The financial reporting environment: Review of the recent literature.” Journal of
Accounting and Economics, 51(1-2), 204–218.
Berger, P. G., & Hann, R. (2002). Segment Disclosures, Proprietary Costs, and the Market
for Corporate Control. Working Paper.
Berger, P. G., & Hann, R. (2003). The Impact of SFAS No. 131 on Information and
Monitoring. Journal of Accounting Research, 41(2), 163–223.
Berger, P. G., & Hann, R. (2007). Segment Profitability and the Proprietary and Agency
Costs of Disclosure. The Accounting Review, 82(4), 869–906.
Berger, P. G., & Ofek, E. (1995). Diversification’s effect on firm value. Journal of Financial
Economics, 37, 39–65.
Berger, P. G., & Ofek, E. (1999). Causes and Effects of Corporate Refocusing Programs.
Review of Financial Studies, 12(2), 311–345.
Berry, D. A. (1987). Logarithmic Transformations in ANOVA. Biometrics, 43(2), 439–456.
Beyer, A., Cohen, D. A., Lys, T. Z., & Walther, B. R. (2010). The financial reporting
environment: Review of the recent literature. Journal of Accounting and Economics,
50(2-3), 296–343.
Bhojraj, S., Libby, R., & Yang, H. (2012). Guidance frequency and guidance properties: The
effect of reputation-building and learning-by-doing. Working Paper.
Bhushan, R. (1989). Firm characteristics and analyst following. Journal of Accounting and
Economics, 11(2-3), 255–274.
Blacconiere, W. G., Frederickson, J. R., Johnson, M. F., & Lewis, M. F. (2011). Are
voluntary disclosures that disavow the reliability of mandated fair value information
informative or opportunistic? Journal of Accounting and Economics, 52(2-3), 235–251.
Blanco, B., Garcia Lara, J. M., & Tribo, J. A. (2015). Segment Disclosure and Cost of
Capital. Journal of Business Finance & Accounting, (January), 1–45.
Bloomfield, R., Hodge, F., Hopkins, P., & Rennekamp, K. (2015). Does Coordinated
Presentation Help Credit Analysts Identify Firm Characteristics? Contemporary
Accounting Research, forthcoming.
Bloomfield, R. J. (2002). The “Incomplete Revelation Hypothesis” and Financial Reporting.
Accounting Horizons, 16(3), 233–243.
Blouin, J. L., & Robinson, L. a. (2014). Insights from Academic Participation in the FAF’s
Initial PIR: The PIR of FIN 48. Accounting Horizons, 28(3), 479–500.
Boatsman, J. R., Behn, B. K., & Patz, D. H. (1994). A Test of the Use of Geographical
Segment Disclosures. Journal of Accounting Research, 31(Supplement), 46–65.
253
Botosan, C. A. (1997). Disclosure level and the cost of equity capital. The Accounting
Review, 72(3), 323–349.
Botosan, C. A. (2004). Discussion of a framework for the analysis of firm risk
communication. The International Journal of Accounting, 39(3), 289–295.
Botosan, C. A., & Harris, M. S. (2000). Motivations for a Change in Disclosure Frequency
and Its Consequences: An Examination of Voluntary Quarterly Segment Disclosures.
Journal of Accounting Research, 38(2), 329–353.
Botosan, C. A., & Stanford, M. (2005). Managers’ Motives to Withhold Segment Disclosures
and the Effect of SFAS No. 131 on Analysts’ Information Environment. The Accounting
Review, 80(3), 751–771.
Bozzolan, S., Trombetta, M., & Beretta, S. (2009). Forward-Looking Disclosures, Financial
Verifiability and Analysts’ Forecasts: A Study of Cross-Listed European Firms.
European Accounting Review, 18(3), 435–473.
Bradshaw, M. T. (2009). Analyst information processing, financial regulation, and academic
research. The Accounting Review, 84(4), 1073–1083.
Bradshaw, M. T. (2011). Analysts’ Forecasts: What Do We Know After Decades of Work?
Working Paper.
Bradshaw, M. T., Miller, G. S., & Serafeim, G. (2009). Accounting Method Heterogeneity
and Analysts’ Forecasts. Working Paper.
Bradshaw, M. T., Richardson, S. A., & Sloan, R. G. (2001). Do Analysts and Auditors Use
Information in Accruals? Journal of Accounting Research, 39(1), 45–74.
Bratten, B., Choudhary, P., & Schipper, K. (2013). Evidence that Market Participants Assess
Recognized and Disclosed Items Similarly when Reliability is Not an Issue. The
Accounting Review, 88(4), 1179–1210.
Brazel, J. F., Lail, B. E., & Pagach, D. P. (2013). The Role of Non-Financial Measures in
Management Forecasts. Working Paper.
Brown, L. D., Call, A. C., Clement, M. B., & Sharp, N. Y. (2015). Inside the “Black Box” of
Sell-Side Financial Analysts. Journal of Accounting Research, 53(1), 1–47.
Bugeja, M., Czernkowski, R., & Moran, D. (2014). The Impact of the Management Approach
on Segment Reporting. Journal of Business Finance & Accounting, (forthcoming).
Burgstahler, D. C., & Eames, M. J. (2003). Earnings Management to Avoid Losses and
Earnings Decreases: Are Analysts Fooled? Contemporary Accounting Research, 20(2),
253–294.
Call, A. C., Chen, S., Miao, B., & Tong, Y. H. (2014). Short-term earnings guidance and
accrual-based earnings management. Review of Accounting Studies, 19(2), 955–987.
254
Callen, J. L., Hope, O.-K., & Segal, D. (2005). Domestic and Foreign Earnings, Stock Return
Variability, and the Impact of Investor Sophistication. Journal of Accounting Research,
43(3), 377–412.
CFA Institute. (2007). A Comprehensive Business Reporting Model - Financial Reporting for
Investors. Report.
CFA Institute. (2013). Financial Reporting Disclosures: Investor Perspectives on
Transparency, Trust, and Volume. Report.
Chen, P. F., & Zhang, G. (2003). Heterogeneous Investment Opportunities in Multiple-
Segment Firms and the Incremental Value Relevance of Segment Accounting Data. The
Accounting Review, 78(2), 397–428.
Chen, P. F., & Zhang, G. (2007). Segment Profitability, Misvaluation, and Corporate
Divestment. The Accounting Review, 82(1), 1–26.
Chen, S., DeFond, M. L., & Park, C. W. (2002). Voluntary disclosure of balance sheet
information in quarterly earnings announcements. Journal of Accounting and
Economics, 33(2), 229–251.
Chen, S., Matsumoto, D., & Rajgopal, S. (2011). Is silence golden? An empirical analysis of
firms that stop giving quarterly earnings guidance. Journal of Accounting and
Economics, 51(1-2), 134–150.
Cheng, Q., Luo, T., & Yue, H. (2013). Managerial Incentives and Management Forecast
Precision. The Accounting Review, 88(5), 1575–1602.
Clarkson, P. M., Kao, J. L., & Richardson, G. D. (1999). Evidence That Management
Discussion and Analysis (MD&A) is a Part of a Firm’s Overall Disclosure Package.
Contemporary Accounting Research, 16(1), 111–134.
Clement, M. B. (1999). Analyst forecast accuracy: Do ability, resources, and portfolio
complexity matter? Journal of Accounting and Economics, 27, 285–303.
Coffee, J. C. (2002). Racing Towards the Top?: The Impact of Cross-Listings and Stock
Market Competition on International Corporate Governance. Working Paper.
Collins, D., & Henning, S. (2004). Write-Down Timeliness, Line-of-Business Disclosures
and Investors’ Interpretations of Segment Divestiture Announcements. Journal of
Business Finance & Accounting, 31(9&10), 1261–1300.
Collins, D. W. (1976). Predicting Earnings with Sub-Entity Data: Some Further Evidence.
Journal of Accounting Research, 14(1), 163–177.
Core, J. E. (2001). A review of the empirical disclosure literature: discussion. Journal of
Accounting and Economics, 31(1-3), 441–456.
255
Cormier, D. & Magnan, M. (2004). The impact of the Web on information and
communication modes: The case of corporate environmental disclosure. International
Journal of Technology Management, 27(4), 393-416.
Cotter, J., Tarca, A., & Wee, M. (2012). IFRS adoption and analysts’ earnings forecasts:
Australian evidence. Accounting and Finance, 52, 395–419.
Cotter, J., Tuna, J., & Wysocki, P. D. (2006). Expectations Management and Beatable
Targets: How Do Analysts React to Explicit Earnings Guidance? Contemporary
Accounting Research, 23(3), 593–624.
Crawford, L., Extance, H., Helliar, C., & Power, D. (2012). Operating segments: The
usefulness of IFRS 8. ICAS Insight Publication.
Custódio, C. (2014). Mergers and Acquisitions Accounting and the Diversification Discount.
Journal of Finance, 69(1), 219–240.
Das, S. (1998). Financial Analysts’ Earnings Forecasts For Loss Firms. Managerial Finance,
24(6), 37–46.
Davis, A. K., & Tama-Sweet, I. (2012). Managers’ Use of Language Across Alternative
Disclosure Outlets: Earnings Press Releases versus MD&A. Contemporary Accounting
Research, 29(3), 804–837.
Dechow, P. M., & Dichev, I. D. (2002). The Quality of Accruals and Earnings: The Role of
Accrual Estimation Errors. The Accounting Review, 77(s-1), 35–59.
Defond, M. L., & Jiambalvo, J. (1994). Debt covenant violation and manipulation of
accruals. Journal of Accounting and Economics, 7, 145–176.
Denis, D. J., Denis, D. K., & Sarin, A. (1997). Agency Problems, Equity Ownership, and
Corporate Diversification. The Journal of Finance, LII(1), 135–161.
Denis, D. J., Denis, D. K., & Yost, K. (2002). Global Diversification, Industrial
Diversification, and Firm Value. The Journal of Finance, LVII(5), 1951–1979.
Depoers, F., & Jeanjean, T. (2012). Determinants of Quantitative Information Withholding in
Annual Reports. European Accounting Review, 21(1), 115–151.
Dichev, I. D., Graham, J. R., Harvey, C. R., & Rajgopal, S. (2013). Earnings quality:
Evidence from the field. Journal of Accounting & Economics, 56(1), 1–33.
Diether, K. B., Malloy, C. J., & Scherbina, A. (2002). Differences of Opinion and the Cross
Section of Stock Returns. The Journal of Finance, LVII(5), 2113–2141.
Dixon, C. T. (2011). SEC Disclosure and Corporate Governance. Weil Gotshal Alert from the
Public Company Advisory Group at Weil, Gotshal & Manges LLP.
256
Doyle, J. T., & Magilke, M. J. (2009). The Timing of Earnings Announcements: An
Examination of the Strategic Disclosure Hypothesis. The Accounting Review, 84(1),
157–182.
Duffee, G. R. (1995). Stock returns and volatility - A firm-level analysis. Journal of
Financial Economics, 37, 399–420.
Dunn, K., & Nathan, S. (2005). Analyst Industry Diversification and Earnings Forecast
Accuracy. The Journal of Investing, 7–14.
Dutta, S., & Gigler, F. (2002). The Effect of Earnings Forecasts on Earnings Management.
Journal of Accounting Research, 40(3), 631–655.
Dye, R. A. (1986). Proprietary and Nonproprietary Disclosures. Journal of Business, 59(2),
331–366.
EFRAG. (2012). EFRAG, ANC & FRC Discussion Paper: Towards a Disclosure Framework
for the Notes. Discussion Paper.
Einhorn, E., & Ziv, A. (2008). Intertemporal Dynamics of Corporate Voluntary Disclosures.
Journal of Accounting Research, 46(3), 567–589.
Elliott, W. B., Hobson, J. L., & Jackson, K. E. (2011). Disaggregating Management Forecasts
to Reduce Investors’ Susceptibility to Earnings Fixation. The Accounting Review, 86(1),
185–208.
Ellis, J. A., Fee, C. E., & Thomas, S. E. (2012). Proprietary Costs and the Disclosure of
Information About Customers. Journal of Accounting Research, 50(3), 685–727.
ESMA. (2011). Review of European enforcers on the implementation of IFRS 8 – Operating
Segments. Report.
ESMA. (2012). Activity Report on IFRS Enforcement in the European Economic Area in
2011. Report.
Ettredge, M., Kwon, S. Y., & Smith, D. (2002a). Competitive Harm and Companies’
Positions on SFAS No. 131. Journal of Accounting, Auditing & Finance, 17(2), 93–109.
Ettredge, M., Kwon, S. Y., & Smith, D. (2002b). Security Market Effects Associated with
SFAS No. 131: Reported Business Segments. Review of Quantitative Finance and
Accounting, 18(4), 323–344.
Ettredge, M. L., Kwon, S. Y., Smith, D. B., & Stone, M. S. (2006). The Effect of SFAS No.
131 on the Cross-segment Variability of Profits Reported by Multiple Segment Firms.
Review of Accounting Studies, 11(1), 91–117.
Ettredge, M. L., Kwon, S. Y., Smith, D. B., & Zarowin, P. A. (2005). The Impact of SFAS
No . 131 Business Segment Data on the Market’s Ability to Anticipate Future Earnings.