Page 1
The Pennsylvania State University
The Graduate School
College of Agricultural Sciences
THREE ESSAYS ON TECHNOLOGY DEVELOPMENT AND FDI IN CHINA: REGIONAL
SPILLOVER, FACTOR BIAS SPILLOVER, AND CHANGE OF ENERGY INTENSITY
A Dissertation in
Agricultural, Environmental and Regional Economics
by
Yong Hu
© 2012 Yong Hu
Submitted in Partial Fulfillment
of the Requirements
for the Degree of
Doctor of Philosophy
May 2012
Page 2
i
The dissertation of Yong Hu was reviewed and approved* by the following:
Karen Fisher-Vanden
Associate Professor of Agricultural Economics
Dissertation Adviser
Chair of Committee
David G. Abler
Professor of Agricultural Economics
Spiro E. Stefanou
Professor of Agricultural Economics
Zhen Lei
Assistant Professor of Energy and Environmental Economics
Ann Tickamyer
Professor and Head, Department of Agricultural Economics and Rural Sociology
* Signatures are on file in the Graduate School.
Page 3
ii
ABSTRACT
This thesis investigates how the spillover effect of R&D expenditures and foreign direct investment (FDI)
affect firms’ productivity, technology development, and energy efficiency in China. Specifically, the first
essay uses firm-level panel data from Chinese enterprises to examine how regional differences influence
the impact of technology spillovers on firms’ productivity. This essay contributes to the existing literature
in the following aspects: providing regional evidence that vertical channels are more important than
horizontal channels to generate positive spillovers; providing empirical evidence on how regional
differences, including geographical endowments, economic factors, and government policies, affect
within-region and outside-region spillovers; providing empirical evidence to support the fact that China’s
“Grand Western Development Program” helped to reduce the economic disparity between the Western
region and Coastal region. We find within-region spillover effects improve the productivity of firms in the
Eastern region, which may due to the “Coastal Development Strategies” and the Eastern region’s
geographical advantages; firms in the Northeastern region receive significant cost-increasing outside-
region spillover effects, which is in some extent caused by the low performances of SOEs in the Northeast;
firms in the Southwestern region, which has the lowest GDP among five Chinese regions, receive
significant cost-saving within-region and outside-region spillover effects, which may be a result of the
fact that Coastal region has bigger positive impacts on the Western region after the implementation of
“Grand Western Development Program”. The second essay investigates the factor-bias spillover effect of
FDI in China. Specifically, we examine how domestic enterprises guide their technology development
direction in response to FDI in their horizontal industry, upstream industry, or downstream industry.
Moreover, we will investigate the impact on FDI spillovers, resulting from China’s joining of the World
Trade Organization in 2001. Our empirical results show that foreign capital invested in upstream
industries results in the use of more materials; foreign capital in downstream industries induces the use of
more capital, but less labor; and foreign capital in horizontal industries induces saving in capital, but
using in materials. Competition from foreign firms in the same industry spurs domestic firms to reduce
Page 4
iii
their production cost by more intensively utilizing their relative factors endowment, which is capital-
scarce, labor- and material-abundant. FDI in upstream industry produces higher quality outputs inducing
Chinese firms to outsource more. Benefiting from technology transferred from downstream foreign
consumers, local suppliers exhibit technical change with capital-using, labor- and material-saving factor
bias. The third essay investigates how R&D expenditures and FDI, as well as other factors, influence the
energy intensity in four Chinese high energy consumption industries. Results suggest that China’s
increased openness to the world and R&D expenditures only bring benefits a couple of industries in
improving their energy efficiency, while rising energy costs and China’s industrial policy—“grasping the
large, letting go off the small” are significant contributors to the decline in energy intensity in all four
industries.
Page 5
iv
TABLE OF CONTENTS
List of Figures ……………………………………………………………………………..…….vi
List of Tables ………………………. ………………………………………………..…...….……..vii
ACKNOWLEDGEMENTS……………………………………………………………………………….….…ix
1 Chapter one: Introduction......................................................................................................................................1
1.1 Background & Motivation........................................................................................................................................1
1.2 Objectives & brief outline........................................................................................................................................5
References………………………………………………………………………………………………..……………7
2 Chapter two: Region Development and Technology Spillover in China............................................8
2.1 Introduction…………………………………………………………………………………………..…….……..8
2.2 Literature review….…………………………………………………………………………………..………….11
2.3 Data……………………………………………………………………………………………………..…….....15
2.4 Model specification and methodology…….…………………………………………………………..…………24
2.5 Results and interpretation……………………………………………………………………………………….29
2.5.1 Empirical Result…….……………………………………………………………………………….….…29
2.5.2 Rapid Growth in the Eastern Region…………………………………………………………...……..…..33
2.5.3 The Impact of “Grand Western Development Program” on the Southwestern Region………….…..….36
2.5.4 SOE Reform in the Northeastern Region…………………………………………………………...…….39
2.7 Conclusion…………………………………………………………………………………………………...…...45
References…………………………………………………………………………………………………………….72
3 Chapter three: Factor Bias Spillover Effect of FDI in China………………………………..76
3.1 Introduction……………………………………………………….…………………………………………….76
3.2 Literature review………………………………………………………………………………………………..85
3.3 Data……………………………………………………………………………………………………………..90
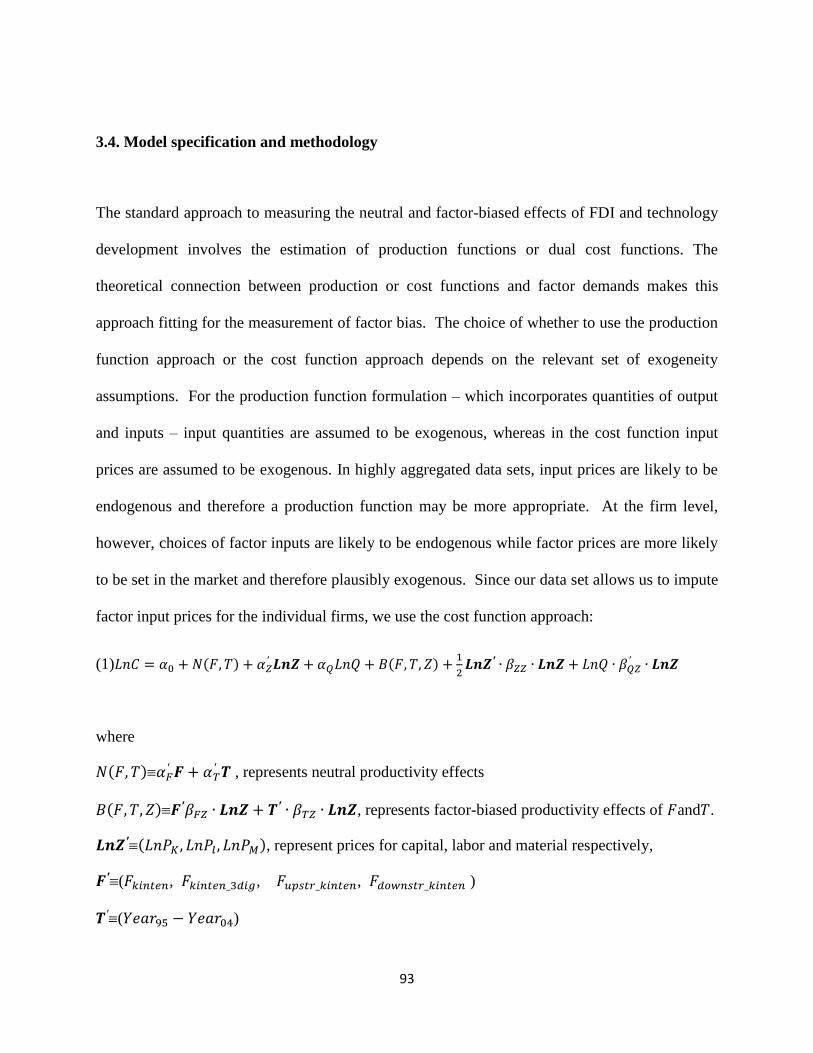
3.4 Model specification and Methodology………………………………………………………………………….93
3.5 Results and Interpretation……………………………………………………………………………..………..97
3.6 Conclusion…………………………………………………………………………………..…………………104
References……………………………………………………………………………………..……………………114
Page 6
v
4 Chapter four: Factors Influencing Energy Intensity in Four Chinese Industries………….…..118
4.1 Introduction…………………………………………………………………………………………………….118
4.2 Energy Consumptions and Development Policies in Four Chinese Industries………..…………..…...………122
4.3 Literature Review & Research Hypothesis………………………………………………………….………….126
4.4 Data…………………………………………………………………………………………………………….130
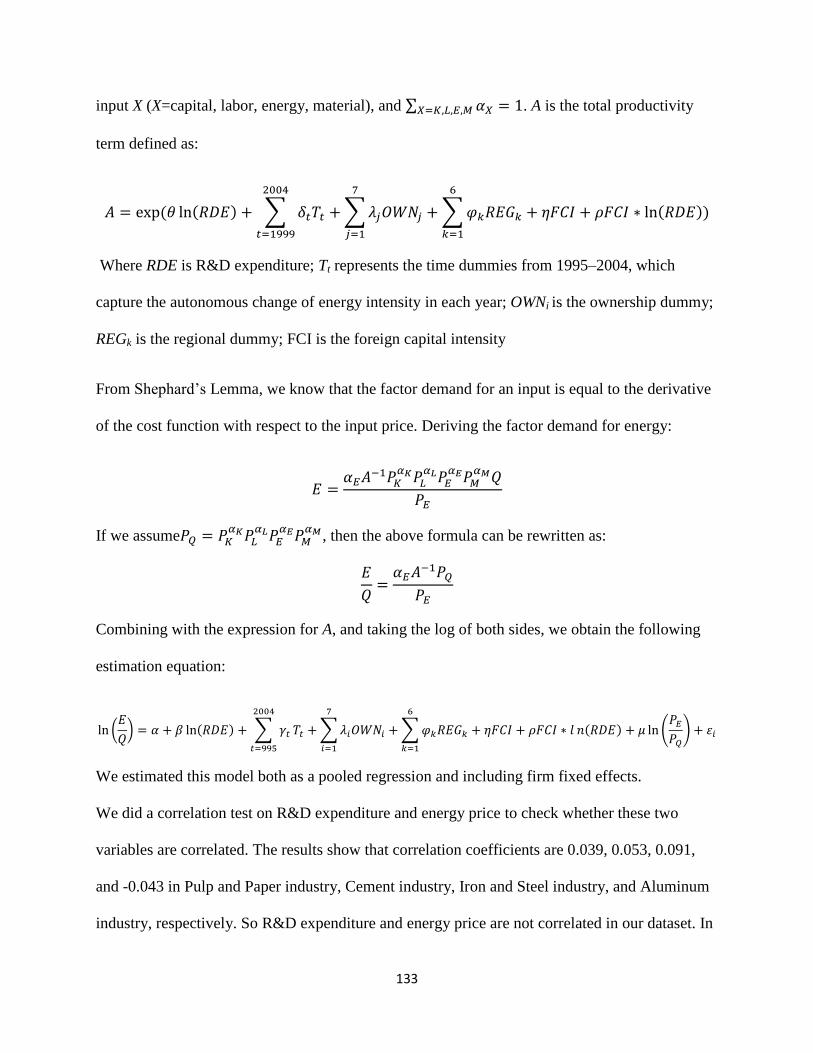
4.5 Model Specification…………………………………………………………………………………………….132
4.6 Results and Interpretation………………………………………………………………………………………134
4.7 Robustness Analysis…………………………………………………………………………………………….139
4.8 Conclusion…………………………………………………………………………………………………...…141
References…………………………………………………………………..…………………………………….....155
Page 7
vi
List of Figures
Figure 2.1 Annual Growth Rate in Each Chinese Region (1992-2004)………..……….……....49
Figure 2.2 FDI in Eastern China…………………………………………………………………49
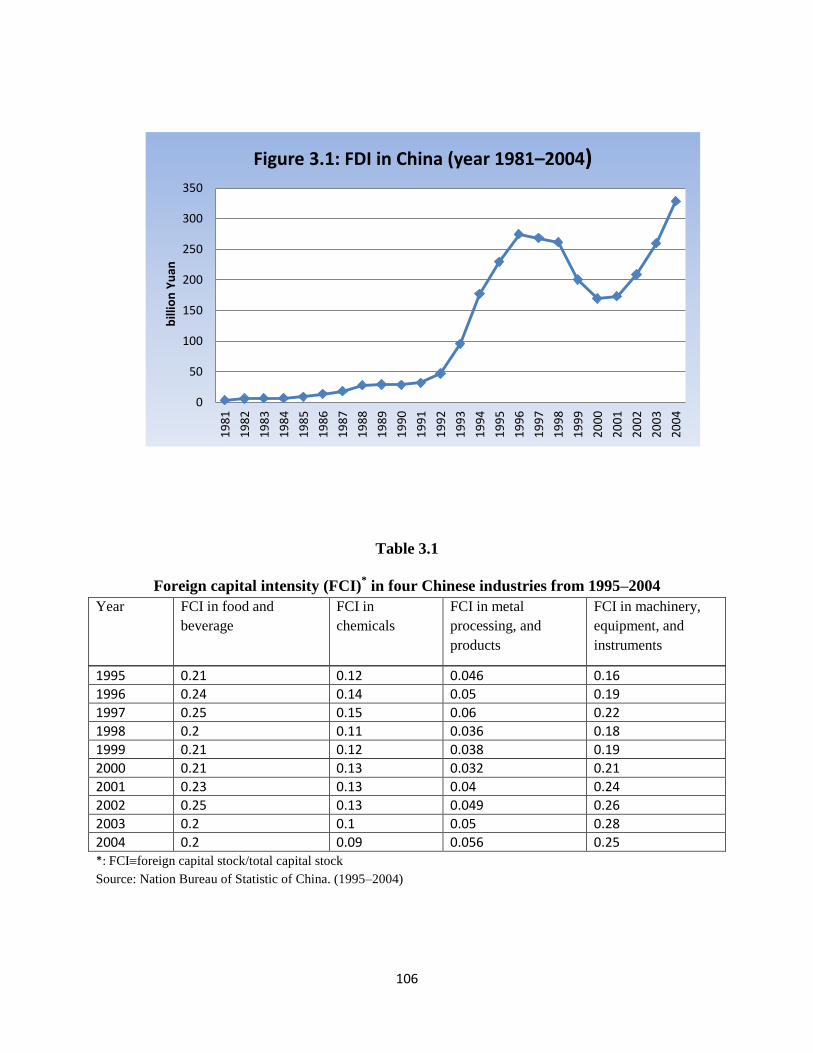
Figure 3.1 FDI in China (Year 1981-2004)………………………………………………..…...106
Page 8
vii
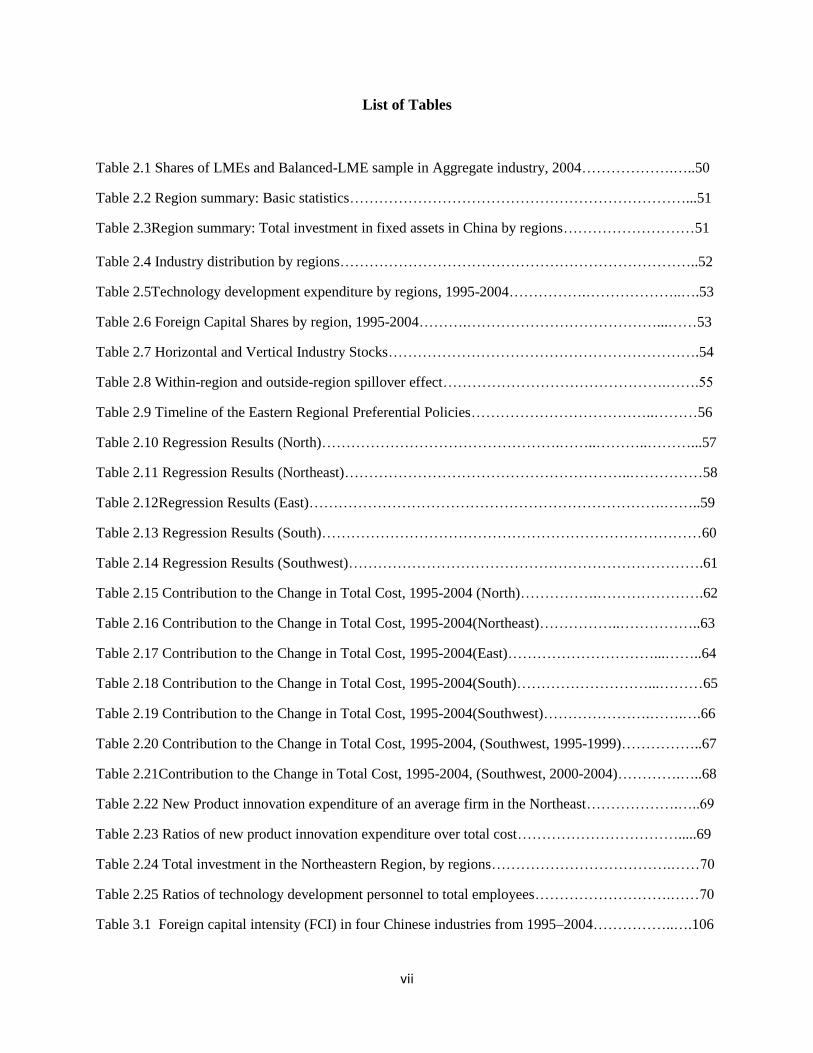
List of Tables
Table 2.1 Shares of LMEs and Balanced-LME sample in Aggregate industry, 2004……………….…..50
Table 2.2 Region summary: Basic statistics……………………………………………………………...51
Table 2.3Region summary: Total investment in fixed assets in China by regions………………………51
Table 2.4 Industry distribution by regions………………………………………………………………..52
Table 2.5Technology development expenditure by regions, 1995-2004…………….………………..….53
Table 2.6 Foreign Capital Shares by region, 1995-2004……….…………………………………...……53
Table 2.7 Horizontal and Vertical Industry Stocks……………………………………………………….54
Table 2.8 Within-region and outside-region spillover effect……………………………………….…….55
Table 2.9 Timeline of the Eastern Regional Preferential Policies………………………………..………56
Table 2.10 Regression Results (North)………………………………………….……..………..………...57
Table 2.11 Regression Results (Northeast)…………………………………………………..……………58
Table 2.12Regression Results (East)……………………………………………………………….……..59
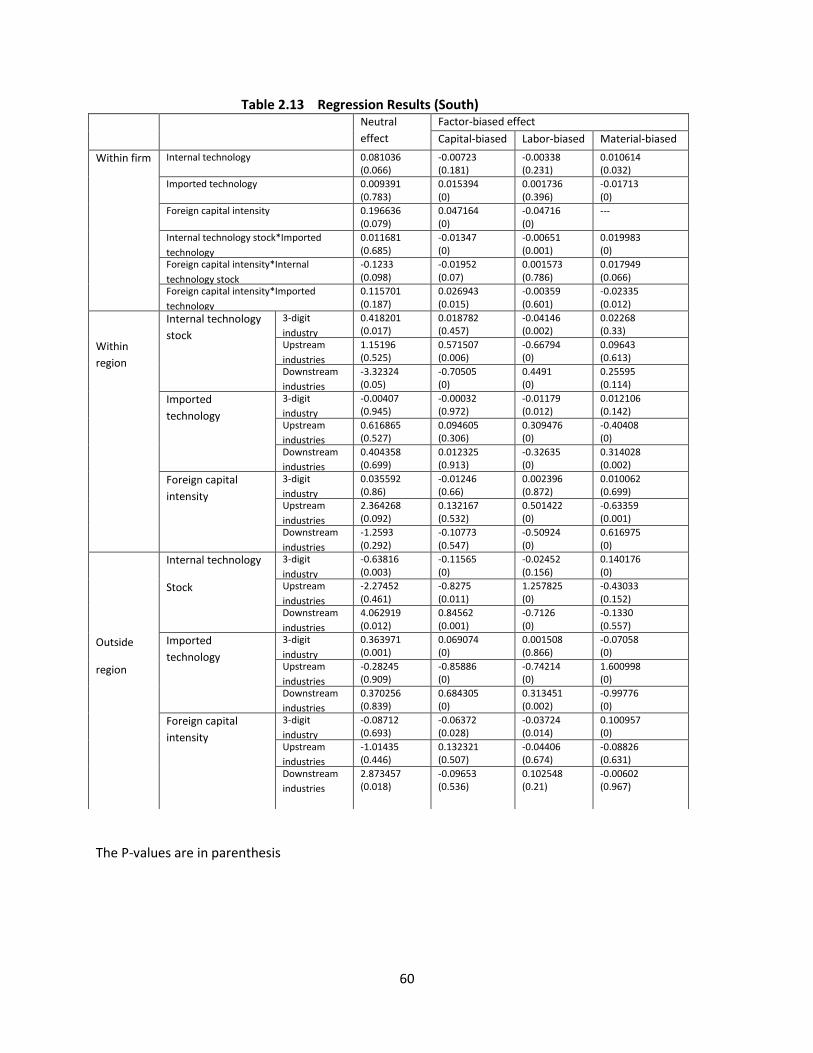
Table 2.13 Regression Results (South)……………………………………………………………………60
Table 2.14 Regression Results (Southwest)……………………………………………………………….61
Table 2.15 Contribution to the Change in Total Cost, 1995-2004 (North)…………….………………….62
Table 2.16 Contribution to the Change in Total Cost, 1995-2004(Northeast)……………..……………..63
Table 2.17 Contribution to the Change in Total Cost, 1995-2004(East)…………………………...……..64
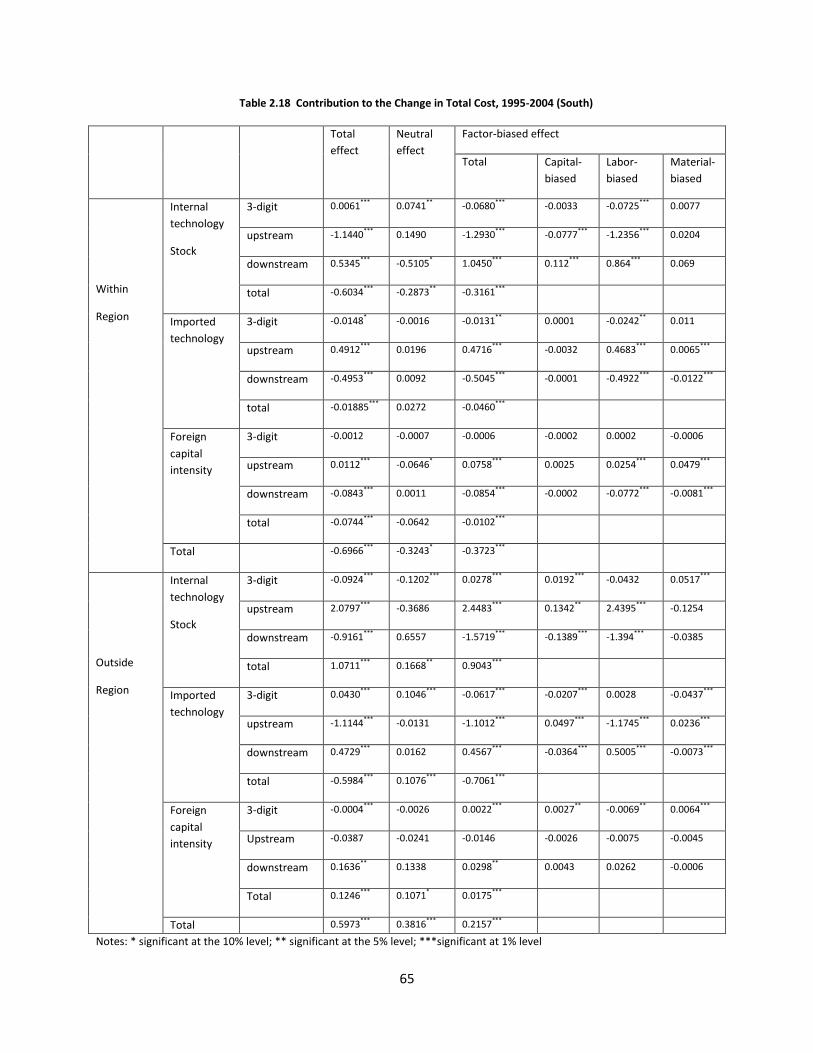
Table 2.18 Contribution to the Change in Total Cost, 1995-2004(South)………………………...………65
Table 2.19 Contribution to the Change in Total Cost, 1995-2004(Southwest)………………….…….….66
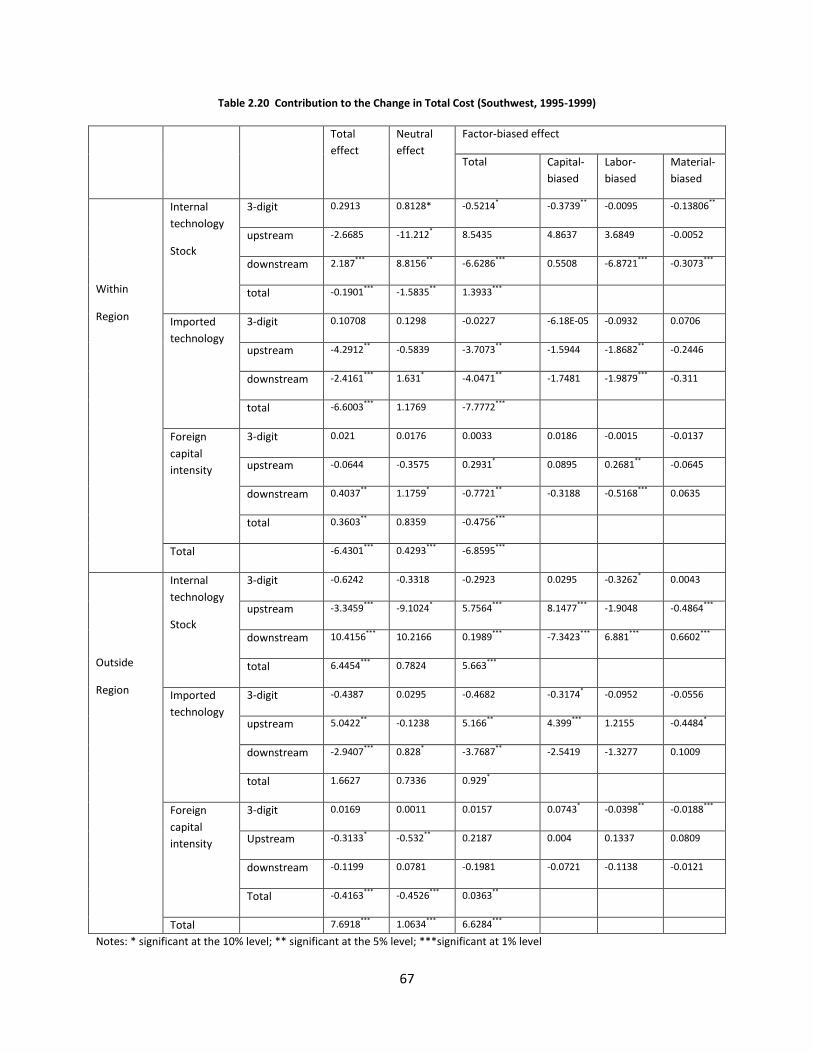
Table 2.20 Contribution to the Change in Total Cost, 1995-2004, (Southwest, 1995-1999)……………..67
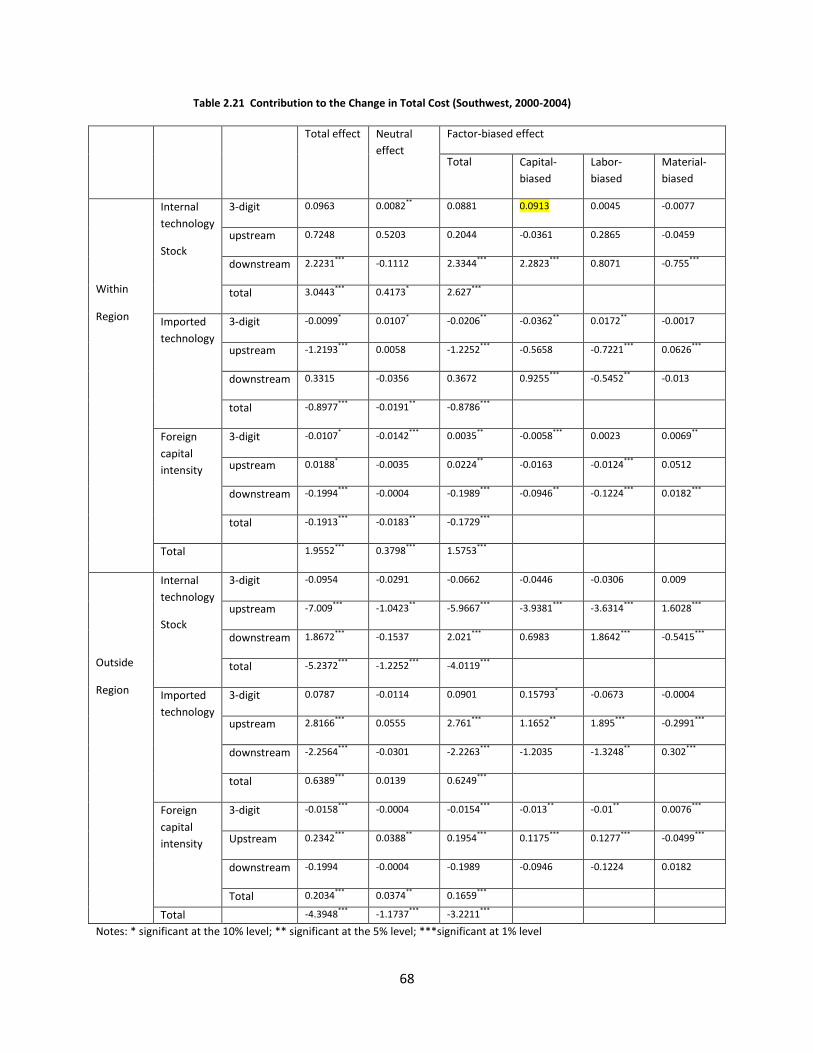
Table 2.21Contribution to the Change in Total Cost, 1995-2004, (Southwest, 2000-2004)………….…..68
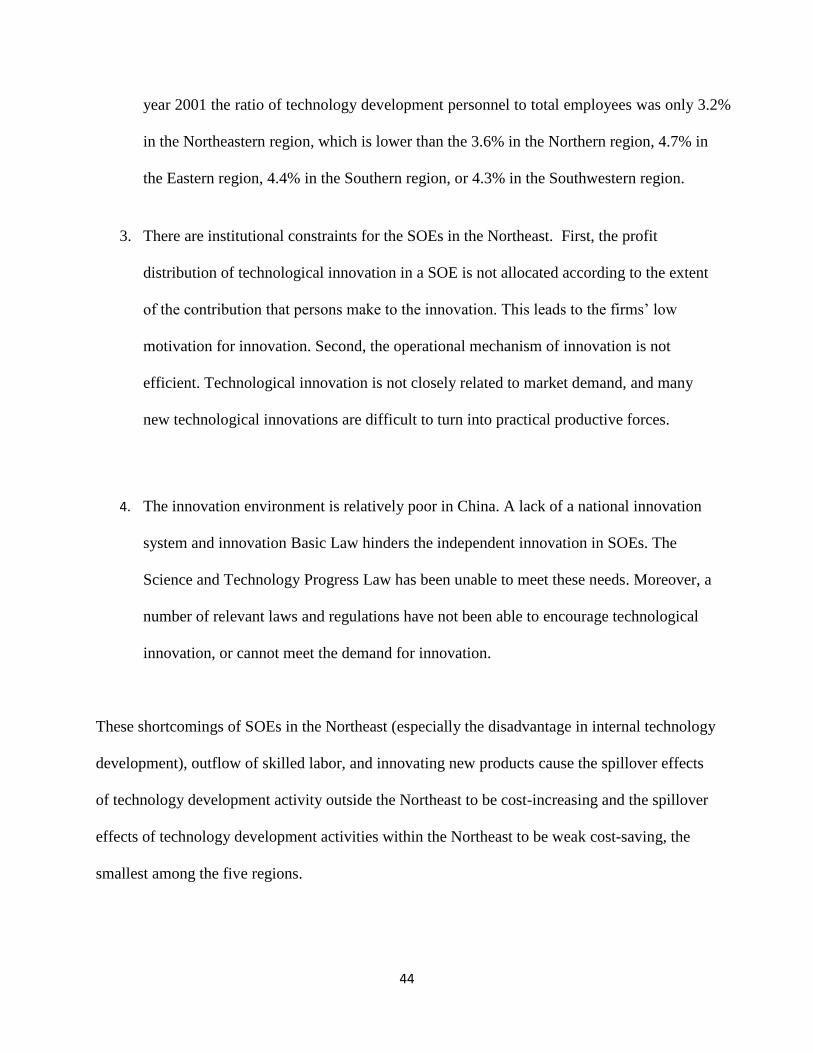
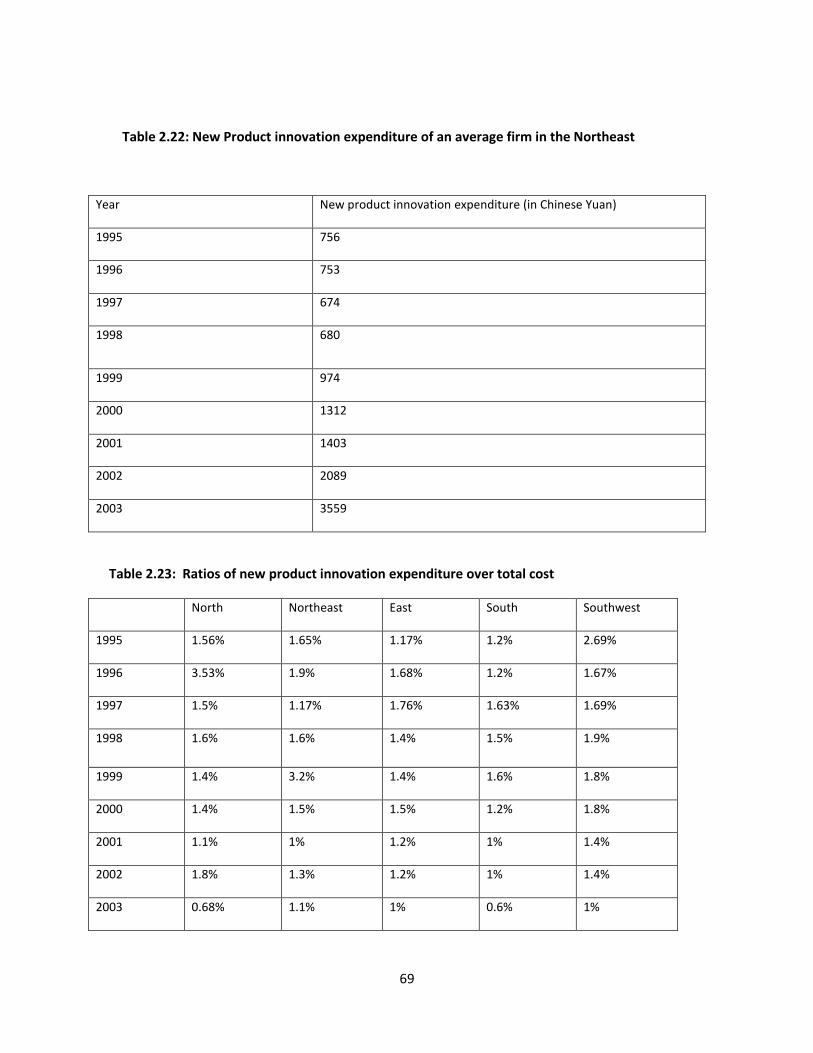
Table 2.22 New Product innovation expenditure of an average firm in the Northeast……………….…..69
Table 2.23 Ratios of new product innovation expenditure over total cost…………………………….....69
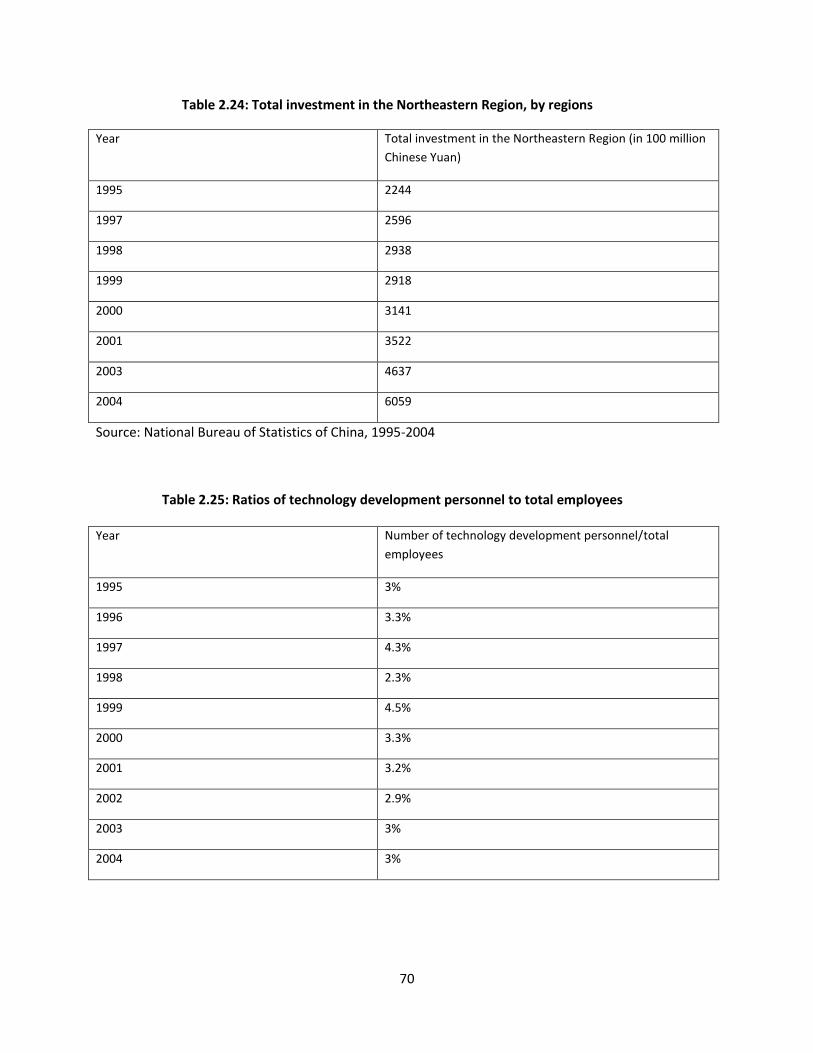
Table 2.24 Total investment in the Northeastern Region, by regions……………………………….……70
Table 2.25 Ratios of technology development personnel to total employees……………………….……70
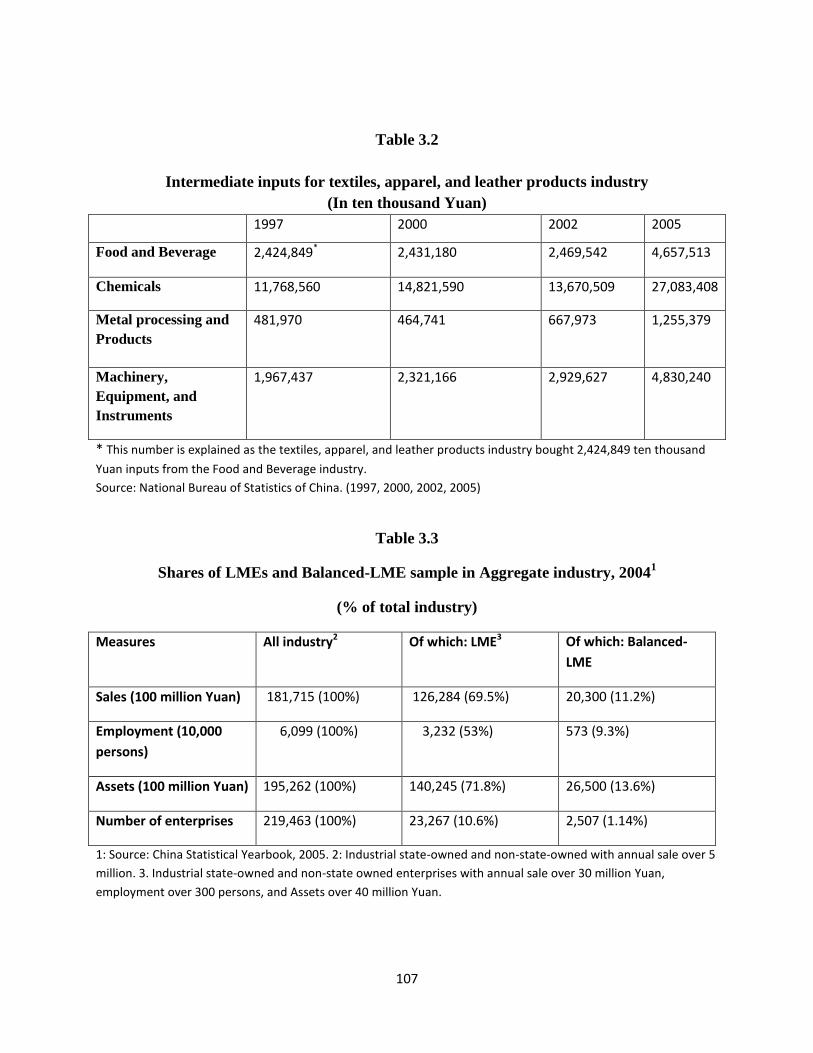
Table 3.1 Foreign capital intensity (FCI) in four Chinese industries from 1995–2004……………..….106
Page 9
viii
Table 3.2 Intermediated inputs for textiles, apparel, and leather products industry (in ten
thousands Yuan)…………………………………………………………………………….....107
Table 3.3 Shares of LMEs and Balanced-LME Sample in Aggregate Industry, 2004………………….107
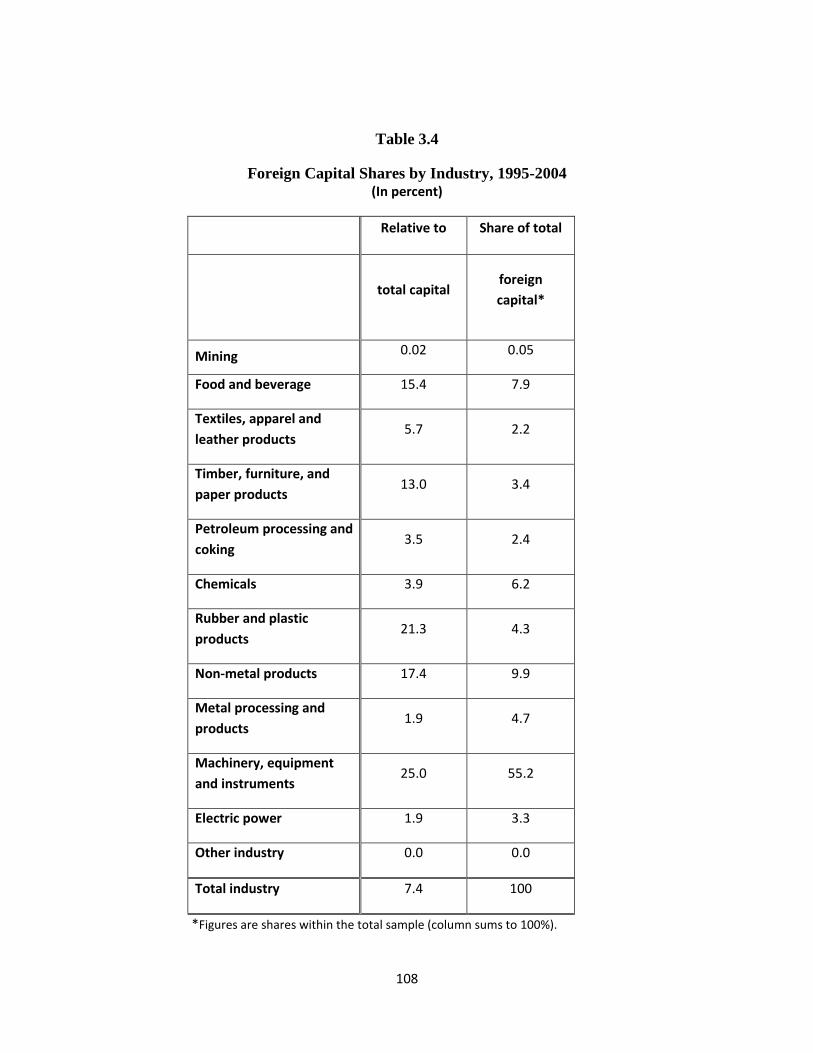
Table 3.4 Foreign Capital Shares by Industry, 1995-2004.……………………………………………...108
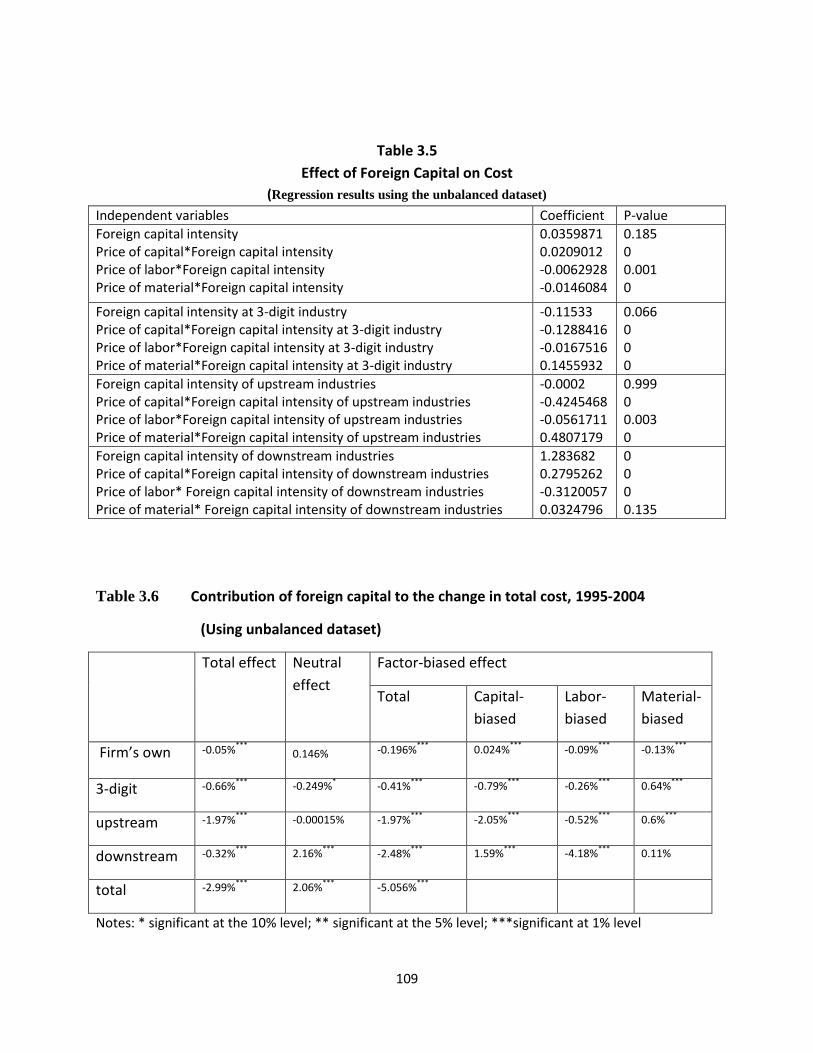
Table 3.5 Effect of Foreign Capital on Cost (on unbalanced data)………………………………………109
Table 3.6 Contribution of foreign capital to the change in total cost, 1995-2004………………...……..109
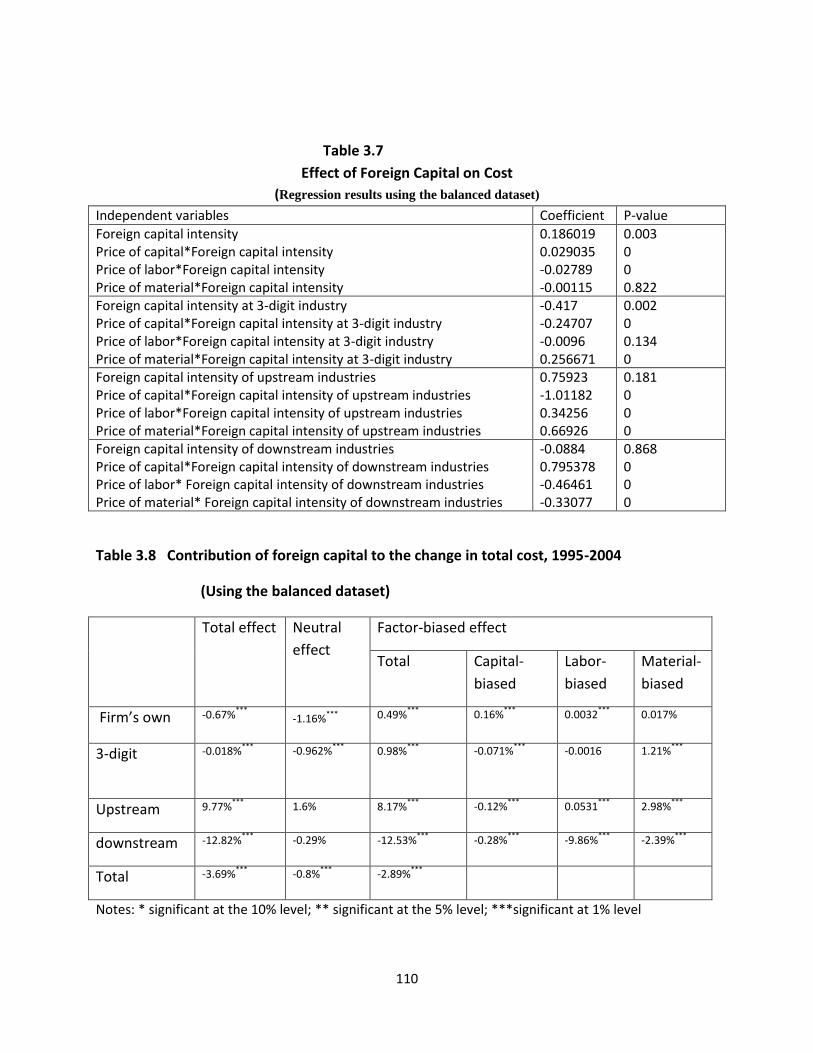
Table 3.7 Effect of Foreign Capital on Cost (on balanced data)…………………………………………110
Table 3.8 Contribution of foreign capital to the change in total cost, 1995-2004……………………….110
Table 3.9 Effect of Foreign Capital on Cost: 1995-2001 versus 2002-2004 (on unbalanced data)….….111
Table 3.10 Effect of Foreign Capital on Cost: 1995-2001 versus 2002-2004 (on balanced data)……...112
Table 3.11 Employment of China Urban from year 1995 to year 2004……………………………....…113
Table 4.1 Firm distribution by ownership type (number of enterprises)……….……………………..…143
Table 4.2 Firms distribution by region (number of enterprises)………………………………..…….….143
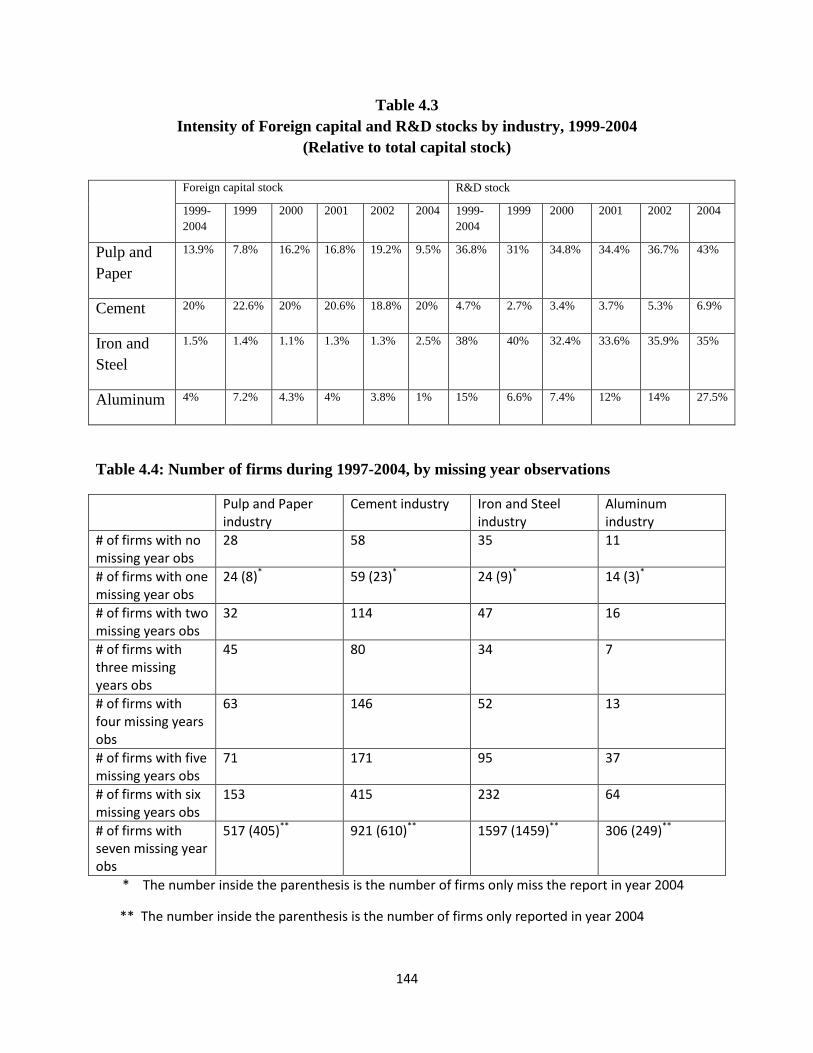
Table 4.3 Intensity of Foreign capital and R&D stocks by industry, 1999-2004………………..………144
Table 4.4 Number of firms during 1997-2004, by missing year observations………………….………144
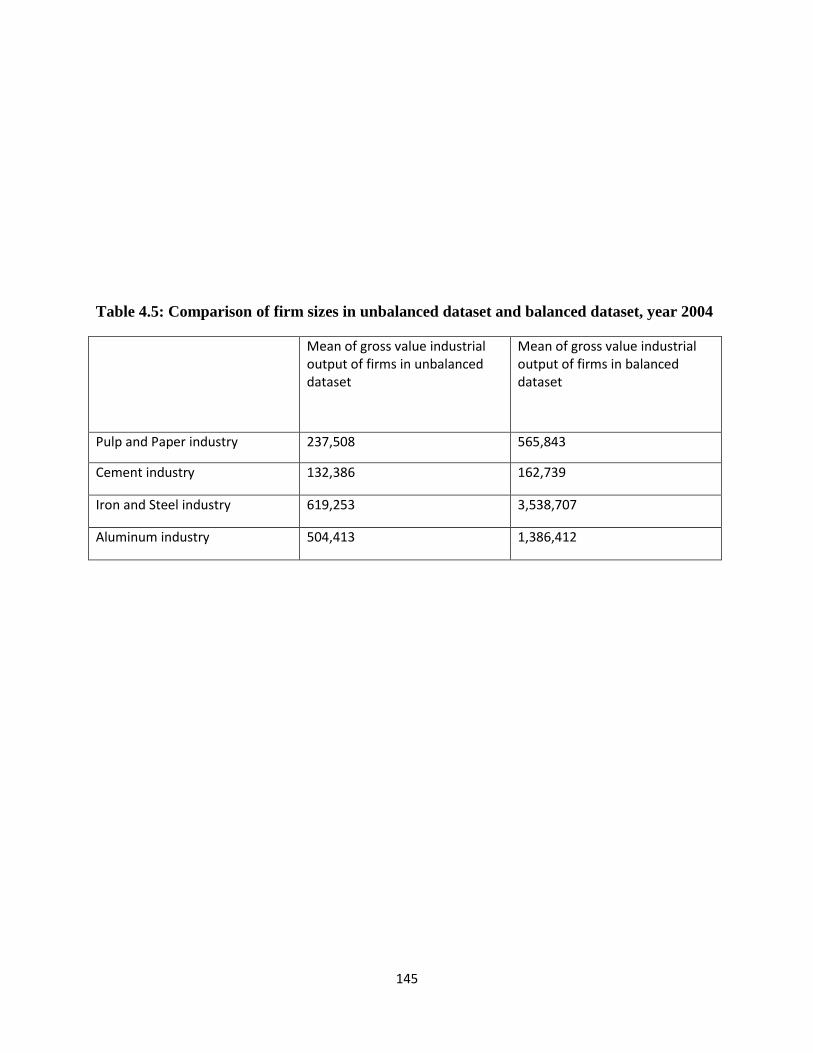
Table 4.5 Comparison of firm sizes in unbalanced dataset and balanced dataset, year 2004………..…145
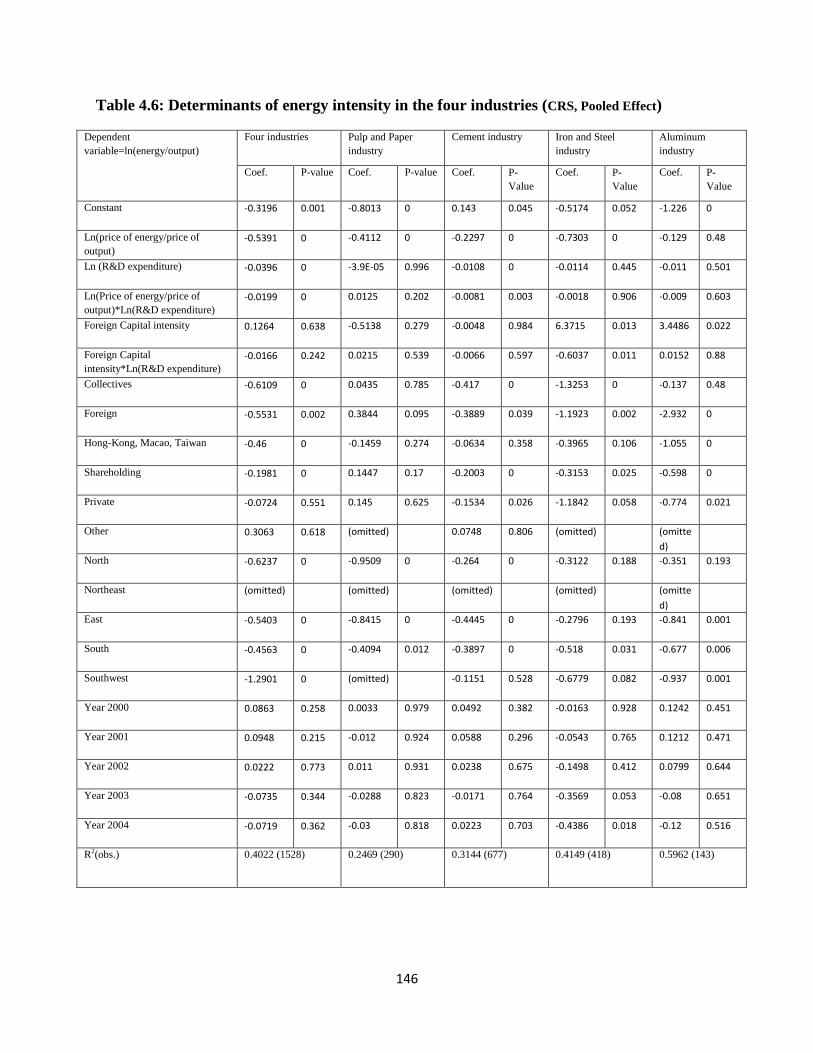
Table 4.6 Determinants of energy intensity in the four industries (CRS, Pooled Effect)……………....146
Table 4.7 Determinants of energy intensity in the four industries ( CRS, Fixed Effect)………………..147
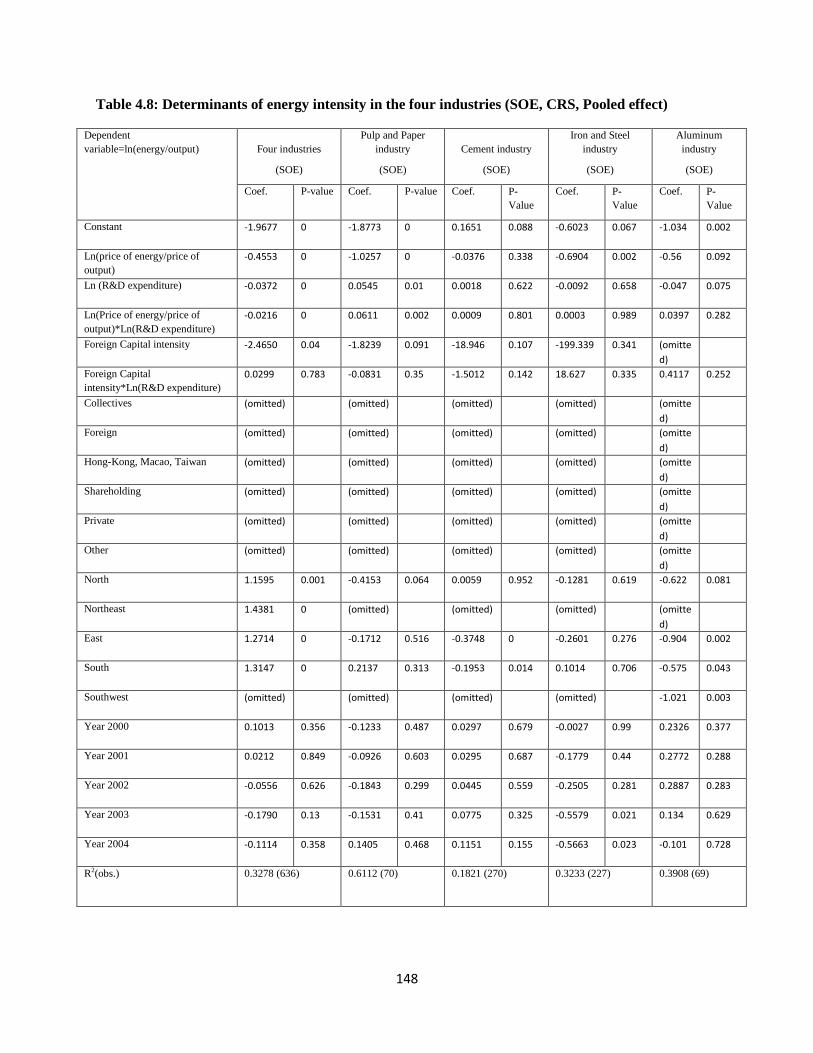
Table 4.8 Determinants of energy intensity in the four industries (SOE, CRS, Pooled effect)…………148
Table 4.9 Determinants of energy intensity in the four industries (NonSOE, CRS, Pooled effect)…….149
Table 4.10 Determinants of energy intensity in the four industries (1999-2001, CRS, Pooled
effect)…………………………………..…………………………………………...………..150
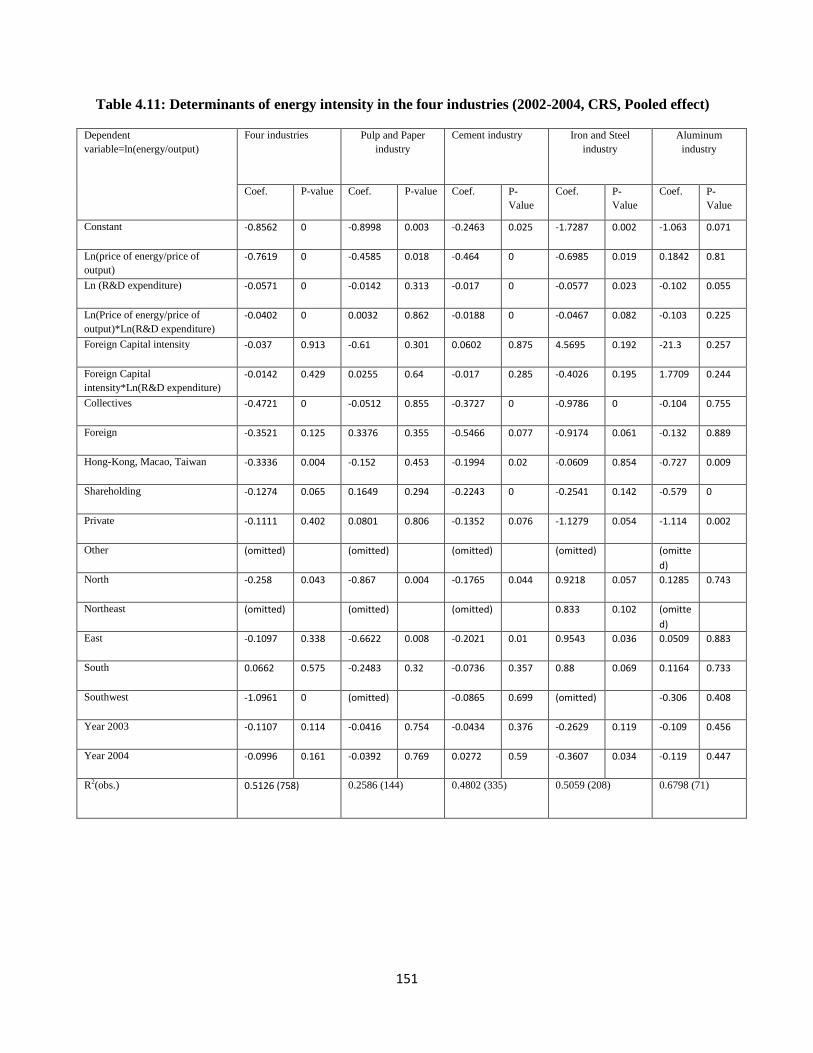
Table 4.11 Determinants of energy intensity in the four industries (2002-2004, CRS, Pooled
effect)……………………………………...……………………………….………………..151
Table 4.12 Determinants of energy intensity in the four industries (NonCRS, Pooled Effect)………....152
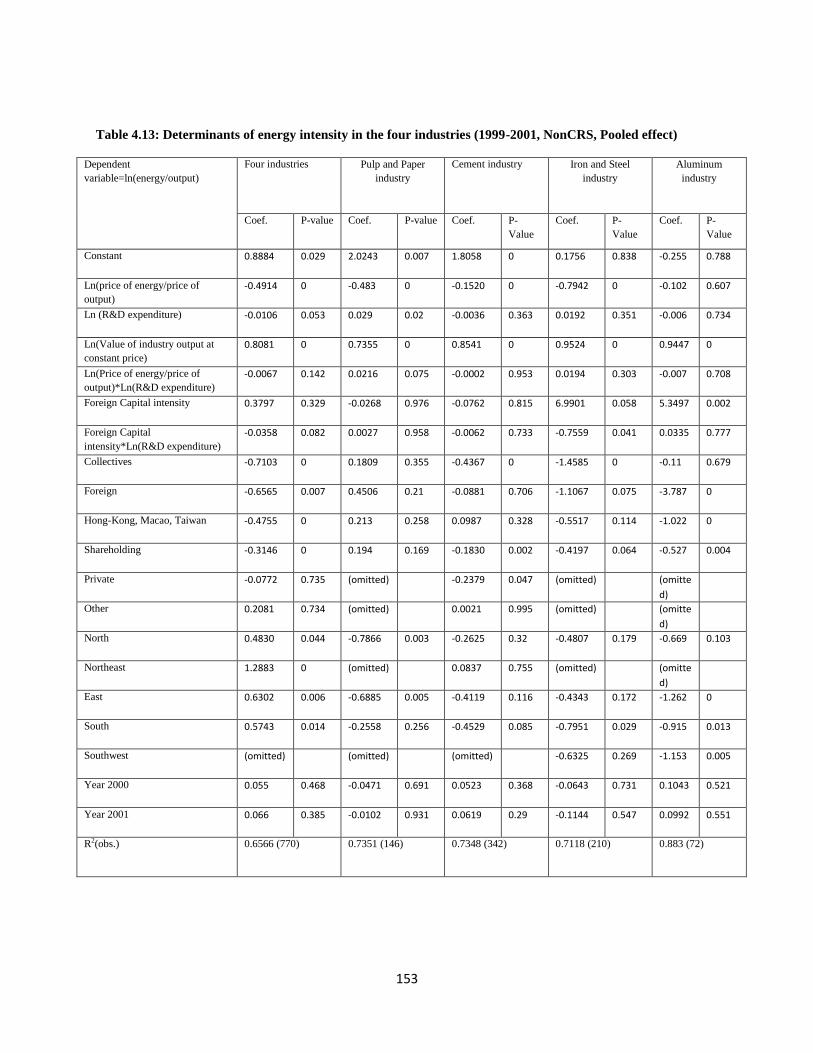
Table 4.13 Determinants of energy intensity in the four industries (1999-2001, NonCRS, Pooled
effect)…………………………………………………………………………...…………..153
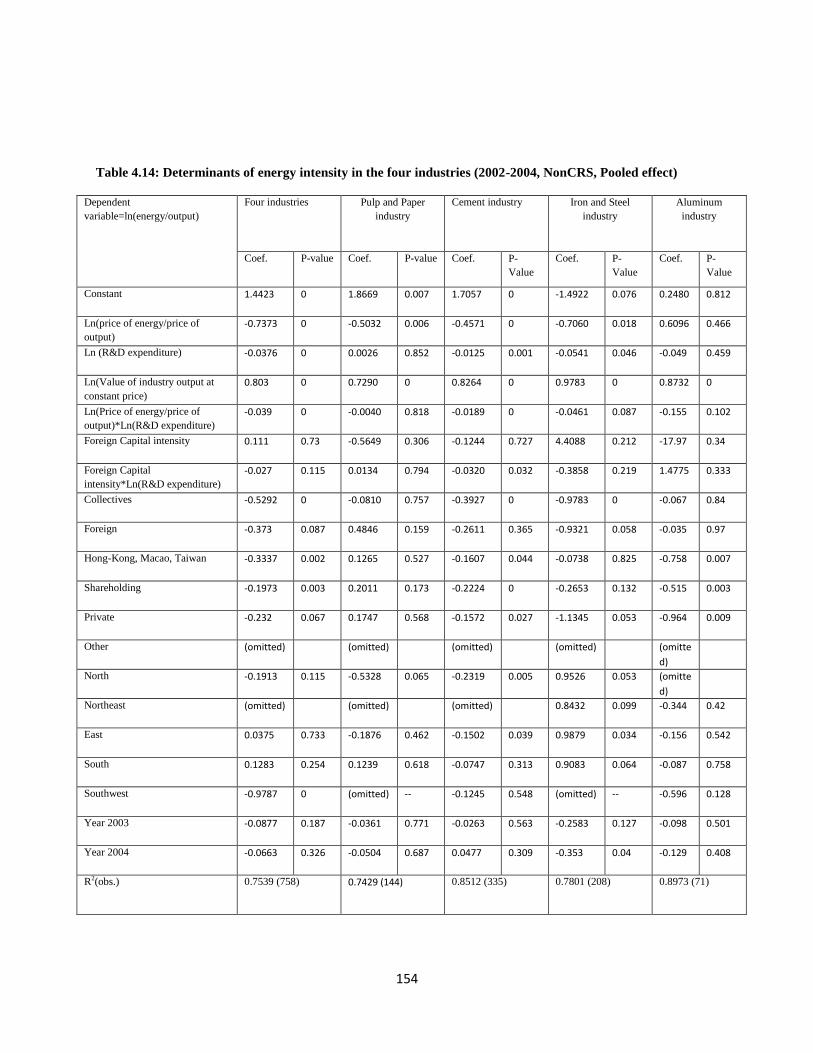
Table 4.14 Determinants of energy intensity in the four industries (2002-2004, NonCRS, Pooled
effect)……………………………………………………………………………………….154
Page 10
ix
Acknowledgements
I am grateful to many people for their encouragement, guidance, and helpful insights during my
dissertation writing. Particularly, I express my deepest gratitude to my advisor Dr. Karen Fisher-
Vanden for making this dissertation possible. Not only she helps me in my dissertation through
providing me many precious comments and revising many intermediate drafts, but also grants me
with life-long treasure by training me to be a good researcher. I feel so fortunate with my advisor. It
would have been next to impossible to write this thesis without her help and guidance. I am also
grateful to other committee members: Dr. David Abler, Dr.Spiro E. Stefanou, and Dr. Zhen Lei, who
provide profound suggestions into this dissertation. Last but not least, I owe special thanks to my
family, who provide support and encouragement throughout the years of my study at Penn State.
Page 11
1
Chapter 1
Introduction
1.1 Background and Motivation
Since the “Open-Door” policy and economic reforms began in the late 1970s, China’s economy
has undergone extraordinary growth, and its GDP rank in the world has risen from 10th in 1978
to second in 2011. However, in the past decade, China’s economic growth heavily depended on a
large increase in the use of inputs. Many economists argue that in the near future China will face
a growth limit, and its current high growth rate will be unsustainable unless its technology
largely improves during the next ten years (Ernst et al, 2005). Therefore, an essential focus for
Chinese enterprises is technological innovation and an increase in their knowledge stocks.
Among different methods to increase knowledge stocks, in-house research and development
activities, imported technologies, and foreign direct investment (FDI) will be examined in this
essay. In-house R&D focuses on process innovation, which utilizes the country’s comparative
advantage to reduce its production costs, while imported technologies concentrate on
development of new products, which reward firms with great advantages, such as obtaining
higher profits or attracting customers’ minds, in the market competition. Besides these direct
impacts on a firm’s knowledge stocks, a firm’s in-house R&D and imported technologies, as
well as FDI, also influence other firms’ knowledge stocks through spillovers.
Much previous literature investigated whether or not local firms benefit from spillovers from
other firms ’R&D activities and advanced technologies (Coe and Helpman, 1995; Hu and
Jefferson, 2002; Kokko, 1994). However, most of these studies encompass the entire country. In
the first essay, we extend this analysis of spillover effect to the regional level. This extension is
Page 12
2
also motivated by the fact that the economic disparity among five Chinese regions remains
significant in the recent years; therefore, investigating regional technological spillovers’
interactions with regional economies in China is important.
Foreign direct investment in China has experienced impressive growth in foreign direct
investment (FDI) over the past thirty years, expanding from less than 10 billion Yuan in 1980 to
approximately 330 billion Yuan in 2004 (NBSC, 2005). Although foreign firms may impose an
intense competition on Chinese domestic firms, such as taking away a portion of Chinese
domestic market share from local firms and raising payments for skilled workers, they
undoubtedly enhance the productivity of Chinese firms in several ways: The international
standards of research environment provided by the multinational companies will attract a large
number of world-class technical experts to work in China. The movement of experts across
different R&D institutions and the cooperation between multinational companies and local
companies will accelerate the diffusion of technological information. The exemplary role of
multinational R&D institutions will provide local enterprises with expertise in management and
marketing.
Therefore, combining the competition effect (crowding-out effect) and the positive effect (such
as knowledge spillovers and movement of experts), determining whether or not FDI eventually
brings benefits to host country is difficult to determine, despite investigation by much empirical
literature. However, few studies examined the effects of FDI on the direction of technological
development and firms’ decisions for choices of inputs.
One well-known hypothesis of biased technological change is the induced innovation hypothesis,
which posits that changes in the prices of input factors will spur technology development toward
Page 13
3
economic use of the input factor which becomes relative inexpensive (Hicks, 1932). Therefore,
price changes in input factors affect a firm’s decision regarding R&D investment and efforts, and
influences the rate and direction of innovation, resulting in biased technological change. In the
case of foreign firms investing in an upstream industry, more intense competition occurs in the
intermediate inputs’ market, and consequently, engenders cheaper intermediate inputs for
downstream firms (Mankiw, Principles of Economics). According to the induced innovation
hypothesis, cheaper intermediate inputs (material) affect firms’ decisions towards the direction of
material-using innovation. Based on this observation, we will empirically examine whether or
not the presence of FDI in an upstream industry induces downstream local firms to develop new
technologies with a material-using bias.
More generally, inspired by Acemoglu (2002), who argued that the bias for technological change
slants toward particular factors, the second essay investigates the factor bias spillover effect of
FDI in China. Specifically, the examination considers how domestic enterprises’ guide the
direction of their technological developments (in choosing capital, labor, or material inputs) in
response to the presence of FDI in a horizontal industry, an upstream industry, or a downstream
industry.
During the past thirty years, China’s economy has undergone remarkable growth at an average
annual rate of 9.7% (He and Wang, 2007). Such rapid economic development drove an increase
in Chinese total energy use. However, China’s energy intensity, the ratio of total energy
consumption in physical quantities to real GDP, has steadily declined, on average, 3.6% annually
from 1993 to 2005 (He and Wang, 2007).
Page 14
4
Several factors may account for the change. The first factor is technological change, including
subsector productivity changes and R&D input. For example, Ma and Stern (2008) found
technological change to be the most important factor in reducing the energy intensity of Chinese
enterprises from 1980 to 2003. The second factor is the spillover effect of FDI. Fisher-Vanden et
al. (2004) asserted that the energy intensity of foreign firms in China, on average, is lower than
that of local firms. Empirical results in Fisher-Vanden et al. (2009) showed that spillover effects
of FDI tend to save energy. He and Wang (2007) also provided empirical evidence to suggest
that foreign capital has had an effect on lowering the energy intensity of Chinese enterprises. The
third factor is market reform, including structural changes to production and governmental
ministries’ changes. Fisher-Vanden et al (2004) found that sectoral shift has improved
enterprises’ energy efficiency. These researchers’ empirical results indicated that sectoral shift
accounted for almost 50% of the decline in total energy intensity during 1997 to 1999. Besides
these three factors, other elements, such as rising energy prices and scale effects, may have
impacted the change in energy intensity in China.
Other numerous previous studies examined these factors’ effects on energy intensity in China;
however, most of them employed industry-level data or conducted aggregate, industry level
investigations. The third essay uses a unique set of firm-level data from China’s most energy-
intensive large and medium enterprises to investigate the impact of these factors on energy
intensity in four specific Chinese industries: pulp and paper, cement, iron and steel, and
aluminum. The reason for choosing these four industries is that they lead the nation in energy
consumption and comprise a large share of China’s industrial output. For instance, in 2007,
energy consumption in the Cement industry accounted for 5.6% of China’s total energy
consumption (Cai et al. 2011). China’s Iron and Steel industry became the largest producer of
Page 15
5
crude steel in the world in 1996 (Wei et al. 2007) and, more recently, has become the largest
energy consuming sector in the nation.
1.2 Objectives and Brief Outline
Many studies have investigated the spillover effect of R&D and FDI. However, few of them
explicitly distinguish the spillover effects generated from firms located in the targeted region
with the effects from firms located outside the targeted region. My first essay will contribute to
existing literature by: 1) do firms location and distance matter in spillovers, both within-region
spillover effect and outside-region spillover effect? 2) investigate the impact of regional
differences, including government policies, economic factors, and natural endowments, on
within-region and outside-region spillovers; 3) testing whether or not developed regions benefit
more from both within-region and outside-region spillover effects than less developed regions;
To complete these analyses, we divide China into five regions in terms of geographic location
and level of economic development (GDP, infrastructure and household income, etc.). Then we
categorize technological innovations into three types: internal technology development within-
firm, purchases of imported technology, and foreign direct investment (FDI). We distinguish
between “within-region” spillover effects from industries located in the same region as the
targeted firm, and “outside-region” spillover effects from industries located outside the region of
the targeted firm. These two region-related spillover effects track the horizontal and vertical
spillover effects of three forms of technological activities. Using a balanced, firm-level dataset,
which contains 2000 large- and medium- sized Chinese enterprises during 1995 to 2004, we run
Page 16
6
a seeming unrelated regression to obtain the empirical results. We end the first essay with an
interpretation of the results.
The second essay investigates the factor biased FDI spillover effect through vertical linkages (i.e.
the effect of upstream foreign capital on downstream Chinese local firms, and, conversely, the
effect of downstream foreign capital on upstream local firms). An additional examination
considers domestic firms’ bias direction of technological development if foreign firms enter the
same industry as domestic firms.
Moreover, the investigation considers the impact on FDI spillover, caused by China’s joining of
the World Trade Organization (WTO) in 2001. In order to complete this analysis, we divide our
data set into two periods: 1995 to 2001 and 2002 to 2004; we then run the corresponding
regression for each dataset and compare the spillover during different time periods to investigate
the impact of China’s joining of the WTO on FDI spillover.
The third essay investigates the factors that explain the decline in energy intensity in four
Chinese industries: pulp and paper, cement, iron and steel, and aluminum. Completing this
analysis requires, first, outlining energy consumption and developmental policies in these four
industries and identifying the important industrial-common or industrial-specific policies, which
induce changes in energy intensity in these four industries. A summary of previous research
analyzing China’ energy intensity decline follows. After these two steps, we will use a unique set
of firm-level data to empirically examine how China’s energy-saving programs, liberalization of
domestic markets, openness to the world economy, and other government policies’ contributions
to the decline in energy intensity in these industries. We conclude this essay with an
interpretation of the results and a test for robustness.
Page 17
7
References:
Acemoglu, Daron, 2002, “Direct Technical Change”. Review of Economic Studies, 69, 781-809
Cai, Bofeng, Dong Cao, Ying Zhou, and Zhangsheng Zhang, 2011, “Characteristics Analysis of Energy
Consumption in Chinese Cement Industry.” Environment Engineering, vol. 2.
Coe, David T and Elhanan Helpman, 1995, "International R&D spillovers", 1995, European economic review, 39(5)
Ernst, Dieter, Thomas George Ganiatsos, and Lynn Krieger Mytelka, 2005, Technological Capabilities and Export
Success in Asia, Taylor & Francis e-Library
Fisher-Vanden, Karen, Gary H. Jefferson, Yaodong Liu, and Jinchang Qian, 2009, “Open Economy Impacts on
Energy Consumption: Technology Transfer & FDI Spillovers in China’s Industrial Economy,” manuscript,
Pennsylvania State University
Fisher-Vanden, Karen, Gary Jefferson, Hongmei Liu, and Quan Tao, 2004, “What is Driving China’s Decline in
Energy Intensity?” Resource and Energy Economics, 26: 77-97
He, Canfei, and Junsong Wang, 2007, “Energy Intensity in Light of China’s Economic Transition.” Eurasian
Geography and Economics, 48(4): 439-468
Hicks, J. R., 1932, The Theory of Wage, Macmillan, London
Hu, Albert, G., and Gary Jeffersons, 2002, “FDI Impact and Spillover: Evidence from China’s Electronic and
Textile Industries.” The World Economy, 25(8): 1063-1076
Kokko, Ari, 1994, “technology, market characteristics, and spillover,” Journal of Development Economics, 43(2):
279-293
Ma, Chunbo and David I. Stern, 2008, “China’s Changing Energy Intensity Trend: a Decomposition Analysis.”
Energy Economics, 30:1037-1053
Mankiw, Gregory, Principles of Economics, South-Western College Pub, 5 Edition
NBSC, 2005, China Statistical Yearbook on Science and Technology, Beijing, China Statistical Press.
Wei, Yi-Ming, Hua Liao, and Ying Fan, 2007, “An Empirical Analysis of Energy Efficiency in China’s Iron and
Steel Sector.” Energy, 32(12): 2262-2270.
Page 18
8
Chapter 2
Regions Development and Technology Spillover in China
2.1 Introduction
Since the onset of economic reform in the late 1970s, the Chinese economy has experienced
phenomenal economic growth. However, due to disparities in region-specific endowments and
government policies across different regions, the growth in each region exhibits great
heterogeneity. Using the zoning codes adopted by the National Bureau of Statistics of China
(NBSC), we combine China provinces into five regions: North, Northeast, East, South and
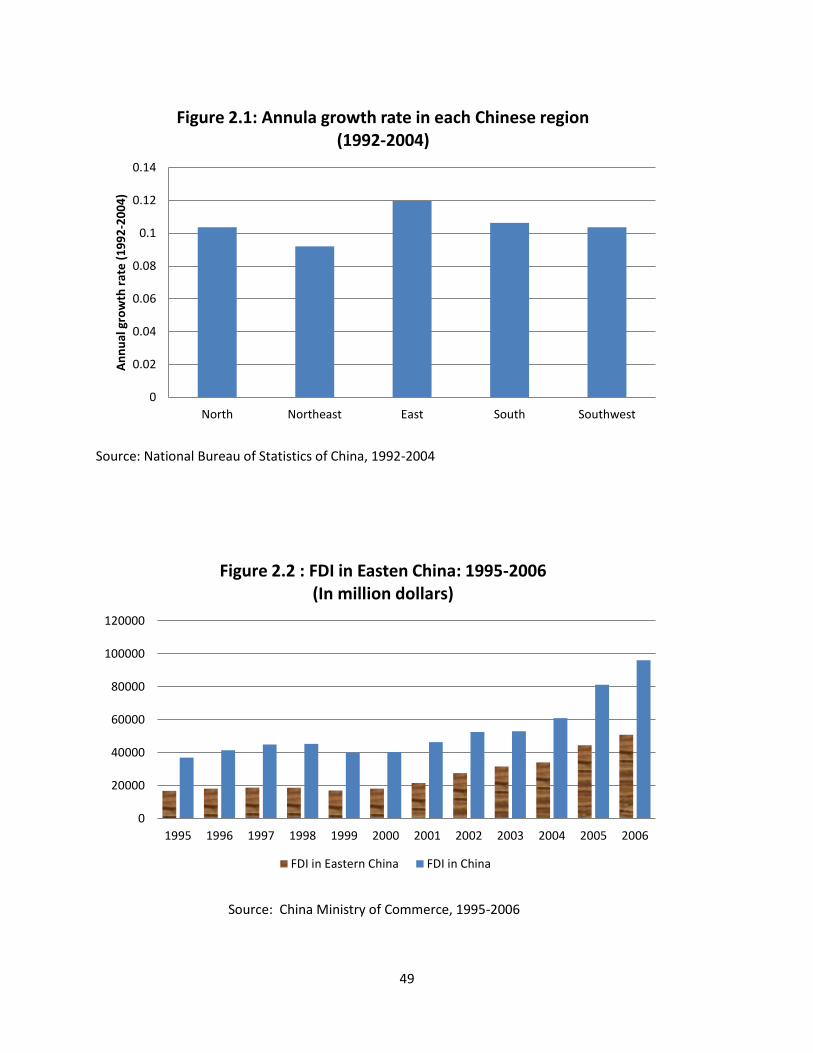
Southwest. Figure 2.1 lists the annual growth rate of per capita income in each region over the
period 1992-2004.1 Three features capture our attention: the growth rate of per capita income in
the Southwest is not far behind those of other regions except the East, which is somewhat
surprising since the Southwest had the worst infrastructure and lowest per capita income in the
early years of economic reform2. The Northeast had the lowest growth rate during this time
period and the East had the highest growth rate during this period.
What factors account for the disparities in GDP growth rates across different regions? Initial
economic status, government preferential policies, and natural endowments are some of the
factors affecting regional growth. However, differences in the level of the technological advance
play a critical role in explaining the difference in growth rates among regions. Technology
1 The reason that we choose per capita income instead of GDP in each region as a proxy to regional economy is that
there are huge differences among different regions in term of population and number of provinces. For example, the
Northeast only consists of 3 provinces while the East consists of 7 provinces. Per capita income is more likely to
truly exhibit the economic development status in each region.
2In year 1992, Per capita income is 1435 Yuan in the Southwest, 2026 Yuan in the South, 2564 Yuan in the North,
2668 Yuan in the East, and 2908 Yuan in the Northeast.
Page 19
9
development activities in each firm not only have significant impacts on their own productivity,
but also bring spillover effects to firms operating in horizontal, upstream, downstream industries.
In this essay, we will focus on how the within-region and outside-region technology spillovers
differ across regions, how these different regional spillovers affect the economic disparity in
regional growth, and what factors cause these differences in regional spillovers.
There have been many studies that investigate the spillover effects of R&D activities and FDI;
however, they did not explicitly distinguish between within-region and outside-region effects.
For example, there is a vast amount of literature that focuses on examining whether host
countries, as an entire country, benefit from spillover effects (Shen, 1999; Hubert and Pain, 2001;
Liu, 2002). We will extend this work to regional cases and test how local firms’ costs are
affected by spillover effects both within and outside Chinese five regions. There are also many
previous studies investigating through which channels, for example, horizontal channel and
vertical channel, spillover effects have the biggest impact on host countries ( Blalock and Gertler,
2003; Jacorvik, 2004; Fisher-Vanden et al 2009). We will extend the comparison between
horizontal spillovers and vertical spillovers to the cases of within and outside regions, and test
whether vertical spillovers still have bigger impacts on local firms than horizontal spillovers. A
few studies conduct research on the regional spillover effects, including on Chinese regions
( Bottazzi and Perri, 1999; Brun, 2002; Kuo and Yang, 2008; Qi et al, 2009). In our paper, we
will test whether developed regions will benefit more from both within-region and outside-region
spillover effects than less developed regions.
Page 20
10
In this paper, using the zoning codes adopted by the National Bureau of Statistics of China
(NBSC), we categorize Chinese provinces into five Chinese regions -- North, Northeast, East,
South and Southwest -- and calculate the within-region R&D stock and outside-region R&D
stock using the science and technology data obtained from NBSC. Applying the seeming
unrelated regression method, we empirically calculate the different spillover effects of
innovation expenditures. We subdivide innovation expenditures into three categories: internal
technology expenditure, imported technology expenditure, and foreign direct investment (FDI).
We then compare among different regions to assess both spillover effects generated within the
region and those transferred from other regions.
Results of within-region total spillover effects and outside-region total spillover effects show that
the cost-saving spillover effects in both developed and less developed regions mainly come from
upstream and downstream industries. Results of outside-region spillover effects suggest that
distance and economic similarity do matter in the outflow of technology and knowledge across
regions. The result – that the Eastern region benefits significantly from within-region total
spillovers – is consistent with previous results, which found spillovers in developed countries
exhibit positive effects, due to mature markets and infrastructure. Results for the Northeastern
and Southwestern regions confirm the influence of two Chinese development policies: the
“Grand Western Development Program” and “Revitalizing the Old Industrial Base in the
Northeast”. Both helped to reduce the regional development inequality, and one of them has
already contributed to the inland firms’ productivity improvement through more effective
spillover effects.
The rest of paper is organized as following: Section 2 review the literature, in which I briefly
introduce previous studies on technology spillover effects. Section 3 introduces the data used in
Page 21
11
the analysis along with data descriptions. Section 4 presents the model specification and
methodology. Section 5 exhibits the empirical results and interpretation. Lastly, Section 6 offers
concluding remarks.
2.2 Literature review
There is much debate about whether firms will benefit from the technological spillover. For
example, Jacorvik (2004) finds FDI spillover effects in developing countries are not significant
and sometimes even negative. Hu and Jefferson (2002) find negative spillover effects in China’s
electronic and textile industry. In contrast, Coe and Helpman (1995) find that foreign R&D
spillovers increase domestic firms’ productivity. Jacob and Szirmai (2007) find that knowledge
spillovers in Indonesia largely increase labor productivity. Hubert and Pain (2001) use industry-
level panel data of the UK manufacturing sector to examine the effects of FDI. Results show that
FDI has a positive impact on UK firms through intra-industry and inter-industry spillover.
Shen(1999) contends that a one per cent increase in foreign direct investment in China will
increase total factor productivity (TFP) in China by 37 percent through technology spillover
effects.
In addition to examining whether local firms gain from spillover effects, many previous studies
have investigated whether spillover effects are intra-industry or inter-industry. Saxena (2011)
finds empirical evidence of horizontal spillover effects in the manufacturing industry in India.
Bin (2008) also finds that horizontal R&D spillovers significantly improve firms’ productivity in
China’s manufacturing industry. Halpern and Muraközy (2007) examine whether FDI has
horizontal or vertical spillover effects on Hungarian domestic manufacturing firms. Employing a
Page 22
12
large amount of data from Hungarian firms, Halpern and Muraközy ran a regression of output on
capital, labor, a horizontal measure of spillover, and a vertical measure of spillovers. The results
showed positive vertical spillovers and no horizontal spillover effects, except for those firms in
close proximity with foreign-owned firms.
Javorcik (2004) proposed that spillover effects from downstream industries usually happen in the
following ways: the direct knowledge transfer from the downstream industry to the upstream
suppliers; indirect technology or managerial improvement forced by the higher quality standard;
and on-time delivery required by downstream customers. The empirical tests of Javorcik (2004)
confirm that local suppliers receive positive productivity spillover effects, such as technologies
transfer, from the downstream customers through the backward linkage. Using Chinese industrial
firm-level data, Fisher-Vanden et al (2009) found that spillover effects from downstream
industries have more impact on the total productivity of Chinese firms than in-house research
and horizontal spillover effects.
Some previous studies have examined the factors that affect cross-region spillovers. For example,
Jacobs (1969) argues tacit knowledge is difficult to transfer across distances and requires
significant interaction, such as face-to-face communication. Therefore, areas closer to those
sources of tacit knowledge will have a better chance to receive and understand knowledge
outflows. Adams and Jaffe (1996) and Adams (2002) show that spillover effects are affected by
the distance and the effects will be strongest within certain distances. Andretsch and Feldman
(2004) also find distance matters for technology spillovers and plays an important role in making
use of those knowledge outflows. Bottazzi and Peri (1999) use data on European regions to
investigate spatial spillovers of R&D as well as knowledge, and address the importance of such
diffusion on innovation. The regression results of Bottazzi and Peri (1999) show that pure
Page 23
13
technological similarities have fewer spillover effects than pure spatial distance. Absorptive
abilities are also important in determining cross-region spillovers. Qi et al (2009) explore the
feature of various absorptive abilities across different Chinese provinces. Qi et al believe that if
the gap between the local firms and foreign firms is too big, local firms will not have the
capacity to understand and absorb the outflow of advanced technology and knowledge: a
threshold of absorptive capacity determines whether the spillover can be assimilated. Empirical
results of Qi et al (2009) revealed the absorption abilities of many Chinese provinces had not
reached the necessary threshold to benefit from the presence of outside firms with high
technology and advanced managerial skills. The crowding-out effect of foreign capital may
prevail in many Chinese provinces.
The economic system and level of development of market economics, such as a financial market
and labor market, also play an important role in the process of digestion and absorption of
spillover effects originating from outside regions or countries. Alfaro et al (2010) postulate that a
mature financial market has a big impact on the FDI spillover effect, and their results show that
countries with such markets find it not only easier to integrate the spillover effect, but also to
gain more positive effects from the spillovers of foreign advanced technology than those with
poor financial market.
Several studies investigated spillovers across regions and effects specific to different regions.
Lehto (2007) finds that R&D of firms outside the region where the targeted firm is located but in
the same industry positively contribute to the productivities of the targeted firm. However,
Bottazzi and Peri (2003) find that spillovers are localized and exist only within a distance of
300km. There are several studies examining technology spillovers across Chinese regions. For
example, Brun et al (2002) investigate whether there are sufficient spillover effects from coastal
Page 24
14
provinces to inland provinces to achieve the Deng’s policy of using advanced coastal provinces
to boost western province economies. Their results reveal that spillover effects from coastal
provinces to inland provinces are not sufficient to reduce the regional disparities in China. Kuo
and Yang (2008) investigate the effect of knowledge capital (both R&D capital and technology
imports) and technology spillover on regional economic growth. Their results find a positive
impact of regional spillover effects on regional growth. This suggests that a well-developed
region will stimulate its neighbor’s economy, which will be confirmed in our results.
Based on these studies, we will test the following hypotheses in this paper:
Hypothesis 1: Based on previous studies, for example, Fisher-Vanden et al (2009), the spillover
effects from downstream industries have more impact on the total factor productivity of Chinese
firms than horizontal spillover effects; therefore we would expect that spillover effects generated
through vertical channels are more significant—either more cost-saving or more cost-decreasing-
--than effects generated through horizontal channels, both for within and outside the region.
Hypothesis 2: Based on the fact that local firms need to reach a threshold of absorptive ability in
order to effectively assimilate the spillover effect (Qi et al, 2009), and the fact that the Eastern
region has advanced factor markets and most imported technology expenditure and FDI in China,
we would expect the East to experience has received significant cost-saving within-region
spillover effects.
Hypothesis 3: Based on previous studies (Jacorvik, 2004; Hubert and Pain, 2001) which find
spillover of FDIs in developing countries to be not significant or even negative, we expect in our
empirical results that developed regions will receive more benefits from within-region spillover
effects than less developed regions. Specifically, we expect the benefit from the within-region
Page 25
15
spillover effect in the Southwest is the lowest among all five regions since the Southwestern
region is the poorest region and has the worst infrastructure among five Chinese regions in the
late 1980s.
Hypothesis 4: The Northeastern region has the highest ratio of capital in state-owned enterprises
to total capital3. However, state-owned enterprises in China have many shortcomings: low
efficiency and the lack of an effective incentive mechanism. Dual identity of SOEs’ CEOs, as
businessman and government officials, gives way to irrational behavior as these two objectives
may produce conflicting interests (Lin and Li, 2005; Chen et al, 2005). Therefore, we expect that
within-region and outside-region spillovers bring few benefits and may even increase total cost
of firms operating in the Northeastern region.
2.3 Data
Our dataset is firm-level panel data containing over 2000 large- and medium-size Chinese
enterprises during 1995-2004. This data is part of a survey annually updated by National Bureau
of Statistics of China. Data used in our regression merges two datasets: one consists of economic
and financial variables, covering around 22,000 large and medium-size firms4 over the ten year
period from 1995 to 2004. The other consists of science and technology variables. Among all
variables, our paper focuses on internal technology development and imported technology. The
former measure includes regular R&D spending, the expenditure for process innovation and
3Huang (2004) mentioned that assets of SOEs accounted for 79.34% of total assets in the Northeast Old Industrial
Base, which was much higher than the nation average of 60.93%. 4 National Bureau of Statistics of China defines large- and medium-size enterprises according to enterprise’s
production capacity or original value of fixed assets, see Table 2.1.
Page 26
16
quality improvement of existing products. The latter is the purchase of advance technology from
foreign countries.
Because the size of firms shrank during this time period, or due to the change of ownership
related to industry reformation, mergers, or changes of address, there are many exiting firms,
new entry firms, or changes of firm ID during the 10-year period. Therefore, many firms are
missing at least one observation during 1995-2004. In order to maintain the continuity of data,
necessary for the composition of R&D stock, we have to drop the firms that are not continuously
observed during 1995-2004 and create a balanced dataset consisting of only 2000 firms per year
during 1995-2004. This causes a significant drop of observations from the two original datasets
to the balanced dataset.5
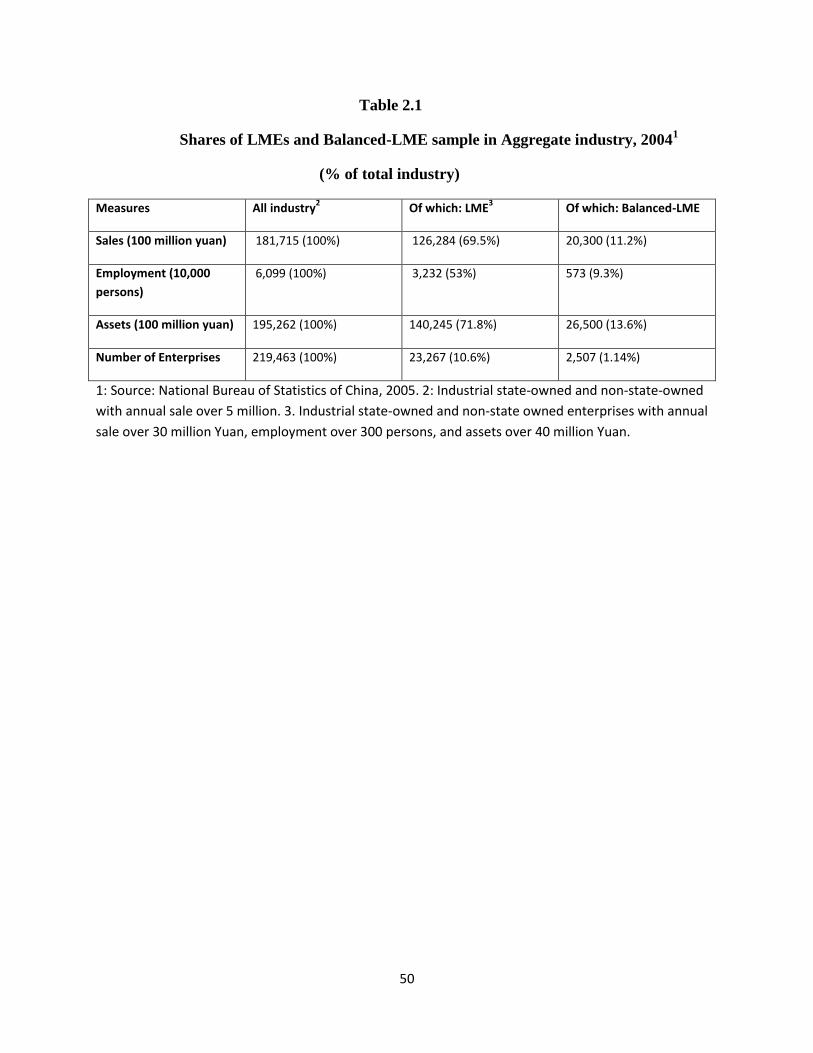
As in Table 2.1, we compare our “Balanced-LME sample” with both total industry and with
large- and medium-size enterprises data in three dimensions—sales revenue, employment, and
fixed assets. We find although our sample only contains slightly over one percent China’s
industrial enterprises with annual sales over 30 million Yuan, employment over 300 persons, and
total assets over 40 million Yuan, it captures 11.2 percent of industrial sales, 9.3 percent of
industrial employment, and 13.6 percent of industrial assets.
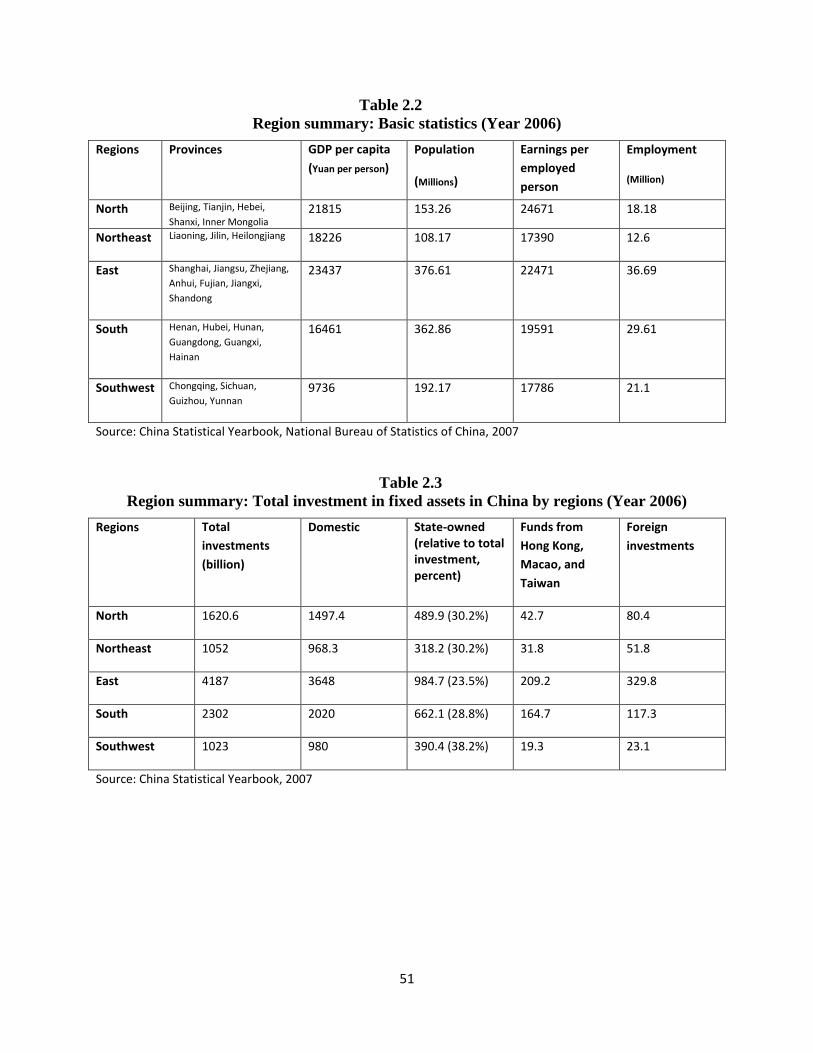
In Table 2.2 and 2.3, we provide summary statistics for each region. As shown, the East and
North are two richest regions while the Southwest is the poorest region in China in term of GDP
per capita or earnings per employed person. Table 2.3 shows that the East has the highest state-
owned investment while the percent to its own total investment is the lowest among five regions.
5We construct horizontal, upstream, downstream stocks based on the unbalanced dataset. For one specific industry,
we sum up all the technology expenditure flows of the firms operating in this industry. Then we use the perpetual
inventory method to convert the technology expenditure flow of the industry into the technology expenditure stock
of the industry. After the construction of horizontal stocks, we apply input-output tables to obtain upstream and
downstream stocks. Details are explained in the following subsections.
Page 27
17
The Southwest is exactly opposite: its state-owned investment is the lowest among five regions
while its ratio of state-own investment over total investment is the highest.
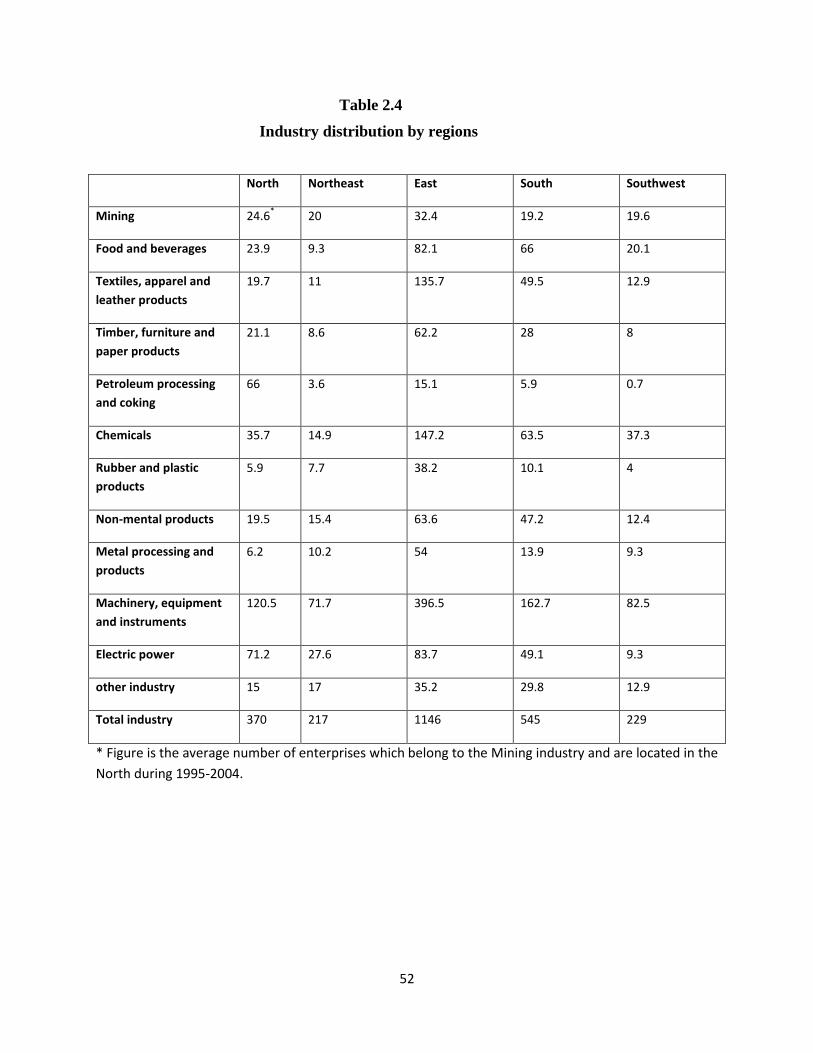
As shown in Table 2.4, over fifty percent of firms in our dataset are located in the Eastern region.
In all five regions, the machinery, equipment and instruments industry contains the largest
number of firms. As shown in Table 2.5, the firms in the Eastern region own the largest stock of
technology development expenditures, 51.4 percent of internal technology development, and
48.7 percent of imported technology expenditure. The Northeastern region has the lowest ratio of
total technology development expenditure, the sum of internal technology development
expenditure and imported technology expenditure, to the value of industrial output at constant
price among the five regions. Table 2.6 shows that the East captures 46 percent of total foreign
capital in China and is the region with the most foreign capital in China. The second region is the
North with a share of 19.2 percent of total foreign capital in China. The Southern region is the
region with the highest foreign capital intensity—foreign capital over total capital, followed by
the East.
2.3.1: Stock of technology development expenditure
For estimation purposes, we use the perpetual inventory method to construct stocks of
technology development expenditure for each firm in our data set. The stocks are constructed as
the accumulation of reported technology development expenditures minus depreciation; i.e.
KR,i,t = (1-δ)KR,i,t-1 + IR,i,t-1
where
KR,i,t ≡ stock of R&D of firm i at time t;
Page 28
18
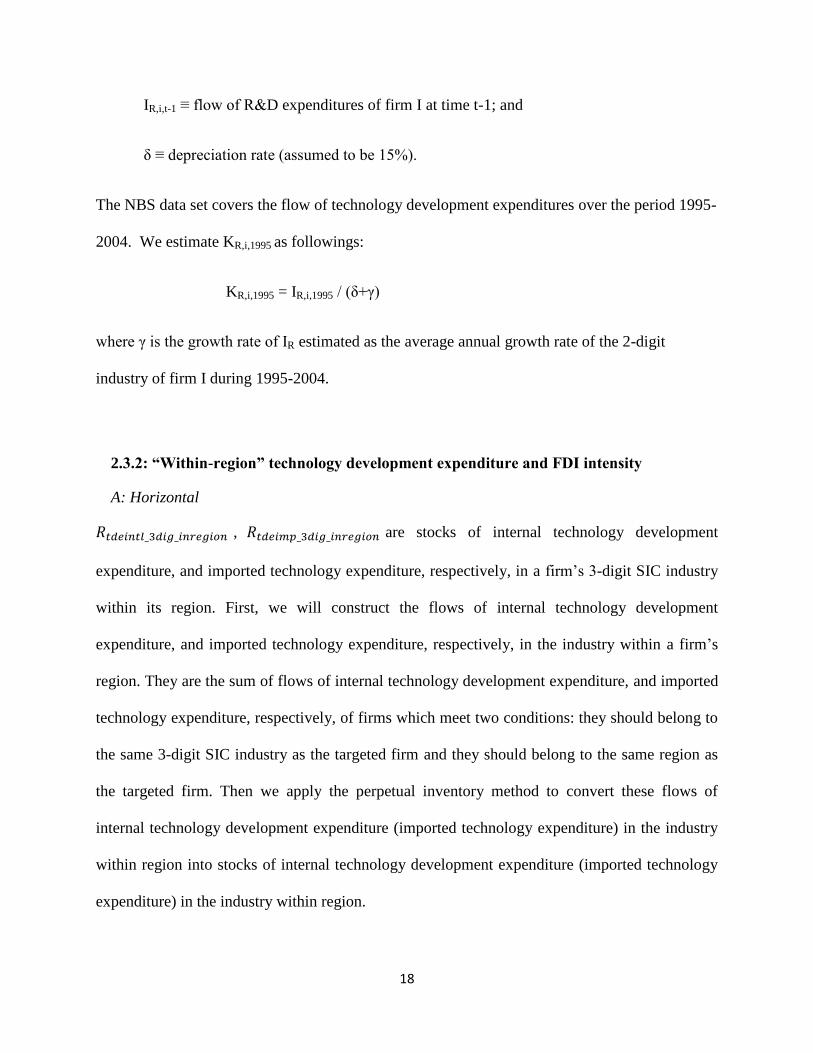
IR,i,t-1 ≡ flow of R&D expenditures of firm I at time t-1; and
δ ≡ depreciation rate (assumed to be 15%).
The NBS data set covers the flow of technology development expenditures over the period 1995-
2004. We estimate KR,i,1995 as followings:
KR,i,1995 = IR,i,1995 / (δ+γ)
where γ is the growth rate of IR estimated as the average annual growth rate of the 2-digit
industry of firm I during 1995-2004.
2.3.2: “Within-region” technology development expenditure and FDI intensity
A: Horizontal
, are stocks of internal technology development
expenditure, and imported technology expenditure, respectively, in a firm’s 3-digit SIC industry
within its region. First, we will construct the flows of internal technology development
expenditure, and imported technology expenditure, respectively, in the industry within a firm’s
region. They are the sum of flows of internal technology development expenditure, and imported
technology expenditure, respectively, of firms which meet two conditions: they should belong to
the same 3-digit SIC industry as the targeted firm and they should belong to the same region as
the targeted firm. Then we apply the perpetual inventory method to convert these flows of
internal technology development expenditure (imported technology expenditure) in the industry
within region into stocks of internal technology development expenditure (imported technology
expenditure) in the industry within region.
Page 29
19
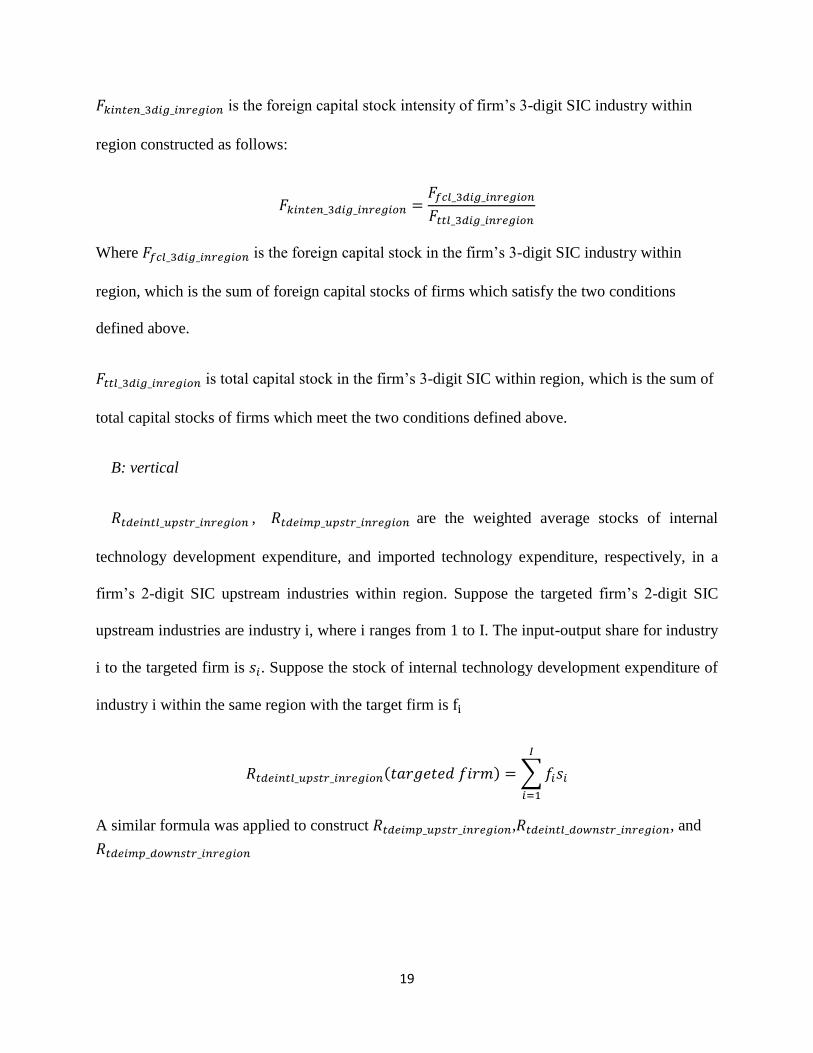
is the foreign capital stock intensity of firm’s 3-digit SIC industry within
region constructed as follows:
Where is the foreign capital stock in the firm’s 3-digit SIC industry within
region, which is the sum of foreign capital stocks of firms which satisfy the two conditions
defined above.
is total capital stock in the firm’s 3-digit SIC within region, which is the sum of
total capital stocks of firms which meet the two conditions defined above.
B: vertical
, are the weighted average stocks of internal
technology development expenditure, and imported technology expenditure, respectively, in a
firm’s 2-digit SIC upstream industries within region. Suppose the targeted firm’s 2-digit SIC
upstream industries are industry i, where i ranges from 1 to I. The input-output share for industry
i to the targeted firm is . Suppose the stock of internal technology development expenditure of
industry i within the same region with the target firm is
( ) ∑
A similar formula was applied to construct , , and
Page 30
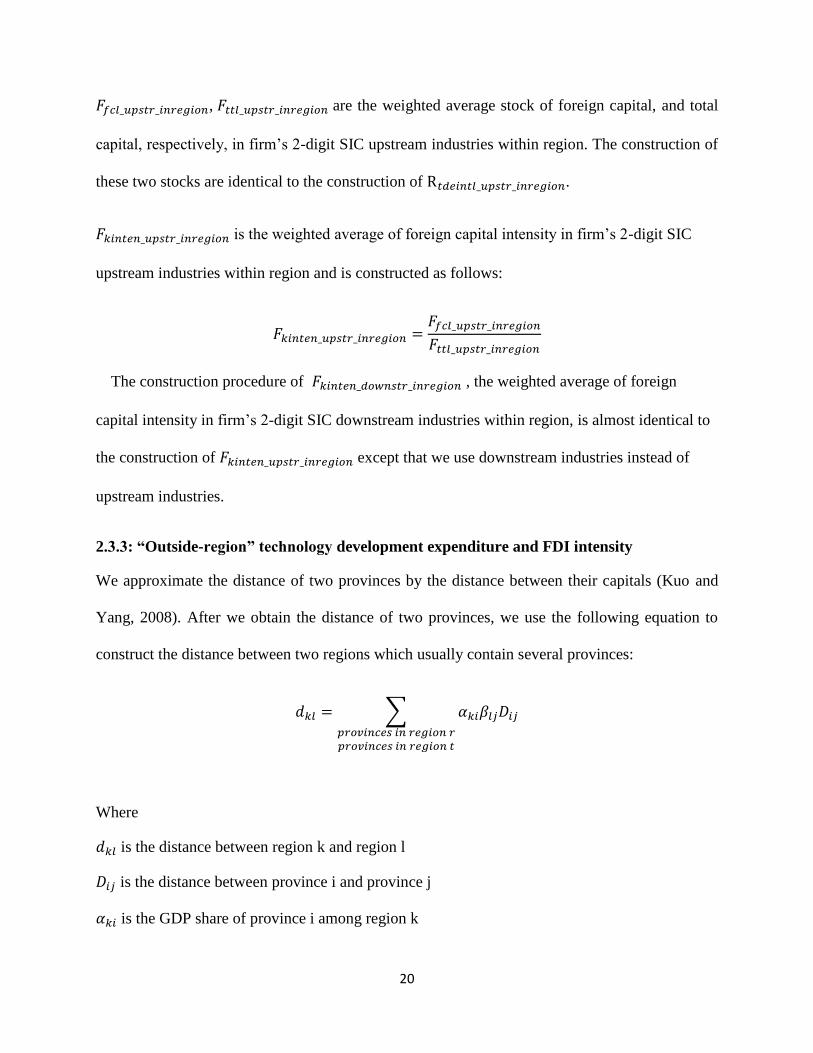
20
, are the weighted average stock of foreign capital, and total
capital, respectively, in firm’s 2-digit SIC upstream industries within region. The construction of
these two stocks are identical to the construction of .
is the weighted average of foreign capital intensity in firm’s 2-digit SIC
upstream industries within region and is constructed as follows:
The construction procedure of , the weighted average of foreign
capital intensity in firm’s 2-digit SIC downstream industries within region, is almost identical to
the construction of except that we use downstream industries instead of
upstream industries.
2.3.3: “Outside-region” technology development expenditure and FDI intensity
We approximate the distance of two provinces by the distance between their capitals (Kuo and
Yang, 2008). After we obtain the distance of two provinces, we use the following equation to
construct the distance between two regions which usually contain several provinces:
∑
Where
is the distance between region k and region l
is the distance between province i and province j
is the GDP share of province i among region k
Page 31
21
is the GDP share of province j among region l
As in Kuo and Yang (2008), the distance weight is an exponential function with a distance
decay parameter β:
Adopting the specification in Funke and Niebuhr’s (2005), we define β as:
( )
Where is the average distance between two adjacent regions, and is the transformed
distance decay parameter. Usually ranges from 0 to 1, we use only 0.5 in our study.
A: Horizontal
, are the weighted average stocks of internal
technology development expenditure, and imported technology expenditure, respectively, in the
firm’s 3-digit SIC industry outside region. Assuming the targeted firm is in the Eastern region, as
we define above, is the distance weight between region and the Eastern region, where
belong to set Ω={Northern, Northeastern, Southern, Southwestern}. First, we will construct the
weighted average flow of internal technology development expenditure in the industry outside
region. For each firm located in region r that belongs to the same industry with the targeted firm,
we label its flow of internal technology expenditure as , where ranges from 1 to . Then:
( ) ∑ ∑
Then we use the perpetual inventory method to convert to obtain
The same method was applied to construct .
Page 32
22
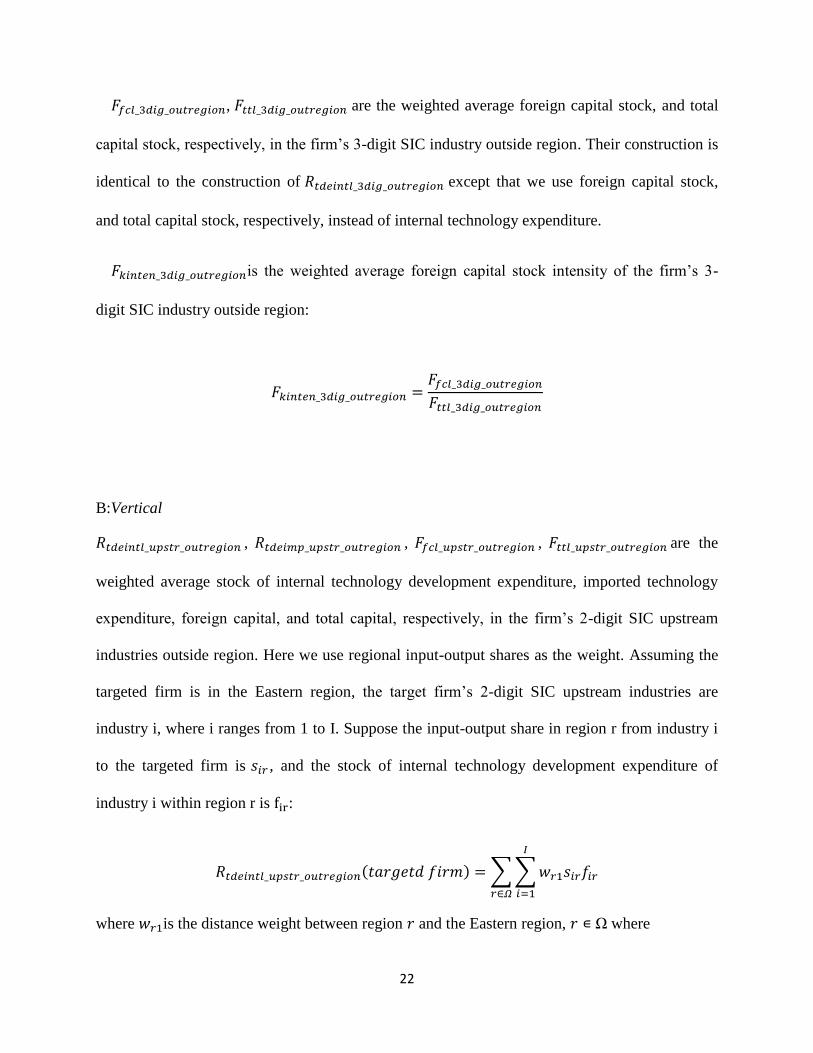
, are the weighted average foreign capital stock, and total
capital stock, respectively, in the firm’s 3-digit SIC industry outside region. Their construction is
identical to the construction of except that we use foreign capital stock,
and total capital stock, respectively, instead of internal technology expenditure.
is the weighted average foreign capital stock intensity of the firm’s 3-
digit SIC industry outside region:
B:Vertical
, , , are the
weighted average stock of internal technology development expenditure, imported technology
expenditure, foreign capital, and total capital, respectively, in the firm’s 2-digit SIC upstream
industries outside region. Here we use regional input-output shares as the weight. Assuming the
targeted firm is in the Eastern region, the target firm’s 2-digit SIC upstream industries are
industry i, where i ranges from 1 to I. Suppose the input-output share in region r from industry i
to the targeted firm is , and the stock of internal technology development expenditure of
industry i within region r is :
( ) ∑ ∑
where is the distance weight between region and the Eastern region, Ω where
Page 33
23
Ω ={Northern, Northeastern, Southern, Southwestern}
The same approach was used to construct , ,
.
is the weighted average of foreign capital stock intensity in firm’s 2-digit
SIC upstream industries outside region, employing the following formula:
, , ,
are the weighted average stock of internal technology development expenditure, imported
technology expenditure, foreign capital, and total capital, respectively, in the firm’s 2-digit SIC
downstream industries outside region. The construction of the variables is identical to
, , , ,
respectively, except we use downstream industries instead of upstream industries.
is the weighted average of foreign capital stock intensity in the firm’s 2-
digit SIC downstream industries outside region, and it is the ratio of over
.
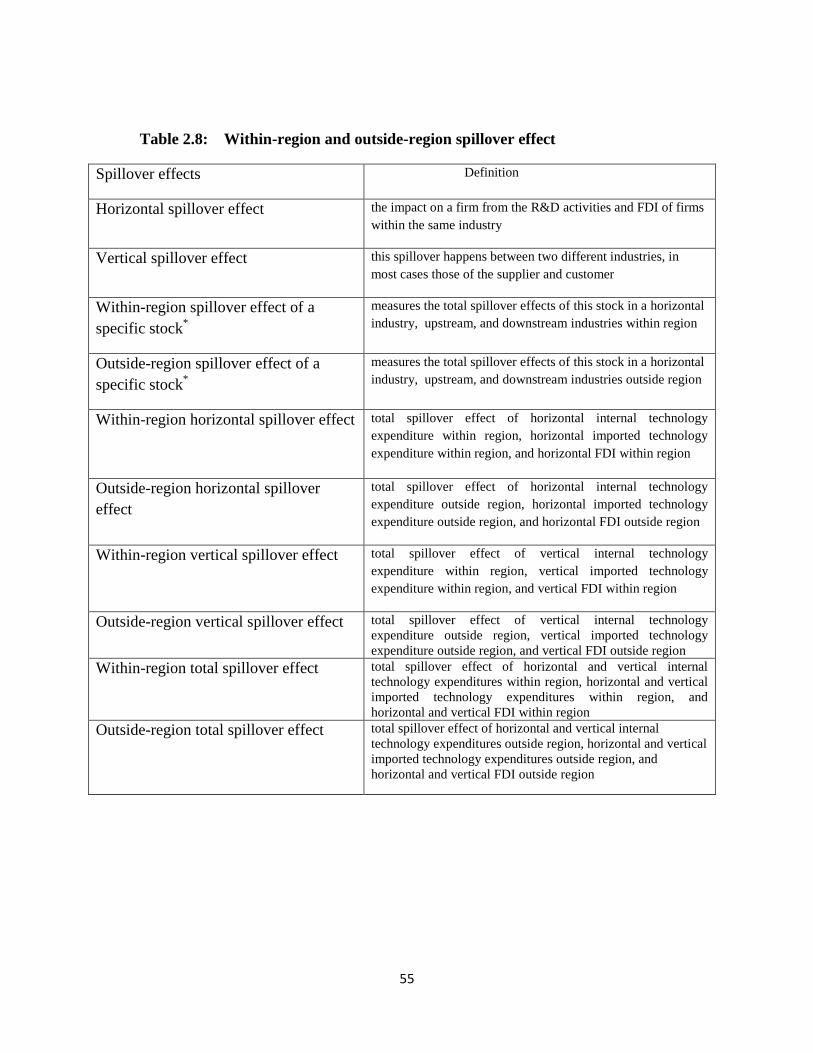
Table 2.7 provides a summary description of the eighteen industry stocks. Table 2.8 provides a
summary definition of within-region and outside-region spillover effects.
Page 34
24
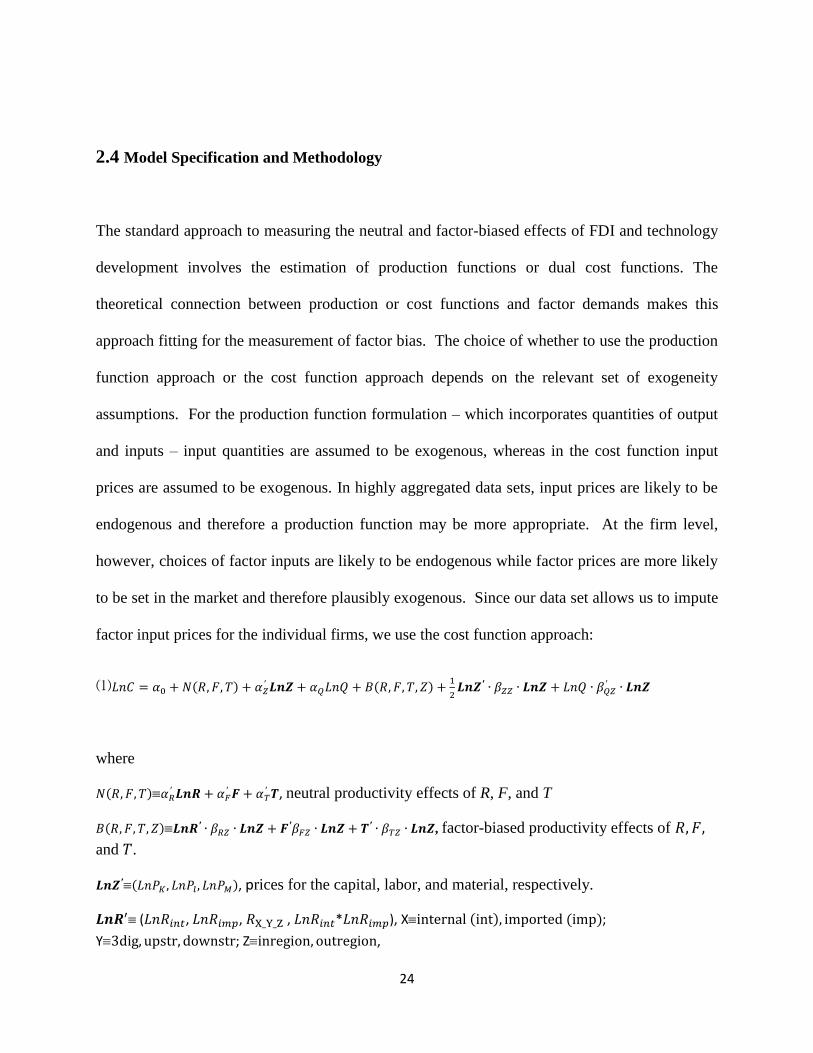
2.4 Model Specification and Methodology
The standard approach to measuring the neutral and factor-biased effects of FDI and technology
development involves the estimation of production functions or dual cost functions. The
theoretical connection between production or cost functions and factor demands makes this
approach fitting for the measurement of factor bias. The choice of whether to use the production
function approach or the cost function approach depends on the relevant set of exogeneity
assumptions. For the production function formulation – which incorporates quantities of output
and inputs – input quantities are assumed to be exogenous, whereas in the cost function input
prices are assumed to be exogenous. In highly aggregated data sets, input prices are likely to be
endogenous and therefore a production function may be more appropriate. At the firm level,
however, choices of factor inputs are likely to be endogenous while factor prices are more likely
to be set in the market and therefore plausibly exogenous. Since our data set allows us to impute
factor input prices for the individual firms, we use the cost function approach:
⑴ ( ) ( )
where
( )
, neutral productivity effects of R, F, and T
( ) , factor-biased productivity effects of
and .
( ), prices for the capital, labor, and material, respectively.
( , , , * ), X ( ) ( );
Y ; Z ,
Page 35
25
( , , ln * , ln * , ), X ;
Y ,
( ), year dummy variables,
C total cost of production,
Q gross value of industrial output in constant prices,
price of fixed assets, which is calculated as (Value added-wage bills-welfare payments)/(net
value of fixed assets),
price of labor , which is calculated as (wage bills+ welfare payments)/(number of employed
persons),
price of material, which is calculated as weighted average of industrial prices using the
input-output shares,
stock of technology development expenditures ( = internal (tdeint) or imported (tdeimp)),
weighted average stock of internal technology development expenditure (or imported
technology expenditure) in firm’s 3-digit SIC industry (or 2-digit SCI upstream or downstream
industry) within (or outside) region. ( = internal (tdeint) or imported (tdeimp), Y=3-dig or upstr
or downstr, Z=inregion or outregion)
foreign capital stock intensity, which is calculated as (foreign capital stock)/(total capital
stock),
weighted average foreign capital stock intensity of firm’s 3-digit SIC industry (or 2-
digit SIC upstream or downstream industry) within (or outside) region. (X=3-dig or upstr or
downstr, Y=inregion or outregion)
Page 36
26
T time dummies for the span of 1995 to 2004, which are used to capture the autonomous
technical progress during this time period.
Using Shephard’s Lemma, we derive the cost share equation associated with each factor input
by taking the derivative of the cost function with respect to the relevant input price; i.e.,
C
XP
P
C ii
i
ln
lni = K, L, M
Specifically, taking the derivative of equation (1) with respect to each input price, we obtain the
following cost share equations:
(2) ⁄
(3 ) ⁄
To ensure that the coefficients exhibit the usual properties of symmetry and homogeneous of
degree one in prices, we impose the following constraints:
βa,b = βb,a
i’∙Z = 1
βZZ∙ i = 0
βRZ∙ i = 0
βRTZ∙ i = 0
βTZ∙ i = 0
βQZ∙ i = 0
where i is a vector of ones.
Page 37
27
The reason that we do not adopt the random effects approach is that the unobserved effect may
be correlated with some of the dependent variables. An unobserved difference in leadership
ability at a firm is one situation in which issued of simultaneity may arise. Better leaders will be
more likely to make better decisions, have better negotiation skills and have more connections
with the upstream input and downstream sale industries. An effective manager can reduce the
production cost in the following ways: First, an effective manager can increase workers’
productivity through creating a friendly working environment, assigning different talent workers
to the suitable place, highlighting good performances, and creating events to increase employee.
Those efforts will motivate workers’ morale and increase efficiency. Second, an effective
manager will make appropriate financial decisions including budget control, balance between
facility maintenance and substitution, and future employment plans. Third, an effective manager
will be aware of market fashions and produce timely product upgrades, which will help reduce
the possibility of overstocked, out-date products. All those advantages of great leadership will
contribute to the low production cost and are included in the firm’s unobserved error term. In the
theory of economic development, Schumpeter (1934) emphasized that a firm’s leaders,
especially their ability to innovate, have significant effects on a firm’s development. Kirzner
(1973) proposed that the ability to handle the unbalanced situation of firm’s leader is important
to the firms.
On the hand, an effective manager will be more likely to make policies or regulations to use
R&D or FDI more effectively. For example, Elkins et al (2003) surveyed past empirical
literature investigating the impact of leader quality on the likelihood of success for R&D
organizations. The results indicate that leaders who can encourage project members with
Page 38
28
intellectual incentives, communicate effectively and motivate workers are more likely to
successfully guide an organization.
Therefore, an effective manager usually helps to reduce production costs and increase the
efficiency of R&D and FDI. However, leadership is unobserved in our dataset and regression
error terms. This will induce a counterfeit association between the low production cost and use of
R&D and FDI. In order to overcome this problem, we adopted the fixed effects estimation
procedure. For each firm that appeared in our panel dataset, we created a dummy variable and
incorporate these variables in our regression equations.
Also, measurement error would occur in our dataset. As Fisher-Vanden et al (2009) pointed out,
even with truthful reporting, the values of R&D expenditure and imported technology collected
in our dataset still are only an approximation. With the classical assumptions that measurement
error is not correlated with original error terms and explanatory variables, which seems to hold in
most situations -- and in our case, we have attenuation bias in our regression coefficients. The
absolute value of the estimated coefficients using our dataset will tend to underestimate the
coefficients. However, this attenuation bias, or downward bias, will reinforce our results. For
example, if the estimated coefficient of R&D turns out to be negative, then the true value of the
parameter should be also negative with a larger magnitude after we incorporate the downward
bias.
Page 39
29
2.5. Results and Interpretation
2.5.1 Empirical Results:
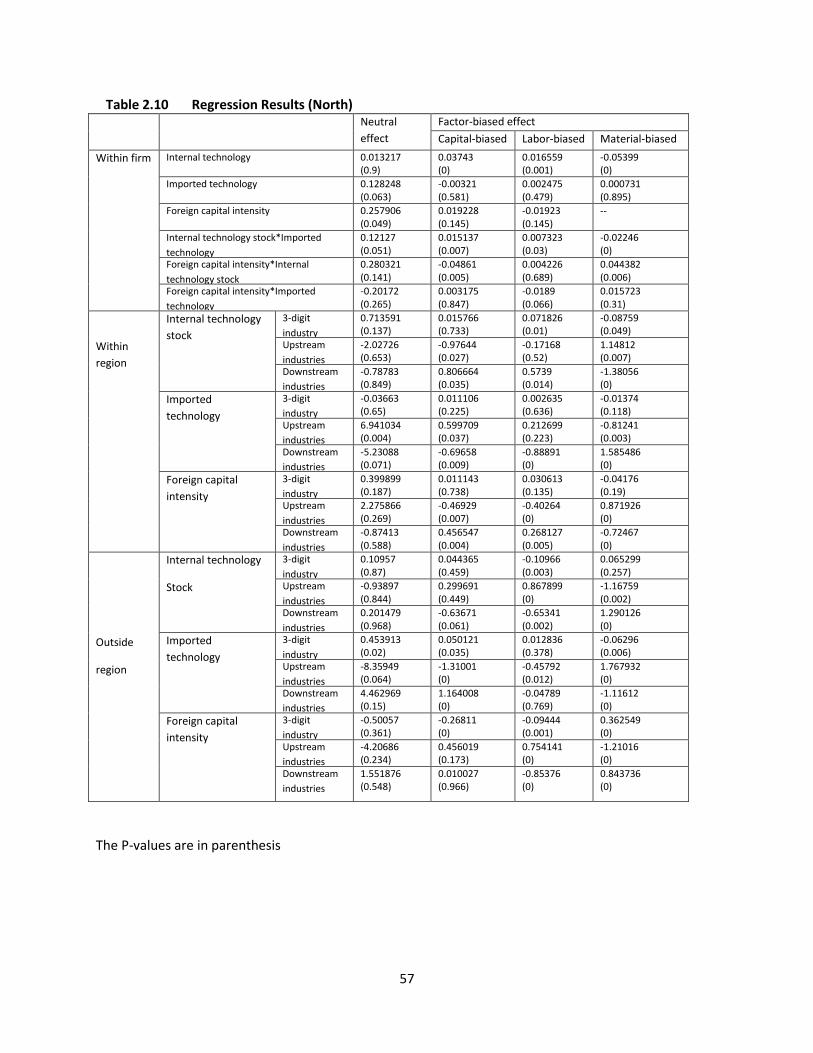
Tables 2.10--2.14 provide the regression results. As showed in Table 2.10, coefficients
associated with stock of internal technology expenditures, both in firm’s 3-digit SIC industry,
firm’s 2-digit SIC upstream industries, and firm’s 2-digit SIC downstream industries, within and
outside region are not robust. Therefore, internal technology expenditures-both within and
outside the Northern region—do not exhibit significant neutral spillover effects on the firms
located in the Northern region. However, the neutral impact of imported technology on total cost
is significant. For instance, the stock of imported technology at firm’s 3-digit industry outside the
Northern region has cost-increasing spillover effects, as well as the stock of imported technology
of upstream industries within the Northern region. On the contrary, cost-reducing effects
originated from the stock of imported technology of upstream industries outside the Northern
region and downstream industries within the northern region. As showed in Table 2.10, both
within-region and outside-region of foreign stocks don’t have significant cost effects. We can
conclude that, for firms located in the Northern region, imported technology has more significant
spillover effects than internal technology development and foreign capital.
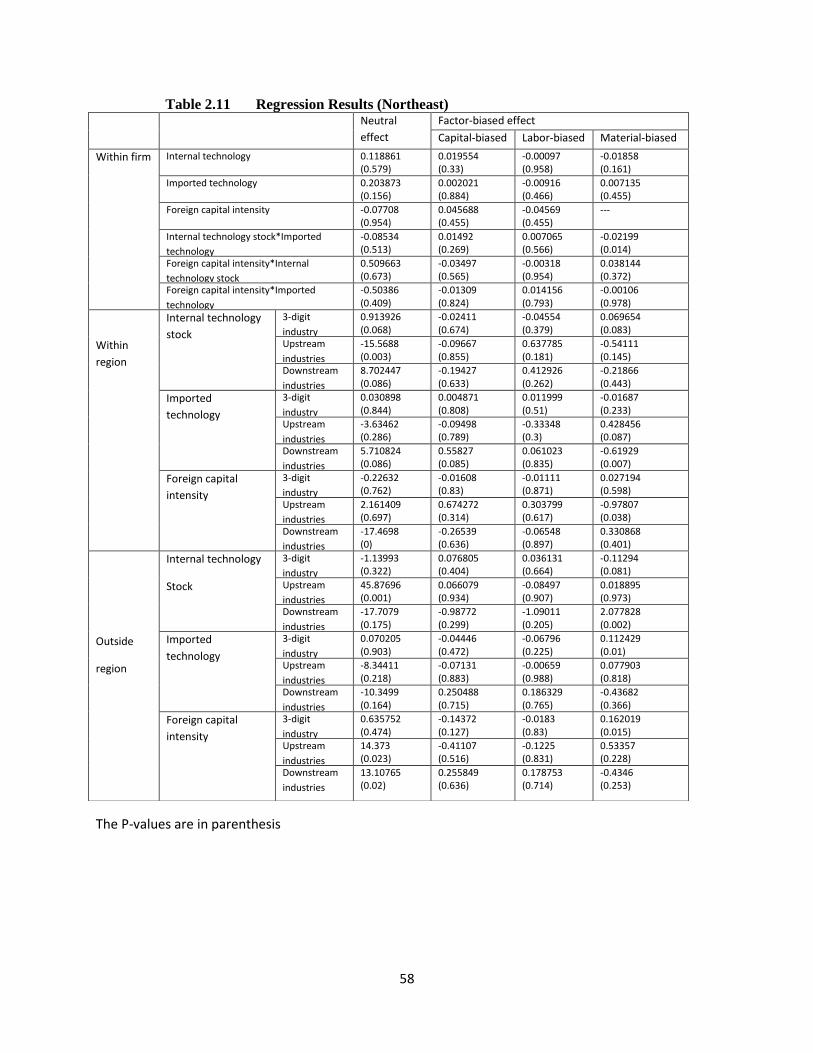
Unlike the Northern region, for the Northeastern region, the three technology stocks—internal
technology expenditure, imported technology expenditure, and FDI all have significant spillover
effects on the local firms. As showed in Table 2.11 the stock of internal technology expenditures
in the following three channels has cost-increasing effects: 3-digit industry within the
Northeastern region; upstream industries outside the Northeastern region; downstream industries
within the Northern region. Only the stock of internal technology expenditures from upstream
Page 40
30
industries within the Northeastern region exhibit cost-saving effects. Imported technology from
downstream industries within the Northeastern region has cost-increasing effects. We also find
that foreign capital through two channels—upstream and downstream industries outside the
Northeastern region—exhibits cost-increasing spillover effects while foreign capital in
downstream industries within the Northeastern region has cost-saving spillover effects. We can
conclude that, for the Northeastern region, the primarily neutral cost effects happen through
vertical channel—both upstream and downstream.
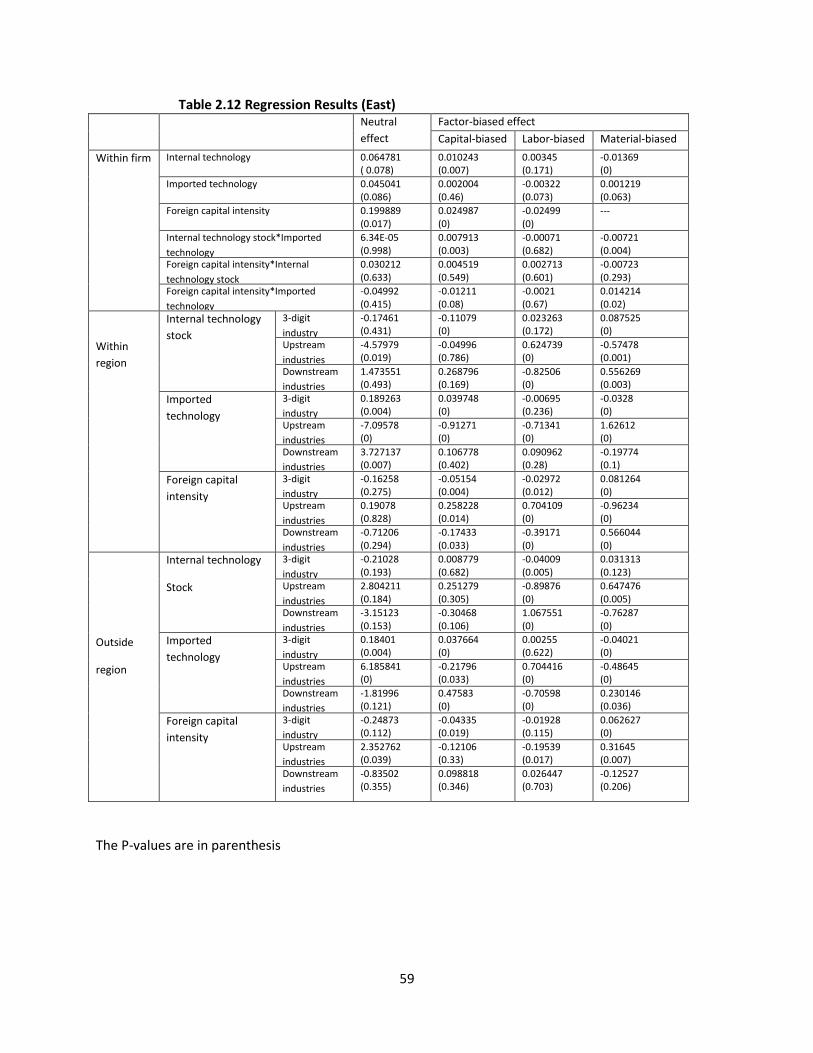
Like the Northeastern region, for the Eastern region, all three type technology stocks have
significant spillover effect on the local firms. Moreover, similar to the Northeastern region, the
neutral spillover effect in the Eastern region mainly takes place through vertical channel except
for the imported technology stock. In most situations as showed in Table 2.12, the cost effects of
those two stocks are not significant, and only internal technology expenditures from upstream
industries within the Eastern region have cost-saving effect and Foreign capital of upstream
industries outside the Eastern region have cost-increasing effect. Imported technology from four
channels—3-digit industry within and outside the eastern region, upstream industries outside the
eastern region and downstream industries within the eastern region—display cost-increasing
effect. We can conclude that stocks within the Eastern region have more significant spillover
effects than stocks outside the Eastern region.
For the Southern region, similar to the Northeastern and Eastern region, all three technology
stocks exhibit robust spillover effects. As showed in Table 2.13, cost-increasing effects originate
from four stocks—internal technology expenditures of 3-digit industry within the Southern
region, imported technology from 3-digit industry outside the Southern region, foreign capital
form upstream industries within the Southern region and downstream industries outside the
Page 41
31
Southern region. Only internal technology expenditures from 3-digit industry outside the
Southern region and downstream industries within the Southern region have cost-saving
spillover effects.
For the Southwestern region, similar to the Northeastern and Eastern region, spillover effects
mainly take place through vertical channel-both upstream and downstream. As showed in Table
2.14, internal technology expenditures of downstream industries within the southern region and
imported technology of upstream industries outside the Southern region display cost-increasing
effects, while cost reducing effect only originate with the upstream stocks of internal technology
expenditure within the Southern region. While foreign capital does not have statistically
significant spillover effects.
In conclusion, for internal technology stock, most neutral spillover effects come from within
region’s stock while outside region’s stocks only have spillover effect though few channels in
some regions.(Actually, only two channel---3-digit outside region’s stock in South and upstream
outside region’s stock in Northeast). While for imported technology and foreign capital, both
within region’s stocks and outside region’s stocks have significant neutral spillover effects.
Table 2.15—2.19 use the results from Tables 2.10—2.14 to measure the change in total cost into
the change of amount of factors used, to evaluate the contribution of three types of technology
developments to the change in total cost. Using the coefficients from Table 2.10-2.14 and mean
values of each variable in our equation (1), we subtract the cost function in equation (1)
evaluating in year 2004 by the cost function in equation (1) evaluating in year 1995. Then we use
these differences to account for the percentage change in total cost contributed by each type of
Page 42
32
technology development expenditure. These results are listed from Table 2.15 to Table 2.19,
consist of the neutral effect, factor-bias effect and total effect, of three channels through which
three technology developments have spillover effects in five regions.
Vertical channels are the most effective channels that affect total cost, both for stocks within the
Northern region and outside the Northern region. This pattern holds for the Northeastern region,
the Eastern region, the Southern region and the Southwestern region. In addition to this result,
for one specific stock, Tables 2.15 to Table 2.19 reveal several interesting patterns. For instance,
for imported technology, except outside the Eastern region and outside the Southwestern region,
all other eight spillover effects are cost saving. Except for the Northern region, internal
technology development dominates the outside-region spillover effect in other four regions.
As we expected in Hypothesis 1, empirical results find that spillover effects generated through
vertical channels are more significant--either cost-saving or cost-increasing--than effects
generated through horizontal channel, both for within and outside region. This result extends the
studies of Javorcik (2004) and Fisher-Vanden et al (2009) who find strong cost-saving vertical
but weak horizontal spillover evidences to the case of within versus outside regions. Specifically,
like most previous studies, within-region vertical spillovers have more significant impact on total
cost than horizontal spillovers. However, few of previous studies has found that vertical
channels are also more effective than horizontal channel when examining the impact of outside
region’s stocks on the local firms’ production costs.
Page 43
33
2.5.2 Rapid Growth in the Eastern Region
For the Eastern region, all three types of technology stocks have significant spillover effects on
local firms. Table 2.12 shows that the neutral spillover effect in the Eastern region mainly takes
place through vertical channels. Table 2.17 shows that the within-region total spillover effect
reduces the average firm’s production cost by 179%, which ranks 2rd among all five Chinese
regions. This confirms Hypothesis #2.
What are the factors that contribute to the Eastern region receiving greater within-region
spillover than most other regions? Infrastructure, human capital (for instance, absorptive
capacity), and government macroeconomic policies may be several important factors.
Physical Infrastructure, especially the transportation infrastructure, is an important factor in
determining the extent of spillover. Higher transportation costs will force a firm to choose
suppliers that are close to their location, this is also the case for consumers. Therefore the vertical
spillover more likely takes place between firms that are geographically proximate. This hinders
the spread of advanced technology and managerial skills within the region or across regions.
Aggravated by China’s geography (mountains and hilly, few plains), transportation costs have
bigger impact on local firms’ costs. However, the coastal region has geographical advantages
over those inland. For example seven Coastal provinces, Hebei, Shandong, Jiangsu, Zhejiang,
Fujian, Guangdong, and Hainan, have 82% percent of their population living within 100
kilometers of the sea or navigable rivers (Démurger et al (2002)). The low cost of water
transportation makes it easier to exchange of goods within coastal region and export goods to
foreign countries.
Page 44
34
Aside from these geographical advantages, the Eastern region also enjoys advantages in
transportation infrastructure, including highways and railways. In the year 1998, the average
transportation network density in the East was over 500km/1000km2, while the density in the
Interior was between 350 and 500 km/1000 km2, the density in the West was even less 350
km/1000km2. (Démurger et al (2001))
The advantage in transportation facilities helped the Eastern region receive more significant cost-
savings from the within-regions spillover effect than most other Chinese regions.
Absorptive ability is essential to determine how well firms can recognize, digest, and apply new
knowledge to commercial ends. It becomes more important when the new knowledge is tacit
knowledge, which requires firms to reach a certain level of absorptive ability to understanding
and putting into practice. We use the variable of technology development personnel to roughly
measure firms’ absorptive ability. In the year 2001, our unbalanced dataset indicates that the
ratio of technology development personnel to total employees was 4.7% in the Eastern region,
which was higher than 3.6% in the Northern region, 3.2% in the Northeastern region, 4.4% in the
Southern region, and the 4.3% in the Southwestern region.
This advantage in absorptive ability among Chinese regions contributes to the fact that the
Eastern region receives more significant cost-savings from the within-region spillover effect than
many other Chinese regions.
In the early 1980s, in order to give priority to efficient regions and let coastal regions grow first,
China’s government formulated a series of coastal development strategies including many
preferential policies, which were made to reform the economy in coastal region into a market-
Page 45
35
orientated economy. In particular, many special economic zones were established in the coastal
region. Firms in these open economic zones could import intermediate inputs duty free, were
provided with various preferential tax-treatments, and were allowed to collaborate with foreign
firms in design, production, and distribution.
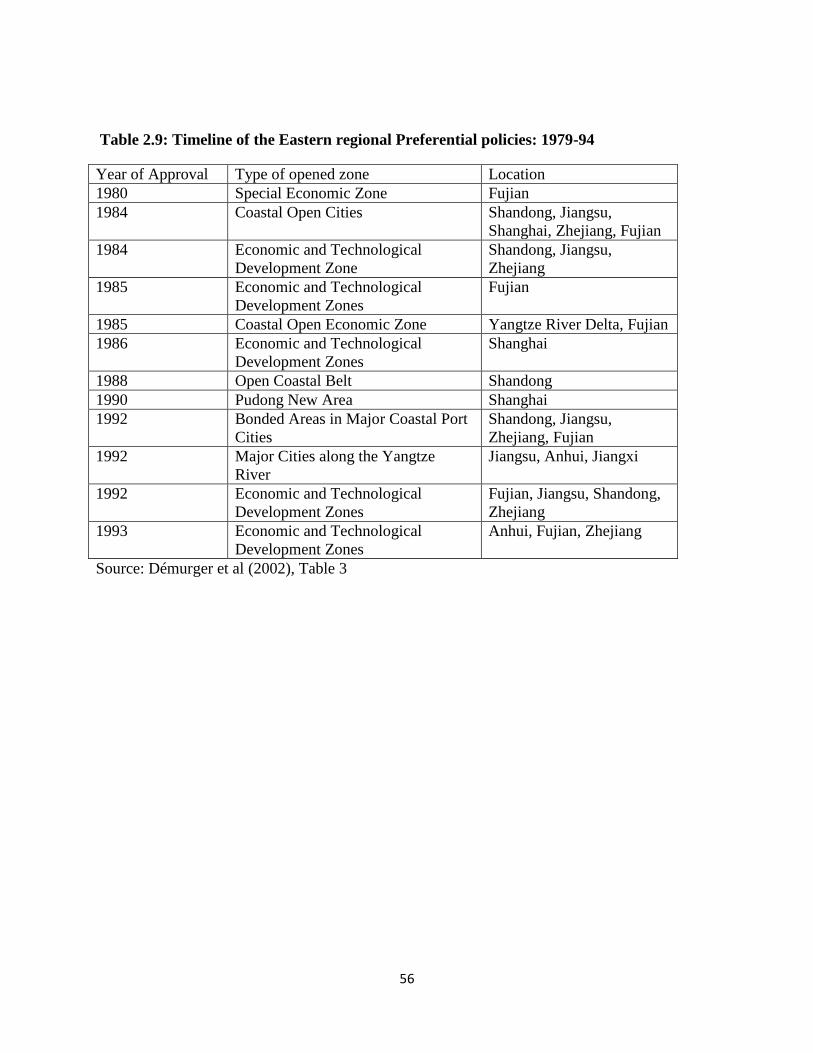
Table 2.9 lists the timeline of the establishment of economic zones in the Eastern region over the
period 1979-1994. The coastal development strategies, especially the preferential policies,
brought many benefits to the development of the economy in the Eastern region. These include a
huge influx of FDI into the Eastern region.
Figure 2.2 Shows that the value of FDI in the Eastern region and FDI in China over the period
1995-2006. We find FDI in the Eastern region has steadily grown from below 20,000 million
dollar in 1995 to around 90,000 million dollar in 2006. During 1995-2000, FDI in the Eastern
region of China accounts for around 40% of total FDI in China, while after 2000, this number is
more than 50%.
Convenient transportation facilities lower the cost of the exchange of inputs and final production,
provide higher freedom of movement for laborers, and speed up the spread of technology and
managerial skills. Firms’ high absorptive abilities help them to better recognize, understand, and
apply this newly acquired technology. Regional preferential policies and FDI spur the
introduction of advanced technology and growth of the regional economy. With the advantages
in these three aspects, the Eastern region has more sources of technology spillovers, more foreign
firms and more firms with advanced technology, a better economic environment for spillovers to
take place, an advanced transportation infrastructure and advantages embedded in the advanced
economy including a more mature labor market, financial market, and innovation mechanism et
Page 46
36
al, and a better ability to absorb and utilize the technology spillover. Therefore large cost-saving
within-region spillovers are expected to occur within the Eastern region. This is consistent with
our empirical results.
2.5.3 The Impact of “Grand Western Development Program” on the Southwestern Region
Hypothesis 3, which expect developed regions will receive more benefits from within-region
spillover effects than less developed regions, is not supported by our empirical results. Not only
did the relatively developed regions, such as the East, benefit from significant within-region
spillover, but also the less developed regions, such as the Southwest, gained largely from within-
region spillovers. In addition, outside-region spillovers have cost-saving effects on firms
operating in the Southwestern region. This may be a result of “Grand Western Development
Program” launched in 2000 to accelerate the economic development of the Central and Western
region.
In order to further analyze the impact of “Grand Western Development Program” on the
technological spillover and economic development in Western regions, we divided the dataset
into two time periods: 1995-1999 and 2000-2004, then ran almost identical regressions on these
two datasets separately. Results are reported in Table 2.20 and 2.21. After comparing these two
Tables, we found two main changes: outside-region total spillover effect turned from cost-
increasing over the period 1995-1999 to be cost-saving over the period 2000-2004; within-region
total spillover effect turned from cost-saving over the period 1995-1999 to be cost-increasing
over the period 2000-2004. The first change is largely caused by the change in the spillover
Page 47
37
effect of downstream internal technology expenditures located outside the Southwestern region.
Although this spillover effect remains cost-increasing over these two periods, its magnitude
becomes much smaller over the period 2000-2004. The lag in technology and managerial skills
may require firms in the Southwest to devote more costs to produce the products demanded by
downstream consumers located outside the Southwestern region. Therefore, the spillover effect
increases costs. However, the reason causing the magnitude of this cost-increasing spillover
effect to get smaller requires further analysis. We will explore it in the following paragraph
through a policy discussion. The investigation will also analyze the second change—the within-
region total spillover effect turns from cost-saving over the period 1995-1999 to cost-increasing
over the period 2000-2004. This change is mainly due to the within-region spillover effect of
imported technology: its magnitude becomes smaller although it remains cost-saving over the
two periods.
The above results show that there are significant changes in the spillover effects in the
Southwestern region, both the within-region spillover effect and outside-region spillover effect.
We searched for Chinese government policies accounting for these changes and the “Grand
Western Development Program” stood out.
In order to help the lagging Western region to catch up with the Coastal region, China State
Council launched the “Grand Western Development Program” in January 2000. The following
up policies included the construction of “West-East Gas Pipeline” in 2002 and “Returning
Grazing Land to Grass Land” in 2003.
The “Grand Western Development Program” tried to improve the Western region’s
infrastructure, including transportation, power and communication facilities. Through building
Page 48
38
universities, national laboratories, and enterprise technology centers, this program planned to
enhance the education level in the Western region. Also it encouraged foreign firms to invest in
the Western region by creating an appealing investing environment and introducing other
initiatives.
There is evidence of success for the “Grand Western Development Program” at some levels. For
example, statistics data shows a substantial growth in foreign investment in fixed assets in the
Southwestern region: from 4.52 Billion Chinese Yuan in 1995 to 10.5 Billion Chinese Yuan in
20046.
Real GDP in the Southwestern region increased from 546 billion Chinese Yuan in 2000 to 811
billion Chinese Yuan in 2004. The real average growth rate over the period 2000-2004 was
10.4%, close to the 10.6% seen in the Northeastern region, and not far behind 11.8% recorded
for the Northern region.7
The “Grand Western Development Program” is divided into three stages: 2000-2010, the
foundation stage; 2011-2030, the development stage; 2031-2050, the modernization stage.8 The
foundation stage focuses on transportation infrastructure which provides a close connection
between the Western region and the Coastal region. For example, six of the ten key projects in
the “Grand Western Development Program” are related with transportation: two railway
construction projects—Chongqing-Huaihua Railway and Nanjing-Xi’an Railway, one airport
construction project which plans to build airports in Shanxi, Yunnan, Lanzhou, and Xinjiang,
one road construction project, the construction of the “West-East Gas Pipeline”, and Chongqing
Light rail project.
6China Statistical Yearbook, 1995-2004
7China Statistical Yearbook, 1995-2004
8The new 10
th five Year Guidelines, China, 2000
Page 49
39
These transportation projects will promote the economic exchange between the Western region
and the Coastal region. Hence, the Western region will receive more cost-saving spillover effects
from the Coastal region via more convenient transportation infrastructure. However, these
increasing spillover effects from outside the Western region will dilute the spillover effects
within the region. This is consistent with our finding that the magnitude of the within-region
spillover effect of imported technology gets smaller after the implementation of the “Grand
Western Development Program.” On the other hand, the inward flow of talents and improved
infrastructure increases the absorptive capacity of the Western region. Many outside region
downstream firms are encouraged to open new branches in the Western region. Transportation
costs for the upstream supplies and downstream consumers become less costly. These changes
help the Western region’s firms receive more benefits from the closer relationship between the
Western region and the Coastal region. Therefore, the Coastal region has a bigger positive
impact on the Western region after the implementation of “Grand Western Development
program”.
2.5.4 SOE Reform in the Northeastern Region
In the Northeastern region, three technology stocks—internal technology expenditure, imported
technology expenditure, and FDI all have significant spillover effects on the local firms. As
showed in Table 2.11 the stock of internal technology expenditures in the following three
channels has cost-increasing effects: 3-digit industry within the Northeastern region; upstream
industries outside the Northeastern region; downstream industries within the Northeastern region.
Only the stocks of internal technology expenditures from upstream industries within the
Northeastern region exhibit cost-saving effects. Imported technology from downstream
Page 50
40
industries within the Northeastern region has cost-increasing effects. We also find that foreign
capital through two channels—upstream and downstream industries outside the Northeastern
region—exhibits cost-increasing spillover effects, while foreign capital in downstream industries
within the Northeastern region has cost-saving spillover effects.
Applying the growth accounting method, we find technology development activities outside the
Northeast region have a negative impact on the firms operating within the Northeast. Notably,
the spillover of internal technology development outside the Northeast increases firms’
production cost by 400%. Although the within-region spillover effect of technology development
activities in the Northeast is cost-saving, its magnitude is the smallest among five regions (See
Table 2.15-2.19). Therefore, Hypothesis 4, which expects that within-region and outside-region
spillovers bring few benefits and may even increase total cost of firms operating in the
Northeastern region, is confirmed by our empirical results.
Many factors may drive firms to increase their total cost. For example, facing the intensified
competition coming from R&D activities of firms outside the Northeastern region, firms in the
Northeast region are likely to innovate new products, which may largely increase their total costs.
However, this type of outside-region cost-increasing spillover effect is different from true
negative productivity effects since the former helps firms to attain higher profits, especially in a
long-run term. Therefore, it is necessary to investigate to what extent this cost-increasing
spillover effect is due to firms’ innovating new products.
In Table 2.22, we use our unbalanced dataset to summarize average new product innovation
expenditures for firms in the Northeastern region. Results show that there was a significant
increase in new product innovation expenditures for firms in the Northeast during 1999-2003.
Page 51
41
Specifically, average expenditure on new product innovation increased from 974 Chinese Yuan
to 3559 Chinese Yuan. This may explain why outside-region R&D activities have cost-
increasing effects on firms located in the Northeast: firms in the Northeast take the strategy of
innovating new products to face the competition from outside-region firms. However, since the
figure (average value for all firms in five different regions) in Table 2.22 is not associated with
each individual firm, we suspect that it does not truly represent the trend of firms’ expenditure on
new product innovation. Therefore, we summarize average ratios of new product innovation
expenditure over total cost for firms in each of the five Chinese regions separately. As shown in
Table 2.23, except for year 1999, there is no significant difference between the variation of the
ratios during 1995-2003 in the Northeast as compared to those in other Chinese regions. Thus,
there may be other potential factors influencing outside-region spillover effects.
To understand whether this outside-region cost-increasing spillover effect is caused by the
capital outflow from the Northeast, we examined outflow of capital. In Table 2.24 we list total
investment in the Northeast during 1995-2004. The results show that total investment in the
Northeast increased steadily during 1995-2004 (Except a slight decline during 1998-1999, from
293.8 billion in year 1998 to 291.8 billion Chinese Yuan in year 1999). Therefore, there is not a
significant capital outflow from the Northeast. This suggests that capital outflow may not be the
factor inducing outside-region cost-increasing spillover effect in the Northeast.
Besides capital outflow, drain on skilled labor will also increase firms’ production cost. As
shown in Table 2.25, we summarize the ratio of the number of technology development
personnel to total employees of firms in the Northeastern region. We notice a significant decline
in the ratio during 1997-2002, from 4.3% to 2.9%. This indicates a serious outflow of skilled
Page 52
42
labor, which will bring firms with lots of damage, such as the loss of core technologies and
additional cost of training of new talent. Therefore, outflow of skilled labor from the Northeast
may cause the outside-region spillover effect in the Northeast to be cost-increasing.
Besides these reasons, we are interested in whether the distinctive feature of ownership
distribution in the Northeast9 matters in outside-region spillovers in the Northeast.
The Northeastern region has the most important state-owned base. Begun in 1949, it is known as
the Northeast Old Industrial Base. Until the year 2002, the total value of assets of state-owned
and state holding enterprises in the Northeast was the largest among all Chinese regions, which
reached 1,324 Billion Yuan, 14.86% of total assets of all Chinese state-owned and state holding
enterprises. Moreover, Assets of state-owned and state-holding enterprises accounted for 79.34%
of the total assets of all enterprises in the Northeast Old Industrial Base, which is much higher
than the National average of 60.93% (Huang and Ge, 2004).
Our dataset shows that SOE ownership among all large and medium sized firms in the Northeast
averages 80% during the period 1995-2004, while the ratio is 66% in the South, 79% in the
North, 63% in the East, and 86% in the Southwest.
However, SOE has many shortcomings, such as a lack of an effective incentive mechanism, a
lack of survival of consciousness, and a tendency to ignore policy implementation. Moreover,
SOEs in the Northeast Old Industrial Base have their own disadvantages. Over years, SOEs in
the Northeastern region have experienced debt problems and a significant shortage of funds.
Overstaffing problems also hindered the product efficiency of SOEs in the Northeast. Recent
structural reforms tried to alleviate this problem by dismissing employees with bad performance
9 the Northeastern region has the highest ratio of number of state-owned enterprises to the number of total
enterprises (Huang and Ge, 2004)
Page 53
43
records. However, this resulted in a huge unemployment rate in the Northeast (Huang and Ge,
2004). The layoff of many employees also resulted in huge placement fees. Moreover, over the
years, the expenditure of the subsidiary units of SOEs in the Northeast, such as primary and
secondary schools and hospitals, has been a heavy burden on the development of SOEs in the
Northeast.
These shortcomings significantly harm technical development in SOEs and their absorptive
capacity, resulting in weak within-region spillover effects and cost-increasing outside-region
spillover effects.
Table 2.16 shows that among spillover effects of the three types of technology development
expenditures, the spillover effect of internal technology development is the largest factor in
increased costs for firms operating in the Northeast. This feature reveals the weakness of
independent innovation of SOEs in the Northeast, which may be the result of following
shortcomings of SOEs in the Northeast:
1. There is a serious shortage of scientific and technological inputs for SOEs in the
Northeast. Technical innovation cannot happen without the financial support. Our
balance dataset shows that the ratio of internal technology development expenditure to
the value of industrial output at constant price for an average firm was only 0.097 in the
Northeast over the period 1995-2004, while the ratio was 0.169 in the North, 0.118 in the
East, 0.126 in the South, and 0.154 in the Southwest.10
2. There is a serious drain on high skilled laborers. Lack of scientific and technical talent
hinders a SOE’s technological innovation capacity. Our unbalanced data shows that in the
10
Table 5 shows that the Northeastern region also has the lowest ratio of total technology development expenditure
to the value of industrial output at constant price.
Page 54
44
year 2001 the ratio of technology development personnel to total employees was only 3.2%
in the Northeastern region, which is lower than the 3.6% in the Northern region, 4.7% in
the Eastern region, 4.4% in the Southern region, or 4.3% in the Southwestern region.
3. There are institutional constraints for the SOEs in the Northeast. First, the profit
distribution of technological innovation in a SOE is not allocated according to the extent
of the contribution that persons make to the innovation. This leads to the firms’ low
motivation for innovation. Second, the operational mechanism of innovation is not
efficient. Technological innovation is not closely related to market demand, and many
new technological innovations are difficult to turn into practical productive forces.
4. The innovation environment is relatively poor in China. A lack of a national innovation
system and innovation Basic Law hinders the independent innovation in SOEs. The
Science and Technology Progress Law has been unable to meet these needs. Moreover, a
number of relevant laws and regulations have not been able to encourage technological
innovation, or cannot meet the demand for innovation.
These shortcomings of SOEs in the Northeast (especially the disadvantage in internal technology
development), outflow of skilled labor, and innovating new products cause the spillover effects
of technology development activity outside the Northeast to be cost-increasing and the spillover
effects of technology development activities within the Northeast to be weak cost-saving, the
smallest among the five regions.
Page 55
45
To accelerate economic development in the Northeast, China’s government formulated the
policy of “revitalizing of the Old Industrial Base in the Northeast” in 2003. The principle of this
policy is to deeper reform and expands open up. It focuses on the strategic adjustment of SOEs,
formulating a mechanism to promote the concentration of state-owned capital in national
economic lifelines of important and advantageous industries, and reforming the SOEs in
accordance with the requirements of modern enterprises. Aside from these reforms, another goal
of this policy is to balance the functions of the market mechanism against government
macroeconomic regulation. Industrial restructuring, the integration of factors of production,
technological innovation, and enterprise restructuring should mainly be determined by the
market, while the government needs to create a favorable environment for the development,
product innovation, and competition of firms in the marketplace.
2.6 Conclusion
Since the start of economic reform in the late 1970s, the Chinese government has laid out a series
of regional economic policies. In order to improve the macro-economic benefit and give priority
to efficiency, the coastal development strategy was first implemented in the early 1980s.
Through the implementation of these strategies, the Coastal region, especially the Pearl River
Delta and Yangtze River Delta, took the lead in development over the period 1980-2000. The
development of these areas led to the growth of the national economy and created a greater
demand for low-level industries in the Midwest. In 2004, the real GDP of the Eastern Region
accounted for 41% of total real GDP in China. (National Bureau of Statistics of China, 2004)
Page 56
46
This essay shows that there is a positive relationship between the technology spillover
effects within a region and the level of economic development in the region. Within-region
total spillover effect in the East reduced the average firm’s production cost by 179%, which
ranked 2rd among all five Chinese regions. In particular, upstream imported technology stocks
within the Eastern region made the largest contribution to the reduction in production costs for
local firms.
After 20 years of development, these preferential policies have greatly stimulated the growth of
Chinese economy. However, the gap between developed regions and undeveloped regions,
especially the Coastal region and the Western region, has become much wider than in the early
1980s. To relieve or eventually eliminate these disparities, China’s government implemented the
policies of the “Grand Western Development Program” in 2000 and “Revitalizing the Old
Industrial Base in the Northeast” in 2003.
After the implementation of “Grand Western Development Program”, the infrastructure,
ecological environment, and industrial reconstruction in the Western region made significant
progress. Our empirical results show that outside-region total spillover effect in the Southwest
turned from cost-increasing over the period 1995-1999 to cost-saving over the period 2000-2004,
thus the Coastal region has had a bigger positive impact on the Southwestern region since the
implementation of “Grand Western Development Program”. The Southwest’s benefit from the
“Grand Western Development Program” is further supported by another empirical finding—both
within-region and outside-region spillover effects on firms operating in the Southwest were cost-
saving over the period 1995-2004.
Page 57
47
Affected by the poor performance of SOEs in the Northeastern region, economic development in
the Northeast has lagged behind other Chinese regions despite its status as the most advanced
Chinese region at the beginning of economic reform. Our empirical findings--weak cost-saving
within-region technology spillover and extreme strong cost-increasing outside-region spillover
are consistent with this feature. To reverse this decline and rejuvenate the Northeast’s economy,
Chinese government introduced the policy of “Revitalizing of the Old Industrial Base in the
Northeast” in 2003. After the implementation of this policy, follow-up policies including
exemption from historical corporate debt and the establishment of bankruptcy for SOEs were put
into practice. As a result, the economic structure in the Northeast has made significant progress
over the years. The portion of service industry and non-public economy in the Northeast’s
economy has steadily improved since 2003.
Finally, as a contribution to the existing literature on the examination of the channels through
which spillovers take place (for instance, Javorcik (2004)), we find that the vertical channel is
the most important channel through which within-region and outside-region technological stocks
affect a local firm’s production cost. Therefore even with the factor of distance, which can
influence the spillover effect through transportation cost and technology similarity, etc.,
spillovers from upstream or downstream industries have bigger impacts on the individual firm
than spillovers generated from horizontal industries.
Regional development is affected by technology spillovers within each individual region and
spillovers across regions. In this paper, we empirically investigate within-region and outside-
region spillover effects among five Chinese regions, and explain how they relate to the disparity
in economy growth across regions. Furthermore, we analyze the factors causing the differences
in technology spillovers among the five Chinese regions. However, the natural relationship
Page 58
48
between the regional economy and regional technology spillover is not a unilateral causality.
Conversely, they interact with each other. A higher level of regional economy will have a greater
chance to benefit from cost-saving technology spillover within a region, while productivity-
increasing spillover will in turn enhance the regional economy. To break up this economy-
spillover cycle—good becomes better and bad gets worse— government intervention is
necessary and essential. Through effective macro-policies, such as the “Grand Western
Development Program” in China, the government can utilize the technology spillovers to guide
the development of regional economies toward a convergent path.
Page 59
49
Source: National Bureau of Statistics of China, 1992-2004
Source: China Ministry of Commerce, 1995-2006
0
0.02
0.04
0.06
0.08
0.1
0.12
0.14
North Northeast East South Southwest
An
nu
al g
row
th r
ate
(1
99
2-2
00
4)
Figure 2.1: Annula growth rate in each Chinese region (1992-2004)
0
20000
40000
60000
80000
100000
120000
1995 1996 1997 1998 1999 2000 2001 2002 2003 2004 2005 2006
Figure 2.2 : FDI in Easten China: 1995-2006 (In million dollars)
FDI in Eastern China FDI in China
Page 60
50
Table 2.1
Shares of LMEs and Balanced-LME sample in Aggregate industry, 20041
(% of total industry)
Measures All industry2
Of which: LME3
Of which: Balanced-LME
Sales (100 million yuan) 181,715 (100%) 126,284 (69.5%) 20,300 (11.2%)
Employment (10,000
persons)
6,099 (100%) 3,232 (53%) 573 (9.3%)
Assets (100 million yuan) 195,262 (100%) 140,245 (71.8%) 26,500 (13.6%)
Number of Enterprises 219,463 (100%) 23,267 (10.6%) 2,507 (1.14%)
1: Source: National Bureau of Statistics of China, 2005. 2: Industrial state-owned and non-state-owned
with annual sale over 5 million. 3. Industrial state-owned and non-state owned enterprises with annual
sale over 30 million Yuan, employment over 300 persons, and assets over 40 million Yuan.
Page 61
51
Table 2.2
Region summary: Basic statistics (Year 2006)
Regions Provinces GDP per capita
(Yuan per person)
Population
(Millions)
Earnings per
employed
person
Employment
(Million)
North Beijing, Tianjin, Hebei,
Shanxi, Inner Mongolia
21815 153.26 24671 18.18
Northeast Liaoning, Jilin, Heilongjiang 18226 108.17 17390 12.6
East Shanghai, Jiangsu, Zhejiang,
Anhui, Fujian, Jiangxi,
Shandong
23437 376.61 22471 36.69
South Henan, Hubei, Hunan,
Guangdong, Guangxi,
Hainan
16461 362.86 19591 29.61
Southwest Chongqing, Sichuan,
Guizhou, Yunnan
9736 192.17 17786 21.1
Source: China Statistical Yearbook, National Bureau of Statistics of China, 2007
Table 2.3
Region summary: Total investment in fixed assets in China by regions (Year 2006)
Regions Total
investments
(billion)
Domestic State-owned (relative to total investment, percent)
Funds from
Hong Kong,
Macao, and
Taiwan
Foreign
investments
North 1620.6 1497.4 489.9 (30.2%) 42.7 80.4
Northeast 1052 968.3 318.2 (30.2%) 31.8 51.8
East 4187 3648 984.7 (23.5%) 209.2 329.8
South 2302 2020 662.1 (28.8%) 164.7 117.3
Southwest 1023 980 390.4 (38.2%) 19.3 23.1
Source: China Statistical Yearbook, 2007
Page 62
52
Table 2.4
Industry distribution by regions
North Northeast East South Southwest
Mining 24.6*
20 32.4 19.2 19.6
Food and beverages 23.9 9.3 82.1 66 20.1
Textiles, apparel and
leather products
19.7 11 135.7 49.5 12.9
Timber, furniture and
paper products
21.1 8.6 62.2 28 8
Petroleum processing
and coking
66 3.6 15.1 5.9 0.7
Chemicals 35.7 14.9 147.2 63.5 37.3
Rubber and plastic
products
5.9 7.7 38.2 10.1 4
Non-mental products 19.5 15.4 63.6 47.2 12.4
Metal processing and
products
6.2 10.2 54 13.9 9.3
Machinery, equipment
and instruments
120.5 71.7 396.5 162.7 82.5
Electric power 71.2 27.6 83.7 49.1 9.3
other industry 15 17 35.2 29.8 12.9
Total industry 370 217 1146 545 229
* Figure is the average number of enterprises which belong to the Mining industry and are located in the
North during 1995-2004.
Page 63
53
Table 2.5 Technology development expenditure by regions, 1995-2004
Regions Internal technology
expenditure*
Imported technology
expenditure*
Ratio of technology development
expenditure to total output at
constant price
North 83.2% (11.6%) 16.8% (10.2%) 23.5%
Northeast 82.5% (12.8%) 17.5% (18.5%) 14%
East 83.4% (51.4%) 16.6% (48.7%) 17.4%
South 85.5% (20.1%) 14.5% (17%) 20.5%
Southwest 84.4% (4.18%) 15.6% (5.7%) 21.4%
*Figures not in parenthesis are shares of internal technology expenditure, imported technology expenditure, in total
technology development expenditure within each region, respectively (For each region, row sums to 100%); Figures in
parenthesis are ratios of internal technology expenditure, imported technology expenditure, of each region to total internal
technology expenditure, total imported technology expenditure, of five regions, respectively.
Table 2.6
Foreign Capital Shares by Region, 1995-2004 (In percent)*
Relative to Total Capital Share of Total foreign capital
North 8.35 19.2
Northeast 7.08 12.9
East 9.54 46.1
South 9.6 17.8
Southwest 5.77 4.0
China
8.69 100
*Figures are shares obtained from our balanced dataset
Page 64
54
Table 2.7: Horizontal and Vertical Industry Stocks
Horizontal Upstream Downstream
Internal
technology
development
expenditure
Within
region
Outside
region
Imported
technology
expenditure
Within
region
Outside
region
Foreign
capital
intensity
Within
region
Outside
region
Page 65
55
Table 2.8: Within-region and outside-region spillover effect
Spillover effects Definition
Horizontal spillover effect the impact on a firm from the R&D activities and FDI of firms
within the same industry
Vertical spillover effect this spillover happens between two different industries, in
most cases those of the supplier and customer
Within-region spillover effect of a
specific stock*
measures the total spillover effects of this stock in a horizontal
industry, upstream, and downstream industries within region
Outside-region spillover effect of a
specific stock*
measures the total spillover effects of this stock in a horizontal
industry, upstream, and downstream industries outside region
Within-region horizontal spillover effect total spillover effect of horizontal internal technology
expenditure within region, horizontal imported technology
expenditure within region, and horizontal FDI within region
Outside-region horizontal spillover
effect
total spillover effect of horizontal internal technology
expenditure outside region, horizontal imported technology
expenditure outside region, and horizontal FDI outside region
Within-region vertical spillover effect total spillover effect of vertical internal technology
expenditure within region, vertical imported technology
expenditure within region, and vertical FDI within region
Outside-region vertical spillover effect total spillover effect of vertical internal technology
expenditure outside region, vertical imported technology
expenditure outside region, and vertical FDI outside region
Within-region total spillover effect total spillover effect of horizontal and vertical internal
technology expenditures within region, horizontal and vertical
imported technology expenditures within region, and
horizontal and vertical FDI within region
Outside-region total spillover effect total spillover effect of horizontal and vertical internal
technology expenditures outside region, horizontal and vertical
imported technology expenditures outside region, and
horizontal and vertical FDI outside region
Page 66
56
Table 2.9: Timeline of the Eastern regional Preferential policies: 1979-94
Year of Approval Type of opened zone Location
1980 Special Economic Zone Fujian
1984 Coastal Open Cities Shandong, Jiangsu,
Shanghai, Zhejiang, Fujian
1984 Economic and Technological
Development Zone
Shandong, Jiangsu,
Zhejiang
1985 Economic and Technological
Development Zones
Fujian
1985 Coastal Open Economic Zone Yangtze River Delta, Fujian
1986 Economic and Technological
Development Zones
Shanghai
1988 Open Coastal Belt Shandong
1990 Pudong New Area Shanghai
1992 Bonded Areas in Major Coastal Port
Cities
Shandong, Jiangsu,
Zhejiang, Fujian
1992 Major Cities along the Yangtze
River
Jiangsu, Anhui, Jiangxi
1992 Economic and Technological
Development Zones
Fujian, Jiangsu, Shandong,
Zhejiang
1993 Economic and Technological
Development Zones
Anhui, Fujian, Zhejiang
Source: Démurger et al (2002), Table 3
Page 67
57
Table 2.10 Regression Results (North)
The P-values are in parenthesis
Neutral
effect
Factor-biased effect
Capital-biased Labor-biased Material-biased
Within firm
Internal technology
Stock
0.013217 (0.9)
0.03743 (0)
0.016559 (0.001)
-0.05399 (0)
Imported technology 0.128248 (0.063)
-0.00321 (0.581)
0.002475 (0.479)
0.000731 (0.895)
Foreign capital intensity 0.257906 (0.049)
0.019228 (0.145)
-0.01923 (0.145)
--
Internal technology stock*Imported
technology
0.12127 (0.051)
0.015137 (0.007)
0.007323 (0.03)
-0.02246 (0)
Foreign capital intensity*Internal
technology stock
0.280321 (0.141)
-0.04861 (0.005)
0.004226 (0.689)
0.044382 (0.006)
Foreign capital intensity*Imported
technology
-0.20172 (0.265)
0.003175 (0.847)
-0.0189 (0.066)
0.015723 (0.31)
Within
region
Internal technology
stock
3-digit
industry
0.713591 (0.137)
0.015766 (0.733)
0.071826 (0.01)
-0.08759 (0.049)
Upstream
industries
-2.02726 (0.653)
-0.97644 (0.027)
-0.17168 (0.52)
1.14812 (0.007)
Downstream
industries
-0.78783 (0.849)
0.806664 (0.035)
0.5739 (0.014)
-1.38056 (0)
Imported
technology
3-digit
industry
-0.03663 (0.65)
0.011106 (0.225)
0.002635 (0.636)
-0.01374 (0.118)
Upstream
industries
6.941034 (0.004)
0.599709 (0.037)
0.212699 (0.223)
-0.81241 (0.003)
Downstream
industries
-5.23088 (0.071)
-0.69658 (0.009)
-0.88891 (0)
1.585486 (0)
Foreign capital
intensity
3-digit
industry
0.399899 (0.187)
0.011143 (0.738)
0.030613 (0.135)
-0.04176 (0.19)
Upstream
industries
2.275866 (0.269)
-0.46929 (0.007)
-0.40264 (0)
0.871926 (0)
Downstream
industries
-0.87413 (0.588)
0.456547 (0.004)
0.268127 (0.005)
-0.72467 (0)
Outside
region
Internal technology
Stock
3-digit
industry
0.10957 (0.87)
0.044365 (0.459)
-0.10966 (0.003)
0.065299 (0.257)
Upstream
industries
-0.93897 (0.844)
0.299691 (0.449)
0.867899 (0)
-1.16759 (0.002)
Downstream
industries
0.201479 (0.968)
-0.63671 (0.061)
-0.65341 (0.002)
1.290126 (0)
Imported
technology
3-digit
industry
0.453913 (0.02)
0.050121 (0.035)
0.012836 (0.378)
-0.06296 (0.006)
Upstream
industries
-8.35949 (0.064)
-1.31001 (0)
-0.45792 (0.012)
1.767932 (0)
Downstream
industries
4.462969 (0.15)
1.164008 (0)
-0.04789 (0.769)
-1.11612 (0)
Foreign capital
intensity
3-digit
industry
-0.50057 (0.361)
-0.26811 (0)
-0.09444 (0.001)
0.362549 (0)
Upstream
industries
-4.20686 (0.234)
0.456019 (0.173)
0.754141 (0)
-1.21016 (0)
Downstream
industries
1.551876 (0.548)
0.010027 (0.966)
-0.85376 (0)
0.843736 (0)
Page 68
58
Table 2.11 Regression Results (Northeast)
The P-values are in parenthesis
Neutral
effect
Factor-biased effect
Capital-biased Labor-biased Material-biased
Within firm
Internal technology
Stock
0.118861 (0.579)
0.019554 (0.33)
-0.00097 (0.958)
-0.01858 (0.161)
Imported technology 0.203873 (0.156)
0.002021 (0.884)
-0.00916 (0.466)
0.007135 (0.455)
Foreign capital intensity -0.07708 (0.954)
0.045688 (0.455)
-0.04569 (0.455)
---
Internal technology stock*Imported
technology
-0.08534 (0.513)
0.01492 (0.269)
0.007065 (0.566)
-0.02199 (0.014)
Foreign capital intensity*Internal
technology stock
0.509663 (0.673)
-0.03497 (0.565)
-0.00318 (0.954)
0.038144 (0.372)
Foreign capital intensity*Imported
technology
-0.50386 (0.409)
-0.01309 (0.824)
0.014156 (0.793)
-0.00106 (0.978)
Within
region
Internal technology
stock
3-digit
industry
0.913926 (0.068)
-0.02411 (0.674)
-0.04554 (0.379)
0.069654 (0.083)
Upstream
industries
-15.5688 (0.003)
-0.09667 (0.855)
0.637785 (0.181)
-0.54111 (0.145)
Downstream
industries
8.702447 (0.086)
-0.19427 (0.633)
0.412926 (0.262)
-0.21866 (0.443)
Imported
technology
3-digit
industry
0.030898 (0.844)
0.004871 (0.808)
0.011999 (0.51)
-0.01687 (0.233)
Upstream
industries
-3.63462 (0.286)
-0.09498 (0.789)
-0.33348 (0.3)
0.428456 (0.087)
Downstream
industries
5.710824 (0.086)
0.55827 (0.085)
0.061023 (0.835)
-0.61929 (0.007)
Foreign capital
intensity
3-digit
industry
-0.22632 (0.762)
-0.01608 (0.83)
-0.01111 (0.871)
0.027194 (0.598)
Upstream
industries
2.161409 (0.697)
0.674272 (0.314)
0.303799 (0.617)
-0.97807 (0.038)
Downstream
industries
-17.4698 (0)
-0.26539 (0.636)
-0.06548 (0.897)
0.330868 (0.401)
Outside
region
Internal technology
Stock
3-digit
industry
-1.13993 (0.322)
0.076805 (0.404)
0.036131 (0.664)
-0.11294 (0.081)
Upstream
industries
45.87696 (0.001)
0.066079 (0.934)
-0.08497 (0.907)
0.018895 (0.973)
Downstream
industries
-17.7079 (0.175)
-0.98772 (0.299)
-1.09011 (0.205)
2.077828 (0.002)
Imported
technology
3-digit
industry
0.070205 (0.903)
-0.04446 (0.472)
-0.06796 (0.225)
0.112429 (0.01)
Upstream
industries
-8.34411 (0.218)
-0.07131 (0.883)
-0.00659 (0.988)
0.077903 (0.818)
Downstream
industries
-10.3499 (0.164)
0.250488 (0.715)
0.186329 (0.765)
-0.43682 (0.366)
Foreign capital
intensity
3-digit
industry
0.635752 (0.474)
-0.14372 (0.127)
-0.0183 (0.83)
0.162019 (0.015)
Upstream
industries
14.373 (0.023)
-0.41107 (0.516)
-0.1225 (0.831)
0.53357 (0.228)
Downstream
industries
13.10765 (0.02)
0.255849 (0.636)
0.178753 (0.714)
-0.4346 (0.253)
Page 69
59
Table 2.12 Regression Results (East)
The P-values are in parenthesis
Neutral
effect
Factor-biased effect
Capital-biased Labor-biased Material-biased
Within firm
Internal technology
Stock
0.064781 ( 0.078) )
0.010243 (0.007)
0.00345 (0.171)
-0.01369 (0)
Imported technology 0.045041 (0.086)
0.002004 (0.46)
-0.00322 (0.073)
0.001219 (0.063)
Foreign capital intensity 0.199889 (0.017)
0.024987 (0)
-0.02499 (0)
---
Internal technology stock*Imported
technology
6.34E-05 (0.998)
0.007913 (0.003)
-0.00071 (0.682)
-0.00721 (0.004)
Foreign capital intensity*Internal
technology stock
0.030212 (0.633)
0.004519 (0.549)
0.002713 (0.601)
-0.00723 (0.293)
Foreign capital intensity*Imported
technology
-0.04992 (0.415)
-0.01211 (0.08)
-0.0021 (0.67)
0.014214 (0.02)
Within
region
Internal technology
stock
3-digit
industry
-0.17461 (0.431)
-0.11079 (0)
0.023263 (0.172)
0.087525 (0)
Upstream
industries
-4.57979 (0.019)
-0.04996 (0.786)
0.624739 (0)
-0.57478 (0.001)
Downstream
industries
1.473551 (0.493)
0.268796 (0.169)
-0.82506 (0)
0.556269 (0.003)
Imported
technology
3-digit
industry
0.189263 (0.004)
0.039748 (0)
-0.00695 (0.236)
-0.0328 (0)
Upstream
industries
-7.09578 (0)
-0.91271 (0)
-0.71341 (0)
1.62612 (0)
Downstream
industries
3.727137 (0.007)
0.106778 (0.402)
0.090962 (0.28)
-0.19774 (0.1)
Foreign capital
intensity
3-digit
industry
-0.16258 (0.275)
-0.05154 (0.004)
-0.02972 (0.012)
0.081264 (0)
Upstream
industries
0.19078 (0.828)
0.258228 (0.014)
0.704109 (0)
-0.96234 (0)
Downstream
industries
-0.71206 (0.294)
-0.17433 (0.033)
-0.39171 (0)
0.566044 (0)
Outside
region
Internal technology
Stock
3-digit
industry
-0.21028 (0.193)
0.008779 (0.682)
-0.04009 (0.005)
0.031313 (0.123)
Upstream
industries
2.804211 (0.184)
0.251279 (0.305)
-0.89876 (0)
0.647476 (0.005)
Downstream
industries
-3.15123 (0.153)
-0.30468 (0.106)
1.067551 (0)
-0.76287 (0)
Imported
technology
3-digit
industry
0.18401 (0.004)
0.037664 (0)
0.00255 (0.622)
-0.04021 (0)
Upstream
industries
6.185841 (0)
-0.21796 (0.033)
0.704416 (0)
-0.48645 (0)
Downstream
industries
-1.81996 (0.121)
0.47583 (0)
-0.70598 (0)
0.230146 (0.036)
Foreign capital
intensity
3-digit
industry
-0.24873 (0.112)
-0.04335 (0.019)
-0.01928 (0.115)
0.062627 (0)
Upstream
industries
2.352762 (0.039)
-0.12106 (0.33)
-0.19539 (0.017)
0.31645 (0.007)
Downstream
industries
-0.83502 (0.355)
0.098818 (0.346)
0.026447 (0.703)
-0.12527 (0.206)
Page 70
60
Table 2.13 Regression Results (South)
The P-values are in parenthesis
Neutral
effect
Factor-biased effect
Capital-biased Labor-biased Material-biased
Within firm
Internal technology
Stock
0.081036 (0.066)
-0.00723 (0.181)
-0.00338 (0.231)
0.010614 (0.032)
Imported technology 0.009391 (0.783)
0.015394 (0)
0.001736 (0.396)
-0.01713 (0)
Foreign capital intensity 0.196636 (0.079)
0.047164 (0)
-0.04716 (0)
---
Internal technology stock*Imported
technology
0.011681 (0.685)
-0.01347 (0)
-0.00651 (0.001)
0.019983 (0)
Foreign capital intensity*Internal
technology stock
-0.1233 (0.098)
-0.01952 (0.07)
0.001573 (0.786)
0.017949 (0.066)
Foreign capital intensity*Imported
technology
0.115701 (0.187)
0.026943 (0.015)
-0.00359 (0.601)
-0.02335 (0.012)
Within
region
Internal technology
stock
3-digit
industry
0.418201 (0.017)
0.018782 (0.457)
-0.04146 (0.002)
0.02268 (0.33)
Upstream
industries
1.15196 (0.525)
0.571507 (0.006)
-0.66794 (0)
0.09643 (0.613)
Downstream
industries
-3.32324 (0.05)
-0.70505 (0)
0.4491 (0)
0.25595 (0.114)
Imported
technology
3-digit
industry
-0.00407 (0.945)
-0.00032 (0.972)
-0.01179 (0.012)
0.012106 (0.142)
Upstream
industries
0.616865 (0.527)
0.094605 (0.306)
0.309476 (0)
-0.40408 (0)
Downstream
industries
0.404358 (0.699)
0.012325 (0.913)
-0.32635 (0)
0.314028 (0.002)
Foreign capital
intensity
3-digit
industry
0.035592 (0.86)
-0.01246 (0.66)
0.002396 (0.872)
0.010062 (0.699)
Upstream
industries
2.364268 (0.092)
0.132167 (0.532)
0.501422 (0)
-0.63359 (0.001)
Downstream
industries
-1.2593 (0.292)
-0.10773 (0.547)
-0.50924 (0)
0.616975 (0)
Outside
region
Internal technology
Stock
3-digit
industry
-0.63816 (0.003)
-0.11565 (0)
-0.02452 (0.156)
0.140176 (0)
Upstream
industries
-2.27452 (0.461)
-0.8275 (0.011)
1.257825 (0)
-0.43033 (0.152)
Downstream
industries
4.062919 (0.012)
0.84562 (0.001)
-0.7126 (0)
-0.1330 (0.557)
Imported
technology
3-digit
industry
0.363971 (0.001)
0.069074 (0)
0.001508 (0.866)
-0.07058 (0)
Upstream
industries
-0.28245 (0.909)
-0.85886 (0)
-0.74214 (0)
1.600998 (0)
Downstream
industries
0.370256 (0.839)
0.684305 (0)
0.313451 (0.002)
-0.99776 (0)
Foreign capital
intensity
3-digit
industry
-0.08712 (0.693)
-0.06372 (0.028)
-0.03724 (0.014)
0.100957 (0)
Upstream
industries
-1.01435 (0.446)
0.132321 (0.507)
-0.04406 (0.674)
-0.08826 (0.631)
Downstream
industries
2.873457 (0.018)
-0.09653 (0.536)
0.102548 (0.21)
-0.00602 (0.967)
Page 71
61
Table 2.14 Regression Results (Southwest)
The P-values are in parenthesis
Neutral
effect
Factor-biased effect
Capital-biased Labor-biased Material-biased
Within firm
Internal technology
Stock
0.076529 (0.58)
0.020004 (0.062)
0.001718 (0.816)
-0.02172 (0.033)
Imported technology 0.052827 (0.519)
0.001031 (0.886)
0.010182 (0.041)
-0.01121 (0.101)
Foreign capital intensity -2.99363 (0.283)
0.162675 (0.294)
-0.16268 (0.294)
---
Internal technology stock*Imported
technology
-0.03993 (0.638)
0.00062 (0.934)
-0.0047 (0.365)
0.004081 (0.567)
Foreign capital intensity*Internal
technology stock
3.541972 (0.23)
-0.06914 (0.69)
0.103601 (0.543)
-0.03446 (0.399)
Foreign capital intensity*Imported
technology
0.832423 (0.135)
-0.07473 (0.041)
-0.03957 (0.118)
0.114304 (0.001)
Within
region
Internal technology
stock
3-digit
industry
0.134817 (0.455)
0.031246 (0.163)
0.003069 (0.842)
-0.03432 (0.106)
Upstream
industries
-19.7464 (0.009)
-0.86935 (0.086)
0.8358 (0.017)
0.033547 (0.944)
Downstream
industries
14.41772 (0.002)
0.298289 (0.385)
-0.91699 (0)
0.618707 (0.058)
Imported technology 3-digit
industry
0.052466 (0.469)
-0.00948 (0.306)
-0.00329 (0.609)
0.012773 (0.148)
Upstream
industries
5.238434 (0.101)
0.083476 (0.646)
-0.53374 (0)
0.450269 (0.009)
Downstream
industries
-1.75821 (0.478)
0.34604 (0.023)
-0.3163 (0.003)
-0.0297 (0.838)
Foreign capital
intensity
3-digit
industry
-0.48788 (0.315)
-0.10454 (0.056)
-0.00214 (0.955)
0.106675 (0.041)
Upstream
industries
4.046759 (0.48)
0.164781 (0.776)
1.779677 (0)
-1.94446 (0)
Downstream
industries
1.791437 (0.691)
0.240999 (0.633)
-1.79821 (0)
1.557208 (0.001)
Outside
region
Internal technology
Stock
3-digit
industry
0.787316 (0.104)
0.019952 (0.67)
-0.03945 (0.225)
0.0195 (0.662)
Upstream
industries
-7.14141 (0.236)
-1.25965 (0)
-0.77696 (0)
2.036609 (0)
Downstream
industries
-4.59396 (0.496)
0.632909 (0.027)
0.991511 (0)
-1.62442 (0)
Imported technology 3-digit
industry
-0.10173 (0.646)
0.042569 (0.097)
-0.03557 (0.045)
-0.007 (0.774)
Upstream
industries
6.38176 (0.038)
-0.45201 (0.023)
0.494299 (0)
-0.04229 (0.823)
Downstream
industries
0.309266 (0.923)
0.482843 (0.058)
-0.36948 (0.036)
-0.11337 (0.639)
Foreign capital
intensity
3-digit
industry
0.469692 (0.352)
-0.13223 (0.001)
-0.07411 (0.007)
0.206336 (0)
Upstream
industries
2.635337 (0.26)
0.151574 (0.578)
0.438715 (0.02)
-0.59029 (0.023)
Downstream
industries
2.518671 (0.286)
0.219282 (0.341)
-0.17819 (0.265)
-0.0411 (0.851)
Page 72
62
Table 2.15 Contribution to the Change in Total Cost, 1995-2004 (North)
Total effect Neutral
effect
Factor-biased effect
Total Capital-
biased
Labor-
biased
Material-
biased
Within
region
Internal
technology
Stock
3-digit 0.1531** 0.0804 0.0726** 0.0012 0.0886*** -0.0171**
upstream -0.3722* -0.2171 -0.1551** -0.1092** -0.2409 0.195***
downstream 0.6926*** -0.0629 0.7555*** 0.1225** 0.7775** -0.1445***
total 0.4734*** -0.1995 0.67297***
Imported
technology
3-digit -0.0243 -0.0138 -0.0105 -0.0031 0.0043 -0.0117
upstream 0.7469*** 0.4680*** 0.2789** 0.0824** 0.2611 -0.0646***
downstream -1.3565*** -0.1919* -1.1647*** -0.1257*** -1.0478*** 0.0089***
total -0.6339*** 0.2623** -0.8963***
Foreign capital
intensity
3-digit 0.0146 0.0121 0.0025 9.1220E-05 0.0051 -0.0027
upstream -0.1156*** -0.0488 -0.0668*** -0.0183*** -0.0004*** -0.0480***
downstream 0.0585*** 0.0068 0.0517*** 0.0162*** 0.0184*** 0.0171***
total -0.0424*** -0.0298 -0.0126***
Total -0.2029*** 0.0330*** -0.2359***
Outside
region
Internal
technology
Stock
3-digit -0.1148** 0.0128 -0.1276*** 0.0038 -0.1445*** 0.0131
upstream 1.0309*** -0.0950 1.1260*** 0.0418 1.2616*** -0.1775***
downstream -0.8355*** 0.0207 -0.8562*** -0.0894* -0.9666*** 0.1997***
total 0.0806*** -0.0615 0.1421***
Imported
technology
3-digit 0.07950** 0.0954** -0.0159** -0.0065** 0.0178 -0.0272***
upstream -1.1272*** -0.2840* -0.8433*** -0.2689*** -0.5655** -0.0089***
downstream 0.3413*** 0.1300 0.2113*** 0.2510*** -0.0600 0.0204***
total -0.7064*** -0.0586* -0.6478***
Foreign capital
intensity
3-digit -0.0025*** -0.0124 0.0099*** 0.0034*** -0.0128*** 0.0193***
Upstream -0.0514*** -0.0942 0.0429*** -0.0042 0.1043*** -0.0572***
downstream -0.0506*** 0.0475 -0.0981*** -0.0001 -0.1534*** 0.0554***
Total -0.1045*** -0.0591 -0.0454***
Total -0.7303*** -0.1792* -0.5511***
Notes: * significant at the 10% level; ** significant at the 5% level; ***significant at 1% level
Page 73
63
Table 2.16 Contribution to the Change in Total Cost, 1995-2004 (Northeast)
Total effect Neutral
effect
Facotr-biased effect
Total Capital-
biased
Labor-
biased
Material-
biased
Within
Region
Internal
technology
Stock
3-digit 0.0983** 0.1827* -0.0844 -0.002 -0.1048 0.0224*
upstream -1.5857*** -3.1418 1.5560*** -0.0255 1.7397 -0.1582
Downstream 2.7308 1.7196* 1.0112 -0.0545 1.1265 -0.0608
Total 1.2434*** -1.2394*** 2.4828*
Imported
technology
3-digit 0.0271 -0.0265 0.0007 -0.0053 0.039 -0.033
Upstream -1.1986 -0.3854 -0.8132 -0.0319 -0.8106 0.0293*
Downstream 0.8188** 0.4506 0.3682** 0.2271* 0.1427 -0.0016***
Total -0.3526 0.0917 -0.4443
Foreign
capital
intensity
3-digit -0.0099 -0.0108 0.0009 0.0012 -0.003 0.0027
Upstream 0.0358 0.1102 -0.0743 -0.0324 0.0691 -0.111**
Downstream -0.9588*** -0.9902*** 0.0313 0.01 -0.0197 0.0411
Total -0.9328*** -0.8908*** -0.0421
Total -0.0420*** -2.0385*** 1.9964**
Outside
Region
Internal
technology
stock
3-digit -0.3130 -0.3418 0.0288 0.0002 0.0916 -0.063*
Upstream 11.8597*** 12.0894*** -0.2297 0.0101 -0.2481 0.0083
Downstream -6.8653*** -4.2952 -2.5701*** -0.2201 -3.1505 0.8005***
Total 4.6814*** 7.4524*** -2.7710***
Imported
technology
3-digit -0.0653* 0.0216 -0.0869** 0.009 -0.1623 0.0664***
Upstream -0.8993 -0.8643 -0.0349 -0.0238 -0.0161 0.0049
downstream -0.2024 -0.7639 0.5615 0.1122 0.4447 0.0046
total -1.1669 -1.6066 0.4397
Foreign
capital
intensity
3-digit 0.0475** 0.0327 0.0148** 0.0028 -0.0053 0.0173**
Upstream 0.2754** 0.2896 -0.0142** -0.0055 -0.027 0.0182
downstream 0.7887* 0.7873** 0.0014 -0.0074 0.0642 -0.0555
Total 1.1115*** 1.1096*** 0.0020
Total 4.6260*** 6.9554*** -2.3293***
Notes: * significant at the 10% level; ** significant at the 5% level; ***significant at 1% level
Page 74
64
Table 2.17 Contribution to the Change in Total Cost, 1995-2004 (East)
Total effect Neutral
effect
Factor-biased effect
Total Capital-
biased
Labor-
biased
Material-
biased
Within
Region
Internal
technology
Stock
3-digit 0.0199***
-0.0229
0.0427***
-0.014***
0.035
0.0217***
upstream 0.3543***
-0.5703**
0.9246***
-0.0087
1.0614***
-0.1281***
downstream -1.0575***
0.1807
-1.2383*** 0.048 -1.4077*** 0.1214***
total -0.6834***
-0.4124**
-0.2709***
Imported
technology
3-digit 0.0146***
0.0419***
-0.0273***
-0.0008***
-0.011
-0.0155****
upstream -1.4776***
-0.2730***
-1.2046***
-0.2113***
-1.0217***
0.0284***
downstream 0.3527*
0.2067***
0.1460
0.0234
0.1342
-0.0116
total -1.1103***
-0.0244
-1.0859***
Foreign
capital
intensity
3-digit -0.0048***
-0.0044
-0.0004***
0.0003***
-0.0055**
0.0048***
upstream 0.0771***
0.0084
0.0687***
-0.0024**
0.1665***
-0.0954***
downstream -0.0760***
-0.0396
-0.0365***
0.0027**
-0.1107***
0.0715***
total -0.0037***
-0.0356***
0.0319***
Total -1.7973***
-0.4724***
-1.3249***
Outside
Region
Internal
technology
stock
3-digit -0.0647**
-0.0185
-0.0462**
0.0012
-0.0521***
0.0047
upstream -0.9547***
0.2707
-1.2254***
0.0446
-1.3735***
0.1035***
downstream 1.1429***
-0.3241
1.4670***
-0.0538
1.6546***
-0.1338***
total 0.1234***
-0.0719***
0.1954***
Imported
technology
3-digit 0.0197***
0.0266***
-0.0070***
0.0017***
0.0033
-0.012***
upstream 0.9175***
0.0668***
0.8507***
-0.0508**
0.8805***
0.021***
downstream -0.7981***
-0.0162
-0.7819***
0.1131***
-0.884***
-0.0111**
total 0.1390***
0.0773
0.0618***
Foreign
capital
intensity
3-digit -0.0056***
-0.0040
-0.0016***
-0.0007**
-0.0029
0.002***
Upstream -0.0482***
-0.0252**
-0.0230***
-0.0037
-0.0095**
-0.0099***
downstream -0.0064
-0.0095
0.0030
0.002
0.0037
-0.0026
Total -0.0602***
-0.0387*
-0.0215***
Total 0.2022***
-0.0333***
0.2356***
Notes: * significant at the 10% level; ** significant at the 5% level; ***significant at 1% level
Page 75
65
Table 2.18 Contribution to the Change in Total Cost, 1995-2004 (South)
Total
effect
Neutral
effect
Factor-biased effect
Total Capital-
biased
Labor-
biased
Material-
biased
Within
Region
Internal
technology
Stock
3-digit 0.0061***
0.0741**
-0.0680***
-0.0033
-0.0725***
0.0077
upstream -1.1440***
0.1490
-1.2930***
-0.0777***
-1.2356***
0.0204
downstream 0.5345***
-0.5105*
1.0450***
0.112***
0.864***
0.069
total -0.6034***
-0.2873**
-0.3161***
Imported
technology
3-digit -0.0148*
-0.0016
-0.0131**
0.0001
-0.0242**
0.011
upstream 0.4912***
0.0196
0.4716***
-0.0032
0.4683***
0.0065***
downstream -0.4953***
0.0092
-0.5045***
-0.0001
-0.4922***
-0.0122***
total -0.01885***
0.0272
-0.0460***
Foreign
capital
intensity
3-digit -0.0012
-0.0007
-0.0006 -0.0002 0.0002 -0.0006
upstream 0.0112***
-0.0646*
0.0758***
0.0025
0.0254***
0.0479***
downstream -0.0843***
0.0011
-0.0854***
-0.0002
-0.0772***
-0.0081***
total -0.0744***
-0.0642
-0.0102***
Total -0.6966***
-0.3243*
-0.3723***
Outside
Region
Internal
technology
Stock
3-digit -0.0924***
-0.1202***
0.0278***
0.0192***
-0.0432
0.0517***
upstream 2.0797***
-0.3686
2.4483***
0.1342**
2.4395***
-0.1254
downstream -0.9161***
0.6557
-1.5719***
-0.1389***
-1.394***
-0.0385
total 1.0711***
0.1668**
0.9043***
Imported
technology
3-digit 0.0430*** 0.1046***
-0.0617***
-0.0207***
0.0028
-0.0437***
upstream -1.1144***
-0.0131
-1.1012***
0.0497***
-1.1745***
0.0236***
downstream 0.4729*** 0.0162
0.4567***
-0.0364***
0.5005***
-0.0073***
total -0.5984***
0.1076***
-0.7061***
Foreign
capital
intensity
3-digit -0.0004*** -0.0026
0.0022***
0.0027**
-0.0069**
0.0064***
Upstream -0.0387
-0.0241
-0.0146
-0.0026
-0.0075
-0.0045
downstream 0.1636**
0.1338
0.0298**
0.0043
0.0262
-0.0006
Total 0.1246***
0.1071*
0.0175***
Total 0.5973***
0.3816***
0.2157***
Notes: * significant at the 10% level; ** significant at the 5% level; ***significant at 1% level
Page 76
66
Table 2.19 Contribution to the Change in Total Cost, 1995-2004 (Southwest)
Total
effect
Neutral
effect
Factor-biased effect
Total Capital-
biased
Labor-
biased
Material-
biased
Within
Region
Internal
technology
Stock
3-digit 0.0277
0.0430
-0.0153
0.0004
0.0075
-0.0232
upstream -1.3177***
-2.8978***
1.5801**
-0.4568*
2.0287**
0.0081
downstream 0.5570***
2.5122***
-1.9552***
0.1551
-2.302***
0.1917*
total -0.7330***
-0.3426**
-0.3904***
Imported
technology
3-digit 0.0364
0.0265
0.0099
0.0035
-0.0082
0.0147
upstream -1.1434***
-0.0887
-1.055***
0.0509
-1.0385***
-0.0672***
downstream -0.3221***
0.0659
-0.3881***
0.2277**
-0.6218***
0.0061
total -1.4292***
0.0038
-1.4329***
Foreign
capital
intensity
3-digit -0.0031
-0.0040
0.0009
-0.0005
-0.0002*
0.0016**
upstream 0.1048*** 0.0082
0.0966***
0.003
0.0984***
-0.0048***
downstream -0.1264***
0.0278
-0.1542***
0.0035
-0.2103***
0.0527***
total -0.0247***
0.0320
-0.0567***
Total -2.1869***
-0.3069**
-1.8800***
Outside
Region
Internal
technology
Stock
3-digit 0.0412
0.1135
-0.0723
0.0101
-0.0872
0.0048
upstream -3.3142***
-1.2630
-2.0512***
-0.6555***
-2.0239***
0.6283***
downstream 1.5658***
-0.8480
2.4139***
0.327**
2.6174***
-0.5306***
total -1.7071***
-1.9975**
0.2904***
Imported
technology
3-digit -0.0862*
-0.0191
-0.0670*
0.0106*
-0.0752**
-0.0025
upstream 1.0410***
0.2495**
0.7915***
-0.2862**
1.077***
0.0007
downstream -0.5095
0.0191*
-0.5287
0.2982*
-0.8226**
-0.0042
total 0.4453*** 0.2495
0.1958***
Foreign
capital
intensity
3-digit 0.0132***
0.0155
-0.0023***
0.0017***
-0.0176***
0.0136***
Upstream 0.1199**
0.0347
0.0853**
0.0034
0.0937**
-0.0118**
downstream 0.0462
0.1080
-0.0618
0.0007
-0.0588
-0.0037
Total 0.1793***
0.1582**
0.0211***
Total -1.0825***
-1.5899*
0.5073***
Notes: * significant at the 10% level; ** significant at the 5% level; ***significant at 1% level
Page 77
67
Table 2.20 Contribution to the Change in Total Cost (Southwest, 1995-1999)
Total
effect
Neutral
effect
Factor-biased effect
Total Capital-
biased
Labor-
biased
Material-
biased
Within
Region
Internal
technology
Stock
3-digit 0.2913 0.8128* -0.5214* -0.3739** -0.0095 -0.13806**
upstream -2.6685 -11.212* 8.5435 4.8637 3.6849 -0.0052
downstream 2.187*** 8.8156** -6.6286*** 0.5508 -6.8721*** -0.3073***
total -0.1901*** -1.5835** 1.3933***
Imported
technology
3-digit 0.10708 0.1298 -0.0227 -6.18E-05 -0.0932 0.0706
upstream -4.2912** -0.5839 -3.7073** -1.5944 -1.8682** -0.2446
downstream -2.4161*** 1.631* -4.0471** -1.7481 -1.9879*** -0.311
total -6.6003*** 1.1769 -7.7772***
Foreign
capital
intensity
3-digit 0.021 0.0176 0.0033 0.0186 -0.0015 -0.0137
upstream -0.0644 -0.3575 0.2931* 0.0895 0.2681** -0.0645
downstream 0.4037** 1.1759* -0.7721** -0.3188 -0.5168*** 0.0635
total 0.3603** 0.8359 -0.4756***
Total -6.4301*** 0.4293*** -6.8595***
Outside
Region
Internal
technology
Stock
3-digit -0.6242 -0.3318 -0.2923 0.0295 -0.3262* 0.0043
upstream -3.3459*** -9.1024* 5.7564*** 8.1477*** -1.9048 -0.4864***
downstream 10.4156*** 10.2166 0.1989*** -7.3423*** 6.881*** 0.6602***
total 6.4454*** 0.7824 5.663***
Imported
technology
3-digit -0.4387 0.0295 -0.4682 -0.3174* -0.0952 -0.0556
upstream 5.0422** -0.1238 5.166** 4.399*** 1.2155 -0.4484*
downstream -2.9407*** 0.828* -3.7687** -2.5419 -1.3277 0.1009
total 1.6627 0.7336 0.929*
Foreign
capital
intensity
3-digit 0.0169 0.0011 0.0157 0.0743* -0.0398** -0.0188***
Upstream -0.3133* -0.532** 0.2187 0.004 0.1337 0.0809
downstream -0.1199 0.0781 -0.1981 -0.0721 -0.1138 -0.0121
Total -0.4163*** -0.4526*** 0.0363**
Total 7.6918*** 1.0634*** 6.6284***
Notes: * significant at the 10% level; ** significant at the 5% level; ***significant at 1% level
Page 78
68
Table 2.21 Contribution to the Change in Total Cost (Southwest, 2000-2004)
Total effect Neutral
effect
Factor-biased effect
Total Capital-
biased
Labor-
biased
Material-
biased
Within
Region
Internal
technology
Stock
3-digit 0.0963 0.0082** 0.0881 0.0913 0.0045 -0.0077
upstream 0.7248 0.5203 0.2044 -0.0361 0.2865 -0.0459
downstream 2.2231*** -0.1112 2.3344*** 2.2823*** 0.8071 -0.755***
total 3.0443*** 0.4173* 2.627***
Imported
technology
3-digit -0.0099* 0.0107* -0.0206** -0.0362** 0.0172** -0.0017
upstream -1.2193*** 0.0058 -1.2252*** -0.5658 -0.7221*** 0.0626***
downstream 0.3315 -0.0356 0.3672 0.9255*** -0.5452** -0.013
total -0.8977*** -0.0191** -0.8786***
Foreign
capital
intensity
3-digit -0.0107* -0.0142*** 0.0035** -0.0058*** 0.0023 0.0069**
upstream 0.0188* -0.0035 0.0224** -0.0163 -0.0124*** 0.0512
downstream -0.1994*** -0.0004 -0.1989*** -0.0946** -0.1224*** 0.0182***
total -0.1913*** -0.0183** -0.1729***
Total 1.9552*** 0.3798*** 1.5753***
Outside
Region
Internal
technology
Stock
3-digit -0.0954 -0.0291 -0.0662 -0.0446 -0.0306 0.009
upstream -7.009*** -1.0423** -5.9667*** -3.9381*** -3.6314*** 1.6028***
downstream 1.8672*** -0.1537 2.021*** 0.6983 1.8642*** -0.5415***
total -5.2372*** -1.2252*** -4.0119***
Imported
technology
3-digit 0.0787 -0.0114 0.0901 0.15793* -0.0673 -0.0004
upstream 2.8166*** 0.0555 2.761*** 1.1652** 1.895*** -0.2991***
downstream -2.2564*** -0.0301 -2.2263*** -1.2035 -1.3248** 0.302***
total 0.6389*** 0.0139 0.6249***
Foreign
capital
intensity
3-digit -0.0158*** -0.0004 -0.0154*** -0.013** -0.01** 0.0076***
Upstream 0.2342*** 0.0388** 0.1954*** 0.1175*** 0.1277*** -0.0499***
downstream -0.1994 -0.0004 -0.1989 -0.0946 -0.1224 0.0182
Total 0.2034*** 0.0374** 0.1659***
Total -4.3948*** -1.1737*** -3.2211***
Notes: * significant at the 10% level; ** significant at the 5% level; ***significant at 1% level
Page 79
69
Table 2.22: New Product innovation expenditure of an average firm in the Northeast
Year New product innovation expenditure (in Chinese Yuan)
1995 756
1996 753
1997 674
1998 680
1999 974
2000 1312
2001 1403
2002 2089
2003 3559
Table 2.23: Ratios of new product innovation expenditure over total cost
North Northeast East South Southwest
1995 1.56% 1.65% 1.17% 1.2% 2.69%
1996 3.53% 1.9% 1.68% 1.2% 1.67%
1997 1.5% 1.17% 1.76% 1.63% 1.69%
1998 1.6% 1.6% 1.4% 1.5% 1.9%
1999 1.4% 3.2% 1.4% 1.6% 1.8%
2000 1.4% 1.5% 1.5% 1.2% 1.8%
2001 1.1% 1% 1.2% 1% 1.4%
2002 1.8% 1.3% 1.2% 1% 1.4%
2003 0.68% 1.1% 1% 0.6% 1%
Page 80
70
Table 2.24: Total investment in the Northeastern Region, by regions
Year Total investment in the Northeastern Region (in 100 million
Chinese Yuan)
1995 2244
1997 2596
1998 2938
1999 2918
2000 3141
2001 3522
2003 4637
2004 6059
Source: National Bureau of Statistics of China, 1995-2004
Table 2.25: Ratios of technology development personnel to total employees Year Number of technology development personnel/total
employees
1995 3%
1996 3.3%
1997 4.3%
1998 2.3%
1999 4.5%
2000 3.3%
2001 3.2%
2002 2.9%
2003 3%
2004 3%
Page 81
71
Here we explain how we start from the regression results reported in Table 9-13 to obtain individual contribution
to the change in total cost in Table 14-20,we choose the capital-biased spillover effect of horizontal internal
technology stock within region as a representative:
For example, in Table 20, thefigurewith yellow mark is obtained through employing the following formula:
β
( )
where β
is the coefficient of variable in our regression results,
( ) is the change of mean of variable over the period 2000-
2004, is the change of log of total cost during 2000-2004
Page 82
72
References
Acemoglu, Daron, 2002, “Direct Technical Change”. Review of Economic Studies, 69, 781-809.
Adams, James, 2002, “Comparative Localization of Academic and Industrial Spillovers.”Journal of Economic
Geography, 2(3): 253-278
Adams, James, and Jaffe B. Adam, 1996, “Bounding the Effects of R&D: an Investigation using Matched Firm and
Establishment Data.” RAND Journal of Economics, 27: 700-721
Alfaro, Laura, Areendam Chanda, Sebnem Kalemli-Ozcan, and Selin Sayek , 2010, “Does Foreign Direct
Investment Promote Growth? Exploring the Role of Financial Markets on Linkages.” Journal of
Development Economics, 91 (2): 242-256
Audretsch, David B. and Maryann P. Feldman,, 2004, “Knowledge Spillovers and the Geography of Innovation,”
Handbook of Regional and Urban Economics, 2713-2739
Bin, Guo, 2008, "Technology acquisition channels and industry performance: An industry-level analysis of Chinese
large- and medium-size manufacturing enterprises", Research Policy, 37(2)
Blalock, Garrick, and Paul, J. Gertler, 2003, “Firms Capabilities and Technology Adoption: Evidence from Foreign
Direct Investment in Indonesia.” Unpublished paper, Department of Applied Economics and Management,
Cornell University.
Bottazi, Laura, and Giovanni Peri, 1999, “Innovation, Demand and Knowledge Spillover: Theory and Evidence
from European Regions”. Discussion Paper No. 2279 London: CERP
Bottazzi, Laura, and Giovanni Peri, 2003. "Innovation and spillovers in regions: Evidence from European Patent
Data", European economic review, 47(4)
Brun, Jean-François, Jean-Louis Combes, and Mary-Françoise Renard, 2002, “Are there spillover effects between
Coastal and Noncoastal Regions in China?” China Economic Review, 13(2-3): 161-169
Chen, Donghua, Xinyuan Chen, and Hualin Wan, 2005, “regulation and Non-pecuniary Compensation in Chinese
SOEs”, Economic Research Journal, Issue 2
Coe, David T and Elhanan Helpman, 1995, "International R&D spillovers", 1995, European economic review, 39(5)
Démurger, Sylvie, 2001. “Infrastructure development and economic growth: an explanation for regional disparities
in China?” Journal of Comparative Economics, 19, 95-117.
Page 83
73
Démurger, Sylvie, Wing Thye Woo, Shuming Bao, Gene Chang, and Andrew Mellinger, 2002, “Geography,
Economics Policy, and Regional Development in China,” Asian Economic Papers, 1(1): 146-197
Duan, Junshang and Yanhui Fan, 2003, “Wage and technology spillover of Foreign Direct Investment: Theory and
Empirical Analysis”, Working Paper, Xiangtan University, China.
Elkins, Teri and Robert T. Keller, 2003, “Leadership in Research and Development Organizations: A literature
Review and Conceptual Framework”, The Leadership Quarterly, 14: 587-606.
Ernst, Dieter, Thomas George Ganiatsos, and Lynn Krieger Mytelka, 2005, Technological Capabilities and Export
Success in Aisa, Tayor & Francis e-Library
Fisher-Vanden, Karen, Gary H. Jefferson, Jingkui Ma, and Jianyi Xu, 2006, “Technology development and energy
productivity in China”, Energy Economics, 28(5-6): 690-705.
Fisher-Vanden, Karen and Gary H. Jefferson, 2008, “Technology Diversity and Development: evidence from
China’s Industrial Enterprises.” Journal of Comparative Economics, 36(4): 658-672.
Fisher-Vanden, Karen, Gary H. Jefferson, Yaodong Liu, and Jinchang Qian, 2009, “Open Economy Impacts on
Energy Consumption: Technology Transfer & FDI Spillovers in China’s Industrial Economy,” manuscript,
Pennsylvania State University
Gӧrg, Holger and David Greenaway, 2004, “Much ado about nothing? Do domestic firms really benefit from
foreign direct investment?” World Bank Research Observer, 19: 171-197.
Goto, Akira and Kazuyuki Suzuki, 1989, “R&D capital, rate of return on R&D investment and spillovers of R&D in
Japanese manufacturing industries”, The Review of Economics and Statistics. 71(4): 555-564
Griliches, Zvi, 1979, “Issue in Assessing the Contribution of Research and Development to the Productivity
Growth”, The Bell Journal of Economics, 10(1): 92-116
Halpern, László and Balázs Muraközy, 2007, “Does distance matter in spillover?” Economics of Transition, 15(4):
781-805
Hatzuis, Jan, 2000, “Foreign Direct Investment and Demand Elasticity”. European Economic Review, 44(1): 117-
143
Page 84
74
Hicks, J. R., 1932, The Theory of Wage, Macmillan, London
Hu, Albert, G. and Gary H. Jefferson, 2002, “FDI Impact and Spillover: Evidence from China’s Electronic and
Textile Industries.” The World Economy, 25(8): 1063-1076
Hu, Albert, G.Z., Gary, H. Jefferson, and Jinchang Qian, 2005, “R&D and technology transfer: Firm-level Evidence
from Chinese Industry”, The Review of Economics and Statistics, 87(4), 780-786.
Hu, Zhuliu, 2004, “Three Issues on FDI in China”. International Economic Review, Volume 3-4.
Huang, Sujian and Quan Ge, 2012, “Strategy Revival of State-owned Enterprises in Northeast Old Industrial Base:
from Passive Reform to Active Reform” Economic Management, 20: 4-10.
Hubert, Florence and Nigel Pain, 2001, “Inward investment and technical progress in the United Kingdom
manufacturing sector.” Scottish Journal of Political Economy, 48(2): 134-147
Jacob, Jojo and Adam Szirmai, 2007, “Review of Development Economics”, 11(3), 550 – 565
Jacobs, Jane, 1969, The Economy of Cities, Random House, New-York.
Javorcik, B.S., 2004, “Does Foreign Direct Investment Increase the Productivity of Domestic Firms? In Search of
Spillovers through Backward Linkages.” American Economic Review, 94(3): 605-627.
Kirzner, I. M., 1973, Competition and Entrepreneurship. Chicago: University of Chicago Press.
Kokko, Ari, 1994, “technology, market characteristics, and spillover,” Journal of Development Economics, 43(2):
279-293
Krugman, paul, “The Myth of Asian Miracle”. Foreign Affairs, 73(6): 62-78
Kuo, Chun-Chien and Chih-Hai Yang, 2008, “Knowledge Capital and Spillover on Regional Economic Growth:
Evidence from China”, China Economic Review, 19(4): 594-604
Lehto, Eero, 2007. "Regional Impact of Research and Development on Productivity", Regional studies, 41(5)
Liu, Zhiqiang, 2002, “Foreign Direct Investment and Technology Spillovers: Evidence from China.” Journal of
Comparative Economics, 30(3), 579-602.
Page 85
75
Lin, Justin Yifu and Zhibin Li, 2005, “China’s State-owned Enterprises and Reform of Financial System”, China
Economic Quarterly, Issue 4
Long, Guoqiang, 2006, “Opportunities and Countermeasures for Attracting Research & Development Institutions of
Foreign Multinational Corporations”. Journal of Chongqing Institute of Technology, 20(1).
Mankiw, Gregory, Principles of Economics, South-Western College Pub, 5 Edition
NBS, MOST (National Bureau of Statistics,Ministry of Science and Technology), 2004, China Statistical Yearbook
on Science and Technology, Beijing, China Statistical Press.
NBS (National Bureau of Statistics of China), China Statistical Yearbook(1996-2007), Beijing: China Statistics
Press.
Qi, Jianhong, Yingmei Zheng, James Laurenceson, and Hong Li, 2009, “Productivity Spillover from FDI in China:
Regional differences and Threshold effects.” China & World Economy. 17(4): 18-35
Rodríguez-Clare, Andrés, 1996, “Multination, Linkage and Development”. The American Economic Review, 86(4):
852-873
Romer, Robert, 1990, “Endogenous Technological Change”. The Journal of Political Economics, 98(5): S71-S102
Saxena, Shishir, 2011, "Technology and spillovers: evidence from Indian manufacturing microdata", Applied
Economics, 43(10)
Schumpeter, Joseph A., 1934, The Theory of Economic Development. Cambridge, Mass., Harvard University Press.
Shen, Kunrong, 1995, “Foreign Direct Investment and China Economic Growth”. Management World, 5.
Wieser, Robert, 2005, “Research and Development Productivity and Spillovers: Empirical Evidence from Firm
Level”. Journal of Economic Survey, 19(6).
Xavier X. Sala-i-Martin, 1996, “Regional cohesion: evidence and theories of regional growth and convergence,
European Economic Review,” 40 (6): 1325-1352,
Zahra, Shaker and Gerard George, 2002, “Absorptive Capacity: A Review, Reconceptualization, and Extension”.
Academy of Management Review, 27(2):185-203
Page 86
76
Chapter 3
Factor bias spillover effect of FDI in China
3.1. Introduction
Foreign direct investment in China has experienced impressive growth over the past thirty years.
We can classify its growth into three stages:
1. The “open and adjustment” stage, from 1979–1986. Special Economic Zones along the
southern coastline were established and the regulation of joint ventures between foreign
investors and local entrepreneurs were introduced. Rates of FDI during this period were
low: as demonstrated in Figure 3.1, the average FDI from 1981–1985 is only 6.5 billion
Yuan annually.
2. The “constant growth phase” stage, from 1986–1991. In 1986, Deng, Xiaoping
introduced the “Open Door” policy to encourage foreign investment. Lower tax rates and
simpler licensing procedures were also introduced. FDI rates from 1986–1991 averaged
24.8 billion Yuan annually—four times the amount in the first stage.
3. The “rapid growth, sustainable, healthy phase” stage, from 1992–present. In the 1990s, to
further encourage FDI, the Chinese government permitted the establishment of wholly
foreign-owned enterprises. FDI rates, consequently, experienced significant growth:
Figure 3.1 demonstrates a jump of almost 200 billion Yuan from 1992–1995. The
average FDI over the period 1994–2004 hovers around 207 billion Yuan annually,
making China one of the top five countries in the world for FDI.
Other scholars have taken a different approach to categorize China’s FDI based on the source
country of foreign capital and industry destination. Hu (2004) divided the process into two
Page 87
77
phases: the first period is from the 1980s to the mid-1990s, when the primary source of capital
came from Hong Kong, Taiwan and Southeast Asia. More recently, foreign capital has shifted
toward primarily Western and Japanese sources. The focus of FDI has also shifted toward
capital- or technology-intensive industries rather than more traditional labor-intensive industries.
However, in general, the attracted FDI in the past decade in China are mainly concentrated in
low-technology and labor-intensive industries, especially the manufacturing industry. Dahlman
and Aubert (2001) found that 62% of the FDI in 1998 was concentrated in the manufacturing and
related industries, 25% in real estate, and only 1.6% in agriculture.
In order to better understand the development of foreign capital in China over the past 30 years,
we review Chinese polices on foreign capital since the onset of economic reforms in the late
1970s. In 1979, the “Law of People’s Republic of China on Joint Ventures using Chinese and
Foreign Investment” was established by the Chinese government to ensure the legal protection of
foreign investors in China. In 1983, the “Regulation for Implementation of the Law of the
People’s Republic of China on Chinese and Foreign Investment” was issued to further reform the
domestic market and establish a better economic environment for foreign investors. In 1987, the
State Council announced the “Provisions of the State Council of the People’s Republic of China
for the Encouragement of Foreign Capital”—also known as the “22 Article Provisions”—in
which foreign joint ventures were granted preferential tax treatment, freedom to import materials
and equipment, and measures designed to promote FDI. In 1990, “Detailed Implementing Rule
for the Law of the People’s of Republic of China on Wholly Foreign-Owned Enterprises”
required wholly foreign owned enterprises to use either export-oriented or advanced technology.
Page 88
78
In 1995, the “Provisional Guidelines for Foreign Projects” encouraged FDI into the agricultural,
energy, and high-technology industries. Furthermore, “Guiding Category of Foreign Investment
Projects” classified foreign project into four types: encouraged, restricted, prohibited, and
permitted (Fung et al, 2002). Encouraged projects are projects with new or advanced
technologies that save energy or use new materials. To meet the World Trade Organization
membership requirements, a new version of “Detailed Implementing Rule for the Law of the
People’s of Republic of China on Wholly Foreign-Owned Enterprises” was introduced in 2001
which removed the requirement that wholly foreign-owned enterprises must use either export-
oriented or advanced technology to meet the WTO membership requirement.
In 2002, China’s new “Guiding Industries Directory for Foreign Investment” took effect. The
new foreign investment directory removes many old requirements on foreign capital, including
the local content requirement, which requires a foreign investor to purchase a certain amount of
intermediate inputs from local suppliers as opposed to international markets. Technology transfer
required for foreign capital entering the Chinese market is also removed to meet WTO
membership requirements. As a result, solely foreign-owned firms have replaced joint ventures
as the most popular source of FDI.
Since 2004 the China government encourages FDI to enter high-technology industries, new
material manufacturing industries, and energy-saving and environmental protection industries
(China State Council, 2010).
The most effective way to attract FDI in China is through the establishment of National
Economic Development Zone. For example, the actual utilization of foreign capital in 54
Page 89
79
national economic development zones was $ 13.6 billion dollar in 2004, which accounts for 22.4%
of total foreign capital in China. More than 10% of employees in these economic zones have
senior professional titles. Some zones gather local cities’ 1/3-1/2 skilled labor who have
experiences of studying abroad. (Ministry of Commerce of the People’s Republic of China, 2006)
Aside from these common policies, there are regional- or provincial-specific FDI policies. For
example, in the Central and Western region, China government encourages inflows of labor-
intensive foreign firms that meet with environmental requirements. Moreover, foreign firms in
the Central and Western region will continuously receive preferential tax treatments, which have
been terminated in the Coastal regions. (China State Council, 2010)
Henan, a province in the Central China, issued many provincial-specific polices to incur FDI.
For instance, any national or provincial foreign invested R&D institutions will receive 200
million or 100 million Chinese Yuan project funding from government of Henan province,
respectively. The government of Henan Province also provides profession training, qualification
examination, and other supporting services to improve adaptive capacity. (The People’s
Government of Henan Province, 2010)
Some other special economic zones also issued policies to train labor to better attract FDI. For
instance, the Management Committee of Tianjin Economic and Technologic development zone
issued policies to encourage labor training; one such policy would fund a number of outstanding
professional and technical personnel to participate in oversea technical training annually, and
cover 20% of total training cost (the maximum subsidy amount is 10000 Chinese Yuan). Another
policy would encourage enterprises to carry out professional and technical personnel training.
For all kinds of talent who have certificates from training institutions recognized by the
Page 90
80
Development Zone, the management committee will fund them with 25% of their training cost
(the maximum subsidy amount for each person is 1000 Yuan). (The management committee of
Tianjin Economic and Technologic development zone, 2009)
Hangzhou Economic and Technological Development Zone has the largest higher education park
in Zhejiang Province. This park consists of fourteen colleges and universities, which provides the
Development Zone with good talent and many opportunities to train their workers, therefore
increasing labor quality in the Development Zone. (Hangzhou Economic and Technological
Development Zone, 2012)
In order to better attract foreign capital, Shanghai Municipal People’s Government implemented
three incentive policies in 2006: encourage foreign firms to participate infrastructure
construction; encourage foreign firms to invest in R&D institutions; encourage foreign firms to
participate in economic restructuring. (The Shanghai Municipal People’s government, 2006)
The people’s Government of Jiangsu Province has made further decentralization of foreign
investment approval authority. Cities and Counties’ development and reform departments can
approve any “encouraged” or “permitted” foreign projects with total investment less than 100
million dollars, which usually need authorizations from the Jiangsu Reform and Development
Commission. This policy has increased the administrative efficiency and reduced firms’ cost.
(The People’s Government of Jiangsu province, 2011)
Every big city in Liaoning province will launch a large scale industry cluster with an individual
brand to attract foreign investment. Foreign capitals are encouraged to participate in mergers and
acquisitions of local firms. (The People’s Government of Liaoning Province, 2012)
Page 91
81
It is commonly accepted that FDI brings a number of benefits to the host country:
1. Foreign capital will improve the technological efficiency and product quality of local
companies.
2. Advanced technologies will be provided by foreign enterprises to the upstream and
downstream enterprises of the host country.
3. Foreign-trained technical workers and managers could potentially enter local firms.
4. Market competition is intensified by the presence of foreign companies, forcing local
manufacturers to adopt new technology and improve efficiency.
There are many studies employing firm-level data to investigate the effect of FDI. For example,
Liu (2002) conducts research on China’s manufacturing industries. Hu and Jefferson (2002)
empirically examine the spillover effect of FDI within China’s electronics and textile industries.
For the studies of channels in which FDI spillover happens, Blalock and Gertler (2003) find
strong evidence within the Indonesian manufacturing industry of vertical supply chains acting as
a channel for technology transfer. Jacorvik (2004) finds strong evidence of a positive FDI
spillover effect between foreign firms and their local suppliers. In this paper, we will investigate
the FDI spillover effect through vertical linkages, i.e. how upstream foreign capital affects
downstream firms, and, conversely, how downstream foreign capital affects upstream firms.
Examining these questions requires examining how industry specific foreign capital intensity
(FCI)11
, defined as the ratio of foreign capital stock to total capital stock, changes over time. As
an example, Table 3.1 lists the individual FCIs for the following four industries: food and
11
In Figure 1, we depict the change of total capital stock and foreign capital stock of an average firm in our dataset
of large- and medium-size firms over the period 1995-2004.
Page 92
82
beverages, chemicals, metal processing and products, and machinery, equipment, and
instruments. As shown in Table 3.1, after 1998, foreign capital intensity in metal processing and
products industry increases every year (except year 2000). The foreign capital intensity of the
machinery, equipment, and instruments industry experiences a similar increase from 1998–2003.
The foreign capital intensity of the food and beverage industry and the chemicals industry,
however, hovers around 0.22 and 0.13 respectively over the period 1995-2002.
We are interested in how foreign capital in upstream industries affects the behavior of
downstream firms, specifically, whether more foreign capital in upstream industry will cause
downstream consumers to buy more intermediate inputs. We start from statistics on input-output
relationships among different industries. We employ the intermediate-use part of 1997, 2000,
2002, and 2005 input-output tables to construct Table 3.2, which lists the intermediate inputs
which the textiles, apparel and leather products industry purchased from the food and beverage,
chemicals, metal processing and products, and machinery, equipment and instruments industries
respectively. Every year from 1997–2005, the textiles, apparel, and leather products industry
purchased more intermediate inputs from its upstream industries. Combining Tables 3.1 and 3.2,
we propose that the spillover effects of upstream foreign capital stimulate downstream firms to
purchase more intermediate inputs. We will test this hypothesis later in this paper.
It is also important to consider how upstream Chinese firms are affected by the presence of
foreign firms in downstream industry. There are many examples of local firms that benefit from
the spillover of downstream foreign firms. For example, Motorola built a new factory in Tianjin
(Long, 2005), for which there are approximately 70 supporting enterprises within the city and
Page 93
83
170 supporting enterprises surrounding it. To ensure the intermediate inputs provided by these
enterprises meet the world standard, Motorola not only imposes strict quality control, but also
Provides information on the proper manufacture of these inputs, and even offers expert
manufacturing and managerial assistance. Typically, advance technologies from foreign firms
are capital-using (Fisher-Vanden and Jefferson, 2008). Therefore, another hypothesis is that local
firms will benefit from the spillover of the downstream foreign firms and tend to use more
capital.
Based on the change in Chinese FDI policies upon China’s entering into the WTO in 2001, we
can expect that the spillover effect of FDI—especially downstream FDI—has experienced
significant changes since 2001. We will test this hypothesis by running two similar seeming-
unrelated regression equations for two periods.
In this paper, we will empirically estimate factor-bias spillover effects of FDI, and try to answer
the following questions: Does the presence of FDI motivate Chinese firms to use more materials
or fewer? Does it push Chinese firms to develop technologies that reflect China’s comparative
advantage in order to compete internationally? Does FDI spillovers have the same impact on
horizontal industry as it does on vertical industry? Does China’s joining the World Trade
Organization in 2001 have any impact on FDI spillover and its effects?
Findings of our paper indicate that the neutral effect of foreign capital in China is not significant,
but that the factor-bias effect is robust and has the following features: the spillover effect of
foreign capital in upstream industries saves capital, but causes an increase in the use of labor and
Page 94
84
materials; the spillover effect of foreign capital in downstream industries uses more capital, but
less labor and materials; the spillover effect of foreign capital in horizontal industry saves capital,
but uses more labor and materials. China’s joining the WTO in 2001 changes the spillover of
FDI on upstream local firms from being material-saving over 1995-2001 to material-using over
2002-2004.This change occurs mainly through intensified competition and the removal of
technology transfer from downstream foreign firms.
The paper is organized as follows: Section 2 provides a literature review, which briefly
summarizes previous work on FDI, including the general empirical results on FDI spillover, the
reasons why the spillover effect is not clear, the impact of FDI on the factor markets of the host
country, technology-bias change affected by the FDI, and the hypotheses which we will test in
these paper. Section 3 introduces the data along with some descriptions. Section 4 presents the
model specifications and methodology. Section 5 discusses the empirical results and
interpretation. Section 6 provides concluding remarks.
Page 95
85
3.2. Literature Review
There is a well-known debate regarding the effects of FDI on host countries. Konings (2001)
12
finds no horizontal evidence of positive spillover of FDI on domestic firms in Poland, while
firms in Bulgaria and Romania experience a negative horizontal FDI spillover, which is due to
the competition effect. Woo (2009) finds that FDI increased TFP of a large number of countries
in 1979-2000.Tong and Hu (2003) find that productivity-increasing spillover effects take place
within region and across industries. Using data on large- and medium-sized enterprises in the
Chinese electronics and textile industries, Hu and Jefferson (2002) find that FDI within the same
industry substantially promotes new product innovation and reduce the productivity and market
share of domestic firms. However, based on an examination of 29 manufacturing industries in
the Shenzhen Special Economic Zone of China from 1993–1998, Liu (2002) finds that FDI
horizontal spillover significantly improves productivity in China’s manufacturing industry.
However, most empirical literature find that if the technological gap between a host country and
foreign country is too big, then the impact of spillovers of FDI on local firms is not significant.
Kokko (1994) and Kokko et al (1996) find, for Mexico and Uruguay, respectively, that there are
no significant FDI spillovers in the sectors where foreign firms have much more advanced
technologies than local firms. Jacorvik (2004) finds that the horizontal FDIs spillover effect in
developing countries is not significant and is even sometimes negative while the spillover effect
of FDI in developed countries is usually positive. Alfaro et al (2010) find that FDI bring higher
economic growth in financially developed economies relative to financially under-developed
ones.
12
Konings (2001) uses output as the dependent variable.
Page 96
86
In addition to studies focusing on whether host countries gain from the presence of FDI, the
importance of spillover channels also captures many researchers’ attention. Hale and Long (2006)
find that spillovers take place through the movement of high-skilled workers from foreign firms
to local firms and network externalities of these higher-skilled workers. Using a new longitudinal
dataset of more than 15,000 manufacturing firms in China, Abraham et al (2010) finds that FDI
horizontal spillovers increase productivity of firms in the same sector13
. However, Crespo et al
(2009), using data for Portugal, find negative FDI horizontal spillover effects.
Using an unbalanced panel dataset consisting of 17,675 Chinese manufacturing firms14
, Liu
(2008) finds that spillovers of upstream foreign firms increase productivity of downstream local
firms. However, Gorodnichenko et al (2007) find these upstream spillovers are only positive for
service sector firms. Moreover, Stančík (2007) finds that recently domestic firms in the Czech
Republic were harmed by spillovers of upstream foreign firms.15
Kugler (2006) finds that outsourcing relationships between foreign firms and upstream local
suppliers are an important channel of spillovers (see e.g. Rivera-Batiz and Rivera-Batiz, 1990;
Rodriguez-Clare, 1996; Markusen and Venables, 1999; Blalock, 2001; Lopez- Cordova, 2003;
Javorcik, 2004). Using panel data on Indonesian manufacturing firms from 1988–1996 to
evaluate the effects of FDI on local firms through backward linkages, Blalock and Gertler (2003)
find strong evidence of local firms in upstream industry benefiting from the technology transfer
13
Data used in Abraham et al (2010) is obtained from Oriana database of Bureau Van Dijk (Version January 2007).
It only covers the period 2002-2004. Also, due to their data quality issue, Abraham et al (2010) restrict their
attention to the manufacturing sector and exclude SOEs from their analysis. 14
Difference between our dataset and data used in Liu (2008) is that our data cover the period from 1995-2004
while data used in Liu (2008) only cover the period from 1995-1999. Also, Liu (2008) restricts his empirical
analysis to the manufacturing sector. 15
Stančík (2007) argues that upstream foreign firms tend to export their products outside Chine which makes
downstream domestic firms suffer.
Page 97
87
of downstream FDI. Jacorvik (2004) finds that local suppliers gain substantially from the
spillover effects of foreign firms through backward linkages.
However, these past studies only focus on the spillover effects on neutral productivity, while
spillovers may have important factor-bias effects. In this paper, we will examine not only the
horizontal and vertical FDI spillover effects, but also the neutral and factor-bias FDI spillover
effects.
One of the main contributions of this paper is how FDI affects the use of factor inputs. Fisher-
Vanden et al. (2006) find that the interaction of in-house technology expenditures and FDI
exhibits capital-using, labor-saving, and material-saving biases. Hatzius (2000) finds that the
existence of FDI increases demand for labor. Therefore, the price of labor increases, raising the
labor costs for domestic producers. Moreover, with more lax FDI regulations recently put into
place, the elasticity of long-run labor demand will rise, which may cause the labor market to
fluctuate more violently. Driffield and Taylor (2000) show that FDI tends to raise wage
inequality through the increased demand of skilled labor in local markets, and domestic firms
will also use more skilled labor since they receive more advanced technologies through
technology spillovers from foreign firms. Therefore, the presence of FDI and the spillover effect
of FDI will increase demand for skilled labor at the expense of unskilled labor.
Similar to our work in this paper, Fisher-Vanden and Jefferson (2008) examine the difference of
factor bias with in-house technology innovation and purchased imported technology. Results
show that the technology developments are consistent with the country’s comparative factor
Page 98
88
endowment. In other words, in-house technology tends to be capital-saving, but labor and
material-using. Imported technology saves labor and materials, but uses more capital, reflecting
the imported-technology source country’s comparative advantage. Additionally, results suggest
that in-house technology is cost saving and focuses on the process innovation of existing
production. On the contrary, imported technology is mainly used to develop new products and
raises the production quality and cost.
The main contribution of this paper to the existing literature is that we use a unique dataset of
Chinese enterprise to investigate how vertical and horizontal FDI influence Chinese domestic
firms’ input choice.
Based on the literature, we will test these hypotheses in this paper:
1. Facing competition from foreign firms in the same industry, local firms will be likely to
conduct process innovation to save costs or outsource more to obtain higher quality
inputs (Acemoglu, 2002). Based on Atkinson and Stiglitz (1969), the new knowledge
acquisition will reflect the local relative factor endowments. Therefore, the presence of
FDI in a given horizontal industry will induce local firms to exploit their comparative
advantage, which is capital-saving, labor- and material-using.
2. The entrance of foreign firms in an upstream industry intensifies competition, which
results in cheaper intermediate outputs for downstream consumers. Based on Hicks’
induced innovation hypothesis (1932), cheaper intermediate inputs will induce
downstream firms to adopt technologies with more use of intermediate materials.
Moreover, outputs of foreign firms usually have higher quality, which give downstream
Page 99
89
firms additional incentive to buy more intermediate inputs. Therefore, the presence of
FDI in an upstream industry ultimately spurs local firms to use more materials.
3. In order to obtain high quality intermediate inputs, downstream foreign firms are likely to
transfer advanced technologies to upstream suppliers. On the other hand, to capture
potential foreign customers, upstream suppliers are likely to increase their output quality
through product innovation. Based on Acemoglu (2002) and Fisher-Vanden and Jefferson
(2008), we expect the presence of FDI in downstream industries will induce local firms to
use more capital, less labor and material.
4. After China joined the World Trade Organization in 2001, the Chinese government
removed many of the existing regulations for foreign investor entering the Chinese
market, such as local content requirement and technology transfer requirement. Therefore,
with the relaxed foreign investment environment (This will reduce the chances that
domestic firms obtain technologies transferred from foreign firms and force domestic
firms to pay more attention to their own in-house R&D activities) and more intense
international competition (one way for domestic firms to stay successfully in this
competition is to increase their production quality or production efficiency through
outsourcing more), we expect that the spillover effect of downstream FDI will be
significant material-using after 2001.
Page 100
90
3.3 Data
The data we used in our paper is firm-level panel data that is annually updated by the National
Bureau of Statistics of China (NBS). It consists of approximately 200,000 observations and
63,564 large- and medium-sized industrial enterprises, from 1995–2004.
We will run a seeming-unrelated regression (SUR) on this unbalanced dataset. However, the
unbalanced dataset contains many firms with only one or two year observations between 1995-
2004. Additionally, these firms are generally small in sales revenue or fixed assets compared
with firms with observations over the entire period 1995-2004. Therefore, the impact of FDI
spillovers on these firms may be not as steady as firms with many years observations from 1995-
2004. In order to test these potential disturbances caused by firms with inconsistence
observations, we construct a balanced dataset and run a similar SUR. We will report both results
and make a comparison.
Starting from the unbalanced dataset, we drop any firm that did not continuously report over a
ten-year period to obtain the balanced dataset. This could happen for one of the following
reasons: the size of the firm shrank from a medium-sized firm to a small-sized firm; a change of
ownership related to industry reformation; or the firm may have merged, moved, or simply
changed its firm ID. The final balanced dataset consists of only 2,000 firms.
In Table 3.3, we compare our “Balanced-LME” sample with both industry-wide totals and large-
and medium-sized firm data across three dimensions: sales revenue, employment, and fixed
Page 101
91
assets. We find that, although our balanced sample only contained just over 1% of China’s state-
owned industrial enterprises and non-state-owned industrial enterprises with annual sales of over
5 million Yuan, it did capture 11.2% of China’s industrial sales, 9.3% of its industrial
employment, and 13.6% of its industrial assets. In Table 3.4, we list the foreign capital shares by
industry from 1995–2004. The machinery, equipment, and instruments industry has the highest
ratio of foreign capital over total capital, and its foreign capital accounts for more than half of 12
industries’ total foreign capital.
Since foreign capital is already in stock form, we calculate the foreign-capital stock intensity as
the ratio of foreign capital over total capital stock. Now we are going to construct foreign capital
intensity for horizontal, upstream, and downstream industries.
, represent foreign capital stock and total capital stock in a firm’s 3-digit SIC
industry, respectively.16
They are the sum of the foreign capital stock and the total capital stock
of any firm belonging to the same 3-digit SIC industry as the targeted firm.
is foreign-capital stock intensity of a firm’s 3-digit SIC industry, which employs the
following formula:
, are the weighted average stocks of foreign capital, and total capital in the
firm’s 2-digit SIC upstream industries, respectively. Here we use input-output shares as the
16
The construction method of stocks in a firm’s 3-dig SIC industry and stocks in a firm’s 2-digit SIC upstream or
downstream industries applies to both the unbalanced and balanced dataset.
Page 102
92
weight. Suppose the target firm’s 2-digit SIC upstream industries are industry , where i range
from 1 to I17
. The input-output share for industry to the industry where the targeted firm
locates is . We label the foreign capital of industry IDi as , then
( ) ∑
The construction of is almost identical to the construction of except using
total capital instead of foreign capital. Then we define , weighted average foreign
capital stock intensity of firm’s 2-digit SIC upstream industries, to be the ratio of to
The same steps apply to ,weighted average foreign capital stock intensity of
downstream industry, except that the calculations involve with the target firm’s 2-digit
downstream industries instead of its upstream industries.
17
We only use 23 industries in our dataset, therefore, I=23.
Page 103
93
3.4. Model specification and methodology
The standard approach to measuring the neutral and factor-biased effects of FDI and technology
development involves the estimation of production functions or dual cost functions. The
theoretical connection between production or cost functions and factor demands makes this
approach fitting for the measurement of factor bias. The choice of whether to use the production
function approach or the cost function approach depends on the relevant set of exogeneity
assumptions. For the production function formulation – which incorporates quantities of output
and inputs – input quantities are assumed to be exogenous, whereas in the cost function input
prices are assumed to be exogenous. In highly aggregated data sets, input prices are likely to be
endogenous and therefore a production function may be more appropriate. At the firm level,
however, choices of factor inputs are likely to be endogenous while factor prices are more likely
to be set in the market and therefore plausibly exogenous. Since our data set allows us to impute
factor input prices for the individual firms, we use the cost function approach:
(1) ( ) ( )
where
( )
, represents neutral productivity effects
( ) , represents factor-biased productivity effects of and .
( ), represent prices for capital, labor and material respectively,
( , , , )
( )
Page 104
94
C total cost of production
Q gross value of industrial output in constant prices,
price of fixed assets, which is calculated as (value added-wage bill-welfare payments)/(net
value of fixed assets),
price of labor , which is calculated as (wage bill+ welfare payments)/(number of employed
persons),
price of material, which is calculated as the weighted average of industrial prices using
input-output shares,
Fkinten foreign capital stock intensity, calculated as (foreign capital stock)/(total capital stock),
Fkinten_3dig foreign capital stock intensity of firm’s 3-digit SIC industry,
Fupstr_kinten foreign capital stock intensity of firm’s 2-digit SIC upstream industries, weighted by
input-output shares
Fdownstr_kinten foreign capital stock intensity of firm’s 2-digit SIC downstream industries,
weighted by input-output shares
We are most interested in the ( ) and ( ) terms. The former captures the neutral cost
effect of foreign direct investment (F) and time (T). The latter captures factor-biased productivity
effects of F.
Using Shephard’s Lemma, we derive the cost share equation associated with each factor input
by taking the derivative of the cost function with respect to the relevant input price; i.e.,
Page 105
95
C
XP
P
C ii
i
ln
lni = K, L, M
Specifically, taking the derivative of equation (1) with respect to each input price, we obtain the
following cost share equations:
(2) ⁄
(3) ⁄
where
VL value of labor expenditures (equal to wage bill + welfare payments)
VM value of material expenditures (value of intermediate inputs )
VC value of total cost.
It is easy to verify that the sum of three value share equations (capital, labor, and material) is
equal to one. According to Berndt (1991), the estimated coefficients of value share equations are
independent with the choice of which specific value share equation we drop. Therefore we drop
the capital share equation out of our seeming-unrelated regression estimation.
We construct a system equation which consists of equations 1, 2 and 3. Since the coefficients are
correlated across these three equations, we adopt the seeming unrelated regression method. To
ensure that the coefficients exhibit the usual properties of symmetry and homogeneous of degree
one in prices, we impose the following constraints:
βa,b = βb,a
i’∙Z = 1
βZZ∙ i = 0
Page 106
96
βRZ∙ i = 0
βRTZ∙ i = 0
βTZ∙ i = 0
βQZ∙ i = 0
where i is a vector of ones.
We use the fixed-effect estimation procedure to control for firm-specific productivity differences
by incorporating dummy variables associated with each firm in our regression. The reason that
we do not adopt the random effects model is that the unobserved effect maybe correlated with
some of the dependent variables; for example, differences in leadership ability from firm to firm
are an instance where simultaneity occurs. However, the number of dummy variables constructed
in our unbalanced dataset is more than 65,000, which exceeds STATA’s allowable capacity.
Therefore, we use the demean method, also called within transformation, to control for firm-
specific productivity differences while not adding dummy variables. Specially, for each variable
in the first regression equation, we obtain a new variable defined to the original variable minus
the mean of this variable over the period 1995-2004. This time demean method removes the
individual specific effects from the original equation. Results are reported in Table 3.5.
Additionally, to obtain a comparison, we use the fixed-effect estimation procedure by
incorporating dummy variable to run regression on the balanced dataset. This method will result
in a potential sample selection bias problem which seems inevitable since we dropped a portion
of observation. The results are reported in Table 3.6.
Page 107
97
3.5. Results and Interpretation
Tables 3.5 and 3.9, Table 3.7 and 3.10, present the main results of our SUR regressions on the
unbalanced dataset, and the balanced dataset, respectively. Table 3.6 and 3.8 provide results of
using growth accounting method to evaluate the contribution of FDI to total cost. Table 3.9 and
3.10 offer a comparison of two regression results: the first one is run on the data collected from
1995–2001 and second one is run on data from 2002–2004. In both tables, the coefficients and p-
values of regression estimates for variables related with foreign capital intensity are listed in the
following order: the stock of own-firm foreign capital; the stock of foreign capital intensity in the
firm’s 3-digit SIC industry; the stock of foreign capital intensity in the firm’s 2-digit SIC
upstream industry; the stock of foreign capital intensity in the firm’s 2-digit SIC downstream
industry; and the three factor-bias (capital, labor, and material) effects of these stocks.
Neutral impact on total cost: Table 3.5 and 3.7 show the impact of FDI on total cost from 1995–
2004. Among the four potential spillover channels through which FDI affects total cost, results
on the unbalanced dataset shows that only FDI at the horizontal 3-digit industry level and FDI in
a firm’s downstream industries exhibit significant effects on productivity. Specifically, own-firm
foreign capital exhibits cost-saving productivity effects. Regression results on the balanced
dataset show that only intra-firm FDI and FDI at the horizontal 3-digit industry level exhibit a
significant effect on productivity. No vertical spillovers are found either from the firm’s
upstream industry or its downstream industry. Specifically, foreign capital in a firm’s 3-digit SIC
industry has cost-saving productivity effects.
Page 108
98
As discussed in Fisher-Vanden and Jefferson (2008), imported technologies are chosen to
produce new products which command a higher price even at the expense of greater cost. We
expect foreign capital invested in Chinese firms to have a similar technological bias as the
imported technology purchased by Chinese firms. The reason is that the technologies developed
by foreign investors or purchased from foreign countries both reflect the resource scarcities of
developed countries. Therefore, firms with FDI are likely to focus on product innovation, which
typically demands higher costs. This is confirmed by our results using the balanced dataset that
own-firm foreign capital exhibits cost-increasing effect, although this effect is not significant but
still cost-increasing in our results using the unbalanced dataset.
Horizontal FDI has a cost-saving neutral effect on local firms; the possible reasons are discussed
in the existing literature. For example, FDI brings advanced technology and managerial skills to
the local market. These technologies and skills can spill over to local firms via carriers like
workers and products. The appearance of FDI in a host country will increase competition, which
forces local firms to increase their efficiency. One effective way is through process innovation
which uses input factors based on their relative factor endowments, thereby effectively reducing
their overall cost. Tybout (2003) also finds strong evidence that the presence of foreign firms
pushes their local counterparts to increase their productivity.
As shown in Table 3.9 and 3.10, from 1995–2001, foreign capital in upstream industries has
significant cost-saving spillover effects while the downstream industries’ foreign capital has
significant cost-increasing spillover effects. From 2002–2004, a firm’s own foreign capital
Page 109
99
increases cost while foreign capital at a firm’s horizontal-industry level exhibits significant cost-
saving effects. Comparing results from these two periods, we find that the spillover effect of FDI
in downstream industries has a significant change over the period 1995–2001 to spillover effect
over the period 2002–2004: cost increases that were significant over the period 1995-2001 have
since turned insignificant (cost-saving in the results on the unbalanced dataset) over the period
2002-2004, a direct result of China’s newly relaxed foreign-investment regulation, such as
removal of local content requirement and technology transfer requirement. With these old
policies in effect, downstream firms with FDI may have had a stronger incentive to transfer a
portion of additional costs to local suppliers since they have to transfer advanced technology to
upstream suppliers. With the removal of the policies, the effect of foreign capital in downstream
industry on upstream local suppliers will become more positive. This is consistent with our
results in Table 3.9 and 3.10.
Factor bias impact on total cost: Table 3.5 and 3.7 show that foreign capital in a firm’s
horizontal industry causes a spillover effect that saves capital and uses more materials, which
confirm Hypothesis 1. This is consistent with our first hypothesis. The possible explanations for
this result are as follows: the presence of FDI will bring additional competition on local firms,
and spur them to increase their productivity to prevent a large loss of market share; and one of
the quickest ways to reduce cost is to focus on process innovation instead of new product
innovation18
. According to Acemoglu (2002), process innovation focuses on cost reduction
conditions that employ the comparative advantage of the host country’s strengths, which, in
18
Typically, procession innovation will reduce production cost, while production innovation focuses on higher quality and higher
priced new product will increase production cost. Our empirical results show that FDI in horizontal industry saves production
cost. Therefore, it seems that domestic firms choose process innovation rather than production innovation in response to the
entrance of foreign firms
Page 110
100
China’s case, is labor and materials. Moreover, higher competition from the entrance of foreign
firms or foreign capital incurs domestic firms to buy intermediate material rather than make them
in-house. Therefore, the spillover effect of horizontal FDI in China is expected to save capital
and use materials, which is confirmed by our results.
Hypothesis 2, which expects that FDI in upstream industries will drive local firms to use more
material, is confirmed by our empirical results. As reported in Table 3.5 and 3.7, foreign capital
in upstream industry exhibits the opposite factor-bias spillover effect than foreign capital in
downstream industry: spillover effect of FDI in upstream industry saves capital, but uses more
materials, while spillover effect of FDI in downstream industry uses more capital, but still saves
on labor and materials (material-saving is not significant in Table 3.5).
The entrance of foreign firms or foreign capital into upstream industry raises the market
competition for intermediate inputs of downstream firms. Typically, the entrance of new
producers into a market leads to a larger supply of output. Classical demand-supply theory
indicates that more supply of one particular good usually results in a lower price of that good.
Therefore, the presence of FDI in upstream industry brings cheaper outputs. In other words,
downstream firms have cheaper intermediate inputs. The induced innovation hypothesis, first
proposed by J. R. Hicks in 1932, posits that a change in relative prices of input factor will induce
innovations to economize on the use of the factor which has become relatively expensive; thus,
cheaper intermediate inputs (material) affect firms’ decision toward the direction of material-
using innovation.
Page 111
101
Moreover, FDI in upstream industry will usually improve the quality of outputs due to an influx
of more advanced technology from foreign firms. Therefore, downstream local firms will buy
more intermediate inputs from upstream firms.
Foreign firms in downstream industries typically bring spillover effects to upstream suppliers
through outsourcing relationships (e.g., Kugler, 2006; Blalock, 2001). In order to achieve a
higher quality product and lower price inputs, foreign firms in downstream industry often
transfer advanced technologies and even skilled labor to the upstream local firms. For instance,
Blalock and Gertler (2003) find strong evidence of local firms in upstream industry benefiting
from the technology transfer of downstream FDI. Local firms will upgrade their machinery in
accordance with the new advanced technology. This is similar to the local firms’ purchase of
imported technology, except, in this case, the recipients and sellers are both in China. According
to Fisher-Vanden and Jefferson (2008), imported technology, which usually originates in
developed countries, uses capital, saves labor, and materials. On the other hand, the higher
quality requirement from downstream foreign firms may induce the local firms to improve their
existing product quality or even invent a new product. This product innovation is also needed for
firms exporting their products to OECD markets. Based on Acemoglu and Zilibotti (2001) and
Acemoglu (2002), production innovation, unlike process innovation, reflects the factor bias of
developed countries, such as OECD. Therefore, upstream domestic firms will use more capital,
less labor and material, which confirms Hypothesis 3.
As shown in Table 3.9 and 3.10, comparing the results from 1995–2001 with the results from
2002–2004, the spillover from foreign capital in upstream industries both have significant
Page 112
102
capital-saving and material-using spillover effects and foreign capital in downstream industries
stays robust labor-saving effects in both periods. The pattern of factor bias spillover effect of
horizontal FDI changes. From 1995–2001, the bias for the labor affected by the spillover of
horizontal FDI changes from being saving over the period 1995-2001 to be robustly using over
the period 2002-2004. This explains by the increase in urban employees from 1995–2004. As
shown in Table 3.11, we find that, from 1995–2001, the average number of urban employee is
213 million; from 2002–2004, that number jumped to256 million. The material bias exhibits the
same behavior as the labor bias: foreign capital in downstream industry saved materials from
1995–2001, but ultimately caused an increase in material-usage after 2002. This result confirms
Hypothesis 4. Required by its admittance to the WTO, China relaxed its foreign-investment
regulation, including removing of local content requirements and demands for technology
transfer. As a result, upstream domestic suppliers will get less or even no technology transfer
from downstream foreign firms. Therefore, input factors of upstream Chinese suppliers will
exhibit a bias more consistent with their in-house technologies rather than the technologies
transferred from foreign firms.
Moreover, after China’s joining of the WTO in 2001, not only more foreign firms build their
branches in China, but also many foreign firms start to export their goods to Chinese market,
which is a result of China’s removal of many trade barriers (These will increase supply of
intermediate materials). Openness to imports increases the domestic competition (Bayoumi et al
1999). These changes largely intensify the competition. To effectively reduce the cost and
increase their competitiveness, more Chinese firms choose to buy intermediate inputs rather than
Page 113
103
make them in house. Therefore, the spillover effect of downstream foreign capital exhibits
material using after 2001.
Contribution to change in total cost:
Based on Table 3.5 and 3.7, we use growth accounting method, which decomposes the change in
total cost into the change of amount of factors used, to evaluate the contribution of three types of
FDI to the change in total cost. Results are listed from Table 3.6 and 3.8, consist of neutral effect,
fact-bias effect and total effect, of four different kinds of FDI.
As shown in Table 3.6 and 3.8, FDI between 1995 and 2004 tended to reduce total cost (Except
the effect of upstream FDI in Table 3.8). We break out this total contribution in terms of neutral
effect and factor bias effect. In both Table 3.6 and Table 3.8, downstream FDI has a significant
cost-saving factor bias effect and FDI in 3-dig industry has a strong cost-saving neutral effect.
We focus on the results in Table 3.6 since they are regression results on the unbalanced dataset.
Factor bias effect, whether it associated with upstream, downstream, 3-dig industry or firm itself,
is always cost-reducing. According to Table 3.6, increases in FDI in upstream industries reduce
cost by 1.97 percent and increases in total FDI in China reduce total cost by 2.99 percent.
Page 114
104
3.6. Conclusion
This paper investigates the factor bias effects of FDI spillover. Unlike the investigations on the
neutral FDI spillover effect and channels through which FDI impacts most on the host country,
examined in previous literature, our investigation examines how the presence of FDI in different
industries affects the decision of Chinese domestic firms regarding their input factors.
Using a large sample of Chinese large- and medium-size enterprises, we conclude that the
presence of FDI in horizontal industry is driving Chinese firms toward technological bias which
is highly consistent with their comparative advantages, especially their advantage of material
abundance, as we expected in Hypothesis. Typically, production innovation and process
innovation are two choices for firms to deal with the competition. However, since product
innovation is used to produce higher quality and demand higher price, it needs the capital-using,
cost-increasing technologies. Since Chinese domestic firms are still less developed, their
technological strengths are capital-saving, labor- and material-using. Therefore, Chinese firms
will choose process innovation which focuses on cost-cutting of existing products. Based on
Acemoglu (2002) and Fisher-Vanden and Jefferson (2008), process innovation reflects the
resource scarcity of the source country. Therefore, the presence of FDI in horizontal industry
reinforces Chinese firms’ technological bias choice, which is capital-saving, labor- and material-
using.
The pattern of factor bias effect of FDI in downstream industry is strikingly different from that of
horizontal FDI. Downstream foreign firms choose intermediate inputs from upstream local firms.
Therefore, downstream foreign firms will likely treat them as subsidiaries, transferring advanced
technologies and managerial skills to increase the quality and reduce supply time for
Page 115
105
intermediate inputs. Since the technologies adopted by the downstream foreign firms are usually
embedded with the comparative advantage of developed countries—capital-using, labor- and
material-saving, the spillover effects of downstream FDI should exhibit a bias that uses capital
but saves labor and materials, which consist with what we expected in Hypothesis 3.
Upstream foreign firms will often supply downstream local firms with higher quality
intermediate inputs, which resulting in downstream local firms buying more intermediate inputs
from upstream industries. Moreover, the entrance of foreign firms in upstream industry increases
the number of suppliers, which will increase supply for downstream industries. As a result, the
price of intermediate inputs for downstream firms may decrease. Therefore, the presence of
foreign capital in upstream industries should have material-using spillover effects, as we
expected in Hypothesis 2.
In conclusion, horizontal FDI drives Chinese domestic firms to play more on their comparative
advantage; upstream FDI improves the quality of intermediate inputs for downstream firms and
drives them to outsource more; downstream FDI is driving new product development of
upstream Chinese suppliers through technology transfer and higher requirement, thus driving
them toward technical bias consistent with foreign firms. While previous studies focus on the
neutral effect of FDI on developing countries, our finding leads us to believe that FDI in
different levels of vertical linkage will induce different factor bias technical changes among
Chinese firms.
Page 116
106
Table 3.1
Foreign capital intensity (FCI)* in four Chinese industries from 1995–2004
Year
FCI in food and
beverage
FCI in
chemicals
FCI in metal
processing, and
products
FCI in machinery,
equipment, and
instruments
1995 0.21 0.12 0.046 0.16
1996 0.24 0.14 0.05 0.19
1997 0.25 0.15 0.06 0.22
1998 0.2 0.11 0.036 0.18
1999 0.21 0.12 0.038 0.19
2000 0.21 0.13 0.032 0.21
2001 0.23 0.13 0.04 0.24
2002 0.25 0.13 0.049 0.26
2003 0.2 0.1 0.05 0.28
2004 0.2 0.09 0.056 0.25 *: FCI foreign capital stock/total capital stock
Source: Nation Bureau of Statistic of China. (1995–2004)
0
50
100
150
200
250
300
350
19
81
19
82
19
83
19
84
19
85
19
86
19
87
19
88
19
89
19
90
19
91
19
92
19
93
19
94
19
95
19
96
19
97
19
98
19
99
20
00
20
01
20
02
20
03
20
04
bill
ion
Yu
an
Figure 3.1: FDI in China (year 1981–2004)
Page 117
107
Table 3.2
Intermediate inputs for textiles, apparel, and leather products industry
(In ten thousand Yuan)
1997 2000 2002 2005
Food and Beverage 2,424,849* 2,431,180 2,469,542 4,657,513
Chemicals 11,768,560 14,821,590 13,670,509 27,083,408
Metal processing and
Products
481,970 464,741 667,973 1,255,379
Machinery,
Equipment, and
Instruments
1,967,437 2,321,166 2,929,627 4,830,240
* This number is explained as the textiles, apparel, and leather products industry bought 2,424,849 ten thousand
Yuan inputs from the Food and Beverage industry.
Source: National Bureau of Statistics of China. (1997, 2000, 2002, 2005)
Table 3.3
Shares of LMEs and Balanced-LME sample in Aggregate industry, 20041
(% of total industry)
Measures All industry2 Of which: LME3 Of which: Balanced-
LME
Sales (100 million Yuan) 181,715 (100%) 126,284 (69.5%) 20,300 (11.2%)
Employment (10,000
persons)
6,099 (100%) 3,232 (53%) 573 (9.3%)
Assets (100 million Yuan) 195,262 (100%) 140,245 (71.8%) 26,500 (13.6%)
Number of enterprises 219,463 (100%) 23,267 (10.6%) 2,507 (1.14%)
1: Source: China Statistical Yearbook, 2005. 2: Industrial state-owned and non-state-owned with annual sale over 5
million. 3. Industrial state-owned and non-state owned enterprises with annual sale over 30 million Yuan,
employment over 300 persons, and Assets over 40 million Yuan.
Page 118
108
Table 3.4
Foreign Capital Shares by Industry, 1995-2004 (In percent)
Relative to Share of total
total capital foreign
capital*
Mining 0.02 0.05
Food and beverage 15.4 7.9
Textiles, apparel and
leather products 5.7 2.2
Timber, furniture, and
paper products 13.0 3.4
Petroleum processing and
coking 3.5 2.4
Chemicals 3.9 6.2
Rubber and plastic
products 21.3 4.3
Non-metal products 17.4 9.9
Metal processing and
products 1.9 4.7
Machinery, equipment
and instruments 25.0 55.2
Electric power 1.9 3.3
Other industry 0.0 0.0
Total industry 7.4 100
*Figures are shares within the total sample (column sums to 100%).
Page 119
109
Table 3.5
Effect of Foreign Capital on Cost
(Regression results using the unbalanced dataset)
Independent variables Coefficient P-value
Foreign capital intensity Price of capital*Foreign capital intensity Price of labor*Foreign capital intensity Price of material*Foreign capital intensity
0.0359871 0.0209012 -0.0062928 -0.0146084
0.185 0 0.001 0
Foreign capital intensity at 3-digit industry Price of capital*Foreign capital intensity at 3-digit industry Price of labor*Foreign capital intensity at 3-digit industry Price of material*Foreign capital intensity at 3-digit industry
-0.11533 -0.1288416 -0.0167516 0.1455932
0.066 0 0 0
Foreign capital intensity of upstream industries Price of capital*Foreign capital intensity of upstream industries Price of labor*Foreign capital intensity of upstream industries Price of material*Foreign capital intensity of upstream industries
-0.0002 -0.4245468 -0.0561711 0.4807179
0.999 0 0.003 0
Foreign capital intensity of downstream industries Price of capital*Foreign capital intensity of downstream industries Price of labor* Foreign capital intensity of downstream industries Price of material* Foreign capital intensity of downstream industries
1.283682 0.2795262 -0.3120057 0.0324796
0 0 0 0.135
Table 3.6 Contribution of foreign capital to the change in total cost, 1995-2004
(Using unbalanced dataset)
Total effect Neutral
effect
Factor-biased effect
Total Capital-
biased
Labor-
biased
Material-
biased
Firm’s own -0.05%***
0.146% -0.196%
*** 0.024%***
-0.09%***
-0.13%***
3-digit -0.66%*** -0.249%
* -0.41%
*** -0.79%***
-0.26%***
0.64%***
upstream -1.97%*** -0.00015% -1.97%
*** -2.05%***
-0.52%***
0.6%***
downstream -0.32%*** 2.16%
*** -2.48%
*** 1.59%***
-4.18%***
0.11%
total -2.99%***
2.06%***
-5.056%***
Notes: * significant at the 10% level; ** significant at the 5% level; ***significant at 1% level
Page 120
110
Table 3.7
Effect of Foreign Capital on Cost
(Regression results using the balanced dataset)
Independent variables Coefficient P-value
Foreign capital intensity Price of capital*Foreign capital intensity Price of labor*Foreign capital intensity Price of material*Foreign capital intensity
0.186019 0.029035 -0.02789 -0.00115
0.003 0 0 0.822 Foreign capital intensity at 3-digit industry
Price of capital*Foreign capital intensity at 3-digit industry Price of labor*Foreign capital intensity at 3-digit industry Price of material*Foreign capital intensity at 3-digit industry
-0.417 -0.24707 -0.0096 0.256671
0.002 0 0.134 0
Foreign capital intensity of upstream industries Price of capital*Foreign capital intensity of upstream industries Price of labor*Foreign capital intensity of upstream industries Price of material*Foreign capital intensity of upstream industries
0.75923 -1.01182 0.34256 0.66926
0.181 0 0 0
Foreign capital intensity of downstream industries Price of capital*Foreign capital intensity of downstream industries Price of labor* Foreign capital intensity of downstream industries Price of material* Foreign capital intensity of downstream industries
-0.0884 0.795378 -0.46461 -0.33077
0.868 0 0 0
Table 3.8 Contribution of foreign capital to the change in total cost, 1995-2004
(Using the balanced dataset)
Total effect Neutral
effect
Factor-biased effect
Total Capital-
biased
Labor-
biased
Material-
biased
Firm’s own -0.67%***
-1.16%***
0.49%***
0.16%***
0.0032***
0.017%
3-digit -0.018%***
-0.962%***
0.98%***
-0.071%***
-0.0016 1.21%***
Upstream 9.77%***
1.6% 8.17%***
-0.12%***
0.0531***
2.98%***
downstream -12.82%***
-0.29% -12.53%***
-0.28%***
-9.86%***
-2.39%***
Total -3.69%***
-0.8%***
-2.89%***
Notes: * significant at the 10% level; ** significant at the 5% level; ***significant at 1% level
Page 121
111
Table 3.9
Effect of Foreign Capital on Cost: 1995-20001 versus 2002-2004
(Using the unbalanced dataset)
Independent variables 1995-2001 2002-2004 Coefficient P-value Coefficient P-value
Foreign capital intensity Price of capital*Foreign capital intensity Price of labor*Foreign capital intensity Price of material*Foreign capital intensity
-0.0068 0.032339 -0.015631 -0.016708
0.871 0 0 0
0.06661 0.0090201 0.004447 -0.01346
0.011 0 0.037 0
Foreign capital intensity at 3-digit industry Price of capital*Foreign capital intensity at 3-digit industry Price of labor*Foreign capital intensity at 3-digit industry Price of material*Foreign capital intensity at 3-digit industry
-0.05728 -0.15373 -0.04984 0.20357
0.537 0 0 0
-0.23854 -0.09280 0.0368809 0.0559243
0 0 0 0
Foreign capital intensity in upstream industries Price of capital* Foreign capital intensity in upstream industries Price of labor* Foreign capital intensity in upstream industries Price of material* Foreign capital intensity in upstream industries
-3.620577 -0.73366 -0.10118 0.8348
0 0 0 0
3.629951 -0.015957 -0.056368 0.0723257
0 0.586 0.034 0.012
Foreign capital intensity in downstream industries Price of capital* Foreign capital intensity in downstream industries Price of labor* Foreign capital intensity in downstream industries Price of material* Foreign capital intensity in downstream industries
4.5479 0.6188 -0.2204 -0.3983
0 0 0 0
-1.62236 -0.23235 -0.52790 0.76025
0 0 0 0
Page 122
112
Table 3.10
Effect of Foreign Capital on Cost: 1995-20001 versus 2002-2004
(Using the balanced dataset)
Independent variables 1995-2001 2002-2004 Coefficient P-value Coefficient P-value
Foreign capital intensity Price of capital*Foreign capital intensity Price of labor*Foreign capital intensity Price of material*Foreign capital intensity
0.0989 0.032259 -0.03268 0.000421
0.255 0 0 0.946
0.119057 0.023455 -0.01348 -0.00998
0.008 0.001 0 0.239
Foreign capital intensity at 3-digit industry Price of capital*Foreign capital intensity at 3-digit industry Price of labor*Foreign capital intensity at 3-digit industry Price of material*Foreign capital intensity at 3-digit industry
-0.26041 -0.28151 -0.02862 0.310135
0.254 0 0.001 0
-0.36799 -0.16281 0.016195 0.14662
0.001 0 0.026 0
Foreign capital intensity in upstream industries Price of capital* Foreign capital intensity in upstream industries Price of labor* Foreign capital intensity in upstream industries Price of material* Foreign capital intensity in upstream industries
-2.64335 -1.31074 0.396012 0.914728
0.038 0 0 0
-0.21972 -0.63387 0.355744 0.278124
0.694 0 0 0
Foreign capital intensity in downstream industries Price of capital* Foreign capital intensity in downstream industries Price of labor* Foreign capital intensity in downstream industries Price of material* Foreign capital intensity in downstream industries
2.651857 1.161696 -0.49843 -0.66327
0.005 0 0 0
-0.48461 0.101308 -0.38267 0.281367
0.382 0.071 0 0
Page 123
113
Table 3.11: Employment of China Urban from year 1995 to year 2004
Year Urban Employees (10 thousands)
1995 19093
1996 19815
1997 20678
1998 21014
1999 21274
2000 23151
2001 23940
2002 24780
2003 25639
2004 26476
Source: National Bureau of Statistics of China.
Page 124
114
References:
Abraham, Filip, Jozef Konings, and Veerle Slootmaekers, 2010, “FDI spillovers in the Chinese manufacturing
sector.” The Economics of Transition, 18(1): 143.
Acemoglu, Daron, 2002, “Direct Technical Change.” Review of Economic Studies, 69: 781-809.
Acemoglu, Daron, and Fabrizio Zilibotti, 2001, “Productivity differences,” The Quarterly Journal
of Economics, 116: 563-606.
Atkinson, B. Anthony and Joseph E. Stiglitz, 1969, “A new view of Technological Change.” The Economic Journal,
79 (315): 573-578
Alfaro, Laura, Areendam Chanda, Sebnem Kalemli-Ozcan, Selin Sayek, 2010, “Does foreign direct investment
promote growth? Exploring the role of financial markets on linkages.” Journal of Development Economics,
91(2)
Bayoumi, Tamim, David T. Coe, and Elhanan Helpman, 1999, “R&D spillovers and global growth.” Journal of
International Economics, 47: 399-428
Berndt, E.R. 1991, The Practice of Econometrics: Classic and Contemporary. Addison-Wesley Publishing Co.
Blalock, Garrick, 2001, “Technology from Foreign Direct Investment: Strategic Transfer through Supply Chains.”
mimeo, Haas School of Business, University of California, Berkeley.
Blalock, Garrick, and Paul J. Gertler, 2003, “Firms Capabilities and Technology Adoption: Evidence from Foreign
Direct Investment in Indonesia.” Unpublished paper, Department of Applied Economics and Management,
Cornell University.
China State Council, 2010, “Several options of the State Council on further improving the utilization of foreign
investment.”
Crespo, Nuno, Maria Paula Fontoura, and Isabel Proença, 2009, “FDI spillovers at regional level: Evidence from
Portugal.”Papers in Regional Science, 88(3)
Dahlman, Carl, J., and Jean-Eric Aubert, 2001, China and the Knowledge Economy: Seizing the 21st Century. The
World Bank.
Driffield, N., and K., Taylor, 2000, “FDI and the Labour Market: a Review of the Evidence and Policy Implication.”
Oxford Review of Economic Policy, 16(3): 90-103
Fisher-Vanden, Karen, Gary H. Jefferson, Jingkui Ma, and Jianyi Xu, 2006, “Technology development and energy
productivity in China.” Energy Economics, 28(5-6): 690-705.
Page 125
115
Fisher-Vanden, Karen and Gary Jefferson, 2008, “Technology Diversity and Development: evidence from China’s
Industrial Enterprises.” Journal of Comparative Economics, 36(4): 658-672.
Fisher-Vanden, Karen, Gary Jefferson, Yaodong Liu, and Jinchang Qian, 2009, “Open Economy Impacts on Energy
Consumption: Technology Transfer & FDI Spillovers in China’s Industrial Economy,” manuscript,
Pennsylvania State University.
Fung, K. C., Iizaka, Hitomi, and Tong, Sarah, 2002, “Foreign Direct Investment in China: Policy, Trend and
Impact.” HIEBS working paper, Ref. No.: 1049
Glaeser, Edward, Hedi Kallal, José Scheinkman, and Andrei Shleifer, 1992, “Growth in cities.” Journal of Political
Economy, 100(6):1126– 1152.
Gorodnichenko, Yuriy, Jan Svejnar, and Katherine Terrell, 2007, “When does FDI have positive spillovers?
Evidence from 17 emerging market economies.” IZA discussion paper No. 3079.
Grossman G.M. and E. Helpman, 1991. Innovation and Growth in the Global Economy. Cambridge: MIT Press.
Hale, Galina and Cheryl Long, 2006, “what determines technological spillovers of foreign direct investment:
evidence from China,” Economic Growth Center, Yale university
Hangzhou Economic and Technological Development Zone, 2012, Over view of Hangzhou Economic
Development Zone
Hatzuis, Jan, 2000, “Foreign Direct Investment and Demand Elasticity.” European Economic Review, 44(1): 117-
143
Hicks, J. R., 1932, The Theory of Wage, Macmillan, London
Hu, Albert, G. and Gary Jefferson, 2002, “FDI Impact and Spillover: Evidence from China’s Electronic and Textile
Industries.” The World Economy, 25(8): 1063-1076
Hu, Zhuliu, 2004, “Three Issues on FDI in China.” International Economic Review, Volume 3-4.
Javorcik, Beata S., 2004, “Does Foreign Direct Investment Increase the Productivity of Domestic Firms? In Search
Of Spillovers through Backward Linkages.” American Economic Review, 94(3): 605-627.
Page 126
116
Kokko, Ari, 1994, “technology, market characteristics, and spillover,” Journal of Development Economics, 43(2):
279-293
Kokko Ari, Ruben Tansini, and Mario C. Zejan, 1996, “Local technological capability and productivity spillovers
from FDI in the Uruguayan manufacturing sector”, Journal of Development Studies, 32 (4)
Konings, Jozef, 2001, “The Effect of Foreign Direct Investment on Domestic Firms, Evidence from Firm-level
Panel Data in Emerging Economies.” Economic of Transition, 9(3): 619-633.
Kugler, Maurice, 2006, "Spillovers from foreign direct investment: Within or between industries?" Journal of
Development Economics, 80(2).
Lin, Ping, Zhoumin Liu, and Yifan Zhang, 2009, “Do Chinese Domestic Firms benefit from FDI inflow? Evidence
of Horizontal and Vertical Spillovers.” China Economic Review, 20(4): 677-691.
Liu, Zhiqiang, 2002, “Foreign Direct Investment and Technology Spillovers: Evidence from China.” Journal of
Comparative Economics, 30(3), 579-602.
Liu, Zhiqiang, 2008, “Foreign Direct Investment and Technology Spillovers: Theory and Evidences.” Journal of
Development Economics, 85(1-2): 176-193.
Long, Guoqiang, 2005, “China’s policies on FDI: Review and Evaluation”, Chapter 12 of “Does Foreign Direct
Investment Promote Development,” edited by Theodore H. Moran, Edward Montgomery Graham, and
Magnus Blomström, Peterson Institute.
Lopez-Cordova , J. Ernesto, 2003, “NAFTA and Manufacturing Productivity in Mexico.” Economía (Journal of the
Latin American and Caribbean Economics Association-LACEA)
Marcin, Kolasa, 2008, “How does FDI inflow affect productivity of domestic firms? The role of horizontal and
vertical spillovers, absorptive capacity and competition.” The Journal of International Trade & Economic
Development, 17(1):155.
Markusen, James and Anthony Venables, 1999, “Foreign direct investment as a catalyst for industrial development.”
European Economic Review 43 (2), 335– 356.
Meng, liang, 2005, “Research on Technology spillovers from FDI in China.” PHD dissertation, Shanghai Jiao
Tong University.
Ministry of Commerce of the People’s Republic of China, 2006, statistical data
Page 127
117
NBS, MOST (National Bureau of Statistics, Ministry of Science and Technology), 2004, China Statistical Yearbook
on Science and Technology, Beijing, China Statistical Press.
NBS (National Bureau of Statistics). 1981-2005. China Statistical Yearbook (1981-2005).Beijing: China Statistics
Press.
Rivera-Batiz, Francisco, Luis Rivera-Batiz, 1990, “The effects of direct foreign direct investment in the presence of
increasing returns due to specialization.” Journal of Economic Development 34 (2): 287–307
Rodriguez-Clare, Andres, 1996, “Multinationals, linkages, and economic development.” American Economic
Review. 86(4): 852– 873.
Stančík, Juraj, 2007, “Horizontal and Vertical FDI Spillovers: Recent Evidence from the Czech Republic,” working
paper series: 340, ISSN: 1211-3298
The management committee of Tianjin Economic and Technologic development zone, 2009, “Tianjin Economic
and Technologic Development Zone’s regulation on introduction and training of talents.”
The People’s Government of Henan Province, 2010, “The views of the people’s government of Henan province on
How to further Improving the utilization of foreign investment”
The people’s Government of Jiangsu Province, 2011, “Further views on verification and approval of foreign-
invested projects”
The People’s Government of Liaoning Province, 2012, “Secure the utilization of foreign capital in 2012 increased
by 15%”
The Shanghai Municipal People’s Government, 2006, “Shanghai will further encourage foreign investment”
Tian, Xiaowen, VaiIo Lo, Shuanglin Lin, and Shunfeng Song, 2011, “Cross-region FDI productivity spillovers in
transition economies: evidence from China,” Post-communist economies, 23(1): 105
Tong, Sarah Y. and AngelaYouxin Hu, 2003, “Do Domestic Firms Benefit from Foreign Direct Investment? Initial
Evidence from Chinese Manufacturing,” mimeo, The University of Hong Kong.
Tybout, James, 2003, “Plant- and Firm-level Evidence on ‘New’ Trade Theories.”E. Kwan Choi and James
Harrigan, ed., Handbook of International Trade, Oxford: Basil-Blackwell.
Woo, Jaejoon, 2009, “Productivity growth and technological diffusion through foreign direct investment,”
Economic Inquiry, 47(2): 226
Page 128
118
Chapter 4
Factors influencing energy intensity in four Chinese industries
4.1. Introduction
Since the onset of economic reforms in 1978, China’s economy has undergone remarkable
growth, with GDP (in constant price) jumping from $364 billion in 1978 to $4,837 billion in
2006, an average annual growth rate of 9.7% (He and Wang, 2007). Such rapid economic
development usually drives up energy usage, but China’s energy intensity, defined as total
energy consumption in physical quantities over real GDP, has steadily declined over the years,
on average 3.6%annually from 1993–2005 (He and Wang, 2007).
The reason behind this energy intensity decline has been widely investigated and is usually
separated into two main contributing factors: structural change and technological change.
Structural change refers to a shift in the sectoral composition of the economy; e.g., a shift away
from heavy industry to light industry. A number of market reforms have been instituted in China
that have had an effect on structural and technological change. In 1998, 21 ministries—
including industrial sector-line ministries that provide macro-planning for each industry sector—
were eliminated by the central government (Naughton 2003). In 2003, the National Development
and Reform Commission (NDRC) was formed to regulate China’s social market economy and to
shift the government’s role more toward market coordination (Naughton 2003). Furthermore, in
order to compete with international markets and to capture the benefits of scale economies,
China’s state council implemented industrial policies focused on “grasping the large, letting go
the small” (Sutherland 2003). As a result of these policies, selected enterprises in 57 targeted,
Page 129
119
state-owned industrial groups received preferential treatment, including the allocation of a
greater share of state assets within their respective groups, and targeted investment to improve
R&D capabilities via a closer relationship with state research institutions. Many empirical
studies have investigated whether these policies have contributed to the decline of energy
intensity in China. Fan, Liao, and Wei (2007) provide empirical evidence that suggest that these
reforms have made a significant contribution to the improvement of China’s energy efficiency.
Fisher-Vanden (2009) also argues that China’s transition to a market economy has induced a
large decline in energy intensity. He and Wang (2007) find that economic transition—including
market liberalization, decentralization, and globalization—helps Chinese enterprises improve
energy efficiency. Lastly, Fisher-Vanden, Jefferson, Liu, and Tao (2004) find that sectoral shift
has improved enterprises’ energy efficiency, with empirical results that indicate that sectoral
shift accounted for almost 50% of the decline in total energy intensity over the period 1997-1999.
Technological change, including subsector productivity changes and R&D input, has proved to
be the most effective factor driving China’s decline in energy intensity after 1979. For example,
shifting from vertical shaft kilns to more efficient rotary kilns accounted for 21% of the total
reduction in CO2emission in 2008 (Rock, 2011). Garbaccio, Ho, and Jorgenson (1999) find
technological change to be the largest factor explaining the decline in Chinese enterprises’
energy intensity from 1987–1992. Liao, Fan, and Wei (2007) find that the efficiency effect
(including technological change and the shift of product-mix at the subsector or firm level)
contributed more than structural change to the decline in China’s energy intensity. Ma and Stern
(2008) find technological change to be the most important factor in reducing the energy intensity
of Chinese enterprises from 1980–2003.He and Wang (2007) also show that foreign direct
investment can induce reductions in energy intensity among Chinese enterprises.
Page 130
120
Rising energy costs throughout China have also induced energy savings. By 1999, the allocation
of energy through the state plan was almost totally eliminated (Fisher-Vanden et al. 2004),
causing state-owned enterprises to face world prices for energy at the margin. This shift from
plan-market allocation to market-oriented allocation has led to an increase in energy prices,
especially for state-owned enterprises. Fisher-Vanden et al. (2004) find that rising energy prices
contributed significantly to the decline of firm-level energy intensity, with54.4% of the decline
in aggregate energy-use explained by rising energy costs. Hang and Tu (2007) find that higher
energy prices helped to decrease the intensity of aggregate energy up until 1995; after 1995,
however, the effects were negligible or even non-existent.
In this paper, we investigate the factors explaining the decline in energy intensity in four Chinese
industries: Pulp and Paper; Cement; Iron and Steel; and Aluminum. There are many studies
specifically on Chinese industry; e. g., Wei, Liao, and Fan (2007), Garbaccio, Ho, and Jorgenson
(1999), Ma and Stern (2008), Zheng, Qi, and Chen (2011). Wei, Liao, and Fan (2007) show that
the China’s iron and steel industry has increased its energy efficiency by 60% from 1994–2003,
while the variations in energy efficiency across firms in China’s iron and steel sector has become
larger during the same period. However, unlike our study, these past studies employ industry-
not firm-level data and are therefore unable to examine what is happening at the firm-level.
In this paper, we utilize a unique set of firm-level data from China’s most energy-intensive large-
and medium-size industrial enterprises in each of these four industries over a six-year period,
1999–2004. We empirically examine to what extent China’s energy-saving programs,
liberalization of domestic markets, and openness to the world economy contribute to the decline
Page 131
121
in energy intensity within these industries. We estimate firm-level energy intensity on factors
such as energy prices, research and development expenditures, region, and ownership type,
expecting that higher energy prices, R&D (including process innovation and product innovation),
more openness to world markets (including regional location), and ownership reform have
contributed to the decline in energy intensity in these four industries.
We find rising energy prices to be one of the main factors explaining the decline in energy
intensity in these industries. Policy of “gasping the large, letting go off the small” is another
important factor in the decline. However, unlike these two factors which contribute to all four
industries in decline in energy intensity, R&D expenditure and openness to the world only help a
couple of industries to improve their energy efficiency, as are regional and ownership differences.
The Northern and Eastern regions of China increased their energy efficiency more than the South
in the Pulp and Paper industry. In the Cement industry, energy intensity in the North, East, and
South decreased more than the energy intensity in Southwest. In the Iron and Steel industry,
energy intensity in the South and Southwest fell more than in the North, and East.
The paper is organized as follows. Section II of the paper provides the energy consumptions and
development policies in these four industries. Section III provides a literature review that
summarizes previous work on the analysis of China’s energy intensity decline, including
investigations on specific industries and the overall economy. Section IV discusses the dataset
used in this analysis and section V presents our estimation model specification. Section VI
discusses the empirical results and offers interpretation. Section VII discusses the robustness test.
Section VIII provides future research plans and Section IX offers concluding remarks.
Page 132
122
4.2: Energy consumptions and Development Policies in four Chinese industries
Overview of four industries:
We chose these four industries because they lead the nation in energy consumption and,
combined, they comprise a large share of China’s industrial output. For example, the share of
industrial output from the top ten Chinese cement firms has increased from 4% in 2000 to 13.5%
in 2005 (Kang 2007). In 2007, energy consumption in the Cement industry accounted for 5.6%
of China’s total energy consumption (Cai et al. 2011). China’s Iron and Steel industry became
the largest producer of crude steel in the world in 1996 (Wei et al. 2007) and, more recently, has
become the largest energy consuming sector in the nation. According to Dao (2010), this
industry accounts for approximately 11% of China’s total energy consumption in 2010. Of the
different types of energy utilized in the iron and steel industry, coal and gas comprise 47% of
total energy consumption (Dao 2010).
In recent years, these industries have improved their energy efficiency; e. g., energy intensity in
the Cement industry fell by 10.2% between 2002 and 2007 (Cai et al. 2011). The energy
intensity of large- and medium-sized enterprises in the Iron and Steel industry decreased by
almost 50% between 1990–2006 (Dao 2010). While the output of China’s Paper industry grew
by 100% from 1995–2005, energy consumption per unit of output fell by 60% over the same
period (Zhang et al. 2008). Over the period 2001-2006, energy consumption per unit of Alumina
product and Primary Aluminum fell by 24.1% and 3.21%, respectively.19
Policies in four industries:
Since the onset of economic reform in late 1970s, China government has issued many policies
forwarding this reform in these four industries, such as industrial development strategy based on
19
The statistical data by Aluminum Corporation of China, a backbone state-owned enterprise in China Aluminum
industry
Page 133
123
policy of “grasping the large, letting go of the small”(Sutherland 2003).The aim of this
consolidation is to improve energy efficiency, lower emissions, reduce output and eliminate
excess capacity and improve enterprises’ technological capabilities so they can autonomously
innovate.
Based on the idea of “grasping the large, letting go off the small”, China state actors believed it
is necessary and feasible to create large state-owned enterprises that can compete with OECD
multinationals. To carry out this scheme, China policies makers endow the core enterprises in
each 57 state-owned industrial groups with favored access to state bank finance and state
research institutes, such as more independence to manipulate state assets and greater opportunity
to take advantage of state research institutes to improve their R&D capabilities (Sutherland
2003).
In the Pulp and Paper industry, in order to reduce the number of small paper enterprises, China
state council issued “Decision of the State Council on Several Issues Concerning Environment
Protection” in 1996, which required 15 kinds of heavy polluting small enterprises to be closed
before September 30, 1996. By May 31, 1997, 5933 small paper mills were closed, which
accounts for 92.3% of total small enterprises scheduled for closure (Wang, Jinnan, Shoumin Zou,
and Yaxiong Hong 2006). Furthermore, “Technical Policy for Pollution Prevention of
Wastewater from Straw Pulp Papermaking Industry”-- issued by the Ministry of Environmental
Protection--set the end of 2000 to be the final deadline for paper enterprises to meet the new
discharge standard and to close all the chemical pulp mills with output less than 5000 metric tons
per year. Rock and Song (2011) found that there is a big drop in the number of Pulp and Paper
Enterprises, from 12000 in year 1993 to 5000 in year 1999. As a result of these policies, many
Page 134
124
large integrated pulp and paper producers emerged, which have the similar production scale as
OECD multinationals.
In the Cement industry, as a result of “grasping the large, letting go of the small” policy, the
production share of large rotary kilns-based plants has reached nearly 62% of total cement
production in 2008. Furthermore, top 25 publicly listed enterprises with cement as their main
product account for 25% of total cement production. (Kang 2007)
In the Iron and Steel industry, it is expected that the top 10 steel producers will account for 50%
of steel production by 2010, and70% by 2020. Moreover, two of the top 10 firms in the industry
will be expected to produce at least 30 million metric tons each while several others will each
produce 10 million metric tons. The number of large scale firms which producing more than 5
million metric tons rose from 8 in 2002 to 15 in 2004 (Brandt et al. 2008). The production share
of these large firms rose from 36.7% in 2002 to 40% in 2004 (Brandt et al. 2008).
In the Aluminum industry, the policy of “grasping the large, letting go off the small” prohibited
the new establishment of small aluminum plants. Small primary aluminum producers with
backward technologies were forced to close. In terms of alumina products, 6 largest alumina
producers almost produced all of China’s 6 million metric tons of alumina in 2003. In 2005, 15
largest aluminum producers accounted for 45% of the production with 10 largest of them
accounts for 34% of the production. (Rock and Wang 2011)
In addition to the policy of “grasping the large, letting go off the small”, beginning from early
1980s, China government established energy intensity standards in a wide range of industrial
sectors. Firms which fail to meet the standards either were forced to pay higher prices for energy
Page 135
125
used above the standards or were forced to close. Except these mandatory requirements, China
government created a large number of energy conservation centers to help firms improve their
energy efficiencies. (Sinton et al 1998)
Except these sector-common policies, some sector-specific policies may contribute to the decline
in energy intensity in these four industries. In the Pulp and Paper industry, China government
encourages the input structure to be more energy efficiency. Listed in China’s Tenth Five Year
Plan (2001-2005), raw materials for paper industry were encouraged shift from straw and reed
pulp to wood pulp and wastepaper pulp. Non-wood pulp drop from 48.5% of total pulp
production in 1994 to 15.7% in 2008, while wood pulp and wastepaper pulp rose from 24.7%,
22.8% in 1985 to 31%, 53.4% in 2008, respectively. (Rock and Song 2011)
In the Cement industry, China government regulated its policies to provide cement producers
with five broad technical and technological opportunities: A. Improving fuel efficiency of kilns
by retrofitting existing vertical shaft and rotary kilns or replacing them with larger and more
efficient rotary kilns. B. Burning alternative fuels in kilns. C. Decreasing electricity use in raw
materials preparation and in the grinding of clinker D. Shifting to blended cement. E. Recovering
heat in the production process to generate electricity. (Rock, 2011)
In the Iron and Steel industry, government encouraged producer to reduce the iron to steel ratio
by shifting to electric arc furnaces, to replace beehive coke ovens with modern advanced coke
ovens, and to adopt advanced sintering machine. (Rock and He, 2011)
In the Aluminum industry, China government requires aluminum produce technology to be the
more efficient pre-baked cell production technology. Enterprises with soderberg in-situ baked
Page 136
126
cells that could not meet the environmental standards are force to close by the end of 1999. All
other in-situ baked cell facilities are required to close by the end of 2005. (Rock and Wang, 2011)
4.3 Literature Review & Research Hypotheses
Over the past ten years, Chinese industry has made substantial energy efficiency improvements
through the implementation of market reforms. For example, Fisher-Vanden et al. (2004) point
out that there has been a nearly 70% decline in Chinese energy intensity during the 1980s and
90s. They argue that market-oriented reforms are one of the main reasons behind this decline.
Fan, Liao, and Wei (2007) estimate changes in own-price elasticity and elasticities of
substitution between energy, capital and labor, and find that accelerated market-oriented reforms
have contributed significantly to the decline of energy intensity since 1993. He and Wang (2007),
using panel data on energy intensity across 30 Chinese provinces from 1998–2005, examine the
relationship between economic transition—including market liberalization, decentralization, and
globalization—and the decline in energy intensity among Chinese enterprises. Their empirical
results show that economic transition made a substantial contribution to the decline in energy
intensity.
Rising energy prices are another important factor. As Fisher-Vanden et al. (2004) show, rising
energy prices have contributed significantly to an intensity decline across several types of energy.
Hang and Tu (2007) estimate energy-price elasticities to evaluate the effects of changes on
aggregate energy intensity. For each type of energy, their results show that rising energy prices
have led to a decline in energy intensity.
Page 137
127
Research and development activities have also helped China’s enterprises reduce energy
intensity. Since the late 1990s, the Chinese government has privatized R&D institutes. As a
result of these policies, commercial R&D expenditures as a share of China’s total R&D
expenditures has risen from 32% in 1994 to 60% in 2000 (Fisher-Vanden 2009). This increase in
expenditures tends to lead to more efficient production technologies and, therefore, reduced
energy intensity. Garbaccio, Ho, and Jorgenson (1999) find that technical change rather than
structural change explains most of the decline in China’s energy intensity from 1987–1992.
Using logarithmic mean Divisia index techniques to examine changes in energy use per unit
from 1980–2003, Ma and Stern (2008) also find technical change to be the most important factor
explaining the decline.
Foreign direct investment (FDI) has also contributed to the decline in energy intensity. Fisher-
Vanden et al. (2004) find the energy intensity of foreign firms in China, on average, to be lower
than that of local firms. Empirical results in Fisher-Vanden et al. (2009) show that spillover
effects of FDI tend to save energy. He and Wang (2007) also provide empirical evidence to
suggest that foreign capital has had an effect on lowering the energy intensity of Chinese
enterprises.
This paper will contribute to the literature in a number of ways: First, except for Fisher-Vanden
et al (2004), previous studies examining China’s decline in energy intensity have been at the
sector or regional level. Like Fisher-Vanden et al (2004), we will utilize a dataset of Chinese
enterprises in order to examine what factors are improving energy efficiency at the firm level.
Second, we extend the analysis of Fisher-Vanden et al (2004) by (a) focusing on a longer time
period (1999-2004) over which a number of policies related to energy efficiency have occurred
Page 138
128
and (b) focusing on four specific industries which will allow us to examine how the impacts of
common industrial policies on individual industry differ.
Based on this review of the literature, there are a number of hypotheses that emerge which we
will test in this paper:
Hypothesis #1: Fisher-Vanden et al. (2004) find that rising energy prices have resulted in
decreased energy intensity. Prior to the mid-1980s, energy prices were set by the central
government. In the early 1980s, tiered pricing systems were introduced where firms were
required to sell up to a predetermined quota at government set prices but were allowed to sell
above the quota at market prices. To a large extent, quotas were removed and energy prices were
liberalized as part of sweeping price reforms initiated in 1993. As a result, relative energy prices
have risen dramatically over the last 30 years. Based on this, we expect that higher energy prices
will have a negative and significant effect on energy intensity. Moreover, since NonSOE firms
are more likely to be market-oriented than SOE firms, we expect that NonSOE firms will have a
bigger decline in energy intensity than SOE firms in response to the higher energy price.
Hypothesis #2: we expect that China’s increasing openness to the world market—as evidenced
by China’s accession to the World Trade Organization in 2001—will also be an important factor
(such as intensified competition effect and more channels to obtain advance technologies) to
firm-level energy efficiency improvements in these four industries.
Hypothesis #3: In their study of the cement industry, Worrel et al. (2008) find that shifting from
vertical shaft kilns to rotary kilns (a more efficient technology) and shifting to blended cement
together accounted for a 21% CO2 emissions reduction in 2008. In the previous section, we
mentioned that in the Cement industry, China government regulated its policies to provide five
broad technical and technological opportunities to cement producers such as improving fuel
Page 139
129
efficiency of kilns by retrofitting existing vertical shaft and rotary kilns or replacing them with
larger and more efficient rotary kilns. Based on these observations, we expect that R&D
activities, including process innovation and product innovation, contribute significantly to
reductions in energy intensity.
Hypothesis #4: Facing the rise of energy price, firms have many strategies to response. One way
is to increase the R&D expenditure to increase energy efficiency. Fisher-Vanden and Ho (2010)
quoted that R&D intensity of China (R&D expenditures/ GDP) has risen from 0.6 in 1996 to 1.3
in China. Therefore, we expect that the effect of the interaction terms between energy price and
R&D is increasing the energy efficiency.
Hypothesis #5: Foreign direct investment (FDI) usually brings advance technologies and
managerial skills to the host countries, therefore increases their firms’ energy efficiency. For
example, Mielnik and Goldemberg(2002) find that developing countries with higher foreign
direct investment had clearer declines in energy intensity. So we expect FDI will make a
contribution to the increase in energy efficiency in these four industries.
Hypothesis #6: Firms with higher R&D usually have bigger adaptive capacities20
, therefore can
attract and utilize FDI more efficiently. Based on this point of view, we expect the interaction
term between R&D and FDI helped these four industries to reduce energy intensity.
Hypothesis #7: Since large enterprises have advantages over small enterprises—and also benefit
from economies of scale—we expect that China’s policy of “grasping the large, letting go of the
small”, which is discussed in our previous section, will help large enterprises in these four
industries to decrease energy intensity.
20
For example, Kinoshita (2001) found that learning effect of R&D is more important than the innovation effect
Page 140
130
Hypothesis #8: Fisher-Vanden et al. (2004) find that foreign-owned enterprises experience larger
declines in energy intensity. Therefore, we expect foreign-owned enterprises in these four
industries to experience greater improvements in energy efficiency than enterprises of other
ownership types.
Hypothesis #9: Since the onset of economic reform in 1979, the industrial structure in China has
become more regionalization, with variation in the implementation of market reforms and
exposure to international markets across regions. Given this, we expect the more developed
regions, such as North and East, to experience a larger decline in energy intensity.
4.4. Data
The data set used in our analysis is the combination of three firm-level data sets collected by
China’s National Bureau of Statistics. The first dataset consists of economic and financial
variables, comprising around 22,000 large- and medium-sized industrial enterprises. The second
dataset consists of science and technology variables, comprising the same number of enterprises.
The third dataset is an energy data set that only includes the most energy intensive enterprises,
approximately 1500.
To create a balanced dataset, we drop any firm that does not report for all years. Missing years
often occur when the size of a firm shrinks below the large and medium threshold, or a firm
experiences a change in ownership due to industry reform, mergers, or changes in a firm’s
location. Many firms are missing at least one year between 1995 and 2004, and in order to
maintain the continuity of data, we had to drop these firms from the study. Our final balanced
dataset consists of 2,000 firms per year from 1995–2004, or 20,000 observations in total.
Page 141
131
We then combined this combined economic and science and technology dataset with the energy
dataset, which includes measures of approximately 20 individual energy types and aggregate
measures of both the value and physical quantity of energy consumption. The number of
observations was further reduced, largely for two reasons: (1) the energy dataset focuses only on
the most energy-intensive enterprises, and (2) it only covers 1999–2004 while the economic and
technology merged dataset covers the period 1995-2004. Although the data set is significantly
reduced, total energy consumption in our balanced dataset comprises a significant portion of the
total energy consumption of each industry. For example, total energy consumption of the
enterprises in our merged dataset accounts for 40% of total industrial energy consumption in
1999.21
Most variables used in the analysis are included in the original data set. However, a few variables
had to be constructed, such as the R&D stock variable:
KR,i,t = (1-δ)KR,i,t-1 + IR,i,t-1
where
KR,i,t ≡ R&D stock of firm i at time t;
IR,i,t-1 ≡ R&D expenditures of firm i at time t-1; and
δ ≡ depreciation rate (assumed to be 15%).
The NBS data set provides the flow of technology development expenditures over the period
1995-2004. We estimate the R&D stock in the initial year 1995as follows:
KR,i,1995 = IR,i,1995 / (δ+γ)
21
National Bureau of Statistics of China, 2000.
Page 142
132
where γ is the growth rate of IR estimated as the average annual growth rate of the 2-digit
industry of firm i over the period 1995-2004.
Obviously, after narrowing our merged dataset to the four industries that we are considering in
this analysis, we lose a considerable number of firms. Specifically, we have 49 firms and 294
observations for the Pulp and Paper industry; 115 firms and 690 observations for the Cement
industry; 70 firms and 420 observations for the Iron and Steel industry; and 27 firms and 162
observations for the Aluminum industry. China’s National Bureau of Statistics classifies
enterprises into seven ownership types—state-owned, collective-owned, HKMT (Hong-Kong,
Macao, and Taiwan), foreign, shareholding, private, and other—and six regional locations: North,
Northeast, East, South, Southwest, and Northwest. In Tables 4.1 and 4.2, we list the respective
ownership distribution and regional distribution of each industry in our dataset. In all four
industries, most enterprises are either state-owned or shareholding, and are located in the South
or, in particular, the East where more than half of the total number of firms in the dataset reside.
Table 4.3 provides a breakdown of foreign capital and R&D stocks. We find that the Cement
industry has the highest foreign capital intensity while the Iron and Steel industry has the highest
R&D intensity.
4.5. Model Specification
The estimation equations used in this analysis are derived from cost minimization, assuming the
following Cobb-Douglas cost function:
( )
where C is cost, Q is the quantity of output, PK is the price of capital input, PL is the price of
labor input, PE is the price of energy input, PM is the price of material input, is the elasticity of
Page 143
133
input X (X=capital, labor, energy, material), and ∑ . A is the total productivity
term defined as:
( ( ) ∑
∑
∑
( ))
Where RDE is R&D expenditure; Tt represents the time dummies from 1995–2004, which
capture the autonomous change of energy intensity in each year; OWNi is the ownership dummy;
REGk is the regional dummy; FCI is the foreign capital intensity
From Shephard’s Lemma, we know that the factor demand for an input is equal to the derivative
of the cost function with respect to the input price. Deriving the factor demand for energy:
If we assume
, then the above formula can be rewritten as:
Combining with the expression for A, and taking the log of both sides, we obtain the following
estimation equation:
(
) ( ) ∑
∑
∑
( ) (
)
We estimated this model both as a pooled regression and including firm fixed effects.
We did a correlation test on R&D expenditure and energy price to check whether these two
variables are correlated. The results show that correlation coefficients are 0.039, 0.053, 0.091,
and -0.043 in Pulp and Paper industry, Cement industry, Iron and Steel industry, and Aluminum
industry, respectively. So R&D expenditure and energy price are not correlated in our dataset. In
Page 144
134
order to investigate how the energy price affects firms’ decisions on R&D expenditure, we add
the interaction term between energy price and R&D expenditure to obtain a new equation:
(
) ( ) ∑
∑
∑
( ) (
)
(
) ( )
However, since dependent variable in the above regression is the log of energy intensity, we
automatically assume each firm is constant returns to scale in energy consumption. This
approach left out the scale effect, which should be an important factor in improving energy
efficiency in our targeted four industries. In order to remedy this shortcoming, we estimated
another regression equation:
( ) ( ) ( ) ∑
∑
∑
( )
(
) (
) ( )
where s captures the scale effect.
4.6. Results and Interpretation
Our main results are obtained through balanced dataset, which consists of firms’ each year
observation over the period 1999-2004. The shortcoming of this approach is that we lost a lot of
observations after we converted original unbalanced dataset to be balanced dataset22
, and smaller
sample size will be likely to lead to biased empirical results. Therefore, in the next section we
provide the results using the revised-unbalanced dataset. The revised-unbalanced dataset is
obtained by dropping all the firms that only have one year observation over the period 1997-
2004 out of the original unbalanced dataset. As listed in Table 4.4, firms with only one year
22
Our unbalanced dataset consists of 7934 observations, while the balanced dataset only have 1548 observations
Page 145
135
observation are mostly reported in year 2004. The possible explanation is that many small firms
may miss other years’ report but not allowed to in year 2004, which happened to be one of the
census year in China. The relative small sizes of these firms are confirmed by Table 4.5. For
example, the mean of gross value industrial output of firms in balanced dataset is 5 times of that
in unbalanced dataset. Our research object is focusing on the impact of government policies and
market factors on these industries’ energy consumption, and large size firms are the main energy
consumers23
. There we drop these firms with only one year observation out of our unbalanced
dataset to become the revised-unbalanced dataset. However, not each firm in the unbalanced
dataset continuously reported year by year over the period 1997-2004, we are not able to
construct the R&D stock for each firm. R&D flow is our only choice to represent the technology
development expenditure. However, endogenous problem will emerge if we use the R&D flow
as a proxy for firm’s technology development expenditure. Therefore, results on unbalance
dataset only used as supplements to our main results.
As reported in Table 4.6, the coefficient on relative energy price is negative and significant in the
pooled effect regression for the Pulp and Paper industry, Cement industry, and Iron and Steel
industry. This implies that higher energy prices induce a decline in energy intensity in these four
industries. As shown in Table 4.7, after we use the fixed effect estimator, this coefficient is still
negative but no longer significant in the Pulp and Paper industry and Cement industry. Firm-
specific characteristics that are correlated with the relative energy price may account for this
change. Table 4.8 and Table 4.9 show that, if we aggregate four industries together, the
coefficient of energy price for NonSOE firms has a larger magnitude than the counterpart of
SOE firms. This is consistent with Hypothesis #1. This feature holds for the Cement industry and
23
Fisher-Vanden et al (2009) shows that the firms in balanced dataset use 40% of total energy consumption in all
industries
Page 146
136
Iron and Steel industry. Unlike SOE firms, which can buy portion of their energy inputs at
government set price in early 1990s, NonSOE firms usually faced the market price directly.
Higher energy price pushed them to take more efforts in improving the energy efficiency.
Another interesting result is that energy price has a larger impact on the energy efficiency for all
four industries over the period 2002-2004 than the impact over the period 1999-2001. Table 4.10
and Table 4.11 exhibit that the coefficient of energy price over the period 2002-2004 is as one
and half times that over the period 1999-2001if we aggregate four industries together. This
improvement in energy efficiency over two periods is benefited from the more openness of
Chinese market through the access to WTO in 2001, which is consistent with Hypothesis #2.
In the Iron and Steel industry, the coefficients on year dummies show that firms receive greater
and significant declines in energy intensity in years 2003 and 2004 than previous years. This
result suggests that China’s increased openness to the world (due, for example, to China’s
accession to the WTO in 2001) may contribute to the decline in energy intensity of firms in the
Iron and Steel industry in China. This is another evidence to support our Hypothesis #2.
R&D expenditure has a significant energy saving effect in the Cement industry. In the Iron and
Steel industry and Aluminum industry, the energy-saving effect of R&D expenditure is
significant only over the period 2002-2004. Therefore, Hypothesis #3 is confirmed in the Cement
industry and partially supported by the other two industries. We expect that there is R&D
expenditure difference between the Cement industry and other three industries. As shown in
Table 4.3, we find the Cement industry has the lowest ratio of R&D stock over total stock while
the highest ratio of foreign capital stock over total stock. Highest ratio of foreign capital stock
over R&D stock may help R&D in the Cement industry works most efficient among these four
industries.
Page 147
137
Table 4.6 shows that the coefficient for the interaction term between R&D and energy price are
negative and significant only in the Cement industry. This implies that firms increase R&D
expenditure to improve firms’ energy efficiency to overcome the rise cost caused by the
increasing energy price. Therefore, Hypothesis #4 is confirmed in the Cement industry.
As shown in Table 4.6, FDI increases the energy intensity in the Iron and Steel industry and
Aluminum industry, likely the result of the small number of firms in our dataset. This result is
contradicted with Hypothesis #5. However, in the Pulp and Paper industry, FDI in SOE firms
robustly reduces their energy intensity.
In the Iron and Steel industry, the coefficient of interaction term between R&D and FDI is
negative and significant. This means that firms with higher R&D expenditure can employ FDI
more efficiently to lower energy intensity. So Hypothesis #6 is confirmed.
As shown in Table 4.12, there is a significant decreasing returns to scale effect for the energy
consumption in all four industries. This implies that firms with larger output gain higher energy
efficiency. Therefore, the policy of “grasping the larger, letting go of the small” helps these four
industries to reduce the energy intensity through closing the small size firms. Hence, Hypothesis
#7 is confirmed.
Another interesting finding is that this scale effect varies over two different periods. Table 4.13
and 4.14 report that for the Pulp and Paper industry, Cement industry, and Aluminum industry,
firms have larger decreasing returns to scale effects over the period 2002-2004 than the effects
over the period 1999-2001. The possible reason for this feature is due to the implementation of
“grasping the larger, letting go of the small” policy in early 1990s; by the time that China joined
in WTO in 2001, most of small firms were closed and the remaining larger firms exhibited
Page 148
138
higher decreasing returns to scale than if there were a combination of coexisting small and large
size firms.
As shown in Table 4.6, we find the evidence of ownership type affecting the decline in energy
intensity. For example, in the Cement industry, Iron and Steel industry, and Aluminum industry,
foreign firms experience a larger decline in energy intensity that state-owned firms. This feature
holds if we pool four industries together to be a combined one. This result is consistent with
Hypothesis #8. The possible explanation for this result is that Chinese firms still lack behind
foreign firms in a wide range of aspect over the period 1999-2004, such as managerial skills and
technologies. These factors are important in determining the decline in energy intensity.
There are also regional differences in energy intensity in the Pulp and Paper industry: the
Northern and Eastern regions of China lowered their energy intensity more than the Southern
region. This result is consistent with Hypothesis #9. In the Cement industry, the East experiences
the greatest decline in energy intensity among China’s six regions. Varying levels of economic
development, R&D activities, and government policies may account for this difference.
Looking back at our hypotheses, Hypothesis #1 and #7 holds in the results of all four industries,
Hypothesis #2 holds in the Pulp and Paper industry, Cement industry, and Iron and Steel industry,
and Hypothesis #8 holds in the case of the Cement industry, Iron and Steel industry, and
Aluminum industry. Also, Hypothesis # 9 holds in the Pulp and Paper industry and Cement
industry. However, Hypotheses #3 and #4 only hold in the Cement industries, Hypothesis #6
only holds in the Iron and Steel industries, and Hypothesis #5 only holds for the SOE enterprises
in the Pulp and Paper industry.
Page 149
139
4.7. Robustness Analysis
Due to the limitation of our small sample size, the robustness of several variables is not
confirmed by our main results. So we think it is necessary to conduct further robustness test on
our key variables. We carry out the test in four different directions. First, we use the fixed effect
estimator to check whether the robustness of independent variables change if we include the
firm-specific characteristics in our regression equation. Second, we pooled the four industries
data together to generate a combined dataset and see how the robustness of our key variables
changes if we run the regression on the new dataset. Third, we run our pooled regression on the
unbalanced dataset to determine how the sample size affects our result. Finally, we change our
model specification to be non-constant returns to scale function form and investigate whether the
variables will still be robust if we explicitly include the scale effect.24
We begin with a test on the robustness of the variable of relative energy price. Results using
fixed effect estimator show that the coefficient stays negative and significant for the Iron and
Steel industry, negative but not significant for the Pulp and Paper industry and Cement industry.
However, if we run the fixed effect regression on the data which pooled four industries together,
the coefficient turns out to be negative and robust. Therefore, we suspect that the small sample
size may erase the robustness of this variable. We test this by run regression on unbalanced
dataset (both pooled effect and fixed effect). Results turn out to be very inspiring. Pooled effect
regression results confirm the robustness of the variable of relative energy price in all industries,
as are the fixed effect regression results except for the Aluminum industry. The regressions we
run so far use energy intensity as the dependent variable, which automatically assume the
constant returns to scale function form. Therefore we wonder that whether the robustness of this
24
Results on unbalanced dataset and results using non-constant returns to scale are available upon request.
Page 150
140
variable still stands if we add the scale effect by assuming the non-constant returns to scale
function form. New results on balanced dataset keep robustness for the variable of relative
energy price in all four industries except the Aluminum industry and results on unbalanced
dataset stays significant for this variable in all four industries.
The scale effect stays significant even if we use the fixed effect estimator in all four industries.
The variable of R&D expenditure is only robust in the Pulp and Paper industry. We suspect that
the small sample size may lead to this unexpected feature. Therefore, we rerun the regression on
the combined dataset.25
The result meets our expectation that the R&D expenditures
significantly reduce the energy intensity in these four industries. The same thing happens for the
interaction term between R&D and energy price.
Most unexpected result is related with the variable of foreign capital intensity. Among four
industries, none of the coefficient is significant energy reduction. There are two reasons may
account for these features. One is we add the interaction term between R&D and foreign capital
intensity in the regression equation. This extra term may weaken the robustness of foreign capital
intensity in our results. Therefore we run a regression that excludes the interaction term.
However, the new results don’t have essential changes—the variable of foreign capital intensity
stays non-significant for the Pulp and Paper industry, Cement industry, and Iron and steel
industry.26
The other reason causing the variable of foreign capital intensity to be no significant
is the small size of our balanced dataset. Therefore, we re-estimate the coefficient on the
unbalanced dataset. As we expected, foreign capital intensity significantly reduce the energy
intensity in the Pulp and Paper industry and Cement industry.
25
The unbalanced dataset is not suitable for this test since we are not able to obtain R&D stocks for unbalanced
dataset. 26
Results are available upon request.
Page 151
141
In conclusion, the robustness of many variables, such as relative energy price and value of
industry output which are already significant in our main results, was reinforced by our
complementary results. Some other variables that are not significant in our main results were
found to be significant if we adopt a larger size dataset.
4.8. Conclusion
Energy intensity in four Chinese industries—Pulp and Paper, Cement, Iron and Steel, and
Aluminum—has decreased continuously over the last 30 years. Many factors, including rising
energy costs, increased research and development activity, market-oriented reforms, and imports
of foreign technology, are possible factors explaining this decline. In this paper, our empirical
results show that, in all four industries, rising energy prices and policy of “grasping the large,
letting go off the small” have substantially induced declines in firm-level energy intensity.
Similarly, increased investments in research and development in Cement industries also yield
decreases in energy intensity.
When considering the effect of ownership type on energy intensity in these four industries, our
results are consistent with previous studies on the Cement, Iron and Steel, and Aluminum
industry; e.g., foreign firms in China are usually more energy efficient than state-owned firms.
However, in our analysis, this does not seem to be the case in the Pulp and Paper industry.
Like the regional disparities of economic development in China, changes in energy intensity
within these four industries also display regional heterogeneity. In the Pulp and Paper and
Cement industries, firms in the Eastern regions of China exhibit a greater decline in energy
intensity than firms in other regions. Specific reasons for this difference should be explored in
Page 152
142
further analysis. In the Iron and Steel industry, firms experience large declines in energy
intensity after year 2002. More openness to the world and increased foreign competition may be
the reason behind this result.
Page 153
143
Table 4.1: Firm distribution by ownership type (number of enterprises)
Ownership Pulp and paper Cement Iron and steel Aluminum
SOE (state-owned) 12 45 38 12
COE (collective-owned) 4 12 9 3
HMT (Hong Kong, Macao,
and Taiwan)
7 8 4 2
(Foreign) 7 5 3 2
(Shareholding) 18 36 15 7
(Private) 1 8 1 1
(others) 0 1 0 0
Total 49 115 70 27
Table 4.2: Firms distribution by region (number of enterprises)
Region (provinces) Pulp and Paper industry Cement
Iron and Steel Aluminum
North (Beijing, Tianjin, Hebei,
Shanxi,Inner Mongolia) 5
14 13 4
Northeast (Liaoning, Jilin,
Heilongjiang) 3 12 5 1
East (Shanghai, Jiangsu,
Zhejiang, Anhui, Fujian, Jiangxi,
Shandong)
27 51 36 11
South (Henan, Hubei, Hunan,
Guangdong, Guangxi, Hainan) 14 37 14 6
Southwest (Chongqing,
Sichuan,Guizhou, Yunnan, Tibet) 0 1 2 2
Northwest (Shanxi, Gansu,
Ginghai,Ningxia, Xinjiang)
0 0 0 3
Total 49 115 70 27
Page 154
144
Table 4.3
Intensity of Foreign capital and R&D stocks by industry, 1999-2004
(Relative to total capital stock)
Foreign capital stock R&D stock
1999-
2004
1999 2000 2001 2002 2004 1999-
2004
1999 2000 2001 2002 2004
Pulp and
Paper
13.9% 7.8% 16.2% 16.8% 19.2% 9.5% 36.8% 31% 34.8% 34.4% 36.7% 43%
Cement 20% 22.6% 20% 20.6% 18.8% 20% 4.7% 2.7% 3.4% 3.7% 5.3% 6.9%
Iron and
Steel
1.5% 1.4% 1.1% 1.3% 1.3% 2.5% 38% 40% 32.4% 33.6% 35.9% 35%
Aluminum 4% 7.2% 4.3% 4% 3.8% 1% 15% 6.6% 7.4% 12% 14% 27.5%
Table 4.4: Number of firms during 1997-2004, by missing year observations
Pulp and Paper industry
Cement industry Iron and Steel industry
Aluminum industry
# of firms with no missing year obs
28 58 35 11
# of firms with one missing year obs
24 (8)* 59 (23)* 24 (9)* 14 (3)*
# of firms with two missing years obs
32 114 47 16
# of firms with three missing years obs
45 80 34 7
# of firms with four missing years obs
63 146 52 13
# of firms with five missing years obs
71 171 95 37
# of firms with six missing years obs
153 415 232 64
# of firms with seven missing year obs
517 (405)** 921 (610)** 1597 (1459)** 306 (249)**
* The number inside the parenthesis is the number of firms only miss the report in year 2004
** The number inside the parenthesis is the number of firms only reported in year 2004
Page 155
145
Table 4.5: Comparison of firm sizes in unbalanced dataset and balanced dataset, year 2004
Mean of gross value industrial output of firms in unbalanced dataset
Mean of gross value industrial output of firms in balanced dataset
Pulp and Paper industry 237,508 565,843
Cement industry 132,386 162,739
Iron and Steel industry 619,253 3,538,707
Aluminum industry 504,413 1,386,412
Page 156
146
Table 4.6: Determinants of energy intensity in the four industries (CRS, Pooled Effect)
Dependent
variable=ln(energy/output)
Four industries Pulp and Paper
industry
Cement industry Iron and Steel
industry
Aluminum
industry
Coef. P-value Coef. P-value Coef. P-
Value
Coef. P-
Value
Coef. P-
Value
Constant -0.3196
0.001 -0.8013 0 0.143 0.045 -0.5174 0.052 -1.226 0
Ln(price of energy/price of
output)
-0.5391 0 -0.4112 0 -0.2297 0 -0.7303 0 -0.129 0.48
Ln (R&D expenditure) -0.0396 0 -3.9E-05 0.996 -0.0108 0 -0.0114 0.445 -0.011 0.501
Ln(Price of energy/price of
output)*Ln(R&D expenditure)
-0.0199 0 0.0125 0.202 -0.0081 0.003 -0.0018 0.906 -0.009 0.603
Foreign Capital intensity 0.1264 0.638 -0.5138 0.279 -0.0048 0.984 6.3715 0.013 3.4486 0.022
Foreign Capital
intensity*Ln(R&D expenditure)
-0.0166 0.242 0.0215 0.539 -0.0066 0.597 -0.6037 0.011 0.0152 0.88
Collectives -0.6109 0 0.0435 0.785 -0.417 0 -1.3253 0 -0.137 0.48
Foreign -0.5531 0.002 0.3844 0.095 -0.3889 0.039 -1.1923 0.002 -2.932 0
Hong-Kong, Macao, Taiwan -0.46 0 -0.1459 0.274 -0.0634 0.358 -0.3965 0.106 -1.055 0
Shareholding -0.1981 0 0.1447 0.17 -0.2003 0 -0.3153 0.025 -0.598 0
Private -0.0724 0.551 0.145 0.625 -0.1534 0.026 -1.1842 0.058 -0.774 0.021
Other 0.3063 0.618 (omitted) 0.0748 0.806 (omitted) (omitte
d)
North -0.6237 0 -0.9509 0 -0.264 0 -0.3122 0.188 -0.351 0.193
Northeast (omitted) (omitted) (omitted) (omitted) (omitte
d)
East -0.5403 0 -0.8415 0 -0.4445 0 -0.2796 0.193 -0.841 0.001
South -0.4563 0 -0.4094 0.012 -0.3897 0 -0.518 0.031 -0.677 0.006
Southwest -1.2901 0 (omitted) -0.1151 0.528 -0.6779 0.082 -0.937 0.001
Year 2000 0.0863 0.258 0.0033 0.979 0.0492 0.382 -0.0163 0.928 0.1242 0.451
Year 2001 0.0948 0.215 -0.012 0.924 0.0588 0.296 -0.0543 0.765 0.1212 0.471
Year 2002 0.0222 0.773 0.011 0.931 0.0238 0.675 -0.1498 0.412 0.0799 0.644
Year 2003 -0.0735 0.344 -0.0288 0.823 -0.0171 0.764 -0.3569 0.053 -0.08 0.651
Year 2004 -0.0719 0.362 -0.03 0.818 0.0223 0.703 -0.4386 0.018 -0.12 0.516
R2(obs.) 0.4022 (1528) 0.2469 (290) 0.3144 (677) 0.4149 (418) 0.5962 (143)
Page 157
147
Table 4.7: Determinants of energy intensity in the four industries ( CRS, Fixed Effect)
Dependent
variable=ln(energy/output)
Four industries Pulp and Paper
industry
Cement industry Iron and Steel
industry
Aluminum
industry
Coef. P-value Coef. P-value Coef. P-
Value
Coef. P-
Value
Coef. P-
Value
Constant -2.6141 0 -1.1964 0 -0.1392 0.177 -2.6302 0 -2.174 0
Ln(price of energy/price of
output)
-0.0595 0.003 -0.0127 0.856 -0.0318 0.14 -0.1791 0.022 0.5892 0
Ln (R&D expenditure) -0.0063 0.031 -0.0112 0.132 -0.0008 0.811 -0.006 0.517 -0.018 0.08
Ln(Price of energy/price of
output)*Ln(R&D expenditure)
-0.0046 0.011 0.0014 0.819 0.0004 0.83 -0.004 0.542 -0.06 0
Foreign Capital intensity -0.1535 0.328 -0.0378 0.891 -1.3637 0.182 -0.303 0.875 -3.26 0
Foreign Capital
intensity*Ln(R&D expenditure)
-0.0071 0.585 -0.0466 0.075 -0.1089 0.22 0.0662 0.785 0.2836 0
Collectives -- -- -- -- -- -- -- -- -- --
Foreign -- -- -- -- -- -- -- -- -- --
Hong-Kong, Macao, Taiwan -- -- -- -- -- -- -- -- -- --
Shareholding -- -- -- -- -- -- -- -- -- --
Private -- -- -- -- -- -- -- -- -- --
Other -- -- -- -- -- -- -- -- -- --
North -- -- -- -- -- -- -- -- -- --
Northeast -- -- -- -- -- -- -- -- -- --
East -- -- -- -- -- -- -- -- -- --
South -- -- -- -- -- -- -- -- -- --
Southwest -- -- -- -- -- -- -- -- -- --
Year 2000 -0.0224 0.436 0.003 0.962 0.0145 0.651 -0.0964 0.17 0.012 0.891
Year 2001 -0.0456 0.118 0.0196 0.761 0.0106 0.743 -0.1773 0.016 -0.001 0.99
Year 2002 -0.0744 0.013 0.0057 0.932 0.0063 0.848 -0.2468 0.001 -0.031 0.734
Year 2003 -0.1451 0 0.0061 0.927 -0.038 0.249 -0.4074 0 -0.137 0.148
Year 2004 -0.1613 0 -0.0426 0.533 -0.0147 0.666 -0.4696 0 -0.215 0.029
R2(obs.) 0.9329 (1528) 0.8435 (290) 0.8192 (677) 0.9299 (418) 0.9036 (143)
Page 158
148
Table 4.8: Determinants of energy intensity in the four industries (SOE, CRS, Pooled effect)
Dependent
variable=ln(energy/output) Four industries
(SOE)
Pulp and Paper
industry
(SOE)
Cement industry
(SOE)
Iron and Steel
industry
(SOE)
Aluminum
industry
(SOE)
Coef. P-value Coef. P-value Coef. P-
Value
Coef. P-
Value
Coef. P-
Value
Constant -1.9677 0 -1.8773 0 0.1651 0.088 -0.6023 0.067 -1.034 0.002
Ln(price of energy/price of
output)
-0.4553 0 -1.0257 0 -0.0376 0.338 -0.6904 0.002 -0.56 0.092
Ln (R&D expenditure) -0.0372 0 0.0545 0.01 0.0018 0.622 -0.0092 0.658 -0.047 0.075
Ln(Price of energy/price of
output)*Ln(R&D expenditure)
-0.0216 0 0.0611 0.002 0.0009 0.801 0.0003 0.989 0.0397 0.282
Foreign Capital intensity -2.4650 0.04 -1.8239 0.091 -18.946 0.107 -199.339 0.341 (omitte
d)
Foreign Capital
intensity*Ln(R&D expenditure)
0.0299 0.783 -0.0831 0.35 -1.5012 0.142 18.627 0.335 0.4117 0.252
Collectives (omitted) (omitted) (omitted) (omitted) (omitte
d)
Foreign (omitted) (omitted) (omitted) (omitted) (omitte
d)
Hong-Kong, Macao, Taiwan (omitted) (omitted) (omitted) (omitted) (omitte
d)
Shareholding (omitted) (omitted) (omitted) (omitted) (omitte
d)
Private (omitted) (omitted) (omitted) (omitted) (omitte
d)
Other (omitted) (omitted) (omitted) (omitted) (omitte
d)
North 1.1595 0.001 -0.4153 0.064 0.0059 0.952 -0.1281 0.619 -0.622 0.081
Northeast 1.4381 0 (omitted) (omitted) (omitted) (omitte
d)
East 1.2714 0 -0.1712 0.516 -0.3748 0 -0.2601 0.276 -0.904 0.002
South 1.3147 0 0.2137 0.313 -0.1953 0.014 0.1014 0.706 -0.575 0.043
Southwest (omitted) (omitted) (omitted) (omitted) -1.021 0.003
Year 2000 0.1013 0.356 -0.1233 0.487 0.0297 0.679 -0.0027 0.99 0.2326 0.377
Year 2001 0.0212 0.849 -0.0926 0.603 0.0295 0.687 -0.1779 0.44 0.2772 0.288
Year 2002 -0.0556 0.626 -0.1843 0.299 0.0445 0.559 -0.2505 0.281 0.2887 0.283
Year 2003 -0.1790 0.13 -0.1531 0.41 0.0775 0.325 -0.5579 0.021 0.134 0.629
Year 2004 -0.1114 0.358 0.1405 0.468 0.1151 0.155 -0.5663 0.023 -0.101 0.728
R2(obs.) 0.3278 (636) 0.6112 (70) 0.1821 (270) 0.3233 (227) 0.3908 (69)
Page 159
149
Table 4.9: Determinants of energy intensity in the four industries (NonSOE, CRS, Pooled effect)
Dependent
variable=ln(energy/output) Four industries
(NonSOE)
Pulp and Paper
industry
(NonSOE)
Cement industry
(NonSOE)
Iron and Steel
industry
(NonSOE)
Aluminum
industry
(NonSOE)
Coef. P-value Coef. P-value Coef. P-
Value
Coef. P-
Value
Coef. P-
Value
Constant -1.3186 0.041 -0.2213 0.571 -0.076 0.831 -1.1251 0.17 -3.275 0
Ln(price of energy/price of
output)
-0.6317 0 -0.1944 0.157 -0.362 0 -0.9531 0 -0.392 0.338
Ln (R&D expenditure) -0.0414 0 -0.0106 0.281 -0.018 0 0.0077 0.722 0.0597 0.158
Ln(Price of energy/price of
output)*Ln(R&D expenditure)
-0.0154 0.004 -0.0088 0.499 -0.0101 0.011 0.0131 0.582 0.0154 0.698
Foreign Capital intensity 0.1936 0.482 -0.3472 0.51 0.0568 0.824 8.3915 0.002 5.959 0.067
Foreign Capital
intensity*Ln(R&D expenditure)
-0.0042 0.772 0.0263 0.496 0.0027 0.829 -0.8053 0.001 -0.199 0.404
Collectives -0.859 0.164 -0.164 0.63 -0.418 0.184 -0.1746 0.786 0.4664 0.188
Foreign -0.8337 0.19 0.0557 0.887 -0.477 0.188 0.2386 0.746 -2.507 0.001
Hong-Kong, Macao, Taiwan -0.7083 0.252 -0.3873 0.243 -0.0903 0.777 1.3253 0.048 -0.531 0.159
Shareholding -0.4689 0.445 -0.0735 0.814 -0.2505 0.419 1.0711 0.086 0.1096 0.716
Private -0.3986 0.523 (omitted) -0.2119 0.504 (omitted) (omitte
d)
Other (omitted) (omitted) (omitted) (omitted) (omitte
d)
North 0.4631 0.023 -1.4105 0 -0.2164 0.245 -1.2514 0.023 0.6849 0.069
Northeast 1.5179 0 (omitted) 0.3391 0.073 (omitted) (omitte
d)
East 0.5908 0.001 -1.1058 0 -0.2887 0.113 -1.1588 0.017 0.1337 0.611
South 0.6925 0 -0.7022 0.001 -0.267 0.151 -2.1873 0 0.0215 0.934
Southwest (omitted) (omitted) (omitted) -1.542 0.005 (omitte
d)
Year 2000 0.0801 0.444 0.0173 0.911 0.0654 0.401 -0.0391 0.891 -0.097 0.658
Year 2001 0.1704 0.102 0.0459 0.766 0.0794 0.304 0.0393 0.89 -0.160 0.485
Year 2002 0.0979 0.344 0.0494 0.755 0.0193 0.801 -0.0691 0.808 -0.230 0.334
Year 2003 0.0331 0.748 0.0047 0.976 -0.042 0.577 -0.2094 0.454 -0.412 0.096
Year 2004 -0.0009 0.993 -0.0839 0.595 0.0055 0.944 -0.4252 0.127 -0.326 0.229
R2(obs.) 0.4364 (892) 0.2285 (220) 0.4075 (407) 0.429 (191) 0.6064 (74)
Page 160
150
Table 4.10: Determinants of energy intensity in the four industries (1999-2001, CRS, Pooled effect)
Dependent
variable=ln(energy/output)
Four industries
Pulp and Paper
industry
Cement industry
Iron and Steel
industry
Aluminum
industry
Coef. P-value Coef. P-value Coef. P-
Value
Coef. P-
Value
Coef. P-
Value
Constant -1.4609 0 -1.7028 0 0.1924 0.481 -0.399 0.26 -0.916 0.016
Ln(price of energy/price of
output)
-0.4991 0 -0.371 0.006 -0.152 0 -0.7829 0 -0.063 0.741
Ln (R&D expenditure) -0.0265 0 0.0128 0.3 -0.008 0.041 0.0135 0.478 -0.012 0.491
Ln(Price of energy/price of
output)*Ln(R&D expenditure)
-0.0075 0.108 0.022 0.086 -0.0007 0.847 0.0183 0.327 -0.01 0.595
Foreign Capital intensity 0.2682 0.504 -0.4612 0.629 0.044 0.893 7.2048 0.05 5.2162 0.003
Foreign Capital
intensity*Ln(R&D expenditure)
-0.0227 0.282 0.0311 0.575 0.0077 0.672 -0.7852 0.033 0.0512 0.658
Collectives -0.6779 0 0.1165 0.571 -0.404 0 -1.458 0 -0.196 0.412
Foreign -0.6576 0.009 0.4423 0.244 -0.27 0.25 -1.0436 0.09 -3.886 0
Hong-Kong, Macao, Taiwan -0.5208 0 -0.0959 0.597 0.0964 0.351 -0.5563 0.111 -1.065 0
Shareholding -0.2648 0.001 0.1605 0.281 -0.1647 0.007 -0.4114 0.068 -0.537 0.003
Private 0.0574 0.807 (omitted) -0.1934 0.112 (omitted) (omitte
d)
Other 0.2943 0.642 (omitted) 0.0162 0.96 (omitted) (omitte
d)
North 0.5462 0.028 (omitted) -0.233 0.388 -0.5075 0.154 -0.607 0.129
Northeast 1.3922 0 0.9264 0.001 0.0552 0.84 (omitted) (omitte
d)
East 0.6389 0.007 0.009 0.965 -0.4532 0.091 -0.4557 0.149 -1.271 0
South 0.6292 0.009 0.4762 0.013 -0.4825 0.073 -0.8097 0.026 -0.936 0.011
Southwest (omitted) (omitted) (omitted) -0.6082 0.287 -1.195 0.003
Year 2000 0.069 0.379 -0.016 0.897 0.049 0.411 -0.0612 0.743 0.1147 0.477
Year 2001 0.0698 0.377 -0.0355 0.776 0.0532 0.374 -0.113 0.551 0.1058 0.523
R2(obs.) 0.3690 (770) 0.2740 (146) 0.2725 (342) 0.4048 (210) 0.6740 (72)
Page 161
151
Table 4.11: Determinants of energy intensity in the four industries (2002-2004, CRS, Pooled effect)
Dependent
variable=ln(energy/output)
Four industries
Pulp and Paper
industry
Cement industry
Iron and Steel
industry
Aluminum
industry
Coef. P-value Coef. P-value Coef. P-
Value
Coef. P-
Value
Coef. P-
Value
Constant -0.8562 0 -0.8998 0.003 -0.2463 0.025 -1.7287 0.002 -1.063 0.071
Ln(price of energy/price of
output)
-0.7619 0 -0.4585 0.018 -0.464 0 -0.6985 0.019 0.1842 0.81
Ln (R&D expenditure) -0.0571 0 -0.0142 0.313 -0.017 0 -0.0577 0.023 -0.102 0.055
Ln(Price of energy/price of
output)*Ln(R&D expenditure)
-0.0402 0 0.0032 0.862 -0.0188 0 -0.0467 0.082 -0.103 0.225
Foreign Capital intensity -0.037 0.913 -0.61 0.301 0.0602 0.875 4.5695 0.192 -21.3 0.257
Foreign Capital
intensity*Ln(R&D expenditure)
-0.0142 0.429 0.0255 0.64 -0.017 0.285 -0.4026 0.195 1.7709 0.244
Collectives -0.4721 0 -0.0512 0.855 -0.3727 0 -0.9786 0 -0.104 0.755
Foreign -0.3521 0.125 0.3376 0.355 -0.5466 0.077 -0.9174 0.061 -0.132 0.889
Hong-Kong, Macao, Taiwan -0.3336 0.004 -0.152 0.453 -0.1994 0.02 -0.0609 0.854 -0.727 0.009
Shareholding -0.1274 0.065 0.1649 0.294 -0.2243 0 -0.2541 0.142 -0.579 0
Private -0.1111 0.402 0.0801 0.806 -0.1352 0.076 -1.1279 0.054 -1.114 0.002
Other (omitted) (omitted) (omitted) (omitted) (omitte
d)
North -0.258 0.043 -0.867 0.004 -0.1765 0.044 0.9218 0.057 0.1285 0.743
Northeast (omitted) (omitted) (omitted) 0.833 0.102 (omitte
d)
East -0.1097 0.338 -0.6622 0.008 -0.2021 0.01 0.9543 0.036 0.0509 0.883
South 0.0662 0.575 -0.2483 0.32 -0.0736 0.357 0.88 0.069 0.1164 0.733
Southwest -1.0961 0 (omitted) -0.0865 0.699 (omitted) -0.306 0.408
Year 2003 -0.1107 0.114 -0.0416 0.754 -0.0434 0.376 -0.2629 0.119 -0.109 0.456
Year 2004 -0.0996 0.161 -0.0392 0.769 0.0272 0.59 -0.3607 0.034 -0.119 0.447
R2(obs.) 0.5126 (758) 0.2586 (144) 0.4802 (335) 0.5059 (208) 0.6798 (71)
Page 162
152
Table 4.12: Determinants of energy intensity in the four industries (NonCRS, Pooled Effect)
Dependent
variable=ln(energy/output)
Four industries Pulp and Paper
industry
Cement industry Iron and Steel
industry
Aluminum
industry
Coef. P-value Coef. P-value Coef. P-
Value
Coef. P-
Value
Coef. P-
Value
Constant 2.0149 0 1.886 0 1.9939 0 -0.0593 0.918 -0.59 0.376
Ln(price of energy/price of
output)
-0.5281 0 -0.508 0 -0.2271 0 -0.7399 0 -0.161 0.384
Ln (R&D expenditure) -0.0213 0 0.0179 0.042 -0.005 0.04 -0.006 0.706 -0.003 0.863
Ln(Value of industry output at
constant price)
0.7993 0 0.7376 0 0.834 0 0.9611 0 0.9448 0
Ln(Price of energy/price of
output)*Ln(R&D expenditure)
-0.0188 0 0.01208 0.191 -0.0078 0.003 -0.0009 0.953 -0.007 0.684
Foreign Capital intensity 0.2561 0.321 -0.4599 0.303 -0.1457 0.545 6.1411 0.017 3.6265 0.017
Foreign Capital
intensity*Ln(R&D expenditure)
-0.0300 0.028 0.006 0.855 -0.021 0.076 -0.5768 0.016 -0.003 0.975
Collectives -0.6553 0 0.066 0.659 -0.447 0 -1.325 0 -0.044 0.834
Foreign -0.5586 0.001 0.5369 0.014 -0.164 0.368 -1.23 0.002 -2.869 0
Hong-Kong, Macao, Taiwan -0.4334 0 0.1495 0.267 -0.0442 0.504 -0.405 0.099 -1.023 0
Shareholding -0.2576 0 0.1814 0.069 -0.2085 0 -0.3288 0.02 -0.582 0
Private -0.1957 0.095 0.2646 0.345 -0.1854 0.005 -1.1898 0.057 -0.747 0.026
Other 0.2347 0.69 (omitted) 0.0713 0.806 (omitted) (omitte
d)
North -0.566 0 -0.7231 0 -0.3217 0 -0.2828 0.237 -0.385 0.157
Northeast (omitted) (omitted) (omitted) (omitted) (omitte
d)
East -0.4117 0 -0.4876 0.004 -0.4105 0 -0.2504 0.249 -0.825 0.001
South -0.3950 0 -0.1259 0.43 -0.3882 0 -0.4957 0.04 -0.648 0.008
Southwest -1.1746 0 (omitted) -0.1503 0.39 -0.6974 0.074 -0.894 0.002
Year 2000 0.0676 0.356 -0.029 0.805 0.051 0.344 -0.0207 0.909 0.1048 0.527
Year 2001 0.0860 0.241 0.0044 0.97 0.066 0.221 -0.0573 0.752 0.1042 0.537
Year 2002 0.0332 0.654 0.0642 0.594 0.0436 0.423 -0.147 0.421 0.0622 0.72
Year 2003 -0.0396 0.596 0.029 0.811 0.0184 0.737 -0.3469 0.06 -0.092 0.602
Year 2004 -0.0261 0.731 0.0166 0.892 0.0625 0.268 -0.4229 0.024 -0.121 0.513
R2(obs.) 0.6873 (1528) 0.7354 (290) 0.7778 (677) 0.7236 (418) 0.8617 (143)
Page 163
153
Table 4.13: Determinants of energy intensity in the four industries (1999-2001, NonCRS, Pooled effect)
Dependent
variable=ln(energy/output)
Four industries
Pulp and Paper
industry
Cement industry
Iron and Steel
industry
Aluminum
industry
Coef. P-value Coef. P-value Coef. P-
Value
Coef. P-
Value
Coef. P-
Value
Constant 0.8884 0.029 2.0243 0.007 1.8058 0 0.1756 0.838 -0.255 0.788
Ln(price of energy/price of
output)
-0.4914 0 -0.483 0 -0.1520 0 -0.7942 0 -0.102 0.607
Ln (R&D expenditure) -0.0106 0.053 0.029 0.02 -0.0036 0.363 0.0192 0.351 -0.006 0.734
Ln(Value of industry output at
constant price)
0.8081 0 0.7355 0 0.8541 0 0.9524 0 0.9447 0
Ln(Price of energy/price of
output)*Ln(R&D expenditure)
-0.0067 0.142 0.0216 0.075 -0.0002 0.953 0.0194 0.303 -0.007 0.708
Foreign Capital intensity 0.3797 0.329 -0.0268 0.976 -0.0762 0.815 6.9901 0.058 5.3497 0.002
Foreign Capital
intensity*Ln(R&D expenditure)
-0.0358 0.082 0.0027 0.958 -0.0062 0.733 -0.7559 0.041 0.0335 0.777
Collectives -0.7103 0 0.1809 0.355 -0.4367 0 -1.4585 0 -0.11 0.679
Foreign -0.6565 0.007 0.4506 0.21 -0.0881 0.706 -1.1067 0.075 -3.787 0
Hong-Kong, Macao, Taiwan -0.4755 0 0.213 0.258 0.0987 0.328 -0.5517 0.114 -1.022 0
Shareholding -0.3146 0 0.194 0.169 -0.1830 0.002 -0.4197 0.064 -0.527 0.004
Private -0.0772 0.735 (omitted) -0.2379 0.047 (omitted) (omitte
d)
Other 0.2081 0.734 (omitted) 0.0021 0.995 (omitted) (omitte
d)
North 0.4830 0.044 -0.7866 0.003 -0.2625 0.32 -0.4807 0.179 -0.669 0.103
Northeast 1.2883 0 (omitted) 0.0837 0.755 (omitted) (omitte
d)
East 0.6302 0.006 -0.6885 0.005 -0.4119 0.116 -0.4343 0.172 -1.262 0
South 0.5743 0.014 -0.2558 0.256 -0.4529 0.085 -0.7951 0.029 -0.915 0.013
Southwest (omitted) (omitted) (omitted) -0.6325 0.269 -1.153 0.005
Year 2000 0.055 0.468 -0.0471 0.691 0.0523 0.368 -0.0643 0.731 0.1043 0.521
Year 2001 0.066 0.385 -0.0102 0.931 0.0619 0.29 -0.1144 0.547 0.0992 0.551
R2(obs.) 0.6566 (770) 0.7351 (146) 0.7348 (342) 0.7118 (210) 0.883 (72)
Page 164
154
Table 4.14: Determinants of energy intensity in the four industries (2002-2004, NonCRS, Pooled effect)
Dependent
variable=ln(energy/output)
Four industries
Pulp and Paper
industry
Cement industry
Iron and Steel
industry
Aluminum
industry
Coef. P-value Coef. P-value Coef. P-
Value
Coef. P-
Value
Coef. P-
Value
Constant 1.4423 0 1.8669 0.007 1.7057 0 -1.4922 0.076 0.2480 0.812
Ln(price of energy/price of
output)
-0.7373 0 -0.5032 0.006 -0.4571 0 -0.7060 0.018 0.6096 0.466
Ln (R&D expenditure) -0.0376 0 0.0026 0.852 -0.0125 0.001 -0.0541 0.046 -0.049 0.459
Ln(Value of industry output at
constant price)
0.803 0 0.7290 0 0.8264 0 0.9783 0 0.8732 0
Ln(Price of energy/price of
output)*Ln(R&D expenditure)
-0.039 0 -0.0040 0.818 -0.0189 0 -0.0461 0.087 -0.155 0.102
Foreign Capital intensity 0.111 0.73 -0.5649 0.306 -0.1244 0.727 4.4088 0.212 -17.97 0.34
Foreign Capital
intensity*Ln(R&D expenditure)
-0.027 0.115 0.0134 0.794 -0.0320 0.032 -0.3858 0.219 1.4775 0.333
Collectives -0.5292 0 -0.0810 0.757 -0.3927 0 -0.9783 0 -0.067 0.84
Foreign -0.373 0.087 0.4846 0.159 -0.2611 0.365 -0.9321 0.058 -0.035 0.97
Hong-Kong, Macao, Taiwan -0.3337 0.002 0.1265 0.527 -0.1607 0.044 -0.0738 0.825 -0.758 0.007
Shareholding -0.1973 0.003 0.2011 0.173 -0.2224 0 -0.2653 0.132 -0.515 0.003
Private -0.232 0.067 0.1747 0.568 -0.1572 0.027 -1.1345 0.053 -0.964 0.009
Other (omitted) (omitted) (omitted) (omitted) (omitte
d)
North -0.1913 0.115 -0.5328 0.065 -0.2319 0.005 0.9526 0.053 (omitte
d)
Northeast (omitted) (omitted) (omitted) 0.8432 0.099 -0.344 0.42
East 0.0375 0.733 -0.1876 0.462 -0.1502 0.039 0.9879 0.034 -0.156 0.542
South 0.1283 0.254 0.1239 0.618 -0.0747 0.313 0.9083 0.064 -0.087 0.758
Southwest -0.9787 0 (omitted) -- -0.1245 0.548 (omitted) -- -0.596 0.128
Year 2003 -0.0877 0.187 -0.0361 0.771 -0.0263 0.563 -0.2583 0.127 -0.098 0.501
Year 2004 -0.0663 0.326 -0.0504 0.687 0.0477 0.309 -0.353 0.04 -0.129 0.408
R2(obs.) 0.7539 (758) 0.7429 (144) 0.8512 (335) 0.7801 (208) 0.8973 (71)
Page 165
155
.
References
Brandt, Loren, Thomas G. Rawski, and John Sutton, 2008, “China’s industrial development.” China’s Great
Economic Transformation. Cambridge: Cambridge University Press, 569-633.
Cai, Bofeng, Dong Cao, Ying Zhou, and Zhangsheng Zhang, 2011, “Characteristics Analysis of Energy
Consumption in Chinese Cement Industry.” Environment Engineering, vol. 2.
Dao, Huang, 2010, “Energy Efficiency in China Iron and Steel Industry.” China Iron and Steel Association,
International workshop on industrial energy efficiency, New Delhi. See also
<http://www.iea.org/work/2010/india_bee/dao.pdf>
Fan, Ying, Hua Liao, and Yi-Ming Wei, 2007, “Can Market Oriented Economic Reforms Contribute To Energy
Efficiency Improvement? Evidence from China.” Energy Policy, 35: 2287-2295
Fisher-Vanden, Karen, 2009, “Energy in China: Understanding Past Trends and Future Directions.” International
Review of Environmental and Resource Economics, 3: 217-244
Fisher-Vanden, Karen, Gary Jefferson,Yaodong Liu, and Jinchang Qiao, 2009, “Open Economy Impacts on Energy
Consumption: Technology Transfer & FDI Spillovers in China’s Industrial Economy,” manuscript,
Pennsylvania State University.
Fisher-Vanden, Karen, Gary Jefferson, Hongmei Liu, and Quan Tao, 2004, “What is Driving China’s Decline in
Energy Intensity?” Resource and Energy Economics, 26: 77-97
Garbaccio, Richard, F., Mun S. Ho, and Dale W. Jorgenson, 1999, “Why Has the Energy-Output Ratio Fallen in
China?” The Energy Journal, 20 (3): 63-92
Hang, Leiming and Meizeng Tu, 2007, “The Impact of Energy Prices on Energy Intensity: Evidence from China.”
Energy Policy, 35: 2978-2988
He, Canfei, and Junsong Wang, 2007, “Energy Intensity in Light of China’s Economic Transition.” Eurasian
Geography and Economics, 48(4): 439-468
Ho, Mun and Karen Fisher-Vanden, 2010, “Technology, Development and the Environment,” Journal of
Environmental Economics and Management, 59(1): 94-108
Hu, Albert, G. Z. and Gary, H. Jefferson, 2008, “Science and Technology in China.” in Brandt, L. and T. G. Rawski
(eds.), China’s Great Economic Transition, Cambridge University Press.
Jefferson, Gary, H., and Thomas, G. Rawski, 2000, “Ownership, Productivity Change, and Financial Performance in
Chinese Industry.” Journal of Comparative Economics, 28: 786-813
Kang, Xiiangzhang, 2007, Overview of China’s Cement Industry. Beijing: China Cement Association.
Page 166
156
Kinoshita, Y. (2001). "R&D and Technology Spillovers via FDI: Innovation and Absorptive Capacity". CEPR
Discussion Paper 2775.
Liao, Hua, Ying Fan, and Yi-Ming Wei, 2007, “What Induced China’s Energy Intensity to Fluctutate: 997-2006?”
Energy Policy, 35: 4640-4649
Ma, Chunbo and David I. Stern, 2008, “China’s Changing Energy Intensity Trend: a Decomposition Analysis.”
Energy Economics, 30:1037-1053.
Mielnik, Otavio, and Jose Goldemberg, 2002, "Foreign direct investment and decoupling between energy and gross
domestic product in developing countries," Energy Policy, 30: 87-89
National Bureau of Statistics of China, 2000, China Statistical Yearbook.
Naughton, B., 2003, “ Government Reorganization: Lui Mingkang and Financial Restructuring. China Leadership
Monitor.” No. 7 Summer. Downloaded at www.hoover.org/publications/clm/issues/2904276.html.
Rock, Michael T., 2011, “Saving Energy and the Environment (CO2 Emissions) While Growing China’s Energy
Intensive Industries: Lessons for Indonesia”, Paper prepared for the editors of the Bulletin of Indonesian
Economic Studies, Resources for the Future, Washington, D. C: The World Bank
Rock, M. T. and Y. Cui, 2010, “Evolving landscape and shifting socio-technical regimes: Sustainability of China’s
cement industry.” Paper Presented at IHDP Conference on Industrial Transformation, Urbanization, and
Human Security in the Asia Pacific, Taipei, Taiwan, January 14-15, 2011
Rock, M. T. and Y. Wang, 2011, “Saving energy and the environment in China’s Aluminum industry.” Paper being
prepared for Green Growth in China Work, Environment and Energy Group, Development Research Group,
The World Bank, Washington, D.C.
Rock, M. T. and Y. Song, 2011, “Energy efficiency and CO2 emissions in China’s pulp and paper industry.” Paper
being prepared for Green Growth in China Work, Environment and Energy Group, Development Research
Group, The World Bank, Washington, D.C.
Rock, M. T., J. Kejun and C. He, 2011, “Energy and CO2 intensity in China’s iron and steel
industry.” Paper being prepared for Green Growth in China Work, Environment and Energy Group,
Development Research Group, The World Bank, Washington, D.C.
Sinton, Jonathan, Mark D Levine, and Qingyi Wang, 1998, “Energy efficiency in China: accomplishments and
Challenges”, Energy policy, 26(11): 813-829
Page 167
157
Sutherland, D. , 2003, “China’s large enterprises and the challenge of late industrialism.” London: Routledge
Curzon.
Wang, Jinnan, Shoumin Zou, and Hong Yaxiong, 2006, China Environmental Policy, China Environmental Science
Press, Vol.2: 154-173
Wei, Yi-Ming, Hua Liao, and Ying Fan, 2007, “An Empirical Analysis of Energy Efficiency in China’s Iron and
Steel Sector.” Energy, 32(12): 2262-2270.
Worrell, Ernst, Christina Galitsky, and Lynn Price, 2008, “Energy efficiency improvement opportunities for the
cement industry.” Lawrence Berkeley National Laboratory. University of California. Paper No. LBNL-72E.
Zha, Donglan, Dequn Zhou, and Ning Ding, 2009, “The Contribution Degree of Sun-sectors to Struture Effect and
Intensity Effects on Industry Energy Intensity in China from 1993-2003.” Renewable and Sustainable
Energy Review, 13: 895-902
Zhang, Yang, Bing-yue Liu, and Qing-wei Ping, 2008, “the Status Quo and an Analysis of Energy Consumption of
China’s Paper Industry.” China Paper and Pulp Industry. See also
<http://wenku.baidu.com/view/e1e6477f27284b73f24250d4.html>
Zheng, Yingmei, Jianhong Qi, and Xiaoliang Chen, 2011, “The Effect of Increasing Exports on Industrial Energy
Intensity in China.” Energy Policy, 39: 2688-2698
Page 168
158
VITA
YONG HU
Education:
Agricultural, Environmental and Regional Economics, The Pennsylvania State University
PH.D. Candidate in Technological Change in Developing Countries (2008-2012)
Advisor: Karen Fisher-Vanden
Department of Mathematics, The Pennsylvania State University M.A. in Mathematical Economics (2004-2007) Advisor: Xiaoe (Jenny) Li Chern Institute of Mathematics, Nankai University, China M.S. in Differential Geometry (2001-2004) Advisor: Weiping Zhang Zhejiang University of Technology, China B.E. in Computer science (1998-2001)
Teaching Experience & Awards:
Department of Mathematics, The Pennsylvania State University Techniques of Calculus; Calculus of Several Variables (2006-2007) Fellowship Award of Eberly College of Science, The Pennsylvania State University (2004-2005) Excellent Graduate, Zhejiang University of Technology Excellent Student Scholarship, Zhejiang University of Technology (1998-2000)
Assistantship and Support: Full-time teaching Assistant: Department of Mathematics, The Pennsylvania State University, 2006-2007 Full-time Graduate Assistant: Department of Agricultural, Environmental and Regional Economics, The Pennsylvania State University, 1/2008—8/2012
Professional experience:
Data Analyst, “the examination of the effects of foreign influences on technology development in China, and China’s technology transformation”, National Bureau of Statistics of China (2010 summer) Consultant, environment and Energy Group, Development Research Group, The World Bank
(2011)
Conference:
International Congress of Mathematicians, Beijing, China (2002) AAEA & NAREA Joint Annual Meeting, Pittsburg, USA (2011)