Thresholding for Change Detection Paul L. Rosin Department of Information Systems and Computing, Brunel University, Uxbridge, Middlesex UB8 3PH UK email: [email protected]Abstract Image differencing is used for many applications involv- ing change detection. Although it is usually followed by a thresholding operation to isolate regions of change there are few methods available in the literature specific to (and appropriate for) change detection. We describe four dif- ferent methods for selecting thresholds that work on very different principles. Either the noise or the signal is mod- elled, and the model covers either the spatial or intensity distribution characteristics. The methods are: 1/ a Normal model is used for the noise intensity distribution, 2/ signal intensities are tested by making local intensity distribution comparisons in the two image frames (i.e. the difference map is not used), 3/ the spatial properties of the noise are modelled by a Poisson distribution, and 4/ the spatial prop- erties of the signal are modelled as a stable number of re- gions (or stable Euler number). 1 Introduction Due to its simplicity image differencing is a popular method for change detection. It only requires calculat- ing the absolute values of the difference between the cor- responding pixels in two images, and large values in the difference map then indicate locations of change. Com- mon applications of image differencing include object tracking [25], intruder surveillance systems [3, 5], vehicle surveillance systems [7, 8, 11], and interframe data com- pression [2]. There are also many examples of its use for analysing satellite images [20] to measure land erosion, de- forestation, urban growth, crop development, etc., and for analysing medical images to measure cell distribution [10], etc. The difference map is usually binarised by threshold- ing it at some pre-determined value to obtain a change/no- change classification. However, the threshold value is crit- ical, since too low a value will swamp the difference map with spurious changes, while too high a value will sup- press significant changes. The proper value of the thresh- old is dependent on the scene, possibly fluctuating cam- era levels, as well as viewing conditions (e.g. illumination) which may change over time. This indicates that in general the threshold value should be calculated dynamically based on the image content, and that experimentally selecting a value (e.g. Jain [8], Koller et al. [11]) is not appropriate for a robust autonomous vision system. As an extension to global threshold determination there are various other procedures that can improve change de- tection. Local thresholding can be useful, particularly when the scene illumination varies locally over time. Noisy difference maps can be much improved by remov- ing small isolated change pixels, merging close regions of change, incorporating connectivity, and performing hys- teresis thresholding [1, 11, 18, 25]. Rather than differ- encing adjacent frames in temporal image sequences back- ground images can be dynamically generated [12, 18, 25], and these are differenced with each image instead. How- ever, these issues will not be further explored in this paper. Several general approaches are possible for determin- ing thresholds for change detection. First the signal, noise, or both can be modelled. Second, either their intensity and/or spatial properties can be modelled. In this paper we consider all of the four combinations of pairs of ob- ject and property (signal/noise and intensity/spatial distri- bution) and describe four techniques for threshold determi- nation that fall into each of these categories (see table 1). Note that most standard intensity image thresholding tech- niques belong to the signal/intensity class. noise signal intensity Normal model intensity distributions spatial Poisson model stable number of regions Table 1: Techniques for threshold selection described in this paper
Transcript
Thresholding for Change Detection
Paul L. RosinDepartmentof InformationSystemsandComputing,
ing change detection.Althoughit is usuallyfollowedby athresholdingoperation to isolate regionsof change thereare few methodsavailablein theliterature specificto (andappropriate for) change detection. We describefour dif-ferent methodsfor selectingthresholdsthat work on verydifferentprinciples. Either thenoiseor thesignal is mod-elled,and the modelcovers either the spatial or intensitydistributioncharacteristics.Themethodsare: 1/ a Normalmodelis usedfor thenoiseintensitydistribution, 2/ signalintensitiesare testedbymakinglocal intensitydistributioncomparisonsin the two image frames(i.e. the differencemapis not used),3/ thespatialpropertiesof thenoisearemodelledbya Poissondistribution,and4/ thespatialprop-ertiesof thesignalare modelledasa stablenumberof re-gions(or stableEulernumber).
1 IntroductionDue to its simplicity imagedifferencingis a popular
methodfor changedetection. It only requirescalculat-ing the absolutevaluesof the differencebetweenthe cor-respondingpixels in two images,and large valuesin thedifferencemap then indicatelocationsof change. Com-mon applicationsof image differencing include objecttracking[25], intrudersurveillancesystems[3, 5], vehiclesurveillancesystems[7, 8, 11], andinterframedatacom-pression[2]. Therearealsomany examplesof its useforanalysingsatelliteimages[20] to measurelanderosion,de-forestation,urbangrowth, cropdevelopment,etc.,andforanalysingmedicalimagesto measurecell distribution[10],etc.
The differencemap is usually binarisedby threshold-ing it at somepre-determinedvalueto obtaina change/no-changeclassification.However, thethresholdvalueis crit-ical, sincetoo low a valuewill swampthedifferencemapwith spuriouschanges,while too high a value will sup-presssignificantchanges.Thepropervalueof the thresh-
old is dependenton the scene,possiblyfluctuatingcam-eralevels,aswell asviewing conditions(e.g.illumination)whichmaychangeovertime. This indicatesthatin generalthethresholdvalueshouldbecalculateddynamicallybasedon the imagecontent,andthat experimentallyselectingavalue(e.g.Jain[8], Koller etal. [11]) is notappropriatefora robustautonomousvisionsystem.
As anextensionto globalthresholddeterminationtherearevariousotherproceduresthat canimprove changede-tection. Local thresholdingcan be useful, particularlywhen the scene illumination varies locally over time.Noisy differencemapscanbe muchimprovedby remov-ing small isolatedchangepixels,merging closeregionsofchange,incorporatingconnectivity, and performinghys-teresisthresholding[1, 11, 18, 25]. Ratherthan differ-encingadjacentframesin temporalimagesequencesback-groundimagescanbedynamicallygenerated[12, 18, 25],andthesearedifferencedwith eachimageinstead.How-ever, theseissueswill notbefurtherexploredin thispaper.
Several generalapproachesare possiblefor determin-ing thresholdsfor changedetection.First thesignal,noise,or both can be modelled. Second,either their intensityand/orspatialpropertiescan be modelled. In this paperwe considerall of the four combinationsof pairs of ob-ject andproperty(signal/noiseandintensity/spatialdistri-bution)anddescribefour techniquesfor thresholddetermi-nationthat fall into eachof thesecategories(seetable1).Notethatmoststandardintensityimagethresholdingtech-niquesbelongto thesignal/intensityclass.
noise signal
intensity Normalmodel intensitydistributionsspatial Poissonmodel stablenumberof regions
2 Previous work on threshold selectionAlthough there are many techniquesfor determining
imagethresholdvaluesfor binarisingintensityimages[19]mostof themmake assumptionsthatdo not hold for stan-darddifferenceimages,therebyinvalidatingtheir applica-tion. For instance,many methodsexpecttheintensityhis-togramto bebimodal,andsomecannotcopeif themodesaretoo dissimilarin size,or if they arenot approximatelyNormal. We know of ratherfew thresholdingtechniquesspecificallydesignedto be effective for differencemaps;thesearedescribedbelow.
Yang and Levine [25] employed a two stageprocessto selectlocal andglobal thresholdsfor differencededgemapsusingthefull imagesequence.First, for eachedgel,themedianabsolutedeviation (MAD � ) of all theedgelsatthat locationover the sequenceis calculated.The edgel’slocaldifferencemapthresholdis thensetto
��������� � �������MAD � . Next, a histogramis formed from thoseedgelswhich areabove their local thresholdvalues.ThemedianabsolutedeviationMAD � calculatedover thehistogramisusedto generateaglobalthreshold
��������� � ��� �����MAD � .
Edgelsnow aremarkedaschangeonly if they exceedboththeir localandtheglobalthresholds.
JainandNagel [9], and later Hsu et al. [7], bypassedthe differencemap and detectedchangeusing hypothe-sis testing. The imagesweremodelledaspatcheswhoseintensitieswere describedby bivariatepolynomials. Foreachpixel a likelihoodtestcheckedwhethertheintensitieswithin alocalwindow in eachof thetwo imagescouldhavebeendrawn from a singleintensitydistribution. Sincethet-test is usedthe thresholdcanthenbe relatedto a confi-dencelevel.
3 Modelling the noise intensity3.1 Noise Models
In many instancesit is reasonableto assumethat theimagenoisecanbemodelledby a zeromeanNormaldis-tribution ��������� �"! . In thiscase,analysingthedifferenceinintensityimagesis straightforward.Differencingfollowedby taking theabsolutevaluewill producetheNormaldis-tribution
� ������� � � �#! for positivevaluesonly.Sometimesit is preferredto differenceedgemapsrather
thanintensityimagesasthey canbemorerobustfor changedetectionundervaryingillumination [1, 21, 25]. Unfortu-natelythis makesdeterminingthedistribution of thenoisemoretroublesome.First we notethat thenoisein theedgemapscanbemodelledby aRayleighdistribution [24]$ ��%&!(' %� �*) + ,�--/. -10 %324�if theedgeresponseis of theform
5 6877"9;: �8<>= 77"?A@ � . De-
notingthenoisein two edgemapsasindependentrandom
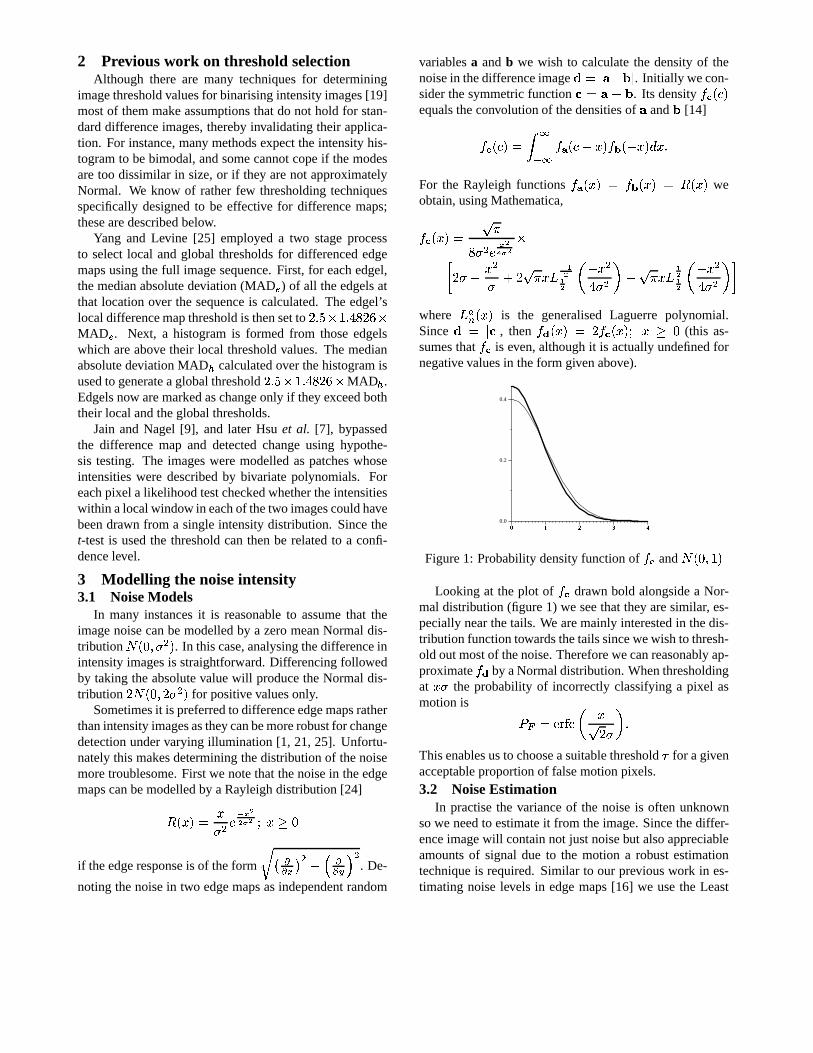
variablesa andb we wish to calculatethe densityof thenoisein thedifferenceimageBC'ED FHGJI�D . Initially wecon-siderthesymmetricfunction KL'MFNGOI . Its density PRQ ��S#!equalstheconvolutionof thedensitiesof F and I [14]PTQ���SU!8'WVYXZ X PT[A��S�GC%&!�PT\]�^G�%;!^_ % �For the Rayleighfunctions PT[A�`%;!a'bPT\c��%&!a' $ ��%&! weobtain,usingMathematica,P Q �`%;!(' d e� � � ) , -f . - �g � �hG % �� < � d e %&i +�j-j-lk G�% �� � �Hm G d e %*i j- j-�k G�% �� � �(m�nwhere i1op �`%;! is the generalisedLaguerre polynomial.Since Bq'rD K&D , then PTst�`%&!a' � P Q �`%;! 0 %u2v� (this as-sumesthat PRQ is even,althoughit is actuallyundefinedfornegativevaluesin theform givenabove).
0w 1x 2y 3z 4{0.0
0.2
0.4
Figure1: Probabilitydensityfunctionof P Q and ������� � !Looking at the plot of P Q drawn bold alongsidea Nor-
mal distribution (figure1) we seethat they aresimilar, es-peciallynearthetails. We aremainly interestedin thedis-tributionfunctiontowardsthetailssincewewishto thresh-old outmostof thenoise.Thereforewecanreasonablyap-proximateP s by aNormaldistribution. Whenthresholdingat %*� the probability of incorrectlyclassifyinga pixel asmotionis |~} '��U����� k %d � � m �Thisenablesusto chooseasuitablethreshold� for agivenacceptableproportionof falsemotionpixels.3.2 Noise Estimation
In practisethe varianceof the noiseis often unknownsowe needto estimateit from theimage.Sincethediffer-enceimagewill containnot just noisebut alsoappreciableamountsof signal due to the motion a robust estimationtechniqueis required.Similar to our previouswork in es-timating noiselevels in edgemaps[16] we usethe Least
Medianof Squares(LMedS)methodappliedto thediffer-enceimagehistogram.Its advantagesarethatit is efficient(at least for 1D data), and hasa high breakdown point.This latter propertyenablesit to return the correctresultevenwhenlargeamountsof outliers(i.e. truemotion)arepresent.It is straightforward [17] to derive the followingrelationbetweentheLMedSandtheexpectedstandardde-viationof thenoise:
�3' LMedS� � ������R� �4 Modelling the signal intensity
While it is reasonableto assumethat the noisecharac-teristicsareknown sufficiently suchthat they canbemod-elledanalyticallyandestimatedfrom thedifferenceimage,wehavenoinformationconcerningtheintensitiesof there-gionsof change.Likewise,weknow little aboutthemagni-tudesof thedifferencemapintensitiesproducedby change,exceptthatwe would generallyexpectthemto be signifi-cantly larger thanzero. Sincethis provideslittle help forthresholdselectionwedonot try to analysedifferencemapintensities,but considerthe original (pre-differenced)im-agesinstead. Changeoccurswhen correspondingpixelsin the two imageshave significantlydifferent intensities,but it is difficult to quantify what is meantby significant.Onesolutionis to considerin additionto eachindividualpixel all the intensitiesin a surroundingwindow. Com-paring two windows is a more tractabletask sincetherearemany techniquesavailablefor comparingtwo distribu-tions,andthis is theapproachtakenby JainandNagel[9]andHsuet al. [7]. In contrastto themwe shallusea non-parametricmethodsothatnoassumptionsabouttheinten-sity distributionsneedto be made. Oneof the mostpop-ular is the Kolmogorov-Smirnov testwhich wasusedforchangedetectionin satelliteimageryby Eghbali[4]. It hasthenicepropertythatit is invariantto imagescalingor off-sets.As analternativewe havealsoexperimentedwith theCramer-von Misestestwhich is oftenmorepowerful thantheKolmogorov-Smirnov test[22]. Ratherthantestingthemaximumvalueof the differencebetweenthe two cumu-lativedistributionsit usesinsteadthesummedsquareddif-ferences.Thresholdingis performedby acceptingasmo-tion only thosepixels whosedistributions are dissimilar,i.e. their teststatisticis above the critical valuefor a se-lectedsignificancevalue(e.g.5%).
Following Eghbaliwenormalisethedatato reducesen-sitivity to largescalevariationsbetweenthe images.Eachwindow is rescaledandoffsetsothat it haszeromeanandunit standarddeviation.
5 Modelling the spatial distribution of thenoise
If we assumethat thenoiseis white thenits spatialdis-tributionovertheimagewill berandom.For theanalysisofspatialdatatherearemany measuresof randomness[23],oftenbasedon theassumptionthattheobservationsfollowa Poissondistribution. Sincea Poissondistribution hasitsmeanequalto its variancethentheratioof thesamplevari-anceto thesamplemeanis a naturaltestfor thatdistribu-tion, andis calledthe relativevariance ����'�� -�9 � It is cal-culatedby first countingthenumberof observations(in ourcasethenumberof abovethresholdpixelsin thedifferencemap)in � windows, �"%*��� p���~� , from whichthemean, �% , andvariance,� � , of the %*� canbe found. Although the test issensitive to thewindow sizeandpoint densityit worksad-equatelyaslongas �% is sufficiently large.
For our purposeswe do not wish to detectthespatiallyrandomnoise,but ratherto avoid it in our thresholdedim-age.Wethereforeselectthethresholdwhichmaximisestherelative variance,therebymaximising “clumpiness” (re-gionsof change)andminimising the Poissondistribution(noise).
6 Modelling the spatial distribution of thesignal
Thelocation,size,andnumberof theregionsof changeare generallyunknown. However, we might expect thatthesepropertieswill remainfairly stableoverawide rangeof thresholdvalues,whereasdown at thenoiselevel smallchangesin the thresholdvaluecansubstantiallyalter thenumberof regions. Suchan observation suggeststhat ifa rangeof thresholdvaluesis found that leadsto a sta-ble numberof regions, thentheseregionsareunlikely tocomefrom noise,andsoa valuefrom this rangewill pro-vide a suitablethreshold.This approachwassuggestedbyO’Gorman[13] for intensityimagethresholding(andwasrecentlyproposedagainby PikazandAverbuch[15]), andwasappliedto differenceimagesby RosinandEllis [18].Ratherthan countingthe numberof regions the image’sEuler numbercanbe used,andwasfound to give almostidentical results[18]. The advantageof calculatingcon-nectivity over region countingis that the Euler numberislocally countable[6], andcanbedeterminedefficiently inasinglerasterscanof theimageby justafew linesof code.
A stablethresholdrangewill correspondto a plateauin thegraphof theEulernumbersagainstthresholds.Ini-tially weassumedthattheplateauswereperfectlyflat, anddetectedthemby looking for thelongestsuchrangein thegraph[18]. However, giventhenoisy, fragmentednatureofimagesthis wasnot found to bereliableassometimestheEuler numbervariedslowly within the stablerange. Analternativeprocedurethatwe have foundmoreeffective is
to modeltheshapeof thegraphasadecayingexponential.At low thresholdvaluestherewill be many regions andholescausedprimarily by the noise,and the Euler num-ber will changerapidly with threshold. At high thresh-old valuestherewill befew regions,andtheEulernumberwill bestable.(We only considerthresholdsup until thereareno regionsremaining,andthe Euler numberbecomeszero).Thereforea suitablepartitionpointbetweenthesig-nalandnoiseis the“corner” of thecurve. whichwefind asthe point on the curve with maximumdeviation from thestraightline drawn betweentheendpointsof thecurve.
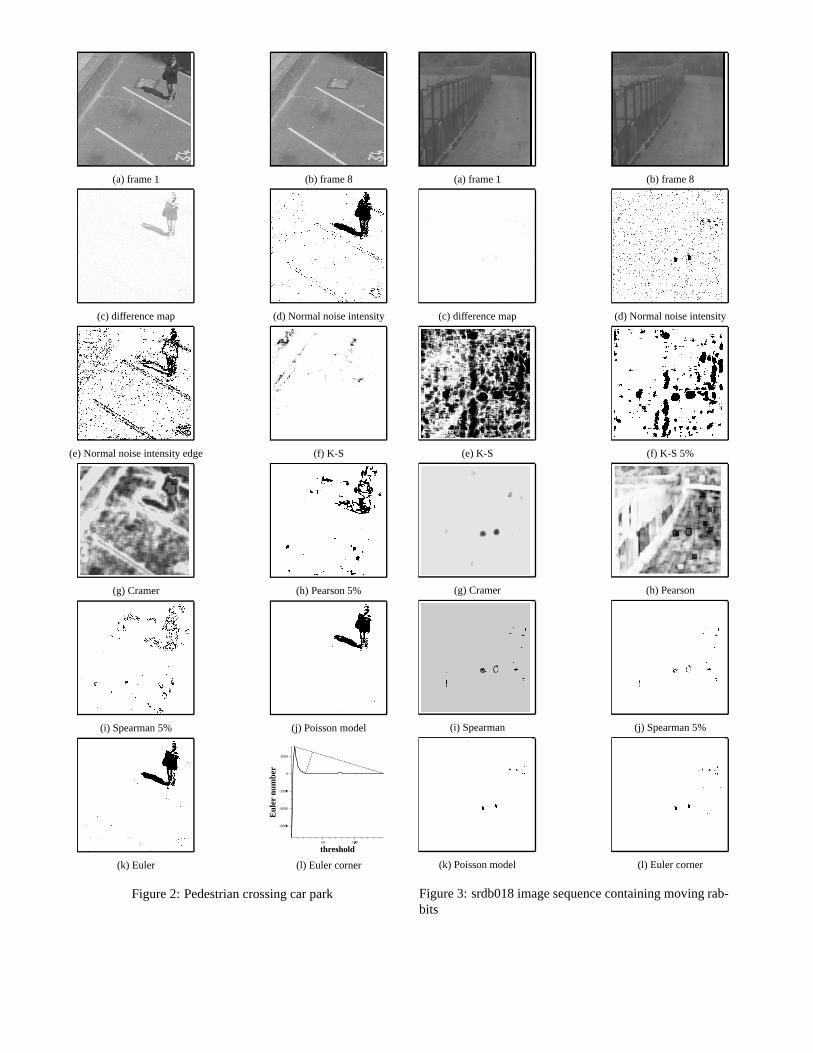
If we count regions then the curve at low thresholdswhich is generatedprimarily by noisewill appearroughlyGaussian[15] andthenumberof regionseventuallydropsto oneat a thresholdof zero. WhenusingEulernumbersthe shapeis differentsincethe numbercanbecomeneg-ative if therearemoreholesthanconnectedcomponents.To avoid difficulties for the cornerdetectionwe start thestraightline from the first positive peakin the curve (seefor examplefigure2n).
noiseintensity model, while 5% confidencevalueswereusedfor theteststatistics.Apart from theinput imagestheremainingimageareshown invertedto improvevisualisa-tion.
Figures2a&bshow two framesof anoutdoorscenecon-taininga pedestrianwalking acrossa carpark.The resultsof thresholdingthe differencemap (figure 2c) using theNormal modelfor noiseintensityareshown in figure 2d.A reasonablefit usingthe Normalapproximationis madeto the differencemaphistogram,andthe walker hasbeenthresholdedreasonablywell althoughthereis someresid-ualnoise.Applying thesametechniqueto adifferenceim-ageconstructedfrom two framesafter running the Sobeledgedetectorproducesa noisierresult(figure2e). In thiscasethedifferencemaphistogramis notsowell fit nearthetail.
Using the methodsfor comparingintensity distribu-tions, the Kolmogorov-Smirnov and Cramer-von Misestestsproducetheconfidencevaluesin figures2f&g. Bothperformedpoorly in this casesinceeither little or no re-sponseis retainedafterthresholding.We alsodemonstratea relatedapproachfor comparingtwo setsof values:cor-relation. Pearson’s rank correlationcoefficient is shownthresholdedat0.05(figure2h)althoughthecoefficientcan-not strictly beinterpretedasa probabilityvalue.Likewise,a non-parametricmethod,Spearman’s rankcorrelation,is
shown after thresholdingin figure 2i. Although the cor-relationresultsarebetterthanthedistribution comparisonresults,they arestill poor.
Both of the spatialmethods(the Poissonnoisemodeland the stableEuler number)producegood results(fig-ures2j&k). Thecornerfinding procedureis demonstratedon theplot of theEulernumberin figure2l.
Finally, the imagesin figures3a&b areoutdoorimagesfrom atestsurveillancesite,takenunderavarietyof condi-tions[5], andarerathermoredemanding.They arepoorlyilluminatedandcontainonly two setsof smallmoving ob-jects(rabbits). Due to the low contrastthe thresholdob-tained by the Normal distribution methodretainsmanyspuriousnoisepoints. The distribution comparisonandcorrelationmethodsperformedpoorly (figure3e-j), eitherunder- or over-thresholdingexceptfor Spearman’scorrela-tion coefficientwhichperformedquitewell. As before,thetwo spatialmethodsproducedgoodresults(figures3k&l).
8 Conclusions
Future work is required to perform more extensivetesting,and to incorporatesomequantitative assessment.However, from theresultsabove we canform someinitialconclusions.First, the Normal model for approximatingthenoiseintensityin combinationwith thenoiseestimationprocedureworksadequately, althoughtheresultstendedtolook speckly. Onereasonfor this is that the methodper-formsthethresholdingon a localpixel basis,in contrasttomostof theothermethodswhich operateoverwindowsorregions.Thespecklecouldbereducedeitherby modifyingthe threshold,but moreprobablypost-processingsuchaserosionwouldbesimplerandmorereliable.
Thetwo techniquesweconsideredfor comparinginten-sity distributions, the Kolmogorov-Smirnov and Cramer-von Misestests,did not do well. A further disadvantageis that the resultsare fairly sensitive to the window sizewhich needsto be specifiedas an additional parameter.The correlationmethodsfor comparingwindows, Pear-son’srankcorrelationcoefficientandSpearman’srankcor-relation,alsoperformedpoorly. TheKolmogorov-SmirnovandPearsonmethodsappearedto beparticularlysensitiveto noise,especiallyin regionswith small dynamicrangesof intensities.
Most promising were the spatial methods. Both thePoissonnoisemodelandthestableEulernumberreliablygavegoodresults,which for all theimageseithermatchedor betteredtheNormalnoiseintensitymodelresults.How-ever, furthertestsarenecessaryto determinetherobustnessof thepeakfinding andcornerfinding proceduresusedbythetwo methods.
References[1] M. Bichsel. Segmentingsimply connectedmoving objects
in astaticscene.IEEETrans.PatternAnalysisandMachineIntelligence, 16:1138–1142,1994.
[2] S.C. Brofferio. An object-backgroundimage model forpredictive video coding. IEEE Trans. Communications,37:1391–1394,1989.
[3] I. Dinstein. A new techniquefor visualmotionalarm. Pat-ternRecognition Letters, 8:347–351,1989.
[9] R. Jain and H.-H. Nagel. On the analysisof accumula-tive differencepicturesfrom imagesequencesof realworldscenes.IEEE Trans.PatternAnalysisandMachine Intelli-gence, 1:206–214,1979.
[11] D. Koller, J.Weber, andJ.Malik. Robustmultiplecartrack-ing with occlusionreasoning. In Europ. Conf. ComputerVision, pages189–196,1994.
[12] A. Makarov. Comparisonof backgroundextractionbasedintrusiondetectionalgorithm. In Int. Conf. Image Process-ing, pages521–524,1996.
[13] L. O’Gorman. Binarizationandmulti-thresholdingof doc-umentimnagesusingconnectivity. In Symp.on DocumentAnalysisandInfo. Retrieval, pages237–252,1994.
[14] A. Papoulis.Probability, RandomVariables,andStochasticProcesses. McGraw-Hill, 1991.
[15] A. Pikaz and A. Averbuch. Digital image thresholdingbasedon topological stable state. Pattern Recognition,29:829–843,1996.