Through the Labor Market Looking Glass: An Inquiry into Principal-Teacher Race Congruence
WCER Working Paper No. 2018-13 October 2018
Peter Goff, Yasmin Rodriguez-Escutia, and Minseok Yang Wisconsin Center for Education Research University of Wisconsin–Madison [email protected] Suggested citation: Goff, P., Rodriguez-Escutia, Y., & Yang, M. (2018). Through the labor market looking glass: An inquiry into principal-teacher race congruence (WCER Working Paper No. 2018-13). Retrieved from University of Wisconsin–Madison, Wisconsin Center for Education Research website: http://www.wcer.wisc.edu/publications/working-papers
Representative bureaucracy suggests that supervisors are representative of their employees based, in part, on shared values and identity. In education, we often observe representative asymmetries among school principals and the teaching faculty, particularly by race. This study explores the ways in which race congruence (or incongruence) between teachers and principals relates to key labor market behaviors, in particular, job searching, changing, applying, and hiring. Using an unprecedented and large-scale vacancy-application database coupled with administrative staffing records in Wisconsin, this study demonstrates that representative bureaucracy based on race operates at the stages of job searching and applying. The congruence effect is only notable for Minoritized teachers at the hiring stage, while White teachers show a greater effect when changing positions. Comparing the differences in marginal probabilities by racial combinations, we conclude race congruence effects are greatest for Minoritized teachers.
Through the Labor Market Looking Glass: An Inquiry into Principal-Teacher Race Congruence
Peter Goff, Yasmin Rodriguez-Escutia, & Minseok Yang
Schools face a substantial shortage of Minoritized1 teachers (Foster, 2004; Tillman, 2004; Brown, 2005; Goldhaber, Theobald, & Tien, 2015; Putman, Hansen, Walsh, & Quintero, 2016). With 50% of the student population Minoritized individuals and only 18% of teachers with similar racial backgrounds, some have identified recruitment and retention of Minoritized teachers as a top priority in education as a way to reduce the disparity gap (Putman, Hansen, Walsh, & Quintero, 2016). This persistent challenge has led many to ask, “How can schools attract and retain Minoritized teachers for our growing populations of Minoritized students?”
Previous studies have responded to this question by identifying principal leadership, instructional support (e.g., mentoring), and higher salaries as key levers to improve the retention of Minoritized teachers (Brown, 2014; Brown & Wynn, 2009; Grissom, 2011; Grissom & Keiser, 2011). This body of research raises important questions regarding the role of leadership and its ability to influence teachers’ career decisions to apply to, select, or leave a school. Few studies have observed race congruence with principals in the teacher labor market (Grissom & Keiser, 2011; D’Amico, Pawlewicz, Earley, McGeehan, 2017), yet this limited research is compelling and suggests that racial congruence plays a non-trivial role in labor dynamics. We build upon prior work by integrating vacancy and application data to better understand how principal-teacher race congruence impacts teacher selection decisions.
Teacher Recruitment and Retention
A challenge administrators face when recruiting and retaining Minoritized teachers is the hiring process, which is often complex, tedious, and laden with logistic and bureaucratic obstacles (Rutledge, Harris, Thompson, & Ingle, 2008). For example, Liu and Johnson (2006) noted that the hiring process for teachers is done closer to the school year and is therefore often rushed. D’Amico, Pawlewicz, Earley, and McGeehan (2017) demonstrated bureaucratic challenges Minoritized teachers encounter in their hiring decisions, suggesting that Black teachers are hired at a lower rate than White applicants, even when both Black and White applicants have advanced degrees and experience working in the same districts. Although their study showed that Black teachers are hired at a higher rate by schools led by Black principals, overall hiring trends provide evidence that racial discrimination2 continues to occur within the teacher labor market.
Looking beyond the hiring paradigm, other researchers have confirmed that the majority of Minoritized teachers encounter discriminatory challenges in the early stages of the teacher 1 We capitalize Minoritized to empower individuals and challenge linguistic and grammatical rules. This is following the work of Harris (2017) and Pérez Huber (2010). 2 Prejudice is defined as attitudes and discrimination is defined by actions according to Kite and Whitley (2016). We use discrimination because it describes the actions of administrators not hiring Minoritized teachers.
2
pipeline. For example, Brown (2014) indicated that Minoritized teachers experience racism, are less supported, and are held to lower expectations from faculty and peers. Minoritized teachers not only face discrimination in the earlier stages of the teacher pipeline, but discrimination has also occurred as a result of historical events. After the decision of Brown v. Board of Education, White administrators were given greater authority to fire, hire, and/or transfer Minoritized teachers (Irvine, 1988) and consequently Black teachers were being displaced by White teachers (Fairclough, 2004; Fultz, 2004). Irvine (1988) further noted that Black principals were also fired or demoted to lower positions, which made it harder for Black principals to advocate for Black teachers and their community. These studies demonstrate that, historically, racism has reduced the number of Minoritized teachers and may continue to dissuade Minoritized teachers from entering the workforce.
Shared Representation
Motivated by previous studies on the barriers Minoritized teachers encounter in the hiring process and working environment, our study centers on the labor market behaviors of Minoritized teachers, conditional on principal race. Prior research found that shared representation between teachers and students improved students’ achievement and learning (Dee, 2004; Egalite, Kisida, & Winters, 2015) and that Minoritized and non-Minoritized students have a preference for Minoritized teachers (Cherng & Halpin, 2016).
As prior literature has shown that race congruence between teachers and students can shape the educational experience, race congruence between principals and teachers can account for labor market activities such as teacher turnover (Grissom & Keiser, 2011). The roots of race congruence in education can be found in Ehrenberg, Goldhaber, and Brewer’s (1995) study, where the authors noted that future researchers should observe “whether it is important to match employees and supervisors by RGE [race, gender, and ethnic congruency]” (Ehrenberg, Goldhaber, & Brewer, 1995, p. 560).
Subsequent studies on the race congruence between administrators and teachers have noted that teachers feel more satisfied in their workplace and have lower turnover rates (D’Amico, Pawlewicz, Early, & McGeehan, 2017; Grissom & Keiser, 2011). This congruence-based retention effect may also explain why some schools attract more Minoritized applicants. Similarly, Irvine (1988) suggested that one solution to the shortage of Black teachers may lie in the development of a strong pipeline of Black school leaders because Black principals could implement initiatives for Black teachers and their community’s needs. This is further supported by researchers who study teacher-principal relationships and confirm that teachers seek school leaders who will support them (Achinstein, Ogawa, Sexton, & Freitas, 2010; Farinde, Allen, & Lewis, 2016; Farkas, Johnson, & Foleno, 2000; Kirby, Berends, & Naftel, 1999), and perceptions of such support is linked to retention and productivity.
Theoretical Framework
Representative bureaucracy suggests that supervisors are representative of their employees based on shared values and attitudes (Meier, 1975, p. 159; Selden, 1997). For instance, Selden
3
(1997) noticed that if Minoritized administrators have the same values and attitudes as Minoritized individuals, they are more likely to voice their concerns and seek changes when implementing policies (p. 5). Lim (2006) noted that passive representation benefits the Minoritized group through shared values, beliefs, partiality, and empathic understanding, while active representation occurs as the principal takes on a formal advocacy role. Representative bureaucracy benefits the Minoritized group through the creation of supports that reflect their group’s ideas, needs, and values. Therefore, the lens of representative bureaucracy is suitable for our study because it helps us understand the extent to which applicants seek out schools led by principals who share the same race. Collectively, representative bureaucracy allows us to frame, test, and understand the link between principal-teacher congruence and labor market dynamics.
The theory of representative bureaucracy has been used to study the influences of political officials on policies but has not often been applied in the field of education (Meier & Stewart, 1992, p. 159; Meier, 1993, p. 396; Selden, 1997, p. 5). The few researchers that have investigated representative bureaucracy in education have observed the impact it had on students (Meier & Stewart, 1992; Meier, 1993). For example, researchers observed that African American teachers challenged policies that were implemented and advocated for policies that support African American students (Meier & Stewart, 1992; Selden, 1997, p. 9). Similarly, scholars also observed that Latinx3 teachers challenged policies that were implemented and advocated for policies that support Latinx students (Meier 1993; Selden, 1997, p. 9). Overall, these researchers illustrate that representative bureaucracy influences the ways in which Minoritized teachers teach and support Minoritized students.
In its sole application to educational leadership, representative bureaucracy has been used to better understand how administrators can impact teachers’ labor market decisions. Grissom and Keiser (2011) applied representative bureaucracy to observe the impact of race congruence on teacher turnover and satisfaction. Their study articulated two forms of representation (passive and active) in which congruence provided both formal and informal benefits. Formal benefits arise through the principal representing Minoritized teachers and implementing policies that support them. Meanwhile, the informal benefits of race congruence allow teachers and principals to rely on similar cultural experiences, shared communication, and socio-professional norms (Grissom & Keiser, 2011).
Specific Aims and Research Questions
Our study first explores the impact race congruence has between teachers and principals on labor market outcomes. Building on prior research that focused on teacher satisfaction, turnover, and employment (D’Amico, Pawlewicz, Early, & McGeehan, 2017; Grissom & Keiser, 2011), we expand their findings by using application data coupled with administrative staffing records from Wisconsin to observe teacher selection decisions such as searching, changing, applying, and hiring. Second, our study models labor market outcomes, conditional on teachers’ choice set
3 We use Latinx because it is gender inclusive. For more information on the term, see DeOnis (2017) and Patterson (2017).
4
of the vacancies to which they have applied. The relationship between race congruence is engaged through a logistic regression framework to answer the following questions:
RQ1: Does teacher-principal race congruence predict if a teacher is likely to seek other jobs?
RQ2: Does teacher-principal race congruence predict if a teacher is likely to change schools?
RQ3: Are teachers more likely to apply to positions where leadership race congruence is present?
RQ4A: Are teachers more likely to be hired in positions where leadership race congruence is present?
RQ4B: Are schools more likely to choose teachers who share race congruence with the principal?
Data
Two datasets were employed in this study: a vacancy/application database from the Wisconsin Education Career Access Network (WECAN) and the administrative staffing data from the Wisconsin Department of Public Instruction (WDPI). The WECAN dataset is a job application portal for educators interested in working for K–12 schools in Wisconsin. It is used by about 83% of the school districts and contains an extensive range of descriptive information about applicants and vacancies, such as the schools and districts in which teachers applied, the period of job posting, educational background, certification, and experience of teachers. The data are suitable for exploring prospective teachers’ labor market activity (e.g., submission of applications to vacancies) and current teachers’ change of status in the labor market (e.g., attrition and mobility).
Meanwhile, the data from the WDPI include administration records of all the staff in K–12 schools in Wisconsin. The records range from individual characteristics of teachers to background of schools where the teachers are working. Each teacher identifier was used to merge with the WECAN dataset to investigate the behavioral patterns of applicants according to the race congruence of principal-teacher relationships. Because each of our research questions requires a somewhat different sample, the detailed number of observations used in this study will be introduced with the analysis of each research question.
Measures
Our research questions centered on four dependent variables: searching, changing, applying, and hiring. “Searching,” which we used to answer RQ1, was dummy coded to indicate whether or not current public-school teachers searched for other positions using the WECAN application system. The WECAN represents a sizable majority of vacancies across the state, but does not cover all vacancies. Therefore, our measures for this variable are conservative, representing a lower bound of search behaviors.
“Changing,” the dependent variable for RQ2, was measured by whether or not teachers changed their positions across schools between two years. A value of 1 was assigned to a teacher
5
who switched position and a value of 0 for a teacher who maintained the same position in two years. Because we excluded teachers who left their current schools in the analytic model, the number of samples was smaller than it was for RQ1.
“Applying,” the dependent variable for RQ3, was measured by whether or not teachers actually applied for potential positions using only the vacancy information in WECAN. For example, if a teacher (applicant) has teaching certifications for math and chemistry, we expanded the data to include all vacancies for math and chemistry that the applicant could apply in WECAN. For the dependent variable, a value of 1 was assigned to a vacancy where a teacher actually applied and a value of 0 for a vacancy where a teacher did not apply even though the teacher could have applied. The difference between “Searching” and “Applying” is that the former indicates if a teacher who was working for a public school in Wisconsin was actively searching for other teaching positions through the WECAN, while the latter distinguishes the set of vacancies where a teacher actually applied to all possible vacancies to which they could have applied. Thus, the number of observations for RQ3 is substantially larger than that for RQs 1 and 2.
“Hiring,” the last dependent variable for RQs 4A and 4B, is measured by whether or not teachers were hired into a given/applied position. A value of 1 was assigned to a teacher who succeeded in getting the position and a value of 0 for a teacher who was not hired.
The Minoritized variable was created by grouping Black and Latinx teachers together, and this variable was given a value of 1; meanwhile, White was assigned a value of 0. Other races, such as American Indian or Asian, were excluded in the analysis model because the proportions were extremely small for both teachers and principals. For example, the combined proportion of other races of teachers was less than 1.42%, while it was 2.24% for Black and 1.62% for Latinx in the 2016 WDPI staff data. Meanwhile, for other races the proportion of principals was 1.06%, while it was 6.03% for Black and 1.93% for Latinx.
Grouping Latinx and Black teachers together carries two notable limitations. First, we acknowledge that Latinx and Black teachers may have distinct and unique experiences in the labor market. Second, the impact of race congruence might also vary by race. For example, a Latinx teacher under the supervision of a Black principal might encounter a different experience as compared to a Latinx teacher supervised by a Latinx principal and vice versa for a Black teacher. Representative bureaucracy advocates our grouping in that both Latinx and Black educators have faced historical and social adversity due to their race. This leads us to believe that a Latinx (or Black) principal would be more representative of a Black (or Latinx) teacher than a White principal. With this limitation in mind, we note that the estimates presented in our findings represent lower-bound estimates due to our approach to group races.
Three teacher characteristics are included in the model: gender, total amount of teaching experience, and highest degree obtained. Gender is shown to predict some behavioral patterns of teachers, such as satisfaction, turnover, and workplace preference (Grissom, Nicholson-Crotty, & Keiser, 2012; Horng, 2009). Similarly, teaching experience is used in many studies to explain job attrition. For instance, Lankford, Loeb, and Wyckoff (2002) observed that teachers with fewer credentials and less experience are more likely to work in low-income and Minoritized schools.
6
Meanwhile, teachers’ degree attainment is used to examine teachers’ mobility (Grissom & Keiser, 2011). The degree indicators are changed to a dummy variable in the model: a value of 1 for teachers who had a master’s degree or above and a value of 0 for teachers who held a bachelor’s degree or below.
Previous studies have indicated that school demographics such as high population of low-income students, high population of Minoritized students, and achievement scores are factors predicting teachers’ mobility and attrition (Bacolod, 2007; Lankford et al., 2002; Scafidi, Sjoquist, & Stinebrickner, 2007). Researchers noted a reduction in mobility and attrition patterns for Minoritized teachers when teaching in school districts that contained higher proportions of Minoritized students compared to their non-Minoritized colleagues (Hanushek, Kain, & Rivkin, 2002; Scafidi et al., 2007). Ingersoll (2001) included school characteristics such as the size and location of a school in his model to predict teacher turnover, concluding that there were notable turnover tendencies based on the size and the location of a school. Based on the former literature, six school characteristics were contained in the model: (1) the proportion of students receiving free or reduced-price lunch, (2) the proportion of Minoritized students, (3) the student population, (4) average academic achievement, (5) locale (city, suburb, town, and rural), and (6) grade level (elementary, middle, and high school). Academic achievement is defined by the average score in reading and math tests within a school. City and elementary school are the reference groups.
Methods
Figure 1 illustrates the labor market patterns we explored through our four research questions. The dashed lines represent applications and solid lines represent applications that result in hiring. RQ1 focused on whether race congruence with a teachers’ current principal affects teachers’ job search tendencies. This scenario is evident in the left-hand side of Figure 1, where the teacher is represented in a school (the leftmost rectangle), with the arrows representing applications to other schools. RQ2 focused on the relationship between race congruence and mobility (the leftmost solid arrow), conditional on schools at which they worked.
Figure 1. Overall labor market search and hiring patterns
RQ3 examined whether race congruence with the principal of the school to which the teacher was applying was related to application patterns. This is illustrated in the middle section of Figure 1, where the rectangles demonstrate vacant positions in schools, with the solid and dashed
Vacancies Other teachers
applying to vacancies Teacher (T) in their
current school
T
7
arrows representing applicants applying to vacancies and no arrow representing applicants not applying to vacancies.
RQ4 was divided into two aspects: (A) teachers and (B) schools. RQ 4A focused on teachers who selected schools, conditional on applicants within the vacancy pool. RQ 4B focused on schools that selected teachers, conditional on the set of vacancies to which the teacher applied. Collectively, these scenarios represent the key congruence-dependent interactions in the teacher labor market.
Figure 2. RQ1—Does teacher-principal race congruence predict if a teacher is likely to seek other jobs?
For RQ1, our dependent variable was job search activity, which we operationalize as whether or not the teacher applied to any position in other schools. Figure 2 shows the teacher, their current school, and their search for other teaching positions in bold. The labor market elements that are not reflected in this research question are shown in gray. Given our binary outcome, we used a logistic regression model estimating the relationship between the race congruence on a teacher’s likelihood to search for other jobs. This approach parallels the strategy by Grissom and Keiser (2011) that examined how race congruence between teachers and principals predicted teacher turnover. However, we further divided the race congruence into four cases. The model we used is below:
In this model, teachers (t) were nested within schools (s), and the outcome (Searching) indicated whether or not the teacher sought other positions. Congruence was determined by the inclusion of teachers’ race, principal’s race at the teachers’ current school, and the interaction between these two. Collectively these variables identified four mutually exclusive combinations: a non-Minoritized teacher with a non-Minoritized principal (𝛽𝛽0 as a reference group), a Minoritized teacher with a non-Minoritized principal (𝛽𝛽1), a non-Minoritized teacher with a Minoritized principal (𝛽𝛽2), and a Minoritized teacher with a Minoritized principal (𝛽𝛽3). This approach further allowed us to test various hypotheses for the degree of representative bureaucracy based on differences in marginal probabilities between racial combinations. The model clustered standard errors at the school-level.
T
8
Figure 3. RQ 2—Does teacher-principal race congruence predict if a teacher is likely to change schools?
To address RQ2 as to whether teachers moved to different schools as a function of race congruence (Figure 3), we again use a logistic regression model. Our approach is similar to Grissom and Keiser (2011) with one exception. They grouped teachers who left their school and changed their positions into one group, and they focused on teacher turnover on either staying or leaving from the perspective of each school. In our study, we excluded those who left the public school system and focused on teacher mobility (“stay” or “change”) from the standpoint of each district. The model we used for the second research question is below:
Figure 4. RQ3—Are teachers more likely to apply to positions where race congruence is present?
To answer RQ3 in determining the impact of race congruence on teachers’ application patterns, as shown in Figure 4, we used another logistic regression model formulated in (3):
The outcome, 𝐴𝐴𝑃𝑃𝑃𝑃𝑃𝑃𝐴𝐴𝑃𝑃𝑃𝑃𝑎𝑎𝑡𝑡𝑡𝑡, indicated whether a teacher (t) applied to a vacancy (v) for which
they were eligible based on the license(s) they held. We used an interaction between teachers’ race and principals’ race to examine the role of race congruence. In this model, we no longer used the principal’s race that the applicant was currently working with. Instead, we included the race of the principal in a vacancy where applicants applied.
T
T
9
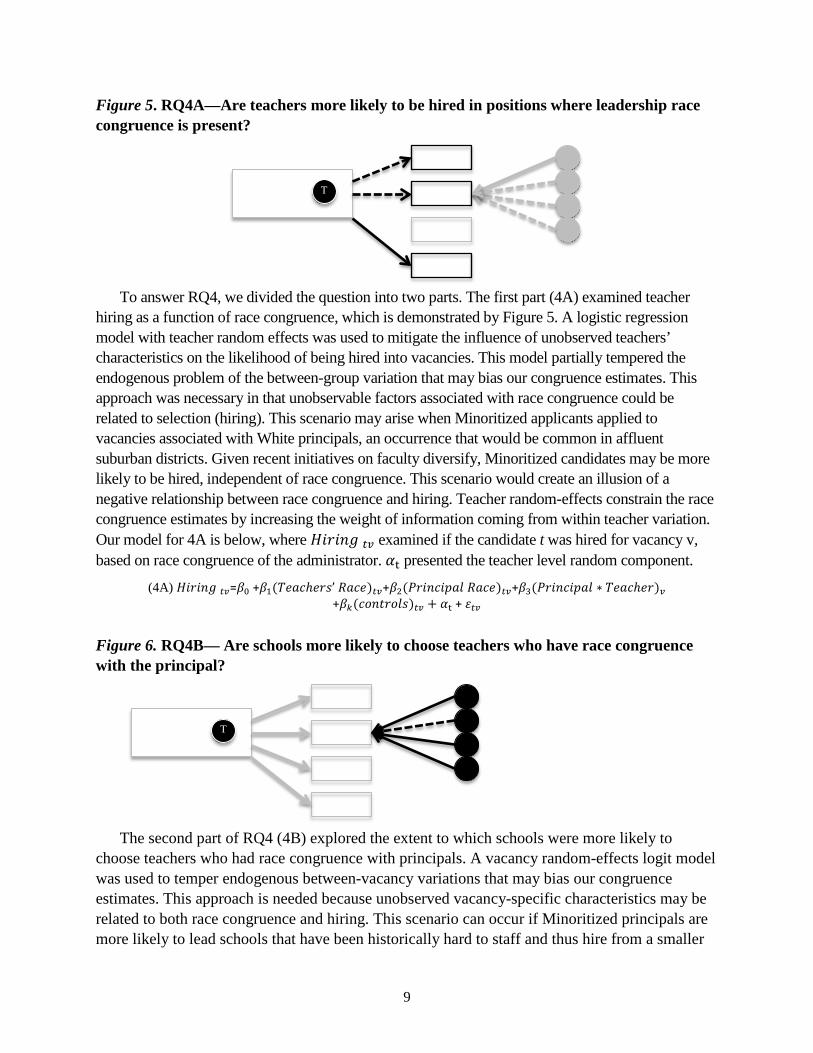
Figure 5. RQ4A—Are teachers more likely to be hired in positions where leadership race congruence is present?
To answer RQ4, we divided the question into two parts. The first part (4A) examined teacher hiring as a function of race congruence, which is demonstrated by Figure 5. A logistic regression model with teacher random effects was used to mitigate the influence of unobserved teachers’ characteristics on the likelihood of being hired into vacancies. This model partially tempered the endogenous problem of the between-group variation that may bias our congruence estimates. This approach was necessary in that unobservable factors associated with race congruence could be related to selection (hiring). This scenario may arise when Minoritized applicants applied to vacancies associated with White principals, an occurrence that would be common in affluent suburban districts. Given recent initiatives on faculty diversify, Minoritized candidates may be more likely to be hired, independent of race congruence. This scenario would create an illusion of a negative relationship between race congruence and hiring. Teacher random-effects constrain the race congruence estimates by increasing the weight of information coming from within teacher variation. Our model for 4A is below, where 𝐻𝐻𝑃𝑃𝑒𝑒𝑃𝑃𝑃𝑃𝑎𝑎 𝑡𝑡𝑡𝑡 examined if the candidate t was hired for vacancy v, based on race congruence of the administrator. 𝛼𝛼t presented the teacher level random component.
Figure 6. RQ4B— Are schools more likely to choose teachers who have race congruence with the principal?
The second part of RQ4 (4B) explored the extent to which schools were more likely to choose teachers who had race congruence with principals. A vacancy random-effects logit model was used to temper endogenous between-vacancy variations that may bias our congruence estimates. This approach is needed because unobserved vacancy-specific characteristics may be related to both race congruence and hiring. This scenario can occur if Minoritized principals are more likely to lead schools that have been historically hard to staff and thus hire from a smaller
T
T
10
applicant pool. Smaller applicant pools would give Minoritized teachers in these vacancies a greater chance of being hired, artificially inflating our congruence estimates. Thus, vacancy random-effects construct estimates on race congruence by placing more weight on variation within a vacancy rather than between vacancies. Our model for RQ4B is below, where 𝐻𝐻𝑃𝑃𝑒𝑒𝑃𝑃𝑃𝑃𝑎𝑎 𝑡𝑡𝑡𝑡 indicates if a teacher (t) was hired to fill a vacancy (v) in a particular school. ∝𝑡𝑡 was the vacancy-level random component.
Results Table 1 shows descriptive statistics for our sample, disaggregated by those searching and not
searching for new positions. We found that the proportion of Minoritized teachers in both groups was fairly small (3%), and the teachers who were searching were more likely to work with Minoritized principals (10%) in comparison with teachers who were not searching (7%). We also found that, on average, teachers who were not searching are more experienced (14 years) than teachers who were searching (8 years). Teachers who were not searching have higher degrees (53%) than teachers who were active on the job market (35%). Teachers who were searching for new positions are working in schools with slightly higher proportions of low-income students (45%) and higher proportion of Minoritized students (22%).
Table 1. Descriptive statistics for teachers who were and were not searching VARIABLES Search Non-Search Minoritized Teacher 0.03 0.03 Working with a Minoritized Principal 0.10 0.07 Teacher Characteristics (Controls) Female Teacher 0.71 0.73 Total Experience 8.04 14.45 (7.18) (9.33) Master’s Degree 0.35 0.53 School Characteristics (Controls) Free/Reduced-price Lunch (%) 44.59 41.50 Student Achievement 509.83 510.68 (42.52) (42.27) City 0.32 0.27 Suburb 0.25 0.26 Town 0.17 0.20 Rural 0.26 0.27 Elementary School 0.46 0.49 Middle School 0.22 0.20 High School 0.32 0.31 Student Enrollment 598.06 606.04 (424.00) (421.32) Minoritized Student (%) 22.05 18.24 Years Year 2014
0.48
0.50
Year 2015 0.52 0.50 Observations 12,073 108,775
Standard deviation in parentheses
11
Figure 7 shows findings for our first research question by using marginal effects from the logistic regression model across each of the racial combinations, controlling for teacher and school characteristics.4 We found that teachers were less likely to search for other positions when race congruence was present. To illustrate, a Minoritized teacher under the supervision of a Minoritized principal had the smallest probability of searching in the labor market (0.067) compared to a White teacher with a White principal (0.114). By contrast, when race congruence was not present, there was a higher probability of searching in the labor market. A White teacher with a Minoritized principal had a higher probability of searching (0.194) in comparison with a Minoritized teacher with a White principal (0.125). Overall, our findings revealed that race congruence between a principal and teacher may lead to a lower probability of that teacher actively searching in the job market, suggesting that representative bureaucracy is important for both Minoritized and non-Minoritized teachers when searching in the labor market.
Figure 7. Marginal probabilities (effects) of searching in the labor market based on principal-teacher race congruence
In the second part of our analysis, we determined how teacher-principal race congruence
predicted the probability that a teacher changed schools. The descriptive information of teachers who stayed or changed schools (Table 2) shows that Minoritized teachers accounted for 4% among the group who changed schools and 3% among the group who stayed. We also found that teachers who changed schools were more likely to work with Minoritized principals (11%), which was likely attributable to Minoritized principals being more likely to lead schools to be disproportionately populated by low-income and/or Minoritized students. In addition, teachers who did not change schools had more experience (14 years) and hold higher degrees (52%). We further noticed that
4 See appendix for odds ratio tables for the research question 1-4B.
12
teachers who stayed in their current school worked with lower proportions of low income (41%), Minoritized students (17%), and students with higher achievement scores (512).
Table 2. Descriptive statistics for teachers who stayed or changed schools VARIABLES Change Stay Minoritized Teacher 0.04 0.03 Working with a Minoritized Principal 0.11 0.07 Teacher Characteristics (Controls) Female Teacher 0.74 0.73 Total Experience 8.95 14.13 (7.81) (9.09) Master’s Degree 0.38 0.52 School characteristics (Controls) Free/Reduced-price Lunch (%) 46.96 40.68 Student Achievement 503.37 511.71 (42.56) (42.05) City 0.32 0.26 Suburb 0.23 0.27 Town 0.18 0.20 Rural 0.27 0.28 Elementary School 0.52 0.49 Middle School 0.21 0.20 High School 0.28 0.31 Student Enrollment 541.99 611.87 Minoritized Student (%) 23.03 17.30 Years Year 2014 0.53 0.50 Year 2015 0.47 0.50 Observations 7,701 97,247
Standard deviation in parentheses
Figure 8 shows the marginal effects for the second research question in examining the probability of teachers changing schools based on race congruence with their principals controlling for teacher and school characteristics. We found that a Minoritized teacher with a Minoritized principal had an approximately equal chance of changing positions as a Minoritized teacher working with a White principal (0.121, respectively). By contrast, a White teacher with a Minoritized principal had a higher probability of changing (0.145) as compared to when there was race congruence (0.077). We thus found that race congruence influences the probability of changing for only White teachers. These findings present us with the counter-intuitive finding that representative bureaucracy appears to influence the mobility patterns of White teachers, but not Minoritized teachers.
13
Figure 8. Marginal probabilities (effects) for teachers who changed schools based on race congruence
We then explored whether anticipated congruence at a future school predicted the likelihood
of teachers applying to those specific vacancies. In RQ3, the “principal” indicated the leader working in the school to which the teacher was applying, as compared to the principal that the teacher was currently working with in RQs 1 and 2.
The descriptive information for RQ3 with our expanded dataset (Table 3) shows Minoritized teachers were more likely to apply to vacancies supervised by a Minoritized principal (12%) in comparison with White teachers (5%). Both Minoritized and White teachers were more likely to apply to vacancies in schools that were affluent (fewer students receiving free and reduced-price lunch), suburban, enrolled more students, and posted higher achievement. We also notice that Minoritized teachers had a stronger preference to these vacancy characteristics compare to White teachers.
Table 3. Descriptive statistics for teachers who were (not) applying in the labor market Vacancies applied Vacancies did not apply VARIABLES Minoritized White Minoritized White Vacancy Associated with a Minoritized Principal
Vacancies applied Vacancies did not apply VARIABLES Minoritized White Minoritized White Student Achievement 519.65 520.11 501.41 501.48 (43.81) (40.18) (38.17) (38.29) City 0.20 0.14 0.25 0.25 Suburb 0.57 0.43 0.31 0.32 Town 0.12 0.21 0.20 0.20 Rural 0.12 0.22 0.24 0.24 Elementary School 0.41 0.44 0.58 0.58 Middle School 0.23 0.24 0.26 0.25 High School 0.36 0.32 0.16 0.17 Student Enrollment 739.03 663.15 550.13 554.50 (471.90) (439.72) (343.52) (351.73) Minoritized Student (%) 25.03 14.17 18.10 18.22 Years Year 2014 0.49 0.51 - - Year 2015 0.51 0.49 - - Observations 423 21,271 138,574 4,136,894
Standard deviation in parentheses
For RQ3, we tested whether anticipated race congruence was related to teachers’ choice to apply to a vacancy while controlling for teacher, school, and subject position characteristics. Figure 9 shows that a Minoritized teacher had the same probability to apply to a race-congruent vacancy as did a White teacher (0.005) and these probabilities were significantly higher than the non-congruent alternatives. Overall, we found that representative bureaucracy is important for both Minoritized and non-Minoritized teachers when applying in the labor market.
Figure 9. Marginal probabilities (effects) for teachers applying based on race congruence and position
15
The descriptive statistics for RQ4A (Table 4) show that Minoritized teachers accounted for 2% between both the hired and non-hired teachers. Teachers who were hired had more years of experience (6.2) as compared to those who were not hired (5.6). Teachers who also had a higher degree were more likely to be hired (26%) as compared to teachers who were not hired (24%). Table 4 also indicates teachers were more likely to be hired by schools with a higher percentage of students receiving free or reduced-price lunch (38%) and Minoritized students (16%) compared to schools that did not hire teachers (33%, 14%, respectively). Finally, teachers were more likely to be hired by schools with a higher student enrollment (671) in comparison with schools that had smaller student enrollment (629).
Table 4. Descriptive statistics for teachers who were (not) hired VARIABLES Hired Non-Hired Minoritized Teacher 0.02 0.02 Minoritized Hiring Principal 0.07 0.05 Teacher Characteristics (Controls) Female Teacher 0.75 0.70 Total Experience 6.15 5.60 (6.45) (6.47) Master’s Degree 0.26 0.24 School Characteristics (Controls) Free/Reduced-price Lunch (%) 38.04 32.93 Student Achievement 517.64 516.28 (41.56) (40.07) City 0.21 0.13 Suburb 0.31 0.41 Town 0.24 0.21 Rural 0.24 0.25 Elementary School 0.41 0.47 Middle School 0.24 0.24 High School 0.35 0.29 Student Enrollment 670.62 628.94 (456.34) (423.97) Minoritized Student (%) 16.31 14.16 Years Year 2014
0.50
0.56
Year 2015 0.50 0.44 Observations 2,684 49,011
Standard deviation in parentheses
Figure 10 provides a visual representation of the marginal effect presented in RQ4A examining the probability of teachers being hired while controlling for teacher and school characteristics. A Minoritized teacher with a Minoritized principal seemed to have highest probability of being hired (0.08), but the magnitude was not statistically different with other groups, which may be caused by the small number of Minoritized teachers. Interestingly, race incongruence with a White teacher and Minoritized principal had a slightly higher probability of being hired (0.05) as compared to race congruence with a White teacher and White principal
16
(0.04). We thus found that representative bureaucracy does not operate for both Minoritized and White teachers when being hired.
Figure 10. Marginal probabilities (effects) of teachers who were hired based on race congruence with principals
RQ4B explored whether schools chose teachers based on racial combinations between a teacher and a principal. The probability of schools choosing teachers when controlling for teacher and school characteristics (Figure 11) shows that schools supervised by Minoritized principals have a higher probability in hiring Minoritized teachers (0.16) than White teachers (0.08). Meanwhile, schools managed by White principals have similar probabilities of choosing White teachers (0.06) and Minoritized teachers (0.06). We thus found that representative bureaucracy plays an important role for a Minoritized teacher to be chosen by a school led by a Minoritized principal.
17
Figure 11. Marginal probabilities (effects) of schools hiring teachers based on race congruence with principals
Discussion and Implication
Our study investigates the importance of representative bureaucracy on the teacher labor market. We found that teachers seek out racial congruence with prospective principals and, once hired, are less likely to look for other jobs when they are working with a race-congruent principal. To summarize our findings and better understand the role of race and representative bureaucracy on the labor market, we calculated differences in the marginal probabilities between four racial combinations and divided the results into three cases: Race congruence (one case, e.g., White teacher with White principal—Minoritized teacher with Minoritized principal), Partial race congruence (four cases, e.g., White teacher with White principal—White teacher with Minoritized principal), and Race incongruence (one case, e.g., White teacher with Minoritized principal—Minoritized principal with White teacher). We used these combinations to examine our hypothesis that representative bureaucracy will produce racial congruence effects largest among historically marginalized teachers.
We compared across all combinations within each of our research questions (Table 5) and revealed that 14 instances (grey boxes) that supported our theory where congruence effects were greatest for the marginalized teachers. Four of the combinations (black boxes) provided contrary evidence that the effects were more pronounced for the privileged group than the marginalized group. Twelve of the comparisons yielded differences that were not statistically significant.
18
Table 5. Significant tests for marginal effect differences between teacher-principal race congruence
Comparisons of Race
Congruence Comparisons of Partial Race Congruence
Comparisons of Race
Incongruence WtWp –
MtMp WtWp – WtMp
WtWp – MtWp
MtMp – MtWp
MtMp – WtMp
WtMp – MtWp
RQ1 (Searching) 0.0465*** -0.0799*** -0.0110 -0.0575*** -0.1264*** 0.0689*** RQ2 (Changing) -0.0442*** -0.0675*** -0.0441*** 0.0001 -0.0234* 0.0235 RQ3 (Applying) -0.0002 0.0012*** 0.0024*** 0.0026*** 0.0014 0.0012*** RQ4A (Hiring) -0.0457 -0.0107** 0.0019 0.0476 0.0351 0.0126 RQ4B (Hiring) -0.1046** -0.0231** -0.0035 0.1011** 0.0815* 0.0197 1. Wt: White teacher, Wp: White principal, Mt: Minoritized teacher, and Mp: Minoritized principal. 2. Grey shaded boxes indicate that the representative bureaucracy is supported, while black shaded boxes
indicate that the representative bureaucracy works inversely. 3. RQ4A used teacher random effect model, and RQ4B used vacancy random effect model. 4. For RQ1 and RQ2, the principal was the individual with whom the teacher currently worked. For RQ3,
RQ4A, and RQ4B, the principal was associated with the vacancy where the teacher applied or was hired. 5. *** p<0.01, ** p<0.05, * p<0.1
The first cell of Table 5 (0.0465) represented the difference in the searching probabilities between a White teacher working with a White principal and a Minoritized teacher working with a Minoritized principal. In the case of the first cell, there was race congruence between both groups, however representative bureaucracy suggests that practices such as institutional racism leads Minoritized workers to be more attuned to representative bureaucracy and thus would be less likely than White teachers to enter the labor market when currently working for a same-race principal. Thus, the positive (and significant) difference between these estimates speaks in favor of representative bureaucracy—specifically, a conception of representative bureaucracy where the concept functions differently for members of the privileged class than it does for historically marginalized groups. The stronger effect may occur because Minoritized teachers feel more supported by Minoritized principals who share the same beliefs and values. Also, Minoritized principals may be more likely to advocate for Minoritized teachers by providing resources and passing supportive policies.
This interpretation parallels the finding by Grissom and Keiser (2011) where Minoritized teachers are more satisfied by a Minoritized principal and are less likely to leave the school. Our study further expands their research by not only focusing on teacher turnover but also observing the broad range of labor dynamics, such as searching, applying, and being hired. Our study makes methodological extensions to Grissom and Keiser’s study as well. Where Grissom and Keiser used a binary indicator of congruence, our approach of race-specific interactions permitted comparisons of marginal probabilities among racial combinations. Our results, showing different effects for White-White congruence than for Minoritized-Minoritized congruence, show that this strategy is a meaningful evolution to studies of congruence.
Our findings also support Irvine’s (1998) suggestion that the creation of a strong pipeline of Minoritized administrators is an effective way to address the shortage of Minoritized teachers.
19
Thus, we call for establishing the stronger leadership pipeline for Minoritized principals which leads to the recruitment and retention of Minoritized teachers. This initiative could be expanded to the relationship between Minoritized superintendents and Minoritized principals.
We also found that 11 of the 20 comparisons of the partial race congruence supported the theory of representative bureaucracy, with four cells presenting evidence contrary to the theory. Partial race congruence may lead Minoritized teachers to seek out other positions and change schools because they may not receive sufficient support from White principals. For instance, with unknowing/knowing prejudices toward Minoritized teachers, White principals could create an unwelcoming and frustrating culture for Minoritized teachers. This could lead Minoritized teachers to search and apply to schools led by a Minoritized principal in the hopes of sharing common beliefs and values. For this reason, if race congruence does not exist, it is still necessary for White administrators and White teachers to be aware of biases permeated at their school. To address prejudices, Grissom and Keiser (2011) suggested professional development programs to help reduce a wide range of biases and preventing unwelcoming environments that Minoritized teachers encounter (p. 577).
Having professional development programs may not be sufficient, as professional development only changes the culture within a school. From outside the school, Minoritized teachers on the labor market may only see the racial incongruence between themselves and the school leader. In such cases, White principals should share their beliefs and values when recruiting Minoritized teachers. Having White principals share their values and beliefs can help Minoritized teachers know whether they will have a supportive White administrator who advocates for equity and does not tolerate racism. Furthermore, sharing their values and beliefs can also build a trusting relationship between a White principal and a Minoritized teacher. Building a trusting relationship can help a Minoritized teacher learn if they can trust and seek support from their White administrator when needed. Thus, having White principals sharing their values and beliefs can help Minoritized teachers decide if they want to apply to vacancies in schools led by a White administrator.
Considerations and Future Studies
Despite the extensive range of research interests, our study did not consider if female or male Minoritized teachers may behave differently toward male or female White principals. This intersectionality requires considering the interactive effects between gender and race on the labor market behaviors. We focused on race congruence due to the data limitation on gender—the number of male-Minoritized teachers was too small to estimate specific effects. Thus, a representative bureaucracy framework should be extended to gender congruence with principals and teachers to examine how it may impact teachers’ selection decisions. A previous study has shown that gender congruence between the principal and teacher leads to more satisfaction and less turnover (Grissom, Nicholson-Crotty, & Keiser, 2012). We look forward to testing this prediction in future work.
20
References
Achinstein, B., Ogawa, R. T., Sexton, D., & Freitas, C. (2010). Retaining teachers of color: A pressing problem and a potential strategy for “Hard-to-Staff” schools. Review of Educational Research, 80(1), 71–107.
Bacolod, M. (2007). Who teaches and where they choose to teach: College graduates of the 1990s. Educational Evaluation and Policy Analysis, 29(3), 155–168.
Brown, F. (2005). African Americans and school leadership: An introduction. Educational Administration Quarterly, 41(4), 585–590.
Brown, K. D. (2014). Teaching in color: A critical race theory in education analysis of the literature on preservice teachers of color and teacher education in the US. Race Ethnicity and Education, 17(3), 326–345.
Brown, K. M., & Wynn, S. R. (2009). Finding, supporting, and keeping: The role of the principal in teacher retention issues. Leadership and Policy in Schools, 8(1), 37–63.
Cherng, H. Y., & Halpin, P. F. (2016). The importance of minority teachers: Student perceptions of minority versus white teachers. Educational Researcher, 45(7), 407–420.
D’Amico, D., Pawlewicz, R. J., Earley, P. M., & McGeehan, A. P. (2017). Where are all the Black teachers? Discrimination in the teacher labor market. Harvard Educational Review, 87(1), 26–49.
Dee, T. S. (2004). Teacher, race, and student achievement in a randomized experiment. The Review of Economics and Statistics, 86(1), 195–210.
DeOnis, C. M. (2017). What’s in an “x”? An exchange about the politics of “Latinx”. Chiric Journal: Latina/o Literatures, Arts, and Cultures, 1(2),78–91. Available at https://muse.jhu.edu/article/664597.
Egalite, A. J., Kisida, B., & Winters, M. A. (2015). Representation in the classroom: The effect of own-race teachers on student achievement. Economics of Education Review, 45, 44–52.
Ehrenberg, R. G., Goldhaber, D. D., & Brewer, D. J. (1995). Do teachers’ race, gender, and ethnicity matter? Evidence from the national educational longitudinal study of 1988. Industrial and Labor Relations Review, 48(3), 547–561.
Fairclough, A. (2004). The costs of Brown: Black teachers and school integration. The Journal of American History, 91(1), 43–55.
Farinde, A. A., Allen, A., & Lewis, C. W. (2016). Retaining black teachers: An examination of black female teachers’ intentions to remain in k-12 classrooms. Equity & Excellence in Education, 49(1), 115–127.
Farkas, S., Johnson, J., & Foleno, T. (2000). A sense of calling: Who teaches and why. New York, NY: Public Agenda.
Foster, L. (2004). Administrator and teacher recruitment and selection post-Brown: Issues, challenges and strategies. Journal of School Public Relations, 25(2), 220–232.
Fultz, M. (2004). The displacement of Black educators post-Brown: An overview and analysis. History of Education Quarterly, 44(1), 11–45.
Goldhaber, D., Theobald, R., & Tien, C. (2015). The theoretical and empirical arguments for diversifying the teacher workforce: A review of the evidence (Policy brief WP #2015-9). Retrieved from http://m.cedr.us/papers/working/CEDR%20WP%202015-9.pdf
Grissom, J. A. (2011). Can good principals keep teachers in disadvantage schools? Linking principal effectiveness to teacher satisfaction and turnover in hard-to-staff environments. Teacher College Record, 113(11), 2552–2585.
Grissom, J. A., & Keiser, L. (2011). A supervisor like me: Race, representation, and the satisfaction and turnover decisions of public sector employees. Journal of Policy Analysis and Management, 30(3), 557–580.
Grissom, J. A., Nicholson-Crotty, J., & Keiser, L. (2012). Does my boss’s gender matter? Explaining job satisfaction and employee turnover in the public sector. Journal of Public Administration Research and Theory, 22(4), 649–673.
Hanushek, E. A., Kain, J. F., & Rivkin, S.G. (2002). Why public schools lose teachers. The Journal of Human Resources, 39(2), 326–354.
Harris, J. C. (2017). Multiracial campus professionals’ experiences with multiracial microaggressions. Journal of College Student Development, 58(7), 1055–1073.
Horng, E. (2009). Teacher tradeoffs: Disentangling teachers’ preferences for working conditions and student demographics. American Educational Research Journal, 46(3), 690–717.
Ingersoll, R. M. (2001). Teacher turnover and teacher shortages: An organizational analysis. American Educational Research Journal, 38(3), 499–534.
Irvine, J. J. (1988). An analysis of the problem of disappearing black educators. The Elementary School Journal, 88(5), 503–513.
Kirby, S. N., Berends, M., & Naftel, S. (1999). Supply and demand of minority teachers in Texas: Problems and prospects. Educational Evaluation and Policy Analysis, 21(1), 47–66.
Kite, M., Whitley, Jr., B. (2016). Psychology of Prejudice and Discrimination (3rd ed.). New York, NY: Routledge.
Lankford, H., Loeb, S., & Wyckoff, J. (2002). Teacher sorting and the plight of urban schools: A descriptive Analysis. Educational Evaluation and Policy Analysis, 24(1), 37–62.
Lim, H. H. (2006). Representative bureaucracy: Rethinking substantive effects and active representation. Public Administration Review, 66(2), 193–204.
Liu, E., & Johnson, S. M. (2006). New teachers’ experiences of hiring: Late, rushed, and information-poor. Educational Administration Quarterly, 42(3), 324–360.
Meier, K. J. (1975). Representative bureaucracy: An empirical analysis. The American Political Science Review, 69(2), 526–542.
Meier, K. J., & Stewart, J., Jr. (1992). The impact of representative bureaucracies: Educational systems and public policies. American Review of Public Administration, 22(3), 157–171.
Meier, K. J. (1993). Latinos and representative bureaucracy testing the Thompson and Henderson hypotheses. Journal of Public Administration Research and Theory, 3(4), 393–414
Patterson, H. (2017). A sociolinguistic survey of “Latinx” (Honors thesis, 14). Available at http://digitalcommons.northgeorgia.edu/honors_theses/14
Pérez Huber, L. (2010). Using Latina/o Critical Race Theory (LatCrit) and racist nativism to explore intersectionality in the educational experiences of undocumented Chicana college students. Educational Foundations, 24(1/2), 77–96.
Putman, H., Hansen, M., Walsh, K., & Quintero, D. (2016, August). High hopes and harsh realities: The real challenges to building a diverse workforce. Retrieved from Brown Center on Education Policy at Brookings website: https://Minoritized.brookings.edu/research/high-hopes-and-harsh-realities-the-real-challenges-to-building-a-diverse-teacher-workforce/
Rutledge, S. A., Harris, D. N., Thompson, C. T., & Ingle, W. K. (2008). Certify, blink, hire: An examination of the process and tolls of teacher screening and selection. Leadership and Policy in Schools, 7(3), 237–263.
Scafidi, B., Sjoquist, D. L., & Stinebrickner, T. R. (2007). Race, poverty, and teacher mobility. Economics of Education Review, 26(2), 145–149.
Selden, S. C. (1997). The promise of representative bureaucracy: Diversity and responsiveness in a government agency. Armonk, NY: M.E. Sharpe
Tillman, L. C. (2004). (Un)intended consequences? The impact of the Brown v. Board of Education decision on the employment status of black educators. Education and Urban Society, 36(3), 280–303.
Teacher Characteristics - X X School Characteristics - - X Year Effect X X X Observations 120,669 120,669 120,669
1. Standard error clustered at the school level 2. *** p<0.01, ** p<0.05, * p<0.1 3. The control variables for teacher characteristics were: gender, total experience, and degree. 4. The control variables for school characteristics were: free or reduced-price lunch, achievement score, location, grade level, school size, and proportion of Minoritized students.
Table B. Likelihood for teachers to change schools based on race congruence (odd ratios) Whether Changed Positions or Not VARIABLES Model 1 Model 2 Model 3 Minoritized Teacher & White principal
Teacher Characteristics - X X School Characteristics - - X Year Effect X X X Observations 104,824 104,824 104,824
1. Standard error clustered at the school level 2. *** p<0.01, ** p<0.05, * p<0.1 3. The control variables for teacher characteristics were: gender, total experience, and degree. 4. The control variables for school characteristics were: free or reduced-price lunch, achievement score, location, grade level, school size, and proportion of Minoritized students.
24
Table C. Likelihood of teachers applying in the labor market based on race congruence (odd ratios) Whether Applied Possible Positions or Not VARIABLES Model 1 Model 2 Model 3 Model 4 Minoritized Teacher & White principal
Teacher Characteristics - X X X School Characteristics - - X X Subjects Applied - - - X Year Effect X X X X Observations 4,319,919 4,319,919 4,319,919 4,319,919
1. Standard error clustered at the teacher level 2. *** p<0.01, ** p<0.05, * p<0.1 3. The control variables for teacher characteristics were: gender, total experience, and degree. 4. The control variables for school characteristics were: free or reduced-price lunch, achievement score, location, grade level, school size, and proportion of Minoritized students, and subjects applicants applied. Table D. Likelihood for teachers who were hired or not hired based on race congruence (odd ratios) Whether Teacher was Hired or
Not Whether Schools Chose the
Teacher or Not VARIABLES Model 1 Model 2 Model 3 Model 4 Model 5 Model 6 Minoritized Teacher & White principal
Teacher Characteristics - X X - X X School Characteristics - - X - - X Year Effect X X X X X X Teacher Random Effect X X X - - - School Random Effect - - - X X X Observations 51,695 51,695 51,695 51,695 51,695 51,695 Number of unique teachers 11,645 11,645 11,645 - - - Number of unique schools - - - 913 913 913
1. Standard error clustered at the teacher level 2. *** p<0.01, ** p<0.05, * p<0.1 3. The control variables for teacher characteristics were: gender, total experience, and degree. 4. The control variables for school characteristics were: free or reduced-price lunch, achievement score, location, grade level, school size, and proportion of Minoritized students.