30

Effective CRM Using Predictive Analytics
Effective CRM Using Predictive Analytics
Antonios Chorianopoulos
This edition first published 2016copy 2016 John Wiley amp Sons Ltd
Registered OfficeJohn Wiley amp Sons Ltd The Atrium Southern Gate Chichester West Sussex PO19 8SQ United Kingdom
For details of our global editorial offices for customer services and for information about how to apply for permission to reuse the copyright material in this book please see our website at wwwwileycom
The right of the author to be identified as the author of this work has been asserted in accordance with the Copyright Designs and Patents Act 1988
All rights reserved No part of this publication may be reproduced stored in a retrieval system or transmitted in any form or by any means electronic mechanical photocopying recording or otherwise except as permitted by the UK Copyright Designs and Patents Act 1988 without the prior permission of the publisher
Wiley also publishes its books in a variety of electronic formats Some content that appears in print may not be available in electronic books
Designations used by companies to distinguish their products are often claimed as trademarks All brand names and product names used in this book are trade names service marks trademarks or registered trademarks of their respective owners The publisher is not associated with any product or vendor mentioned in this book
Limit of LiabilityDisclaimer of Warranty While the publisher and author have used their best efforts in preparing this book they make no representations or warranties with respect to the accuracy or completeness of the contents of this book and specifically disclaim any implied warranties of merchantability or fitness for a particular purpose It is sold on the understanding that the publisher is not engaged in rendering professional services and neither the publisher nor the author shall be liable for damages arising herefrom If professional advice or other expert assistance is required the services of a competent professional should be sought
Library of Congress Cataloging‐in‐Publication Data
Chorianopoulos AntoniosEffective CRM using predictive analytics Antonios Chorianopoulos pages cm Includes bibliographical references and index ISBN 978-1-119-01155-2 (cloth)1 Customer relationsndashManagementndashData processing 2 Data mining I Title HF54155C4786 2015 6588prime12ndashdc23 2015020804
A catalogue record for this book is available from the British Library
Cover image Baitong333iStockphoto
Set in 1012pt Times by SPi Global Pondicherry India
1 2016
To my daughter Eugenia and my wife Virginia
Contents
Preface xiii
Acknowledgments xv
1 An overview of data mining The applications the methodology the algorithms and the data 111 The applications 112 The methodology 413 The algorithms 6
131 Supervised models 61311 Classification models 71312 Estimation (regression) models 91313 Feature selection (field screening) 10
132 Unsupervised models 101321 Cluster models 111322 Association (affinity) and sequence models 121323 Dimensionality reduction models 141324 Record screening models 14
14 The data 15141 The mining datamart 16142 The required data per industry 16143 The customer ldquosignaturerdquo from the mining datamart
to the enriched marketing reference table 1615 Summary 20
Part I The Methodology 21
2 Classification modeling methodology 2321 An overview of the methodology for classification modeling 2322 Business understanding and design of the process 24
221 Definition of the business objective 24222 Definition of the mining approach and of the data model 26223 Design of the modeling process 27
2231 Defining the modeling population 272232 Determining the modeling (analysis) level 282233 Definition of the target event and population 282234 Deciding on time frames 29
23 Data understanding preparation and enrichment 33231 Investigation of data sources 34232 Selecting the data sources to be used 34
viii ConTEnTS
233 Data integration and aggregation 35234 Data exploration validation and cleaning 35235 Data transformations and enrichment 38236 Applying a validation technique 40
2361 Split or Holdout validation 402362 Cross or n‐fold validation 452363 Bootstrap validation 47
237 Dealing with imbalanced and rare outcomes 482371 Balancing 482372 Applying class weights 53
24 Classification modeling 57241 Trying different models and parameter settings 57242 Combining models 60
2421 Bagging 612422 Boosting 622423 Random Forests 63
25 Model evaluation 64251 Thorough evaluation of the model accuracy 65
2511 Accuracy measures and confusion matrices 662512 Gains Response and Lift charts 702513 RoC curve 782514 ProfitRoI charts 81
252 Evaluating a deployed model with testndashcontrol groups 8526 Model deployment 88
261 Scoring customers to roll the marketing campaign 882611 Building propensity segments 93
262 Designing a deployment procedure and disseminating the results 9427 Using classification models in direct marketing campaigns 9428 Acquisition modeling 95
2811 Pilot campaign 952812 Profiling of high‐value customers 96
29 Cross‐selling modeling 972911 Pilot campaign 982912 Product uptake 982913 Profiling of owners 99
210 offer optimization with next best product campaigns 100211 Deep‐selling modeling 102
21111 Pilot campaign 10221112 Usage increase 10321113 Profiling of customers with heavy product usage 104
212 Up‐selling modeling 10521211 Pilot campaign 10521212 Product upgrade 10721213 Profiling of ldquopremiumrdquo product owners 107
213 Voluntary churn modeling 108214 Summary of what wersquove learned so far itrsquos not about the tool or the
modeling algorithm Itrsquos about the methodology and the design of the process 111
ConTEnTS ix
3 Behavioral segmentation methodology 11231 An introduction to customer segmentation 11232 An overview of the behavioral segmentation methodology 11333 Business understanding and design of the segmentation process 115
331 Definition of the business objective 115332 Design of the modeling process 115
3321 Selecting the segmentation population 1153322 Selection of the appropriate segmentation criteria 1163323 Determining the segmentation level 1163324 Selecting the observation window 116
34 Data understanding preparation and enrichment 117341 Investigation of data sources 117342 Selecting the data to be used 117343 Data integration and aggregation 118344 Data exploration validation and cleaning 118345 Data transformations and enrichment 122346 Input set reduction 124
35 Identification of the segments with cluster modeling 12636 Evaluation and profiling of the revealed segments 128
361 ldquoTechnicalrdquo evaluation of the clustering solution 128362 Profiling of the revealed segments 132363 Using marketing research information to evaluate the clusters
and enrich their profiles 138364 Selecting the optimal cluster solution and labeling the segments 139
37 Deployment of the segmentation solution design and delivery of differentiated strategies 139371 Building the customer scoring model for updating the segments 140
3711 Building a Decision Tree for scoring fine‐tuning the segments 141372 Distribution of the segmentation information 141373 Design and delivery of differentiated strategies 142
38 Summary 142
Part II The Algorithms 143
4 Classification algorithms 14541 Data mining algorithms for classification 14542 An overview of Decision Trees 14643 The main steps of Decision Tree algorithms 146
431 Handling of predictors by Decision Tree models 148432 Using terminating criteria to prevent trivial tree growing 149433 Tree pruning 150
44 CART C50C45 and CHAID and their attribute selection measures 150441 The Gini index used by CART 151442 The Information Gain Ratio index used by C50C45 155443 The chi‐square test used by CHAID 158
45 Bayesian networks 17046 naiumlve Bayesian networks 172
x ConTEnTS
47 Bayesian belief networks 17648 Support vector machines 184
481 Linearly separable data 184482 Linearly inseparable data 187
49 Summary 191
5 Segmentation algorithms 19251 Segmenting customers with data mining algorithms 19252 Principal components analysis 192
521 How many components to extract 1945211 The eigenvalue (or latent root) criterion 1965212 The percentage of variance criterion 1975213 The scree test criterion 1985214 The interpretability and business meaning of the components 198
522 What is the meaning of each component 199523 Moving along with the component scores 201
53 Clustering algorithms 203531 Clustering with K‐means 204532 Clustering with TwoStep 211
54 Summary 213
Part III The Case Studies 215
6 A voluntary churn propensity model for credit card holders 21761 The business objective 21762 The mining approach 218
621 Designing the churn propensity model process 2186211 Selecting the data sources and the predictors 2186212 Modeling population and level of data 2186213 Target population and churn definition 2186214 Time periods and historical information required 219
63 The data dictionary 21964 The data preparation procedure 221
641 From cards to customers aggregating card‐level data 221642 Enriching customer data 225643 Defining the modeling population and the target field 228
65 Derived fields the final data dictionary 23266 The modeling procedure 232
661 Applying a Split (Holdout) validation splitting the modeling dataset for evaluation purposes 232
662 Balancing the distribution of the target field 232663 Setting the role of the fields in the model 239664 Training the churn model 239
67 Understanding and evaluating the models 24168 Model deployment using churn propensities to target
the retention campaign 248
ConTEnTS xi
69 The voluntary churn model revisited using RapidMiner 251691 Loading the data and setting the roles of the attributes 251692 Applying a Split (Holdout) validation and adjusting the imbalance
of the target fieldrsquos distribution 252693 Developing a naiumlve Bayes model for identifying potential churners 252694 Evaluating the performance of the model and deploying it
to calculate churn propensities 253610 Developing the churn model with Data Mining for Excel 254
6101 Building the model using the Classify Wizard 2566102 Selecting the classification algorithm and its parameters 2576103 Applying a Split (Holdout) validation 2576104 Browsing the Decision Tree model 2596105 Validation of the model performance 2596106 Model deployment 263
611 Summary 266
7 Value segmentation and cross‐selling in retail 26771 The business background and objective 26772 An outline of the data preparation procedure 26873 The data dictionary 27274 The data preparation procedure 272
741 Pivoting and aggregating transactional data at a customer level 272742 Enriching customer data and building the customer signature 276
75 The data dictionary of the modeling file 27976 Value segmentation 285
761 Grouping customers according to their value 285762 Value segments exploration and marketing usage 287
77 The recency frequency and monetary (RFM) analysis 290771 RFM basics 290
78 The RFM cell segmentation procedure 29379 Setting up a cross‐selling model 295710 The mining approach 295
7101 Designing the cross‐selling model process 29671011 The data and the predictors 29671012 Modeling population and level of data 29671013 Target population and definition of target attribute 29671014 Time periods and historical information required 296
711 The modeling procedure 2967111 Preparing the test campaign and loading the campaign responses
for modeling 2987112 Applying a Split (Holdout) validation splitting the modeling
dataset for evaluation purposes 2987113 Setting the roles of the attributes 2997114 Training the cross‐sell model 300
712 Browsing the model results and assessing the predictive accuracy of the classifiers 301
xii ConTEnTS
713 Deploying the model and preparing the cross‐selling campaign list 308714 The retail case study using RapidMiner 309
7141 Value segmentation and RFM cells analysis 3107142 Developing the cross‐selling model 3127143 Applying a Split (Holdout) validation 3137144 Developing a Decision Tree model with Bagging 3147145 Evaluating the performance of the model 3177146 Deploying the model and scoring customers 317
715 Building the cross‐selling model with Data Mining for Excel 3197151 Using the Classify Wizard to develop the model 3197152 Selecting a classification algorithm and setting the parameters 3207153 Applying a Split (Holdout) validation 3227154 Browsing the Decision Tree model 3227155 Validation of the model performance 3257156 Model deployment 329
716 Summary 331
8 Segmentation application in telecommunications 33281 Mobile telephony the business background and objective 33282 The segmentation procedure 333
821 Selecting the segmentation population the mobile telephony core segments 333
822 Deciding the segmentation level 335823 Selecting the segmentation dimensions 335824 Time frames and historical information analyzed 335
83 The data preparation procedure 33584 The data dictionary and the segmentation fields 33685 The modeling procedure 336
851 Preparing data for clustering combining fields into data components 340
852 Identifying the segments with a cluster model 342853 Profiling and understanding the clusters 344854 Segmentation deployment 354
86 Segmentation using RapidMiner and K‐means cluster 354861 Clustering with the K‐means algorithm 354
87 Summary 359
Bibliography 360
Index 362
Preface
This book is in a way the ldquosequelrdquo of the first book that I wrote together with Konstantinos Tsiptsis It follows the same principles aiming to be an applied guide rather than a generic reference book on predictive analytics and data mining There are many excellent well‐written books that succeed in presenting the theoretical background of the data mining algorithms But the scope of this book is to enlighten the usage of these algorithms in marketing applica-tions and to transfer domain expertise and knowledge Thatrsquos why it is packed with real‐world case studies which are presented with the use of three powerful and popular software tools IBM SPSS Modeler RapidMiner and Data Mining for Excel
Here are a few words on the bookrsquos structure and some tips on ldquohow to read the bookrdquo The book is organized in three main parts
Part I the Methodology Chapters 2 and 3 I strongly believe that these sections are among the strong points of the book Part I provides a methodological roadmap covering both the technical and the business aspects for designing and carrying out optimized marketing actions using predictive analytics The data mining process is presented in detail along with specific guidelines for the development of targeted acquisition cross‐deep‐up‐selling and retention campaigns as well as effective customer segmentation schemes
Part II the Algorithms Chapters 4 and 5 This part is dedicated in introducing the main concepts of some of the most popular and powerful data mining algorithms for classification and clustering The data mining algorithms are explained in a simple and comprehensive language for business users with no technical expertise The intention is to demystify the main concepts of the algorithms rather than ldquodivingrdquo deep in mathematical explanations and formulas so that data mining and marketing practitioners can confidently deploy them in their everyday business problems
Part III the Case Studies Chapters 6 7 and 8 And then itrsquos ldquoaction timerdquo The third part of the book is the ldquohands‐onrdquo part Three case studies from banking retail and telephony are presented in detail following the specific methodological steps explained in the previous chapters The concept is to apply the methodological ldquoblueprintsrdquo of Chapters 2 and 3 in real‐world applications and to bridge the gap between analytics and their use in CRM Given the level of detail and the accompanying material the case studies can be considered as ldquoapplication templatesrdquo for developing similar applications The software tools are presented in that context
In the bookrsquos companion website you can access the material from each case study including the datasets and the relevant code This material is an inseparable part of the book and Irsquod strongly suggest exploring and experimenting with it to gain full advantage of the book
Those interested in segmentation and its marketing usage are strongly encouraged to look for the previous title Konstantinos Tsiptsis and Antonios Chorianopoulos Data Mining Techniques in CRM Inside Customer Segmentation Wiley New York 2009
xiv PREfACE
finally I would really like to thank all the readers of the first book for their warm acceptance all those who read or reviewed the book and all those who contacted us to share kind and encouraging words about how much they liked it They truly inspired the creation of this new book I really hope that this title meets their expectations
Acknowledgments
Special thanks to Ioanna Koutrouvis and Vassilis Panagos at PREDICTA (httpwwwpredictagr) for their support
Effective CRM using Predictive Analytics First Edition Antonios Chorianopoulos copy 2016 John Wiley amp Sons Ltd Published 2016 by John Wiley amp Sons LtdCompanion website wwwwileycomgochorianopouloseffective_crm
1
An overview of data mining The applications the methodology the algorithms and the data
11 The applications
Customers are the most important asset of an organization Thatrsquos why an organization should plan and employ a clear strategy for customer handling Customer relationship management (CRM) is the strategy for building managing and strengthening loyal and long‐lasting customer rela-tionships CRM should be a customer‐centric approach based on customer insight Its scope should be the ldquopersonalizedrdquo handling of the customers as distinct entities through the identification and understanding of their differentiated needs preferences and behaviors
CRM aims at two main objectives
1 Customer retention through customer satisfaction
2 Customer development
Data mining can provide customer insight which is vital for these objectives and for establish-ing an effective CRM strategy It can lead to personalized interactions with customers and hence increased satisfaction and profitable customer relationships through data analysis It can offer individualized and optimized customer management throughout all the phases of the cus-tomer life cycle from acquisition and establishment of a strong relationship to attrition preven-tion and win‐back of lost customers Marketers strive to get a greater market share and a greater share of their customers In plain words they are responsible for getting developing and keeping the customers Data mining can help them in all these tasks as shown in Figure 11
2 EFFECTIvE CRM usIng PREDICTIvE AnAlyTICs
More specifically the marketing activities that can be supported with the use of data mining include
Customer segmentation
segmentation is the process of dividing the customer base in distinct and homogeneous groups in order to develop differentiated marketing strategies according to their character-istics There are many different segmentation types according to the specific criteriaattrib-utes used for segmentation In behavioral segmentation customers are grouped based on behavioral and usage characteristics Although behavioral segments can be created using business rules this approach has inherent disadvantages It can handle only a few segmentation fields and its objectivity is questionable as it is based on the personal per-ceptions of a business expert Data mining on the other hand can create data‐driven behavioral segments Clustering algorithms can analyze behavioral data identify the natural groupings of customers and suggest a grouping founded on observed data patterns Provided it is properly built it can uncover groups with distinct profiles and characteristics and lead to rich actionable segmentation schemes with business meaning and value
Data mining can also be used for the development of segmentation schemes based on the current or expectedestimated value of the customers These segments are necessary in order to prioritize the customer handling and the marketing interventions according to the importance of each customer
Direct marketing campaigns
Marketers carry out direct marketing campaigns to communicate a message to their cus-tomers through mail Internet e‐mail telemarketing (phone) and other direct channels in order to prevent churn (attrition) and drive customer acquisition and purchase of add‐on products More specifically acquisition campaigns aim at drawing new and potentially valuable customers from the competition Crossdeepup‐selling campaigns are rolled out
Customervalue
Timecustomer lifecycle
GetcustomersAcquisition
models
Establish ampdevelop
customersCrossup
deep sellingmodels
Retaincustomers
Attritionmodels
Figure 11 Data mining and customer life cycle management Source Tsiptsis and Chorianopoulos (2009) Reproduced with permission from Wiley
An ovERvIEw oF DATA MInIng 3
to sell additional products more of the same product or alternative but more profitable products to the existing customers Finally retention campaigns aim at preventing valuable customers from terminating their relationship with the organization
These campaigns although potentially effective when not refined can also lead to a huge waste of resources and to the annoyance of customers with unsolicited communica-tion Data mining and classification (propensity) models in particular can support the development of targeted marketing campaigns They analyze the customer characteristics and recognize the profile of the target customers new cases with similar profiles are then identified assigned a high propensity score and included in the target lists Table 11 sum-marizes the use of data mining models in direct marketing campaigns
when properly built propensity models can identify the right customers to contact and lead to campaign lists with increased concentrations of target customers They outperform random selections as well as predictions based on business rules and personal intuitions
Table 11 Data mining models and direct marketing campaigns
Business objective Marketing campaign Data mining models
getting customers Acquisition finding new customers and expanding the customer base with new and potentially profitable customers
Acquisition classification models can be used to recognize potentially profitable prospect customers by finding ldquoclonesrdquo of existing valuable customers in lists of contacts
Developing customers
Cross selling promoting and selling additional productsservices to existing customers
up selling offering and switching customers to premium products other products more profitable than the ones that already have
Deep selling increasing usage of the productsservices that customers already have
Crossupdeep‐selling classification models can reveal the existing customers with purchase potentials
Retaining customers
Retention prevention of voluntary churn with priority given to presently or potentially valuable customers at risk
voluntary attrition (churn) models can identify early churn signals and discern the customers with increased likelihood of voluntary churn
source Tsiptsis and Chorianopoulos (2009)
4 EFFECTIvE CRM usIng PREDICTIvE AnAlyTICs
Market basket and sequence analysis Data mining and association models in particular can be used to identify related products typically purchased together These models can be used for market basket analysis and for the revealing of bundles of productsservices that can be sold together sequence models take into account the order of actionspurchases and can identify sequences of events
12 The methodology
The modeling phase is just one phase in the implementation process of a data mining project steps of critical importance precede and follow the model building and have a significant effect in the success of the project An outline of the basic phases in the development of a data mining project according to the Cross Industry standard Process for Data Mining (CRIsP‐DM) process model is presented in Table 12
Data mining projects are not simple They may end in business failure if the engaged team is not guided by a clear methodological framework The CRIsP‐DM process model charts the steps that should be followed for successful data mining implementations These steps are
Business understanding The data mining project should start with the understanding of the business objective and the assessment of the current situation The projectrsquos param-eters should be considered including resources and limitations The business objective should be translated to a data mining goal success criteria should be defined and a project plan should be developed
Data understanding This phase involves considering the data requirements for properly addressing the defined goal and an investigation on the availability of the required data This phase also includes an initial data collection and exploration with summary statistics and visualization tools to understand the data and identify potential problems of availability and quality
Data preparation The data to be used should be identified selected and prepared for inclusion in the data mining model This phase involves the data acquisition integration and formatting according to the needs of the project The consolidated data should then be cleaned and properly transformed according to the requirements of the algorithm to be applied new fields such as sums averages ratios flags etc should be derived from the original fields to enrich the customer information better summarize the customer characteristics and therefore enhance the performance of the models
Modeling The processed data are then used for model training Analysts should select the appropriate modeling technique for the particular business objective Before the training of the models and especially in the case of predictive modeling the modeling dataset should be partitioned so that the modelrsquos performance is evaluated on a separate validation dataset This phase involves the examination of alternative modeling algo-rithms and parameter settings and a comparison of their performance in order to find the one that yields the best results Based on an initial evaluation of the model results the model settings can be revised and fine‐tuned
Evaluation The generated models are then formally evaluated not only in terms of technical measures but more importantly in the context of the business success criteria set in the business understanding phase The project team should decide whether the
An ovERvIEw oF DATA MInIng 5
results of a given model properly address the initial business objectives If so this model is approved and prepared for deployment
Deployment The projectrsquos findings and conclusions are summarized in a report but this is hardly the end of the project Even the best model will turn out to be a business failure if its results are not deployed and integrated in the organizationrsquos everyday marketing operations A procedure should be designed and developed that will enable the scoring of customers and the update of the results The deployment procedure should also enable the distribution of the model results throughout the enterprise and their incorporation in the organizationrsquos data warehouse and opera-tional CRM system Finally a maintenance plan should be designed and the whole process should be reviewed lessons learned should be taken into account and next steps should be planned
Table 12 The CRIsP‐DM phases
1 Business understanding 2 Data understanding 3 Data preparation understanding of the
business goal situation assessment Translating the business
goal to a data mining objective
Development of a project plan
Considering data requirements
Initial data collectionexploration and quality assessment
selection of required data Data acquisition Data integration and
formatting (mergejoins aggregations)
Data cleaning Data transformations and
enrichment (regroupingbinning of existing fields creation of derived attributes and KPIs ratios flag fields averages sums etc)
4 Modeling 5 Model evaluation 6 Deployment selection of the appropriate
modeling technique Especially in the case of
predictive models splitting of the dataset into training and testing subsets for evaluation purposes
Development and examination of alternative modeling algorithms and parameter settings
Fine‐tuning of the model settings according to an initial assessment of the modelrsquos performance
Evaluation of the models in the context of the business success criteria
Model approval
Create a report of findings
Planning and development of the deployment procedure
Deployment of the data mining model
Distribution of the model results and integration in the organizationrsquos operational CRM system
Development of a maintenancendashupdate plan
Review of the project Planning of next steps
source Tsiptsis and Chorianopoulos (2009) Reproduced with permission from wiley
6 EFFECTIvE CRM usIng PREDICTIvE AnAlyTICs
The aforementioned phases present strong dependencies and the outcomes of a phase may lead to revisiting and reviewing the results of preceding phases The nature of the process is cyclical since the data mining itself is a never‐ending journey and quest demanding continuous reassess-ment and update of completed tasks in the context of a rapidly changing business environment
This book contains two chapters dedicated in the methodological framework of classification and behavioral segmentation modeling In these chapters the recommended approach for these applications is elaborated and presented as a step‐by‐step guide
13 The algorithms
Data mining models employ statistical or machine‐learning algorithms to identify useful data patterns and understand and predict behaviors They can be grouped in two main classes according to their goal
1 Supervisedpredictive modelsIn supervised also referred to as predictive directed or targeted modeling the goal is to predict an event or estimate the values of a continuous numeric attribute In these models there are input fields and an output or target field Inputs are also called pre-dictors because they are used by the algorithm for the identification of a prediction function for the output we can think of predictors as the ldquoXrdquo part of the function and the target field as the ldquoyrdquo part the outcome
The algorithm associates the outcome with input data patterns Pattern recognition is ldquosupervisedrdquo by the target field Relationships are established between the inputs and the output An inputndashoutput ldquomapping functionrdquo is generated by the algorithm that associates predictors with the output and permits the prediction of the output values given the values of the inputs
2 Unsupervised modelsIn unsupervised or undirected models there is no output just inputs The pattern rec-ognition is undirected it is not guided by a specific target field The goal of the algorithm is to uncover data patterns in the set of inputs and identify groups of similar cases groups of correlated fields frequent itemsets or anomalous records
131 Supervised models
Models learn from past cases In order for predictive algorithms to associate input data pat-terns with specific outcomes it is necessary to present them cases with known outcomes This phase is called the training phase During that phase the predictive algorithm builds the function that connects the inputs with the target once the relationships are identified and the model is evaluated and proved of satisfactory predictive power the scoring phase follows new records for which the outcome values are unknown are presented to the model and scored accordingly
some predictive algorithms such as regression and Decision Trees are transparent providing an explanation of their results Besides prediction these algorithms can also be used for insight and profiling They can identify inputs with a significant effect on the target attribute for example drivers of customer satisfaction or attrition and they can reveal the type and the magnitude of their effect
An ovERvIEw oF DATA MInIng 7
According to their scope and the measurement level of the field to be predicted supervised models are further categorized into
1 Classification or propensity modelsClassification or propensity models predict categorical outcomes Their goal is to classify new cases to predefined classes in other words to predict an event The classification algorithm estimates a propensity score for each new case The propen-sity score denotes the likelihood of occurrence of the target event
2 Estimation (regression) modelsEstimation models are similar to classification models with one big difference They are used for predicting the value of a continuous output based on the observed values of the inputs
3 Feature selectionThese models are used as a preparation step preceding the development of a predictive model Feature selection algorithms assess the predictive importance of the inputs and identify the significant ones Predictors with trivial predictive power are discarded from the subsequent modeling steps
1311 Classification models
Classification models predict categorical outcomes by using a set of inputs and a historical dataset with preclassified data generated models are then used to predict event occurrence and classify unseen records Typical examples of target categorical fields include
Accepted a marketing offer yesno
Defaulted yesno
Churned yesno
In the heart of all classification models is the estimation of confidence scores These scores denote the likelihood of the predicted outcome They are estimates of the probability of occur-rence of the respective event typically ranging from 0 to 1 Confidence scores can be translated to propensity scores which signify the likelihood of a particular target class the propensity of a customer to churn to buy a specific add‐on product or to default on his loan Propensity scores allow for the rank ordering of customers according to their likelihood This feature enables mar-keters to target their lists and optimally tailor their campaign sizes according to their resources and marketing objectives They can expand or narrow their target lists on the base of their particular objectives always targeting the customers with the relatively higher probabilities
Popular classification algorithms include
Decision Trees Decision Trees apply recursive partitions to the initial population For each split (partition) they automatically select the most significant predictor the predictor that yields the best separation in respect to the target filed Through succes-sive partitions their goal is to produce ldquopurerdquo subsegments with homogeneous behavior in terms of the output They are perhaps the most popular classification tech-nique Part of their popularity is because they produce transparent results that are easily interpretable offering insight in the event under study The produced results can have
8 EFFECTIvE CRM usIng PREDICTIvE AnAlyTICs
two equivalent formats In a rule format results are represented in plain English as ordinary rules
IF (PREDICToR vAluEs) THEN (TARgET ouTCoME amp ConFIDEnCE sCoRE)
For exampleIF (gender = Male and Profession = white Colar and sMs_usage gt 60 messages per month) THEN Prediction = Buyer and Confidence = 095
In a tree format rules are graphically represented as a tree in which the initial population (root node) is successively partitioned into terminal (leaf) nodes with similar behavior in respect to the target fieldDecision Tree algorithms are fast and scalable Available algorithms include
C45C50 CHAID Classification and regression trees (CART)
Decision rules They are quite similar to Decision Trees and produce a list of rules which have the format of human understandable statements IF (PREDICToR vAluEs) THEn (TARgET ouTCoME amp ConFIDEnCE sCoREs) Their main difference from Decision Trees is that they may produce multiple rules for each record Decision Trees generate exhaustive and mutually exclusive rules which cover all records For each record only one rule applies on the contrary decision rules may generate an overlapping set of rules More than one rule with different predictions may hold true for each record In that case through an integrated voting procedure rules are evaluated and compared or combined to determine the final prediction and confidence
Logistic regression This is a powerful and well‐established statistical algorithm that estimates the probabilities of the target classes It is analogous to simple linear regres-sion but for categorical outcomes logistic regression results have the form of contin-uous functions that estimate membership probabilities of the target classes
lnp
pb b Xj
k ii i0
where pj = probability of the target class j p
k probability of the reference target class k
Xi the predictors b
i the regression coefficients and b
0 the intercept of the model The
regression coefficients represent the effect of predictorsFor example in the case of a binary target denoting churn
lnchurn probability
no churn probabilitytenureb b0 1middot b2middot num of products
In order to yield optimal results it may require special data preparation including potential screening and transformation (optimal binning) of the predictors It demands some statistical experience yet provided it is built properly it can produce stable and understandable results
Neural networks neural networks are powerful machine‐learning algorithms that use complex nonlinear mapping functions for estimation and classification They
An ovERvIEw oF DATA MInIng 9
consist of neurons organized in layers The input layer contains the predictors or input neurons The output layer includes the target field These models estimate weights that connect predictors (input layer) to the output Models with more complex topologies may also include intermediate hidden layers and neurons The training procedure is an iterative process Input records with known outcome are presented to the network and model prediction is evaluated in respect to the observed results observed errors are used to adjust and optimize the initial weight estimates They are considered as opaque or ldquoblack boxrdquo solutions since they do not provide an explana-tion of their predictions They only provide a sensitivity analysis which summarizes the predictive importance of the input fields They require minimum statistical knowledge but depending on the problem may require long processing times for training
Support Vector Machine (SVM) svM is a classification algorithm that can model highly nonlinear complex data patterns and avoid overfitting that is the situation in which a model memorizes patterns only relevant to the specific cases analyzed svM works by mapping data to a high‐dimensional feature space in which records become more easily separable (ie separated by linear functions) in respect to the target cate-gories Input training data are appropriately transformed through nonlinear kernel functions and this transformation is followed by a search for simpler functions that is linear functions which optimally separate cases Analysts typically experiment with different kernel functions and compare the results overall svM is an effective yet demanding algorithm in terms of processing time and resources Additionally it lacks transparency since the predictions are not explained and only the importance of predictors is summarized
Bayesian networks Bayesian networks are statistical models based on the Bayes the-orem They are probabilistic models as they estimate the probabilities of belonging to each target class Bayesian belief networks in particular are graphical models which provide a visual representation of the attribute relationships ensuring transparency and explanation of the model rationale
1312 Estimation (regression) models
Estimation models also referred to as regression models deal with continuous numeric out-comes By using linear or nonlinear functions they use the input fields to estimate the unknown values of a continuous target field
Estimation algorithms can be used to predict attributes like the following
The expected balance of the savings accounts of the customers of a bank in the near future
The estimated loss given default (lgD) incurred after a customer has defaulted
The expected revenue from a customer within a specified time period
A dataset with historical data and known values of the continuous output is required for the model training A mapping function is then identified that associates the available inputs to the output values These models are also referred to as regression models after the well‐known
10 EFFECTIvE CRM usIng PREDICTIvE AnAlyTICs
and established statistical algorithm of ordinary least squares regression (OLSR) The olsR estimates the line that best fits the data and minimizes the observed errors the so‐called least squares line It requires some statistical experience and since it is sensitive to possible viola-tions of its assumptions it may require specific data examination and processing before building The final model has the intuitive form of a linear function with coefficients denoting the effect of predictors to the outcome Although transparent it has inherent limitations that may affect its performance in complex situations of nonlinear relationships and interactions between predictors
nowadays traditional regression is not the only available estimation algorithm new techniques with less stringent assumptions which also capture nonlinear relationships can also be employed to handle continuous outcomes More specifically polynomial regression neural networks SVM and regression trees such as CART can also be employed for the pre-diction of continuous attributes
1313 Feature selection (field screening)
The feature selection (field screening) process is a preparation step for the development of classification and estimation (regression) models The situation of having hundreds of candi-date predictors is not an unusual case in complicated data mining tasks some of these fields though may not have an influence to the output that we want to predict
The basic idea of feature selection is to use basic statistical measures to assess and quantify the relationship of the inputs to the output More specifically feature selection is used to
Assess all the available inputs and rank them according to their association with the outcome
Identify the key predictors the most relevant features for classification or regression
screen the predictors with marginal importance reducing the set of inputs to those related to the target field
some predictive algorithms including Decision Trees integrate screening mechanisms that internally filter out the unrelated predictors A preprocessing feature selection step is also available in Data Mining for Excel and it can be invoked when building a predictive model Feature selection can efficiently reduce data dimensionality retaining only a subset of significant inputs so that the training time is reduced with no or insignificant loss of accuracy
132 Unsupervised models
In unsupervised modeling only input fields are involved The scope is the identification of groupings and associations unsupervised models include
1 Cluster modelsIn cluster models the groups are not known in advance Instead the algorithms ana-lyze the input data patterns and identify the natural groupings of instancescases when new cases are scored by the generated cluster model they are assigned into one of the revealed clusters
An ovERvIEw oF DATA MInIng 11
2 Association (affinity) and sequence modelsAssociation and sequence models also belong to the class of unsupervised algorithms Association models do not involve direct prediction of a single field In fact all fields have a double role since they act as inputs and outputs at the same time Association algorithms detect associations between discrete events products and attributes sequence algorithms detect associations over time
3 Dimensionality reduction modelsDimensionality reduction algorithms ldquogrouprdquo fields into new compound measures and reduce the dimensions of data without sacrificing much of the information of the original fields
1321 Cluster models
Cluster models automatically detect the underlying groups of cases the clusters The clusters are not known in advance They are revealed by analyzing the observed input data patterns Clustering algorithms assess the similarity of the recordscustomers in respect to the clus-tering fields and they assign them to the revealed clusters accordingly Their goal is to detect groups with internal homogeneity and interclass heterogeneity
Clustering algorithms are quite popular and their use is widespread from data mining to market research They can support the development of different segmentation schemes according to the clustering attributes used behavioral attitudinal or demographical segmentation
The major advantage of the clustering algorithms is that they can efficiently manage a large number of attributes and create data‐driven segments The revealed segments are not based on personal concepts intuitions and perceptions of the business people They are induced by the observed data patterns and provided they are properly built they can lead to results with real business meaning and value Clustering models can analyze complex input data patterns and suggest solutions that would not otherwise be apparent They reveal cus-tomer typologies enabling tailored marketing strategies
nowadays various clustering algorithms are available which differ in their approach for assessing the similarity of the cases According to the way they work and their outputs the clustering algorithms can be categorized in two classes the hard and the soft clustering algo-rithms The hard clustering algorithms assess the distances (dissimilarities) of the instances The revealed clusters do not overlap and each case is assigned to a single cluster
Hard clustering algorithms include
Agglomerative or hierarchical In a way it is the ldquomotherrdquo of all clustering algo-rithms It is called hierarchical or agglomerative since it starts by a solution where each record comprises a cluster and gradually groups records up to the point where all records fall into one supercluster In each step it calculates the distances between all pairs of records and groups the ones most similar A table (agglomeration schedule) or a graph (dendrogram) summarizes the grouping steps and the respective distances The analyst should then consult this information identify the point where the algorithm starts to group disjoint cases and then decide on the number of clusters to retain This algorithm cannot effectively handle more than a few thousand cases Thus it cannot be directly applied in most business clustering tasks A usual work-around is to a use it on a sample of the clustering population However with numerous
12 EFFECTIvE CRM usIng PREDICTIvE AnAlyTICs
other efficient algorithms that can easily handle even millions of records clustering through sampling is not considered an ideal approach
K‐means K‐means is an efficient and perhaps the fastest clustering algorithm that can handle both long (many records) and wide datasets (many data dimensions and input fields) In K‐means each cluster is represented by its centroid the central point defined by the averages of the inputs K‐means is an iterative distance‐based clustering algorithm in which cases are assigned to the ldquonearestrdquo cluster unlike hierarchical it does not need to calculate distances between all pairs of records The number of clus-ters to be formed is predetermined and specified by the user in advance Thus usually a number of different solutions should be tried and evaluated before approving the most appropriate It best handles continuous clustering fields
K‐medoids K‐medoids is a K‐means variant which differs from K‐means in the way clusters are represented during the model training phase In K‐means each cluster is represented by the averages of inputs In K‐medoids each cluster is represented by an actual representative data point instead of using the hypothetical point defined by the cluster means This makes this algorithm less sensitive to outliers
TwoStep cluster A scalable and efficient clustering model based on the BIRCH algorithm included in IBM sPss Modeler As the name implies it processes records in two steps The first step of preclustering makes a single pass of the data and records are assigned to a limited set of initial subclusters In the second step initial subclusters are further grouped into the final segments
Kohonen NetworkSelf‐Organizing Map (SOM) Kohonen networks are based on neural networks and they typically produce a two‐dimensional grid or map of the clus-ters hence the name soM Kohonen networks usually take longer time to train than K‐means and Twostep but they provide a different and worth trying view on clustering
The soft clustering techniques on the other end use probabilistic measures to assign the cases to clusters with a certain probabilities The clusters can overlap and the instances can belong to more than one cluster with certain estimated probabilities The most popular probabilistic clustering algorithm is Expectation Maximization (EM) clustering
1322 Association (affinity) and sequence models
Association models analyze past co‐occurrences of events and detect associations and fre-quent itemsets They associate a particular outcome category with a set of conditions They are typically used to identify purchase patterns and groups of products often purchased togetherAssociation algorithms generate rules of the following general format
IF (AnTECEDEnTs) THEN ConsEQuEnT
For exampleIF (product A and product C and product E andhellip) THEN product B
More specifically a rule referring to supermarket purchases might beIF Eggs amp MIlK amp FREsH FRuIT THEN vEgETABlEs
This simple rule derived by analyzing past shopping carts identifies associated products that tend to be purchased together when eggs milk and fresh fruit are bought then there is an

Effective CRM Using Predictive Analytics
Effective CRM Using Predictive Analytics
Antonios Chorianopoulos
This edition first published 2016copy 2016 John Wiley amp Sons Ltd
Registered OfficeJohn Wiley amp Sons Ltd The Atrium Southern Gate Chichester West Sussex PO19 8SQ United Kingdom
For details of our global editorial offices for customer services and for information about how to apply for permission to reuse the copyright material in this book please see our website at wwwwileycom
The right of the author to be identified as the author of this work has been asserted in accordance with the Copyright Designs and Patents Act 1988
All rights reserved No part of this publication may be reproduced stored in a retrieval system or transmitted in any form or by any means electronic mechanical photocopying recording or otherwise except as permitted by the UK Copyright Designs and Patents Act 1988 without the prior permission of the publisher
Wiley also publishes its books in a variety of electronic formats Some content that appears in print may not be available in electronic books
Designations used by companies to distinguish their products are often claimed as trademarks All brand names and product names used in this book are trade names service marks trademarks or registered trademarks of their respective owners The publisher is not associated with any product or vendor mentioned in this book
Limit of LiabilityDisclaimer of Warranty While the publisher and author have used their best efforts in preparing this book they make no representations or warranties with respect to the accuracy or completeness of the contents of this book and specifically disclaim any implied warranties of merchantability or fitness for a particular purpose It is sold on the understanding that the publisher is not engaged in rendering professional services and neither the publisher nor the author shall be liable for damages arising herefrom If professional advice or other expert assistance is required the services of a competent professional should be sought
Library of Congress Cataloging‐in‐Publication Data
Chorianopoulos AntoniosEffective CRM using predictive analytics Antonios Chorianopoulos pages cm Includes bibliographical references and index ISBN 978-1-119-01155-2 (cloth)1 Customer relationsndashManagementndashData processing 2 Data mining I Title HF54155C4786 2015 6588prime12ndashdc23 2015020804
A catalogue record for this book is available from the British Library
Cover image Baitong333iStockphoto
Set in 1012pt Times by SPi Global Pondicherry India
1 2016
To my daughter Eugenia and my wife Virginia
Contents
Preface xiii
Acknowledgments xv
1 An overview of data mining The applications the methodology the algorithms and the data 111 The applications 112 The methodology 413 The algorithms 6
131 Supervised models 61311 Classification models 71312 Estimation (regression) models 91313 Feature selection (field screening) 10
132 Unsupervised models 101321 Cluster models 111322 Association (affinity) and sequence models 121323 Dimensionality reduction models 141324 Record screening models 14
14 The data 15141 The mining datamart 16142 The required data per industry 16143 The customer ldquosignaturerdquo from the mining datamart
to the enriched marketing reference table 1615 Summary 20
Part I The Methodology 21
2 Classification modeling methodology 2321 An overview of the methodology for classification modeling 2322 Business understanding and design of the process 24
221 Definition of the business objective 24222 Definition of the mining approach and of the data model 26223 Design of the modeling process 27
2231 Defining the modeling population 272232 Determining the modeling (analysis) level 282233 Definition of the target event and population 282234 Deciding on time frames 29
23 Data understanding preparation and enrichment 33231 Investigation of data sources 34232 Selecting the data sources to be used 34
viii ConTEnTS
233 Data integration and aggregation 35234 Data exploration validation and cleaning 35235 Data transformations and enrichment 38236 Applying a validation technique 40
2361 Split or Holdout validation 402362 Cross or n‐fold validation 452363 Bootstrap validation 47
237 Dealing with imbalanced and rare outcomes 482371 Balancing 482372 Applying class weights 53
24 Classification modeling 57241 Trying different models and parameter settings 57242 Combining models 60
2421 Bagging 612422 Boosting 622423 Random Forests 63
25 Model evaluation 64251 Thorough evaluation of the model accuracy 65
2511 Accuracy measures and confusion matrices 662512 Gains Response and Lift charts 702513 RoC curve 782514 ProfitRoI charts 81
252 Evaluating a deployed model with testndashcontrol groups 8526 Model deployment 88
261 Scoring customers to roll the marketing campaign 882611 Building propensity segments 93
262 Designing a deployment procedure and disseminating the results 9427 Using classification models in direct marketing campaigns 9428 Acquisition modeling 95
2811 Pilot campaign 952812 Profiling of high‐value customers 96
29 Cross‐selling modeling 972911 Pilot campaign 982912 Product uptake 982913 Profiling of owners 99
210 offer optimization with next best product campaigns 100211 Deep‐selling modeling 102
21111 Pilot campaign 10221112 Usage increase 10321113 Profiling of customers with heavy product usage 104
212 Up‐selling modeling 10521211 Pilot campaign 10521212 Product upgrade 10721213 Profiling of ldquopremiumrdquo product owners 107
213 Voluntary churn modeling 108214 Summary of what wersquove learned so far itrsquos not about the tool or the
modeling algorithm Itrsquos about the methodology and the design of the process 111
ConTEnTS ix
3 Behavioral segmentation methodology 11231 An introduction to customer segmentation 11232 An overview of the behavioral segmentation methodology 11333 Business understanding and design of the segmentation process 115
331 Definition of the business objective 115332 Design of the modeling process 115
3321 Selecting the segmentation population 1153322 Selection of the appropriate segmentation criteria 1163323 Determining the segmentation level 1163324 Selecting the observation window 116
34 Data understanding preparation and enrichment 117341 Investigation of data sources 117342 Selecting the data to be used 117343 Data integration and aggregation 118344 Data exploration validation and cleaning 118345 Data transformations and enrichment 122346 Input set reduction 124
35 Identification of the segments with cluster modeling 12636 Evaluation and profiling of the revealed segments 128
361 ldquoTechnicalrdquo evaluation of the clustering solution 128362 Profiling of the revealed segments 132363 Using marketing research information to evaluate the clusters
and enrich their profiles 138364 Selecting the optimal cluster solution and labeling the segments 139
37 Deployment of the segmentation solution design and delivery of differentiated strategies 139371 Building the customer scoring model for updating the segments 140
3711 Building a Decision Tree for scoring fine‐tuning the segments 141372 Distribution of the segmentation information 141373 Design and delivery of differentiated strategies 142
38 Summary 142
Part II The Algorithms 143
4 Classification algorithms 14541 Data mining algorithms for classification 14542 An overview of Decision Trees 14643 The main steps of Decision Tree algorithms 146
431 Handling of predictors by Decision Tree models 148432 Using terminating criteria to prevent trivial tree growing 149433 Tree pruning 150
44 CART C50C45 and CHAID and their attribute selection measures 150441 The Gini index used by CART 151442 The Information Gain Ratio index used by C50C45 155443 The chi‐square test used by CHAID 158
45 Bayesian networks 17046 naiumlve Bayesian networks 172
x ConTEnTS
47 Bayesian belief networks 17648 Support vector machines 184
481 Linearly separable data 184482 Linearly inseparable data 187
49 Summary 191
5 Segmentation algorithms 19251 Segmenting customers with data mining algorithms 19252 Principal components analysis 192
521 How many components to extract 1945211 The eigenvalue (or latent root) criterion 1965212 The percentage of variance criterion 1975213 The scree test criterion 1985214 The interpretability and business meaning of the components 198
522 What is the meaning of each component 199523 Moving along with the component scores 201
53 Clustering algorithms 203531 Clustering with K‐means 204532 Clustering with TwoStep 211
54 Summary 213
Part III The Case Studies 215
6 A voluntary churn propensity model for credit card holders 21761 The business objective 21762 The mining approach 218
621 Designing the churn propensity model process 2186211 Selecting the data sources and the predictors 2186212 Modeling population and level of data 2186213 Target population and churn definition 2186214 Time periods and historical information required 219
63 The data dictionary 21964 The data preparation procedure 221
641 From cards to customers aggregating card‐level data 221642 Enriching customer data 225643 Defining the modeling population and the target field 228
65 Derived fields the final data dictionary 23266 The modeling procedure 232
661 Applying a Split (Holdout) validation splitting the modeling dataset for evaluation purposes 232
662 Balancing the distribution of the target field 232663 Setting the role of the fields in the model 239664 Training the churn model 239
67 Understanding and evaluating the models 24168 Model deployment using churn propensities to target
the retention campaign 248
ConTEnTS xi
69 The voluntary churn model revisited using RapidMiner 251691 Loading the data and setting the roles of the attributes 251692 Applying a Split (Holdout) validation and adjusting the imbalance
of the target fieldrsquos distribution 252693 Developing a naiumlve Bayes model for identifying potential churners 252694 Evaluating the performance of the model and deploying it
to calculate churn propensities 253610 Developing the churn model with Data Mining for Excel 254
6101 Building the model using the Classify Wizard 2566102 Selecting the classification algorithm and its parameters 2576103 Applying a Split (Holdout) validation 2576104 Browsing the Decision Tree model 2596105 Validation of the model performance 2596106 Model deployment 263
611 Summary 266
7 Value segmentation and cross‐selling in retail 26771 The business background and objective 26772 An outline of the data preparation procedure 26873 The data dictionary 27274 The data preparation procedure 272
741 Pivoting and aggregating transactional data at a customer level 272742 Enriching customer data and building the customer signature 276
75 The data dictionary of the modeling file 27976 Value segmentation 285
761 Grouping customers according to their value 285762 Value segments exploration and marketing usage 287
77 The recency frequency and monetary (RFM) analysis 290771 RFM basics 290
78 The RFM cell segmentation procedure 29379 Setting up a cross‐selling model 295710 The mining approach 295
7101 Designing the cross‐selling model process 29671011 The data and the predictors 29671012 Modeling population and level of data 29671013 Target population and definition of target attribute 29671014 Time periods and historical information required 296
711 The modeling procedure 2967111 Preparing the test campaign and loading the campaign responses
for modeling 2987112 Applying a Split (Holdout) validation splitting the modeling
dataset for evaluation purposes 2987113 Setting the roles of the attributes 2997114 Training the cross‐sell model 300
712 Browsing the model results and assessing the predictive accuracy of the classifiers 301
xii ConTEnTS
713 Deploying the model and preparing the cross‐selling campaign list 308714 The retail case study using RapidMiner 309
7141 Value segmentation and RFM cells analysis 3107142 Developing the cross‐selling model 3127143 Applying a Split (Holdout) validation 3137144 Developing a Decision Tree model with Bagging 3147145 Evaluating the performance of the model 3177146 Deploying the model and scoring customers 317
715 Building the cross‐selling model with Data Mining for Excel 3197151 Using the Classify Wizard to develop the model 3197152 Selecting a classification algorithm and setting the parameters 3207153 Applying a Split (Holdout) validation 3227154 Browsing the Decision Tree model 3227155 Validation of the model performance 3257156 Model deployment 329
716 Summary 331
8 Segmentation application in telecommunications 33281 Mobile telephony the business background and objective 33282 The segmentation procedure 333
821 Selecting the segmentation population the mobile telephony core segments 333
822 Deciding the segmentation level 335823 Selecting the segmentation dimensions 335824 Time frames and historical information analyzed 335
83 The data preparation procedure 33584 The data dictionary and the segmentation fields 33685 The modeling procedure 336
851 Preparing data for clustering combining fields into data components 340
852 Identifying the segments with a cluster model 342853 Profiling and understanding the clusters 344854 Segmentation deployment 354
86 Segmentation using RapidMiner and K‐means cluster 354861 Clustering with the K‐means algorithm 354
87 Summary 359
Bibliography 360
Index 362
Preface
This book is in a way the ldquosequelrdquo of the first book that I wrote together with Konstantinos Tsiptsis It follows the same principles aiming to be an applied guide rather than a generic reference book on predictive analytics and data mining There are many excellent well‐written books that succeed in presenting the theoretical background of the data mining algorithms But the scope of this book is to enlighten the usage of these algorithms in marketing applica-tions and to transfer domain expertise and knowledge Thatrsquos why it is packed with real‐world case studies which are presented with the use of three powerful and popular software tools IBM SPSS Modeler RapidMiner and Data Mining for Excel
Here are a few words on the bookrsquos structure and some tips on ldquohow to read the bookrdquo The book is organized in three main parts
Part I the Methodology Chapters 2 and 3 I strongly believe that these sections are among the strong points of the book Part I provides a methodological roadmap covering both the technical and the business aspects for designing and carrying out optimized marketing actions using predictive analytics The data mining process is presented in detail along with specific guidelines for the development of targeted acquisition cross‐deep‐up‐selling and retention campaigns as well as effective customer segmentation schemes
Part II the Algorithms Chapters 4 and 5 This part is dedicated in introducing the main concepts of some of the most popular and powerful data mining algorithms for classification and clustering The data mining algorithms are explained in a simple and comprehensive language for business users with no technical expertise The intention is to demystify the main concepts of the algorithms rather than ldquodivingrdquo deep in mathematical explanations and formulas so that data mining and marketing practitioners can confidently deploy them in their everyday business problems
Part III the Case Studies Chapters 6 7 and 8 And then itrsquos ldquoaction timerdquo The third part of the book is the ldquohands‐onrdquo part Three case studies from banking retail and telephony are presented in detail following the specific methodological steps explained in the previous chapters The concept is to apply the methodological ldquoblueprintsrdquo of Chapters 2 and 3 in real‐world applications and to bridge the gap between analytics and their use in CRM Given the level of detail and the accompanying material the case studies can be considered as ldquoapplication templatesrdquo for developing similar applications The software tools are presented in that context
In the bookrsquos companion website you can access the material from each case study including the datasets and the relevant code This material is an inseparable part of the book and Irsquod strongly suggest exploring and experimenting with it to gain full advantage of the book
Those interested in segmentation and its marketing usage are strongly encouraged to look for the previous title Konstantinos Tsiptsis and Antonios Chorianopoulos Data Mining Techniques in CRM Inside Customer Segmentation Wiley New York 2009
xiv PREfACE
finally I would really like to thank all the readers of the first book for their warm acceptance all those who read or reviewed the book and all those who contacted us to share kind and encouraging words about how much they liked it They truly inspired the creation of this new book I really hope that this title meets their expectations
Acknowledgments
Special thanks to Ioanna Koutrouvis and Vassilis Panagos at PREDICTA (httpwwwpredictagr) for their support
Effective CRM using Predictive Analytics First Edition Antonios Chorianopoulos copy 2016 John Wiley amp Sons Ltd Published 2016 by John Wiley amp Sons LtdCompanion website wwwwileycomgochorianopouloseffective_crm
1
An overview of data mining The applications the methodology the algorithms and the data
11 The applications
Customers are the most important asset of an organization Thatrsquos why an organization should plan and employ a clear strategy for customer handling Customer relationship management (CRM) is the strategy for building managing and strengthening loyal and long‐lasting customer rela-tionships CRM should be a customer‐centric approach based on customer insight Its scope should be the ldquopersonalizedrdquo handling of the customers as distinct entities through the identification and understanding of their differentiated needs preferences and behaviors
CRM aims at two main objectives
1 Customer retention through customer satisfaction
2 Customer development
Data mining can provide customer insight which is vital for these objectives and for establish-ing an effective CRM strategy It can lead to personalized interactions with customers and hence increased satisfaction and profitable customer relationships through data analysis It can offer individualized and optimized customer management throughout all the phases of the cus-tomer life cycle from acquisition and establishment of a strong relationship to attrition preven-tion and win‐back of lost customers Marketers strive to get a greater market share and a greater share of their customers In plain words they are responsible for getting developing and keeping the customers Data mining can help them in all these tasks as shown in Figure 11
2 EFFECTIvE CRM usIng PREDICTIvE AnAlyTICs
More specifically the marketing activities that can be supported with the use of data mining include
Customer segmentation
segmentation is the process of dividing the customer base in distinct and homogeneous groups in order to develop differentiated marketing strategies according to their character-istics There are many different segmentation types according to the specific criteriaattrib-utes used for segmentation In behavioral segmentation customers are grouped based on behavioral and usage characteristics Although behavioral segments can be created using business rules this approach has inherent disadvantages It can handle only a few segmentation fields and its objectivity is questionable as it is based on the personal per-ceptions of a business expert Data mining on the other hand can create data‐driven behavioral segments Clustering algorithms can analyze behavioral data identify the natural groupings of customers and suggest a grouping founded on observed data patterns Provided it is properly built it can uncover groups with distinct profiles and characteristics and lead to rich actionable segmentation schemes with business meaning and value
Data mining can also be used for the development of segmentation schemes based on the current or expectedestimated value of the customers These segments are necessary in order to prioritize the customer handling and the marketing interventions according to the importance of each customer
Direct marketing campaigns
Marketers carry out direct marketing campaigns to communicate a message to their cus-tomers through mail Internet e‐mail telemarketing (phone) and other direct channels in order to prevent churn (attrition) and drive customer acquisition and purchase of add‐on products More specifically acquisition campaigns aim at drawing new and potentially valuable customers from the competition Crossdeepup‐selling campaigns are rolled out
Customervalue
Timecustomer lifecycle
GetcustomersAcquisition
models
Establish ampdevelop
customersCrossup
deep sellingmodels
Retaincustomers
Attritionmodels
Figure 11 Data mining and customer life cycle management Source Tsiptsis and Chorianopoulos (2009) Reproduced with permission from Wiley
An ovERvIEw oF DATA MInIng 3
to sell additional products more of the same product or alternative but more profitable products to the existing customers Finally retention campaigns aim at preventing valuable customers from terminating their relationship with the organization
These campaigns although potentially effective when not refined can also lead to a huge waste of resources and to the annoyance of customers with unsolicited communica-tion Data mining and classification (propensity) models in particular can support the development of targeted marketing campaigns They analyze the customer characteristics and recognize the profile of the target customers new cases with similar profiles are then identified assigned a high propensity score and included in the target lists Table 11 sum-marizes the use of data mining models in direct marketing campaigns
when properly built propensity models can identify the right customers to contact and lead to campaign lists with increased concentrations of target customers They outperform random selections as well as predictions based on business rules and personal intuitions
Table 11 Data mining models and direct marketing campaigns
Business objective Marketing campaign Data mining models
getting customers Acquisition finding new customers and expanding the customer base with new and potentially profitable customers
Acquisition classification models can be used to recognize potentially profitable prospect customers by finding ldquoclonesrdquo of existing valuable customers in lists of contacts
Developing customers
Cross selling promoting and selling additional productsservices to existing customers
up selling offering and switching customers to premium products other products more profitable than the ones that already have
Deep selling increasing usage of the productsservices that customers already have
Crossupdeep‐selling classification models can reveal the existing customers with purchase potentials
Retaining customers
Retention prevention of voluntary churn with priority given to presently or potentially valuable customers at risk
voluntary attrition (churn) models can identify early churn signals and discern the customers with increased likelihood of voluntary churn
source Tsiptsis and Chorianopoulos (2009)
4 EFFECTIvE CRM usIng PREDICTIvE AnAlyTICs
Market basket and sequence analysis Data mining and association models in particular can be used to identify related products typically purchased together These models can be used for market basket analysis and for the revealing of bundles of productsservices that can be sold together sequence models take into account the order of actionspurchases and can identify sequences of events
12 The methodology
The modeling phase is just one phase in the implementation process of a data mining project steps of critical importance precede and follow the model building and have a significant effect in the success of the project An outline of the basic phases in the development of a data mining project according to the Cross Industry standard Process for Data Mining (CRIsP‐DM) process model is presented in Table 12
Data mining projects are not simple They may end in business failure if the engaged team is not guided by a clear methodological framework The CRIsP‐DM process model charts the steps that should be followed for successful data mining implementations These steps are
Business understanding The data mining project should start with the understanding of the business objective and the assessment of the current situation The projectrsquos param-eters should be considered including resources and limitations The business objective should be translated to a data mining goal success criteria should be defined and a project plan should be developed
Data understanding This phase involves considering the data requirements for properly addressing the defined goal and an investigation on the availability of the required data This phase also includes an initial data collection and exploration with summary statistics and visualization tools to understand the data and identify potential problems of availability and quality
Data preparation The data to be used should be identified selected and prepared for inclusion in the data mining model This phase involves the data acquisition integration and formatting according to the needs of the project The consolidated data should then be cleaned and properly transformed according to the requirements of the algorithm to be applied new fields such as sums averages ratios flags etc should be derived from the original fields to enrich the customer information better summarize the customer characteristics and therefore enhance the performance of the models
Modeling The processed data are then used for model training Analysts should select the appropriate modeling technique for the particular business objective Before the training of the models and especially in the case of predictive modeling the modeling dataset should be partitioned so that the modelrsquos performance is evaluated on a separate validation dataset This phase involves the examination of alternative modeling algo-rithms and parameter settings and a comparison of their performance in order to find the one that yields the best results Based on an initial evaluation of the model results the model settings can be revised and fine‐tuned
Evaluation The generated models are then formally evaluated not only in terms of technical measures but more importantly in the context of the business success criteria set in the business understanding phase The project team should decide whether the
An ovERvIEw oF DATA MInIng 5
results of a given model properly address the initial business objectives If so this model is approved and prepared for deployment
Deployment The projectrsquos findings and conclusions are summarized in a report but this is hardly the end of the project Even the best model will turn out to be a business failure if its results are not deployed and integrated in the organizationrsquos everyday marketing operations A procedure should be designed and developed that will enable the scoring of customers and the update of the results The deployment procedure should also enable the distribution of the model results throughout the enterprise and their incorporation in the organizationrsquos data warehouse and opera-tional CRM system Finally a maintenance plan should be designed and the whole process should be reviewed lessons learned should be taken into account and next steps should be planned
Table 12 The CRIsP‐DM phases
1 Business understanding 2 Data understanding 3 Data preparation understanding of the
business goal situation assessment Translating the business
goal to a data mining objective
Development of a project plan
Considering data requirements
Initial data collectionexploration and quality assessment
selection of required data Data acquisition Data integration and
formatting (mergejoins aggregations)
Data cleaning Data transformations and
enrichment (regroupingbinning of existing fields creation of derived attributes and KPIs ratios flag fields averages sums etc)
4 Modeling 5 Model evaluation 6 Deployment selection of the appropriate
modeling technique Especially in the case of
predictive models splitting of the dataset into training and testing subsets for evaluation purposes
Development and examination of alternative modeling algorithms and parameter settings
Fine‐tuning of the model settings according to an initial assessment of the modelrsquos performance
Evaluation of the models in the context of the business success criteria
Model approval
Create a report of findings
Planning and development of the deployment procedure
Deployment of the data mining model
Distribution of the model results and integration in the organizationrsquos operational CRM system
Development of a maintenancendashupdate plan
Review of the project Planning of next steps
source Tsiptsis and Chorianopoulos (2009) Reproduced with permission from wiley
6 EFFECTIvE CRM usIng PREDICTIvE AnAlyTICs
The aforementioned phases present strong dependencies and the outcomes of a phase may lead to revisiting and reviewing the results of preceding phases The nature of the process is cyclical since the data mining itself is a never‐ending journey and quest demanding continuous reassess-ment and update of completed tasks in the context of a rapidly changing business environment
This book contains two chapters dedicated in the methodological framework of classification and behavioral segmentation modeling In these chapters the recommended approach for these applications is elaborated and presented as a step‐by‐step guide
13 The algorithms
Data mining models employ statistical or machine‐learning algorithms to identify useful data patterns and understand and predict behaviors They can be grouped in two main classes according to their goal
1 Supervisedpredictive modelsIn supervised also referred to as predictive directed or targeted modeling the goal is to predict an event or estimate the values of a continuous numeric attribute In these models there are input fields and an output or target field Inputs are also called pre-dictors because they are used by the algorithm for the identification of a prediction function for the output we can think of predictors as the ldquoXrdquo part of the function and the target field as the ldquoyrdquo part the outcome
The algorithm associates the outcome with input data patterns Pattern recognition is ldquosupervisedrdquo by the target field Relationships are established between the inputs and the output An inputndashoutput ldquomapping functionrdquo is generated by the algorithm that associates predictors with the output and permits the prediction of the output values given the values of the inputs
2 Unsupervised modelsIn unsupervised or undirected models there is no output just inputs The pattern rec-ognition is undirected it is not guided by a specific target field The goal of the algorithm is to uncover data patterns in the set of inputs and identify groups of similar cases groups of correlated fields frequent itemsets or anomalous records
131 Supervised models
Models learn from past cases In order for predictive algorithms to associate input data pat-terns with specific outcomes it is necessary to present them cases with known outcomes This phase is called the training phase During that phase the predictive algorithm builds the function that connects the inputs with the target once the relationships are identified and the model is evaluated and proved of satisfactory predictive power the scoring phase follows new records for which the outcome values are unknown are presented to the model and scored accordingly
some predictive algorithms such as regression and Decision Trees are transparent providing an explanation of their results Besides prediction these algorithms can also be used for insight and profiling They can identify inputs with a significant effect on the target attribute for example drivers of customer satisfaction or attrition and they can reveal the type and the magnitude of their effect
An ovERvIEw oF DATA MInIng 7
According to their scope and the measurement level of the field to be predicted supervised models are further categorized into
1 Classification or propensity modelsClassification or propensity models predict categorical outcomes Their goal is to classify new cases to predefined classes in other words to predict an event The classification algorithm estimates a propensity score for each new case The propen-sity score denotes the likelihood of occurrence of the target event
2 Estimation (regression) modelsEstimation models are similar to classification models with one big difference They are used for predicting the value of a continuous output based on the observed values of the inputs
3 Feature selectionThese models are used as a preparation step preceding the development of a predictive model Feature selection algorithms assess the predictive importance of the inputs and identify the significant ones Predictors with trivial predictive power are discarded from the subsequent modeling steps
1311 Classification models
Classification models predict categorical outcomes by using a set of inputs and a historical dataset with preclassified data generated models are then used to predict event occurrence and classify unseen records Typical examples of target categorical fields include
Accepted a marketing offer yesno
Defaulted yesno
Churned yesno
In the heart of all classification models is the estimation of confidence scores These scores denote the likelihood of the predicted outcome They are estimates of the probability of occur-rence of the respective event typically ranging from 0 to 1 Confidence scores can be translated to propensity scores which signify the likelihood of a particular target class the propensity of a customer to churn to buy a specific add‐on product or to default on his loan Propensity scores allow for the rank ordering of customers according to their likelihood This feature enables mar-keters to target their lists and optimally tailor their campaign sizes according to their resources and marketing objectives They can expand or narrow their target lists on the base of their particular objectives always targeting the customers with the relatively higher probabilities
Popular classification algorithms include
Decision Trees Decision Trees apply recursive partitions to the initial population For each split (partition) they automatically select the most significant predictor the predictor that yields the best separation in respect to the target filed Through succes-sive partitions their goal is to produce ldquopurerdquo subsegments with homogeneous behavior in terms of the output They are perhaps the most popular classification tech-nique Part of their popularity is because they produce transparent results that are easily interpretable offering insight in the event under study The produced results can have
8 EFFECTIvE CRM usIng PREDICTIvE AnAlyTICs
two equivalent formats In a rule format results are represented in plain English as ordinary rules
IF (PREDICToR vAluEs) THEN (TARgET ouTCoME amp ConFIDEnCE sCoRE)
For exampleIF (gender = Male and Profession = white Colar and sMs_usage gt 60 messages per month) THEN Prediction = Buyer and Confidence = 095
In a tree format rules are graphically represented as a tree in which the initial population (root node) is successively partitioned into terminal (leaf) nodes with similar behavior in respect to the target fieldDecision Tree algorithms are fast and scalable Available algorithms include
C45C50 CHAID Classification and regression trees (CART)
Decision rules They are quite similar to Decision Trees and produce a list of rules which have the format of human understandable statements IF (PREDICToR vAluEs) THEn (TARgET ouTCoME amp ConFIDEnCE sCoREs) Their main difference from Decision Trees is that they may produce multiple rules for each record Decision Trees generate exhaustive and mutually exclusive rules which cover all records For each record only one rule applies on the contrary decision rules may generate an overlapping set of rules More than one rule with different predictions may hold true for each record In that case through an integrated voting procedure rules are evaluated and compared or combined to determine the final prediction and confidence
Logistic regression This is a powerful and well‐established statistical algorithm that estimates the probabilities of the target classes It is analogous to simple linear regres-sion but for categorical outcomes logistic regression results have the form of contin-uous functions that estimate membership probabilities of the target classes
lnp
pb b Xj
k ii i0
where pj = probability of the target class j p
k probability of the reference target class k
Xi the predictors b
i the regression coefficients and b
0 the intercept of the model The
regression coefficients represent the effect of predictorsFor example in the case of a binary target denoting churn
lnchurn probability
no churn probabilitytenureb b0 1middot b2middot num of products
In order to yield optimal results it may require special data preparation including potential screening and transformation (optimal binning) of the predictors It demands some statistical experience yet provided it is built properly it can produce stable and understandable results
Neural networks neural networks are powerful machine‐learning algorithms that use complex nonlinear mapping functions for estimation and classification They
An ovERvIEw oF DATA MInIng 9
consist of neurons organized in layers The input layer contains the predictors or input neurons The output layer includes the target field These models estimate weights that connect predictors (input layer) to the output Models with more complex topologies may also include intermediate hidden layers and neurons The training procedure is an iterative process Input records with known outcome are presented to the network and model prediction is evaluated in respect to the observed results observed errors are used to adjust and optimize the initial weight estimates They are considered as opaque or ldquoblack boxrdquo solutions since they do not provide an explana-tion of their predictions They only provide a sensitivity analysis which summarizes the predictive importance of the input fields They require minimum statistical knowledge but depending on the problem may require long processing times for training
Support Vector Machine (SVM) svM is a classification algorithm that can model highly nonlinear complex data patterns and avoid overfitting that is the situation in which a model memorizes patterns only relevant to the specific cases analyzed svM works by mapping data to a high‐dimensional feature space in which records become more easily separable (ie separated by linear functions) in respect to the target cate-gories Input training data are appropriately transformed through nonlinear kernel functions and this transformation is followed by a search for simpler functions that is linear functions which optimally separate cases Analysts typically experiment with different kernel functions and compare the results overall svM is an effective yet demanding algorithm in terms of processing time and resources Additionally it lacks transparency since the predictions are not explained and only the importance of predictors is summarized
Bayesian networks Bayesian networks are statistical models based on the Bayes the-orem They are probabilistic models as they estimate the probabilities of belonging to each target class Bayesian belief networks in particular are graphical models which provide a visual representation of the attribute relationships ensuring transparency and explanation of the model rationale
1312 Estimation (regression) models
Estimation models also referred to as regression models deal with continuous numeric out-comes By using linear or nonlinear functions they use the input fields to estimate the unknown values of a continuous target field
Estimation algorithms can be used to predict attributes like the following
The expected balance of the savings accounts of the customers of a bank in the near future
The estimated loss given default (lgD) incurred after a customer has defaulted
The expected revenue from a customer within a specified time period
A dataset with historical data and known values of the continuous output is required for the model training A mapping function is then identified that associates the available inputs to the output values These models are also referred to as regression models after the well‐known
10 EFFECTIvE CRM usIng PREDICTIvE AnAlyTICs
and established statistical algorithm of ordinary least squares regression (OLSR) The olsR estimates the line that best fits the data and minimizes the observed errors the so‐called least squares line It requires some statistical experience and since it is sensitive to possible viola-tions of its assumptions it may require specific data examination and processing before building The final model has the intuitive form of a linear function with coefficients denoting the effect of predictors to the outcome Although transparent it has inherent limitations that may affect its performance in complex situations of nonlinear relationships and interactions between predictors
nowadays traditional regression is not the only available estimation algorithm new techniques with less stringent assumptions which also capture nonlinear relationships can also be employed to handle continuous outcomes More specifically polynomial regression neural networks SVM and regression trees such as CART can also be employed for the pre-diction of continuous attributes
1313 Feature selection (field screening)
The feature selection (field screening) process is a preparation step for the development of classification and estimation (regression) models The situation of having hundreds of candi-date predictors is not an unusual case in complicated data mining tasks some of these fields though may not have an influence to the output that we want to predict
The basic idea of feature selection is to use basic statistical measures to assess and quantify the relationship of the inputs to the output More specifically feature selection is used to
Assess all the available inputs and rank them according to their association with the outcome
Identify the key predictors the most relevant features for classification or regression
screen the predictors with marginal importance reducing the set of inputs to those related to the target field
some predictive algorithms including Decision Trees integrate screening mechanisms that internally filter out the unrelated predictors A preprocessing feature selection step is also available in Data Mining for Excel and it can be invoked when building a predictive model Feature selection can efficiently reduce data dimensionality retaining only a subset of significant inputs so that the training time is reduced with no or insignificant loss of accuracy
132 Unsupervised models
In unsupervised modeling only input fields are involved The scope is the identification of groupings and associations unsupervised models include
1 Cluster modelsIn cluster models the groups are not known in advance Instead the algorithms ana-lyze the input data patterns and identify the natural groupings of instancescases when new cases are scored by the generated cluster model they are assigned into one of the revealed clusters
An ovERvIEw oF DATA MInIng 11
2 Association (affinity) and sequence modelsAssociation and sequence models also belong to the class of unsupervised algorithms Association models do not involve direct prediction of a single field In fact all fields have a double role since they act as inputs and outputs at the same time Association algorithms detect associations between discrete events products and attributes sequence algorithms detect associations over time
3 Dimensionality reduction modelsDimensionality reduction algorithms ldquogrouprdquo fields into new compound measures and reduce the dimensions of data without sacrificing much of the information of the original fields
1321 Cluster models
Cluster models automatically detect the underlying groups of cases the clusters The clusters are not known in advance They are revealed by analyzing the observed input data patterns Clustering algorithms assess the similarity of the recordscustomers in respect to the clus-tering fields and they assign them to the revealed clusters accordingly Their goal is to detect groups with internal homogeneity and interclass heterogeneity
Clustering algorithms are quite popular and their use is widespread from data mining to market research They can support the development of different segmentation schemes according to the clustering attributes used behavioral attitudinal or demographical segmentation
The major advantage of the clustering algorithms is that they can efficiently manage a large number of attributes and create data‐driven segments The revealed segments are not based on personal concepts intuitions and perceptions of the business people They are induced by the observed data patterns and provided they are properly built they can lead to results with real business meaning and value Clustering models can analyze complex input data patterns and suggest solutions that would not otherwise be apparent They reveal cus-tomer typologies enabling tailored marketing strategies
nowadays various clustering algorithms are available which differ in their approach for assessing the similarity of the cases According to the way they work and their outputs the clustering algorithms can be categorized in two classes the hard and the soft clustering algo-rithms The hard clustering algorithms assess the distances (dissimilarities) of the instances The revealed clusters do not overlap and each case is assigned to a single cluster
Hard clustering algorithms include
Agglomerative or hierarchical In a way it is the ldquomotherrdquo of all clustering algo-rithms It is called hierarchical or agglomerative since it starts by a solution where each record comprises a cluster and gradually groups records up to the point where all records fall into one supercluster In each step it calculates the distances between all pairs of records and groups the ones most similar A table (agglomeration schedule) or a graph (dendrogram) summarizes the grouping steps and the respective distances The analyst should then consult this information identify the point where the algorithm starts to group disjoint cases and then decide on the number of clusters to retain This algorithm cannot effectively handle more than a few thousand cases Thus it cannot be directly applied in most business clustering tasks A usual work-around is to a use it on a sample of the clustering population However with numerous
12 EFFECTIvE CRM usIng PREDICTIvE AnAlyTICs
other efficient algorithms that can easily handle even millions of records clustering through sampling is not considered an ideal approach
K‐means K‐means is an efficient and perhaps the fastest clustering algorithm that can handle both long (many records) and wide datasets (many data dimensions and input fields) In K‐means each cluster is represented by its centroid the central point defined by the averages of the inputs K‐means is an iterative distance‐based clustering algorithm in which cases are assigned to the ldquonearestrdquo cluster unlike hierarchical it does not need to calculate distances between all pairs of records The number of clus-ters to be formed is predetermined and specified by the user in advance Thus usually a number of different solutions should be tried and evaluated before approving the most appropriate It best handles continuous clustering fields
K‐medoids K‐medoids is a K‐means variant which differs from K‐means in the way clusters are represented during the model training phase In K‐means each cluster is represented by the averages of inputs In K‐medoids each cluster is represented by an actual representative data point instead of using the hypothetical point defined by the cluster means This makes this algorithm less sensitive to outliers
TwoStep cluster A scalable and efficient clustering model based on the BIRCH algorithm included in IBM sPss Modeler As the name implies it processes records in two steps The first step of preclustering makes a single pass of the data and records are assigned to a limited set of initial subclusters In the second step initial subclusters are further grouped into the final segments
Kohonen NetworkSelf‐Organizing Map (SOM) Kohonen networks are based on neural networks and they typically produce a two‐dimensional grid or map of the clus-ters hence the name soM Kohonen networks usually take longer time to train than K‐means and Twostep but they provide a different and worth trying view on clustering
The soft clustering techniques on the other end use probabilistic measures to assign the cases to clusters with a certain probabilities The clusters can overlap and the instances can belong to more than one cluster with certain estimated probabilities The most popular probabilistic clustering algorithm is Expectation Maximization (EM) clustering
1322 Association (affinity) and sequence models
Association models analyze past co‐occurrences of events and detect associations and fre-quent itemsets They associate a particular outcome category with a set of conditions They are typically used to identify purchase patterns and groups of products often purchased togetherAssociation algorithms generate rules of the following general format
IF (AnTECEDEnTs) THEN ConsEQuEnT
For exampleIF (product A and product C and product E andhellip) THEN product B
More specifically a rule referring to supermarket purchases might beIF Eggs amp MIlK amp FREsH FRuIT THEN vEgETABlEs
This simple rule derived by analyzing past shopping carts identifies associated products that tend to be purchased together when eggs milk and fresh fruit are bought then there is an

Effective CRM Using Predictive Analytics
Antonios Chorianopoulos
This edition first published 2016copy 2016 John Wiley amp Sons Ltd
Registered OfficeJohn Wiley amp Sons Ltd The Atrium Southern Gate Chichester West Sussex PO19 8SQ United Kingdom
For details of our global editorial offices for customer services and for information about how to apply for permission to reuse the copyright material in this book please see our website at wwwwileycom
The right of the author to be identified as the author of this work has been asserted in accordance with the Copyright Designs and Patents Act 1988
All rights reserved No part of this publication may be reproduced stored in a retrieval system or transmitted in any form or by any means electronic mechanical photocopying recording or otherwise except as permitted by the UK Copyright Designs and Patents Act 1988 without the prior permission of the publisher
Wiley also publishes its books in a variety of electronic formats Some content that appears in print may not be available in electronic books
Designations used by companies to distinguish their products are often claimed as trademarks All brand names and product names used in this book are trade names service marks trademarks or registered trademarks of their respective owners The publisher is not associated with any product or vendor mentioned in this book
Limit of LiabilityDisclaimer of Warranty While the publisher and author have used their best efforts in preparing this book they make no representations or warranties with respect to the accuracy or completeness of the contents of this book and specifically disclaim any implied warranties of merchantability or fitness for a particular purpose It is sold on the understanding that the publisher is not engaged in rendering professional services and neither the publisher nor the author shall be liable for damages arising herefrom If professional advice or other expert assistance is required the services of a competent professional should be sought
Library of Congress Cataloging‐in‐Publication Data
Chorianopoulos AntoniosEffective CRM using predictive analytics Antonios Chorianopoulos pages cm Includes bibliographical references and index ISBN 978-1-119-01155-2 (cloth)1 Customer relationsndashManagementndashData processing 2 Data mining I Title HF54155C4786 2015 6588prime12ndashdc23 2015020804
A catalogue record for this book is available from the British Library
Cover image Baitong333iStockphoto
Set in 1012pt Times by SPi Global Pondicherry India
1 2016
To my daughter Eugenia and my wife Virginia
Contents
Preface xiii
Acknowledgments xv
1 An overview of data mining The applications the methodology the algorithms and the data 111 The applications 112 The methodology 413 The algorithms 6
131 Supervised models 61311 Classification models 71312 Estimation (regression) models 91313 Feature selection (field screening) 10
132 Unsupervised models 101321 Cluster models 111322 Association (affinity) and sequence models 121323 Dimensionality reduction models 141324 Record screening models 14
14 The data 15141 The mining datamart 16142 The required data per industry 16143 The customer ldquosignaturerdquo from the mining datamart
to the enriched marketing reference table 1615 Summary 20
Part I The Methodology 21
2 Classification modeling methodology 2321 An overview of the methodology for classification modeling 2322 Business understanding and design of the process 24
221 Definition of the business objective 24222 Definition of the mining approach and of the data model 26223 Design of the modeling process 27
2231 Defining the modeling population 272232 Determining the modeling (analysis) level 282233 Definition of the target event and population 282234 Deciding on time frames 29
23 Data understanding preparation and enrichment 33231 Investigation of data sources 34232 Selecting the data sources to be used 34
viii ConTEnTS
233 Data integration and aggregation 35234 Data exploration validation and cleaning 35235 Data transformations and enrichment 38236 Applying a validation technique 40
2361 Split or Holdout validation 402362 Cross or n‐fold validation 452363 Bootstrap validation 47
237 Dealing with imbalanced and rare outcomes 482371 Balancing 482372 Applying class weights 53
24 Classification modeling 57241 Trying different models and parameter settings 57242 Combining models 60
2421 Bagging 612422 Boosting 622423 Random Forests 63
25 Model evaluation 64251 Thorough evaluation of the model accuracy 65
2511 Accuracy measures and confusion matrices 662512 Gains Response and Lift charts 702513 RoC curve 782514 ProfitRoI charts 81
252 Evaluating a deployed model with testndashcontrol groups 8526 Model deployment 88
261 Scoring customers to roll the marketing campaign 882611 Building propensity segments 93
262 Designing a deployment procedure and disseminating the results 9427 Using classification models in direct marketing campaigns 9428 Acquisition modeling 95
2811 Pilot campaign 952812 Profiling of high‐value customers 96
29 Cross‐selling modeling 972911 Pilot campaign 982912 Product uptake 982913 Profiling of owners 99
210 offer optimization with next best product campaigns 100211 Deep‐selling modeling 102
21111 Pilot campaign 10221112 Usage increase 10321113 Profiling of customers with heavy product usage 104
212 Up‐selling modeling 10521211 Pilot campaign 10521212 Product upgrade 10721213 Profiling of ldquopremiumrdquo product owners 107
213 Voluntary churn modeling 108214 Summary of what wersquove learned so far itrsquos not about the tool or the
modeling algorithm Itrsquos about the methodology and the design of the process 111
ConTEnTS ix
3 Behavioral segmentation methodology 11231 An introduction to customer segmentation 11232 An overview of the behavioral segmentation methodology 11333 Business understanding and design of the segmentation process 115
331 Definition of the business objective 115332 Design of the modeling process 115
3321 Selecting the segmentation population 1153322 Selection of the appropriate segmentation criteria 1163323 Determining the segmentation level 1163324 Selecting the observation window 116
34 Data understanding preparation and enrichment 117341 Investigation of data sources 117342 Selecting the data to be used 117343 Data integration and aggregation 118344 Data exploration validation and cleaning 118345 Data transformations and enrichment 122346 Input set reduction 124
35 Identification of the segments with cluster modeling 12636 Evaluation and profiling of the revealed segments 128
361 ldquoTechnicalrdquo evaluation of the clustering solution 128362 Profiling of the revealed segments 132363 Using marketing research information to evaluate the clusters
and enrich their profiles 138364 Selecting the optimal cluster solution and labeling the segments 139
37 Deployment of the segmentation solution design and delivery of differentiated strategies 139371 Building the customer scoring model for updating the segments 140
3711 Building a Decision Tree for scoring fine‐tuning the segments 141372 Distribution of the segmentation information 141373 Design and delivery of differentiated strategies 142
38 Summary 142
Part II The Algorithms 143
4 Classification algorithms 14541 Data mining algorithms for classification 14542 An overview of Decision Trees 14643 The main steps of Decision Tree algorithms 146
431 Handling of predictors by Decision Tree models 148432 Using terminating criteria to prevent trivial tree growing 149433 Tree pruning 150
44 CART C50C45 and CHAID and their attribute selection measures 150441 The Gini index used by CART 151442 The Information Gain Ratio index used by C50C45 155443 The chi‐square test used by CHAID 158
45 Bayesian networks 17046 naiumlve Bayesian networks 172
x ConTEnTS
47 Bayesian belief networks 17648 Support vector machines 184
481 Linearly separable data 184482 Linearly inseparable data 187
49 Summary 191
5 Segmentation algorithms 19251 Segmenting customers with data mining algorithms 19252 Principal components analysis 192
521 How many components to extract 1945211 The eigenvalue (or latent root) criterion 1965212 The percentage of variance criterion 1975213 The scree test criterion 1985214 The interpretability and business meaning of the components 198
522 What is the meaning of each component 199523 Moving along with the component scores 201
53 Clustering algorithms 203531 Clustering with K‐means 204532 Clustering with TwoStep 211
54 Summary 213
Part III The Case Studies 215
6 A voluntary churn propensity model for credit card holders 21761 The business objective 21762 The mining approach 218
621 Designing the churn propensity model process 2186211 Selecting the data sources and the predictors 2186212 Modeling population and level of data 2186213 Target population and churn definition 2186214 Time periods and historical information required 219
63 The data dictionary 21964 The data preparation procedure 221
641 From cards to customers aggregating card‐level data 221642 Enriching customer data 225643 Defining the modeling population and the target field 228
65 Derived fields the final data dictionary 23266 The modeling procedure 232
661 Applying a Split (Holdout) validation splitting the modeling dataset for evaluation purposes 232
662 Balancing the distribution of the target field 232663 Setting the role of the fields in the model 239664 Training the churn model 239
67 Understanding and evaluating the models 24168 Model deployment using churn propensities to target
the retention campaign 248
ConTEnTS xi
69 The voluntary churn model revisited using RapidMiner 251691 Loading the data and setting the roles of the attributes 251692 Applying a Split (Holdout) validation and adjusting the imbalance
of the target fieldrsquos distribution 252693 Developing a naiumlve Bayes model for identifying potential churners 252694 Evaluating the performance of the model and deploying it
to calculate churn propensities 253610 Developing the churn model with Data Mining for Excel 254
6101 Building the model using the Classify Wizard 2566102 Selecting the classification algorithm and its parameters 2576103 Applying a Split (Holdout) validation 2576104 Browsing the Decision Tree model 2596105 Validation of the model performance 2596106 Model deployment 263
611 Summary 266
7 Value segmentation and cross‐selling in retail 26771 The business background and objective 26772 An outline of the data preparation procedure 26873 The data dictionary 27274 The data preparation procedure 272
741 Pivoting and aggregating transactional data at a customer level 272742 Enriching customer data and building the customer signature 276
75 The data dictionary of the modeling file 27976 Value segmentation 285
761 Grouping customers according to their value 285762 Value segments exploration and marketing usage 287
77 The recency frequency and monetary (RFM) analysis 290771 RFM basics 290
78 The RFM cell segmentation procedure 29379 Setting up a cross‐selling model 295710 The mining approach 295
7101 Designing the cross‐selling model process 29671011 The data and the predictors 29671012 Modeling population and level of data 29671013 Target population and definition of target attribute 29671014 Time periods and historical information required 296
711 The modeling procedure 2967111 Preparing the test campaign and loading the campaign responses
for modeling 2987112 Applying a Split (Holdout) validation splitting the modeling
dataset for evaluation purposes 2987113 Setting the roles of the attributes 2997114 Training the cross‐sell model 300
712 Browsing the model results and assessing the predictive accuracy of the classifiers 301
xii ConTEnTS
713 Deploying the model and preparing the cross‐selling campaign list 308714 The retail case study using RapidMiner 309
7141 Value segmentation and RFM cells analysis 3107142 Developing the cross‐selling model 3127143 Applying a Split (Holdout) validation 3137144 Developing a Decision Tree model with Bagging 3147145 Evaluating the performance of the model 3177146 Deploying the model and scoring customers 317
715 Building the cross‐selling model with Data Mining for Excel 3197151 Using the Classify Wizard to develop the model 3197152 Selecting a classification algorithm and setting the parameters 3207153 Applying a Split (Holdout) validation 3227154 Browsing the Decision Tree model 3227155 Validation of the model performance 3257156 Model deployment 329
716 Summary 331
8 Segmentation application in telecommunications 33281 Mobile telephony the business background and objective 33282 The segmentation procedure 333
821 Selecting the segmentation population the mobile telephony core segments 333
822 Deciding the segmentation level 335823 Selecting the segmentation dimensions 335824 Time frames and historical information analyzed 335
83 The data preparation procedure 33584 The data dictionary and the segmentation fields 33685 The modeling procedure 336
851 Preparing data for clustering combining fields into data components 340
852 Identifying the segments with a cluster model 342853 Profiling and understanding the clusters 344854 Segmentation deployment 354
86 Segmentation using RapidMiner and K‐means cluster 354861 Clustering with the K‐means algorithm 354
87 Summary 359
Bibliography 360
Index 362
Preface
This book is in a way the ldquosequelrdquo of the first book that I wrote together with Konstantinos Tsiptsis It follows the same principles aiming to be an applied guide rather than a generic reference book on predictive analytics and data mining There are many excellent well‐written books that succeed in presenting the theoretical background of the data mining algorithms But the scope of this book is to enlighten the usage of these algorithms in marketing applica-tions and to transfer domain expertise and knowledge Thatrsquos why it is packed with real‐world case studies which are presented with the use of three powerful and popular software tools IBM SPSS Modeler RapidMiner and Data Mining for Excel
Here are a few words on the bookrsquos structure and some tips on ldquohow to read the bookrdquo The book is organized in three main parts
Part I the Methodology Chapters 2 and 3 I strongly believe that these sections are among the strong points of the book Part I provides a methodological roadmap covering both the technical and the business aspects for designing and carrying out optimized marketing actions using predictive analytics The data mining process is presented in detail along with specific guidelines for the development of targeted acquisition cross‐deep‐up‐selling and retention campaigns as well as effective customer segmentation schemes
Part II the Algorithms Chapters 4 and 5 This part is dedicated in introducing the main concepts of some of the most popular and powerful data mining algorithms for classification and clustering The data mining algorithms are explained in a simple and comprehensive language for business users with no technical expertise The intention is to demystify the main concepts of the algorithms rather than ldquodivingrdquo deep in mathematical explanations and formulas so that data mining and marketing practitioners can confidently deploy them in their everyday business problems
Part III the Case Studies Chapters 6 7 and 8 And then itrsquos ldquoaction timerdquo The third part of the book is the ldquohands‐onrdquo part Three case studies from banking retail and telephony are presented in detail following the specific methodological steps explained in the previous chapters The concept is to apply the methodological ldquoblueprintsrdquo of Chapters 2 and 3 in real‐world applications and to bridge the gap between analytics and their use in CRM Given the level of detail and the accompanying material the case studies can be considered as ldquoapplication templatesrdquo for developing similar applications The software tools are presented in that context
In the bookrsquos companion website you can access the material from each case study including the datasets and the relevant code This material is an inseparable part of the book and Irsquod strongly suggest exploring and experimenting with it to gain full advantage of the book
Those interested in segmentation and its marketing usage are strongly encouraged to look for the previous title Konstantinos Tsiptsis and Antonios Chorianopoulos Data Mining Techniques in CRM Inside Customer Segmentation Wiley New York 2009
xiv PREfACE
finally I would really like to thank all the readers of the first book for their warm acceptance all those who read or reviewed the book and all those who contacted us to share kind and encouraging words about how much they liked it They truly inspired the creation of this new book I really hope that this title meets their expectations
Acknowledgments
Special thanks to Ioanna Koutrouvis and Vassilis Panagos at PREDICTA (httpwwwpredictagr) for their support
Effective CRM using Predictive Analytics First Edition Antonios Chorianopoulos copy 2016 John Wiley amp Sons Ltd Published 2016 by John Wiley amp Sons LtdCompanion website wwwwileycomgochorianopouloseffective_crm
1
An overview of data mining The applications the methodology the algorithms and the data
11 The applications
Customers are the most important asset of an organization Thatrsquos why an organization should plan and employ a clear strategy for customer handling Customer relationship management (CRM) is the strategy for building managing and strengthening loyal and long‐lasting customer rela-tionships CRM should be a customer‐centric approach based on customer insight Its scope should be the ldquopersonalizedrdquo handling of the customers as distinct entities through the identification and understanding of their differentiated needs preferences and behaviors
CRM aims at two main objectives
1 Customer retention through customer satisfaction
2 Customer development
Data mining can provide customer insight which is vital for these objectives and for establish-ing an effective CRM strategy It can lead to personalized interactions with customers and hence increased satisfaction and profitable customer relationships through data analysis It can offer individualized and optimized customer management throughout all the phases of the cus-tomer life cycle from acquisition and establishment of a strong relationship to attrition preven-tion and win‐back of lost customers Marketers strive to get a greater market share and a greater share of their customers In plain words they are responsible for getting developing and keeping the customers Data mining can help them in all these tasks as shown in Figure 11
2 EFFECTIvE CRM usIng PREDICTIvE AnAlyTICs
More specifically the marketing activities that can be supported with the use of data mining include
Customer segmentation
segmentation is the process of dividing the customer base in distinct and homogeneous groups in order to develop differentiated marketing strategies according to their character-istics There are many different segmentation types according to the specific criteriaattrib-utes used for segmentation In behavioral segmentation customers are grouped based on behavioral and usage characteristics Although behavioral segments can be created using business rules this approach has inherent disadvantages It can handle only a few segmentation fields and its objectivity is questionable as it is based on the personal per-ceptions of a business expert Data mining on the other hand can create data‐driven behavioral segments Clustering algorithms can analyze behavioral data identify the natural groupings of customers and suggest a grouping founded on observed data patterns Provided it is properly built it can uncover groups with distinct profiles and characteristics and lead to rich actionable segmentation schemes with business meaning and value
Data mining can also be used for the development of segmentation schemes based on the current or expectedestimated value of the customers These segments are necessary in order to prioritize the customer handling and the marketing interventions according to the importance of each customer
Direct marketing campaigns
Marketers carry out direct marketing campaigns to communicate a message to their cus-tomers through mail Internet e‐mail telemarketing (phone) and other direct channels in order to prevent churn (attrition) and drive customer acquisition and purchase of add‐on products More specifically acquisition campaigns aim at drawing new and potentially valuable customers from the competition Crossdeepup‐selling campaigns are rolled out
Customervalue
Timecustomer lifecycle
GetcustomersAcquisition
models
Establish ampdevelop
customersCrossup
deep sellingmodels
Retaincustomers
Attritionmodels
Figure 11 Data mining and customer life cycle management Source Tsiptsis and Chorianopoulos (2009) Reproduced with permission from Wiley
An ovERvIEw oF DATA MInIng 3
to sell additional products more of the same product or alternative but more profitable products to the existing customers Finally retention campaigns aim at preventing valuable customers from terminating their relationship with the organization
These campaigns although potentially effective when not refined can also lead to a huge waste of resources and to the annoyance of customers with unsolicited communica-tion Data mining and classification (propensity) models in particular can support the development of targeted marketing campaigns They analyze the customer characteristics and recognize the profile of the target customers new cases with similar profiles are then identified assigned a high propensity score and included in the target lists Table 11 sum-marizes the use of data mining models in direct marketing campaigns
when properly built propensity models can identify the right customers to contact and lead to campaign lists with increased concentrations of target customers They outperform random selections as well as predictions based on business rules and personal intuitions
Table 11 Data mining models and direct marketing campaigns
Business objective Marketing campaign Data mining models
getting customers Acquisition finding new customers and expanding the customer base with new and potentially profitable customers
Acquisition classification models can be used to recognize potentially profitable prospect customers by finding ldquoclonesrdquo of existing valuable customers in lists of contacts
Developing customers
Cross selling promoting and selling additional productsservices to existing customers
up selling offering and switching customers to premium products other products more profitable than the ones that already have
Deep selling increasing usage of the productsservices that customers already have
Crossupdeep‐selling classification models can reveal the existing customers with purchase potentials
Retaining customers
Retention prevention of voluntary churn with priority given to presently or potentially valuable customers at risk
voluntary attrition (churn) models can identify early churn signals and discern the customers with increased likelihood of voluntary churn
source Tsiptsis and Chorianopoulos (2009)
4 EFFECTIvE CRM usIng PREDICTIvE AnAlyTICs
Market basket and sequence analysis Data mining and association models in particular can be used to identify related products typically purchased together These models can be used for market basket analysis and for the revealing of bundles of productsservices that can be sold together sequence models take into account the order of actionspurchases and can identify sequences of events
12 The methodology
The modeling phase is just one phase in the implementation process of a data mining project steps of critical importance precede and follow the model building and have a significant effect in the success of the project An outline of the basic phases in the development of a data mining project according to the Cross Industry standard Process for Data Mining (CRIsP‐DM) process model is presented in Table 12
Data mining projects are not simple They may end in business failure if the engaged team is not guided by a clear methodological framework The CRIsP‐DM process model charts the steps that should be followed for successful data mining implementations These steps are
Business understanding The data mining project should start with the understanding of the business objective and the assessment of the current situation The projectrsquos param-eters should be considered including resources and limitations The business objective should be translated to a data mining goal success criteria should be defined and a project plan should be developed
Data understanding This phase involves considering the data requirements for properly addressing the defined goal and an investigation on the availability of the required data This phase also includes an initial data collection and exploration with summary statistics and visualization tools to understand the data and identify potential problems of availability and quality
Data preparation The data to be used should be identified selected and prepared for inclusion in the data mining model This phase involves the data acquisition integration and formatting according to the needs of the project The consolidated data should then be cleaned and properly transformed according to the requirements of the algorithm to be applied new fields such as sums averages ratios flags etc should be derived from the original fields to enrich the customer information better summarize the customer characteristics and therefore enhance the performance of the models
Modeling The processed data are then used for model training Analysts should select the appropriate modeling technique for the particular business objective Before the training of the models and especially in the case of predictive modeling the modeling dataset should be partitioned so that the modelrsquos performance is evaluated on a separate validation dataset This phase involves the examination of alternative modeling algo-rithms and parameter settings and a comparison of their performance in order to find the one that yields the best results Based on an initial evaluation of the model results the model settings can be revised and fine‐tuned
Evaluation The generated models are then formally evaluated not only in terms of technical measures but more importantly in the context of the business success criteria set in the business understanding phase The project team should decide whether the
An ovERvIEw oF DATA MInIng 5
results of a given model properly address the initial business objectives If so this model is approved and prepared for deployment
Deployment The projectrsquos findings and conclusions are summarized in a report but this is hardly the end of the project Even the best model will turn out to be a business failure if its results are not deployed and integrated in the organizationrsquos everyday marketing operations A procedure should be designed and developed that will enable the scoring of customers and the update of the results The deployment procedure should also enable the distribution of the model results throughout the enterprise and their incorporation in the organizationrsquos data warehouse and opera-tional CRM system Finally a maintenance plan should be designed and the whole process should be reviewed lessons learned should be taken into account and next steps should be planned
Table 12 The CRIsP‐DM phases
1 Business understanding 2 Data understanding 3 Data preparation understanding of the
business goal situation assessment Translating the business
goal to a data mining objective
Development of a project plan
Considering data requirements
Initial data collectionexploration and quality assessment
selection of required data Data acquisition Data integration and
formatting (mergejoins aggregations)
Data cleaning Data transformations and
enrichment (regroupingbinning of existing fields creation of derived attributes and KPIs ratios flag fields averages sums etc)
4 Modeling 5 Model evaluation 6 Deployment selection of the appropriate
modeling technique Especially in the case of
predictive models splitting of the dataset into training and testing subsets for evaluation purposes
Development and examination of alternative modeling algorithms and parameter settings
Fine‐tuning of the model settings according to an initial assessment of the modelrsquos performance
Evaluation of the models in the context of the business success criteria
Model approval
Create a report of findings
Planning and development of the deployment procedure
Deployment of the data mining model
Distribution of the model results and integration in the organizationrsquos operational CRM system
Development of a maintenancendashupdate plan
Review of the project Planning of next steps
source Tsiptsis and Chorianopoulos (2009) Reproduced with permission from wiley
6 EFFECTIvE CRM usIng PREDICTIvE AnAlyTICs
The aforementioned phases present strong dependencies and the outcomes of a phase may lead to revisiting and reviewing the results of preceding phases The nature of the process is cyclical since the data mining itself is a never‐ending journey and quest demanding continuous reassess-ment and update of completed tasks in the context of a rapidly changing business environment
This book contains two chapters dedicated in the methodological framework of classification and behavioral segmentation modeling In these chapters the recommended approach for these applications is elaborated and presented as a step‐by‐step guide
13 The algorithms
Data mining models employ statistical or machine‐learning algorithms to identify useful data patterns and understand and predict behaviors They can be grouped in two main classes according to their goal
1 Supervisedpredictive modelsIn supervised also referred to as predictive directed or targeted modeling the goal is to predict an event or estimate the values of a continuous numeric attribute In these models there are input fields and an output or target field Inputs are also called pre-dictors because they are used by the algorithm for the identification of a prediction function for the output we can think of predictors as the ldquoXrdquo part of the function and the target field as the ldquoyrdquo part the outcome
The algorithm associates the outcome with input data patterns Pattern recognition is ldquosupervisedrdquo by the target field Relationships are established between the inputs and the output An inputndashoutput ldquomapping functionrdquo is generated by the algorithm that associates predictors with the output and permits the prediction of the output values given the values of the inputs
2 Unsupervised modelsIn unsupervised or undirected models there is no output just inputs The pattern rec-ognition is undirected it is not guided by a specific target field The goal of the algorithm is to uncover data patterns in the set of inputs and identify groups of similar cases groups of correlated fields frequent itemsets or anomalous records
131 Supervised models
Models learn from past cases In order for predictive algorithms to associate input data pat-terns with specific outcomes it is necessary to present them cases with known outcomes This phase is called the training phase During that phase the predictive algorithm builds the function that connects the inputs with the target once the relationships are identified and the model is evaluated and proved of satisfactory predictive power the scoring phase follows new records for which the outcome values are unknown are presented to the model and scored accordingly
some predictive algorithms such as regression and Decision Trees are transparent providing an explanation of their results Besides prediction these algorithms can also be used for insight and profiling They can identify inputs with a significant effect on the target attribute for example drivers of customer satisfaction or attrition and they can reveal the type and the magnitude of their effect
An ovERvIEw oF DATA MInIng 7
According to their scope and the measurement level of the field to be predicted supervised models are further categorized into
1 Classification or propensity modelsClassification or propensity models predict categorical outcomes Their goal is to classify new cases to predefined classes in other words to predict an event The classification algorithm estimates a propensity score for each new case The propen-sity score denotes the likelihood of occurrence of the target event
2 Estimation (regression) modelsEstimation models are similar to classification models with one big difference They are used for predicting the value of a continuous output based on the observed values of the inputs
3 Feature selectionThese models are used as a preparation step preceding the development of a predictive model Feature selection algorithms assess the predictive importance of the inputs and identify the significant ones Predictors with trivial predictive power are discarded from the subsequent modeling steps
1311 Classification models
Classification models predict categorical outcomes by using a set of inputs and a historical dataset with preclassified data generated models are then used to predict event occurrence and classify unseen records Typical examples of target categorical fields include
Accepted a marketing offer yesno
Defaulted yesno
Churned yesno
In the heart of all classification models is the estimation of confidence scores These scores denote the likelihood of the predicted outcome They are estimates of the probability of occur-rence of the respective event typically ranging from 0 to 1 Confidence scores can be translated to propensity scores which signify the likelihood of a particular target class the propensity of a customer to churn to buy a specific add‐on product or to default on his loan Propensity scores allow for the rank ordering of customers according to their likelihood This feature enables mar-keters to target their lists and optimally tailor their campaign sizes according to their resources and marketing objectives They can expand or narrow their target lists on the base of their particular objectives always targeting the customers with the relatively higher probabilities
Popular classification algorithms include
Decision Trees Decision Trees apply recursive partitions to the initial population For each split (partition) they automatically select the most significant predictor the predictor that yields the best separation in respect to the target filed Through succes-sive partitions their goal is to produce ldquopurerdquo subsegments with homogeneous behavior in terms of the output They are perhaps the most popular classification tech-nique Part of their popularity is because they produce transparent results that are easily interpretable offering insight in the event under study The produced results can have
8 EFFECTIvE CRM usIng PREDICTIvE AnAlyTICs
two equivalent formats In a rule format results are represented in plain English as ordinary rules
IF (PREDICToR vAluEs) THEN (TARgET ouTCoME amp ConFIDEnCE sCoRE)
For exampleIF (gender = Male and Profession = white Colar and sMs_usage gt 60 messages per month) THEN Prediction = Buyer and Confidence = 095
In a tree format rules are graphically represented as a tree in which the initial population (root node) is successively partitioned into terminal (leaf) nodes with similar behavior in respect to the target fieldDecision Tree algorithms are fast and scalable Available algorithms include
C45C50 CHAID Classification and regression trees (CART)
Decision rules They are quite similar to Decision Trees and produce a list of rules which have the format of human understandable statements IF (PREDICToR vAluEs) THEn (TARgET ouTCoME amp ConFIDEnCE sCoREs) Their main difference from Decision Trees is that they may produce multiple rules for each record Decision Trees generate exhaustive and mutually exclusive rules which cover all records For each record only one rule applies on the contrary decision rules may generate an overlapping set of rules More than one rule with different predictions may hold true for each record In that case through an integrated voting procedure rules are evaluated and compared or combined to determine the final prediction and confidence
Logistic regression This is a powerful and well‐established statistical algorithm that estimates the probabilities of the target classes It is analogous to simple linear regres-sion but for categorical outcomes logistic regression results have the form of contin-uous functions that estimate membership probabilities of the target classes
lnp
pb b Xj
k ii i0
where pj = probability of the target class j p
k probability of the reference target class k
Xi the predictors b
i the regression coefficients and b
0 the intercept of the model The
regression coefficients represent the effect of predictorsFor example in the case of a binary target denoting churn
lnchurn probability
no churn probabilitytenureb b0 1middot b2middot num of products
In order to yield optimal results it may require special data preparation including potential screening and transformation (optimal binning) of the predictors It demands some statistical experience yet provided it is built properly it can produce stable and understandable results
Neural networks neural networks are powerful machine‐learning algorithms that use complex nonlinear mapping functions for estimation and classification They
An ovERvIEw oF DATA MInIng 9
consist of neurons organized in layers The input layer contains the predictors or input neurons The output layer includes the target field These models estimate weights that connect predictors (input layer) to the output Models with more complex topologies may also include intermediate hidden layers and neurons The training procedure is an iterative process Input records with known outcome are presented to the network and model prediction is evaluated in respect to the observed results observed errors are used to adjust and optimize the initial weight estimates They are considered as opaque or ldquoblack boxrdquo solutions since they do not provide an explana-tion of their predictions They only provide a sensitivity analysis which summarizes the predictive importance of the input fields They require minimum statistical knowledge but depending on the problem may require long processing times for training
Support Vector Machine (SVM) svM is a classification algorithm that can model highly nonlinear complex data patterns and avoid overfitting that is the situation in which a model memorizes patterns only relevant to the specific cases analyzed svM works by mapping data to a high‐dimensional feature space in which records become more easily separable (ie separated by linear functions) in respect to the target cate-gories Input training data are appropriately transformed through nonlinear kernel functions and this transformation is followed by a search for simpler functions that is linear functions which optimally separate cases Analysts typically experiment with different kernel functions and compare the results overall svM is an effective yet demanding algorithm in terms of processing time and resources Additionally it lacks transparency since the predictions are not explained and only the importance of predictors is summarized
Bayesian networks Bayesian networks are statistical models based on the Bayes the-orem They are probabilistic models as they estimate the probabilities of belonging to each target class Bayesian belief networks in particular are graphical models which provide a visual representation of the attribute relationships ensuring transparency and explanation of the model rationale
1312 Estimation (regression) models
Estimation models also referred to as regression models deal with continuous numeric out-comes By using linear or nonlinear functions they use the input fields to estimate the unknown values of a continuous target field
Estimation algorithms can be used to predict attributes like the following
The expected balance of the savings accounts of the customers of a bank in the near future
The estimated loss given default (lgD) incurred after a customer has defaulted
The expected revenue from a customer within a specified time period
A dataset with historical data and known values of the continuous output is required for the model training A mapping function is then identified that associates the available inputs to the output values These models are also referred to as regression models after the well‐known
10 EFFECTIvE CRM usIng PREDICTIvE AnAlyTICs
and established statistical algorithm of ordinary least squares regression (OLSR) The olsR estimates the line that best fits the data and minimizes the observed errors the so‐called least squares line It requires some statistical experience and since it is sensitive to possible viola-tions of its assumptions it may require specific data examination and processing before building The final model has the intuitive form of a linear function with coefficients denoting the effect of predictors to the outcome Although transparent it has inherent limitations that may affect its performance in complex situations of nonlinear relationships and interactions between predictors
nowadays traditional regression is not the only available estimation algorithm new techniques with less stringent assumptions which also capture nonlinear relationships can also be employed to handle continuous outcomes More specifically polynomial regression neural networks SVM and regression trees such as CART can also be employed for the pre-diction of continuous attributes
1313 Feature selection (field screening)
The feature selection (field screening) process is a preparation step for the development of classification and estimation (regression) models The situation of having hundreds of candi-date predictors is not an unusual case in complicated data mining tasks some of these fields though may not have an influence to the output that we want to predict
The basic idea of feature selection is to use basic statistical measures to assess and quantify the relationship of the inputs to the output More specifically feature selection is used to
Assess all the available inputs and rank them according to their association with the outcome
Identify the key predictors the most relevant features for classification or regression
screen the predictors with marginal importance reducing the set of inputs to those related to the target field
some predictive algorithms including Decision Trees integrate screening mechanisms that internally filter out the unrelated predictors A preprocessing feature selection step is also available in Data Mining for Excel and it can be invoked when building a predictive model Feature selection can efficiently reduce data dimensionality retaining only a subset of significant inputs so that the training time is reduced with no or insignificant loss of accuracy
132 Unsupervised models
In unsupervised modeling only input fields are involved The scope is the identification of groupings and associations unsupervised models include
1 Cluster modelsIn cluster models the groups are not known in advance Instead the algorithms ana-lyze the input data patterns and identify the natural groupings of instancescases when new cases are scored by the generated cluster model they are assigned into one of the revealed clusters
An ovERvIEw oF DATA MInIng 11
2 Association (affinity) and sequence modelsAssociation and sequence models also belong to the class of unsupervised algorithms Association models do not involve direct prediction of a single field In fact all fields have a double role since they act as inputs and outputs at the same time Association algorithms detect associations between discrete events products and attributes sequence algorithms detect associations over time
3 Dimensionality reduction modelsDimensionality reduction algorithms ldquogrouprdquo fields into new compound measures and reduce the dimensions of data without sacrificing much of the information of the original fields
1321 Cluster models
Cluster models automatically detect the underlying groups of cases the clusters The clusters are not known in advance They are revealed by analyzing the observed input data patterns Clustering algorithms assess the similarity of the recordscustomers in respect to the clus-tering fields and they assign them to the revealed clusters accordingly Their goal is to detect groups with internal homogeneity and interclass heterogeneity
Clustering algorithms are quite popular and their use is widespread from data mining to market research They can support the development of different segmentation schemes according to the clustering attributes used behavioral attitudinal or demographical segmentation
The major advantage of the clustering algorithms is that they can efficiently manage a large number of attributes and create data‐driven segments The revealed segments are not based on personal concepts intuitions and perceptions of the business people They are induced by the observed data patterns and provided they are properly built they can lead to results with real business meaning and value Clustering models can analyze complex input data patterns and suggest solutions that would not otherwise be apparent They reveal cus-tomer typologies enabling tailored marketing strategies
nowadays various clustering algorithms are available which differ in their approach for assessing the similarity of the cases According to the way they work and their outputs the clustering algorithms can be categorized in two classes the hard and the soft clustering algo-rithms The hard clustering algorithms assess the distances (dissimilarities) of the instances The revealed clusters do not overlap and each case is assigned to a single cluster
Hard clustering algorithms include
Agglomerative or hierarchical In a way it is the ldquomotherrdquo of all clustering algo-rithms It is called hierarchical or agglomerative since it starts by a solution where each record comprises a cluster and gradually groups records up to the point where all records fall into one supercluster In each step it calculates the distances between all pairs of records and groups the ones most similar A table (agglomeration schedule) or a graph (dendrogram) summarizes the grouping steps and the respective distances The analyst should then consult this information identify the point where the algorithm starts to group disjoint cases and then decide on the number of clusters to retain This algorithm cannot effectively handle more than a few thousand cases Thus it cannot be directly applied in most business clustering tasks A usual work-around is to a use it on a sample of the clustering population However with numerous
12 EFFECTIvE CRM usIng PREDICTIvE AnAlyTICs
other efficient algorithms that can easily handle even millions of records clustering through sampling is not considered an ideal approach
K‐means K‐means is an efficient and perhaps the fastest clustering algorithm that can handle both long (many records) and wide datasets (many data dimensions and input fields) In K‐means each cluster is represented by its centroid the central point defined by the averages of the inputs K‐means is an iterative distance‐based clustering algorithm in which cases are assigned to the ldquonearestrdquo cluster unlike hierarchical it does not need to calculate distances between all pairs of records The number of clus-ters to be formed is predetermined and specified by the user in advance Thus usually a number of different solutions should be tried and evaluated before approving the most appropriate It best handles continuous clustering fields
K‐medoids K‐medoids is a K‐means variant which differs from K‐means in the way clusters are represented during the model training phase In K‐means each cluster is represented by the averages of inputs In K‐medoids each cluster is represented by an actual representative data point instead of using the hypothetical point defined by the cluster means This makes this algorithm less sensitive to outliers
TwoStep cluster A scalable and efficient clustering model based on the BIRCH algorithm included in IBM sPss Modeler As the name implies it processes records in two steps The first step of preclustering makes a single pass of the data and records are assigned to a limited set of initial subclusters In the second step initial subclusters are further grouped into the final segments
Kohonen NetworkSelf‐Organizing Map (SOM) Kohonen networks are based on neural networks and they typically produce a two‐dimensional grid or map of the clus-ters hence the name soM Kohonen networks usually take longer time to train than K‐means and Twostep but they provide a different and worth trying view on clustering
The soft clustering techniques on the other end use probabilistic measures to assign the cases to clusters with a certain probabilities The clusters can overlap and the instances can belong to more than one cluster with certain estimated probabilities The most popular probabilistic clustering algorithm is Expectation Maximization (EM) clustering
1322 Association (affinity) and sequence models
Association models analyze past co‐occurrences of events and detect associations and fre-quent itemsets They associate a particular outcome category with a set of conditions They are typically used to identify purchase patterns and groups of products often purchased togetherAssociation algorithms generate rules of the following general format
IF (AnTECEDEnTs) THEN ConsEQuEnT
For exampleIF (product A and product C and product E andhellip) THEN product B
More specifically a rule referring to supermarket purchases might beIF Eggs amp MIlK amp FREsH FRuIT THEN vEgETABlEs
This simple rule derived by analyzing past shopping carts identifies associated products that tend to be purchased together when eggs milk and fresh fruit are bought then there is an
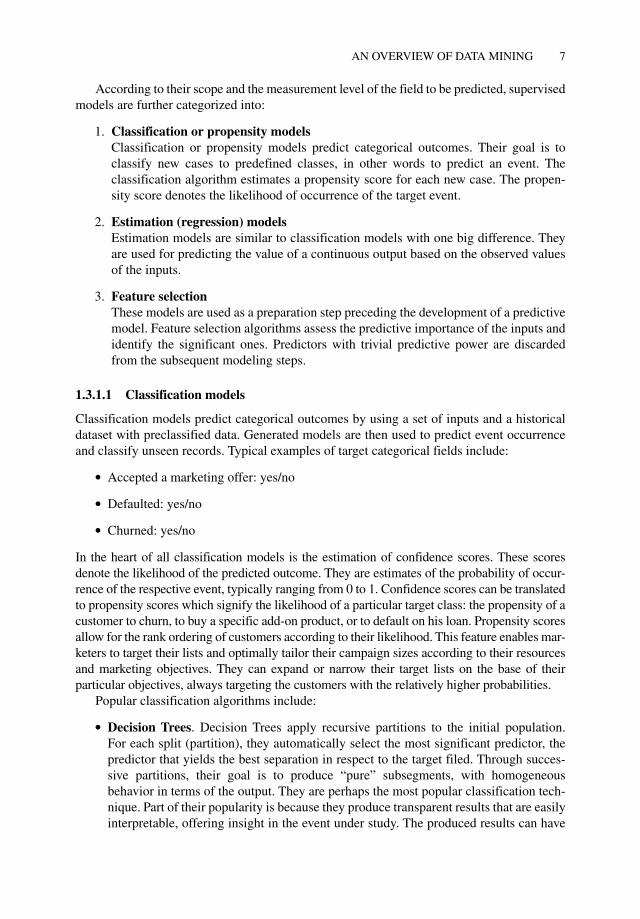


